Embed Size (px)
Citation preview

Why CEESmaRT?
significantly in measurement
Remote
Measurement Assurance
Phone: (409)721-9100 Website: www.ceesmart.com
[email protected] [email protected]
Headquarters: 4484 Hodgson Road Nederland Texas 77627
Umeasurement. The majority of natural gas is now measured on ultrasonic meters (USM).
displacement measurement systems, ultrasonic
Our industry is changing. Manufacturers
(in both the gas and liquid industries). CEESmaRT can help you take advantage of the
measurement. CEESmaRT is like having a
have already invested in to improve the way you
The increasing technical vacuum created by your
The increasing trend of losing technical talent to
-
The challenge of providing your technical support
daily when away from work?
disputes?
Minimizing the risk of driving to sites and the risk of
Managing measurement risk is a major part of your business. What is your
For years the industry’s paradigm for managing measurement risk
the equipment. As measurement equipment has been modernized this task has become increasingly difficult.
he or she must also be proficient at managing the Modbus and
A technician will typically test the pressure and temperature
chromatograph, and then email the data to specialist in the
recalculate volumes, briefly review USM maintenance reports and
tests while on site.
How do you control risk while
At best, management really only knows the
-What was missed?
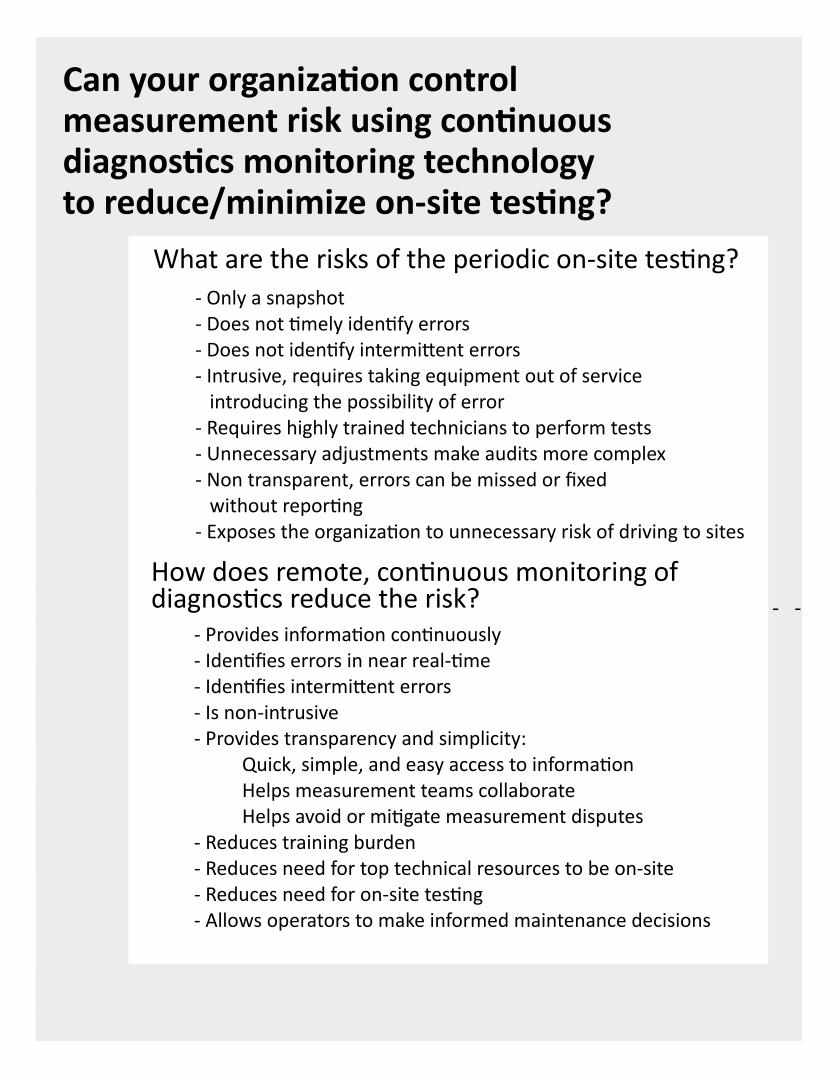
- Only a snapshot - - - Intrusive, requires taking equipment out of service introducing the possibility of error - Requires highly trained technicians to perform tests - Unnecessary adjustments make audits more complex - Non transparent, errors can be missed or fixed -
- - - - - - - Is non-intrusive - Provides transparency and simplicity: Helps measurement teams collaborate - Reduces training burden - Reduces need for top technical resources to be on-site - Reduces need for on- - Allows operators to make informed maintenance decisions
What are the risks of the periodic on-
to reduce/minimize on-
CEESmaRT collects, historizes, and analyzes metering
ultrasonic and coriolis meters, flow computers,
database.
CEESmaRT provides your measurement team quick, easy, and comprehensive Web portal access to your
trending.
arise.
CEESmaRT provides scheduled email reports that
powerful analysis tools to interpret the data.
What is CEESmaRT?
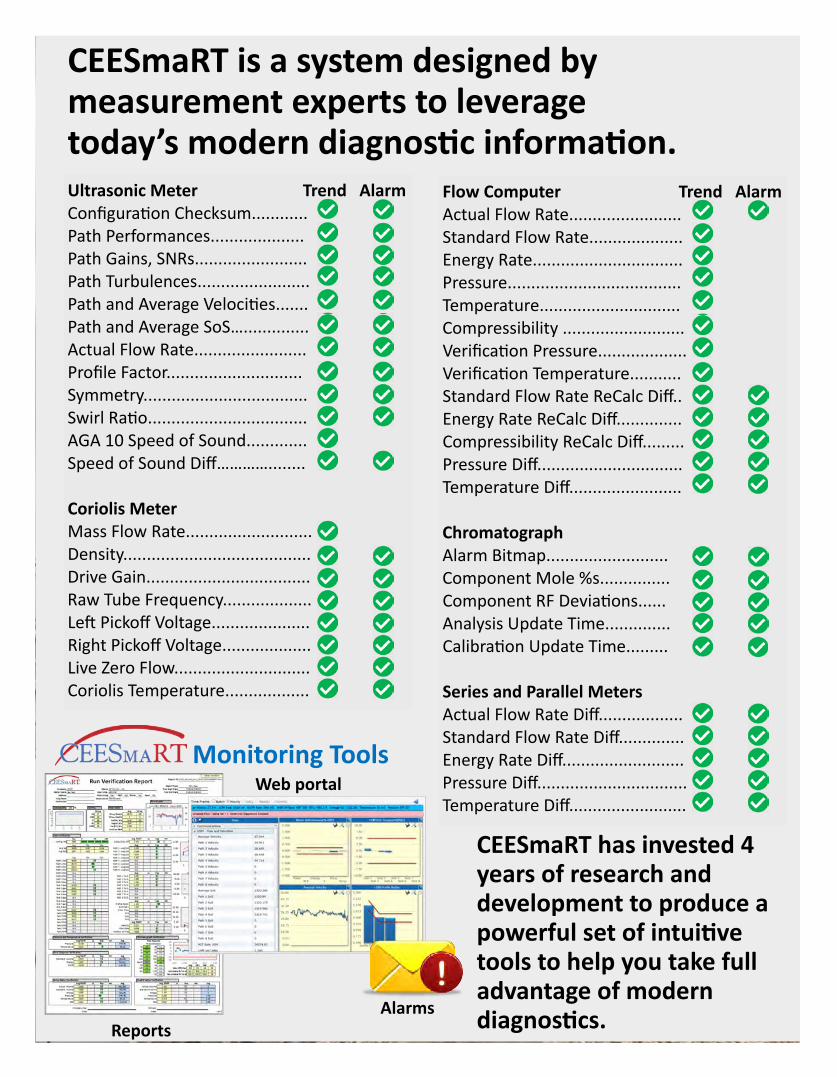
Ultrasonic Meter Trend Alarm
Path Performances.................... Path Gains, SNRs........................ Path Turbulences........................
Path and Average SoS….............. Actual Flow Rate........................ Profile Factor............................. Symmetry...................................
AGA 10 Speed of Sound............. Speed of Sound Diff…………........ Coriolis Meter Mass Flow Rate........................... Density........................................ Drive Gain................................... Raw Tube Frequency...................
Right Pickoff Voltage................... Live Zero Flow............................. Coriolis Temperature..................
Flow Computer Trend Alarm Actual Flow Rate........................ Standard Flow Rate.................... Energy Rate................................ Pressure..................................... Temperature.............................. Compressibility ..........................
Standard Flow Rate ReCalc Diff.. Energy Rate ReCalc Diff.............. Compressibility ReCalc Diff......... Pressure Diff............................... Temperature Diff........................ Chromatograph Alarm Bitmap.......................... Component Mole %s...............
Analysis Update Time..............
Series and Parallel Meters Actual Flow Rate Diff.................. Standard Flow Rate Diff.............. Energy Rate Diff.......................... Pressure Diff................................ Temperature Diff.........................
CEESmaRT has invested 4 years of research and development to produce a
tools to help you take full advantage of modern
CEESmaRT is a system designed by measurement experts to leverage
Monitoring Tools Web portal
Alarms Reports
Real examples of CEESmaRT leverag-
ing client’s diagnostics to improve
their measurement.
The following examples illustrate how CEESmaRT
identified intermittent, variable and hard to find
problems, helping clients and estimate the impact
on their measurement.
Measurement analysts usually have little information supporting a transmitter calibration. Generally there is a report with “as found” and “as left” values, but little other information to confirm the accuracy of the reading. Examples 1 and 2 illustrate how users can remotely confirm pressure and temperature measurements, giving users confidence in the readings and allowing them to extend the time between on-site testing.
CEESmaRT allows users to remotely monitor and trend the custody pressure and temperature readings as well as redundant (verification) readings. CEESmaRT also trends the percent difference between the measurements. So in the case of a temperature calibration, the analyst would see a shift in the percent difference between the two temperature measurements which should correspond with the “as found” and “as left” report. CEESmaRT can be used to confirm the calibration information.
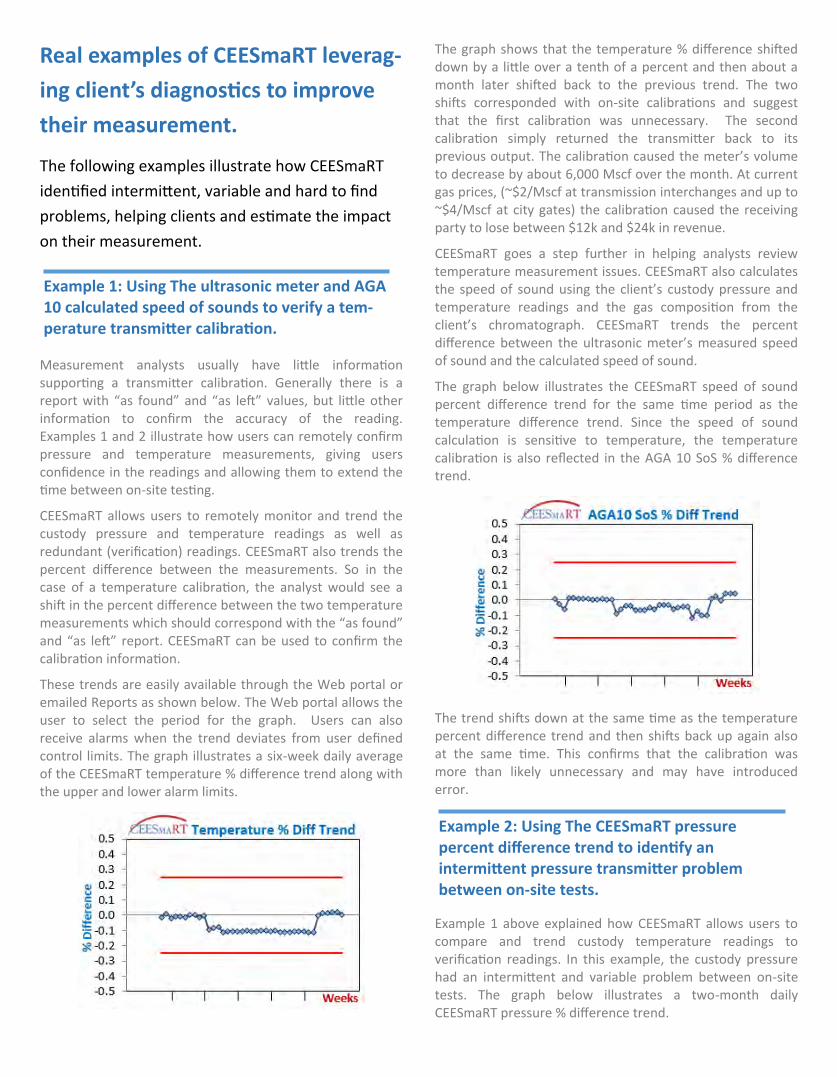
These trends are easily available through the Web portal or emailed Reports as shown below. The Web portal allows the user to select the period for the graph. Users can also receive alarms when the trend deviates from user defined control limits. The graph illustrates a six-week daily average of the CEESmaRT temperature % difference trend along with the upper and lower alarm limits.
Example 1: Using The ultrasonic meter and AGA 10 calculated speed of sounds to verify a tem-perature transmitter calibration.
The graph shows that the temperature % difference shifted down by a little over a tenth of a percent and then about a month later shifted back to the previous trend. The two shifts corresponded with on-site calibrations and suggest that the first calibration was unnecessary. The second calibration simply returned the transmitter back to its previous output. The calibration caused the meter’s volume to decrease by about 6,000 Mscf over the month. At current gas prices, (~$2/Mscf at transmission interchanges and up to ~$4/Mscf at city gates) the calibration caused the receiving party to lose between $12k and $24k in revenue.
CEESmaRT goes a step further in helping analysts review temperature measurement issues. CEESmaRT also calculates the speed of sound using the client’s custody pressure and temperature readings and the gas composition from the client’s chromatograph. CEESmaRT trends the percent difference between the ultrasonic meter’s measured speed of sound and the calculated speed of sound.
The graph below illustrates the CEESmaRT speed of sound percent difference trend for the same time period as the temperature difference trend. Since the speed of sound calculation is sensitive to temperature, the temperature calibration is also reflected in the AGA 10 SoS % difference trend.
The trend shifts down at the same time as the temperature percent difference trend and then shifts back up again also at the same time. This confirms that the calibration was more than likely unnecessary and may have introduced error.
Example 1 above explained how CEESmaRT allows users to compare and trend custody temperature readings to verification readings. In this example, the custody pressure had an intermittent and variable problem between on-site tests. The graph below illustrates a two-month daily CEESmaRT pressure % difference trend.
Example 2: Using The CEESmaRT pressure percent difference trend to identify an intermittent pressure transmitter problem between on-site tests.
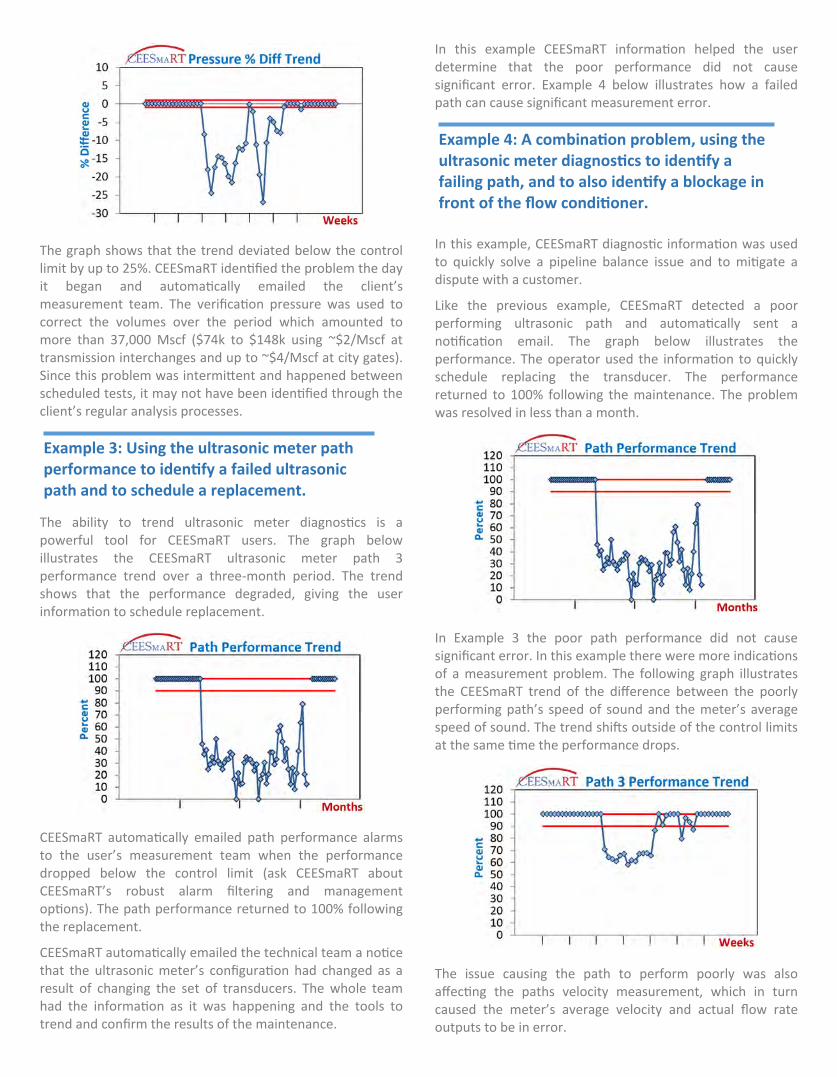
The graph shows that the trend deviated below the control limit by up to 25%. CEESmaRT identified the problem the day it began and automatically emailed the client’s measurement team. The verification pressure was used to correct the volumes over the period which amounted to more than 37,000 Mscf ($74k to $148k using ~$2/Mscf at transmission interchanges and up to ~$4/Mscf at city gates). Since this problem was intermittent and happened between scheduled tests, it may not have been identified through the client’s regular analysis processes.
The ability to trend ultrasonic meter diagnostics is a powerful tool for CEESmaRT users. The graph below illustrates the CEESmaRT ultrasonic meter path 3 performance trend over a three-month period. The trend shows that the performance degraded, giving the user information to schedule replacement.
CEESmaRT automatically emailed path performance alarms to the user’s measurement team when the performance dropped below the control limit (ask CEESmaRT about CEESmaRT’s robust alarm filtering and management options). The path performance returned to 100% following the replacement.
CEESmaRT automatically emailed the technical team a notice that the ultrasonic meter’s configuration had changed as a result of changing the set of transducers. The whole team had the information as it was happening and the tools to trend and confirm the results of the maintenance.
Example 3: Using the ultrasonic meter path performance to identify a failed ultrasonic path and to schedule a replacement.
In this example CEESmaRT information helped the user determine that the poor performance did not cause significant error. Example 4 below illustrates how a failed path can cause significant measurement error.
In this example, CEESmaRT diagnostic information was used to quickly solve a pipeline balance issue and to mitigate a dispute with a customer.
Like the previous example, CEESmaRT detected a poor performing ultrasonic path and automatically sent a notification email. The graph below illustrates the performance. The operator used the information to quickly schedule replacing the transducer. The performance returned to 100% following the maintenance. The problem was resolved in less than a month.
In Example 3 the poor path performance did not cause significant error. In this example there were more indications of a measurement problem. The following graph illustrates the CEESmaRT trend of the difference between the poorly performing path’s speed of sound and the meter’s average speed of sound. The trend shifts outside of the control limits at the same time the performance drops.
The issue causing the path to perform poorly was also affecting the paths velocity measurement, which in turn caused the meter’s average velocity and actual flow rate outputs to be in error.
Example 4: A combination problem, using the ultrasonic meter diagnostics to identify a failing path, and to also identify a blockage in front of the flow conditioner.
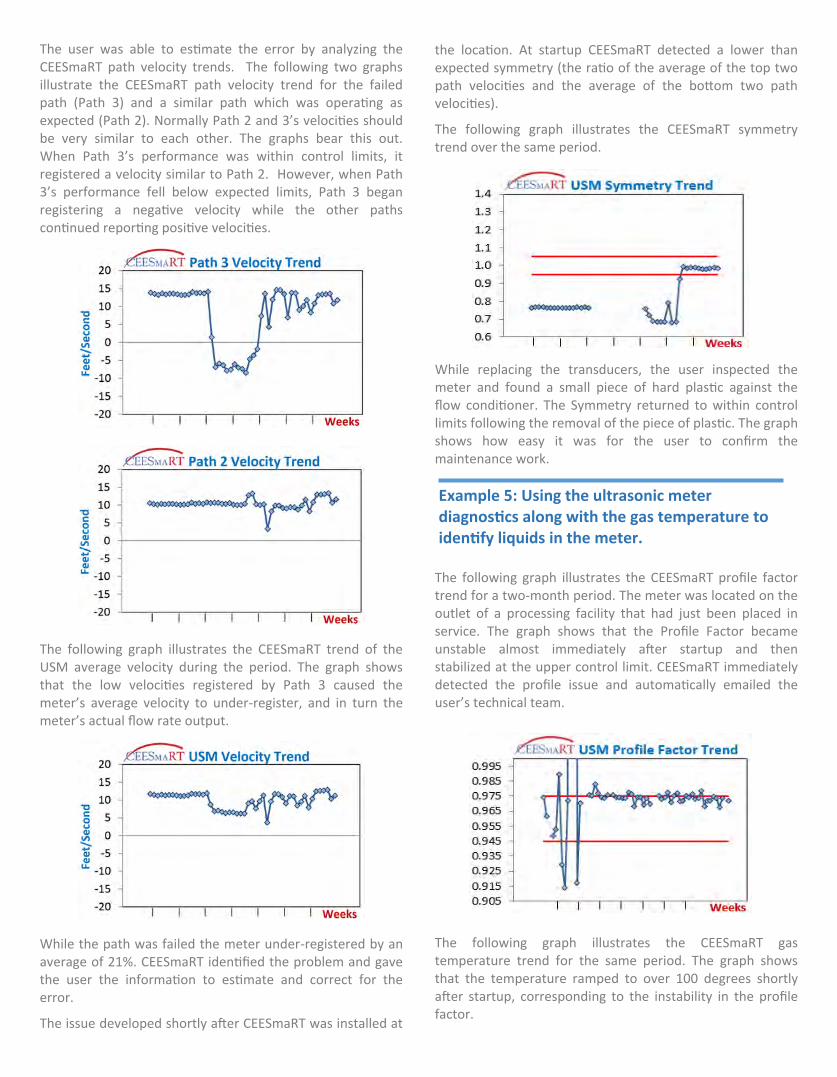
The user was able to estimate the error by analyzing the CEESmaRT path velocity trends. The following two graphs illustrate the CEESmaRT path velocity trend for the failed path (Path 3) and a similar path which was operating as expected (Path 2). Normally Path 2 and 3’s velocities should be very similar to each other. The graphs bear this out. When Path 3’s performance was within control limits, it registered a velocity similar to Path 2. However, when Path 3’s performance fell below expected limits, Path 3 began registering a negative velocity while the other paths continued reporting positive velocities.
The following graph illustrates the CEESmaRT trend of the USM average velocity during the period. The graph shows that the low velocities registered by Path 3 caused the meter’s average velocity to under-register, and in turn the meter’s actual flow rate output.
While the path was failed the meter under-registered by an average of 21%. CEESmaRT identified the problem and gave the user the information to estimate and correct for the error.
The issue developed shortly after CEESmaRT was installed at
the location. At startup CEESmaRT detected a lower than expected symmetry (the ratio of the average of the top two path velocities and the average of the bottom two path velocities).
The following graph illustrates the CEESmaRT symmetry trend over the same period.
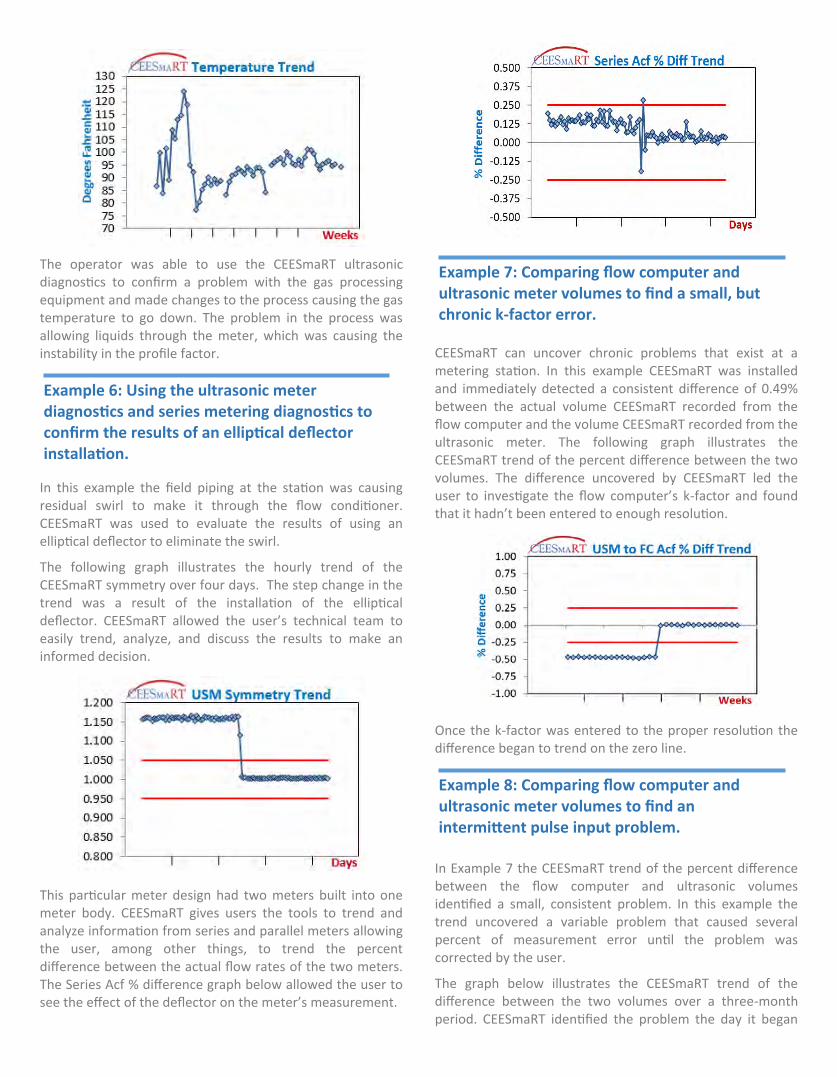
While replacing the transducers, the user inspected the meter and found a small piece of hard plastic against the flow conditioner. The Symmetry returned to within control limits following the removal of the piece of plastic. The graph shows how easy it was for the user to confirm the maintenance work.
The following graph illustrates the CEESmaRT profile factor trend for a two-month period. The meter was located on the outlet of a processing facility that had just been placed in service. The graph shows that the Profile Factor became unstable almost immediately after startup and then stabilized at the upper control limit. CEESmaRT immediately detected the profile issue and automatically emailed the user’s technical team.
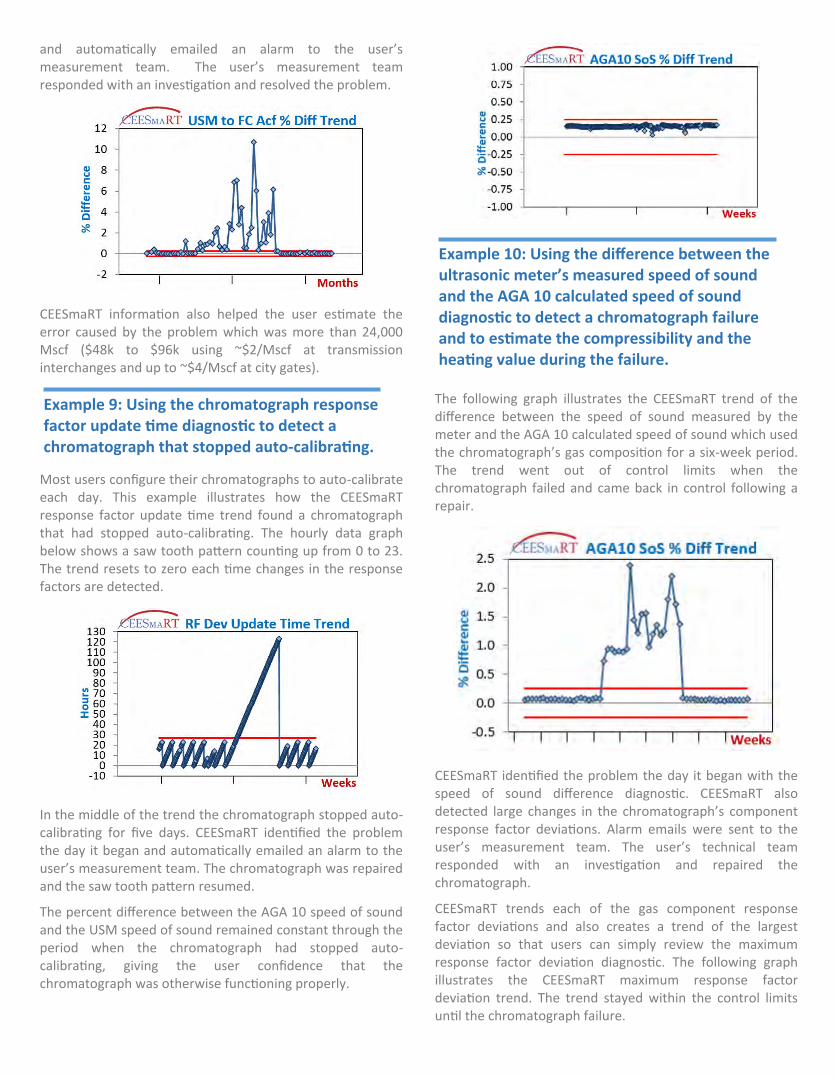
The following graph illustrates the CEESmaRT gas temperature trend for the same period. The graph shows that the temperature ramped to over 100 degrees shortly after startup, corresponding to the instability in the profile factor.
Example 5: Using the ultrasonic meter diagnostics along with the gas temperature to identify liquids in the meter.
The operator was able to use the CEESmaRT ultrasonic diagnostics to confirm a problem with the gas processing equipment and made changes to the process causing the gas temperature to go down. The problem in the process was allowing liquids through the meter, which was causing the instability in the profile factor.
In this example the field piping at the station was causing residual swirl to make it through the flow conditioner. CEESmaRT was used to evaluate the results of using an elliptical deflector to eliminate the swirl.
The following graph illustrates the hourly trend of the CEESmaRT symmetry over four days. The step change in the trend was a result of the installation of the elliptical deflector. CEESmaRT allowed the user’s technical team to easily trend, analyze, and discuss the results to make an informed decision.
This particular meter design had two meters built into one meter body. CEESmaRT gives users the tools to trend and analyze information from series and parallel meters allowing the user, among other things, to trend the percent difference between the actual flow rates of the two meters. The Series Acf % difference graph below allowed the user to see the effect of the deflector on the meter’s measurement.
Example 6: Using the ultrasonic meter diagnostics and series metering diagnostics to confirm the results of an elliptical deflector installation.
CEESmaRT can uncover chronic problems that exist at a metering station. In this example CEESmaRT was installed and immediately detected a consistent difference of 0.49% between the actual volume CEESmaRT recorded from the flow computer and the volume CEESmaRT recorded from the ultrasonic meter. The following graph illustrates the CEESmaRT trend of the percent difference between the two volumes. The difference uncovered by CEESmaRT led the user to investigate the flow computer’s k-factor and found that it hadn’t been entered to enough resolution.
Once the k-factor was entered to the proper resolution the difference began to trend on the zero line.
In Example 7 the CEESmaRT trend of the percent difference between the flow computer and ultrasonic volumes identified a small, consistent problem. In this example the trend uncovered a variable problem that caused several percent of measurement error until the problem was corrected by the user.
The graph below illustrates the CEESmaRT trend of the difference between the two volumes over a three-month period. CEESmaRT identified the problem the day it began
Example 7: Comparing flow computer and ultrasonic meter volumes to find a small, but chronic k-factor error.
Example 8: Comparing flow computer and ultrasonic meter volumes to find an intermittent pulse input problem.
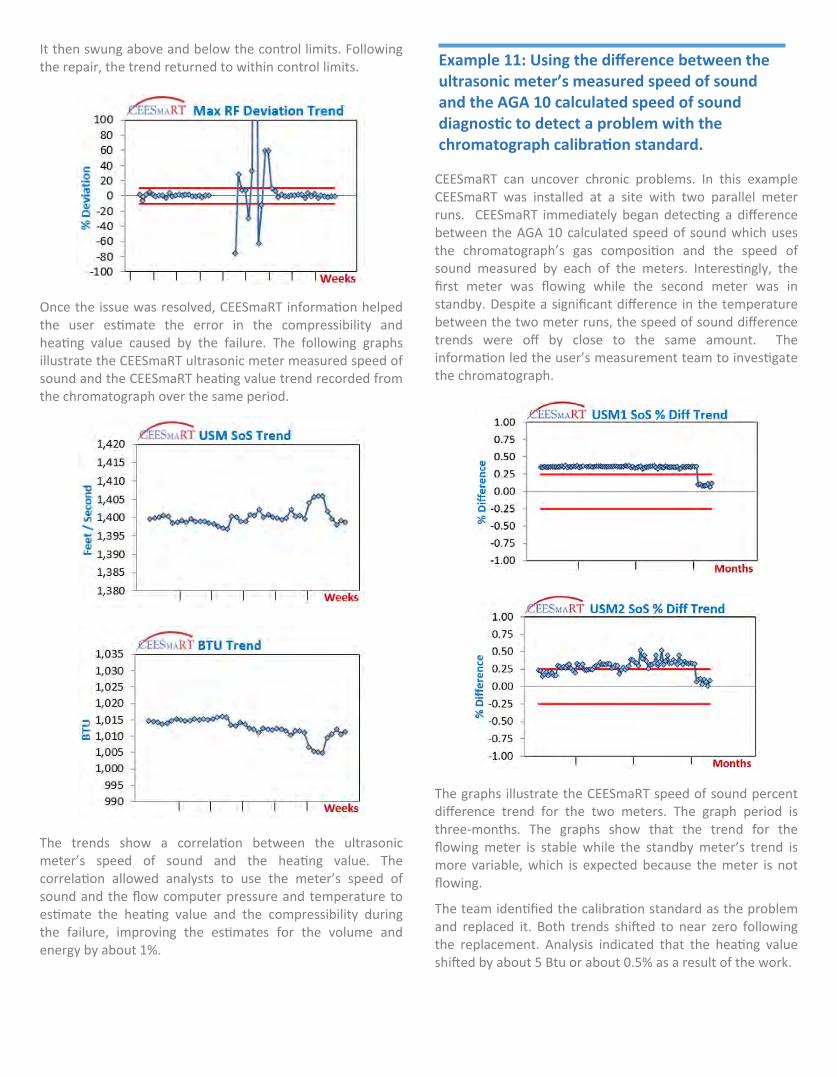
and automatically emailed an alarm to the user’s measurement team. The user’s measurement team responded with an investigation and resolved the problem.
CEESmaRT information also helped the user estimate the error caused by the problem which was more than 24,000 Mscf ($48k to $96k using ~$2/Mscf at transmission interchanges and up to ~$4/Mscf at city gates).
Most users configure their chromatographs to auto-calibrate each day. This example illustrates how the CEESmaRT response factor update time trend found a chromatograph that had stopped auto-calibrating. The hourly data graph below shows a saw tooth pattern counting up from 0 to 23. The trend resets to zero each time changes in the response factors are detected.
In the middle of the trend the chromatograph stopped auto-calibrating for five days. CEESmaRT identified the problem the day it began and automatically emailed an alarm to the user’s measurement team. The chromatograph was repaired and the saw tooth pattern resumed.
The percent difference between the AGA 10 speed of sound and the USM speed of sound remained constant through the period when the chromatograph had stopped auto-calibrating, giving the user confidence that the chromatograph was otherwise functioning properly.
Example 9: Using the chromatograph response factor update time diagnostic to detect a chromatograph that stopped auto-calibrating.
The following graph illustrates the CEESmaRT trend of the difference between the speed of sound measured by the meter and the AGA 10 calculated speed of sound which used the chromatograph’s gas composition for a six-week period. The trend went out of control limits when the chromatograph failed and came back in control following a repair.
CEESmaRT identified the problem the day it began with the speed of sound difference diagnostic. CEESmaRT also detected large changes in the chromatograph’s component response factor deviations. Alarm emails were sent to the user’s measurement team. The user’s technical team responded with an investigation and repaired the chromatograph.
CEESmaRT trends each of the gas component response factor deviations and also creates a trend of the largest deviation so that users can simply review the maximum response factor deviation diagnostic. The following graph illustrates the CEESmaRT maximum response factor deviation trend. The trend stayed within the control limits until the chromatograph failure.
Example 10: Using the difference between the ultrasonic meter’s measured speed of sound and the AGA 10 calculated speed of sound diagnostic to detect a chromatograph failure and to estimate the compressibility and the heating value during the failure.
It then swung above and below the control limits. Following the repair, the trend returned to within control limits.
Once the issue was resolved, CEESmaRT information helped the user estimate the error in the compressibility and heating value caused by the failure. The following graphs illustrate the CEESmaRT ultrasonic meter measured speed of sound and the CEESmaRT heating value trend recorded from the chromatograph over the same period.
The trends show a correlation between the ultrasonic meter’s speed of sound and the heating value. The correlation allowed analysts to use the meter’s speed of sound and the flow computer pressure and temperature to estimate the heating value and the compressibility during the failure, improving the estimates for the volume and energy by about 1%.
CEESmaRT can uncover chronic problems. In this example CEESmaRT was installed at a site with two parallel meter runs. CEESmaRT immediately began detecting a difference between the AGA 10 calculated speed of sound which uses the chromatograph’s gas composition and the speed of sound measured by each of the meters. Interestingly, the first meter was flowing while the second meter was in standby. Despite a significant difference in the temperature between the two meter runs, the speed of sound difference trends were off by close to the same amount. The information led the user’s measurement team to investigate the chromatograph.
The graphs illustrate the CEESmaRT speed of sound percent difference trend for the two meters. The graph period is three-months. The graphs show that the trend for the flowing meter is stable while the standby meter’s trend is more variable, which is expected because the meter is not flowing.
The team identified the calibration standard as the problem and replaced it. Both trends shifted to near zero following the replacement. Analysis indicated that the heating value shifted by about 5 Btu or about 0.5% as a result of the work.
Example 11: Using the difference between the ultrasonic meter’s measured speed of sound and the AGA 10 calculated speed of sound diagnostic to detect a problem with the chromatograph calibration standard.
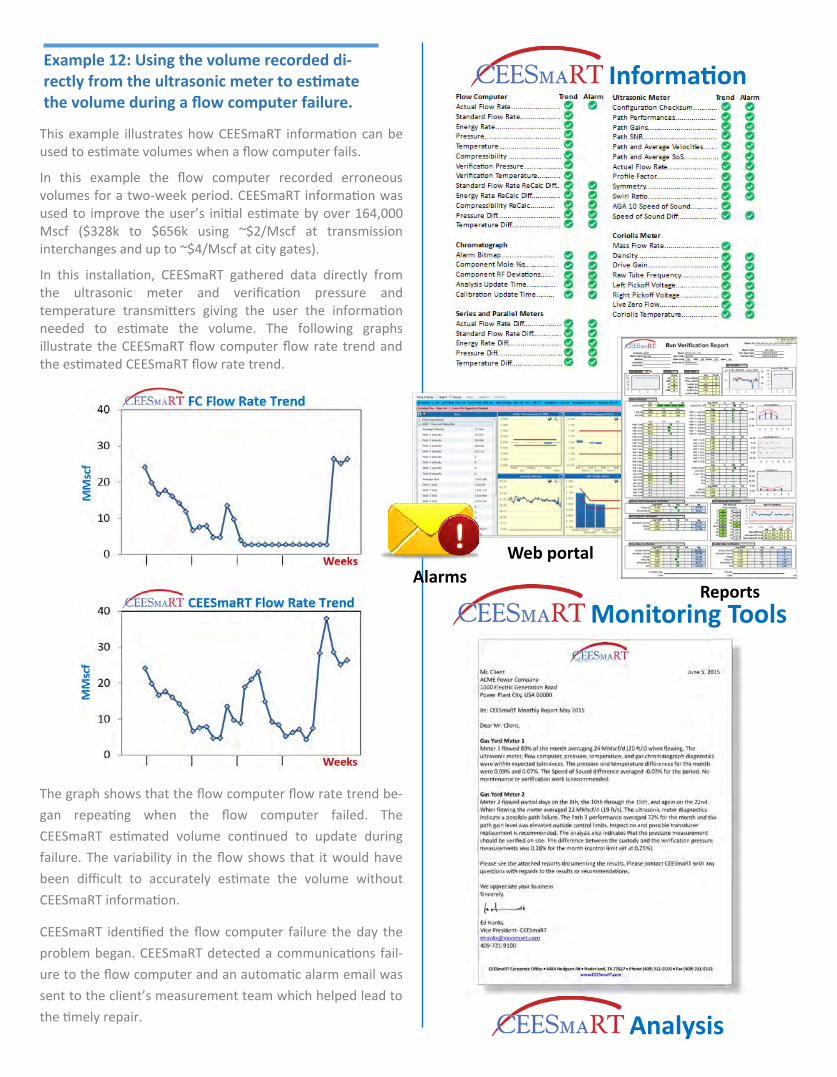
In this example the flow computer recorded erroneous volumes for a two-
Mscf ($328k to $656k using ~$2/Mscf at transmission interchanges and up to ~$4/Mscf at city gates).
illustrate the CEESmaRT flow computer flow rate trend and
The graph shows that the flow computer flow rate trend be-
failure. The variability in the flow shows that it would have
sent to the client’s measurement team which helped lead to
Example 12: Using the volume recorded di-
the volume during a flow computer failure.
Monitoring Tools
Web portal Alarms
Reports
Analysis
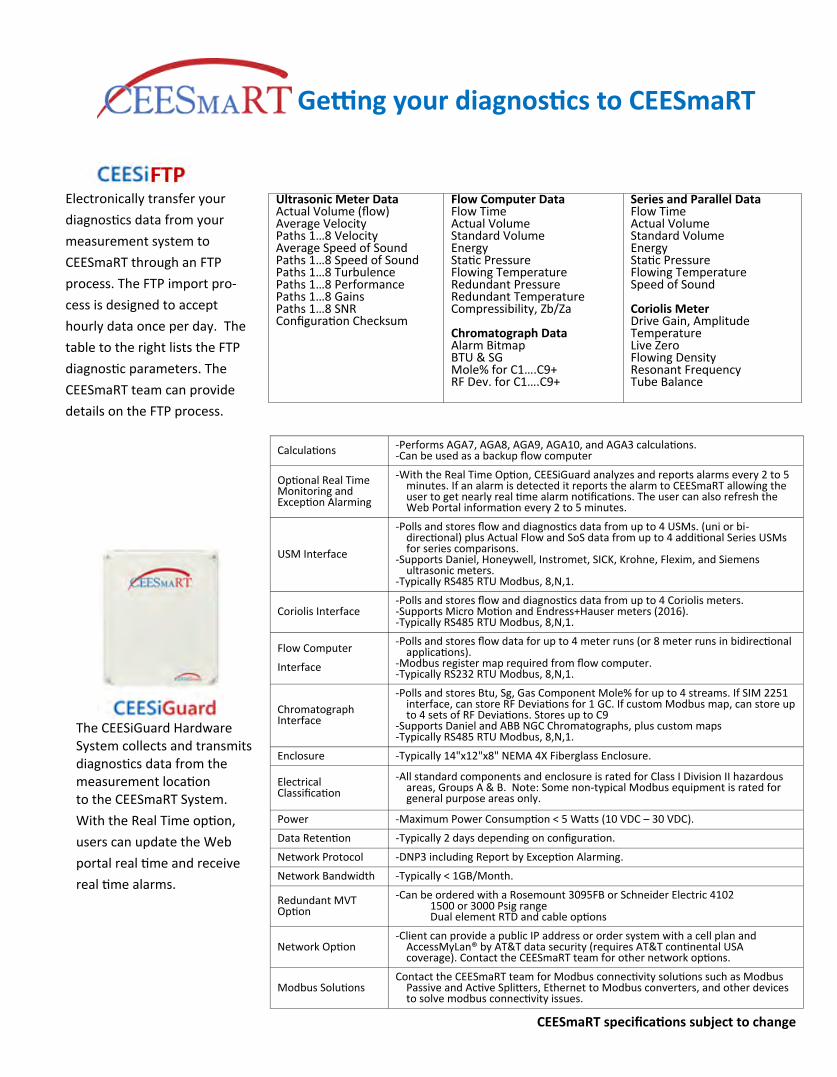
Getting your diagnostics to CEESmaRT
Electronically transfer your
diagnostics data from your
measurement system to
CEESmaRT through an FTP
process. The FTP import pro-
cess is designed to accept
hourly data once per day. The
table to the right lists the FTP
diagnostic parameters. The
CEESmaRT team can provide
details on the FTP process.
The CEESiGuard Hardware System collects and transmits diagnostics data from the measurement location to the CEESmaRT System.
With the Real Time option,
users can update the Web
portal real time and receive
real time alarms.
Ultrasonic Meter Data Actual Volume (flow) Average Velocity Paths 1…8 Velocity Average Speed of Sound Paths 1…8 Speed of Sound Paths 1…8 Turbulence Paths 1…8 Performance Paths 1…8 Gains Paths 1…8 SNR Configuration Checksum
Flow Computer Data Flow Time Actual Volume Standard Volume Energy Static Pressure Flowing Temperature Redundant Pressure Redundant Temperature Compressibility, Zb/Za Chromatograph Data Alarm Bitmap BTU & SG Mole% for C1….C9+ RF Dev. for C1….C9+
Series and Parallel Data Flow Time Actual Volume Standard Volume Energy Static Pressure Flowing Temperature Speed of Sound Coriolis Meter Drive Gain, Amplitude Temperature Live Zero Flowing Density Resonant Frequency Tube Balance
CEESmaRT specifications subject to change
Calculations -Performs AGA7, AGA8, AGA9, AGA10, and AGA3 calculations. -Can be used as a backup flow computer
Optional Real Time Monitoring and Exception Alarming
-With the Real Time Option, CEESiGuard analyzes and reports alarms every 2 to 5 minutes. If an alarm is detected it reports the alarm to CEESmaRT allowing the user to get nearly real time alarm notifications. The user can also refresh the Web Portal information every 2 to 5 minutes.
USM Interface
-Polls and stores flow and diagnostics data from up to 4 USMs. (uni or bi-directional) plus Actual Flow and SoS data from up to 4 additional Series USMs for series comparisons.
-Supports Daniel, Honeywell, Instromet, SICK, Krohne, Flexim, and Siemens ultrasonic meters.
-Typically RS485 RTU Modbus, 8,N,1.
Coriolis Interface -Polls and stores flow and diagnostics data from up to 4 Coriolis meters. -Supports Micro Motion and Endress+Hauser meters (2016). -Typically RS485 RTU Modbus, 8,N,1.
Flow Computer
Interface
-Polls and stores flow data for up to 4 meter runs (or 8 meter runs in bidirectional applications).
-Modbus register map required from flow computer. -Typically RS232 RTU Modbus, 8,N,1.
Chromatograph Interface
-Polls and stores Btu, Sg, Gas Component Mole% for up to 4 streams. If SIM 2251 interface, can store RF Deviations for 1 GC. If custom Modbus map, can store up to 4 sets of RF Deviations. Stores up to C9
-Supports Daniel and ABB NGC Chromatographs, plus custom maps -Typically RS485 RTU Modbus, 8,N,1.
Enclosure -Typically 14"x12"x8" NEMA 4X Fiberglass Enclosure.
Electrical Classification
-All standard components and enclosure is rated for Class I Division II hazardous areas, Groups A & B. Note: Some non-typical Modbus equipment is rated for general purpose areas only.
Power -Maximum Power Consumption < 5 Watts (10 VDC – 30 VDC).
Data Retention -Typically 2 days depending on configuration.
Network Protocol -DNP3 including Report by Exception Alarming.
Network Bandwidth -Typically < 1GB/Month.
Redundant MVT Option
-Can be ordered with a Rosemount 3095FB or Schneider Electric 4102 1500 or 3000 Psig range Dual element RTD and cable options
Network Option -Client can provide a public IP address or order system with a cell plan and
AccessMyLan® by AT&T data security (requires AT&T continental USA coverage). Contact the CEESmaRT team for other network options.
Modbus Solutions Contact the CEESmaRT team for Modbus connectivity solutions such as Modbus
Passive and Active Splitters, Ethernet to Modbus converters, and other devices to solve modbus connectivity issues.

Measurement engineering Training Flow computer and analyzer building
On-site commissioning On-
and system audits Remote monitoring and analysis
Let the W.E.S.T. family of companies help
Phone: (409)721-9100 Website: www.ceesmart.com
[email protected] [email protected]
Headquarters: 4484 Hodgson Road Nederland Texas 77627