Embed Size (px)
Citation preview

Significance testing with noalternative hypothesis: a
measure of surpriseJ. V. Howard
London School of Economics
Significance testing with no alternative hypothesis: a measure of surprise – p. 1

The curse of the iceman
Since being found 14 years ago, five of the people who came inclose contact with Ötzi the Iceman have died, leading to theinevitable question: is the mummy cursed? (Guardian, April 20,2005)
Konrad Spindler, head of the Iceman investigation team atInnsbruck University, died on Monday, apparently fromcomplications arising from multiple sclerosis. But that has notstopped his name being linked to a string of strange deaths relatedto the mummy.
Significance testing with no alternative hypothesis: a measure of surprise – p. 2

The curse of the iceman
The "curse" began with the death of German tourist HelmutSimon, who found the body. The hiker returned to the region tocelebrate winning a £50,000 court battle over rights to themummy. He set out in fine weather but a blizzard set in and hefroze to death, some 200 kilometers from the place where Ötzihad met a similar end. He had not signed the court papers so hiswidow did not get the £50,000. (Wikipedia)
The second “victim” is Dr Rainer Henn, 64, who is the head ofthe forensic team who examined the body. He died when his carwas in a head-on collision with another vehicle while on his wayto give a talk about Ötzi. The cause of the crash is unknown.
Significance testing with no alternative hypothesis: a measure of surprise – p. 3

The curse of the iceman
The third “victim” is mountaineer Kurt Fritz, who led Dr Hennand the others to the iceman’s body and later gave tours to thesite. Although an experienced climber, he died in an avalanche ata mountain region he was very familiar with. Even though theAustrian was crushed to death, no other member of the climbingparty was even injured by the crashing rocks.
Austrian journalist Rainer Hoelzl was the fourth “victim”. Heexclusively covered the removal of the body as part of a one-hourdocumentary that was shown around the world. But he developeda mystery illness — thought to be a brain tumour — that claimedhis life in extreme pain a few months after the programme wasshown.
Significance testing with no alternative hypothesis: a measure of surprise – p. 4

The national lottery
When you next select your lottery numbers, be sure to pick 38.That is the conclusion of a previously unpublished report by theNational Lottery Commission, which unearthed a series ofstatistical anomalies that, taken at face value, suggest the lotterymight not be as random as was previously thought. (Observer, 12December, 2004)
Completed in early 2002, the nine-page document entitled ‘TheRandomness of the National Lottery’ was meant to offerirrefutable proof that it was random. But the statisticians whoproduced the report, Dr John Haigh and Professor Charles Goldie,members of the Royal Statistical Society and readers inmathematics at the University of Sussex, hit a snag.
Significance testing with no alternative hypothesis: a measure of surprise – p. 5
The national lottery
The lottery seemed not to be as subject to chance as it should be.Some combinations popped up with ‘unusually high’ frequency,and others showed a ‘major departure from randomness’.
The revelation of the report’s existence is bound to spark publicinterest. The commission has regular calls from people suggestingthe lottery is not random, allegations that have to be investigated.The two academics found that 38 was drawn so many times thatthey wondered whether it needed to be ‘physically examined’ tosee if there was an anomaly in the ball’s make-up which meant itwas sucked out of the lottery machines more often.
Significance testing with no alternative hypothesis: a measure of surprise – p. 6

The national lottery
The report also found that the ‘bonus ball’, drawn from theLancelot machine using one particular set of balls, would usuallybe a high number - 40 or above. In addition, the Thunderballgame produced freak patterns. Draws that were four weeks apartseemed to ‘talk’ to each other. If one draw favoured a high set ofnumbers, there would be a correspondingly low set four drawslater.
Perhaps alarmed at how the findings would be received, thecommission did not publicise them, simply noting in its annualreport that a Royal Statistical Society study had ‘confirmed thatresults were consistent with the draw being random’.
Significance testing with no alternative hypothesis: a measure of surprise – p. 7

Tossing a fair coinOne hundred tosses
All 2100 possible outcomes are equally probable
Significance testing with no alternative hypothesis: a measure of surprise – p. 8

Tossing a fair coinOne hundred tosses
All 2100 possible outcomes are equally probable
Model could never be rejected without an alternativehypothesis
Significance testing with no alternative hypothesis: a measure of surprise – p. 8

Tossing a fair coinOne hundred tosses
All 2100 possible outcomes are equally probable
Model could never be rejected without an alternativehypothesis
Urn contains one ball of each of a list of colours
Significance testing with no alternative hypothesis: a measure of surprise – p. 8

Tossing a fair coinOne hundred tosses
All 2100 possible outcomes are equally probable
Model could never be rejected without an alternativehypothesis
Urn contains one ball of each of a list of colours
Some sequences ofH ’s andT ’s suggest alternativehypotheses
Suppose these are not initially credible
Significance testing with no alternative hypothesis: a measure of surprise – p. 8

A black boxSwitch box on: get sequence of 0’s and 1’s
‘1’ occurs in then’th place if and only ifn is prime
Model could be rejected without an alternative hypothesis
Significance testing with no alternative hypothesis: a measure of surprise – p. 9

A black boxSwitch box on: get sequence of 0’s and 1’s
‘1’ occurs in then’th place if and only ifn is prime
Model could be rejected without an alternative hypothesis
Model: urn contains only red balls. Blue ball drawn
Significance testing with no alternative hypothesis: a measure of surprise – p. 9

A black boxSwitch box on: get sequence of 0’s and 1’s
‘1’ occurs in then’th place if and only ifn is prime
Model could be rejected without an alternative hypothesis
Model: urn contains only red balls. Blue ball drawn
Deterministic?
Significance testing with no alternative hypothesis: a measure of surprise – p. 9

Urn modelDraw one ball from urn
Urn asserted to have specified proportions of balls withvarious labels (or colours)
Significance testing with no alternative hypothesis: a measure of surprise – p. 10

Urn modelDraw one ball from urn
Urn asserted to have specified proportions of balls withvarious labels (or colours)
When would the single observation cause us to doubt themodel?
Significance testing with no alternative hypothesis: a measure of surprise – p. 10

Urn modelDraw one ball from urn
Urn asserted to have specified proportions of balls withvarious labels (or colours)
When would the single observation cause us to doubt themodel?
The balls are labelled with the possible outcomesi = 1, 2, . . . , n of an experiment
Proportion of balls with labeli equals the probability,pi, thatoutcomei will occur if H0 is true
Seek measures of surprise (doubt, scepticism) based solely onthe observedpi and the vector of probabilities(p1, p2, . . . , pn)for the possible outcomes labelled1, 2, . . . , n
Significance testing with no alternative hypothesis: a measure of surprise – p. 10

A challengeWe have a null hypothesis (a standard model)
A challenger can suggest tests of the standard model
Challenger may or may not have an alternative in mind
Significance testing with no alternative hypothesis: a measure of surprise – p. 11
A challengeWe have a null hypothesis (a standard model)
A challenger can suggest tests of the standard model
Challenger may or may not have an alternative in mind
A test prescribes what data is to be collected (up to a finitebound), and how the data is to be summarised
For example: “switch on the black box and observe untileither ten 0’s or one hundred digits have been seen: recordthe number of 1’s observed.”
Significance testing with no alternative hypothesis: a measure of surprise – p. 11

A challengeWe have a null hypothesis (a standard model)
A challenger can suggest tests of the standard model
Challenger may or may not have an alternative in mind
A test prescribes what data is to be collected (up to a finitebound), and how the data is to be summarised
For example: “switch on the black box and observe untileither ten 0’s or one hundred digits have been seen: recordthe number of 1’s observed.”
Could challenge fair coin hypothesis
Significance testing with no alternative hypothesis: a measure of surprise – p. 11

A testProtocol for the test gives a set of possible outcomes(1, 2, . . . , n) and associated probabilities(p1, p2, . . . , pn)
After the test, we have the observed outcomei and itsprobabilitypi
Significance testing with no alternative hypothesis: a measure of surprise – p. 12

A testProtocol for the test gives a set of possible outcomes(1, 2, . . . , n) and associated probabilities(p1, p2, . . . , pn)
After the test, we have the observed outcomei and itsprobabilitypi
Seek a numerical measure to indicate the level of surprise orscepticism we feel on observing the outcome
Conventional hypothesis tests give dichotomous 0 or 1measures
Significance testing with no alternative hypothesis: a measure of surprise – p. 12

A testProtocol for the test gives a set of possible outcomes(1, 2, . . . , n) and associated probabilities(p1, p2, . . . , pn)
After the test, we have the observed outcomei and itsprobabilitypi
Seek a numerical measure to indicate the level of surprise orscepticism we feel on observing the outcome
Conventional hypothesis tests give dichotomous 0 or 1measuresRandomised tests give a number between 0 and 1
Significance testing with no alternative hypothesis: a measure of surprise – p. 12

A testProtocol for the test gives a set of possible outcomes(1, 2, . . . , n) and associated probabilities(p1, p2, . . . , pn)
After the test, we have the observed outcomei and itsprobabilitypi
Seek a numerical measure to indicate the level of surprise orscepticism we feel on observing the outcome
Conventional hypothesis tests give dichotomous 0 or 1measuresRandomised tests give a number between 0 and 1p-values
Significance testing with no alternative hypothesis: a measure of surprise – p. 12

First difficultyDid we observe an event with a much lower probability thanalternatives that might have occurred but did not?
Need to consider not just the probability of what hashappened, but also the probabilities of things which did nothappen.
Significance testing with no alternative hypothesis: a measure of surprise – p. 13

First difficultyDid we observe an event with a much lower probability thanalternatives that might have occurred but did not?
Need to consider not just the probability of what hashappened, but also the probabilities of things which did nothappen. Yuk
REG: challenger asks us to stop the sequence when we firstsee a 0, or if we observe one hundred 1’s in a row. 101possible outcomes, with probabilities
1
2,1
4,1
8, . . . ,
(
1
2
)100
,
(
1
2
)100
Significance testing with no alternative hypothesis: a measure of surprise – p. 13
First difficultyDid we observe an event with a much lower probability thanalternatives that might have occurred but did not?
Need to consider not just the probability of what hashappened, but also the probabilities of things which did nothappen. Yuk
REG: challenger asks us to stop the sequence when we firstsee a 0, or if we observe one hundred 1’s in a row. 101possible outcomes, with probabilities
1
2,1
4,1
8, . . . ,
(
1
2
)100
,
(
1
2
)100
Observing one hundred 1’s is now surprising
Significance testing with no alternative hypothesis: a measure of surprise – p. 13

First difficultyDid we observe an event with a much lower probability thanalternatives that might have occurred but did not?
Need to consider not just the probability of what hashappened, but also the probabilities of things which did nothappen. Yuk
REG: challenger asks us to stop the sequence when we firstsee a 0, or if we observe one hundred 1’s in a row. 101possible outcomes, with probabilities
1
2,1
4,1
8, . . . ,
(
1
2
)100
,
(
1
2
)100
Observing one hundred 1’s is now surprising
But not if we had planned to observe 100 digits!
Significance testing with no alternative hypothesis: a measure of surprise – p. 13

Pratt-Royall example
A coin is tossed 20 times and the number of heads recorded andsent to me in code. The observation is 6 and I remember the codefor 6, so I can look at the data as one of 21 possibilities and reportap-value accordingly. As it happens, the code for ‘6’ is the onlyone I remember, and after I have reported my results, I discoverthe code book is missing, and might have been unavailable at thetime of the experiment. Should I write to the journal to correctmy calculation now I know that I could observe only ‘6’ or‘not-6’? Has the result become more significant?
Significance testing with no alternative hypothesis: a measure of surprise – p. 14

Pratt-Royall example
A coin is tossed 20 times and the number of heads recorded andsent to me in code. The observation is 6 and I remember the codefor 6, so I can look at the data as one of 21 possibilities and reportap-value accordingly. As it happens, the code for ‘6’ is the onlyone I remember, and after I have reported my results, I discoverthe code book is missing, and might have been unavailable at thetime of the experiment. Should I write to the journal to correctmy calculation now I know that I could observe only ‘6’ or‘not-6’? Has the result become more significant?
Consider only situations where the experimental protocol isfollowed exactly, and code books do not get lost.
Significance testing with no alternative hypothesis: a measure of surprise – p. 14

Second difficulty
An urn contains 2,000 balls, The model is that it has two ballseach of 1,000 different known colours including pink. A ballis drawn at random from the urn: it is pink. Is this evidenceagainst the model?
Significance testing with no alternative hypothesis: a measure of surprise – p. 15

Second difficulty
An urn contains 2,000 balls, The model is that it has two ballseach of 1,000 different known colours including pink. A ballis drawn at random from the urn: it is pink. Is this evidenceagainst the model?
An urn contains 1,999 balls, The model is that it has two ballseach of 999 different known colours, and one pink ball. Aball is drawn at random from the urn: it is pink. Is thisevidence against the model?
An urn contains 2,001 balls, The model is that it has two ballseach of 999 different known colours, and three pink balls. Aball is drawn at random from the urn: it is pink. Is thisevidence against the model?
Significance testing with no alternative hypothesis: a measure of surprise – p. 15

Surprising outcomes
Draw a ball labelledi, say, from an urn. Surprising because:
we were told that there were relatively few balls labelledi inthe urn, while there were other labels which were much morecommon
Significance testing with no alternative hypothesis: a measure of surprise – p. 16

Surprising outcomes
Draw a ball labelledi, say, from an urn. Surprising because:
we were told that there were relatively few balls labelledi inthe urn, while there were other labels which were much morecommon
thelabel i may seem very unusual
theproportion, pi, of balls labelledi may be very unusual
Only concerned with the first
Not collecting data indefinitely
Significance testing with no alternative hypothesis: a measure of surprise – p. 16
General sequential experimentStudy may take a sequential (tree) form
Finite number of paths from each node
Tree is finite
Different branches may generate the same final report
Significance testing with no alternative hypothesis: a measure of surprise – p. 17

General sequential experimentStudy may take a sequential (tree) form
Finite number of paths from each node
Tree is finite
Different branches may generate the same final report
Set of possible branches is the sample space for the study
Final report is the observed data
Equivalent to making a single draw from an urn
Significance testing with no alternative hypothesis: a measure of surprise – p. 17

ExampleToss a coin until aT has been observed, or stop after threeconsecutiveH ’s
Ha
Tb
H
Tc
H
Td
Tree of possible results
Significance testing with no alternative hypothesis: a measure of surprise – p. 18

ExampleRedraw tree as if making a single draw from an urn
HHHa
HHTb
HTc
Td
The urn could contain 4 balls labelled ‘T ’, 2 labelled ‘HT ’, andone each labelled ‘HHT ’ and ‘HHH ’.
Or 4 balls labelled ‘1’, 2 labelled ‘2’, and 2 labelled ‘3’.
Significance testing with no alternative hypothesis: a measure of surprise – p. 19

The two basic problems(model comparison): several models involved
Significance testing with no alternative hypothesis: a measure of surprise – p. 20
The two basic problems(model comparison): several models involved
(model testing): one model involved
Significance testing with no alternative hypothesis: a measure of surprise – p. 20

The two basic problems(model comparison): several models involved
(model testing): one model involved
Can we reject a statistical hypothesis without having analternative to set against it? (Bernardo and O’Hagan inDiscussion following Bayarri and Berger (1999))
Any automated procedure could be internalised
Bayesian always in this position. If she assigns priorprobabilitywi to modelMi, she then has the supermodel
M =∑
i
wiMi.
This model has no alternative
Significance testing with no alternative hypothesis: a measure of surprise – p. 20
Approaches to the two problemsTwo radically different approaches:
Look only at the particular data that has been observed, sayxand the probability of getting that data. So we fix the datapointx and vary the possible measures on the tree (and henceon the sample space). This gives an approach based onlikelihood or on Bayesian ideas
Significance testing with no alternative hypothesis: a measure of surprise – p. 21

Approaches to the two problemsTwo radically different approaches:
Look only at the particular data that has been observed, sayxand the probability of getting that data. So we fix the datapointx and vary the possible measures on the tree (and henceon the sample space). This gives an approach based onlikelihood or on Bayesian ideas
Fix the measure on the tree and look at the other branchesthat might have been followed (other data that might havebeen observed) (Specify a stopping rule)
Natural to use the first approach for the first problem, and thesecond for the second.
Neyman-Pearson combines both approaches
We will try to tackle problem 2 using approach 2
Significance testing with no alternative hypothesis: a measure of surprise – p. 21

Surprise indicesAn index of surprise should be a function of only the observedpi
and the vector of probabilities(p1, p2, . . . , pn)
Three ideas are:
Weaver (1948) proposed looking at the ratio ofE [P ] to theobservedP (x). So the Weaver surprise index is
wi =
∑
p2j
pi
when observationi is made. (Basically we are comparing theobserved value of the random variableP to its expectation)
Significance testing with no alternative hypothesis: a measure of surprise – p. 22

Surprise indicesGood (1954, 1956) suggested a family of alternatives,including in particular the idea of looking at the differencebetween the (Shannon) information in observationi
(− log (pi)) and the expected information(
−∑
pj log (pj))
giving
gi =(
∑
pj log (pj))
− log (pi) .
(This compares the observed value of the transformedrandom variablelog (P ) to its expectation)
Significance testing with no alternative hypothesis: a measure of surprise – p. 23

Surprise indicesA third natural possibility would be to look at the ‘tail area’probability (orp-value) for the random variableP :
ti =∑
pj≤pi
pj,
(We will argue that there is a serious problem with the use ofti)
Significance testing with no alternative hypothesis: a measure of surprise – p. 24

Surprise indicesA third natural possibility would be to look at the ‘tail area’probability (orp-value) for the random variableP :
ti =∑
pj≤pi
pj,
(We will argue that there is a serious problem with the use ofti)
Bayarri and Berger (1999, 2000) proposed modifications top-values to give measures of surprise. They start with avector of parametersθ and a test statisticT . Papers (and thediscussions) highly recommended
Significance testing with no alternative hypothesis: a measure of surprise – p. 24

Problem with the titi is not a continuous function of thep’s. If, for example, there arejust two possibilities with
p1 = p
p2 = 1 − p
thent1 = p for 0 ≤ p < 0.5 andt1 = 1 for 0.5 ≤ p ≤ 1.
Significance testing with no alternative hypothesis: a measure of surprise – p. 25

Problem with the titi is not a continuous function of thep’s. If, for example, there arejust two possibilities with
p1 = p
p2 = 1 − p
thent1 = p for 0 ≤ p < 0.5 andt1 = 1 for 0.5 ≤ p ≤ 1.
Suppose all then alternatives have approximately the sameprobability(1/n), but all are slightly different, then we feel thatthis is very close to the situation of equiprobability. Even if wedraw the least probable colour, we are not surprised
How to devise a continuous version ofti?
Significance testing with no alternative hypothesis: a measure of surprise – p. 25
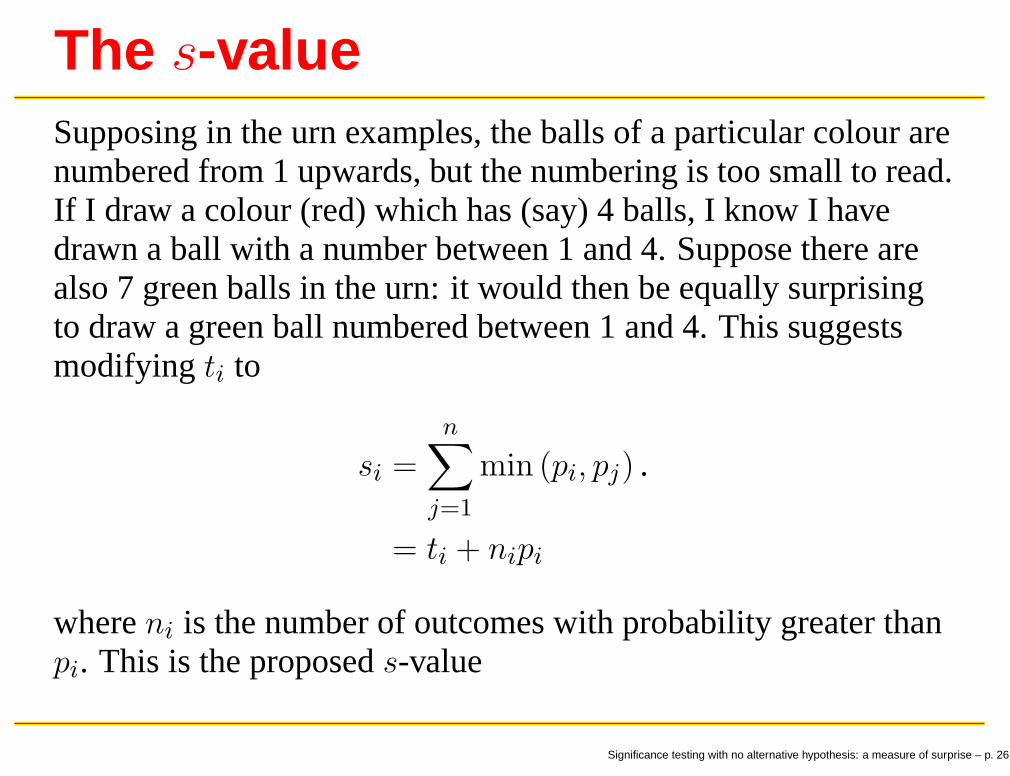
The s-valueSupposing in the urn examples, the balls of a particular colour arenumbered from 1 upwards, but the numbering is too small to read.If I draw a colour (red) which has (say) 4 balls, I know I havedrawn a ball with a number between 1 and 4. Suppose there arealso 7 green balls in the urn: it would then be equally surprisingto draw a green ball numbered between 1 and 4. This suggestsmodifying ti to
si =n
∑
j=1
min (pi, pj) .
= ti + nipi
whereni is the number of outcomes with probability greater thanpi. This is the proposeds-value
Significance testing with no alternative hypothesis: a measure of surprise – p. 26

Binomial exampleObserve the numberX of successes in 10 trials (without knowingthe results of the individual trials). The only model isX ∼ Bin (10, 0.25). ObserveX = 5
109876543210
0.3
0.2
0.1
0.0
Successes
Pro
babi
lity
p-value components
109876543210
0.3
0.2
0.1
0.0
Successes
Pro
babi
lity
s-value components
Significance testing with no alternative hypothesis: a measure of surprise – p. 27

s-values and p-valuesA smallp-value shows that an event has occurred which hasboth a small probabilityand for which the alternativehypothesis offers a better explanation
Significance testing with no alternative hypothesis: a measure of surprise – p. 28

s-values and p-valuesA smallp-value shows that an event has occurred which hasboth a small probabilityand for which the alternativehypothesis offers a better explanation
A small s-value shows that an event has occurred which hasboth a small probabilityand a small relative probability
The two concepts are quite different
Significance testing with no alternative hypothesis: a measure of surprise – p. 28

Normal exampleObserveX ∼ N (0, 1). X is measured to a fixed accuracy.ObserveX = 2. Need theX values to be spaced uniformly on theaxis.
p areas s area
Significance testing with no alternative hypothesis: a measure of surprise – p. 29

Normal exampleThe table shows thep-values ands-values for different values of|x|.
p-values and s-values for N(0, 1)
|x| p-value (%) s-value (%)
0.0 100 1000.5 62 971.0 32 801.5 13 522.0 4.6 262.5 1.2 103.0 0.27 2.9
Significance testing with no alternative hypothesis: a measure of surprise – p. 30
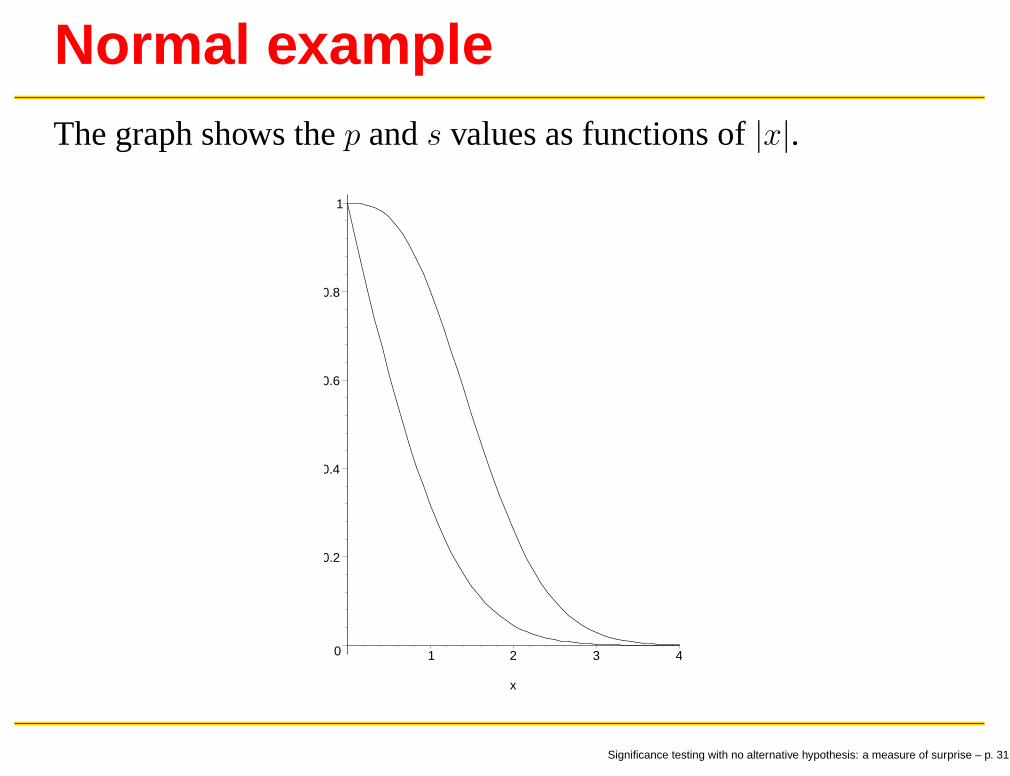
Normal exampleThe graph shows thep ands values as functions of|x|.
0
0.2
0.4
0.6
0.8
1
1 2 3 4
x
Significance testing with no alternative hypothesis: a measure of surprise – p. 31

Normal exampleSurprise values very much more conservative
Thes-value falls to 5% only when|x| = 2.8
The 1% and 0.1% values are 3.4 and 4.0 respectively
Significance testing with no alternative hypothesis: a measure of surprise – p. 32

Normal exampleSurprise values very much more conservative
Thes-value falls to 5% only when|x| = 2.8
The 1% and 0.1% values are 3.4 and 4.0 respectively
Thes-values much closer to the modifiedp-valuesB(p)suggested by Bayarri and Berger (1999) for this problem
B(p) is −ep ln(p) for p < 1/e. Bayarri and Berger interpretB(p) as an odds ratio, and in Bayarri and Berger (2000) theysuggest the calibrationα(p) = B(p)/ (1 + B(p)) ascomparable to a frequentist error probability
Forp-values of 0.1, 0.05, 0.01, and 0.001, we finds-values of0.439, 0.279, 0.085, and 0.0127, andα-values of0.385, 0.289, 0.111, and 0.0184
Significance testing with no alternative hypothesis: a measure of surprise – p. 32

n observations from Normal
p-values (%) withcorresponding s-values (%)
p-value (%)n 5 1 0.1
1 28 8.4 1.272 20 5.6 0.793 16 4.5 0.615 14 3.5 0.4610 11 2.6 0.3220 9 2.0 0.2450 7 1.6 0.18100 6 1.4 0.15
Significance testing with no alternative hypothesis: a measure of surprise – p. 33

Lindley’s paradoxA window is broken in a burglary. The police have only onesuspect (their prior probability is a half that he did it). Theyplan to examine his clothing for glass, and, if they find afragment, to make a measurement related to the refractiveindex. If the man is innocent, there is a 20% chance they willfind a fragment, and if they do, its measurement will be asample fromN (0, 100)
If the suspect is guilty, there is an 80% chance they will find afragment, and if they do, its measurement will be a samplefrom N (27, 1)
Assume that no more than one fragment will be found.Neglect the possibility that a guilty man might have a glassfragment on his clothing but not from the window he broke
Significance testing with no alternative hypothesis: a measure of surprise – p. 34

Lindley’s paradoxAbandon the case if no glass is found. Review it and proceedto prosecution if glass is found whose index supports thehypothesisH1 of guilt
In the event, glass is found with a measurement of 30 — i.e.3 standard deviations from the mean of the distribution underbothH0 andH1
What should we conclude?
Significance testing with no alternative hypothesis: a measure of surprise – p. 35
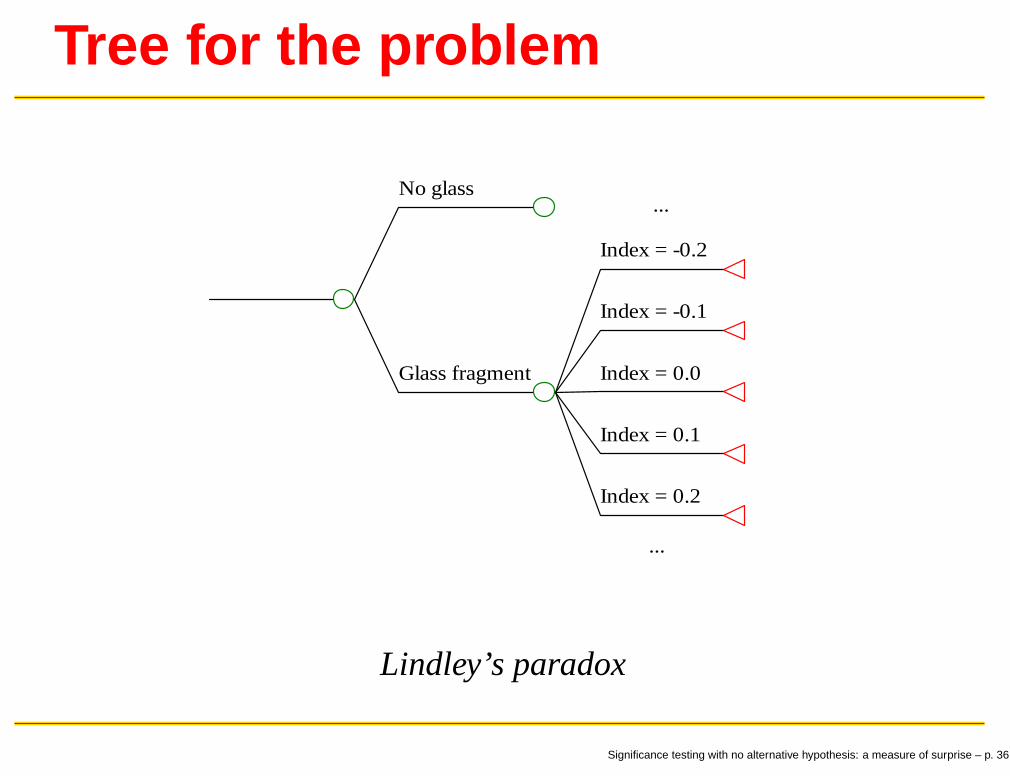
Tree for the problem
No glass
Index = -0.2
Index = -0.1
Index = 0.0
Index = 0.1
Index = 0.2
Glass fragment
...
...
Lindley’s paradox
Significance testing with no alternative hypothesis: a measure of surprise – p. 36

CalculationsUnderH0 the probability of the branch that has beenfollowed is:
(
1
5
) (
1
10√
2π
)
e−4.5dθ
UnderH1 it is:(
4
5
) (
1√2π
)
e−4.5dθ.
So the posterior probability ofH1 is 40/41 = 97.6%. Thepolice (with their prior probability of1/2) are satisfied theman is guilty, although a jury (with a different prior) mightnot be
Significance testing with no alternative hypothesis: a measure of surprise – p. 37

CalculationsBut underH1 an event has occurred (observing a Normaldeviate 3 standard deviations from the mean) that is veryunusual
Has something has happened here that might cause us todoubt our supermodel:
1
2H0 +
1
2H1
Significance testing with no alternative hypothesis: a measure of surprise – p. 38

CalculationsBut underH1 an event has occurred (observing a Normaldeviate 3 standard deviations from the mean) that is veryunusual
Has something has happened here that might cause us todoubt our supermodel:
1
2H0 +
1
2H1
When we calculate thes-value, we find it is 7.8%. There islittle reason to doubt the supermodel
Significance testing with no alternative hypothesis: a measure of surprise – p. 38

CalculationsSuppose the distributionN (27, 1) was changed toN (36, 1)and the observation was 40 (4 standard deviations from themean under both hypotheses)
The posterior probability of guilt is unchanged, but thes-value drops to 0.4%
Significance testing with no alternative hypothesis: a measure of surprise – p. 39

CalculationsSuppose the distributionN (27, 1) was changed toN (36, 1)and the observation was 40 (4 standard deviations from themean under both hypotheses)
The posterior probability of guilt is unchanged, but thes-value drops to 0.4%
Lindley suggests that where “the data are unusual on bothhypotheses” we should check “whether some hithertounexpected hypothesis obtains.”
Significance testing with no alternative hypothesis: a measure of surprise – p. 39

ConclusionsTo test a hypothesis without any alternative one must finessetwo difficulties:
the result obtained will depend on the stopping rule;outcomes which seem very surprising because they are‘distinguished’ will not necessarily be regarded assignificant
Significance testing with no alternative hypothesis: a measure of surprise – p. 40

ConclusionsTo test a hypothesis without any alternative one must finessetwo difficulties:
the result obtained will depend on the stopping rule;outcomes which seem very surprising because they are‘distinguished’ will not necessarily be regarded assignificant
These problems are standard in frequentist statistics: neitherseems insuperable
Significance testing with no alternative hypothesis: a measure of surprise – p. 40

ConclusionsThe most obviousp-value to use is not continuous in theprobabilities
a modification to thep-value, thes-value, is continuous
It is much more conservative, but we would expect to pay asubstantial price for not specifying any alternative hypothesis
Significance testing with no alternative hypothesis: a measure of surprise – p. 41