Embed Size (px)
Citation preview
OVERSIZING OF HVAC SYSTEMSIGNATURES AND PENALTIES
Authors:Djunaedy, Ery
Van Den Wymelenberg, KevinAcker, Brad
Thimmana, Harshana
Date:Available Online: October, 2010
A version of this document is published in:Energy and Buildings, October 2010, <http://dx.doi.org/10.1016/j.enbuild.2010.10.011>
Please cite this paper as follows: Djunaedy, E., Van Den Wymelenberg, K., Acker, B., Thimmana, H. (n.d.). Oversizing of HVAC System: Signatures and Penalties. Energy and Buildings, In Press, Accepted Manuscript. doi:10.1016/j.enbuild.2010.10.011 <http://dx.doi.org/10.1016/j.enbuild.2010.10.011>
Oversizing of HVAC System: Signatures and PenaltiesUniversity of Idaho, Integrated Design Lab-Boise Page 1 of 29
ABSTRACT
Design engineers commonly oversize HVAC systems with the justification of needing a
reasonable safety factor to manage periods more extreme than the specific design conditions.
Unfortunately, the safety factor easily becomes excessive. The design engineers minimize their
professional risk, and by doing so they are actually asking the building owner to pay an
immediate penalty due to increased first cost of equipment and an ongoing penalty due to
maintenance and energy use implications. The penalties associated with excessive safety factors
are often not communicated to the client. This paper presents the results of a study of
“rightsizing” rooftop HVAC systems. The study included intensive interviews with HVAC
designers investigating the design process and extensive field measurement of rooftop units
(RTUs) during peak cooling conditions. This paper focuses on defining the signature of
oversizing, i.e. how to use the physical measurements to quantify the degree of oversizing of an
RTU and how to estimate the penalty of oversizing in terms of energy consumption and peak
electricity demand. Utility companies incentive programs have not yet identified mechanisms for
incentivizing rightsizing of HVAC system. The methodology described in this paper can be used
as the basis for such programs.
KEYWORDS
sizing, oversizing, rightsizing, RTU
(*) Corresponding author: [email protected]
Oversizing of HVAC System: Signatures and PenaltiesUniversity of Idaho, Integrated Design Lab-Boise Page 2 of 29
1. INTRODUCTION
Rooftop units (RTUs) are the most commonly used heating ventilating and air-conditioning
(HVAC) system types for small commercial buildings. In Northern California [1], RTUs
represent more than 2.3 million tons of air conditioning capacity, covering around 70% of the
commercial cooling. Small commercial office and retail buildings account for 50% of
commercial building floor area and HVAC system energy use [2]. Over 75% of the building
stock is less than 5,000 ft2, and almost 90% is less than 10,000 ft2. Approximately 80% of the
buildings were constructed before 1985. Annual air conditioning energy use for the buildings in
the hotter inland areas is 3.64 kWh/ft2. RTUs consume 4.3 billion kWh per year, which translates
into approximately $400 million/year in energy expenses.
In the Pacific Northwest, 34% of the commercial buildings are cooled with RTUs comprising an
estimated 1.3 million tons [3,4]. Small commercial office and retail buildings account for
approximately 33% of commercial building floor area and about 36% of HVAC system energy
use. Around 11% of the building stock is less than 5,000 ft2 , and almost 36% is less than 20,000
ft2. Around 67% of the buildings were constructed before 1987. 45% of the buildings with RTUs
has the RTU for more than 10 years.
These studies shows the widespread use of the RTU, and at the same time suggest a substantial
potential for RTU replacements in California and the Pacific Northwest due to the large number
of small commercial buildings that were constructed over 25 years ago. It is likely that most
other areas of the United States have similar statistics.
There are at least six studies carried out in the northwest region since 1998. All studies found
various problems with RTU installation, maintenance, and operations, and all of them
recommend action programs to mitigate these problems. Based on the cycling rates identified
during the measurements, the previous studies concluded that many RTUs are oversized [2,5].
However, no previous study addressed the issue from the engineering design point of view.
Oversizing of HVAC System: Signatures and PenaltiesUniversity of Idaho, Integrated Design Lab-Boise Page 3 of 29
Furthermore, very little guidance was offered to individuals planning RTU replacements in order
for them to determine rightsized replacements. Our research aimed to examine oversizing from
the design perspective and to provide accurate and repeatable field monitoring protocols for
individuals planning rightsized RTU replacements. This paper outlines the measurement protocol
to quantify the oversizing and the associated penalties.
2. SIZING PROCEDURE
2.1. Typical sizing procedure
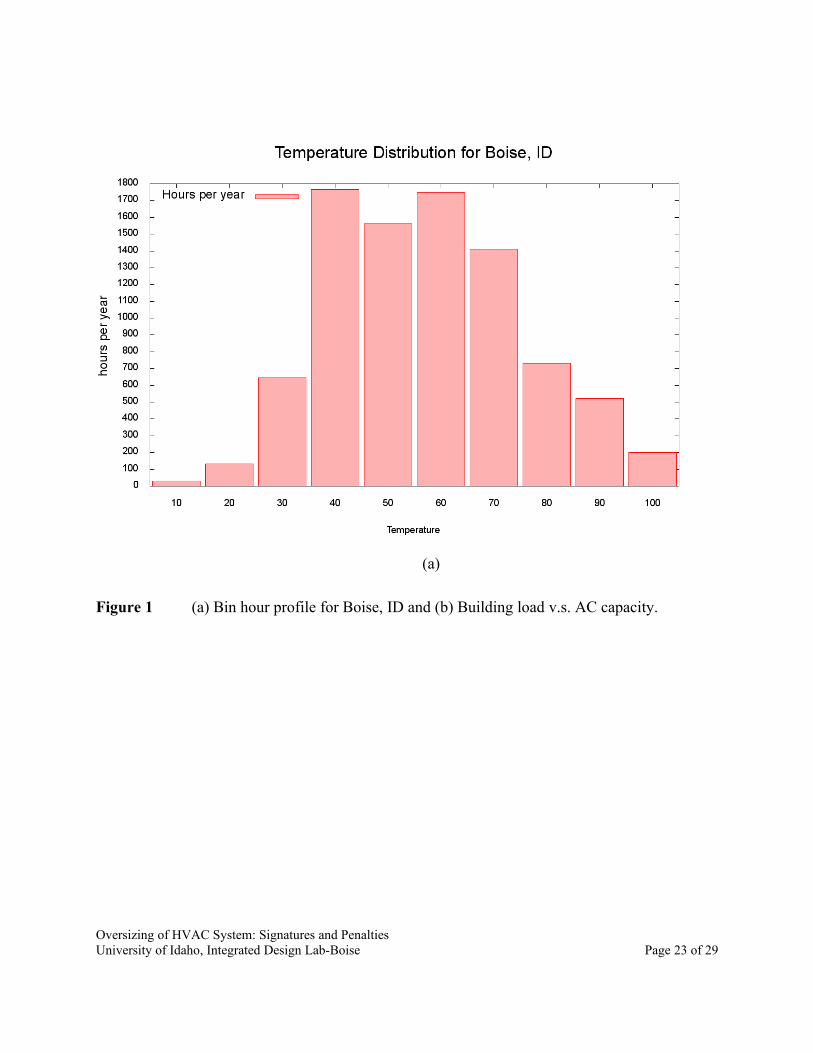
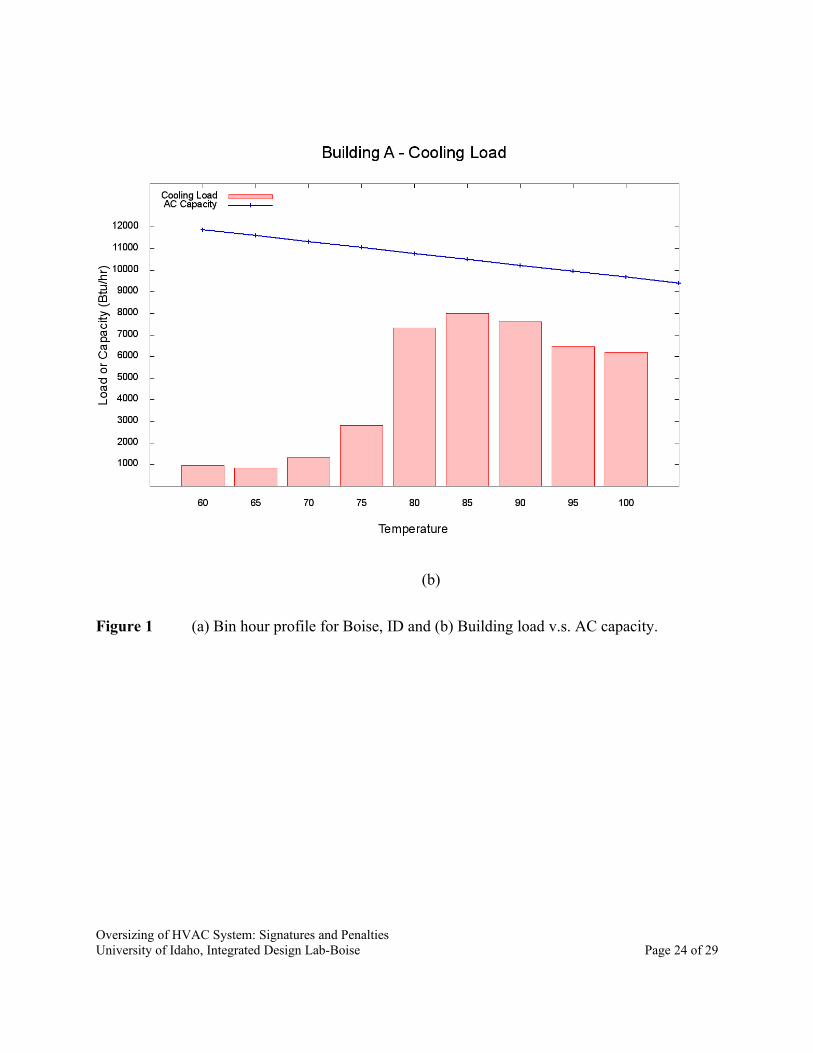
Figure 1.a shows the temperature distribution for Boise, ID, based on the typical year data. The
air conditioning (AC) unit is sized based on design day conditions, which is 95 °F for Boise, ID.
There are only about 100 hours in a typical year that exceed this design condition in Boise.
Since small buildings are typically skin dominated, the cooling load is very sensitive to
changes in the outside air temperature. The lower the outside air temperature, the lower the
cooling load. Figure 1.b shows how the cooling load of a building changes as the outside air
temperature changes. It also shows the air-conditioning capacity (the line) which indicates that
the capacity actually increases when the outside air temperature is cooler. The gap between the
peak cooling load and the capacity shows the degree of oversizing of the air-conditioning unit
Figure 1 (a) Bin hour profile for Boise, ID and (b) Building load v.s. AC capacity.
Since the air conditioning is sized based on the 95 °F design day (for Boise, ID), it will operate
most of the time to handle a cooling load (much) lower than its capacity. This is referred to as
part-load operation. When the RTU has excessive safety factors – i.e. oversized – the part-load
condition is even worse. This is generally not a good situation to have since the air-conditioning
units do not operate as efficiently at part-load as they do at full-capacity.
2.2. Sizing tools
The problem with sizing HVAC systems for small buildings have been studied in a previous
Oversizing of HVAC System: Signatures and PenaltiesUniversity of Idaho, Integrated Design Lab-Boise Page 4 of 29
research [6,7]. At least two conclusions from that study are relevant. The first conclusion is the
average time spent designing HVAC systems for small building projects. The average time for
engineers to design HVAC systems for small building projects is approximately 40 hours.
Although this seems like a short period of time, the HVAC system design represents a large
proportion of all hours spent on the design of small commercial buildings. Furthermore, HVAC
system design involves a very broad scope of work ranging from sizing calculations to air
distribution calculations to overall system selection. This small amount of time available to
design limit the range of tools that can be used for the design process. Obviously, more
sophisticated tools require more time than is allocated to the engineer.
The second conclusion is that approximately half (51%) of the respondents use manufacturers'
software for sizing calculation. The next biggest proportion (17%) rely only on previous
experience and rules-of-thumb. The widespread use of simple sizing tools - “previous
experience” and rules-of-thumb - could be an indication of why oversizing is so prevalent in
small commercial buildings. Note that we are not suggesting there is an inherent problem with
these methods, rather we are suggesting that designers must understand the advantages and
limitations of each and employ each method appropriately.
Table 1 shows some examples of the rule of thumb. The rules of thumb are usually presented as
a range of numbers and do not by themselves cause a problem if they are used as intended. That
is, as a starting point and a secondary guide to verify other calculations.
TABLE 1. Rules-of-thumb Examples [8]
3. OVERSIZING IN THE LITERATURE
3.1. Behaviour of oversized RTUs
Prior research [2] shows that over 60% of rooftop units surveyed had a cycling rate of at least 3
cycles/hour. The same study further concluded that more than 40% of the units studied were
more than 25% oversized and about 10% are considerably greater than 50% oversized. The study
Oversizing of HVAC System: Signatures and PenaltiesUniversity of Idaho, Integrated Design Lab-Boise Page 5 of 29
only labeled RTUs as 'oversized' if they were at least 25% oversized because many HVAC
engineers consider oversizing by 25% as a “safe and acceptable practice” for oversizing. In the
same study, the quantification of oversizing was determined by monitoring the RTU compressor.
The oversized RTU shows a pattern of continuous cycling while the properly sized RTU shows
no cycling during the peak-day operation.
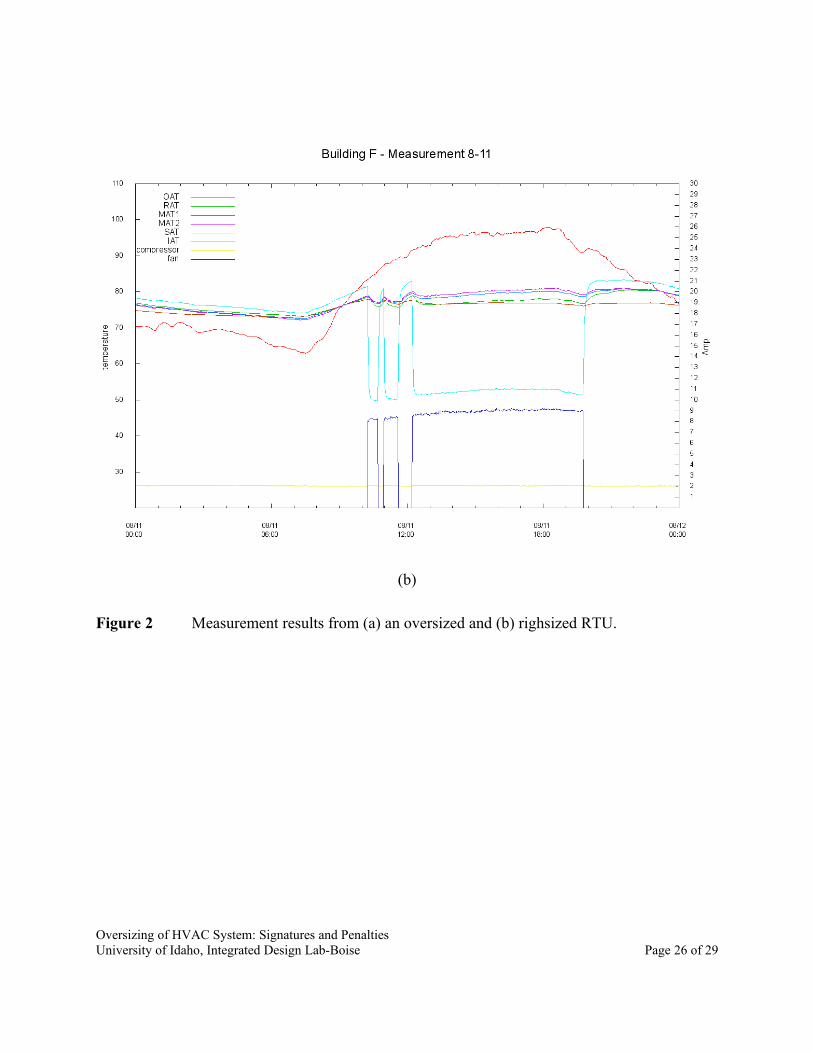
The figures below show typical RTU behaviours. Oversizing can be identified by the cycling of
the compressor on a peak cooling day – a day where the peak temperature reach the design day
(Figure 2.a). A constantly cycling compressor on a peak cooling day (Building A – Figure 2.a)
indicates an oversized unit. A constantly operating compressor (Building G – Figure 2.b)
indicates a rightsized RTU.
Figure 2 Measurement results from (a) an oversized and (b) righsized RTU.
The measurement to identify the cycling profile is straight forward. This paper explains how to
estimate the degree of oversizing of the unit, and more importantly how to quantify the penalty
of oversizing.
3.2. Penalties associated to oversizing
A literature review [8] found only a few studies that reported the benefits of rightsizing (or the
penalty of oversizing). This is because:
It is not possible to correct equipment sizing problems without
replacing the unit. That is extremely expensive and, therefore,
never done.
Neme et. al. [8] quoted another study [9] who estimated an energy savings of 0.2% for every 1%
reduction in oversizing. That means an energy savings of 10% for correcting an average
oversizing of 50%. The savings in terms of peak demand is also estimated as “moderate”, and no
number is associated to the qualitative description.
Oversizing of HVAC System: Signatures and PenaltiesUniversity of Idaho, Integrated Design Lab-Boise Page 6 of 29
It should be noted that McLain and Goldberg [9] focused on the residential sector. The reported
energy savings assumed an average oversizing of 50% or more, which means an average of
around 1 ton of oversizing for the average home. The average oversizing may be different for
commercial buildings, and the average oversizing in tons will typically be more than 1 ton per
unit. Furthermore, the operation mode is rarely “continuously ON” for residential sector (only in
about 20% of homes), while it is more common in commercial sector. Therefore the penalty for
oversizing should be significantly higher for the commercial sector.
Felts and Bailey [2] reports that over 60% of RTUs surveyed have cycling rates of 3 cycles/hour
or more. Jacobs [10], referring to Felts and Bailey [2] report, estimated that the potential energy
savings from mitigating this problem is around 10%. However the study [10] did not elaborate
on how to calculate the amount of savings.
Felts and Bailey [2] also reported that 40% of RTUs are more than 25% oversized. This
represents about 900,000 ton or around 180,000 units in Northern California. The study also
found that the power draw of an average RTU is about 1.5 kW/ton. Their study estimated a 2.5
kW reduction in the peak demand by replacing an oversized RTU with a more efficient and
properly sized RTU. The reduction in the peak demand (assuming 40% of the RTUs in Northern
California were replaced) would be 450 MW of the 1,350 MW peak (roughly 33% savings).
Assuming 1,000 hours of operation for the whole cooling season, the savings would be 450
million kWh (roughly 33% savings). The 33% savings also represents the penalty due to
oversizing.
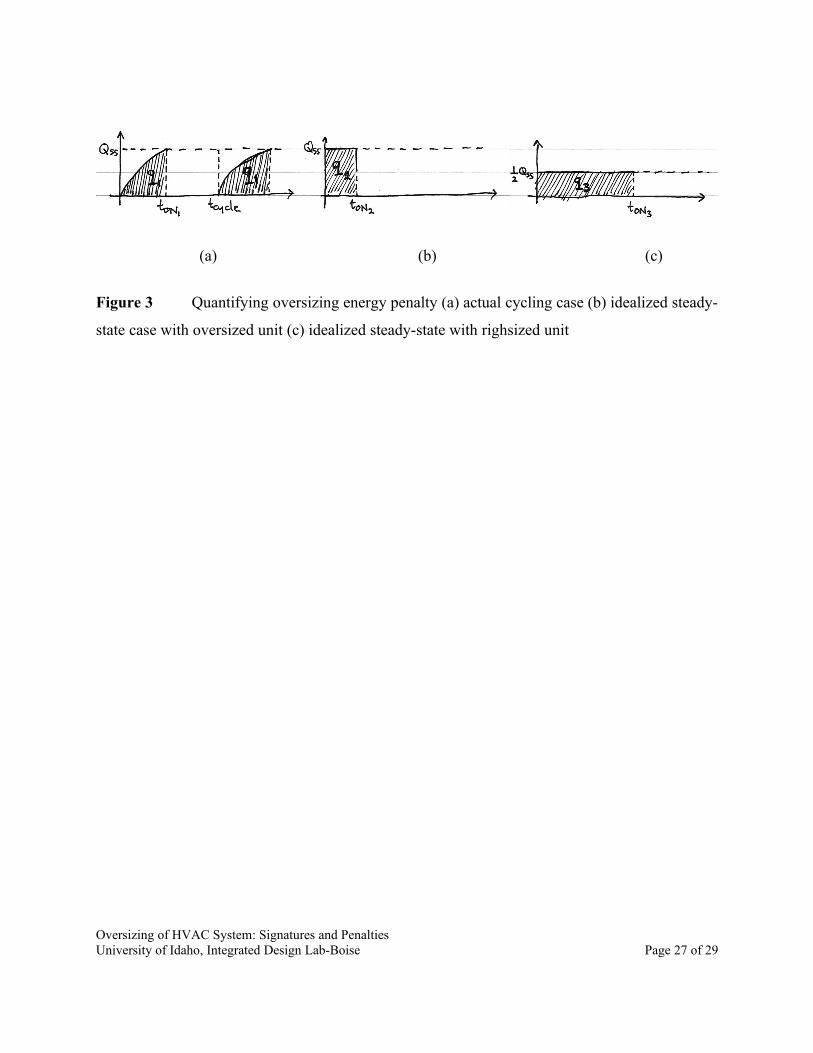
Another study [11] estimated the penalty for oversizing to be roughly 11% for Nmax of 2.5
cycles/hour, the average Nmax found in their study. However, this estimated energy penalty is
calculated based on the same (oversized) unit under steady state energy use condition (without
any cycling). Figure 3.a. illustrates the oversized scenario, where the Qss is the steady state
capacity of the AC unit that cycles with tON1 and tcycle. The area under the curve – q1 – represents
the energy output of the system. Figure 3.b. illustrates that (hypothetical) condition when the air-
Oversizing of HVAC System: Signatures and PenaltiesUniversity of Idaho, Integrated Design Lab-Boise Page 7 of 29
conditioning unit works continuously over the time period of tON2, so that q2 equals q1 (which
means both scenario extracted the same amount of heat from the space). The 11% savings is
from the difference in the input energy between the two scenario.
In our opinion, the comparison should be made against the rightsized unit which would actually
be necessary to eliminate cycling. Figure 3.c. illustrates the rightsized unit (with only 50% of the
original capacity, assuming 100% oversizing). The rightsized unit would run for tON3 which is the
same as the tcycle in the first scenario, so that q3 equals q1.
The savings in input energy will certainly be at least the same as 11% estimated by Henderson et.
al. [11], if not better. However, the illustrating the savings as Figure 3.c. has the advantage of
highlighting the peak electricity demand reduction (of at least 50% in this illustration). This
illustration is missing from Figure 3.b.
Figure 3 Quantifying oversizing energy penalty (a) actual cycling case (b) idealized steady-
state case with oversized unit (c) idealized steady-state with righsized unit.
3.3. Examples from previous research
Previous studies show several ways to estimate the part-load degradation (in terms of efficiency
reduction) of RTUs from the measurement results.
Example 1 is by using the compressor power [12]. The measured compressor power is used to
estimate the system efficiency by dividing the compressor input power and the capacity. The
estimated capacity (in kW/ton) is then compared with the nominal efficiency (in terms of EER).
The ratio of the estimated system efficiency and the nominal efficiency is the part load factor
(PLF) which shows the degradation of the RTU performance. The term 'capacity' used in the
calculation should be the actual capacity at the time of measurement (i.e. at the actual air
temperatures at the condenser and evaporator). However, the study [12] used the nominal
Oversizing of HVAC System: Signatures and PenaltiesUniversity of Idaho, Integrated Design Lab-Boise Page 8 of 29
capacity for two reasons; (1) their monitored data did not include air flow measurement and (2)
their monitoring period was not confined to the 'design day' conditions or near-design day
condition.
Example 2 is using the measured air temperatures (outside air and at evaporator) [12]. The study
uses this method not to estimate the efficiency of the RTU but to generate a benchmark of ideal
operation. The method uses the linear regression equations supplied by the Air Conditioning
Contractors Association (ACCA) Manual J to determine the total capacity, sensible capacity and
the compressor power. The constants in the regression equations are determined using
manufacturers' data. Using this method one can calculate the efficiency of a RTU at any
combination of air temperatures (outdoor and at evaporator). Comparing this efficiency with the
nominal efficiency, one can calculate the degradation.
Example 3 is using the measured refrigerant condition [13]. The study found that the
measurement of airflow is not feasible because (1) it is difficult to do with acceptable accuracy,
and (2) there is insufficient space inside the RTU (around the evaporator) to do a proper airflow
measurement. The study concluded that measuring the refrigerant is the more accurate and
feasible option.
4. THE PROPOSED METHOD
4.1. Signatures of Oversizing
Our study did not use any of the above methods to quantify the degree of oversizing. The first
method (Example 1) uses the nominal capacity – instead of the capacity at the time of
measurement – to calculate the efficiency. The second method (Example 2) will provide the ideal
operation, but will not help in estimating the real situation (the second method was not initially
used for part-load degradation in the first place). The third method (Example 3) is simply beyond
the scope of this project.
The proposed method uses the equations described in a previous study [11]. The study uses the
Oversizing of HVAC System: Signatures and PenaltiesUniversity of Idaho, Integrated Design Lab-Boise Page 9 of 29
equation to quantify the performance degradation of small air conditioning units. Figure 4 shows
the indoor air temperature and the air-conditioning signal. The indoor air temperature is set to a
set-point temperature (Tspt), and the actual indoor air temperature swings within a range (∆Tspt)
around the Tspt. The AC unit is ON when the indoor temperature reaches the peak of the indoor
temperature range, and continues to operate until the indoor air temperature reaches the
minimum of the temperature range.
Figure 4 Indoor air temperature and AC Signal.
From the above description of the system behaviour, the following terms can be defined using
the following equations (1) the cycling rate (N), (2) the run-time fraction (RTF), (3) the cycling
time.
N=1
t cycle (1)
RTF=tON
t cycle (2)
t cycle =tON +t OFF (3)
The cycling rate and RTF from the measurement data can be plot into a graph (the dots in Figure
5). The correlation between N and RTF is describe as:
N= 4Nmax RTF 1−RTF (4)
The maximum cycling rate (Nmax) is a theoretical maximum of cycling rate that happens at run-
Oversizing of HVAC System: Signatures and PenaltiesUniversity of Idaho, Integrated Design Lab-Boise Page 10 of 29
time fraction of 50%. By performing curve-fit of the data to Equation 4, the N-RTF curve can be
calculated, and Nmax is the peak value of the curve.
The combination of high Nmax and low RTF is the signature of oversizing, i.e. under a peak day
operation oversized RTU will cycle frequently and for each cycle it will operate for a short
period of time. On the other hand, rightsized RTUs will have low Nmax and high RTF, i.e. under a
peak day operation rightsized RTU will ideally operate all the time, or at least will run most of
the time with less cycling.
Figure 5 Calculation of Nmax from measurement data.
4.2. Quantification of Oversizing
The degree of oversizing can be quantified by using two parameters, the part-load ratio and the
part-load factor. The Part load ratio (PLR) is the ratio of the (current) building load to the
capacity of the RTU, and the part-load factor (PLF) is the ratio of the part-load coefficient of
performance (COP) to the nominal COP of the RTU. Based on the measurement result, the PLR
and PLF can be estimated using the Equation 5 and Equation 6. Note that both equations are
taken from previous research [11].
PLR=tON
t cycle
−τ
tcycle
1−e
−tONτ (5)
PLF= 1−τ
t cycle
1−e
−tONτ (6)
The time constant (τ) in above equations is a time that shows how fast a compressor reaches the
Oversizing of HVAC System: Signatures and PenaltiesUniversity of Idaho, Integrated Design Lab-Boise Page 11 of 29
steady state output when it starts from OFF. This is empirical data that can only be found from
previous studies. Henderson et. al. [11] used 80 seconds. Another study [14] used 60 seconds for
“typical AC” and 30 seconds for “good AC”.
4.3. Penalty calculations
The peak demand and energy penalties can be calculated from the measurement data by using
the following equations. Note that both equations are taken from previous research [11].
PeakDemandPenalty=E1 1−PLR (7)
EnergyPenalty=[tON
t ON−τ 1−e
−tONτ ]−1
(8)
5. DATA COLLECTION AND ANALYSIS
A total of nine RTUs in eight buildings were measured during peak summer conditions in July
and August 2009. The measurement protocol including logging the air temperatures at various
points of the air distribution system (at a minimum the outside air, return air, mixed air, supply
air, and indoor air temperatures). Additionally, the electric current drawn by the compressor and
the supply fan were also logged.
The following data is measured:
1. Outside air temperature
2. Compressor ON/OFF status
Oversizing of HVAC System: Signatures and PenaltiesUniversity of Idaho, Integrated Design Lab-Boise Page 12 of 29
3. Indoor air temperature, ideally near the thermostat
4. Optional: Fan ON/OFF status
The compressor status can be measured using a simple ON/OFF status sensor. However, the use
of a current transformer or a power meter is preferred because the same data can then be used for
other analyses. For estimating the degree of oversizing only the time of the ON/OFF status
change is important. The measurement shall be carried out in a peak cooling day where the peak
temperature is around the cooling design temperature.
The cycling status of the compressor needs to be extracted from the measurement data. For each
cycle, calculate how long it was ON and how long it was off before it was ON again for the next
cycle. This data needs to be tabulated along with the outside air temperature when the cycle
status is ON (see Table 2 for an example).
5.1. Calculation Example from Measurement Results Using Proposed Method
Table 2 shows a typical measurement results for one of the buildings measured in this study. The
compressor cycled 16 times during the measurement, and for each cycle the following data is
noted: when it started, for how long it ran, and what the outside air temperature was when it
started. Equations 1, 2, 3 are then used to calculate the cycling rate and the RTF.
The shaded rows in Table 2 are the cycles when the outside air temperature is above 90°F. The
maximum (measured) cycling rate and RTF is 2.4 cycles per hour and 0.24 respectively. This
means that the unit is cycling ON and OFF for 2.4 times an hour, and for every cycle it will only
stay ON for about a quarter of the time. This is a clear sign of oversizing.
The values of cycling rate and the RTF can then be plot into a graph (Figure 5). Equation 4 is
used to fit the (cycling rate and RTF) data to calculate the Nmax (the maximum cycling rate). Nmax
is represented as the peak of the curve in Figure 5. This compressor has Nmax of 2.66 cycles/hour.
A previous study [11] found that the average Nmax for that study is 2.5 cycles/hour.
Oversizing of HVAC System: Signatures and PenaltiesUniversity of Idaho, Integrated Design Lab-Boise Page 13 of 29
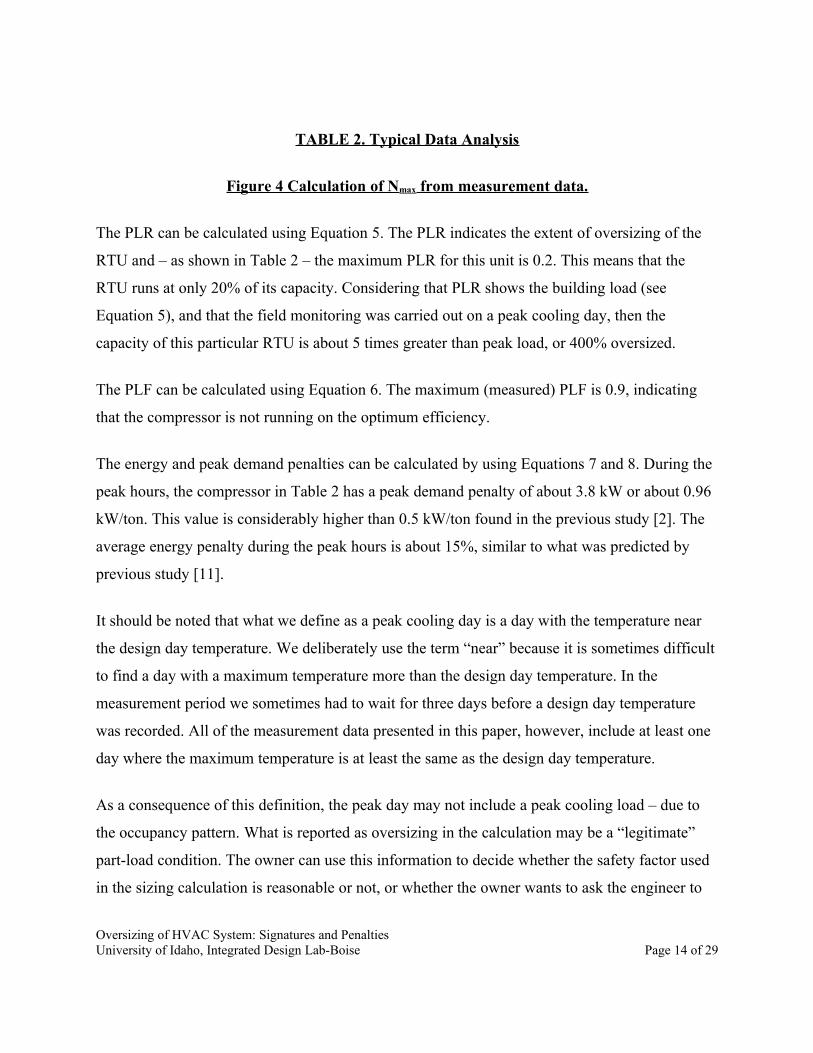
TABLE 2. Typical Data Analysis
Figure 4 Calculation of Nmax from measurement data.
The PLR can be calculated using Equation 5. The PLR indicates the extent of oversizing of the
RTU and – as shown in Table 2 – the maximum PLR for this unit is 0.2. This means that the
RTU runs at only 20% of its capacity. Considering that PLR shows the building load (see
Equation 5), and that the field monitoring was carried out on a peak cooling day, then the
capacity of this particular RTU is about 5 times greater than peak load, or 400% oversized.
The PLF can be calculated using Equation 6. The maximum (measured) PLF is 0.9, indicating
that the compressor is not running on the optimum efficiency.
The energy and peak demand penalties can be calculated by using Equations 7 and 8. During the
peak hours, the compressor in Table 2 has a peak demand penalty of about 3.8 kW or about 0.96
kW/ton. This value is considerably higher than 0.5 kW/ton found in the previous study [2]. The
average energy penalty during the peak hours is about 15%, similar to what was predicted by
previous study [11].
It should be noted that what we define as a peak cooling day is a day with the temperature near
the design day temperature. We deliberately use the term “near” because it is sometimes difficult
to find a day with a maximum temperature more than the design day temperature. In the
measurement period we sometimes had to wait for three days before a design day temperature
was recorded. All of the measurement data presented in this paper, however, include at least one
day where the maximum temperature is at least the same as the design day temperature.
As a consequence of this definition, the peak day may not include a peak cooling load – due to
the occupancy pattern. What is reported as oversizing in the calculation may be a “legitimate”
part-load condition. The owner can use this information to decide whether the safety factor used
in the sizing calculation is reasonable or not, or whether the owner wants to ask the engineer to
Oversizing of HVAC System: Signatures and PenaltiesUniversity of Idaho, Integrated Design Lab-Boise Page 14 of 29
revise the assumptions for the sizing calculation.
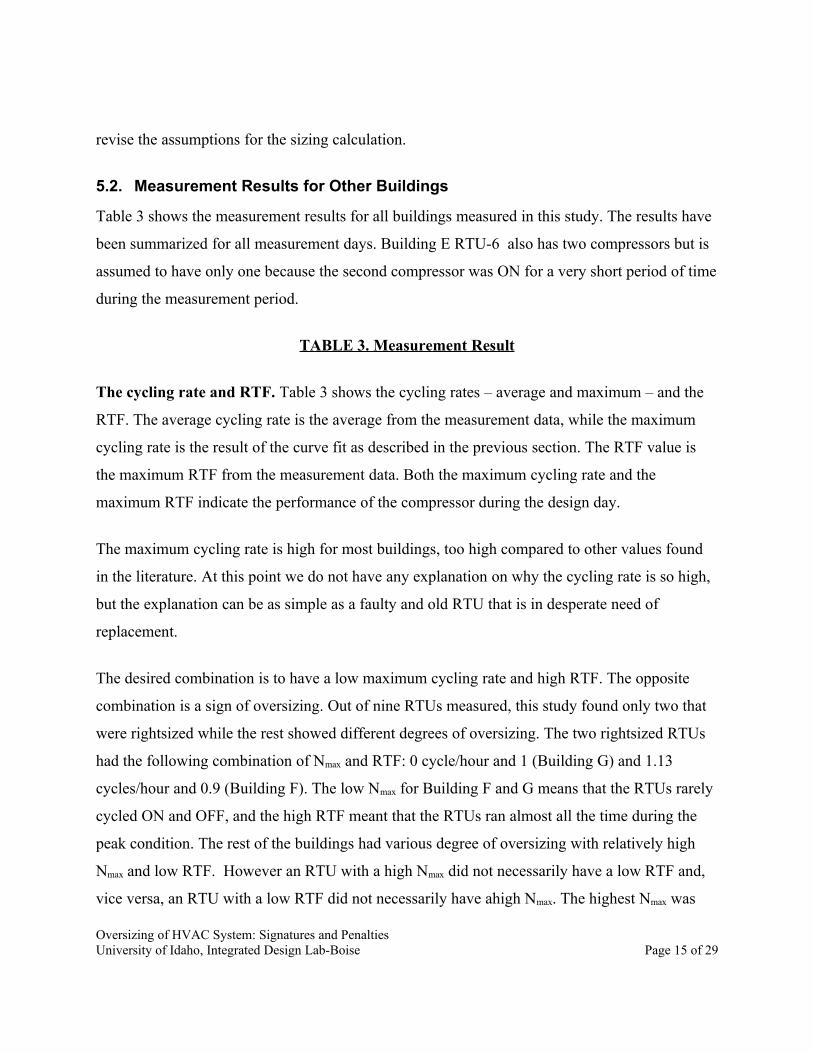
5.2. Measurement Results for Other Buildings
Table 3 shows the measurement results for all buildings measured in this study. The results have
been summarized for all measurement days. Building E RTU-6 also has two compressors but is
assumed to have only one because the second compressor was ON for a very short period of time
during the measurement period.
TABLE 3. Measurement Result
The cycling rate and RTF. Table 3 shows the cycling rates – average and maximum – and the
RTF. The average cycling rate is the average from the measurement data, while the maximum
cycling rate is the result of the curve fit as described in the previous section. The RTF value is
the maximum RTF from the measurement data. Both the maximum cycling rate and the
maximum RTF indicate the performance of the compressor during the design day.
The maximum cycling rate is high for most buildings, too high compared to other values found
in the literature. At this point we do not have any explanation on why the cycling rate is so high,
but the explanation can be as simple as a faulty and old RTU that is in desperate need of
replacement.
The desired combination is to have a low maximum cycling rate and high RTF. The opposite
combination is a sign of oversizing. Out of nine RTUs measured, this study found only two that
were rightsized while the rest showed different degrees of oversizing. The two rightsized RTUs
had the following combination of Nmax and RTF: 0 cycle/hour and 1 (Building G) and 1.13
cycles/hour and 0.9 (Building F). The low Nmax for Building F and G means that the RTUs rarely
cycled ON and OFF, and the high RTF meant that the RTUs ran almost all the time during the
peak condition. The rest of the buildings had various degree of oversizing with relatively high
Nmax and low RTF. However an RTU with a high Nmax did not necessarily have a low RTF and,
vice versa, an RTU with a low RTF did not necessarily have ahigh Nmax. The highest Nmax was
Oversizing of HVAC System: Signatures and PenaltiesUniversity of Idaho, Integrated Design Lab-Boise Page 15 of 29
8.78 cycle/hour, with an RTF of 0.31. The lowest RTF was 0.15, with an Nmax of 2.66 cycle/hour.
Part-load ratio. Table 3 also shows the PLR and the EER degradation. The RTUs with a
signature of rightsizing (low cycling rate and high RTF) tend to have a high PLR, which means
the compressors in these RTUs run at or almost at full capacity (see Buildings F, G and also B).
This also means that these RTUs have very low EER degradation. On the other hand, RTUs with
high cycling rates and low RTFs have low PLRs and high EER degradation.
This study also found that the signature of oversizing (the Nmax and the RTF) accurately indicated
oversizing. The rightsized RTUs (with the right combination of Nmax and RTF) had a Part-Load
Ratio (PLR) of 1, which meant that the RTUs ran at full capacity. The other RTUs with various
degrees of oversizing ran at part of the capacity. The RTU with the highest Nmax ran at a PLR of
only 0.21, which meant it used only about 20% of its capacity to meet the cooling load on a
design day condition. The RTU with the lowest RTF ran at a PLR of 0.5, which meant that the
RTU met the peak load with only half of its capacity.
Energy and Peak Demand Penalty. A similar pattern was observed: the rightsized RTUs had
almost no penalty at all, both in terms of energy and peak demand. On the other hand, the RTUs
with the signature of oversizing described above showed both an energy penalty and a peak
demand penalty. The energy penalty was up to 50%, although the range of 15%-25% was more
typical depending on the degree of oversizing. The peak demand penalty was as high as 0.92
kW/ton, meaning the peak demand savings from a 5-ton RTU would be 4.6 kW.
It should be noted that the methodology outlined in this paper does not offer a solution to the
oversizing problem. The objective of the methodology is to quantify the degree of oversizing. As
mentioned earlier [8], the oversizing problem cannot be solved without replacing the unit. No
modifications are suggested until the RTU is replaced. However, the owner can use the
information from this calculation to adjust the assumptions for the sizing calculation in case the
building is due for renovation or system replacement.
Oversizing of HVAC System: Signatures and PenaltiesUniversity of Idaho, Integrated Design Lab-Boise Page 16 of 29
6. CONCLUDING REMARKS: CONCLUSION, LIMITATIONS AND NEXT STEPS
Unfortunately, design engineers currently do not have any incentive to rightsize RTUs, while at
the same time they will avoid a great deal of potential risk by oversizing HVAC systems.
Previous studies have made recommendations on how to increase the performance of an installed
RTU. However, there have been no clear recommendation about how to address the issue of
oversizing during the design stage for new construction projects. This paper proposed an
accurate and repeatable method for rightsizing RTU replacements or during rezoning efforts.
There is sufficient data available in this report to support the development of utility-funded pilot
incentive programs for RTU replacements. Considering the age of typical office buildings in the
Pacific Northwest, where two-third of small commercial space are built prior to 1987 [3], the
market potential for RTU replacement is significant. Substantial market potential exists in other
geographic regions as well.
This study recommends using the signature of oversizing (the cycling period and the RTF) as the
basis for rightsizing when replacing RTUs or rezoning existing RTUs, and the methods outlined
could be incorporated in utility incentive programs for determining the savings potential and
appropriate incentive figures. These two parameters can accurately estimate the penalties
associated with oversizing. Given the methods outlined in this paper, it is reasonable that
professional maintenance engineer or HVAC contractor to conduct the measurement and process
the measurement results to facilitate rightsizing of new equipment and to support utility incentive
program requirements. We caution anyone engaging in a RTU replacement to avoid simply
replacing the unit with a new unit of the same capacity.
The methodology outlined in this paper does not attempt to replace the sizing calculation
method, nor doe it attempt to eliminate a reasonable safety factor. A proper sizing calculation
needs to be performed by a professional engineer to size the system with a reasonable safety
factor. This methodology can be used to help the engineer fine-tune the assumptions for the
sizing calculation. Furthermore, the effect of the thermostat – which targets a cycling rate or
Oversizing of HVAC System: Signatures and PenaltiesUniversity of Idaho, Integrated Design Lab-Boise Page 17 of 29
even limits the duration of an on cycle – is neglected.
There are still a number of necessary steps to develop this methodology to a utility incentive
program. There was no economic benefits quantification done in this study. A life cycle cost
analysis should be carried out to quantify the economic benefits. Furthermore, the sample size of
the study was small. A bigger number of samples is needed to rigorously test this methodology.
This paper does not talk about the risks of discomfort associated to rightsizing (as opposed to the
guaranteed comfort associated to oversizing). This topic, along with other topics such as the use
of simulation program as a sizing tool, is discussed in another paper.
7. ACKNOWLEDGEMENTS
This study was funded by Idaho Power.
8. NOMENCLATURE
N = Cycling rate (cycle per hour)
RTF= Runtime fraction
tcycle = cycling time (hour)
tON = duration when the compressor is ON (hour)
tOFF = duration when the compressor is OFF (hour)
τ = time constant of the compressor (hour)
9. REFERENCES
[1] PGE, Commercial Building Survey Report, California, USA, Pacific Gas and Electric
Company, 1997.
[2] D.R. Felts, P. Bailey, The State of Affairs - Packaged Cooling Equipment in California, in:
2000.
[3] NEEA, Assessment of the Commercial Building Stock in the Pacific Northwest, Portland,
OR, USA, Northwest Energy Efficiency Alliance, 2004.
Oversizing of HVAC System: Signatures and PenaltiesUniversity of Idaho, Integrated Design Lab-Boise Page 18 of 29
[4] NEEA, Small Commercial HVAC Pilot Program, Portland, OR, USA, Northwest Energy
Efficiency Alliance, 2004.
[5] A. Cowan, Review of Recent Commercial Roof Top Unit Field Studies in the Pacific
Northwest and California, White Salmon, WA, USA, New Buildings Institute, 2004.
[6] P. Jacobs, H. Henderson, State-of-the-Art Review Whole Building, Building Envelope,
and HVAC Component and System Simulation and Design Tools, Arlington, VA, USA,
Air-Conditioning and Refrigeration Technology Institute, 2002.
[7] P. Jacobs, T. Conlon, State-of-the-Art Review Whole Building, Building Envelope, and
HVAC Component and System Simulation and Design Tools - Part 1: Whole-Building and
Building Envelope Simulation Design Tools, (2002).
[8] C. Neme, J. Proctor, S. Nadel, Energy savings potential from addressing residential air
conditioner and heat pump installation problems, Washington DC, USA, American
Council for an Energy-Efficient Economy, 1999.
[9] H. McLain, D. Goldberg, Benefits of replacing residential central air conditioning systems,
in: Washington DC, USA, American Council for an Energy-Efficient Economy, 1984: pp.
E226 - E227.
[10] P. Jacobs, Small HVAC Field and Survey Information, Califonia Energy Comission, 2003.
[11] H. Henderson, R. Raustad, K. Rengarajan, Measuring Thermostat and Air Conditioner
Performance in Florida Homes, Florida, USA, Florida Solar Energy Center, 1991.
[12] D.R. Felts, Rooftop Unit Performance Analysis Tool - A Case Study, California, USA,
Pacific Gas and Electric Company, 1998.
[13] P.R. Armstrong, G.P. Sullivan, G.B. Parker, Field Demonstration of a High-Efficiency
Packaged Rooftop Air Conditioning Unit at Fort Gordon, Augusta, GA, Richland, WA,
Pacific Northwest National Laboratory, 2006.
[14] H. Henderson, D. Parker, J. Huang, Improving DOE-2’s RESYS routine: User Defined
Functions to Provide More Accurate Part Load Energy Use and Humidity Predictions,
Berkeley, CA, USA, Lawrence Berkeley National Laboratory, 2000.
[15] A.A. Bell, HVAC: Equations, Data, and Rules of Thumb, 2nd ed., McGraw-Hill, 2008.
Oversizing of HVAC System: Signatures and PenaltiesUniversity of Idaho, Integrated Design Lab-Boise Page 19 of 29
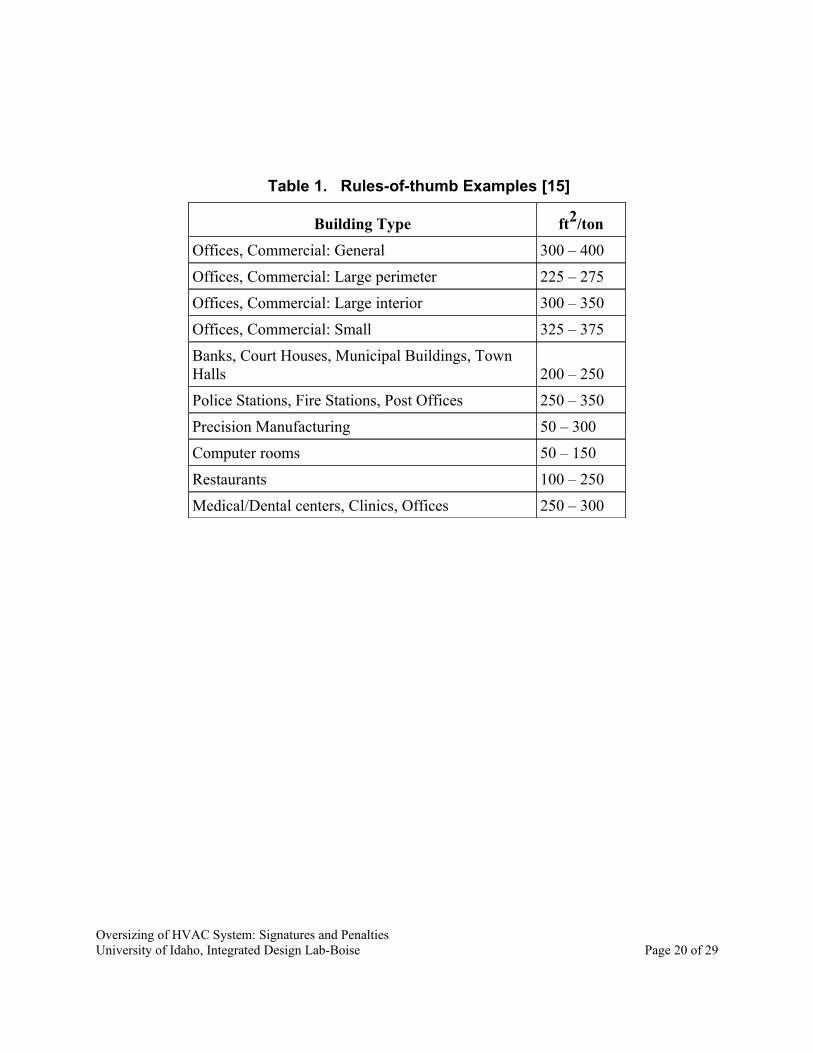
Table 1. Rules-of-thumb Examples [15]
Building Type ft2/ton
Offices, Commercial: General 300 – 400
Offices, Commercial: Large perimeter 225 – 275
Offices, Commercial: Large interior 300 – 350
Offices, Commercial: Small 325 – 375
Banks, Court Houses, Municipal Buildings, Town Halls 200 – 250
Police Stations, Fire Stations, Post Offices 250 – 350
Precision Manufacturing 50 – 300
Computer rooms 50 – 150
Restaurants 100 – 250
Medical/Dental centers, Clinics, Offices 250 – 300
Oversizing of HVAC System: Signatures and PenaltiesUniversity of Idaho, Integrated Design Lab-Boise Page 20 of 29
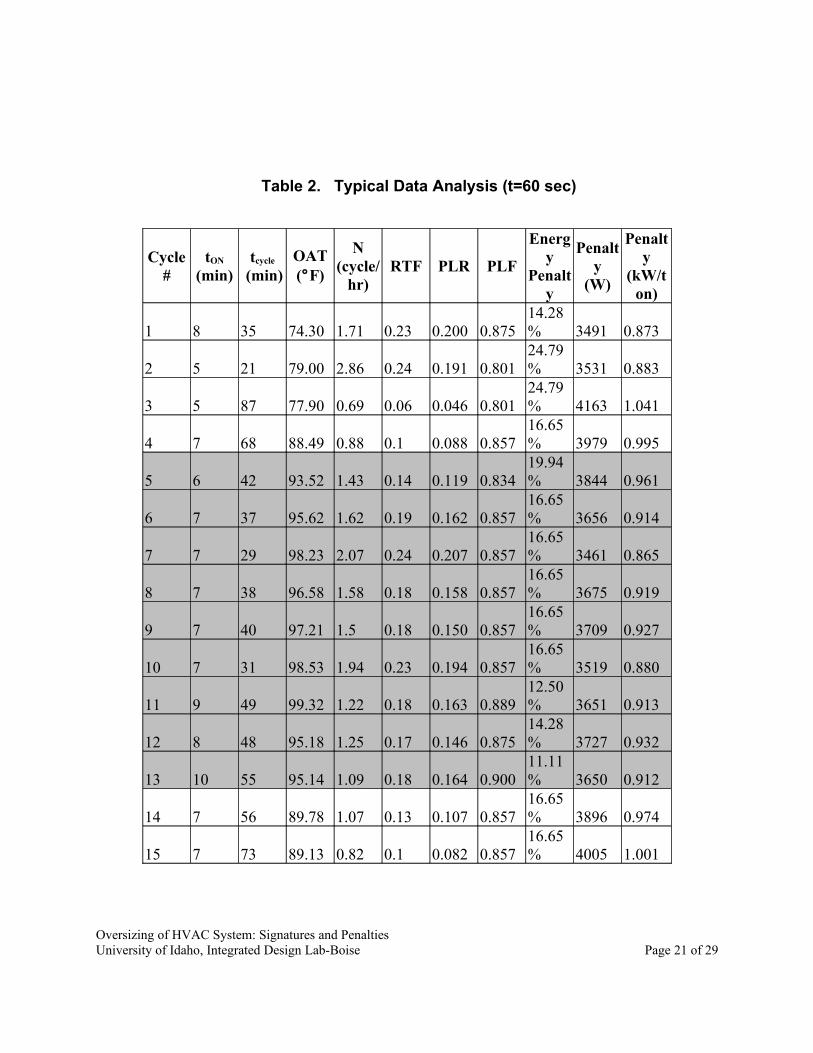
Table 2. Typical Data Analysis (t=60 sec)
Cycle #
tON
(min)tcycle
(min)OAT(°F)
N (cycle/
hr)RTF PLR PLF
Energy
Penalty
Penalty
(W)
Penalty
(kW/ton)
1 8 35 74.30 1.71 0.23 0.200 0.87514.28% 3491 0.873
2 5 21 79.00 2.86 0.24 0.191 0.80124.79% 3531 0.883
3 5 87 77.90 0.69 0.06 0.046 0.80124.79% 4163 1.041
4 7 68 88.49 0.88 0.1 0.088 0.85716.65% 3979 0.995
5 6 42 93.52 1.43 0.14 0.119 0.83419.94% 3844 0.961
6 7 37 95.62 1.62 0.19 0.162 0.85716.65% 3656 0.914
7 7 29 98.23 2.07 0.24 0.207 0.85716.65% 3461 0.865
8 7 38 96.58 1.58 0.18 0.158 0.85716.65% 3675 0.919
9 7 40 97.21 1.5 0.18 0.150 0.85716.65% 3709 0.927
10 7 31 98.53 1.94 0.23 0.194 0.85716.65% 3519 0.880
11 9 49 99.32 1.22 0.18 0.163 0.88912.50% 3651 0.913
12 8 48 95.18 1.25 0.17 0.146 0.87514.28% 3727 0.932
13 10 55 95.14 1.09 0.18 0.164 0.90011.11% 3650 0.912
14 7 56 89.78 1.07 0.13 0.107 0.85716.65% 3896 0.974
15 7 73 89.13 0.82 0.1 0.082 0.85716.65% 4005 1.001
Oversizing of HVAC System: Signatures and PenaltiesUniversity of Idaho, Integrated Design Lab-Boise Page 21 of 29
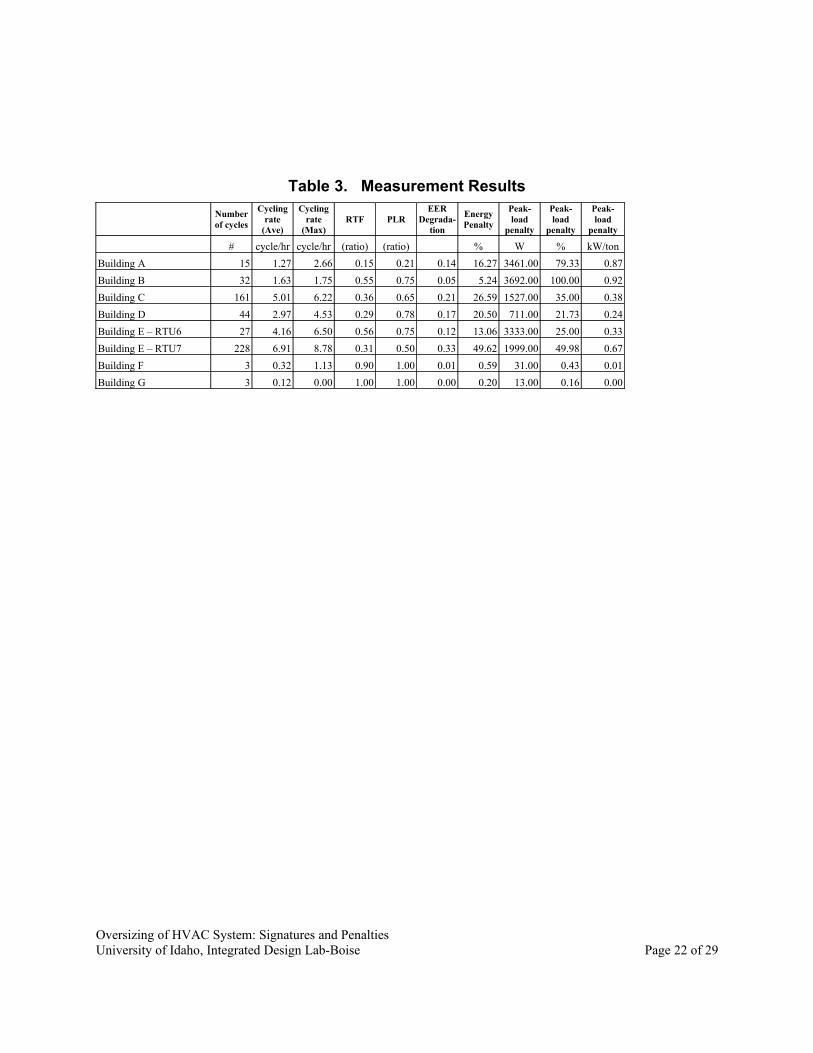
Table 3. Measurement Results
Number of cycles
Cycling rate
(Ave)
Cycling rate
(Max)RTF PLR
EER Degrada-
tion
Energy Penalty
Peak-load
penalty
Peak-load
penalty
Peak-load
penalty
# cycle/hr cycle/hr (ratio) (ratio) % W % kW/ton
Building A 15 1.27 2.66 0.15 0.21 0.14 16.27 3461.00 79.33 0.87
Building B 32 1.63 1.75 0.55 0.75 0.05 5.24 3692.00 100.00 0.92
Building C 161 5.01 6.22 0.36 0.65 0.21 26.59 1527.00 35.00 0.38
Building D 44 2.97 4.53 0.29 0.78 0.17 20.50 711.00 21.73 0.24
Building E – RTU6 27 4.16 6.50 0.56 0.75 0.12 13.06 3333.00 25.00 0.33
Building E – RTU7 228 6.91 8.78 0.31 0.50 0.33 49.62 1999.00 49.98 0.67
Building F 3 0.32 1.13 0.90 1.00 0.01 0.59 31.00 0.43 0.01
Building G 3 0.12 0.00 1.00 1.00 0.00 0.20 13.00 0.16 0.00
Oversizing of HVAC System: Signatures and PenaltiesUniversity of Idaho, Integrated Design Lab-Boise Page 22 of 29
(a)
Figure 1 (a) Bin hour profile for Boise, ID and (b) Building load v.s. AC capacity.
Oversizing of HVAC System: Signatures and PenaltiesUniversity of Idaho, Integrated Design Lab-Boise Page 23 of 29
(b)
Figure 1 (a) Bin hour profile for Boise, ID and (b) Building load v.s. AC capacity.
Oversizing of HVAC System: Signatures and PenaltiesUniversity of Idaho, Integrated Design Lab-Boise Page 24 of 29
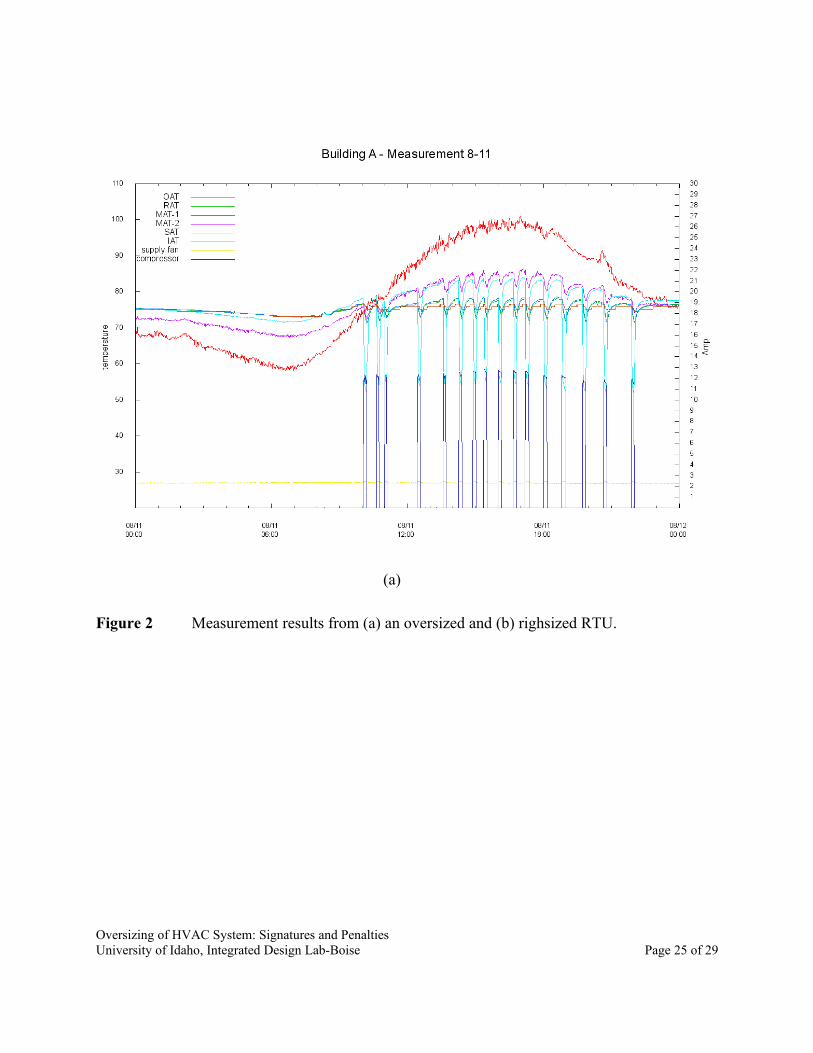
(a)
Figure 2 Measurement results from (a) an oversized and (b) righsized RTU.
Oversizing of HVAC System: Signatures and PenaltiesUniversity of Idaho, Integrated Design Lab-Boise Page 25 of 29
(b)
Figure 2 Measurement results from (a) an oversized and (b) righsized RTU.
Oversizing of HVAC System: Signatures and PenaltiesUniversity of Idaho, Integrated Design Lab-Boise Page 26 of 29
(a) (b) (c)
Figure 3 Quantifying oversizing energy penalty (a) actual cycling case (b) idealized steady-
state case with oversized unit (c) idealized steady-state with righsized unit
Oversizing of HVAC System: Signatures and PenaltiesUniversity of Idaho, Integrated Design Lab-Boise Page 27 of 29
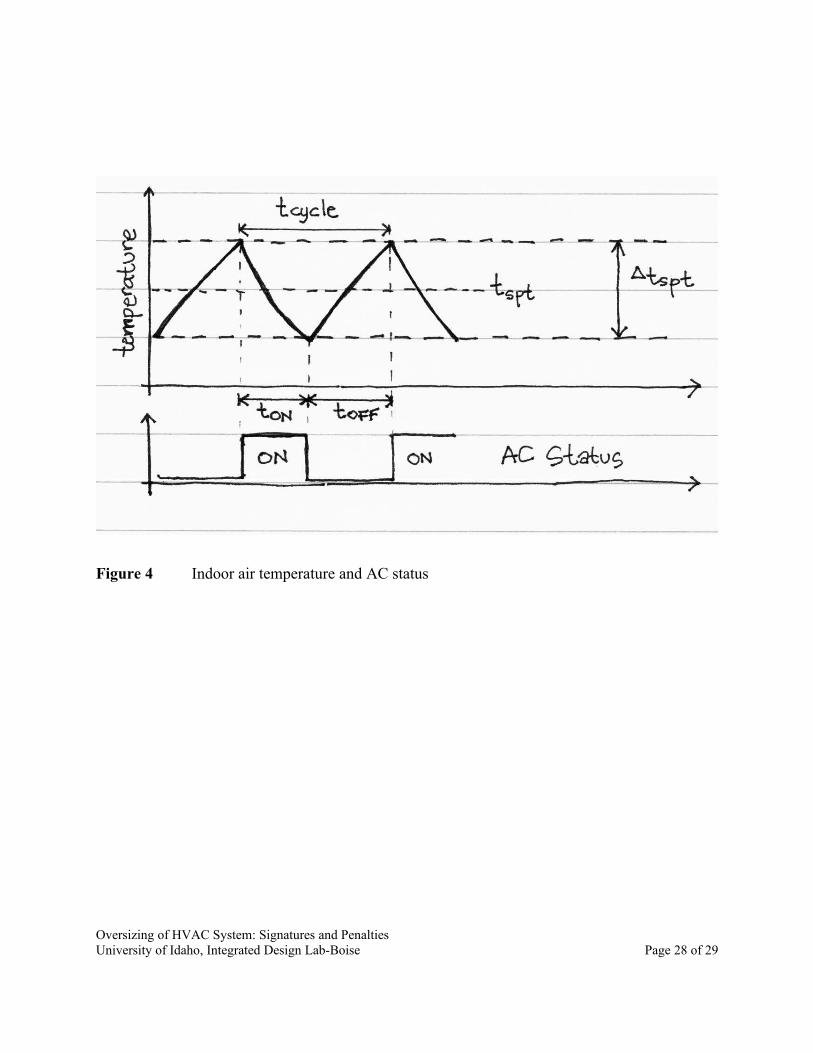
Figure 4 Indoor air temperature and AC status
Oversizing of HVAC System: Signatures and PenaltiesUniversity of Idaho, Integrated Design Lab-Boise Page 28 of 29
Figure 5 Calculation of Nmax from measurement data.
Oversizing of HVAC System: Signatures and PenaltiesUniversity of Idaho, Integrated Design Lab-Boise Page 29 of 29