Embed Size (px)
Citation preview

Signature-Embedding In Printed Documents
For Security and Forensic Applications
Aravind K. Mikkilinenia, Gazi N. Alia, Pei-Ju Chiangb
George T. C. Chiub, Jan P. Allebacha, Edward J. Delpa
aSchool of Electrical and Computer EngineeringbSchool of Mechanical Engineering
Purdue University, West Lafayette, Indiana USA
ABSTRACT
Despite the increase in email and other forms of digital communication, the use of printed documents continuesto increase every year. Many types of printed documents need to be “secure” or traceable to the printer thatwas used to print them. Examples of these include identity documents (e.g. passports) and documents used tocommit a crime. Traditional protection methods such as special inks, security threads, or holograms, can becost prohibitive. The goals of our work are to securely print and trace documents on low cost consumer printerssuch as inkjet and electrophotographic (laser) printers. We will accomplish this through the use of intrinsic andextrinsic features obtained from modelling the printing process. Specifically we show that the banding artifactin the EP print process can be viewed as an intrinsic feature of the printer used to identify both the model andmake of the device. Methods for measuring and extracting the banding signals from documents are presented.The use of banding as an extrinsic feature is also explored.
Keywords: document security, secure printing, printer identification, banding
1. INTRODUCTION
In today’s digital world securing different forms of content is very important in terms of protecting copyrightand verifying authenticity. Many methods1–7 have been developed to protect audio, video, digital documents,images, and programs (executable code).
In this paper, we will be concerned with the securing of printed documents, which we will refer to as “doc-uments”. The securing of documents is not new. In 1282 AD physical paper watermarks began to appear.8
These were created by placing thin wires in the mold used to create the paper. The purpose of these marks isto identify the paper maker or the specific mold used to create the paper. By the early eighteenth century thesetypes of watermarks started to appear in bank notes to deter counterfeiting and also on regular parchment todesignate a trademark or a particular date or place.
Today, paper watermarking is still used as can be seen in most bank notes and some official documents, but itis usually accompanied by other security features. Security fibers or threads can be embedded within the paperor woven into it during manufacture. Special inks which change color or react to certain chemicals which mightbe used to remark a document have been proposed.9 Additionally, new methods using embedded hologramsor microtext are being introduced.10, 11 These methods are used to verify the authenticity of a document andusually do not carry any other information. For more detail on these types of security features see12 .
In digital data hiding, any information (a watermark), such as copyright and owner information, can beembedded within a media data element such as an image or video sequence.4 The watermark could be visibleor non-visible, but in either case should be easily recoverable from the watermarked data.5 Additionally thewatermark must be able to survive if the host data is manipulated.
We believe that a marking scheme analogous to digital watermarking but for documents is very important.1, 13
Printed material is a direct accessory to many criminal and terrorist acts. Examples include forgery or alteration
This research was supported by a grant from the National Science Foundation, under Award Number 0219893.Address all correspondence to E. J. Delp at [email protected]

of documents used for purposes of identity, security, or recording transactions. In addition, printed material maybe used in the course of conducting illicit or terrorist activities. Examples include instruction manuals, teamrosters, meeting notes, and correspondence. In both cases, the ability to identify the device or type of deviceused to print the material in question would provide a valuable aid for law enforcement and intelligence agencies.We also believe that average users need to be able to print secure documents, for example boarding passes andbank transactions.
The problem is that the use of special papers, special inks, or holograms can be cost prohibitive. Most ofthese techniques either require special equipment to embed the security features, or are simply too expensivefor an average consumer. Additionally, there are a number of applications in which it is desirable to be able toidentify the technology, manufacturer, model, or even specific unit that was used to print a given document.
We propose to develop two strategies for printer identification based on examining a printed document. Thefirst strategy is passive. It involves characterizing the printer by finding intrinsic features in the printed documentthat are characteristic of that particular printer, model, or manufacturer’s products. We shall refer to this as theintrinsic signature. The intrinsic signature requires an understanding and modelling of the printer mechanism,and the development of analysis tools for the detection of the signature in a printed page with arbitrary content.
The second strategy is active. We embed an extrinsic signature in a printed page. This signature is generatedby modulating the process parameters in the printer mechanism to encode identifying information such as theprinter serial number and date of printing. To detect the extrinsic signature we use the tools developed forintrinsic signature detection. We will use our knowledge of the printer mechanism and the results of the printercharacterization to determine the printer process parameters that can be modulated to encode the desiredidentifying information. The modulation of these parameters will require modification of the printer mechanism.
2. OTHER APPROACHES
2.1. Hiding Data in Text
Various methods for securing documents have been developed. One of the earliest methods for securing printedtext involves the shifting of elements in a text document as described in14–16 . In this approach, methodsare described for providing copyright protection for text documents by embedding information specific to therecipient or source in order to deter illegal distribution. The methods developed to encode this information intoeach page involve the shifting of textual elements in the document by amounts imperceptible to the human viewerto encode individual bits of data. These textual elements can be lines, words, or individual characters. Withline shifting, every other line is shifted slightly up or down, approximately 1/600th inch, to encode a one or zero.To detect the shifts in a document, no prior information about the original is necessary since the information isembedded by shifting every other line. The baseline locations can be estimated in the scanned document and bymeasuring the relative distances between the baselines of adjacent text lines an estimate of the embedded datacan be found. It is shown that this type of encoding is robust to scan-print attacks and photocopy generationloss, although some variability in the detection arises due to errors in the scan process such as rotation. Anotherdetection method for line shifting, more robust to imaging errors such as scan rotation, is the use of the relativedistance between centroids of adjacent lines of text. For this detection method the original document is neededin order to properly decode the information because the centroids are dependent on the content on each textline.
Word and character coding allow more data to be embedded into a page of text, but are not as robust asline coding due to the fact that each shift is encoded in a smaller portion of the printed page. Also most wordprocessors will vary the spacing between adjacent words and characters, so estimation of the shifts using thedifferential method used for lines will not work in this case unless the original document is also available. Theseshifts could instead be used as a fragile watermark to detect alterations to a document.
One major drawback to these feature shifting methods is that they are easily defeated. An attacker cansimply scan the document and use readily available tools to extract and reformat the text, removing any shifts,and reprint it without the encoded information.

2.2. Hiding Data with Halftone Patterns
The previous method deals with encoding information in text, but documents may also have halftone images.Halftoning is the process of converting a continuous tone image into an image having only a finite number of levels,typically 2 for printed images.17 When viewed from a distance, these images resemble the original. Numerousmethods have been developed for watermarking halftone images. Most of these methods involve modifying thehalftone patterns used when printing the image. The three basic methods are the use of multiple ditheringmatrices, conjugate halftone screens, or angular variation of the halftone screen.18 In the first method, thedithering matrix changes from tile to tile and can be used to encode information. Detection involves measuringthe statistical properties of the halftone patterns and their variation across the image. The second methodinvolves conjugate halftone screens, two screens are used to form two halftone images and the data are embeddedthrough the correlations between two screens.18 The third basic method involves encoding the data in the angularorientation of the screen in each halftone cell. In this case, each angular orientation can represent multiple bitsdepending on the number of angles the halftone screen can be generated and detected at.
Another recent method of data hiding with halftone patterns has been described in19 in which watermarksare embedded in duplex printed pages such that when the page is held up to a light source a fake watermark willappear. This method relies on halftone images that are printed opposite each other on either side of the page.This technique requires a high degree of control over the registration of each side of the document to make surethe halftone patterns line up. A similar technique is also described in20 which can be used for one sided printingwith verification using a transparent screen.
2.3. Data Hiding with Watermarking Techniques for Continuous Tone Images
Watermarking images in documents can also be done using continuous tone image watermarking techniques.4, 5, 7
These methods first embed a watermark into the continuous tone image and then print it at a high resolutionto create the document. To detect the watermark, the document is scanned and transformed back into acontinuous tone image after which an appropriate method for detecting the watermark is used. The type ofwatermark embedded has to be one that can survive the print-scan process when viewed as an attack channel.
The watermarking method described in21–23 has been shown to be very robust against many types of attacks,including the print-scan attack and those involving global affine or local non-linear transformations. Being ableto survive these two types of transformations is important because a document might be wrinkled or torn. Firsta compressed and encrypted message is encoded into a reference watermark creating a small block. The blockis then flipped and mirrored to create a macroblock consisting of 4 copies of the original block. The purposeof the flipping is to visually decorrelate the embedding structure and also to assist in later estimation of localnon-linear transformations. The macroblock is then tiled and embedded into the image which is then printed.An autocorrelation detection scheme as described in24 can be used to estimate any global affine transformationsthat have been applied to the scanned document. Local non-linear transformations can then be estimated usinga similar method within each macroblock.
Until recently, none of the methods which watermark continuous tone images before printing have explicitlytaken into account the printing process itself. The method described in25 jointly optimizes the printed imagequality and the detectability of the watermark. This approach uses direct binary search (DBS) halftoning26 anda spread spectrum watermark.27 The halftoned image is modeled as a bitmap. Because the detection processrelies on a reconstructed continuous tone version of the document, and not the specific halftone patterns used inits creation, there are multiple bitmaps of the same watermarked image which will yield good detection results.Assuming that the bitmap image is M ×N pixels, there are then 2MN possible bitmaps, only a subset of whichwill visually resemble the original image data and simultaneously allow detection of the watermark. Each of thesebitmaps will differ in visual quality and the goal is to pick the one which best maximizes both visual qualityand watermark detectability. This is achieved by using a modified version of DBS such that at each iterationboth the watermark detectability and perceptual image quality metrics are used to jointly optimize the halftoneimage. This method is shown to be more robust against many common image processing operations such asJPEG compression and histogram equalization when compared to prior methods which do not take into accountthe printing process.

3. OUR APPROACH
At Purdue University we are developing forensic signatures for consumer printers based on knowledge of theprinter process and the analysis of printed documents resulting from a given printer. Our intention is to developthese methods for both inkjet (IJ) and electrophotographic (EP or laser) printers.1
We believe that secure printing is based on the concept that the printer output, the document, is an effectivemeans for identifying features of the printer. These features, which are printer specific, can be used for documentsecurity. For example, in the case of a suspected forgery we ideally should be able to tell what type of printer wasused to create the document. In our work at Purdue the focus is on extracting features from the document anddeveloping methods to securely hide information in documents based on these features. We propose to developtwo strategies for printer identification: intrinsic and extrinsic signatures.1, 13
We are developing image analysis techniques to extract features from a printed document that can be usedas an intrinsic signature. The intrinsic signature will be detected by scanning the printed page with a highresolution scanner and treating it as a high resolution image. We will then extract features from the image anduse them to classify the document with respect to the printer. We will then use the features that describe theintrinsic signature to design the extrinsic signature.
In contrast to currently used document watermarking methods which embed the watermark into the documentbefore it is printed, we propose to create the watermark by modifying the print process, this is the extrinsicsignature. This will be accomplished by modulating the process parameters in the printer mechanism to encodeidentifying information such as the printer serial number and date of printing. We believe that moving thisembedding step into the printer hardware will deter possible attempts to modify the hidden information beforeit is printed. If these steps were instead handled by a print driver or some other software beforehand, then amalicious user could reverse engineer the embedding software and re-engineer it to suit his own needs.
4. BANDING IN EP PRINTING
Our current work has focused on intrinsic feature detection of EP (laser) printers. In order to gain insight intothe types of features that can be used to describe these printers, an understanding of the EP printing process isnecessary. The first thing to note is that in the printed output from any printer there exist defects caused byelectromechanical fluctuations or imperfections in the print mechanism.13 Because these “print quality defects”are directly related to the printer mechanism, they can also be viewed as an intrinsic signature or feature of theprinter.
4.1. Banding as an Intrinsic Feature
Figure 1 shows a side view of a typical EP printer. The print process has six steps. The first step is to uniformlycharge the optical photoconductor (OPC) drum. Next a laser scans the drum and discharges specific locationson the drum. The discharged locations on the drum attract toner particles which are then attracted to the paperwhich has an opposite charge. Next the paper with the toner particles on it passes through a fuser and pressureroller which melt and permanently affix the toner to the paper. Finally a blade or brush cleans any excess tonerfrom the OPC drum.
In EP printing, the major artifact in the printed output is banding which is defined as the artifacts thatare due to quasiperiodic fluctuations in process direction parameters in the printer. These are primarily due tofluctuations in the angular velocity of the OPC drum and result in non-uniform scan line spacing. This causes acorresponding fluctuation in developed toner on the printed page.28 The appearance of the banding artifact isalternating light and dark bands perpendicular to the process direction (the direction the paper passes throughthe printer). The main cause of banding is electromechanical fluctuations in the printer mechanism, mostlyfrom gear backlash. Because these fluctuations are related to the gearing, the banding frequencies present in theprinted page should directly reflect mechanical properties of the printer.
To measure the banding frequencies of an EP printer, midtone graylevel patches created with a line fill patternwere printed and analyzed.13 Figure 2 shows a 25% line fill pattern. This pattern was printed on a set of EPprinters and then each patttern was scanned at 2400dpi. Each scanned image, img(i, j), was then projected

Laser Beam
PaperD
C
B
A
F
E
Fused TonerParticles
Pressure Roller
Fuser Roller
Transfer Roller
Process Direction
DeveloperRoller
Charge RollerCleaning Blade
OPC Drum
Figure 1. Diagram of the EP process: (A) charging,(B) exposure, (C) development, (D) transfer, (E) fus-ing, (F) cleaning
1/600 inch 3/600 inch
Figure 2. Midtone pattern 25% fill used for bandingcharacterization
horizontally to produce proj(i) =∑
j img(i, j) shown in Figure 3a. A Fourier analysis of the projection was thenobtained and shown in Figure 3b which shows spikes at 132 cycles/inch and 150 cycles/inch. Table 1 shows alist of printers and their principle banding frequencies as found by this method.
0 2000 4000 6000 8000 10000 12000 140005.85
5.9
5.95
6
6.05
6.1
6.15
6.2
6.25
6.3x 10
5
i
proj
(i)
Horizontal Projection of 25% Fill Pattern from HP lj6MP
(a) Projection of 25% fill patern fromHP lj6MP
0 50 100 150 200 2500
2
4
6
8
10
12
14
16
18
x 105
Frequency (cycles/inch)
Am
plitu
de (
gray
leve
ls)
FFT of Projection of 25% Fill Patch for HP lj6MP
(b) FFT of the projection showingpeaks at 132 and 150 cycles/inch
Figure 3. Projection and FFT analysis of 25% fill pattern printed on HP lj6MP
Detection and measurement of the banding signal in documents with large midtone regions, such as thosewith graphic art, can easily be done using methods similar to that used to produce Table 1. Our interest is tobe able to detect these signals in text. This will require a different processing technique due to the low SNR ofthe banding signal with respect to the text and because of the limited number of cycles of the banding signalwhich can be captured in the length of one text character.
4.2. Banding Modelling and Analysis
In this section we will describe our model of banding and our initial analysis approach. Our ultimate goal is toreliably detect the banding frequencies from a standard printed page. We believe it is important in some of ourforensic applications to be able to do this without using specific test documents.
4.2.1. Banding Modelling
Our model is shown in Figure 4. Two paths are shown in this figure, one for processing actual documents, andanother for processing ideal documents. These are referred to as the actual path and the ideal path respectively.
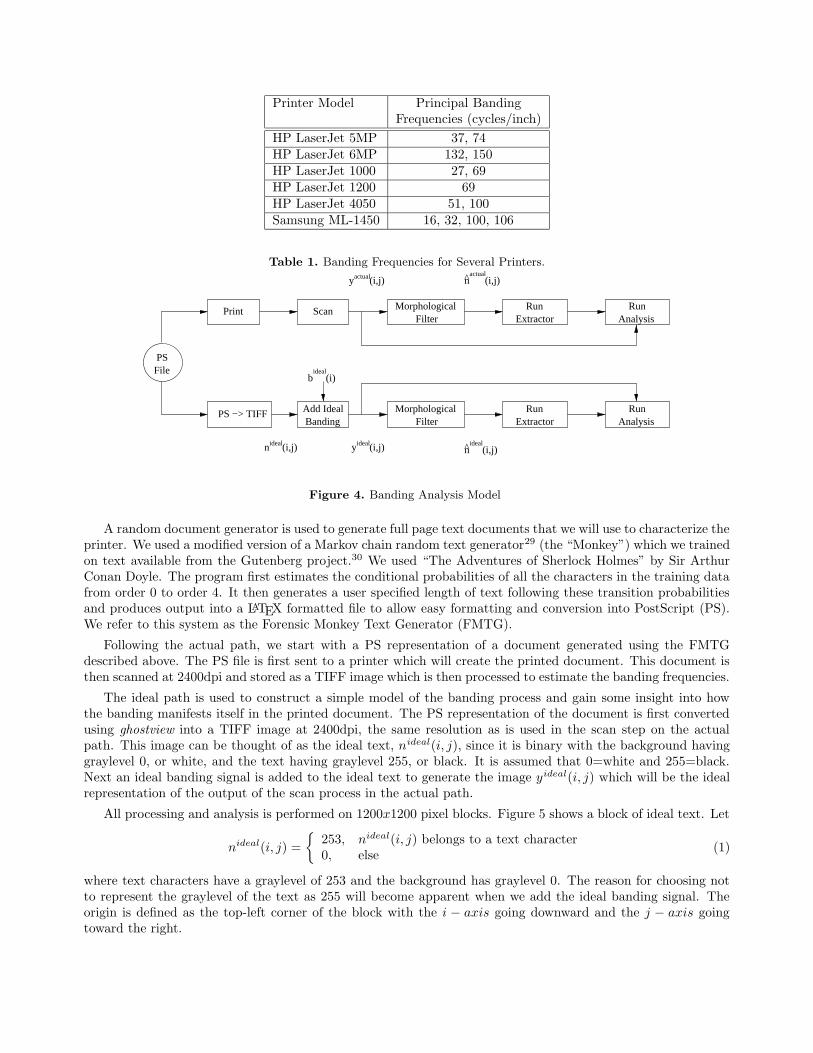
Printer Model Principal BandingFrequencies (cycles/inch)
HP LaserJet 5MP 37, 74HP LaserJet 6MP 132, 150HP LaserJet 1000 27, 69HP LaserJet 1200 69HP LaserJet 4050 51, 100Samsung ML-1450 16, 32, 100, 106
Table 1. Banding Frequencies for Several Printers.
PSFile
PS −> TIFF Add IdealBanding
Scan MorphologicalFilter
MorphologicalFilter
RunExtractor
RunExtractor
RunAnalysis
RunAnalysis
nideal(i,j) ideal(i,j)y
bideal
(i)
yactual(i,j) n̂actual
(i,j)
n̂ideal
(i,j)
Figure 4. Banding Analysis Model
A random document generator is used to generate full page text documents that we will use to characterize theprinter. We used a modified version of a Markov chain random text generator29 (the “Monkey”) which we trainedon text available from the Gutenberg project.30 We used “The Adventures of Sherlock Holmes” by Sir ArthurConan Doyle. The program first estimates the conditional probabilities of all the characters in the training datafrom order 0 to order 4. It then generates a user specified length of text following these transition probabilitiesand produces output into a LATEX formatted file to allow easy formatting and conversion into PostScript (PS).We refer to this system as the Forensic Monkey Text Generator (FMTG).
Following the actual path, we start with a PS representation of a document generated using the FMTGdescribed above. The PS file is first sent to a printer which will create the printed document. This document isthen scanned at 2400dpi and stored as a TIFF image which is then processed to estimate the banding frequencies.
The ideal path is used to construct a simple model of the banding process and gain some insight into howthe banding manifests itself in the printed document. The PS representation of the document is first convertedusing ghostview into a TIFF image at 2400dpi, the same resolution as is used in the scan step on the actualpath. This image can be thought of as the ideal text, nideal(i, j), since it is binary with the background havinggraylevel 0, or white, and the text having graylevel 255, or black. It is assumed that 0=white and 255=black.Next an ideal banding signal is added to the ideal text to generate the image yideal(i, j) which will be the idealrepresentation of the output of the scan process in the actual path.
All processing and analysis is performed on 1200x1200 pixel blocks. Figure 5 shows a block of ideal text. Let
nideal(i, j) =
{
253, nideal(i, j) belongs to a text character0, else
(1)
where text characters have a graylevel of 253 and the background has graylevel 0. The reason for choosing notto represent the graylevel of the text as 255 will become apparent when we add the ideal banding signal. Theorigin is defined as the top-left corner of the block with the i − axis going downward and the j − axis goingtoward the right.

→ j
n (i,j), 1200x1200 pixel Block of Ideal Imageideal
i ←Current Slice n (i,596)ideal
Figure 5. 1200x1200 pixel block of ideal text
0 200 400 600 800 1000 12000
50
100
150
200
250
300
i
Gra
ylev
el (
0=w
hite
255
=bl
ack)
Slice nideal ideal(i,596) of Ideal Text n (i,j)
Top of letter ’l’ Bottom ofletter ’l’
Top of letter ’o’
Inside of letter ’o’
Bottom ofletter ’o’
Graylevel 253
Figure 6. Slice from a block of ideal text
Each block is then broken into slices nideal(i) for fixed j, an example of which is shown in Figure 6 corre-sponding to the 596th slice marked in Figure 5. Within each slice we define runs, rideal
k (m), which are sectionsof the slice that are part of a text character and long enough to capture at least one cycle of the smallest bandingfrequency to be estimated. The subscript k denotes the run number, starting with k = 1 for the first run in slice1, and ending with the last run in slice 1200. The index m denotes the position in the run starting from m = 0.
Next we add an ideal banding signal to nideal(i, j) to create yideal(i, j), the ideal representation of a block oftext in the actual path. We will assume that the printer in the ideal path is an HP lj5MP, and that only the 37cycles/inch banding signal is present. Figure 7 shows an ideal banding signal with an amplitude of 2 graylevelsand frequency 37 cycles per inch as defined by
bideal(i) = a ∗ sin(2πfi
dpi), (2)
where a is the amplitude in graylevels, f is the frequency in cycles/inch, and dpi is the resolution of the signalin dots per inch. This signal only varies in the i direction because, as stated earlier, the banding signal is a printdefect in the process direction only.
The addition of the banding signal to the ideal block of text is a special process. The signal only manifestsitself in printed areas meaning that in the case of the ideal text block it will only appear on top of a textcharacter and not in the white background areas. To form the banded image, yideal(i, j), the following operationis performed,
yideal(i, j) =
{
nideal(i, j) + b(i), if nideal(i, j) = 253nideal(i, j), else
(3)
where the banding signal is added only in printed areas. Figure 8 shows the same slice seen in Figure 6 but nowwith the added banding signal. Figure 9a shows the banded run from this slice. The average value of the run isapproximately 253, and the banding signal itself is seen as a graylevel variation between 251 and 255.
4.2.2. Banding Analysis
Since it is the banding signal that is of interest, a measure of the SNR between the banding signal and the“noise”, which in this case is the text, might give some insight into what estimation techniques should be used.To simplify the situation, we will only examine a single slice. Additionally we will assume that the text characterprofile is a square pulse with width 500 pixels and that the spacing between lines, or character profiles in theslice, is 300 pixels. This is representative of 12point text. Since the banding signal only appears in printed areas,we can safely examine a single 500 pixel run containing the profile of one text charater. The SNR is the ratio of

0 200 400 600 800 1000 1200−3
−2
−1
0
1
2
3
i
Am
plitu
de (
in G
rayl
evel
s)
Ideal Banding Signal b(i)=a*sin(2*π*i*f/dpi), f=37(cycles/inch), dpi=2400(dots/inch)
Figure 7. Ideal banding signal with amplitude 2 andfrequency 37 cycles/inch
0 200 400 600 800 1000 12000
50
100
150
200
250
300
i
Gra
ylev
el (
0=w
hite
255
=bl
ack)
Slice y (i,596)ideal = n (i,596) ideal ⊕ b (i)ideal
Top of letter ’l’ Bottom ofletter ’l’
Top of letter ’o’
Inside of letter ’o’
Bottom ofletter ’o’
Graylevel 251
Graylevel 255
One Run ridealk
(m)
length 222
Figure 8. Slice from a block of ideal text with bandingsignal
the energy in the banding signal divided by the energy in the text profile.
SNR =Ebanding
Etextprofile
=
∑500i=1 b
2(i)∑500
i=1 2532= 6.2285 ∗ 10−8 (4)
Clearly trying to extract the signal directly from the slices will be problematic, hence we process the runs insteadof the slices.
Extracting the runs from the ideal text is trivial since the text and background graylevel values are welldefined. The simplest method in this case is to use a thresholding technique to look for runs of pixels whosevalues are greater than 0. For actual text this will not work since the edges of the text are not well defined andthe background is not uniform graylevel 0. To remedy this problem, we first process the block of text with a5x5 close-open morphological filter. This operation will produce a mask which marks the locations of the textcharacters with graylevel 255, and the background with graylevel 0. This mask is then used to extract the runsand their locations are then mapped back onto the original block for analysis.
Starting with the extracted run from an ideal slice, such as that shown in Figure 9a, first the mean of therun is removed forming
rideal′
k (m) = ridealk (m)− E[rideal
k (m)]. (5)
The mean shift removes the DC component of the signal, as shown in Figure 9b. Next the signal is windowedusing a raised cosine window forming
rideal′wk (m) = rideal′
k (m) ∗ cos(π ∗m
N − 1−π
2) (6)
where N is the length of the run rideal′
k . Again the mean is subtracted from the signal to remove its DC componentto form
rideal′w′
k (m) = rideal′wk (m)− E[rideal′w
k (m)]. (7)
This process of preparing each run for frequency analysis is shown in Figure 9 along with the FFT of rideal′w′
k (m).
In this ideal case a peak is clearly seen centered at 36.92 cycles/inch, very near to the actual embeddedbanding frequency of 37 cycles/inch.
This same methodology is used to analyze actual text in our initial experiments. Figure 10 shows a block ofactual text as well as a closeup of the letter ’l’ from the first line of text in the block. Notice in these imagesthat the actual text is very noisy and the characters and background are not uniform in graylevel. Shown inFigure 11 are three runs from this text block. The sharp peak in the first run, and the sharp dip in the secondrun correspond to an excess and deficiency of developed toner on the document. The first run has a peak nearthe expected banding frequency of 37 cycles/inch although the maximum amplitude was measured at 102.56

0 50 100 150 200 2500
50
100
150
200
250
300
m
Am
plitu
de (
in G
rayl
evel
s)
Plot of Run ridealk
(m) from yideal(i,596), mean=253.0387
(a)
0 50 100 150 200 250−3
−2
−1
0
1
2
3
m
Am
plitu
de (
in G
rayl
evel
s)
Plot of Run rideal,
k(m)
(b)
0 50 100 150 200 250−3
−2
−1
0
1
2
3
m
Am
plitu
de (
in G
rayl
evel
s)
Plot of Windowed Run r ideal,wk
(m) and Raised Cosine Window length 222, mean=−0.0262
(c)
0 50 100 150 200 250−3
−2
−1
0
1
2
3
m
Am
plitu
de (
in G
rayl
evel
s)
Plot of Windowed Run r ideal ‘w‘k
(d)
0 10 20 30 40 50 60 70 80 90 1000
0.2
0.4
0.6
0.8
1
1.2
1.4
Frequency (cycles/inch)
One sided Fourier Transform of rideal ‘w‘k
(m), maximum at 36.92 cycles/inch
Am
plitu
de
(e)
Figure 9. Processing of runs: a) Original Run ridealk (m), b) rideal′
k (m) = rideal
k (m)−E[ridealk ], c) rideal′w
k (m) = rideal
′
k (m)∗
cos(π ∗m
N−1−
π
2), d) rideal
′w
′
k (m) = rideal
′w
k (m)− E[rideal′w
k ], e) FFT of rideal′w
′
k (m)
(a) (b)
Figure 10. a) Block of text from HP lj5MP b) Letter ’l’ from first line
cycles/inch. The second run has a peak located at 28.13 cycles/inch. The third run has a peak at approximately42 cycles/inch. From our analysis of the runs in actual text, we believe that it is possible to estimate the bandingfrequency using our model. We are currently examining weak signal detection methods for extracting the bandingfrequency.

130
140
150
160
170
180
190
0 50 100 150 200 250
Gra
ylev
el
m
r5(m), location i=581 j=898, length 210, mean=1.800048e+02
(a)
180 182 184 186 188 190 192 194 196 198 200
0 50 100 150 200 250
Gra
ylev
el
m
r15(m), location i=188 j=473, length 210, mean=1.876857e+02
(b)
176
178
180
182
184
186
188
190
0 50 100 150 200 250
Gra
ylev
el
m
r20(m), location i=185 j=478, length 212, mean=1.843066e+02
(c)
0
0.5
1
1.5
2
2.5
3
0 10 20 30 40 50 60 70 80 90 100
Am
plitu
de
Frequency (cycles/inch)
R 'w'5(f), location i=581 j=898, length 210
max 102.56
37 cpi
(d)
0 0.2 0.4 0.6 0.8
1 1.2 1.4 1.6
0 10 20 30 40 50 60 70 80 90 100
Am
plitu
de
Frequency (cycles/inch)
R 'w'15(f), location i=188 j=473, length 210
max 28.13
37 cpi
(e)
0 0.1 0.2 0.3 0.4 0.5 0.6 0.7 0.8
0 10 20 30 40 50 60 70 80 90 100
Am
plitu
de
Frequency (cycles/inch)
R 'w'20(f), location i=185 j=478, length 212
max 8.21
37 cpi
(f)
Figure 11. a-c) Runs from actual text Figure 10a, d-f) Corresponding FFT of the processed runs a-c
4.3. Banding as an Extrinsic Signature
We have also examined the possibility of using banding as an extrinsic feature. Prior work has been reportedon reducing the banding artifacts in the print process by controlling either the OPC drum velocity itself ormodulating the laser pulse width as a function of the OPC drum velocity.28, 31 In the first method, a closedloop controller varies the velocity of the motor controlling the OPC drum based on the real time velocity thatis measured using an encoder. The second method uses the fact that the velocity of the OPC drum dictates thescan line spacing assuming that the laser scanning speed is constant. When the OPC drum velocity is low, thescan lines are closer together and so the pulse width is decreased to reduce the amount of developed toner on theprinted document. When the OPC drum velocity is high, the scan lines will be further apart and so the pulsewidth is increased to increase the amount of developed toner on the printed document. Both methods have beenshown to work very well.
Using either of the banding reduction methods, it would be possible to modulate any existing bandingfrequencies in the print process to encode information. Additionally we can inject arbitrary artificial bandingfrequencies into a document. We have been successful in embedding artificial banding frequencies into a documentby using the first method. Because of the electromechanical limitations imposed by the motor controlling theOPC, we have not been able to inject frequencies higher than 50 cycles/inch. We are currently working with thesecond method which should allow the injection of frequencies above 100 cycles/inch.
5. CONCLUSION
Using print quality defects as an intrinsic signature of a printer is possible as shown for banding artifacts inEP printers. We believe that by successfully extracting the banding features from a document it is possible toclassify the document based on the specific make and model of device which created it. We need to better modelthis process by employing more sophisticated statistical analysis tools.

REFERENCES
1. E. J. Delp, “Is your document safe: An overview of document and print security,” Proceedings of the IS&TInternational Conference on Non-Impact Printing, San Diego, California, September 2002.
2. A. M. Eskicioglu and E. J. Delp, “An overview of multimedia content protection in consumer electronicsdevices,” Signal Processing : Image Communication, vol. 16, pp. 681–699, 2001.
3. A. M. Eskicioglu, J. Town, and E. J. Delp, “Security of digital entertainment content from creation toconsumption,” Signal Processing : Image Communication, vol. 18, no. 4, pp. 237–262, April 2003.
4. C. I. Podilchuk and E. J. Delp, “Digital watermarking: Algorithms and applications,” IEEE Signal Pro-cessing Magazine, vol. 18, no. 4, pp. 33–46, July 2001.
5. M. Barni, C. I. Podilchuk, F. Bartolini, and E. J. Delp, “Watermark embedding: hiding a signal within acover image,” IEEE Communications Magazine, vol. 39, no. 8, pp. 102–108, August 2001.
6. B. Macq, J. Dittmann, and E. J. Delp, “Benchmarking of image watermarking algorithms for digital rightsmanagement,” Proceedings of the IEEE, 2004, to appear in.
7. R. W. Wolfgang, C. I. Podilchuk, and E. J. Delp, “Perceptual watermarks for digital images and video,”Proceedings of the IEEE, vol. 87, no. 7, July 1999, pp. 1108–1126.
8. I. J. Cox, M. L. Miller, and J. A. Bloom, Digital Watermarking. San Francisco, CA: Morgan KaufmannPublishers, 2002.
9. R. L. van Renesse, “Paper based document security - a review,” IEE European Conference on Security andDetection, no. 437, pp. 75–80, April 1997.
10. J. Picard, “Digital authentication with copy detection patterns,” Proceedings of the SPIE InternationalConference on Optical Security and Counterfeit Deterrence Techniques V, vol. 5310, January 2004.
11. R. Steenblik and M. Hurt, “Unison(tm) microoptic security film,” Proceedings of the SPIE InternationalConference on Optical Security and Counterfeit Deterrence Techniques V, vol. 5310, January 2004.
12. R. L. Renesse, Optical Document Security. Boston: Artech House, 1998.
13. G. N. Ali, P.-J. Chiang, A. K. Mikkilineni, J. P. Allebach, G. T. Chiu, and E. J. Delp, “Intrinsic and extrinsicsignatures for information hiding and secure printing with electrophotographic devices,” Proceedings of theIS&T International Conference on Non-Impact Printing, vol. 19, New Orleans, LA, September 2003, pp.511–515.
14. J. T. Brassil, S. Low, and N. F. Maxemchuk, “Copyright protection for the electronic distribution of textdocuments,” Proceedings of the IEEE, vol. 87, no. 7, July 1999, pp. 1181–1196.
15. J. T. Brassil, S. Low, N. F. Maxemchuk, and L. O’Gorman, “Electronic marking and identification techniquesto discourage document copying,” IEEE Journal on Selected Areas in Communication, vol. 13, no. 8, pp.1495–1504, October 1995.
16. S. H. Low and N. F. Maxemchuk, “Capacity of text marking channel,” IEEE Signal Processing Letters,vol. 7, no. 12, pp. 345–347, December 2000.
17. T. N. Pappas, J. P. Allebach, and D. L. Neuhoff, “Model-based digital halftoning,” IEEE Signal ProcessingMagazine, vol. 20, no. 4, pp. 14–27, July 2003.
18. M. S. Fu and O. C. Au, “Data hiding watermarking for halftone images,” IEEE Transactions on ImageProcessing, vol. 11, no. 4, pp. 477–484, April 2002.
19. G. Sharma and S. Wang, “Show-through watermarking of duplex printed documents,” Proceedings of theSPIE International Conference on Security, Steganography, and Watermarking of Multimedia Contents VI,vol. 5306, January 2004.
20. Z. Fan, “Information embedding using two-layer conjugate screening,” Proceedings of the SPIE InternationalConference on Optical Security and Counterfeit Deterrence Techniques V, vol. 5310, January 2004.
21. S. V. Voloshynovskiy, F. Deguillaume, and T. Pun, “Multibit digital watermarking robust against localnonlinear geometrical distortions,” Proceedings of the IEEE International Conference on Image Processing,pp. 999–1002, October 2001.
22. ——, “Content adaptive watermarking based on a stochastic multiresolution image modeling,” Proceedingsof the European Signal Processing Conference, September 2000.

23. S. V. Voloshynovskiy, F. Deguillaume, S. Pereira, and T. Pun, “Optimal adaptive diversity watermarkingwith channel state estimation,” Proceedings of the SPIE International Conference on Security and Water-marking of Multimedia Contents III, vol. 4314, San Jose, California, August 2001, pp. 673–685.
24. F. Deguillaume, S. V. Voloshynovskiy, and T. Pun, “Method for the estimation and recovering from generalaffine transforms in digital watermarking applications,” Proceedings of the SPIE International Conferenceon Security and Watermarking of Multimedia Contents IV, vol. 4675, April 2002, pp. 313–322.
25. D. Kacker and J. P. Allebach, “Joint halftoning and watermarking,” IEEE Transactions on Signal Process-ing, vol. 51, no. 4, pp. 1054–1068, April 2003.
26. D. J. Lieberman and J. P. Allebach, “A dual interpretation for direct binary search and its implicationsfor tone reproduction and texture quality,” IEEE Transactions on Image Processing, vol. 9, no. 11, pp.1950–1963, November 2000.
27. I. J. Cox, J. Kilian, F. T. Leighton, and T. Shamoon, “Secure spread spectrum watermarking for multime-dia,” IEEE Transactions on Image Processing, vol. 6, no. 12, pp. 1673–1687, December 1997.
28. G.-Y. Lin, J. M. Grice, J. P. Allebach, G. T.-C. Chiu, W. Bradburn, and J. Weaver, “Banding artifactreduction in electrophotographic printers by using pulse width modulation,” Journal of Imaging Scienceand Technology, vol. 46, no. 4, pp. 326–337, July/August 2002.
29. T. McConnell. (1999) Monkey: a markov chain random text generating program. [Online]. Available:http://barnyard.syr.edu/˜tmc/
30. [Online]. Available: http://www.gutenberg.net/
31. C.-L. Chen and G. T.-C. Chiu, “Banding reduction in electrophotographic process,” Proceedings of theIEEE/ASME International Conference on Advanced Intelligent Mechatronics, vol. 1, July 2001, pp. 81–86.