Embed Size (px)
Citation preview
Wesleyan University The Honors College
Signaling to Sir2-mediated transcriptional silencingthrough metabolism
by
Kuan-lin HuangClass of 2012
A thesis submitted to thefaculty of Wesleyan University
in partial fulfillment of the requirements for theDegree of Bachelor of Arts
with Departmental Honors in Molecular Biology and Biochemistry
Middletown, Connecticut April, 2012

ACKNOWLEDGEMENTS
First and foremost, I would like to thank my advisor, Dr. Scott Holmes, for
providing me with this wonderful learning opportunity. Throughout these three years,
he has been a patient teacher and a caring friend. His advice has often given me fresh
and important perspectives to look at my experiments, education, and life.
I am grateful to all my fellow lab members: Asmitha, Tina, Upasna, Becky,
Sam, Anand, Hannah, Shiwei, Dessie, Priyanka, Lisle and Claire. I have really
enjoyed every moment spent in and out of the lab with you. I have always been proud
to be a member of the Holmes’s lab because you are all awesome.
I also want to thank my friends who have always kept me company.
Specifically, I would like to thank Yu for constantly showing her care and
encouraging me. I would also like to extend my gratitude to Nam-Anh, Taiki, Sandy,
Han-Hsien, and Sunil for bringing great fun into my college life.
Finally, I would like to thank my dad, my mom, and my sister for their
unconditional support. They have always been the extremely supportive, regardless of
whatever I pursue.
TABLE OF CONTENTS
Introduction..................................................................................................................1
I. Sir2.........................................................................................................................2
II. Sir2-mediated transcriptional silencing .................................................................5
1. HM loci ............................................................................................................6
2. Telomeres .........................................................................................................7
3. rDNA repeats ...................................................................................................8
III. Sir2 biochemistry and regulation .........................................................................10
IV. Sirtuins and metabolism.......................................................................................13
1. Signaling from metabolism to Sir2 ................................................................13
2. Sirtuins as metabolic regulators .....................................................................17
V. Sirtuins, mitochondria, and aging ........................................................................19
VI. Goal of the study..................................................................................................21
Material and Methods ...............................................................................................22
I. Plasmids, Strains, and Primers..............................................................................22
II. Strain Construction ...............................................................................................26
1. Overexpression plasmid construction and sequencing ...................................26
2. Creation of gene deletion, site-directed mutation and overexpression strains
........................................................................................................................27
III. Petite strain verification ........................................................................................27
IV. Serial Dilution Assays...........................................................................................28
1. Lethality assay ................................................................................................28
2. Sir-mediated silencing assay...........................................................................29
3. Nuclear NAD reporter assay...........................................................................29
4. Oxidative stress assay .....................................................................................30
5. Two-hybrid assay............................................................................................31
V. Fluorescence microscopy......................................................................................31
VI. rDNA recombination rate measurement ...............................................................32
VII. Western Blotting ...................................................................................................34
Results .........................................................................................................................37
I. Adh1......................................................................................................................37
1. Δadh1 Mutant Exhibits Silencing Defects at Telomeres................................38
2. Δadh1 Mutant Exhibits Lower Tolerance to Oxidative Stress.......................40
II. Tdh3......................................................................................................................43
1. Tdh3 localization studies ...............................................................................43
2. Silencing assay of tdh3T227A, T227K and N314T mutants ..........................46
III. Mrps12 ..................................................................................................................53
1. MRPS12 overexpression enhances Sir2 and Sir3-induced lethality ..............54
2. Lethality assay in Δsir2 and Δsir3 strains ......................................................55
3. Silencing assay of Δmrps12 mutants .............................................................58
4. Silencing assay of MRPS12 overexpressing strains.......................................60
5. rDNA recombination assay of Δmrps12 mutants...........................................63
6. MRPS12 overexpression does not affect Sir2 expression levels....................65
7. Sir2 and Mrps12 do not interact through two-hybrid assays .........................67
8. Nuclear NAD+ levels in mrps12 mutants.......................................................69
Discussion....................................................................................................................72
I. Adh1......................................................................................................................72
II. Tdh3......................................................................................................................74
III. Oxidative stress signaling .....................................................................................77
IV. Mrps12 ..................................................................................................................79
V. Sir2 as a metabolic regulator?...............................................................................81
VI. Conclusion ............................................................................................................82
References ...................................................................................................................83
LIST OF TABLESTable 1: Plasmids used in this study.Table 2: S. cerevisiae strains used in this study.Table 3: Primers used in this study.
LIST OF FIGURESFigure 1. Acetylated histones are deacetylated by Sir2, resulting in transcriptionalsilencing.Figure 2. Molecular phylogeny of the sirtuins.Figure 3. A model of silencing at HML.Figure 4. A model of silencing at telomeres.Figure 5. Sir2 and NAD metabolism.Figure 6. Two potential pathways for CR-mediated life span extension in yeast.Figure 7. Sirt1 and Sirt3 regulate metabolic response pathways in various tissues.Figure 8. Possible calorie restriction pathways in different species.Figure 9. Nuclear NAD+ reporter strain.Figure 10. Silencing assay of adh1 knockout mutant at HMR and Telomere V.Figure 11. H2O2 oxidative stress assay of adh1∆ mutant.Figure 12. Localization of Tdh3-GFP.Figure 13. Localization of a Tdh3-myc construct in wild type, sir2∆ and tdh2∆ strains.Figure 14. Silencing assay of tdh3 mutants at HMR and Telomere V.Figure 15. MRPS12 overexpression enhances Sir2 and Sir3-induced lethality.Figure 16. MRPS12 overexpression enhances Sir2 and Sir3-induced lethality in aΔsir2 strain.Figure 17. MRPS12 overexpression enhances Sir2 and Sir3-induced lethality in aΔsir3 strain.Figure 18. Silencing assay of mrps12∆ mutant at HMR and Telomere V.Figure 19. Silencing assay of mrps12∆ mutant at rDNA repeats.Figure 20. Silencing assay of MRPS12 overexpressing strains at HMR and TelomereV.Figure 21. rDNA recombination assay of ∆mrps12 mutant.Figure 22. Western blotting of Sir2 expression levels from chromosomal SIR2 and anuninduced GAL10-SIR2 construct on a 2μ high-copy plasmid.Figure 22. Western blotting of Sir2 expression levels from an induced GAL10-SIR2construct on a 2μ high-copy plasmid.Figure 23. Nuclear NAD level upon the deletion or the overexpression of MRPS12.Figure 24. A model of Sir2 regulation by Adh1 and Tdh3.Figure 25. A model of aging/oxidative stress signaling to Sir2 through Tdh3 andAdh1.
1
INTRODUCTION
DNA carries the information required to construct a cell. Yet, just as
musical notes need to be thoughtfully arranged to compose a melody, the genetic
information encoded in DNA requires regulated processing in order to create a
functioning cell. Like musical notes, each gene must be “played” or expressed at
the appropriate level and timing. The regulation of gene expression allows diverse
cell characteristics and behaviors within one constant set of genomic sequence.
Gene expression is regulated at multiple steps in the central dogma
pathway from DNA, RNA to protein. As one regulatory mechanism, the
organization of DNA molecules affects their exposure to transcription machineries
and gene expression. In eukaryotic cells, DNA is packaged by histone proteins
into an ordered structure called chromatin. Chromatin structure is dynamic, and
can be controlled by post-translational modifications of histone proteins [reviewed
in (Eberharter, Ferreira et al. 2005)]. Histone acetylation is one such modification
that alters chromatin structure. Chromatins with acetylated histones adopt a more
relaxed structure that is associated with transcriptional activation. In contrast,
chromatins containing hypoacetylated histones are more compact and silenced in
gene expression [reviewed in (Kouzarides 2007)].
2
In budding yeast, Saccharomyces cerevisiae, Sir (Silent information regulator)
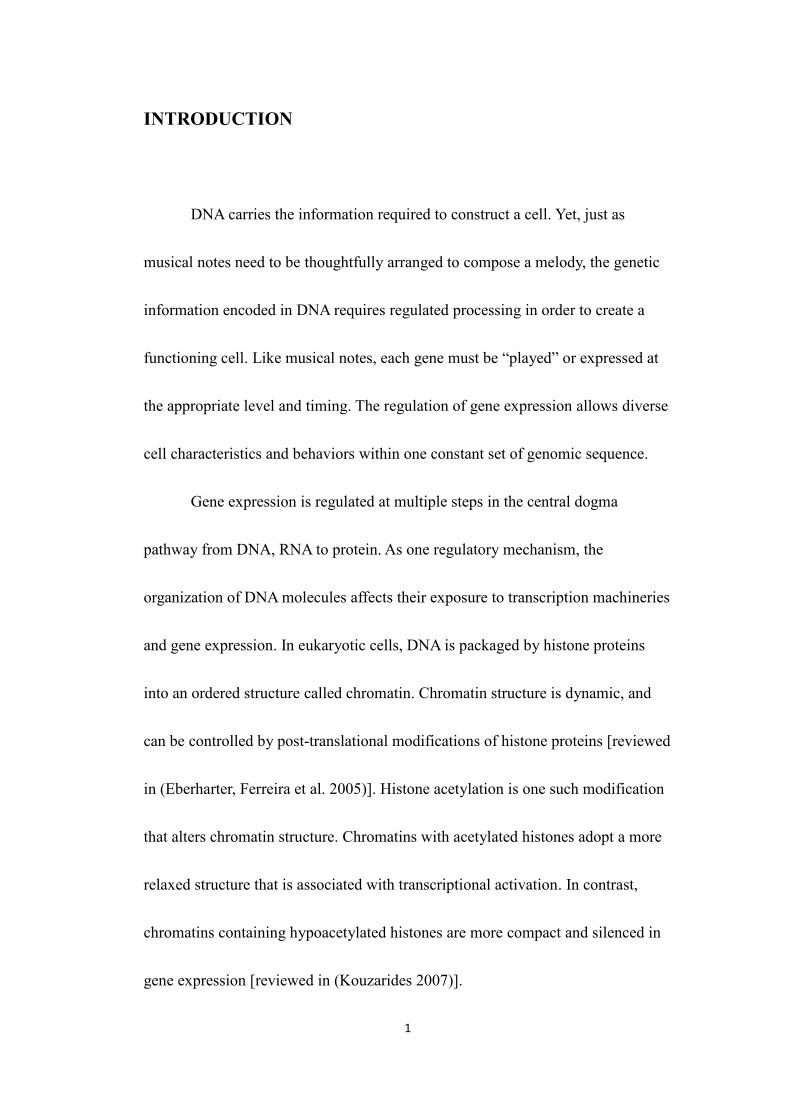
proteins are key mediators of chromatin silencing. Among them, Sir2 is a histone
deacetylase that is essential in the establishment and maintenance of silenced
chromatin structure [reviewed in (Rusche, Kirchmaier et al. 2003)]. It is
evolutionarily conserved from bacteria to human, and its orthologs have been
found to serve similar functions (Blander and Guarente 2004). The studies of gene
regulation by Sir2 deacetylation in budding yeast may provide valuable insights
into related mechanisms in other organisms.
Figure 1. Acetylated histones are deacetylated by Sir2, resulting in transcriptionalsilencing. [Diagrams of histones are adopted from (Schreiber Laboratory 2012).]
I. Sir2
Budding yeast Sir2 is a histone deacetylase (HDAC) that works in concert
with other Sir proteins and collaborating factors to silence gene expression from
chromatin. HDACs are divided into three classes. Yeast Rpd3 and Hda1 are the
respective founding members of class I and II HDACs, which share high
similarity in their catalytic cores (de Ruijter, van Gennip et al. 2003). Sir2 is the
3
founding member of class III HDACs that have little sequence homology to class
I and II HDACs (North and Verdin 2004). Distinct from HDACs of the other two
classes, Sir2’s deacetylation activity requires nicotine adenine dinucleotide (NAD)
as a cofactor (Landry, Sutton et al. 2000). This specific requirement may link
Sir2’s transcriptional regulation activity to cell’s redox state and metabolism.
In Saccharomyces cerevisiae, four Sir2 homologs, Hst1-4, have been
discovered and characterized. They serve direct or indirect functions in silencing,
cell cycle progression, radiation resistance, and genome stability (Brachmann,
Sherman et al. 1995). Among them, Hst1 is the closest homolog of Sir2. It is a
NAD-dependent deacetylase that represses the expression of NAD biosynthesis
genes with its DNA binding partner, Sum1. It is suggested that Hst1p may serve as
a cellular NAD sensor that monitors and regulates cellular NAD levels (Bedalov,
Hirao et al. 2003). More specifically, this demonstrates that Hst1 can translate the
message from cell’s metabolic state into its silencing activity, which in turns
affects cell metabolism.
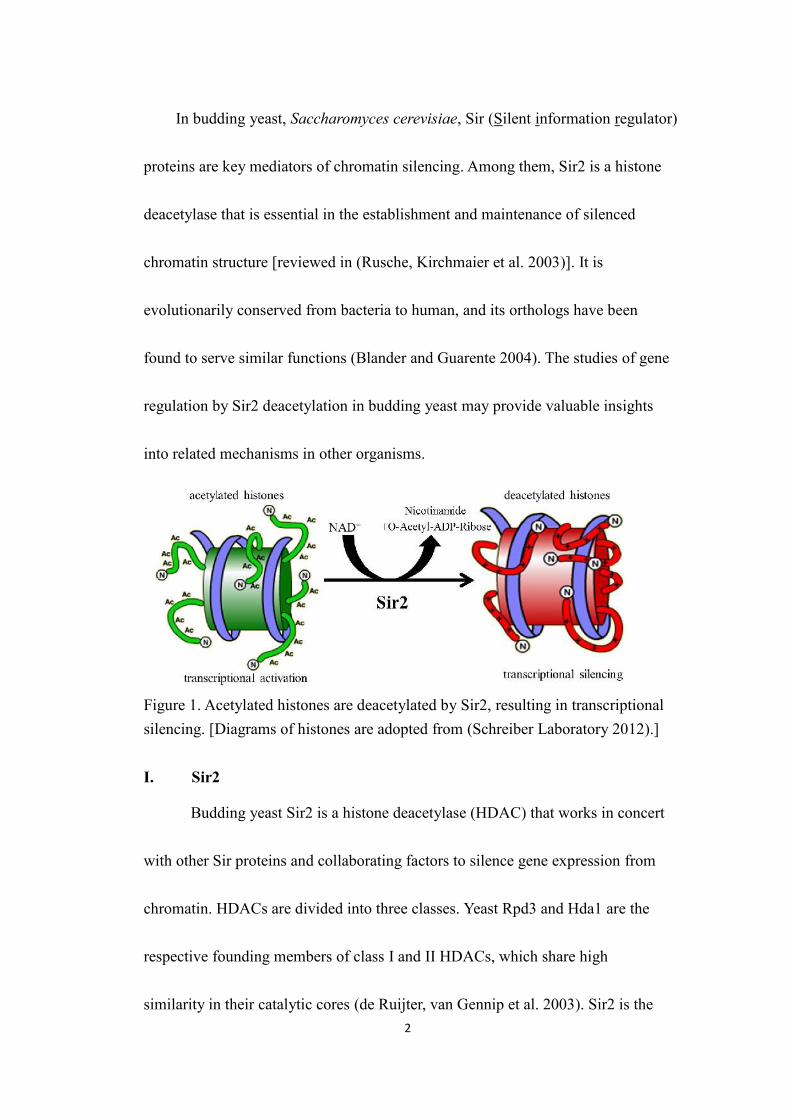
Across species, Sir2 is evolutionarily conserved and its homologs have
been discovered in all three kingdoms of life. Sir2-like NAD-dependent
deacetylases are called sirtuins. They share a conserved core domain of
approximately 260 amino acids. As seen in figure 2, a molecular phylogeny
4
analysis based on this domain classified sixty sirtuins into four major branches
(Frye 2000). Structural studies have implicated the core domain’s role in binding
to NAD and the acetyl-lysine substrate, conferring sirtuins’ NAD-dependent
deacetylase activity (North and Verdin 2004).
Figure 2. Molecular phylogeny of the sirtuins: an unrooted tree diagram of aphylogenetic analysis of the conserved sirtuin core deacylase domain sequences,divided into class I, II, III, IV, and U groups; classes I and IV are further dividedinto subclasses indicated by lowercase letters. Adopted and modified from(Blander and Guarente 2004).
As the list of identified sirtuins expands, novel subcellular localizations,
protein interactors and substrates of sirtuins are also constantly being reported
(Blander and Guarente 2004). In bacteria, CobB is a prokaryote sirtuin that
deacetylates and activates the acyl-CoA synthase in an NAD-dependent manner
(Starai, Takahashi et al. 2003). As one of the five Drosophila sirtuins, dSir2 is a
5
histone deacetylase that is required for transcriptional silencing. The deletion of its
gene causes silencing loss and a shortened lifespan (Astrom, Cline et al. 2003). In
mammals, there are seven Sir2 homologs, SIRT1-7. They are found in diverse
cellular localizations: SIRT1 localizes to the nucleus and cytoplasm, SIRT2
localizes to the cytoplasm, SIRT3-5 are mitochondrial and SIRT6, 7 are nuclear.
They affect a broad range of cellular functions including transcriptional regulation,
stress response and metabolism [reviewed in (Schwer and Verdin 2008) (Haigis
and Guarente 2006)]. The diverse functions of sirtuins implicate their roles as
communication centers for multiple cellular pathways. Importantly, they might be
able to associate other cell functions to their transcriptional regulation activity.
II. Sir2-mediated transcriptional silencing
Sir proteins are required for the proper establishment of silent chromatin
structure at three genetic loci in budding yeast, including the cryptic mating type
loci (HM loci), telomeres and rDNA repeats. In general, silent chromatin
establishment is initiated by the targeting of Sir proteins and their interacting
partners to cis-acting elements, termed silencers. Subsequently, these proteins
spread continuously to the adjacent chromatin regions through the recruitment of
additional Sir proteins (Rusche, Kirchmaier et al. 2003). The detailed mechanisms
of silencing differ between each of the three silenced loci.
6
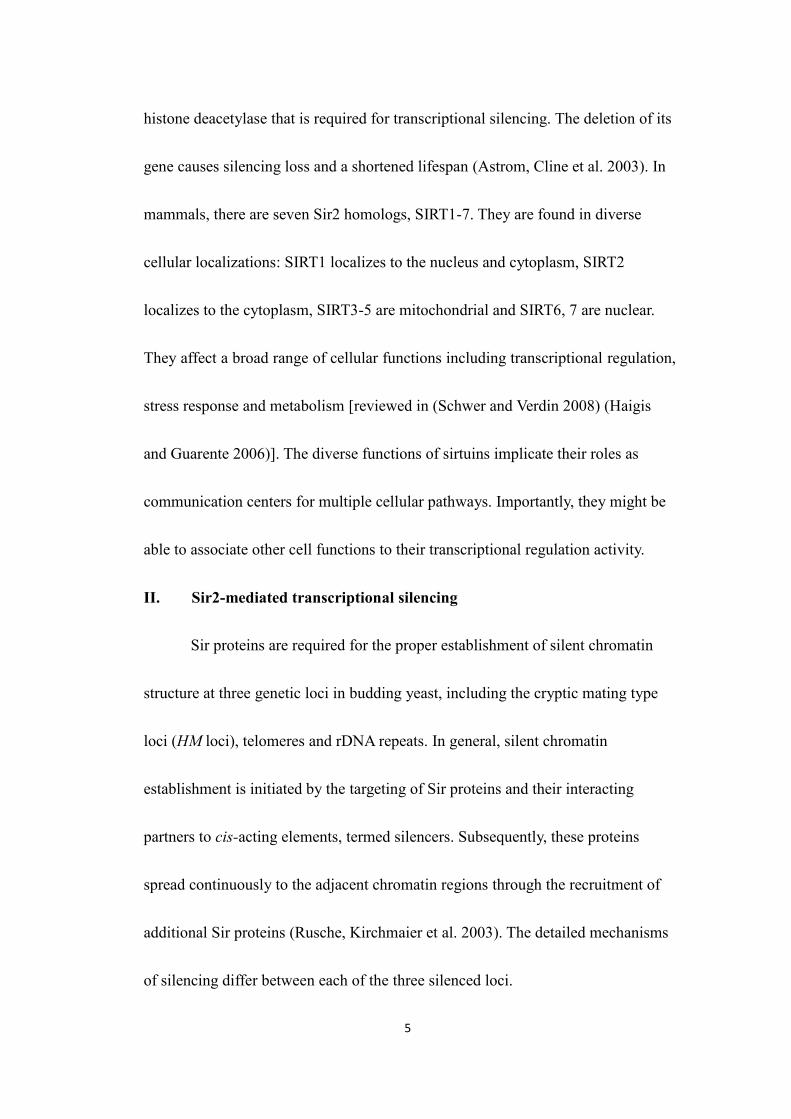
1. HM loci
The S. cerevisiae yeast genome contains spare copies of mating type genes in
the cryptic mating type loci, HML and HMR. These loci are silenced under normal
conditions, and their silenced state is required for yeast’s mating ability. HMR and
HML are each flanked by an E and an I silencers, which contain different
combinations of binding sites for ORC (origin recognition complex), Rap1 and
Abf1 [reviewed in (Rusche, Kirchmaier et al. 2003)]. In a current model, these
silencer binding proteins recruit the four Sir proteins, which form a stable
complex to nucleate silencing. The Sir2 protein from this complex deacetylates
the histones next to the silencers. These deacetylated histones in turn promote the
binding of another Sir2-4 complex to modify the adjacent histones. This cycle of
Sir proteins complex recruitment and histone modifications repeats until the entire
HM locus is hypoacetylated and stably bound with Sir2-4 protein complexes
[reviewed in (Fox and McConnell 2005)].
Figure 3. A model of silencing at HML. Upon binding to a silencer, silencerbinding proteins recruit Sir1-4. The Sir proteins form a complex and deacetylateadjacent histones, which in turn recruits another Sir2-4 protein complex to modifythe next nearby histones. This cycle is repeated until the entire HML locus ishypoacetylated.
7
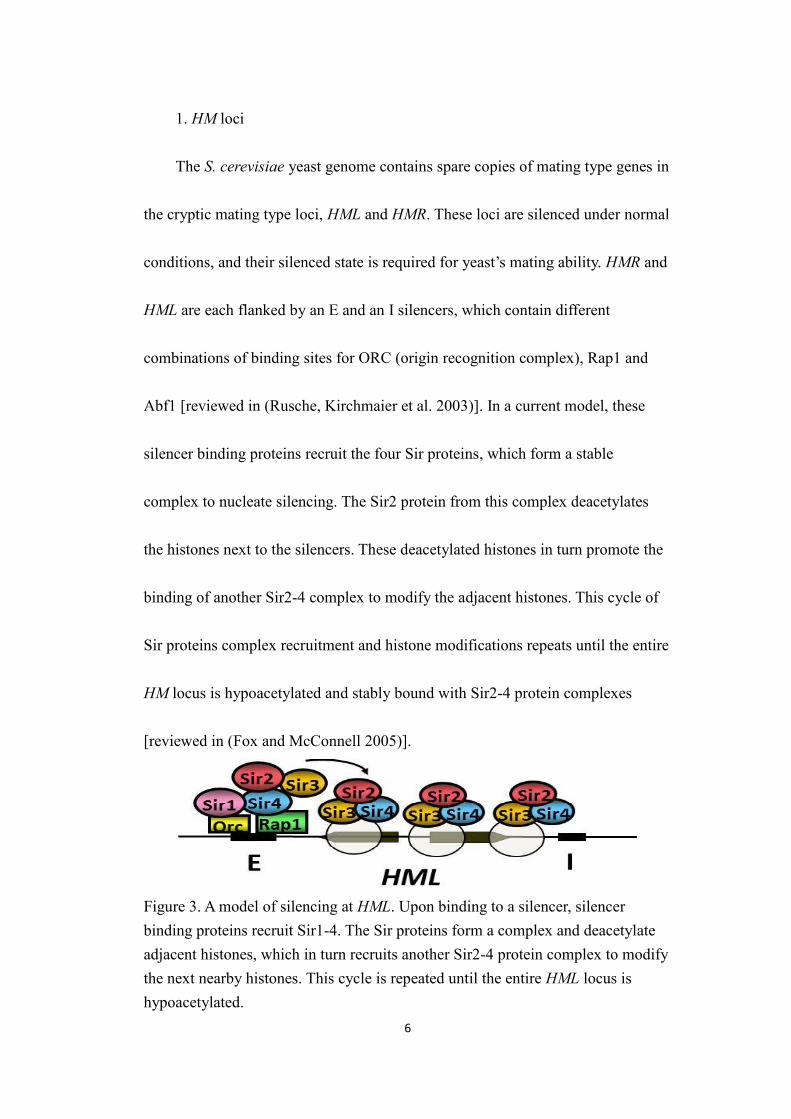
2. Telomeres
Telomeres are DNA regions with repetitive sequences at the ends of
chromosomes that maintain the integrity of chromosome ends (Zakian 1996). In a
phenomenon known as telomere position effect (TPE), genes placed near
telomeres are repressed in a position dependent manner, indicating the silenced
state of this chromatin region (Gottschling, Aparicio et al. 1990).
Silencing at telomeres is established by similar factors that are involved in
HM loci silencing. Rap1 binds to its binding sites at telomeres and recruits the Sir
2-4 proteins. Additionally, Ku complex might also participate in the recruitment of
Sir proteins (Mishra and Shore 1999). These Sir proteins form a complex and
propagate to form silenced chromatin structures at the telomeres. Although ORC,
Abf1 and Sir1 are not required for the silencing protein assembly at telomeres,
their binding sites have been identified and they may play some roles in telomeric
silencing [reviewed in (Huang 2002; Rusche, Kirchmaier et al. 2003)].
Figure 4. A model of silencing at telomeres. Rap1 recruits the Sir 2-4 proteins totelomere repeats. These Sir proteins form a complex and propagate to formsilenced chromatin structures at the telomeres.
8
3. rDNA repeats
In budding yeast, the genes encoding for rRNA (rDNA) are organized in
tandem arrays of approximately 100 to 200 repeats. Each rDNA repeat contains
two rRNA genes separated by nontranscribed spacers. The gene encoding 35S
rRNA is transcribed by RNA polymerase (Pol) I, whereas the gene encoding 5S
rRNA is transcribed by Pol III (Rusche, Kirchmaier et al. 2003). Due to silencing
at rDNA repeats, Pol II-transcribed reporter genes are repressed when inserted into
rDNA repeats in a Sir2-dependent manner (Gottlieb and Esposito 1989; Fritze,
Verschueren et al. 1997).
The silencing at rDNA repeats is established by a set of factors that is
distinct from that of HM loci or telomeres. It is mediated by the RENT (regulator
of nucleolar silencing and telophase exit) complex consisting of at least three
protein components: Sir2, Net1 and Cdc14 (Huang 2002). Net1 recruits Sir2 to the
nucleolus and is required for silencing (Straight, Shou et al. 1999). However, the
cis-acting elements and other structural components responsible for rDNA
silencing are unresolved (Huang 2002; Rusche, Kirchmaier et al. 2003), and the
detailed mechanism of rDNA silencing remains unclear.
At rDNA repeats, another function of Sir2 is the suppression of intra- and
inter-chromosomal recombination. Recombination within the rDNA repeats forms
9
extrachromosomal rDNA circles (ERCs), which is a cause of aging in yeast
(Sinclair and Guarente 1997). Accumulation of ERCs and a decreased lifespan is
observed in a sir2 mutant (Kaeberlein, McVey et al. 1999). In one model of ERC
suppression, a cohesion clamp complex serves as a bridge between sister
chromatids to suppress unequal rDNA recombination and ERC formation (Reid
and Rothstein 2004). The cohesion bridge at rDNA repeats is formed by a
complex of proteins, including Sir2 (Huang, Brito et al. 2006). Sir2 may
contribute to the proper formation of this complex. Thus, the loss of Sir2 causes
destabilization of the cohesion bridge and an increased rDNA recombination rate.
It is worth noting that the silenced chromatin structure is dynamic. When
uncoupled from its silencer, DNA rings excised from HMR were initially silent but
ultimately reactivated in cell cycle arrested cells, indicating that maintenance of
silencing at HMR continuously requires silencers. Additionally, in the same study,
newly expressed Sir3 was found to be incorporated into the silenced chromatin
(Cheng and Gartenberg 2000). Finally, by using splitomicin as an inhibitor of Sir2,
it was demonstrated that the continuous histone deacetylation activity of Sir2p
was required for maintaining a silenced state in nondividing cells (Bedalov,
Gatbonton et al. 2001). This implies that a stimulus changing Sir2’s deacetylation
activity can cause an effect on chromatin silencing in a dynamic manner.
10
III. Sir2 biochemistry and regulation
To silence chromatin, Sir2’s histone deacetylase activity requires NAD as a
cofactor. Deacetylation is a thermodynamically favorable reaction, and the NAD
requirement is unique to Sir2’s class of histone deacetylases (Denu 2003).
Hydrolysis of the glycosidic bond between the ribose and nicotinamide moiety of
NAD liberates roughly 8.2 Kcal/mol of free energy (Von Zglinicki 2003). It is
therefore puzzling to why Sir2 would consume an NAD molecule for an already
exothermic reaction. One possible explanation is that the NAD dependence allows
regulation of Sir2’s silencing activity through the availability of NAD, which
reflects the cellular redox state. Additionally, the two enzymatic products
generated, O-acetyl-ADP-ribose and nicotinamide, may also be able to facilitate
feedback regulation (Von Zglinicki 2003).
In both yeast and mammals, there are two major NAD biosynthesis
pathways: a denovo pathway and a salvage pathway. The salvage pathway
regenerates NAD from nicotinamide, which can be produced by the
sirtuin-mediated deacetylation reaction (Rusche, Kirchmaier et al. 2003). Genetic
studies in yeast have confirmed that perturbations in NAD pathways can affect
Sir2 activity [reviewed in (Yang and Sauve 2006)]. For example, deletion of NPT1
from the NAD salvage pathway causes a 60% depletion in cellular NAD and a
11
reduction in Sir2 silencing (Smith, Brachmann et al. 2000). Consistently, extra
copies of NPT1 results in a higher level of silencing (Anderson, Bitterman et al.
2002). Deletion of another NAD salvage pathway gene, PNC1, also causes
silencing defects (Sandmeier, Celic et al. 2002). However, no change in global
NAD concentration was observed upon NPT1 overexpression or pnc1 deletion,
suggesting that the change in silencing may be an effect of nicotinamide or other
factors. Nicotinamide is a known inhibitor of Sir2 that may reverse the
deacetylation reaction through the reformation of NAD (Landry, Slama et al. 2000;
Sanders, Zhao et al. 2007). Thus, the potential nicotinamide accumulation in the
strain lacking Pnc1 may be the cause of its loss in Sir2 silencing (Rusche,
Kirchmaier et al. 2003).
Although genetic evidence suggests that perturbations in NAD
biosynthesis pathways can affect Sir2 silencing, it is worth questioning whether
the changes in cellular or nuclear levels of NAD and nicotinamide can be
effectively sensed by Sir2. In yeast, the cellular NAD concentration is typically in
the range of 1 to 2 mM (Evans, Bogan et al. 2010), whereas that in human is
between 400 to 700 μM (Revollo, Grimm et al. 2004). However, the Km for NAD
of yeast and human sirtuins are in the range of 100 to 300 μM, and it is unclear
whether the NAD level fluctuation would significantly affect sirtuin function
12
(Yang and Sauve 2006). One hypothesis is that a high proportion of NAD in cell is
protein-bound. Thus, the freely available NAD concentration is lower than the
determined ones and insufficient to cause rate saturation for sirtuins (Yang and
Sauve 2006). In this case, the fluctuation in cellular NAD concentration could
regulate sirtuins’ function.
On the other hand, the yeast cell’s nicotinamide’s concentration of 10 to
150 μM closely matches the Ki value range for its inhibition of Sir2, 50 to 150 μM
(Sauve, Wolberger et al. 2006). Therefore, changes in cellular nicotinamide level
should be able to affect Sir2’s enzymatic activity. Interestingly, Sir2’s sensitivity
towards nicotinamide inhibition and its affinity towards acetylated substrates alter
when binding to different silencing partner proteins. Thus, the three silencing loci
may respond differently to a change in NAD metabolism (Tanny, Kirkpatrick et al.
2004).
In addition to nicotinamide, the other enzymatic product of Sir2 mediated
deacetylation, O-acetyl-ADP-ribose (O-AADPr), may also regulate Sir protein
silencing. O-AADPr promotes the assembly of the Sir2-4 complex at silenced loci
by recruiting additional Sir3 and altering its conformation (Liou, Tanny et al.
2005). Hence, there may be a positive feedback loop where the production of
O-AADPr through Sir2’s enzymatic activity aids the elongation of the silenced
13
chromatin structure.
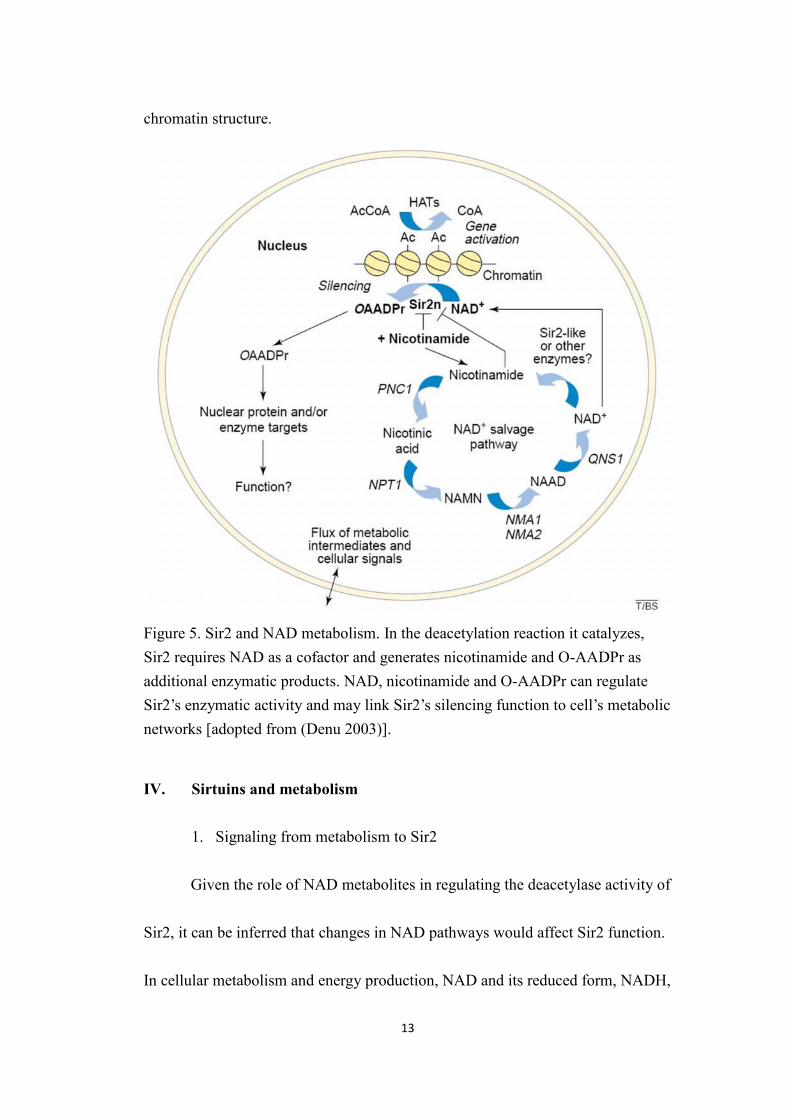
Figure 5. Sir2 and NAD metabolism. In the deacetylation reaction it catalyzes,Sir2 requires NAD as a cofactor and generates nicotinamide and O-AADPr asadditional enzymatic products. NAD, nicotinamide and O-AADPr can regulateSir2’s enzymatic activity and may link Sir2’s silencing function to cell’s metabolicnetworks [adopted from (Denu 2003)].
IV. Sirtuins and metabolism
1. Signaling from metabolism to Sir2
Given the role of NAD metabolites in regulating the deacetylase activity of
Sir2, it can be inferred that changes in NAD pathways would affect Sir2 function.
In cellular metabolism and energy production, NAD and its reduced form, NADH,
14
serve as major hydride-accepting and donating coenzymes (Belenky, Bogan et al.
2007). Different metabolic states of a cell may be reflected by varied
NAD/NADH ratios and discrepancies in other NAD pathways components,
resulting in different levels of Sir2 activity.
Among metabolic treatments, calorie restriction (CR) is extensively
studied due to its ability to extent lifespan in a broad spectrum of life ranging from
yeast to mammals [reviewed in (Guarente and Picard 2005)]. CR is a specific
dietary regime that is modeled in yeast by a reduction of glucose from 2% to 0.5%
in growth media (Lin, Defossez et al. 2000). At least a couple proposed pathways
of CR’s effect on lifespan requires NAD and Sir2 activation [reviewed in (Lu and
Lin 2010)]. In one pathway, CR induces a shift of carbon metabolism from
fermentation towards mitochondria TCA cycle, thereby increasing respiration in
yeast (Lin, Kaeberlein et al. 2002). Mitochondrial respiration regenerates NAD
via NADH oxidation, and the NAD/NADH ratio is balanced between the
mitochondrial and the cytosolic/nuclear pools by an NADH shuttle system
(Bakker, Overkamp et al. 2001). Coherently, a decrease in cellular NADH
concentration was observed as an effect of CR, resulting in a higher NAD/NADH
ratio and elevated Sir2 activity (Lin, Ford et al. 2004). However, since NADH is a
weak inhibitor of Sir2, the change in NAD/NADH ratio without NAD may not be
15
sufficient to greatly alter Sir2 activity (Schmidt, Smith et al. 2004). It is suggested
that there may be specific protein-protein interactions creating higher local
NAD/NADH ratios to activate Sir2 (Lu and Lin 2010).
In the other proposed pathway, the expression level of Pnc1, an enzyme
that deaminates nicotinamide, is up-regulated as a response to CR. As a result,
nicotinamide is depleted and Sir2 is activated (Anderson, Bitterman et al. 2003).
Despite the essential role of Sir2 in both of the models, several life span extension
mechanisms in CR have been found to function independently of Sir2 (Kaeberlein,
Kirkland et al. 2004; Lamming, Latorre-Esteves et al. 2005; Smith, McClure et al.
2007). While the role of Sir2 in life span extension is challenged, a higher Sir2
silencing activity in CR has been reported (Lin, Kaeberlein et al. 2002).
Consistently, a 4-fold increase in NAD/nicotinamide ratio was observed along
with marked elevation of Sirt1 deacetylase activity in the brain of CR mouse (Qin,
Yang et al. 2006). Another study also showed an increased NAD level
accompanied by Sirt1 activation in skeletal muscle cells during CR (Canto, Jiang
et al. 2010). These pieces of evidence demonstrate that the availability of glucose
from the environment may alter NAD metabolism, and eventually, sirtuin’s
transcriptional regulation in a cell.
16
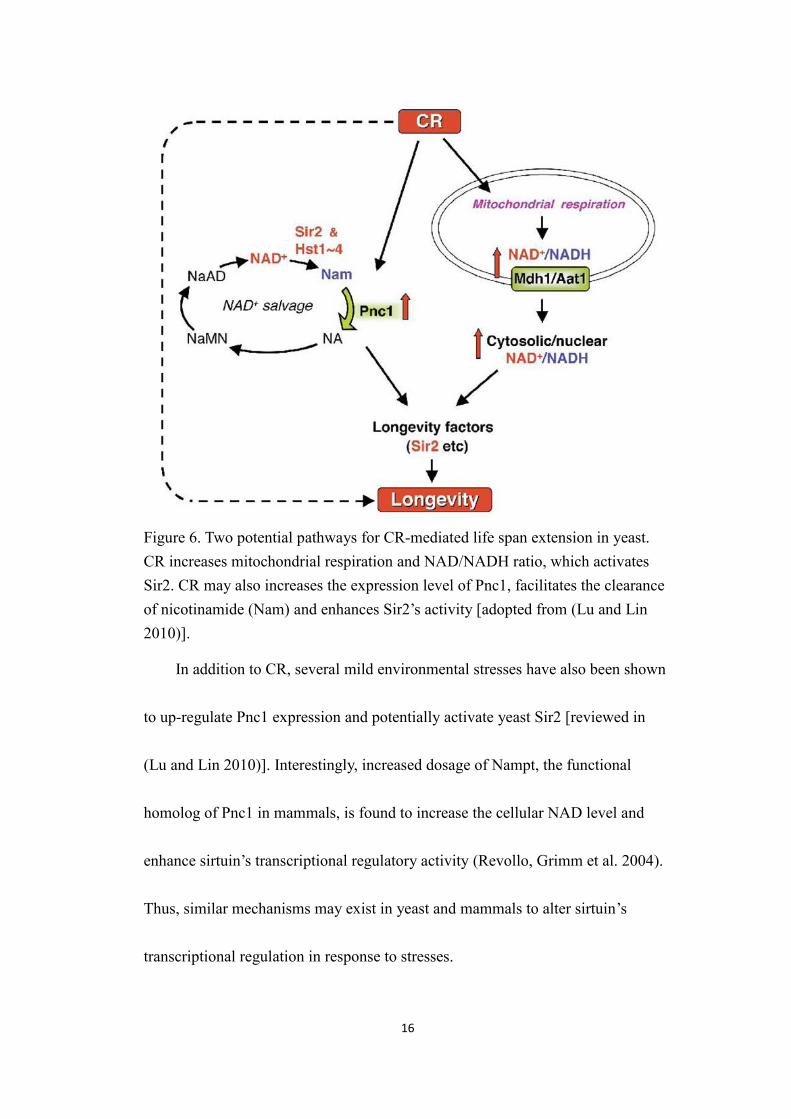
Figure 6. Two potential pathways for CR-mediated life span extension in yeast.CR increases mitochondrial respiration and NAD/NADH ratio, which activatesSir2. CR may also increases the expression level of Pnc1, facilitates the clearanceof nicotinamide (Nam) and enhances Sir2’s activity [adopted from (Lu and Lin2010)].
In addition to CR, several mild environmental stresses have also been shown
to up-regulate Pnc1 expression and potentially activate yeast Sir2 [reviewed in
(Lu and Lin 2010)]. Interestingly, increased dosage of Nampt, the functional
homolog of Pnc1 in mammals, is found to increase the cellular NAD level and
enhance sirtuin’s transcriptional regulatory activity (Revollo, Grimm et al. 2004).
Thus, similar mechanisms may exist in yeast and mammals to alter sirtuin’s
transcriptional regulation in response to stresses.
17
2. Sirtuins as metabolic regulators
Upon sensing the changes in cellular metabolic states, what responses are
elicited by sirtuins? If sirtuins can in turn regulate metabolic pathways, they may
serve key roles in maintaining metabolic homeostasis of a cell under different
conditions. Although there is no concrete evidence demonstrating that yeast Sir2
serve such function, extensive studies in mammalian systems have supported the
role of sirtuins in metabolic control [reviewed in (Haigis and Guarente 2006;
Schwer and Verdin 2008; Yu and Auwerx 2009; Houtkooper, Pirinen et al. 2012)].
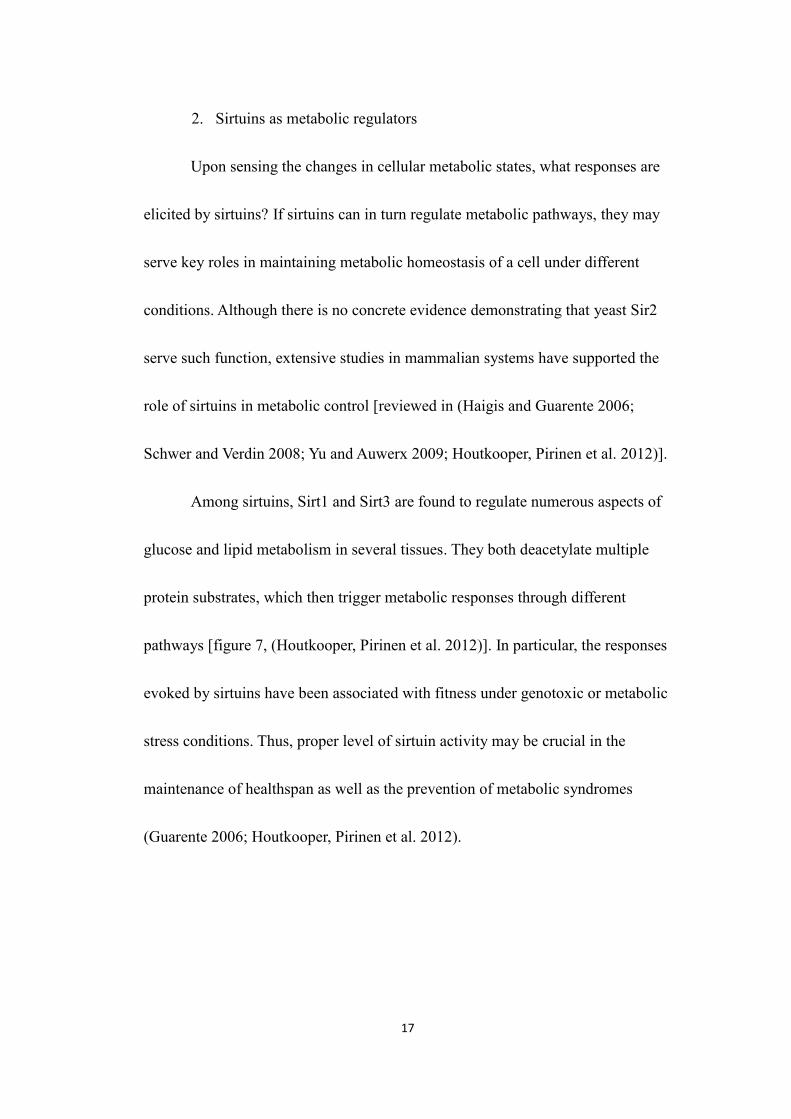
Among sirtuins, Sirt1 and Sirt3 are found to regulate numerous aspects of
glucose and lipid metabolism in several tissues. They both deacetylate multiple
protein substrates, which then trigger metabolic responses through different
pathways [figure 7, (Houtkooper, Pirinen et al. 2012)]. In particular, the responses
evoked by sirtuins have been associated with fitness under genotoxic or metabolic
stress conditions. Thus, proper level of sirtuin activity may be crucial in the
maintenance of healthspan as well as the prevention of metabolic syndromes
(Guarente 2006; Houtkooper, Pirinen et al. 2012).
18
Figure 7. Sirt1 and Sirt3 regulate metabolic response pathways in various tissues[adopted from (Houtkooper, Pirinen et al. 2012)].
A large portion of metabolic enzymes was found to be acetylated in cells
from bacteria (Wang, Zhang et al. 2010) to human liver tissues (Zhao, Xu et al.
2010), and some of them have been identified as sirtuin targets in respective
organisms. It is proposed that protein acetylation, and perhaps sirtuin’s
deacetylase activity, may be a universal mechanism of metabolic regulation (Xu
and Zhao 2011). Considering the potentially conserved function of acetylation,
whether yeast Sir2 can mediate the deacetylation state of metabolic proteins
remains as an intriguing question.
19
V. Sirtuins, mitochondria, and aging
It is worth noting that several metabolic responses elicited by sirtuins
affect mitochondrial function. As an example, Sirt1 deacetylates and activates
PGC-1α, which then up-regulates mitochondrial genes expression and fatty acid
oxidation (Gerhart-Hines, Rodgers et al. 2007). Furthermore, three sirtuins,
Sirt3-5, reside in mitochondria. They directly regulate mitochondria biology,
including metabolism, energy production and signaling [reviewed in (Verdin,
Hirschey et al. 2010; Pereira, Lebiedzinska et al. 2012)].
The relationship between Sir2 and mitochondria function not only ties
transcriptional regulation to energy production in cells, but may also shed light on
cell’s aging mechanism. Mitochondria has long been associated with aging due to
its production of potentially harmful reactive oxygen species (ROS) [reviewed in
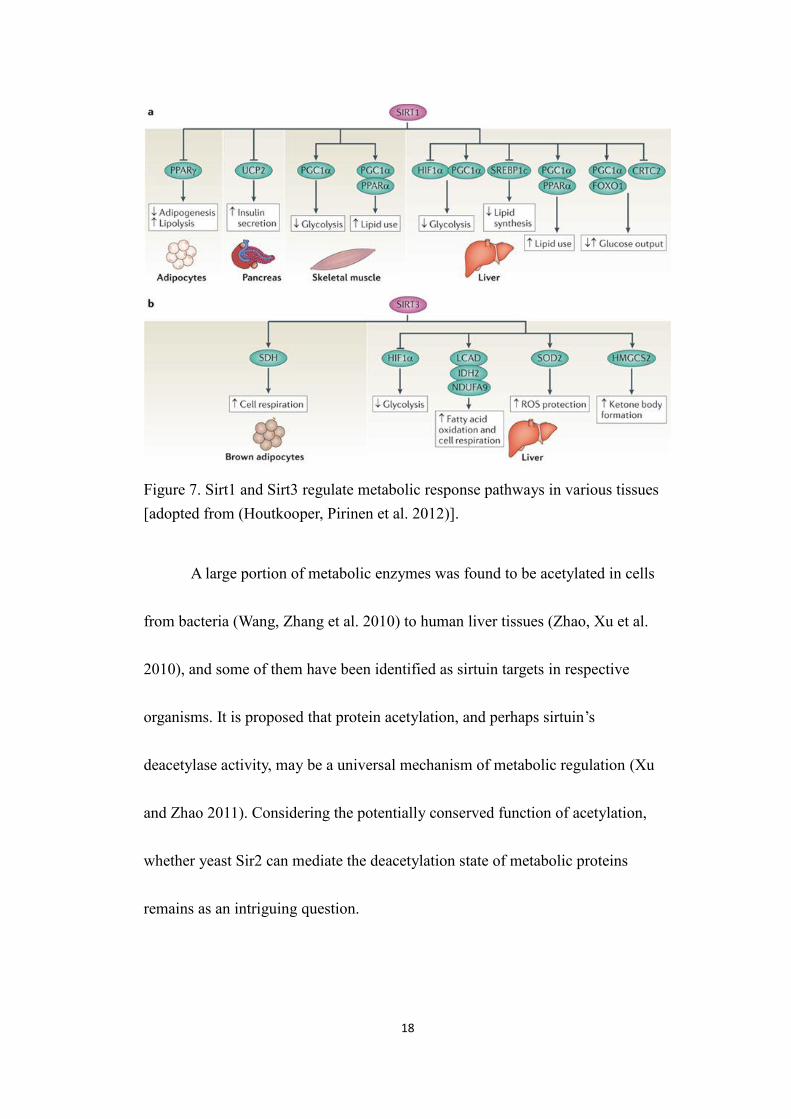
(Balaban, Nemoto et al. 2005)]. Interestingly, in some instances, both
mitochondria and sirtuin activations are essential for CR-mediated lifespan
extension in organisms including yeast and mammals [figure 8, (Guarente 2008)].
The mechanism of how one activation gives rise to the other may be a crucial link
in aging.
20
Figure 8. Possible calorie restriction pathways in different species. In yeast, Sir2 isactivated by mitochondrial changes in response to calorie restriction (CR),whereas the mammalian Sirt1 is implicated upstream of mitochondrial activation[adopted from (Guarente 2008)].
While complex connections have been established between mitochondria
and mammalian sirtuins, yeast Sir2 is associated to mitochondria metabolic states
through solely global NAD/NADH ratio in certain models. Some evidence
suggests a more active role of mitochondria in regulating Sir2. For example, an
increase in mitochondrial DNA reduce the amount of Sir2 bound to the replication
origins of rDNA, accompanied by higher levels of histone acetylation at that
region (Blank, Li et al. 2008). Such effects of mitochondria on Sir2 may not be
satisfactorily explained by changes in global NAD/NADH ratio, implicating that
specific crosstalk mechanisms coordinating mitochondria and Sir2 functions may
also exist in yeast.
21
VI. Goals of this study
Emerging evidence has drawn a connection between Sir2 and metabolism.
Dissecting protein-protein interactions underlying this connection may deepen our
understanding on how Sir2’s transcriptional silencing activity is mediated by a
cell’s metabolic state. In this study, we investigated Sir2’s relationship with three
metabolic proteins that had previously been implicated to regulate Sir2 function.
Among them, Adh1 and Tdh3 are glycolytic proteins that are associated with
NAD metabolism, whereas Mrps12 is a mitochondrial ribosomal protein. We wish
to confirm these proteins’ roles in Sir2 regulation, and further characterize the
mechanisms of their interactions with Sir2.
22
MATERIAL AND METHODS
I. Plasmids, Strains, and Primers
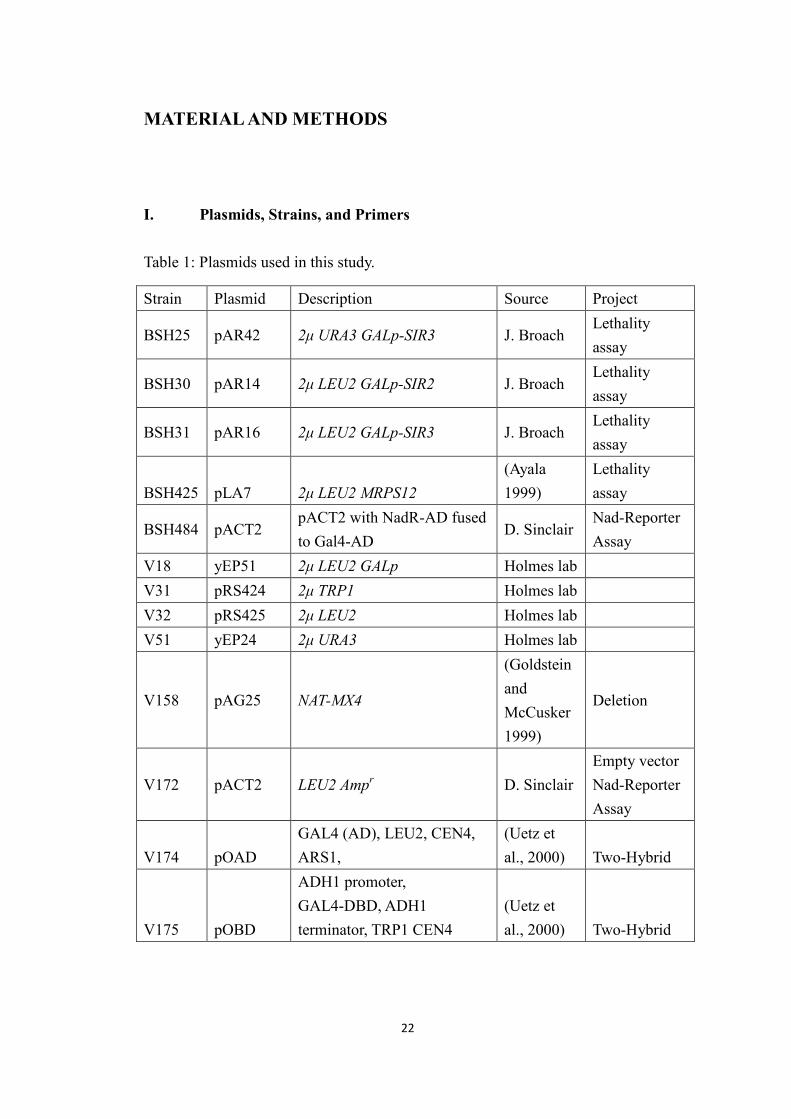
Table 1: Plasmids used in this study.
Strain Plasmid Description Source Project
BSH25 pAR42 2μ URA3 GALp-SIR3 J. BroachLethalityassay
BSH30 pAR14 2μ LEU2 GALp-SIR2 J. BroachLethalityassay
BSH31 pAR16 2μ LEU2 GALp-SIR3 J. BroachLethalityassay
BSH425 pLA7 2μ LEU2 MRPS12(Ayala1999)
Lethalityassay
BSH484 pACT2pACT2 with NadR-AD fusedto Gal4-AD
D. SinclairNad-ReporterAssay
V18 yEP51 2μ LEU2 GALp Holmes labV31 pRS424 2μ TRP1 Holmes labV32 pRS425 2μ LEU2 Holmes labV51 yEP24 2μ URA3 Holmes lab
V158 pAG25 NAT-MX4
(GoldsteinandMcCusker1999)
Deletion
V172 pACT2 LEU2 Ampr D. SinclairEmpty vectorNad-ReporterAssay
V174 pOADGAL4 (AD), LEU2, CEN4,ARS1,
(Uetz etal., 2000) Two-Hybrid
V175 pOBD
ADH1 promoter,GAL4-DBD, ADH1terminator, TRP1 CEN4
(Uetz etal., 2000) Two-Hybrid
23
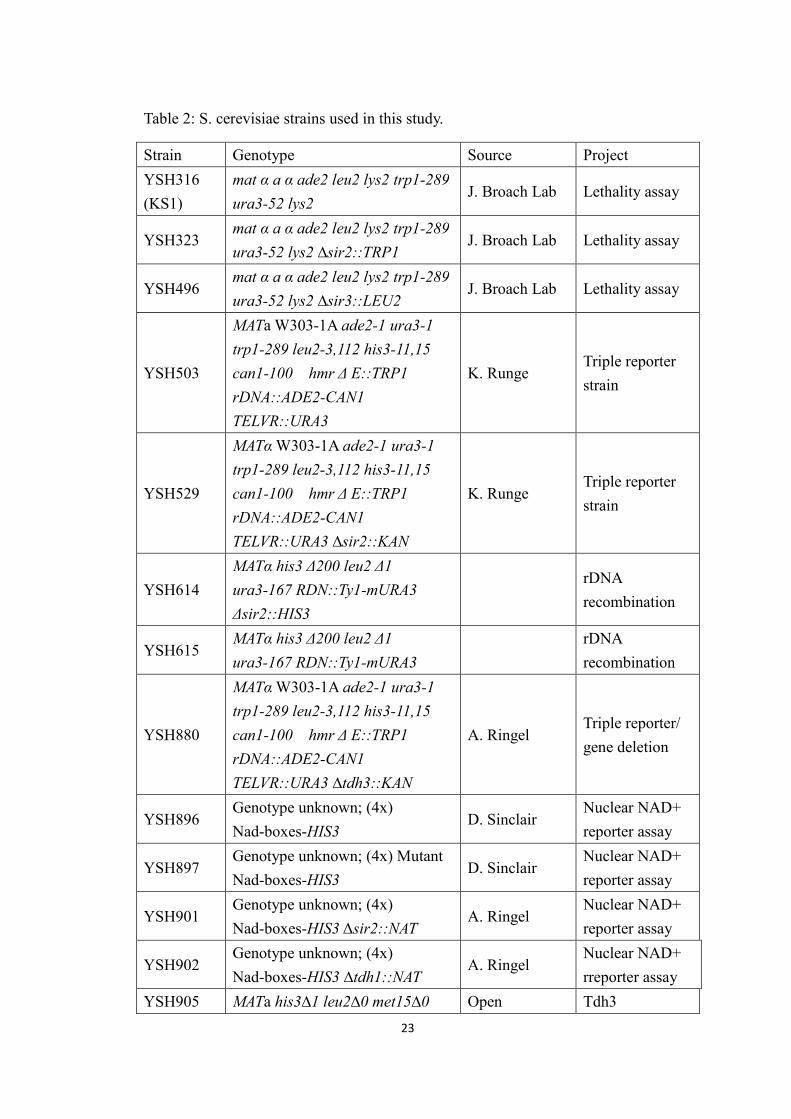
Table 2: S. cerevisiae strains used in this study.
Strain Genotype Source ProjectYSH316(KS1)
mat α a α ade2 leu2 lys2 trp1-289ura3-52 lys2
J. Broach Lab Lethality assay
YSH323mat α a α ade2 leu2 lys2 trp1-289ura3-52 lys2 ∆sir2::TRP1
J. Broach Lab Lethality assay
YSH496mat α a α ade2 leu2 lys2 trp1-289ura3-52 lys2 ∆sir3::LEU2
J. Broach Lab Lethality assay
YSH503
MATa W303-1A ade2-1 ura3-1trp1-289 leu2-3,112 his3-11,15can1-100 hmr Δ E::TRP1rDNA::ADE2-CAN1TELVR::URA3
K. RungeTriple reporterstrain
YSH529
MATα W303-1A ade2-1 ura3-1trp1-289 leu2-3,112 his3-11,15can1-100 hmr Δ E::TRP1rDNA::ADE2-CAN1TELVR::URA3 ∆sir2::KAN
K. RungeTriple reporterstrain
YSH614MATα his3 Δ200 leu2 Δ1ura3-167 RDN::Ty1-mURA3Δsir2::HIS3
rDNArecombination
YSH615MATα his3 Δ200 leu2 Δ1ura3-167 RDN::Ty1-mURA3
rDNArecombination
YSH880
MATα W303-1A ade2-1 ura3-1trp1-289 leu2-3,112 his3-11,15can1-100 hmr Δ E::TRP1rDNA::ADE2-CAN1TELVR::URA3 ∆tdh3::KAN
A. RingelTriple reporter/gene deletion
YSH896Genotype unknown; (4x)Nad-boxes-HIS3
D. SinclairNuclear NAD+reporter assay
YSH897Genotype unknown; (4x) MutantNad-boxes-HIS3
D. SinclairNuclear NAD+reporter assay
YSH901Genotype unknown; (4x)Nad-boxes-HIS3 Δsir2::NAT
A. RingelNuclear NAD+reporter assay
YSH902Genotype unknown; (4x)Nad-boxes-HIS3 ∆tdh1::NAT
A. RingelNuclear NAD+rreporter assay
YSH905 MATa his3∆1 leu2∆0 met15∆0 Open Tdh3
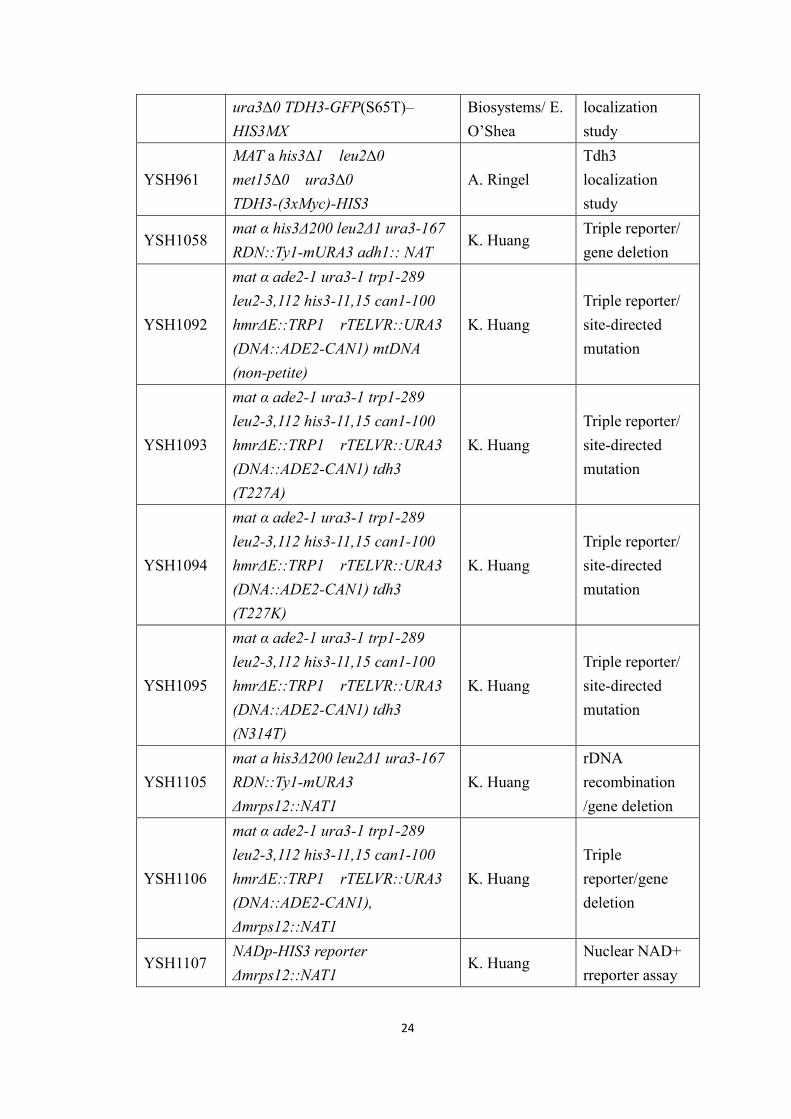
24
ura3∆0 TDH3-GFP(S65T)–HIS3MX
Biosystems/ E.O’Shea
localizationstudy
YSH961MAT a his3∆1 leu2∆0met15∆0 ura3∆0TDH3-(3xMyc)-HIS3
A. RingelTdh3localizationstudy
YSH1058mat α his3Δ200 leu2Δ1 ura3-167RDN::Ty1-mURA3 adh1:: NAT
K. HuangTriple reporter/gene deletion
YSH1092
mat α ade2-1 ura3-1 trp1-289leu2-3,112 his3-11,15 can1-100hmrΔE::TRP1 rTELVR::URA3(DNA::ADE2-CAN1) mtDNA(non-petite)
K. HuangTriple reporter/site-directedmutation
YSH1093
mat α ade2-1 ura3-1 trp1-289leu2-3,112 his3-11,15 can1-100hmrΔE::TRP1 rTELVR::URA3(DNA::ADE2-CAN1) tdh3(T227A)
K. HuangTriple reporter/site-directedmutation
YSH1094
mat α ade2-1 ura3-1 trp1-289leu2-3,112 his3-11,15 can1-100hmrΔE::TRP1 rTELVR::URA3(DNA::ADE2-CAN1) tdh3(T227K)
K. HuangTriple reporter/site-directedmutation
YSH1095
mat α ade2-1 ura3-1 trp1-289leu2-3,112 his3-11,15 can1-100hmrΔE::TRP1 rTELVR::URA3(DNA::ADE2-CAN1) tdh3(N314T)
K. HuangTriple reporter/site-directedmutation
YSH1105mat a his3Δ200 leu2Δ1 ura3-167RDN::Ty1-mURA3Δmrps12::NAT1
K. HuangrDNArecombination/gene deletion
YSH1106
mat α ade2-1 ura3-1 trp1-289leu2-3,112 his3-11,15 can1-100hmrΔE::TRP1 rTELVR::URA3(DNA::ADE2-CAN1),Δmrps12::NAT1
K. HuangTriplereporter/genedeletion
YSH1107NADp-HIS3 reporterΔmrps12::NAT1
K. HuangNuclear NAD+rreporter assay
25
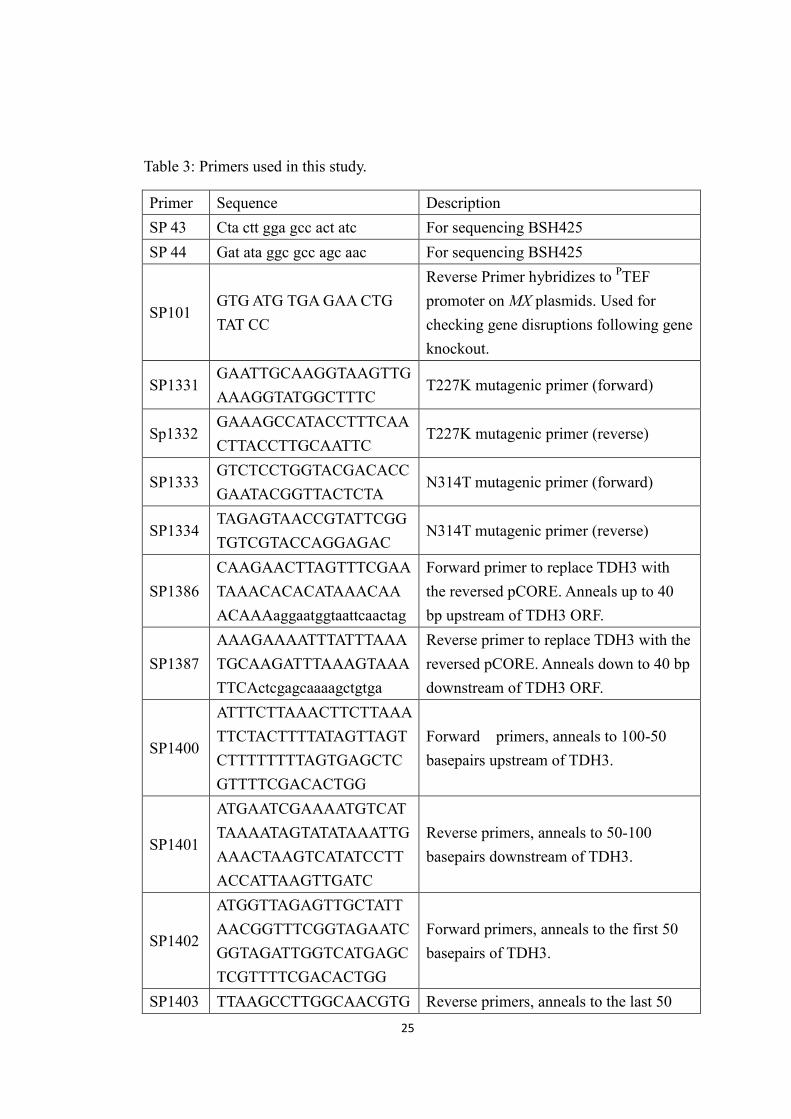
Table 3: Primers used in this study.
Primer Sequence DescriptionSP 43 Cta ctt gga gcc act atc For sequencing BSH425SP 44 Gat ata ggc gcc agc aac For sequencing BSH425
SP101GTG ATG TGA GAA CTGTAT CC
Reverse Primer hybridizes to PTEFpromoter on MX plasmids. Used forchecking gene disruptions following geneknockout.
SP1331GAATTGCAAGGTAAGTTGAAAGGTATGGCTTTC
T227K mutagenic primer (forward)
Sp1332GAAAGCCATACCTTTCAACTTACCTTGCAATTC
T227K mutagenic primer (reverse)
SP1333GTCTCCTGGTACGACACCGAATACGGTTACTCTA
N314T mutagenic primer (forward)
SP1334TAGAGTAACCGTATTCGGTGTCGTACCAGGAGAC
N314T mutagenic primer (reverse)
SP1386CAAGAACTTAGTTTCGAATAAACACACATAAACAAACAAAaggaatggtaattcaactag
Forward primer to replace TDH3 withthe reversed pCORE. Anneals up to 40bp upstream of TDH3 ORF.
SP1387AAAGAAAATTTATTTAAATGCAAGATTTAAAGTAAATTCActcgagcaaaagctgtga
Reverse primer to replace TDH3 with thereversed pCORE. Anneals down to 40 bpdownstream of TDH3 ORF.
SP1400
ATTTCTTAAACTTCTTAAATTCTACTTTTATAGTTAGTCTTTTTTTTAGTGAGCTCGTTTTCGACACTGG
Forward primers, anneals to 100-50basepairs upstream of TDH3.
SP1401
ATGAATCGAAAATGTCATTAAAATAGTATATAAATTGAAACTAAGTCATATCCTTACCATTAAGTTGATC
Reverse primers, anneals to 50-100basepairs downstream of TDH3.
SP1402
ATGGTTAGAGTTGCTATTAACGGTTTCGGTAGAATCGGTAGATTGGTCATGAGCTCGTTTTCGACACTGG
Forward primers, anneals to the first 50basepairs of TDH3.
SP1403 TTAAGCCTTGGCAACGTG Reverse primers, anneals to the last 50
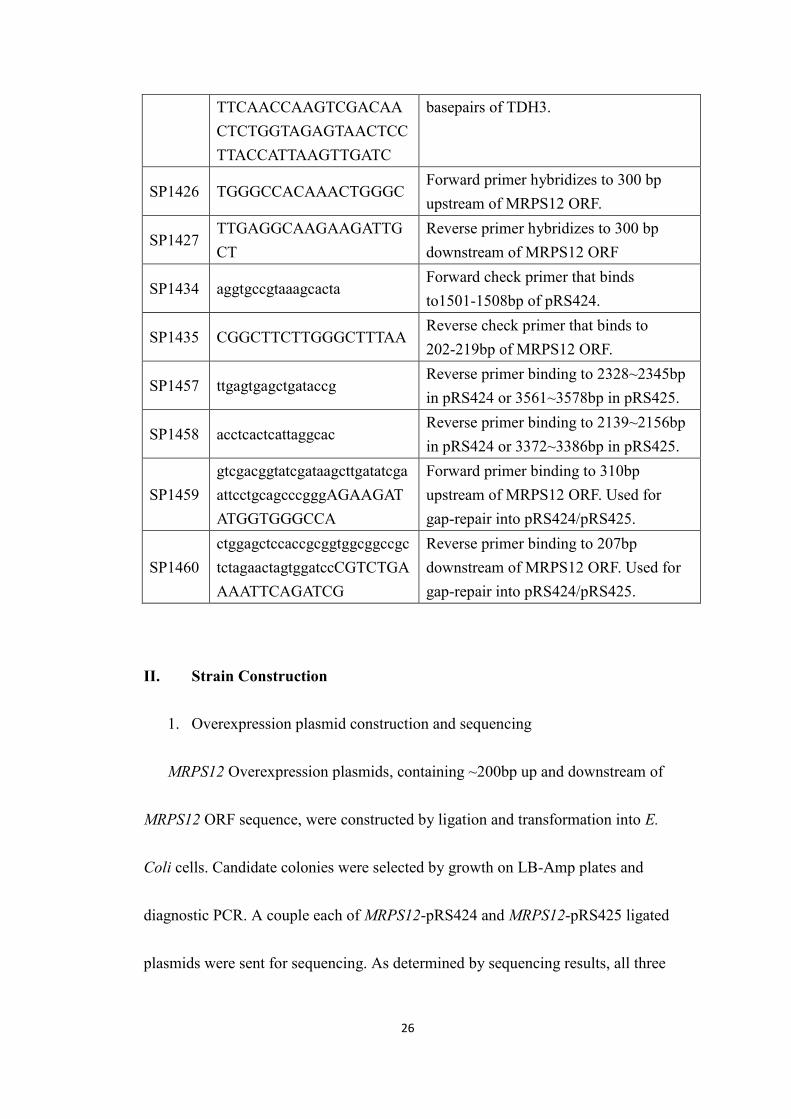
26
TTCAACCAAGTCGACAACTCTGGTAGAGTAACTCCTTACCATTAAGTTGATC
basepairs of TDH3.
SP1426 TGGGCCACAAACTGGGCForward primer hybridizes to 300 bpupstream of MRPS12 ORF.
SP1427TTGAGGCAAGAAGATTGCT
Reverse primer hybridizes to 300 bpdownstream of MRPS12 ORF
SP1434 aggtgccgtaaagcactaForward check primer that bindsto1501-1508bp of pRS424.
SP1435 CGGCTTCTTGGGCTTTAAReverse check primer that binds to202-219bp of MRPS12 ORF.
SP1457 ttgagtgagctgataccgReverse primer binding to 2328~2345bpin pRS424 or 3561~3578bp in pRS425.
SP1458 acctcactcattaggcacReverse primer binding to 2139~2156bpin pRS424 or 3372~3386bp in pRS425.
SP1459gtcgacggtatcgataagcttgatatcgaattcctgcagcccgggAGAAGATATGGTGGGCCA
Forward primer binding to 310bpupstream of MRPS12 ORF. Used forgap-repair into pRS424/pRS425.
SP1460ctggagctccaccgcggtggcggccgctctagaactagtggatccCGTCTGAAAATTCAGATCG
Reverse primer binding to 207bpdownstream of MRPS12 ORF. Used forgap-repair into pRS424/pRS425.
II. Strain Construction
1. Overexpression plasmid construction and sequencing
MRPS12 Overexpression plasmids, containing ~200bp up and downstream of
MRPS12 ORF sequence, were constructed by ligation and transformation into E.
Coli cells. Candidate colonies were selected by growth on LB-Amp plates and
diagnostic PCR. A couple each of MRPS12-pRS424 and MRPS12-pRS425 ligated
plasmids were sent for sequencing. As determined by sequencing results, all three
27
MRPS12 overexpression plasmids used in this study, including BSH425
constructed by Laura Ayala, contained the correct MRPS12 sequence.
2. Creation of gene deletion, site-directed mutation and overexpression
strains
Strains with gene deletions were constructed using PCR-based gene
disruption. For null mutants, marker genes (natMX6 conferring nourseothricin
resistance) were amplified using PCR. The amplified DNA fragments were
transformed into the yeast strain. The cells were left overnight and then plated on
selective media. Candidate knockout mutants were screened by diagnostic PCR.
Strains with site-directed mutations were constructed in a similar manner. The
DNA fragments with site-directed mutations were generated using hybrid PCR.
Overexpression strains were created by transforming 2μ plasmids that contain the
genes of interest into strains and selecting for growth on selective plates.
III. Petite strain verification
Control petite strains were selected from slow growing colonies on a
wild-type streaked-out plate. The candidates were verified by their inability to
grow on glycerol plates, showing the lack of respiration. All Δmrps12 strains were
also verified to be petite through this method after gene deletion.
28
IV. Serial Dilution Assays
For all serial dilution assays, the optical density of the 2 mL cultures was
measured at 600nm (OD600). Then, the cultures were diluted with water to
achieve equal optical densities in the first column of a 96-well plate, with a total
volume of 200 μL. All other wells were filled with 180 μL of water. 20 μL of
culture was transferred to each successive cell, corresponding to a 10-fold serial
dilution. Dilutions were carried out 5 times. A frogger or multi-channel pipette
was used to spot 5μL of the culture from each well onto the selective plate. The
assay is carried out in duplicate or triplicate. Plates were incubated at 30C for
2-5days and scanned. Images shown in this study were adjusted in contrast and
brightness levels through Adobe Photoshop or Microsoft Word.
1. Lethality assay
YSH316 (KS1) background series of strains were grown for one to two days
at 30C in 2 mLs of raffinose selective media. The cells were plated onto a control
selective SDC plate and a galactose-added plate lacking specific amino acids that
is included in the plasmids’ markers. The transition from raffinose to galactose
media allows the proper induction of the GAL promoter.
29
2. Sir -mediated silencing assay
In strains containing reporter genes integrated at Sir-silenced loci, serial
dilution assays were performed to visualize growth phenotypes and determine the
strength of silencing. YSH503 was used the wild type strain with URA3 integrated
at the telomere of chromosome V and TRP1 integrated at HMR. The cells are
spotted as described above for the lethality assay. SDC plates are used as controls,
whereas SDC-Ura plates were used to select for strains with loss of repressionat
the telomeres. 5’-fluoroorotic acid (FOA) selects against strains with increased
telomeric expression.
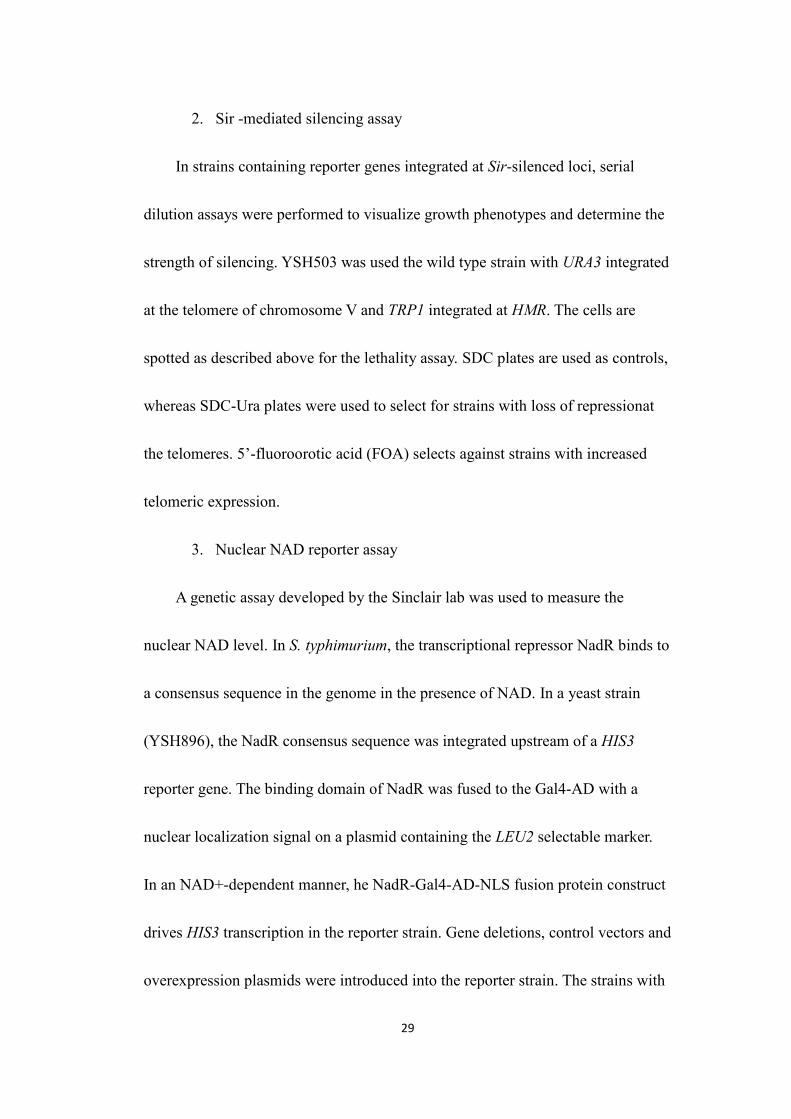
3. Nuclear NAD reporter assay
A genetic assay developed by the Sinclair lab was used to measure the
nuclear NAD level. In S. typhimurium, the transcriptional repressor NadR binds to
a consensus sequence in the genome in the presence of NAD. In a yeast strain
(YSH896), the NadR consensus sequence was integrated upstream of a HIS3
reporter gene. The binding domain of NadR was fused to the Gal4-AD with a
nuclear localization signal on a plasmid containing the LEU2 selectable marker.
In an NAD+-dependent manner, he NadR-Gal4-AD-NLS fusion protein construct
drives HIS3 transcription in the reporter strain. Gene deletions, control vectors and
overexpression plasmids were introduced into the reporter strain. The strains with
30
different combination of plasmids and gene deletions were spotted on
SDC-Trp-Leu plates as controls, and SDC-Trp-Leu-His plates as the experimental
group. The extent of growth on the SDC-Trp-Leu-His plates reflects the level of
freely available nuclear NAD.
Figure 8. Nuclear NAD reporter strain [adopted from (Anderson, Latorre-Esteves
et al. 2003)].
4. Oxidative stress assay
Plates were made with 0, 0.5, 1, 1.5 and 2mM of H2O2, and wrapped
with foils to avoid H2O2 degredation. Cells were grown overnight at 30C before
plating onto the H2O2 plates.
31
5. Two-hybrid assay
The yeast strain YSH625 lacking Sir2, Sir3, and Sir4 was used for the
two-hybrid assay. The combinationsof MRPS12BD/ SIR2AD or MRPS12AD/
SIR2BD were constructed by gap-repair during subsequent yeast transformations.
The transformants were checked for the proper bait gene and BD fusion, or the
prey gene and AD fusion using PCR. Verified colonies were plated onto
SDC-Trp-Leu plates as control plates, and SDC-Trp-Leu-His plates as the
experimental groups.
V. Fluorescence microscopy
Semisquash preparations were adapted from (Fuchs and Loidl 2004)with
minor modifications. Cultures were grown to log phase (OD600 ~0.5), and freshly
prepared paraformaldehyde was added to the cultures to a final concentration of
4%. Fixation was carried out for 1 hour at room temperature. After fixation using
paraformaldehyde, the cells were washed with 1 ml of 1% KAc/1M sorbitol
solution (2 krpm using a Sorvall RT6000B for 4 min). Next, to spheroplast the
cells, the pellet was resuspended in 500 µl 1% KAc/1M sorbitol solution,
containing 10 µl 1M dithiothreitol, and 20 µl of 10mg/ml Zymolyase 20T. After
approximately 30 minutes incubation at 37°C, digestion was stopped by adding
32
500 µl stop solution (0.1 M 2-(N-morpholino) ethane acid (MES), 1 mM EDTA,
0.5 mM MgCl2, 1 M sorbitol in distilled water). Cells were then collected by
centrifugation and the pellets were washed in 1 ml stop solution. Cell pellets were
resuspended in 80 µl cold MES solution (0.1 M 2-(N-morpholino) ethane acid, 1
mM EDTA, 0.5 mM MgCl2) and 200 µl of fixative (4% paraformaldehyde pH 8)
was added. The fixed cells were spread over a glass slide. Afterwards, slides were
mounted with mounting solution containing 1mg/ml DAPI. The coverslips were
laid on glass slides and sealed using nail varnish. The combination of Softworx
software and the Deltavision RT imaging system (Applied Precision) adapted to
an Olympus (IX70) microscope was used to acquire images of the Tdh3-GFP
construct and DAPI staining.
VI. rDNA recombination rate measurements
The rate of recombination at the rDNA repeats was measured by
quantifying the loss rate of the mURA3 reporter gene integrated into the rDNA
repeats in YSH615 series of strains. Before the assay, cells were freshly
streaked-out for 2-4 days on SDC-ura at 30C. Single colonies were picked to
start a 20 mL YPD culture. The cell concentration was estimated through a cell
count. Cultures were diluted to a concentration of 1cell/L with water and an
33
estimated 20 and 200 cells were plated on SDC plates for each strain. The YPD
cultures were then incubated at 30C for 2 days.
The number of colonies on the SDC plate was counted after incubating at
30C for 2-3 days. This is used to correct for the concentration of cells estimated
by the cell count. Then replica plates were made onto SDC-ura. The SDC-Ura
plates were incubated at 30C for 1-2 days, and the fraction of colonies showing
growth on the –Ura plate and retaining the mURA3 reporter recorded. After
two-day incubation, 2 L of the liquid YPD cultures was diluted in 20mLs fresh
YPD and returned to the incubator at 30C. The number of cells/mL was
estimated as 1x10⁸, and diluted by a factor 105 in water to achieve a final
concentration of ~1cell/ L. Approximately 20 and 200 cells were plated per
strain on SDC and allowed to grow at 30C for 2-3 days. Again, the number of
colonies per plate was counted. This procedure was repeated for six to seven
platings cycles. The final SDC plates were relica-plated onto the SDC-ura plate.
Again, the fraction of cells retaining the mURA3 reporter gene calculated. The
recombination rate was calculated as described:
For each cycle of culture:
F0, Ff = cell density at T = 0 and T = 48, T = 48 and T = 96, etc.
= (# colonies)/( # cells plated * estimated cells per mL)
34
N = number of generations between each cycle of cultures
= ln(F0/Ff)/ ln(2) over each consecutive time interval
For the final calculation of recombination rate:
Ip, Fp = Initial, final percentage of mURA3 reporter gene bearing cells
= (# colonies on SDC)/ (# colonies on replica SDC-ura)
R = recombination rate/ rate of URA3 loss
= 1 – (Fp/Ip)^(1/N)
VII. Western Blotting
Western blots were performed to determine the Sir2 protein levels. Cells
were grown to equal OD log phase (OD600 ~0.8) in a 10mL culture. Cells were
pelleted and the supernatant was removed. The cell pellet was resuspended in 1mL
ice cold 20% TCA, which was moved to an Eppendorf tube. Again, the cells were
pelleted and resuspended in 0.5mL 20% TCA. Glass beads were added to equal
volume and vortexed four times at 4C for 30 seconds each. The cell lysate
(supernatant) was removed to a new Eppendorf tube. The beads were washed
twice with 0.5mL of 5% TCA, and the washes were combined with the lysate.
The precipitated protein from the combined lysate and washes was spin down in a
microcentrifuge (Eppendorf 5415C model at 4C for 10 minutes at 14krpm).
35
After discarding the supernatant, the pellet was resuspended in 200L sample
buffer (50mM Tris-HCl pH 6.8, 2% SDS, 10% glycerol, 0.1% bromophenol blue,
0.05% -mercaptoethanol) and 50L 2M TRIS (unpH-ed). The samples were
boiled for five minutes (100C) followed by a Bradford assay (see section I:
Measurement of GAPDH Activity) to quantify protein concentration.
SDS-polyacrylamide gel electrophoresis (SDS-PAGE) was performed on the
protein samples to resolve the Tdh3-myc construct; a 10% running gel and 5%
stacking gel were selected. An equal quantity of protein from each sample was
loaded onto the gel, along with a biotinylated ladder (1.5L Biorad Biotinylated
SDS-PAGE Standards Broad Range diluted in 8.5L 1X sample buffer and boiled
prior to loading) and a rainbow marker (10L Biorad Prestained Standard Broad
Range boiled prior to loading). The gel tank was filled with 1X SDS-running
buffer (25mM Tris base, 250mM glycine pH 8.3, 0.1% SDS) and run at constant
30mA until the dye front reached the bottom of the gel. The proteins were
transferred to a nitrocellulose membrane using a Hoefer TE 70 Series SemiPhor
Semi-Dry Transfer Unit (Amershan Biosciences); the nitrocellulose membrane
(soaked in dH2O) was sandwiched between Whatman blotting paper (soaked in
1X Towbin buffer: 25mM Tris pH 8.8, 192mM glycine with 20% (v/v) methanol)
before transfer, which was carried out at 40mA for 1.5 hours. The nitrocellulose
36
membranes were blocked in 5% nonfat dry milk dissolved in 1X TBS + 0.10%
Tween (20mM Tris pH 7.5, 150mM NaCl, 0.10% Tween-20) overnight at 4C.
Primary antibody was applied at room temperature for one hour at room
temperature in 1X TBS + 0.10% Tween + 5% non-fat dry milk at a 1:100 dilution.
Membranes were washed four times in 1X TBS +0.10% Tween. A secondary
antibody was applied in 1X TBS + 0.10% Tween + 5% non-fat dry milk at 1:4000
dilution for one hour at room temperature. The membrane was subsequently
washed four times with 1X TBS + 0.10% Tween. Detection was performed using
the ECL Western Blotting Reagants from Amersham.
37
RESULTS
Sir2, a NAD-dependent histone deacetylase, is speculated to connect the
distinct cellular functions of metabolism and transcriptional silencing. To further
investigate the connection between Sir2 and cellular metabolic states, this study
examined the relationships of Sir2 and three metabolic proteins: Adh1, Tdh3 and
Mrps12. We utilized molecular genetic techniques to confirm their role in
Sir2-mediated transcriptional silencing. In order to understand how cell
metabolism communicates with transcriptional regulation, we also tested some
potential mechanisms of Sir2 regulation by each of these proteins.
I. Adh1
Alcohol dehydrogenase 1 (Adh1) regenerates NAD through catalyzing the
conversion of acetaldehyde to ethanol in the last step of glycolysis. A yeast strain
carrying an extra copy of the ADH1 gene (2XADH1) showed a 20% rise in
cellular NAD/NADH ratio, as well as an increased telomere VII silencing in a
Sir2-dependent manner (Reverter-Branchat, Cabiscol et al. 2007). Additionally,
Adh1 is found to be in a same multi-protein complex with Sir2 by a large-scale
affinity capture study (Gavin, Bosche et al. 2002). This evidence suggests a
38
potential role of Adh1 in regulating Sir2 silencing, possibly through NAD
metabolism.
1. Δadh1 mutant exhibits silencing defects at telomeres
To further investigate the relationship between Adh1 and Sir2, the effect of
adh1∆ on Sir2 silencing was studied. We deleted ADH1 gene in a strain carrying
reporter genes that are integrated into two separate silenced loci in yeast: TRP1 at
HMR and URA3 at telomere V. The loss of silencing at these loci is reflected by
the transcription of the reporter genes, which can be assessed by cell growth in
plates lacking respective amino acids. When silencing is lost at HMR, the
expression of TRP1 reporter gene allows better cell growth on SDC-Trp plates.
Similarly, when silencing is lost at telomeres, URA3 is expressed and the cell
grows on SDC-Ura plates. 5’-fluoroorotic acid (FOA) mimics a uracil precursor
and it is converted into a toxic compound by the URA3 gene product. Thus, in
contrast to the SDC-Ura plates, viability on FOA plates indicates the presence of
telomeric silencing. In each of the plates, the sir2∆ mutant provides a reference
point that shows a complete absence of Sir-mediated transcriptional silencing.
Upon the deletion of ADH1, cells grew at a decreased rate and formed
smaller colonies. The adh1∆ mutant showed similar reduction of growth on SDC
and SDC-Trp plates. Hence, adh1 deletion does not induce a significant effect in
39
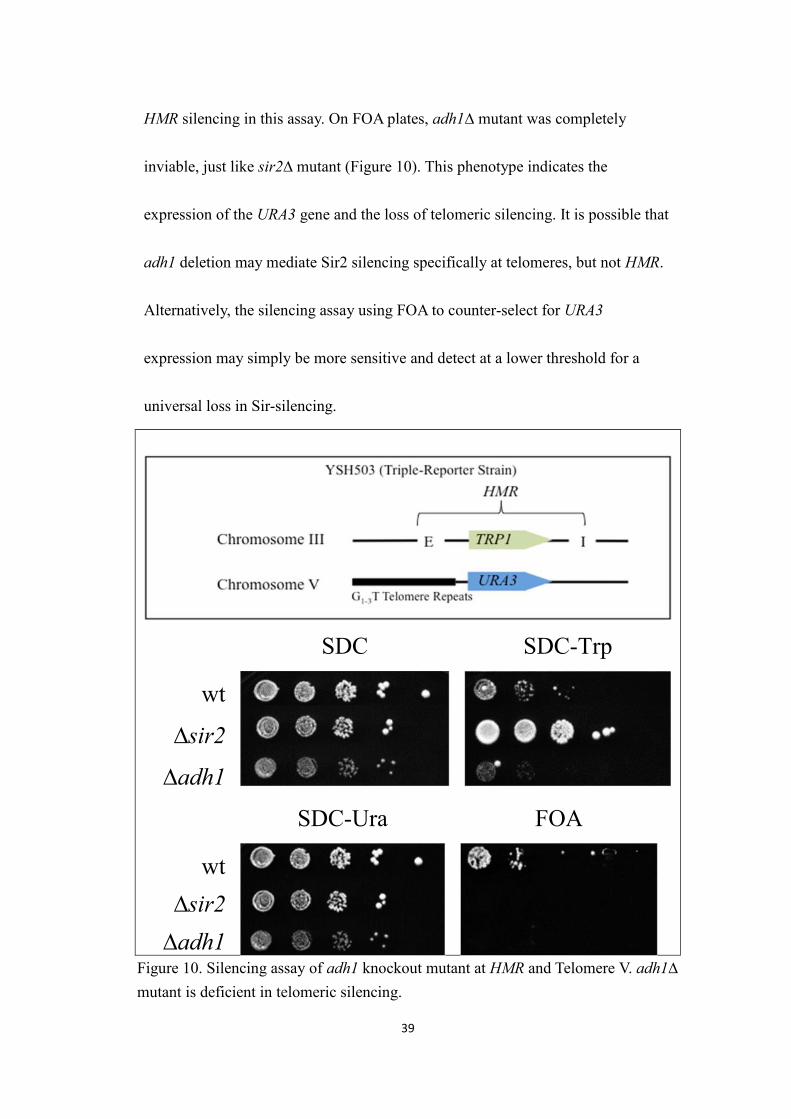
HMR silencing in this assay. On FOA plates, adh1∆ mutant was completely
inviable, just like sir2∆ mutant (Figure 10). This phenotype indicates the
expression of the URA3 gene and the loss of telomeric silencing. It is possible that
adh1 deletion may mediate Sir2 silencing specifically at telomeres, but not HMR.
Alternatively, the silencing assay using FOA to counter-select for URA3
expression may simply be more sensitive and detect at a lower threshold for a
universal loss in Sir-silencing.
SDC SDC-Trp
wt
∆sir2
∆adh1
SDC-Ura FOA
wt∆sir2
∆adh1Figure 10. Silencing assay of adh1 knockout mutant at HMR and Telomere V. adh1∆mutant is deficient in telomeric silencing.
40
2. Δadh1 mutant exhibits lower tolerance to oxidative stress
In addition to the silencing phenotype, 2XADH1 cells exhibited higher
oxidative and heat stress resistance due to increased activities of antioxidant
enzymes, including catalase and superoxide dismutases. The rise in stress
resistance and catalase activity was abolished upon sir2∆, indicating that Sir2 is
required for these effects (Reverter-Branchat, Cabiscol et al. 2007). The elevated
resistance in 2XADH1 cells is consistent with the finding that 2XSIR2 cells are
more resistant when subject to heat shock (Anderson, Bitterman et al. 2002).
Interestingly, another previous report has shown that the deletion of SIR2 actually
increases cells’ oxidative stress resistance (Fabrizio, Gattazzo et al. 2005). Taking
together these earlier findings, additional Sir2 activity and sir2∆ may activate
separate pathways to induce stress resistance. Determining the effect of adh1∆ on
oxidative stress resistance may not only help us understand the interactive nature
of Adh1 and Sir2, but also indirectly clarify Sir2’s role in stress resistance.
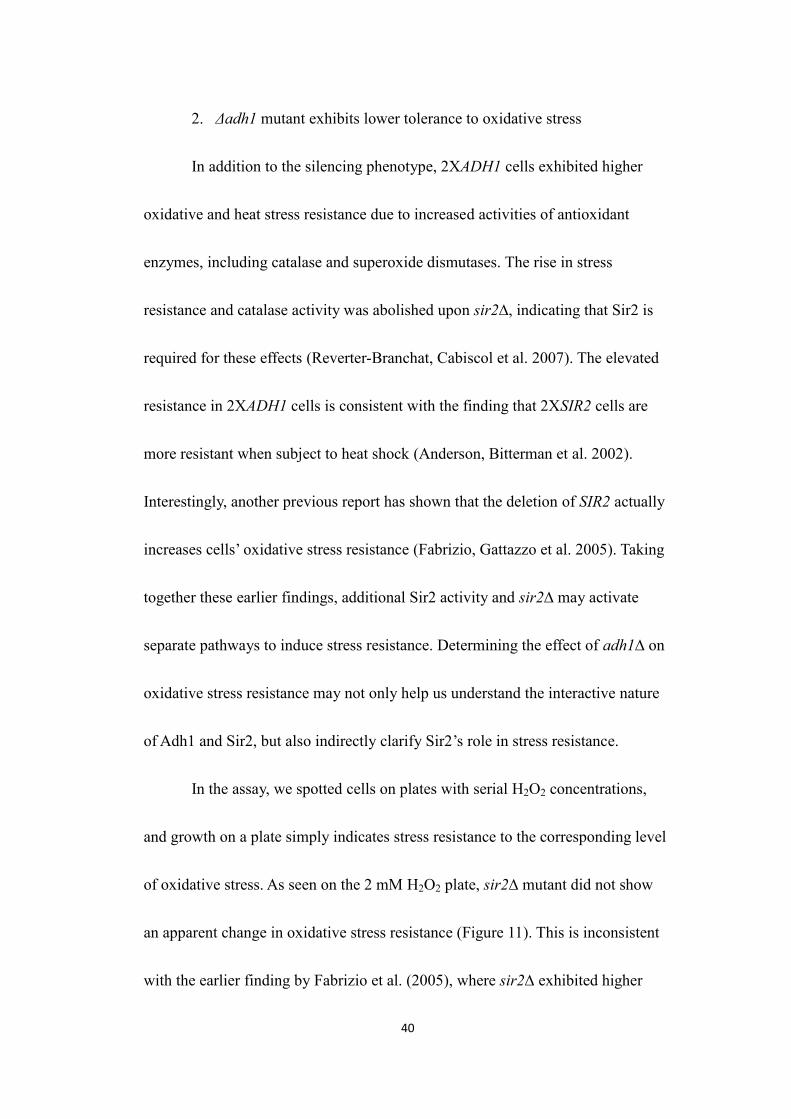
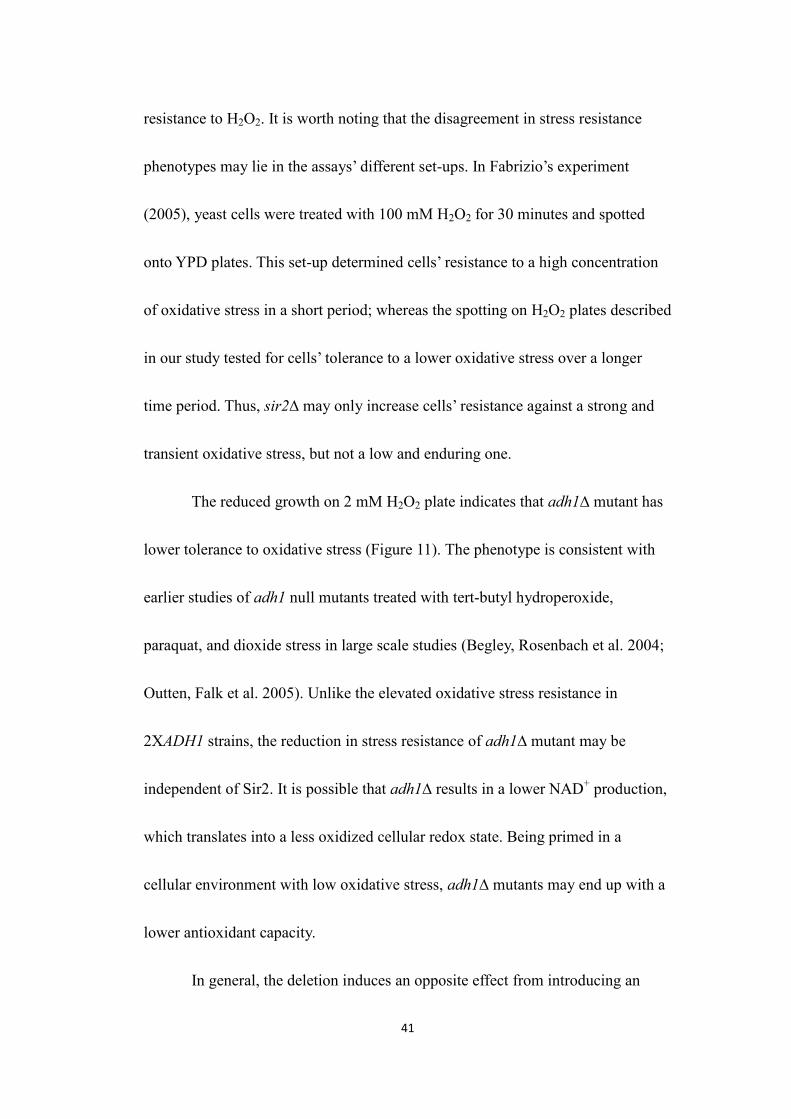
In the assay, we spotted cells on plates with serial H2O2 concentrations,
and growth on a plate simply indicates stress resistance to the corresponding level
of oxidative stress. As seen on the 2 mM H2O2 plate, sir2∆ mutant did not show
an apparent change in oxidative stress resistance (Figure 11). This is inconsistent
with the earlier finding by Fabrizio et al. (2005), where sir2∆ exhibited higher
41
resistance to H2O2. It is worth noting that the disagreement in stress resistance
phenotypes may lie in the assays’ different set-ups. In Fabrizio’s experiment
(2005), yeast cells were treated with 100 mM H2O2 for 30 minutes and spotted
onto YPD plates. This set-up determined cells’ resistance to a high concentration
of oxidative stress in a short period; whereas the spotting on H2O2 plates described
in our study tested for cells’ tolerance to a lower oxidative stress over a longer
time period. Thus, sir2∆ may only increase cells’ resistance against a strong and
transient oxidative stress, but not a low and enduring one.
The reduced growth on 2 mM H2O2 plate indicates that adh1∆ mutant has
lower tolerance to oxidative stress (Figure 11). The phenotype is consistent with
earlier studies of adh1 null mutants treated with tert-butyl hydroperoxide,
paraquat, and dioxide stress in large scale studies (Begley, Rosenbach et al. 2004;
Outten, Falk et al. 2005). Unlike the elevated oxidative stress resistance in
2XADH1 strains, the reduction in stress resistance of adh1∆ mutant may be
independent of Sir2. It is possible that adh1∆ results in a lower NAD+ production,
which translates into a less oxidized cellular redox state. Being primed in a
cellular environment with low oxidative stress, adh1∆ mutants may end up with a
lower antioxidant capacity.
In general, the deletion induces an opposite effect from introducing an
42
extra copy of ADH1 into yeast cells. The deletion of ADH1 may reduce cellular
NAD+/NADH ratio, which results in lower Sir2 silencing activity. The imbalanced
redox state may also prime cells to a lower tolerance to oxidative stress.
0mM 0.5mM
wt
∆sir2
∆adh1
1mM 1.5mM
wt
∆sir2
∆adh1
2mM
wt
∆sir2
∆adh1Figure 11. H2O2 oxidative stress assay of adh1∆ mutant. adh1∆mutant exhibits lower tolerance to oxidative stress.
43
II. Tdh3
Tdh3 is another glycolytic protein that can alter cellular NAD+ level
through its catalytic activity. In the reaction it catalyzes,
glyceraldehyde-3-phosphate is oxidized when NAD+ is simultaneously converted
to NADH. It was first identified by Holmes lab as a suppressor of SIR2
overexpression induced lethality (Matecic, Stuart et al. 2002). Subsequent studies
in the lab have established Tdh3 as a novel regulator of Sir2 that affects
Sir2-mediated silencing and rDNA recombination (Ringel 2009).
1. Tdh3 localization studies in Δtdh2 and Δsir2 strains
As one of the yeast GAPDH enzymes, Tdh3 carries out its glycolytic
function in the cytoplasm. It can potentially regulate nuclear-localized Sir2
through the general metabolic state of the cell, such as the cellular NAD+ level.
However, recent studies have suggested that some organisms’ GAPDHs are
present in the nucleus and perform multiple functions in addition to glycolytic
catalysis [reviewed in (Sirover 2005)]. It is possible that yeast Tdh3 also exists in
the nucleus to exert its effect on Sir2 activity.
Two large scale-studies characterized the sub-cellular localization of Tdh3.
Nuclear localization was not observed when Tdh3 was expressed off a TEF
promoter (Wiwatwattana and Kumar 2005). In the other study, when Tdh3 was
44
fused to GFP at its native locus, the Tdh3-GFP construct was found to be present
at both the nucleus and cytoplasm (Huh, Falvo et al. 2003). Tdh3 is expressed at a
high copy number (~169,000copies per cell) from its endogenous promoter, and it
is possible that the lower amount of Tdh3 expressed from the TEF promoter
showed a different localization pattern from the native Tdh3.
Using the same C-terminally tagged Tdh3-GFP construct from Huh et al’s
study (2003), we confirmed the localization of Tdh3 at both the cytoplasm and
nucleus (Figure 12). This result is consistent with an earlier fluorescence
microscopy experiment in the Holmes lab (Ringel 2009). The presence of Tdh3 in
the nucleus is further supported by a large-scale affinity capture study (Gavin,
Bosche et al. 2002) as well as a CoIP experiment (Rebecca Ryznar, unpublished
data), where Tdh3 was found in a same multi-protein complex with Sir2 in yeast.
Interestingly, Tdh3-GFP clustered to a concentrated spot in some cells’ cytoplasm
(Figure 12). It may be an aggregation of oxidatively damaged Tdh3 that is similar
to the GAPDH “speckles” observed in human fibroblast cells under oxidative
stress (Dastoor and Dreyer 2001).
45
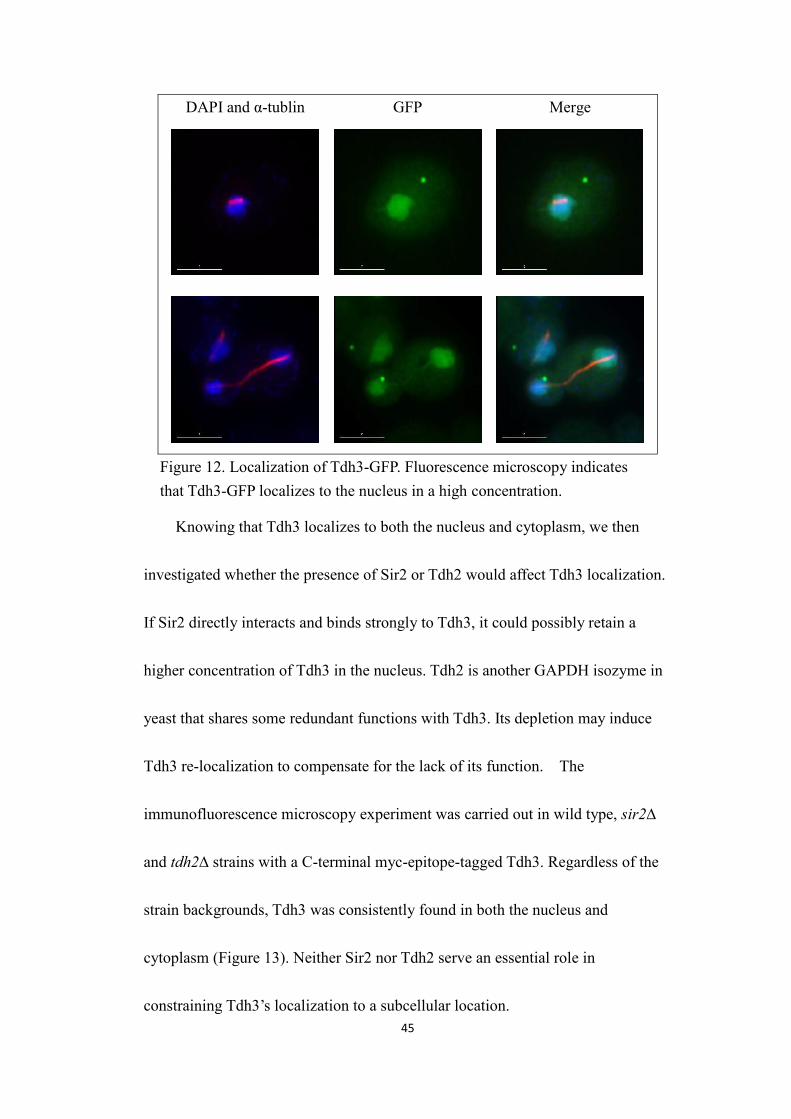
DAPI and α-tublin GFP Merge
Figure 12. Localization of Tdh3-GFP. Fluorescence microscopy indicatesthat Tdh3-GFP localizes to the nucleus in a high concentration.
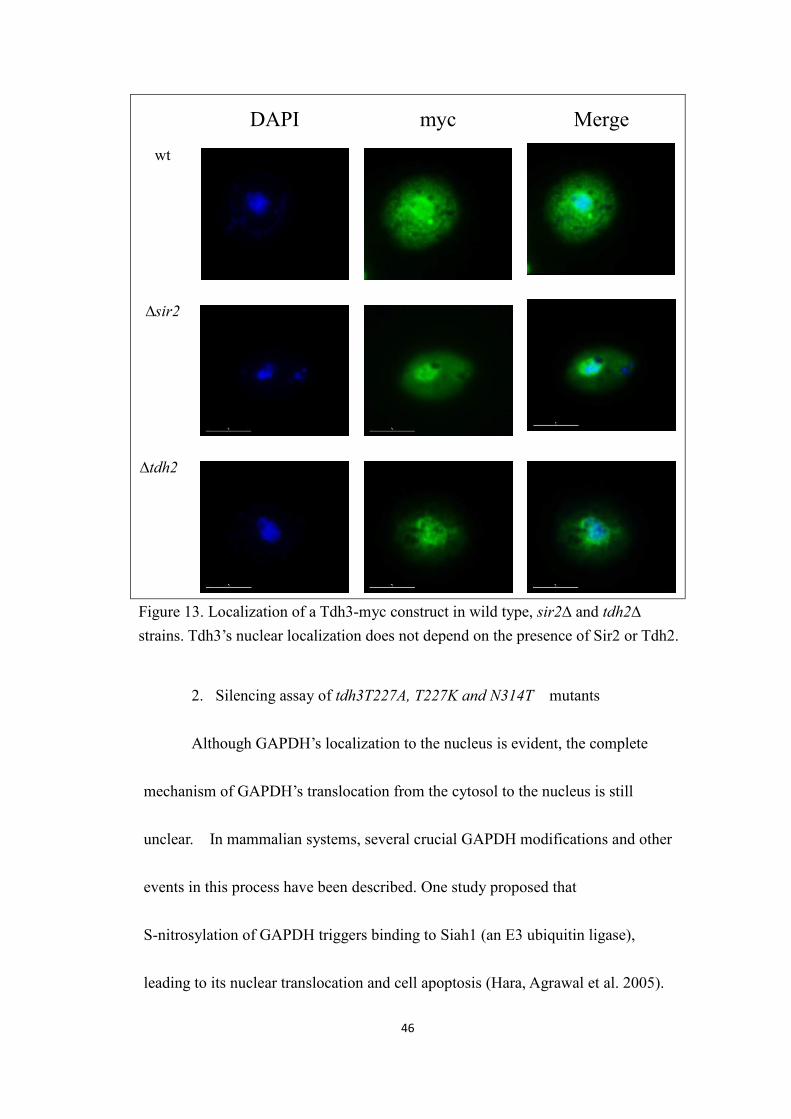
Knowing that Tdh3 localizes to both the nucleus and cytoplasm, we then
investigated whether the presence of Sir2 or Tdh2 would affect Tdh3 localization.
If Sir2 directly interacts and binds strongly to Tdh3, it could possibly retain a
higher concentration of Tdh3 in the nucleus. Tdh2 is another GAPDH isozyme in
yeast that shares some redundant functions with Tdh3. Its depletion may induce
Tdh3 re-localization to compensate for the lack of its function. The
immunofluorescence microscopy experiment was carried out in wild type, sir2∆
and tdh2∆ strains with a C-terminal myc-epitope-tagged Tdh3. Regardless of the
strain backgrounds, Tdh3 was consistently found in both the nucleus and
cytoplasm (Figure 13). Neither Sir2 nor Tdh2 serve an essential role in
constraining Tdh3’s localization to a subcellular location.
46
DAPI myc Mergewt
∆sir2
∆tdh2
Figure 13. Localization of a Tdh3-myc construct in wild type, sir2∆ and tdh2∆strains. Tdh3’s nuclear localization does not depend on the presence of Sir2 or Tdh2.
2. Silencing assay of tdh3T227A, T227K and N314T mutants
Although GAPDH’s localization to the nucleus is evident, the complete
mechanism of GAPDH’s translocation from the cytosol to the nucleus is still
unclear. In mammalian systems, several crucial GAPDH modifications and other
events in this process have been described. One study proposed that
S-nitrosylation of GAPDH triggers binding to Siah1 (an E3 ubiquitin ligase),
leading to its nuclear translocation and cell apoptosis (Hara, Agrawal et al. 2005).
47
Additionally, a separate study observed that GAPDH binding to Siah1 can be
regulated by the acetylation of GAPDH’s lysine residues (Ventura, Mateo et al.
2010). Another study suggested that protein O-linked N-acetylglucosamine
(O-GlcNAcylation) modification on Thr227 can mediate GAPDH’s translocation
to the nucleus through the disruption of GAPDH tetramer conformation. The
author postulates that the bulky hydrophilic sugar ring of N-acetylglucosamine
interrupts the hydrophobic vertical interface between the two subunits. This
destabilizes the GAPDH tetramer, giving rise to its better nuclear translocation. In
their study, two GAPDH mutants were constructed to test the hypothesis. The
T227A mutation prevented O-GlcNAcylation, favoring tetramer formation and
less nuclear localization. In contrast, the T227K mutation mimicked the
modification, which disrupted tetramer GAPDH formation and facilitated
translocation to the nucleus.
Despite the fact that O-GlcNAcylation enzymes are not found in yeast, the
possibility of a similar nuclear translocation mechanism for Tdh3 should not be
precluded. An extensive overlap is identified between the known O-GlcNAc
modified and serine/threonine phosphorylated protein populations (Mishra, Ande
et al. 2011). Moreover, these two modifications are remarkably analogous to each
other in their regulation (Hanover 2001; Hart, Housley et al. 2007). Considering
48
that Thr227 of yeast Tdh3 is a protein phosphorylation site (Smolka, Albuquerque
et al. 2007), it is possible that the phosphorylation of this residue may serve as a
Tdh3 nuclear localization mediator in substitution of O-GlcNAcylation. In this
case, studying Tdh3T227 mutants may provide insight into whether Tdh3’s effect
on Sir2 silencing required nuclear translocation.
Besides their difference in nuclear localization, T227A and T227K mutants
may exist in different monomer/tetramer ratio due to their modified state. Thus,
comparing silencing phenotype between T227A and T227K mutants can possibly
help us unveil the form in which Tdh3 mediates Sir2 silencing. Although GAPDH
functions as a homotetramer to carry out its glycolytic functions, it has been found
to exist as dimers and other forms in different organisms (Zheng, Roeder et al.
2003; Ferreira-da-Silva, Pereira et al. 2006). The transition between various forms
may alter GAPDH’s properties including its NAD+ binding ability and subcellular
localization, allowing GAPDH to serve its different functions.
Aside from defining the form of GAPDH that interacted with Sir2, we were
also interested in whether the NAD+ binding ability of GAPDH was required for
its Sir2 regulation. We constructed a Tdh3N314T mutant, whose GAPDH
counterparts from other organisms have been reported to be defective in NAD+
binding, and assessed its silencing phenotype. In Bacillus stearothermophilus
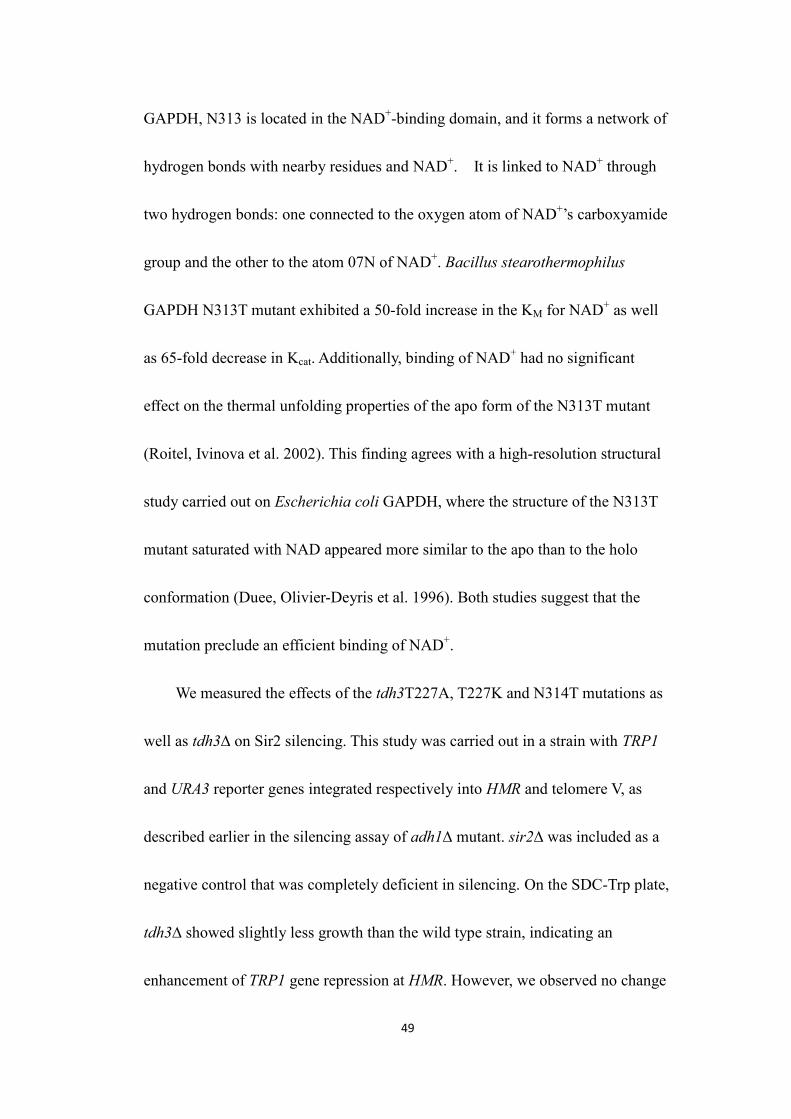
49
GAPDH, N313 is located in the NAD+-binding domain, and it forms a network of
hydrogen bonds with nearby residues and NAD+. It is linked to NAD+ through
two hydrogen bonds: one connected to the oxygen atom of NAD+’s carboxyamide
group and the other to the atom 07N of NAD+. Bacillus stearothermophilus
GAPDH N313T mutant exhibited a 50-fold increase in the KM for NAD+ as well
as 65-fold decrease in Kcat. Additionally, binding of NAD+ had no significant
effect on the thermal unfolding properties of the apo form of the N313T mutant
(Roitel, Ivinova et al. 2002). This finding agrees with a high-resolution structural
study carried out on Escherichia coli GAPDH, where the structure of the N313T
mutant saturated with NAD appeared more similar to the apo than to the holo
conformation (Duee, Olivier-Deyris et al. 1996). Both studies suggest that the
mutation preclude an efficient binding of NAD+.
We measured the effects of the tdh3T227A, T227K and N314T mutations as
well as tdh3∆ on Sir2 silencing. This study was carried out in a strain with TRP1
and URA3 reporter genes integrated respectively into HMR and telomere V, as
described earlier in the silencing assay of adh1∆ mutant. sir2∆ was included as a
negative control that was completely deficient in silencing. On the SDC-Trp plate,
tdh3∆ showed slightly less growth than the wild type strain, indicating an
enhancement of TRP1 gene repression at HMR. However, we observed no change
50
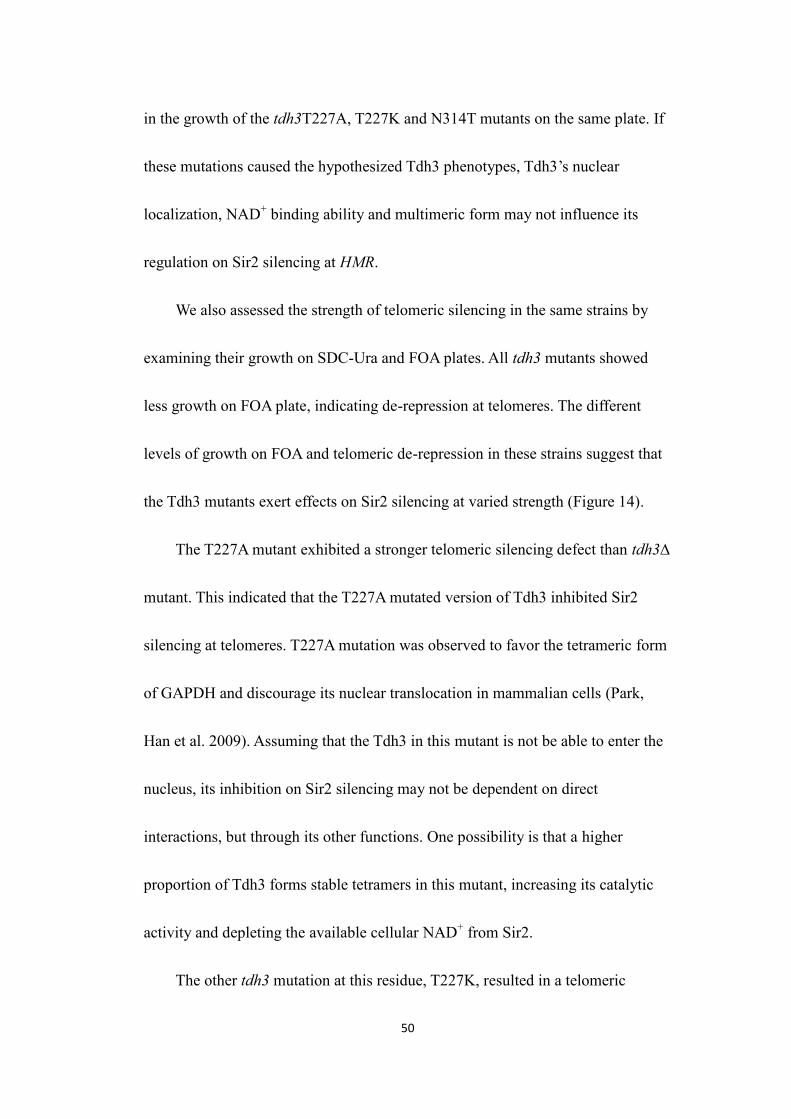
in the growth of the tdh3T227A, T227K and N314T mutants on the same plate. If
these mutations caused the hypothesized Tdh3 phenotypes, Tdh3’s nuclear
localization, NAD+ binding ability and multimeric form may not influence its
regulation on Sir2 silencing at HMR.
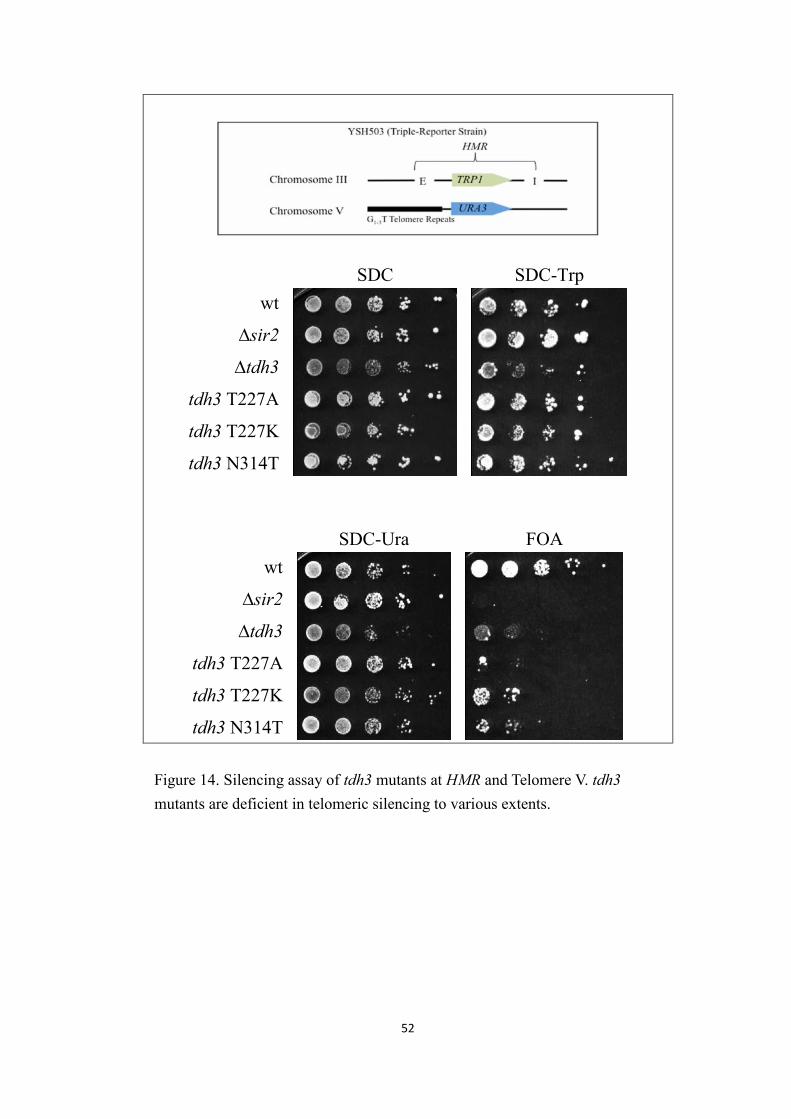
We also assessed the strength of telomeric silencing in the same strains by
examining their growth on SDC-Ura and FOA plates. All tdh3 mutants showed
less growth on FOA plate, indicating de-repression at telomeres. The different
levels of growth on FOA and telomeric de-repression in these strains suggest that
the Tdh3 mutants exert effects on Sir2 silencing at varied strength (Figure 14).
The T227A mutant exhibited a stronger telomeric silencing defect than tdh3∆
mutant. This indicated that the T227A mutated version of Tdh3 inhibited Sir2
silencing at telomeres. T227A mutation was observed to favor the tetrameric form
of GAPDH and discourage its nuclear translocation in mammalian cells (Park,
Han et al. 2009). Assuming that the Tdh3 in this mutant is not be able to enter the
nucleus, its inhibition on Sir2 silencing may not be dependent on direct
interactions, but through its other functions. One possibility is that a higher
proportion of Tdh3 forms stable tetramers in this mutant, increasing its catalytic
activity and depleting the available cellular NAD+ from Sir2.
The other tdh3 mutation at this residue, T227K, resulted in a telomeric
51
de-repression level similar to tdh3∆. It is possible that this Tdh3 protein mutant
failed to affect Sir2 silencing at telomeres. Hence, its silencing phenotypes
resembled tdh3∆ strain. Mammalian GAPDH T227K mutation is speculated to
favor monomer forms that readily translocate into the nucleus (Park, Han et al.
2009). The Tdh3T227K protein, potentially biased towards the monomer form,
may not be the native form of Tdh3 that mediates Sir2 silencing.
The last tdh3 mutant in this assay, N314T, also showed a loss of telomeric
silencing similar to tdh3∆ mutant. If N314T version of the Tdh3 protein is
deficient in NAD+ binding like its GAPDH counterparts in other organisms, we
can conclude that NAD+ binding ability is essential for Tdh3’s regulation of Sir2
silencing. Considering that the deletion of TDH3 causes a reduction in freely
available nuclear NAD+ (Ringel 2009), it is possible that Tdh3 plays a role in
NAD+ nuclear transport to mediate Sir2’s enzymatic function.
In sum, the silencing assay of tdh3 mutants suggested that highly biased
monomer/tetramer ratio and deficit in NAD+ binding could potentially weaken
Tdh3’s ability to regulate Sir2 silencing at telomeres. A specific form of Tdh3 may
be required to maintain Sir2 activity at a normal level.
52
SDC SDC-Trpwt
∆sir2
∆tdh3
tdh3 T227A
tdh3 T227K
tdh3 N314T
SDC-Ura FOAwt
∆sir2
∆tdh3
tdh3 T227A
tdh3 T227K
tdh3 N314T
Figure 14. Silencing assay of tdh3 mutants at HMR and Telomere V. tdh3mutants are deficient in telomeric silencing to various extents.
53
III. Mrps12
Mrps12 is the last potential Sir2 regulator protein presented in this study. It is
a mitochondria ribosomal protein of the small subunit that is encoded in the yeast
genome. As one of the most conserved mitochondrial ribosomal proteins, it is
essential for mitochondrial function (Fujita, Horie et al. 2001). Mrps12 is
suggested to be a major component of ribosomal accuracy center in organisms
including bacteria, fly, mouse and human (Shah, O'Dell et al. 1997). It was first
identified in the Holmes lab as an enhancer of Sir2 overexpression induced
lethality (Ayala 1999). Another enhancer, Sir3, is a collaborator in Sir2’s silencing
activity. Hence, we postulated that Mrps12 could also be a Sir2 silencing partner
and further investigated its relationship with Sir2.
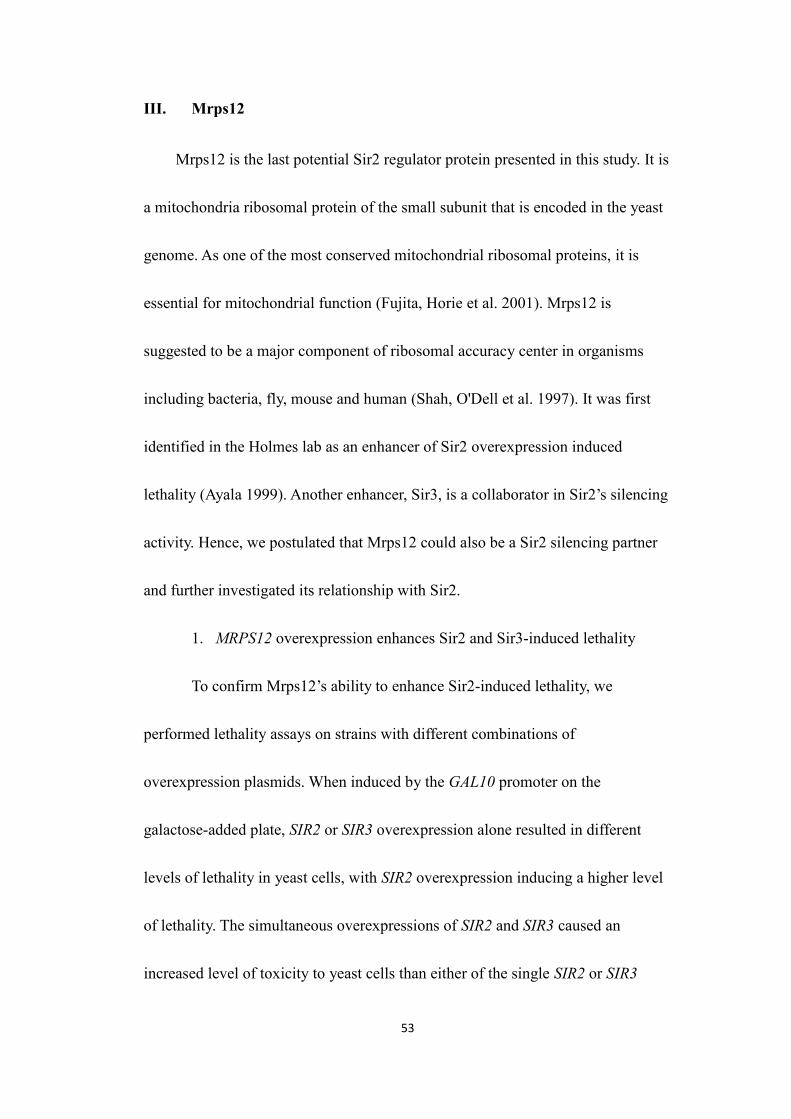
1. MRPS12 overexpression enhances Sir2 and Sir3-induced lethality
To confirm Mrps12’s ability to enhance Sir2-induced lethality, we
performed lethality assays on strains with different combinations of
overexpression plasmids. When induced by the GAL10 promoter on the
galactose-added plate, SIR2 or SIR3 overexpression alone resulted in different
levels of lethality in yeast cells, with SIR2 overexpression inducing a higher level
of lethality. The simultaneous overexpressions of SIR2 and SIR3 caused an
increased level of toxicity to yeast cells than either of the single SIR2 or SIR3
54
overexpression (Figure 15). This result is consistent with an earlier finding
(Holmes, Rose et al. 1997).
In this assay, overexpression of MRPS12 from a 2μ plasmid alone did not
induce lethality to cells on the galactose plate. When it is overexpressed
simultaneously with SIR2, the lethality is enhanced as compared to strains
overexpressing only SIR2. Additionally, we tested Mrps12’s effect on
Sir3-induced lethality. We observed a similar pattern of increased lethality in
strains overexpressing both MRPS12 and SIR3. The level of enhancement in
lethality caused by MRPS12 overexpression is higher for Sir3-induced lethality
than Sir2-induced lethality (Figure 15). The result from this lethality assay not
only confirmed MRPS12 overexpression enhanced Sir2-induced lethality, but also
showed that it could enhance Sir3-induced lethality to an even higher extent. Thus,
Mrps12 may collaborate with both Sir proteins in their functions.
wt SDC-Leu-Ura SC-Leu-Ura GAL
vector
SIR2
SIR3
MRPS12
SIR2SIR2 SIR3
SIR2 MRPS12
SIR3 MRPS12Figure 15. MRPS12 overexpression enhances Sir2 and Sir3-induced lethality.
55
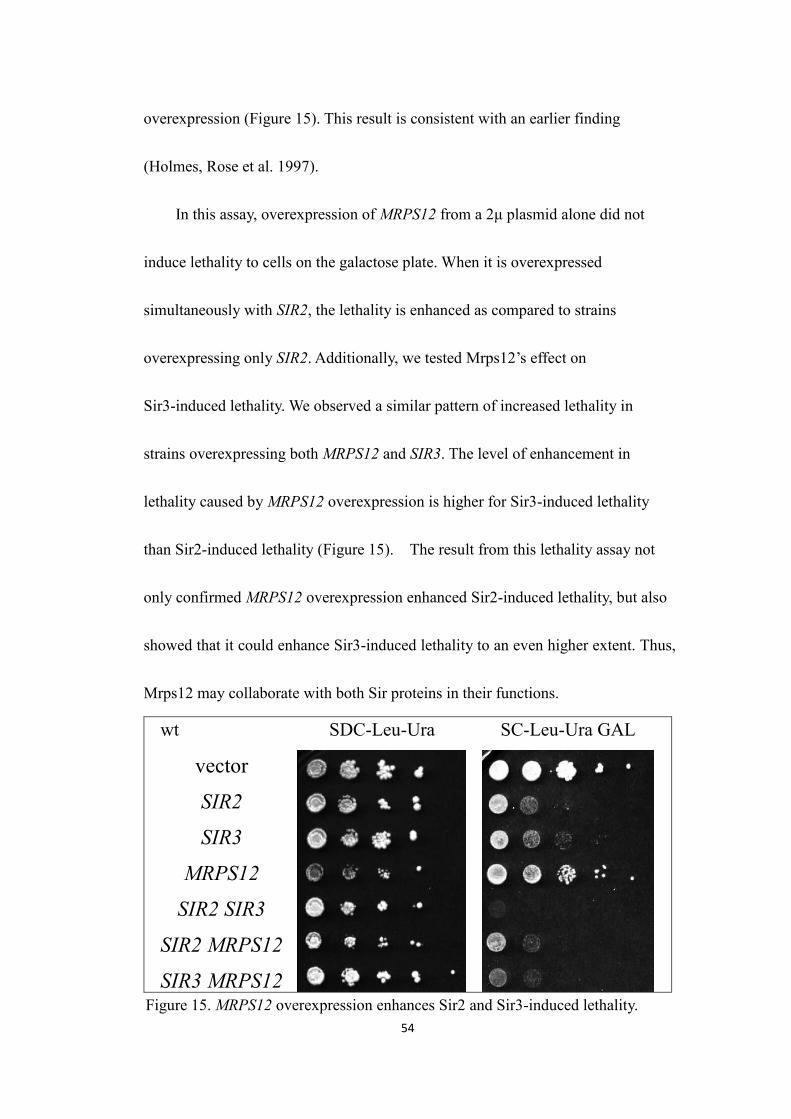
2. Lethality assay in Δsir2 and Δsir3 strains
To investigate if Mrps12’s ability to enhance Sir2 and Sir3-induced
lethality is an effect through either one of these Sir proteins, we also conducted
the overexpression lethality assay in Δsir2 and Δsir3 strains. In agreement with a
previous report, Sir3-induced lethality was mitigated upon the deletion of SIR2
(Figure 16), indicating a requirement of Sir2 to manifest Sir3-induced lethality
(Holmes, Rose et al. 1997). As expected, we observed an enhancement of lethality
through coupling MRPS12 overexpression to that of SIR2. Additionally, MRPS12
overexpression enhanced SIR3’s overexpression-induced lethality in this Δsir2
background (Figure 16), demonstrating that Sir2 was not required for Mrps12’s
effect on the Sir3-induced phenotype.
Δsir2
SDC-Leu-Ura SC-Leu-Ura GAL
vector
SIR2
SIR3
MRPS12 SIR2
SIR2 MRPS12
SIR3 MRPS12
Figure 16. MRPS12 overexpression enhances Sir2 and Sir3-induced lethality inΔsir2 strain.
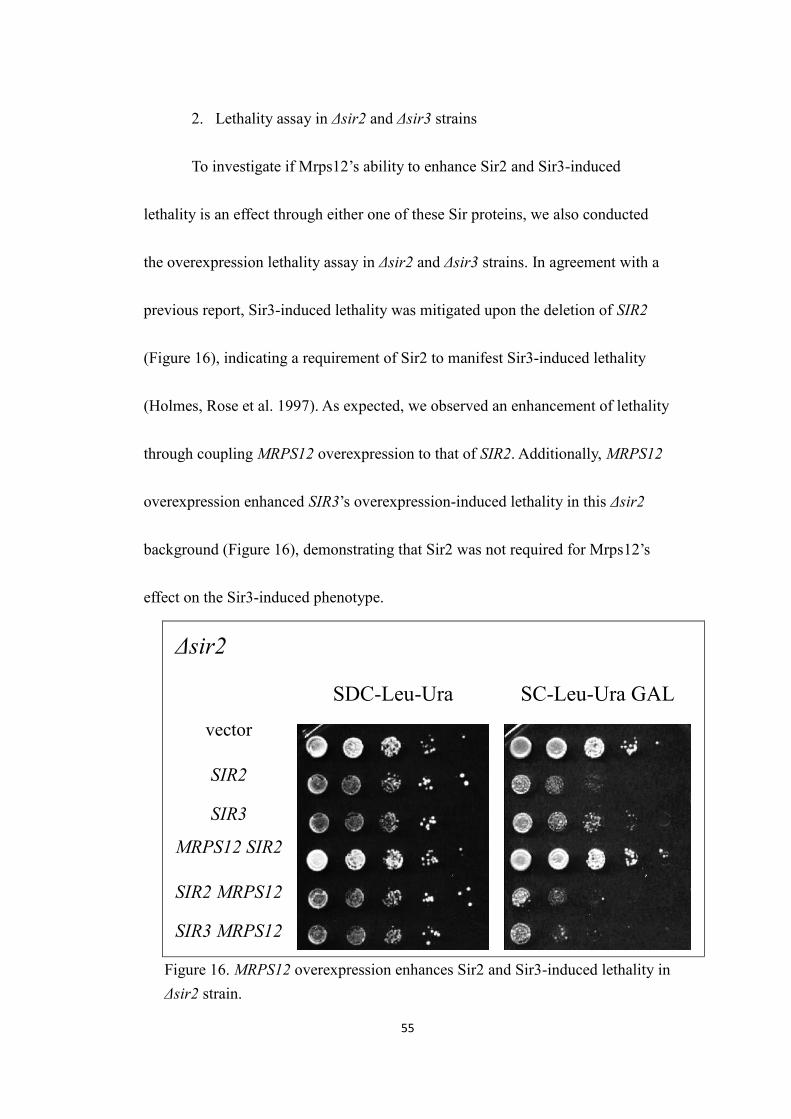
56
The same overexpression lethality study was carried out on a Δsir3 strain.
MPRS12 overexpression was able to enhance both Sir2 and Sir3-induced lethality
in this background (Figure 17). Surprisingly, Mrps12’s ability to enhance
Sir3-induced lethality is weakened upon the deletion of chromosomal SIR3,
indicating it may function through activating the function of chromosomal SIR3 to
induce lethality. It is worth noting that the MRPS12 overexpression plasmid used
in this study is different from that used in the wild-type or Δsir2 strain. It is
possible that the overexpression level from this plasmid is not as high, thus the
reduced ability of Mrps12 to enhance Sir3-induced lethality. In sum, Mrps12 can
enhance Sir2 or Sir3-induced lethality phenotype independently of the other Sir
proteins, indicating that it can contribute to both proteins’ lethality function.
Δsir3
SDC-Leu-Trp SC-Leu-Trp GAL
vector
SIR2
SIR3
MRPS12 SIR2
SIR2 MRPS12
SIR3 MRPS12
Figure 17. MRPS12 overexpression enhances Sir2 and Sir3-induced lethality inΔsir3 strain.
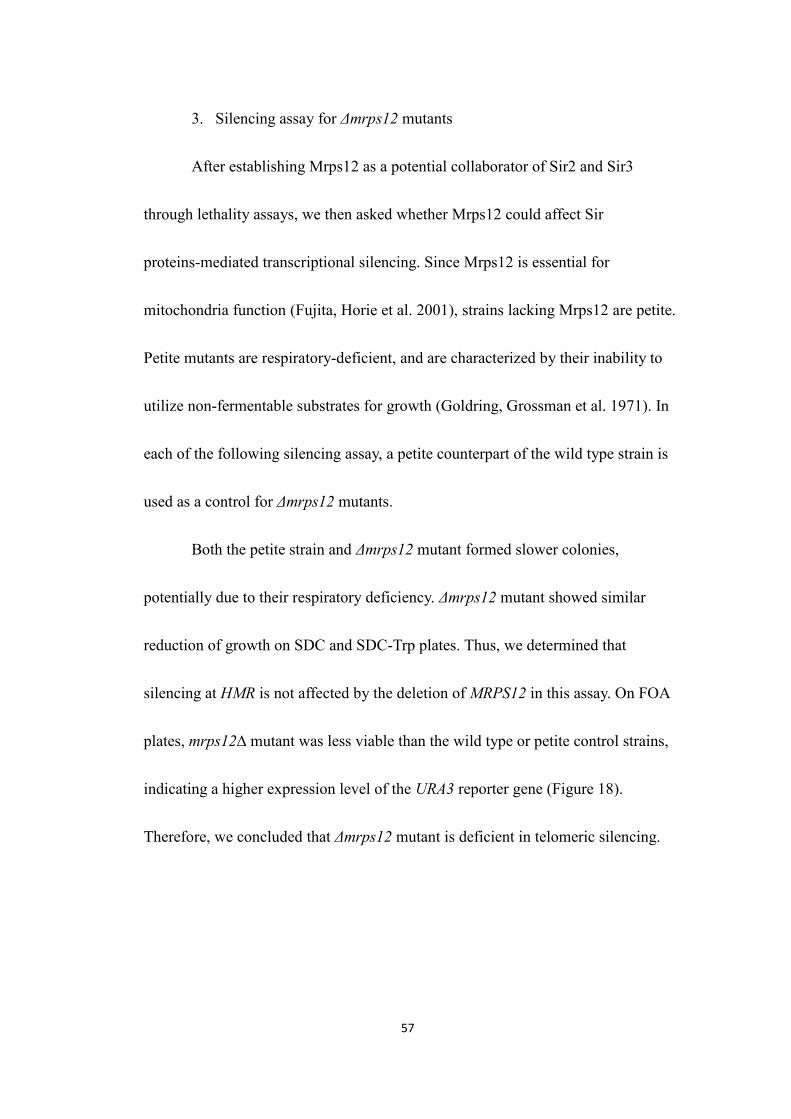
57
3. Silencing assay for Δmrps12 mutants
After establishing Mrps12 as a potential collaborator of Sir2 and Sir3
through lethality assays, we then asked whether Mrps12 could affect Sir
proteins-mediated transcriptional silencing. Since Mrps12 is essential for
mitochondria function (Fujita, Horie et al. 2001), strains lacking Mrps12 are petite.
Petite mutants are respiratory-deficient, and are characterized by their inability to
utilize non-fermentable substrates for growth (Goldring, Grossman et al. 1971). In
each of the following silencing assay, a petite counterpart of the wild type strain is
used as a control for Δmrps12 mutants.
Both the petite strain and Δmrps12 mutant formed slower colonies,
potentially due to their respiratory deficiency. Δmrps12 mutant showed similar
reduction of growth on SDC and SDC-Trp plates. Thus, we determined that
silencing at HMR is not affected by the deletion of MRPS12 in this assay. On FOA
plates, mrps12∆ mutant was less viable than the wild type or petite control strains,
indicating a higher expression level of the URA3 reporter gene (Figure 18).
Therefore, we concluded that Δmrps12 mutant is deficient in telomeric silencing.
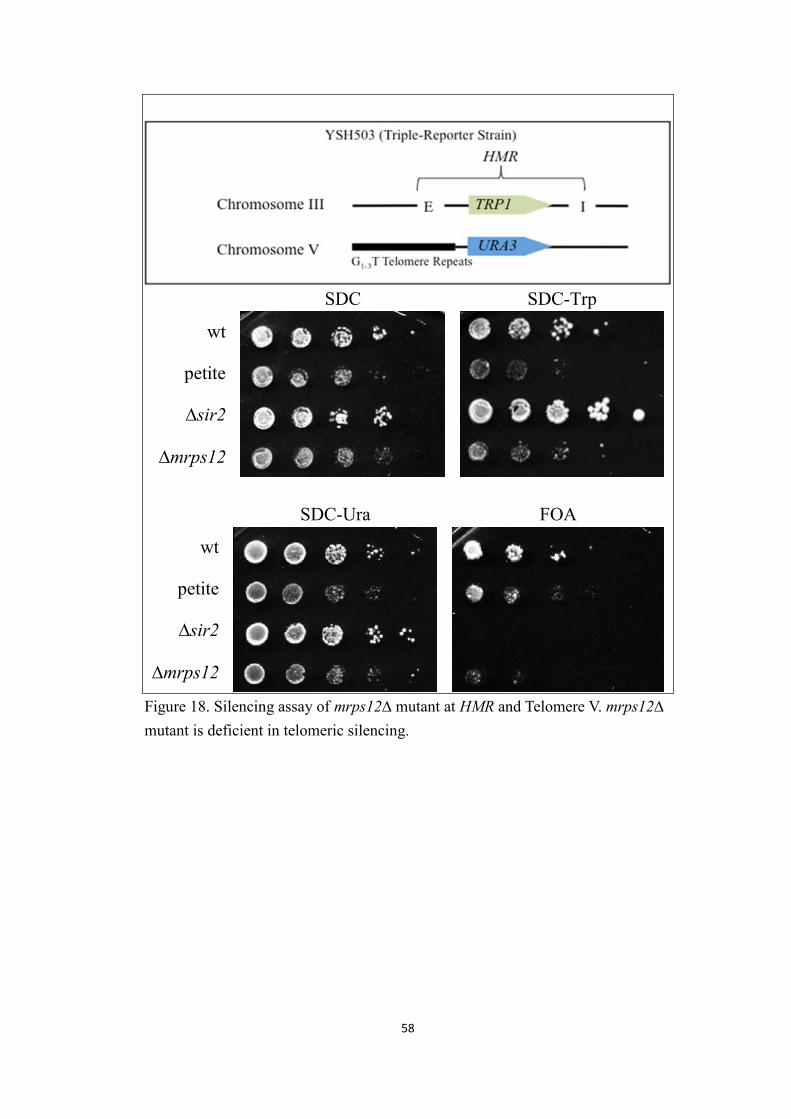
58
SDC SDC-Trp
wt
petite
∆sir2
∆mrps12
SDC-Ura FOA
wt
petite
∆sir2
∆mrps12
Figure 18. Silencing assay of mrps12∆ mutant at HMR and Telomere V. mrps12∆mutant is deficient in telomeric silencing.
59
In addition to HMR and telomeres, we also studied the effect of mrps12∆
on transcriptional silencing at rDNA repeats. We did not observe a significant
difference between the growth of mrps12∆ mutant and the wild type controls on
the SDC-Ura plate. This indicates that mrps12∆ does not affect silencing at rDNA
repeats.
SDC SDC -Ura
wt
∆sir2
petite
∆mrps12
Figure 19. Silencing assay of mrps12∆ mutant at rDNA repeats.
60
4. Silencing assay of MRPS12 overexpressing strains
Since mrps12∆ caused silencing defects at telomeres, we were curious
whether MRPS12 overexpression would affect Sir2 silencing as well. Furthermore,
the effect of MRPS12 overexpression on Sir2 silencing may be a potential cause
for the enhanced Sir2-induced lethality.
We conducted silencing assays on the same HMR and telomere reporter
strains with control vectors or MRPS12-overexpressing 2μ plasmids. We expected
that the strains carrying only the control vectors to exhibit the same phenotype as
the corresponding strains without the vectors in the earlier silencing assay.
However, on the SDC-Leu-Trp plate, the Δmrps12 mutant showed slightly less
growth than the petite control (Figure 20), and this phenotype was not observed in
the same strains without the vector (Figure 18). Thus, although MRPS12
overexpression changed the growth level of this strain on the SDC-Trp-Leu plate,
we concluded that its growth level may not properly represent the silencing
phenotype at HMR.
MRPS12 overexpression did not affect the growth of all four strains on the
FOA- Leu plate (Figure 20), indicating that it did not change the level of telomeric
silencing. Upon MRPS12 overexpression, we expected that Δmrps12 mutant and
the petite control strain would show similar silencing phenotypes. Surprisingly,
Δmrps12 mutant consistently exhibited less growth on FOA-Leu plate than the
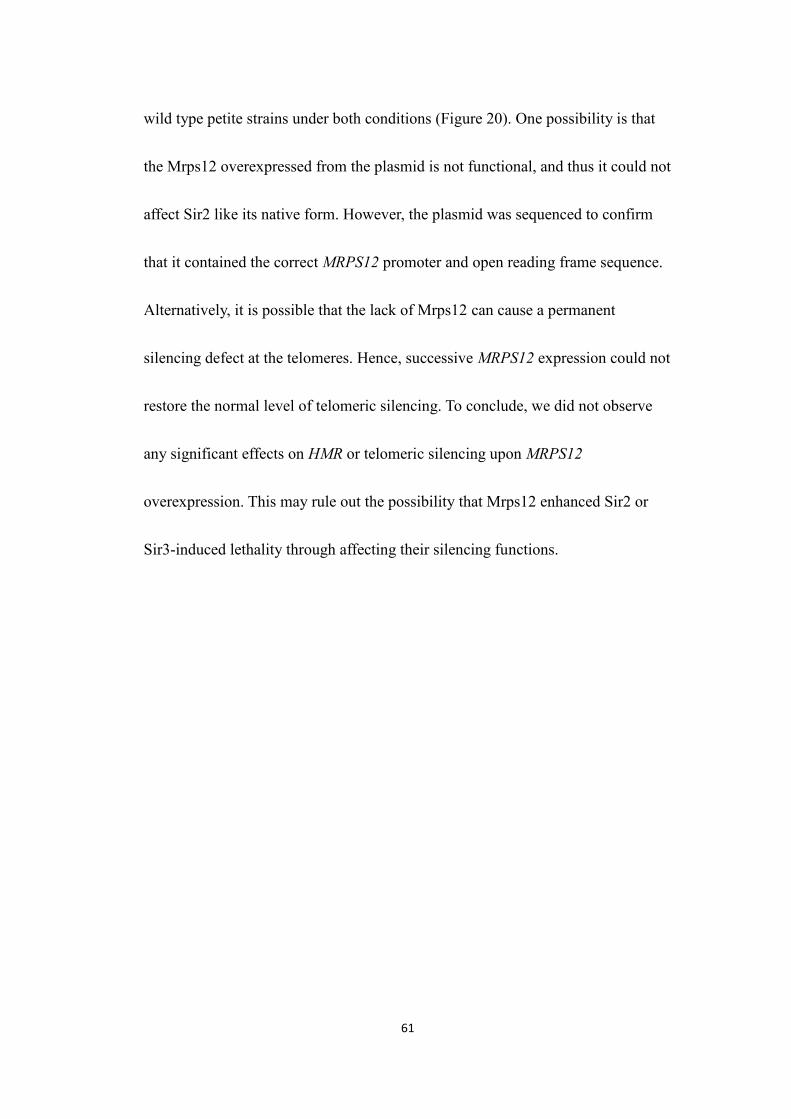
61
wild type petite strains under both conditions (Figure 20). One possibility is that
the Mrps12 overexpressed from the plasmid is not functional, and thus it could not
affect Sir2 like its native form. However, the plasmid was sequenced to confirm
that it contained the correct MRPS12 promoter and open reading frame sequence.
Alternatively, it is possible that the lack of Mrps12 can cause a permanent
silencing defect at the telomeres. Hence, successive MRPS12 expression could not
restore the normal level of telomeric silencing. To conclude, we did not observe
any significant effects on HMR or telomeric silencing upon MRPS12
overexpression. This may rule out the possibility that Mrps12 enhanced Sir2 or
Sir3-induced lethality through affecting their silencing functions.
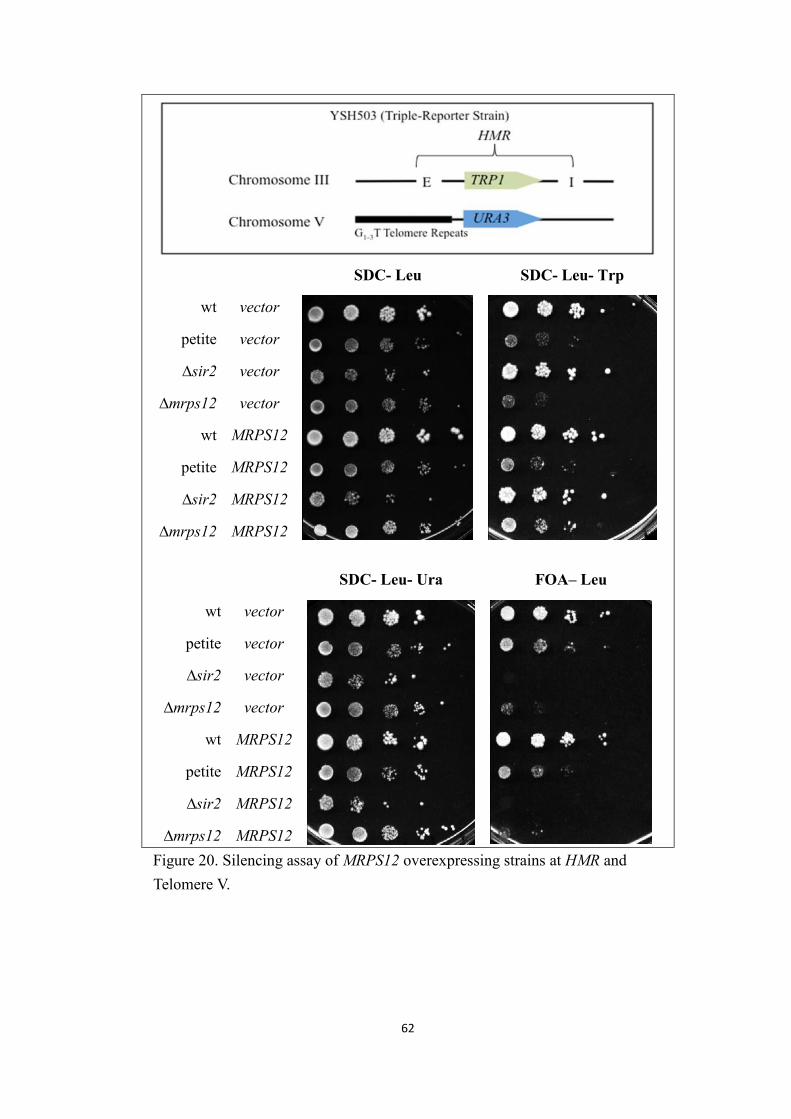
62
SDC- Leu SDC- Leu- Trp
wt vector
petite vector
∆sir2 vector
∆mrps12 vector
wt MRPS12
petite MRPS12
∆sir2 MRPS12
∆mrps12 MRPS12
SDC- Leu- Ura FOA– Leu
wt vector
petite vector
∆sir2 vector
∆mrps12 vector
wt MRPS12
petite MRPS12
∆sir2 MRPS12
∆mrps12 MRPS12Figure 20. Silencing assay of MRPS12 overexpressing strains at HMR andTelomere V.
63
5. rDNA recombination assay of Δmrps12 mutants
In addition to transcriptional silencing, another known function of Sir2 is
the suppression of rDNA recombination. Since Mrps12 can affect Sir2 silencing
and Sir2-induced lethality, it may also play a role in suppressing rDNA
recombination. To investigate this possibility, we measured rDNA recombination
rate in a strain lacking Mrps12.
In the rDNA recombination assay, a mURA3 reporter gene is inserted into
rDNA repeats of the strains, and the rate of rDNA recombination is represented by
the loss rate of the reporter. As expected, sir2∆ increased rDNA recombination
rate, and the role of Sir2 in suppressing rDNA recombination was verified. The
petite strain exhibited a lower rDNA recombination rate than the wild type.
Nevertheless, the rDNA recombination rate of mrps12∆ mutant did not show a
statistically significant difference from the wild type or petite strains (Figure 21).
Therefore, Mrps12 may not play a role in suppressing rDNA recombination.
64
Rate of mURA3 Reporter Loss (number of cells/generation [*10-3])Trial 1 Trial 2 Trial 3 Trial 4 Trial 5 Average Std Dev
wt 1.674 1.587 1.791 1.366 N/A 1.605 0.180∆sir2 2.914 2.702 3.209 1.669 N/A 2.624 0.669petite 0.725 1.044 0.817 1.109 1.060 0.951 0.169
∆mrps12 1.039 2.714 0.970 1.842 N/A 1.641 0.817
Figure 21. rDNA recombination assay of ∆mrps12 mutant. ∆mrps12 mutant has anrDNA recombination rate that is similar to that of the wild type strain and higherthan that of the petite strain.
0.00.51.01.52.02.53.03.54.04.55.0
wt ∆sir2 petite ∆mrps12
Rat
e ofmURA3
Rep
orte
r Los
s(n
umbe
r of
cel
ls/g
ener
atio
n[*
10-3
])
rDNA Recombination
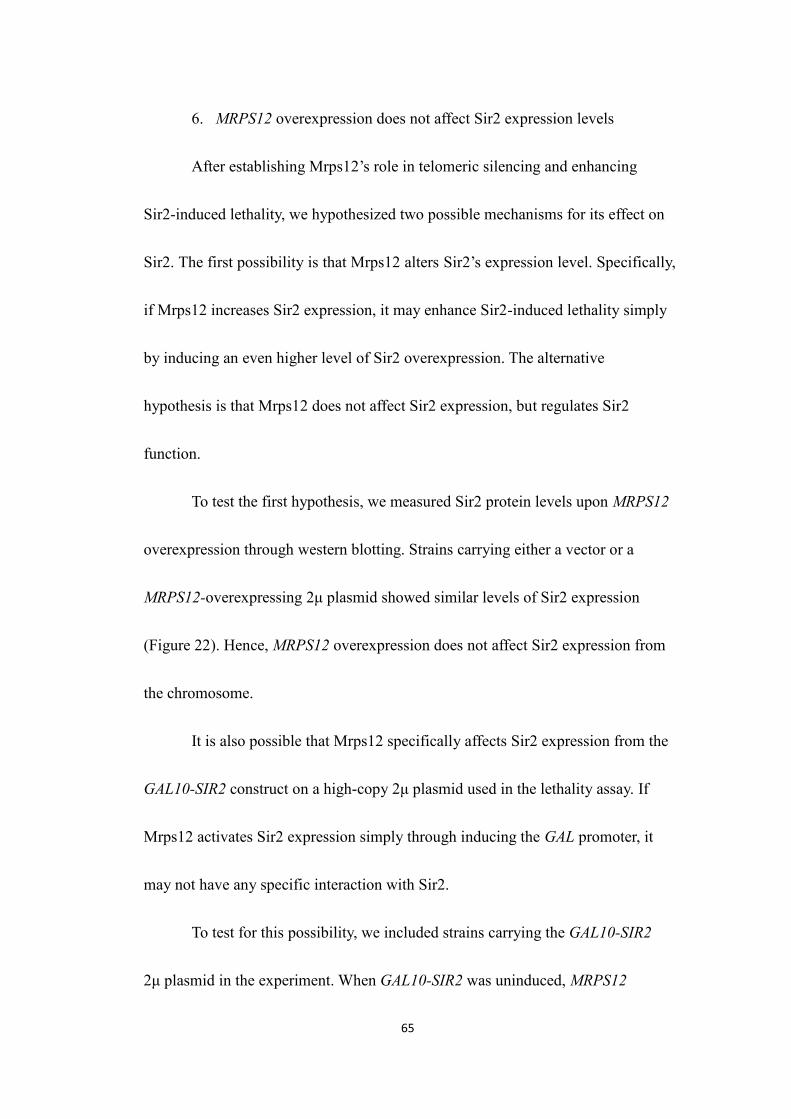
65
6. MRPS12 overexpression does not affect Sir2 expression levels
After establishing Mrps12’s role in telomeric silencing and enhancing
Sir2-induced lethality, we hypothesized two possible mechanisms for its effect on
Sir2. The first possibility is that Mrps12 alters Sir2’s expression level. Specifically,
if Mrps12 increases Sir2 expression, it may enhance Sir2-induced lethality simply
by inducing an even higher level of Sir2 overexpression. The alternative
hypothesis is that Mrps12 does not affect Sir2 expression, but regulates Sir2
function.
To test the first hypothesis, we measured Sir2 protein levels upon MRPS12
overexpression through western blotting. Strains carrying either a vector or a
MRPS12-overexpressing 2μ plasmid showed similar levels of Sir2 expression
(Figure 22). Hence, MRPS12 overexpression does not affect Sir2 expression from
the chromosome.
It is also possible that Mrps12 specifically affects Sir2 expression from the
GAL10-SIR2 construct on a high-copy 2μ plasmid used in the lethality assay. If
Mrps12 activates Sir2 expression simply through inducing the GAL promoter, it
may not have any specific interaction with Sir2.
To test for this possibility, we included strains carrying the GAL10-SIR2
2μ plasmid in the experiment. When GAL10-SIR2 was uninduced, MRPS12
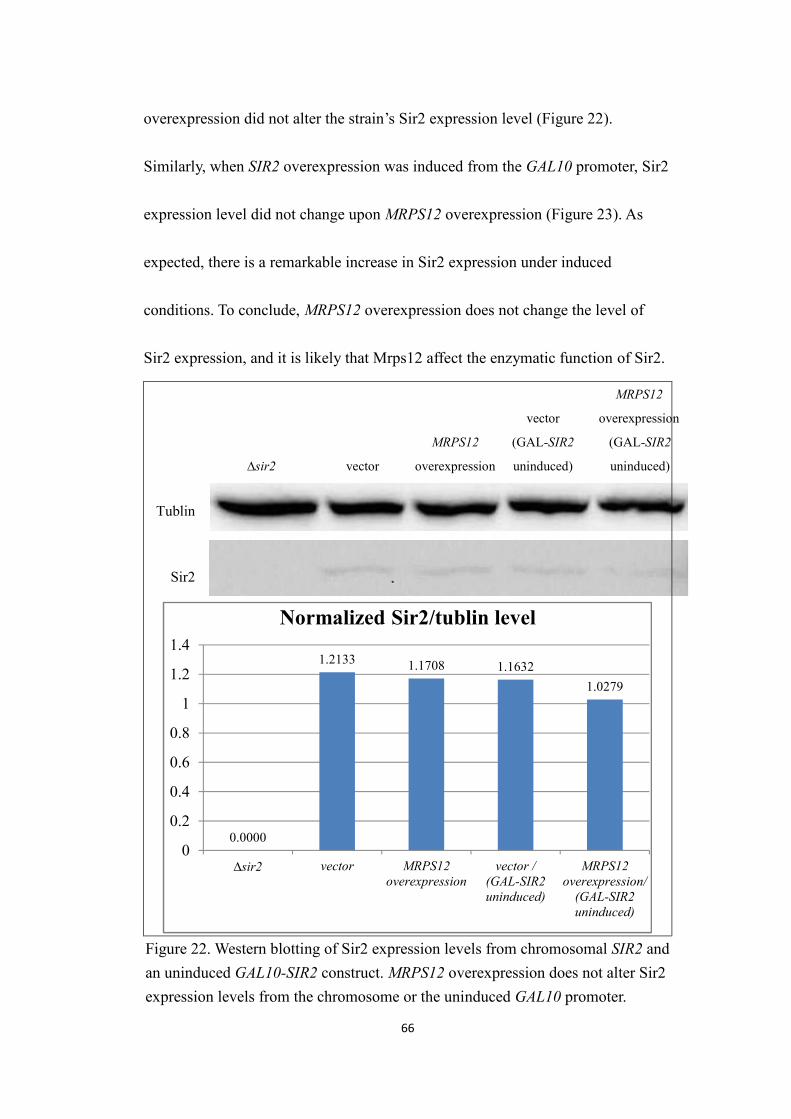
66
overexpression did not alter the strain’s Sir2 expression level (Figure 22).
Similarly, when SIR2 overexpression was induced from the GAL10 promoter, Sir2
expression level did not change upon MRPS12 overexpression (Figure 23). As
expected, there is a remarkable increase in Sir2 expression under induced
conditions. To conclude, MRPS12 overexpression does not change the level of
Sir2 expression, and it is likely that Mrps12 affect the enzymatic function of Sir2.
∆sir2 vector
MRPS12
overexpression
vector
(GAL-SIR2
uninduced)
MRPS12
overexpression
(GAL-SIR2
uninduced)
Tublin
Sir2
Figure 22. Western blotting of Sir2 expression levels from chromosomal SIR2 andan uninduced GAL10-SIR2 construct. MRPS12 overexpression does not alter Sir2expression levels from the chromosome or the uninduced GAL10 promoter.
0.0000
1.2133 1.1708 1.16321.0279
0
0.2
0.4
0.6
0.8
1
1.2
1.4
∆sir2 vector MRPS12overexpression
vector /(GAL-SIR2uninduced)
MRPS12overexpression/
(GAL-SIR2uninduced)
Normalized Sir2/tublin level
67
vector
(GAL-SIR2
induced)
MRPS12
overexpressi
on
(GAL-SIR2
induced)
Tubl
inSir2
Figure 22. Western blotting of Sir2 expression levels from an inducedGAL10-SIR2 construct on a 2μ high-copy plasmid. MRPS12overexpression does not alter Sir2 expression levels from the inducedGAL10 promoter in the plasmid.
7. Sir2 and Mrps12 do not interact through two-hybrid assays
Several of Sir2’s silencing collaborators, such as other Sir proteins,
physically interact with Sir2 to aid its function. Given that Mrps12 may regulate
Sir2 function, there is a possibility that it can also physically interact with Sir2.
2.9499 3.1181
0
0.5
1
1.5
2
2.5
3
3.5
4
vector /GAL-SIR2 induced
MRPS12 overexpression/GAL-SIR2 induced
Normalized Sir2/tublin level
68
Two-hybrid assays were carried out to examine the potential physical
interaction between Mrps12 and Sir2 in vivo. In two hybrid assays, a bait protein
is fused to the DNA binding domain (BD) of a Gal4 transcription factor, whereas a
prey protein is fused to Gal4’s activation domain (AD). The bait protein is
recruited to the promoter of the HIS3 reporter gene by BD’s binding to a Gal4’s
binding site at this region. If the prey protein interacts with the bait protein, the
fused AD would be brought to close proximity of the HIS3 promoter. Thus, HIS3
transcription would be activated, allowing cell growth on plates lacking His.
As seen on the –His plate, the strain with Mrps12-BD and Sir2-AD did not
show additional growth than strains carrying only Sir2-AD plasmid, indicating
that there is no interaction detected between Mrps12-BD and Sir2-AD. Similarly,
the strain carrying both Mrps12-AD and Sir2-BD did not show better growth on
the –His plate strains carrying control plasmids. Thus, Mrps12 and Sir2 do not
interact through a two-hybrid assay. However, there is a possibility that the
two-hybrid assay failed to represent the actual interaction between these two
proteins. In particular, Mrps12 is a small protein containing 153 amino acids, and
the fusion to AD or BD may interrupt the proper folding of Mrps12 into its native
form.
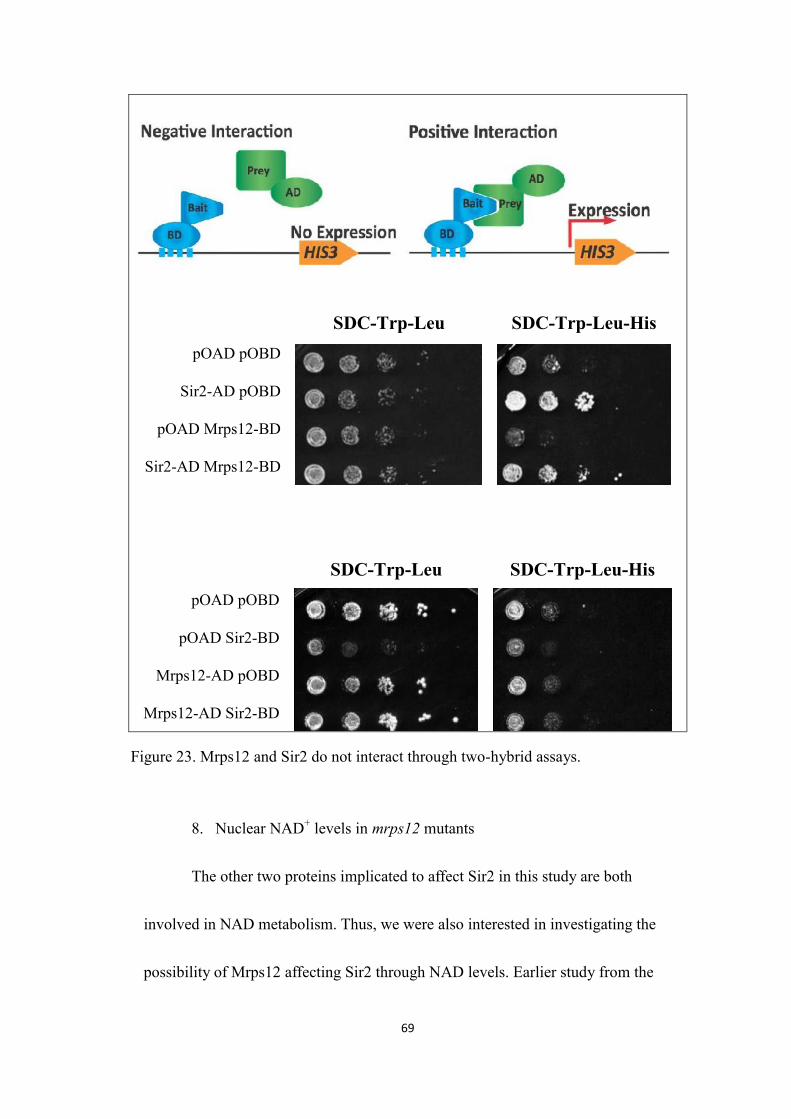
69
SDC-Trp-Leu SDC-Trp-Leu-HispOAD pOBD
Sir2-AD pOBD
pOAD Mrps12-BD
Sir2-AD Mrps12-BD
SDC-Trp-Leu SDC-Trp-Leu-HispOAD pOBD
pOAD Sir2-BD
Mrps12-AD pOBD
Mrps12-AD Sir2-BD
Figure 23. Mrps12 and Sir2 do not interact through two-hybrid assays.
8. Nuclear NAD+ levels in mrps12 mutants
The other two proteins implicated to affect Sir2 in this study are both
involved in NAD metabolism. Thus, we were also interested in investigating the
possibility of Mrps12 affecting Sir2 through NAD levels. Earlier study from the
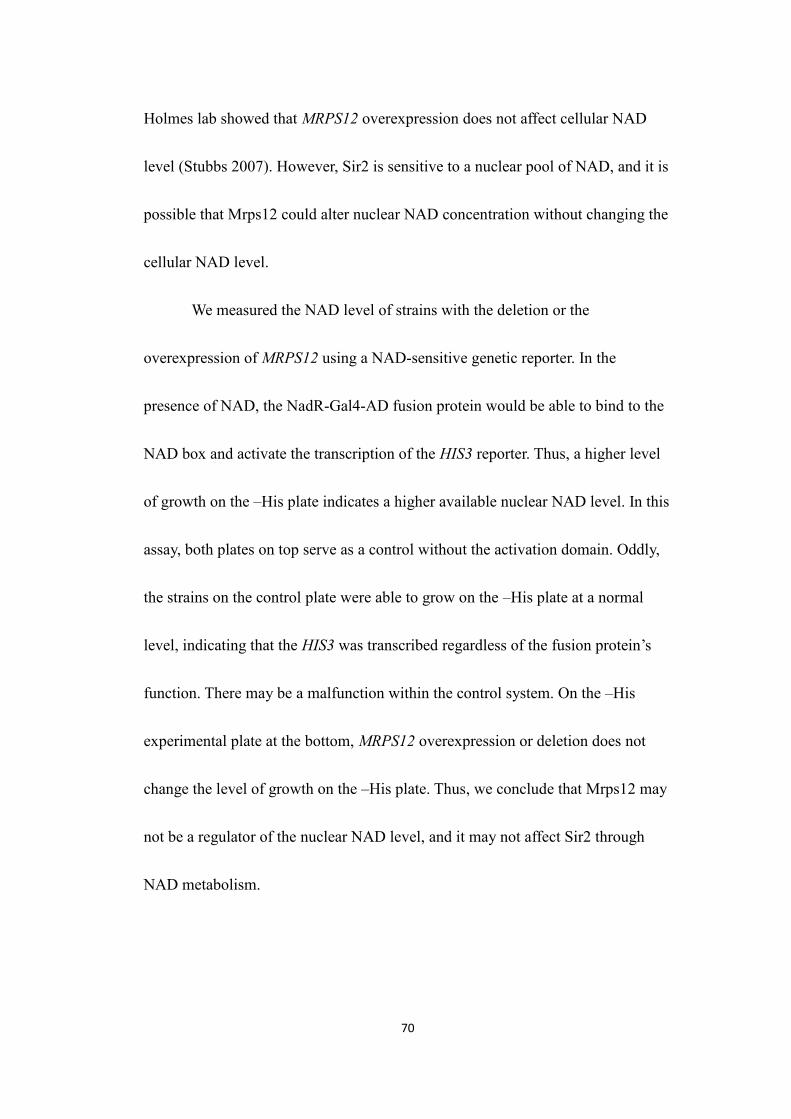
70
Holmes lab showed that MRPS12 overexpression does not affect cellular NAD
level (Stubbs 2007). However, Sir2 is sensitive to a nuclear pool of NAD, and it is
possible that Mrps12 could alter nuclear NAD concentration without changing the
cellular NAD level.
We measured the NAD level of strains with the deletion or the
overexpression of MRPS12 using a NAD-sensitive genetic reporter. In the
presence of NAD, the NadR-Gal4-AD fusion protein would be able to bind to the
NAD box and activate the transcription of the HIS3 reporter. Thus, a higher level
of growth on the –His plate indicates a higher available nuclear NAD level. In this
assay, both plates on top serve as a control without the activation domain. Oddly,
the strains on the control plate were able to grow on the –His plate at a normal
level, indicating that the HIS3 was transcribed regardless of the fusion protein’s
function. There may be a malfunction within the control system. On the –His
experimental plate at the bottom, MRPS12 overexpression or deletion does not
change the level of growth on the –His plate. Thus, we conclude that Mrps12 may
not be a regulator of the nuclear NAD level, and it may not affect Sir2 through
NAD metabolism.
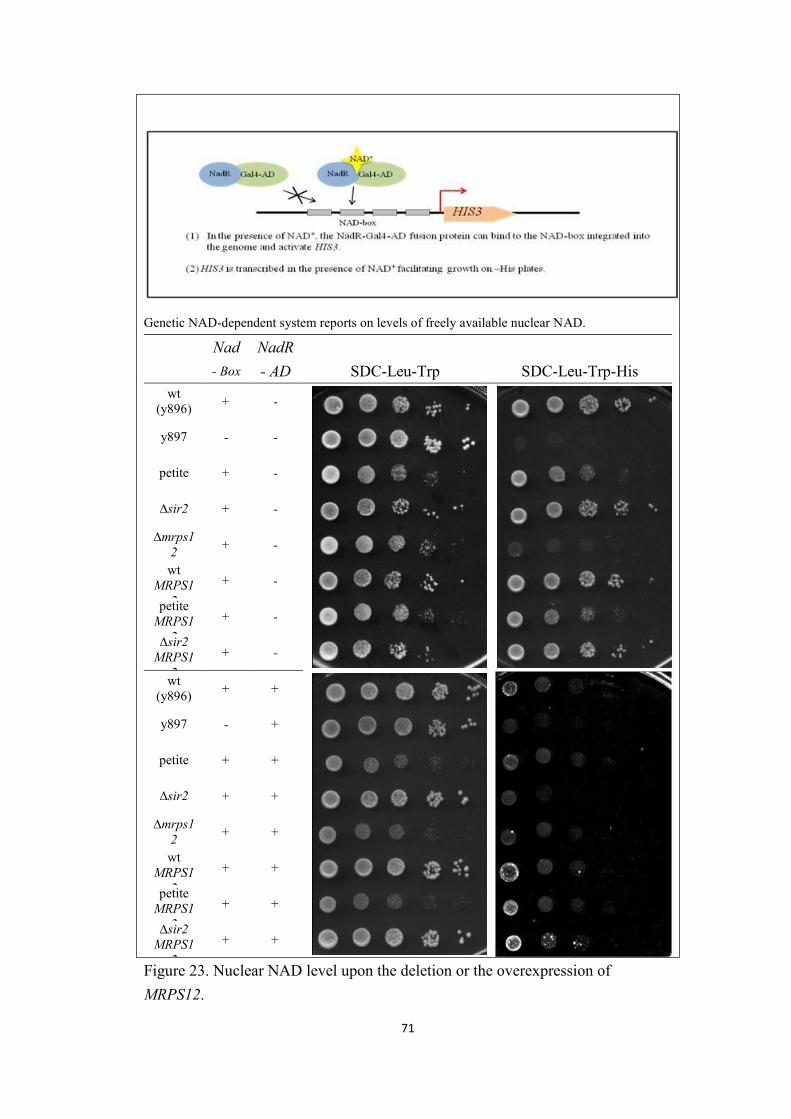
71
Genetic NAD-dependent system reports on levels of freely available nuclear NAD.
Nad- Box
NadR- AD SDC-Leu-Trp SDC-Leu-Trp-His
wt(y896) + -
y897 - -
petite + -
∆sir2 + -
∆mrps12 + -
wtMRPS1
2+ -
petiteMRPS1
2+ -
∆sir2MRPS1
2+ -
wt(y896) + +
y897 - +
petite + +
∆sir2 + +
∆mrps12 + +
wtMRPS1
2+ +
petiteMRPS1
2+ +
∆sir2MRPS1
2+ +
Figure 23. Nuclear NAD level upon the deletion or the overexpression ofMRPS12.
72
DISCUSSION
Since the discovery of Sir2 deacetylase’s distinct NAD requirement, many
associations have been made between the function of Sir2-like proteins and the
metabolic states of a cell. The connection between Sir2 and metabolism is
considerably complex. In two orders of direct genetic or physical interactions,
Sir2’s metabolic network spans half of the yeast proteome (Ralser, Michel et al.
2012). In this study, we characterized the interactions between Sir2 and three
metabolic proteins, Adh1, Tdh3, and Mrps12. Our results show that manipulations
of all three corresponding genes affect Sir2 function, implicating these proteins’
roles in regulating Sir2. Further investigations reveal that the mechanisms
underlying their interactions with Sir2 may be distinct for each protein, suggesting
that there can be multiple signaling pathways from metabolism to Sir2’s
transcriptional regulation activity.
I. Adh1
Among the three studied proteins, the current model of Adh1’s regulation of
Sir2 may be the most straightforward one. Alcohol dehydrogenase 1 (Adh1) is a
glycolytic protein that regenerates NAD through its enzymatic function. We found
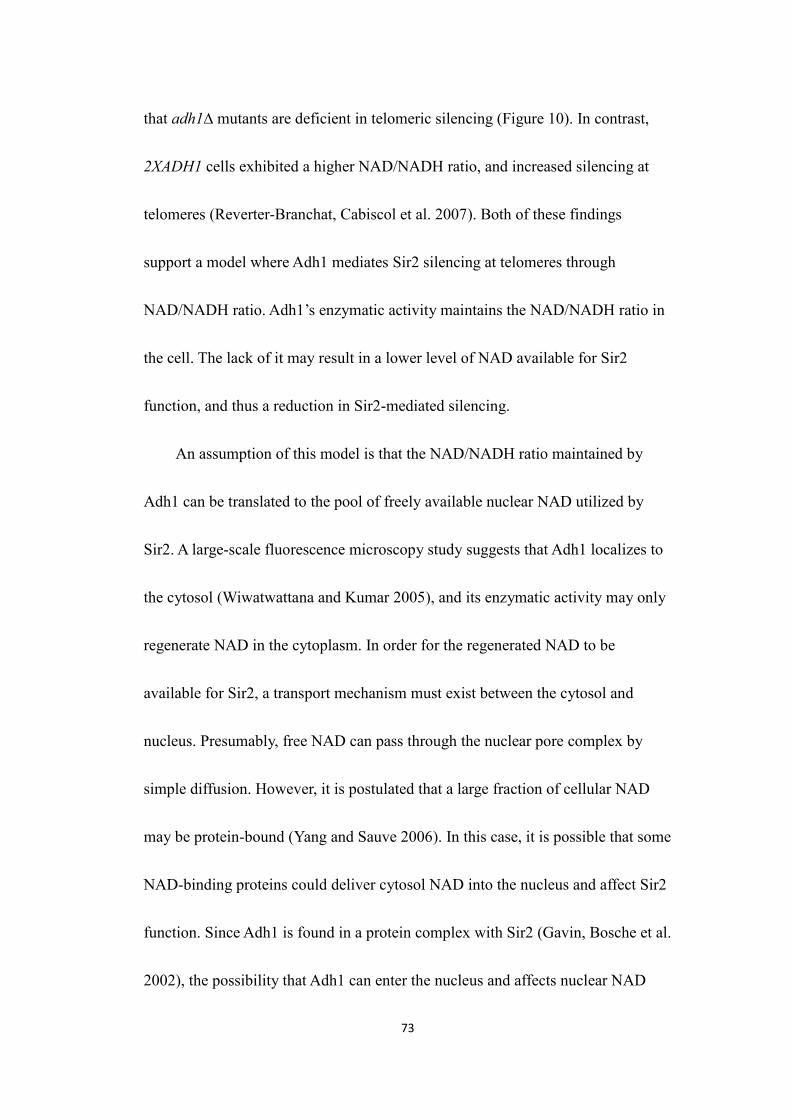
73
that adh1∆ mutants are deficient in telomeric silencing (Figure 10). In contrast,
2XADH1 cells exhibited a higher NAD/NADH ratio, and increased silencing at
telomeres (Reverter-Branchat, Cabiscol et al. 2007). Both of these findings
support a model where Adh1 mediates Sir2 silencing at telomeres through
NAD/NADH ratio. Adh1’s enzymatic activity maintains the NAD/NADH ratio in
the cell. The lack of it may result in a lower level of NAD available for Sir2
function, and thus a reduction in Sir2-mediated silencing.
An assumption of this model is that the NAD/NADH ratio maintained by
Adh1 can be translated to the pool of freely available nuclear NAD utilized by
Sir2. A large-scale fluorescence microscopy study suggests that Adh1 localizes to
the cytosol (Wiwatwattana and Kumar 2005), and its enzymatic activity may only
regenerate NAD in the cytoplasm. In order for the regenerated NAD to be
available for Sir2, a transport mechanism must exist between the cytosol and
nucleus. Presumably, free NAD can pass through the nuclear pore complex by
simple diffusion. However, it is postulated that a large fraction of cellular NAD
may be protein-bound (Yang and Sauve 2006). In this case, it is possible that some
NAD-binding proteins could deliver cytosol NAD into the nucleus and affect Sir2
function. Since Adh1 is found in a protein complex with Sir2 (Gavin, Bosche et al.
2002), the possibility that Adh1 can enter the nucleus and affects nuclear NAD
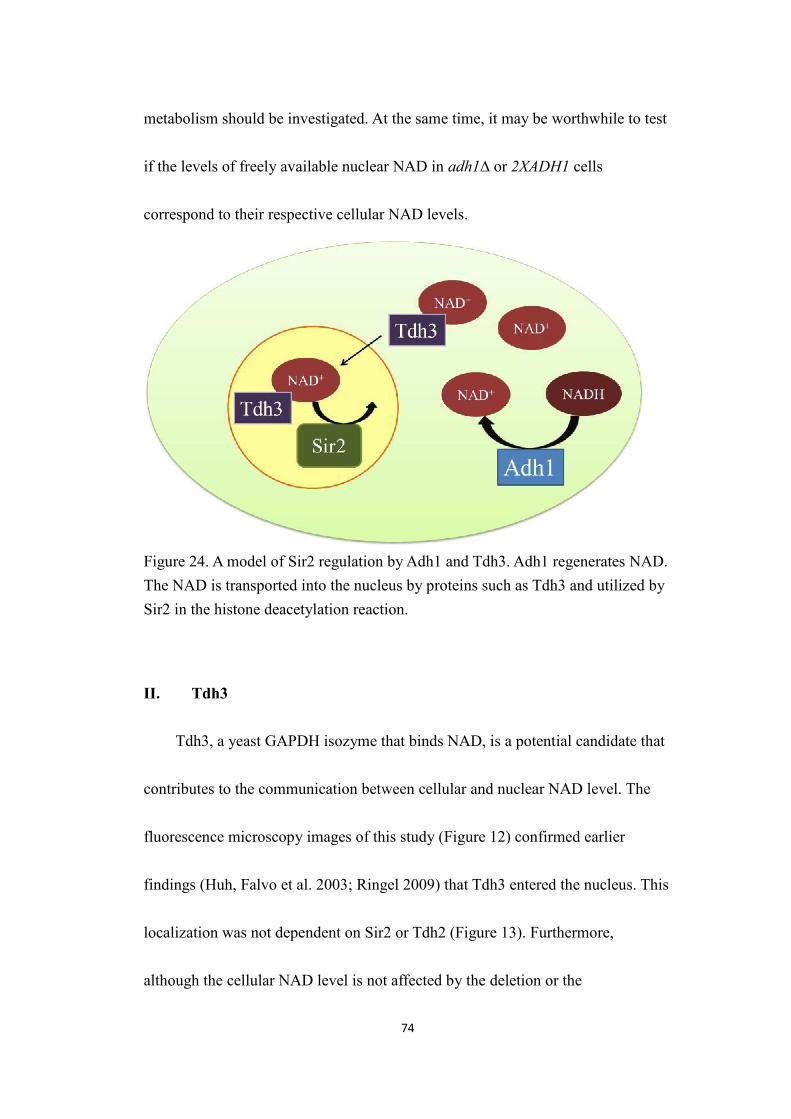
74
metabolism should be investigated. At the same time, it may be worthwhile to test
if the levels of freely available nuclear NAD in adh1∆ or 2XADH1 cells
correspond to their respective cellular NAD levels.
Figure 24. A model of Sir2 regulation by Adh1 and Tdh3. Adh1 regenerates NAD.The NAD is transported into the nucleus by proteins such as Tdh3 and utilized bySir2 in the histone deacetylation reaction.
II. Tdh3
Tdh3, a yeast GAPDH isozyme that binds NAD, is a potential candidate that
contributes to the communication between cellular and nuclear NAD level. The
fluorescence microscopy images of this study (Figure 12) confirmed earlier
findings (Huh, Falvo et al. 2003; Ringel 2009) that Tdh3 entered the nucleus. This
localization was not dependent on Sir2 or Tdh2 (Figure 13). Furthermore,
although the cellular NAD level is not affected by the deletion or the
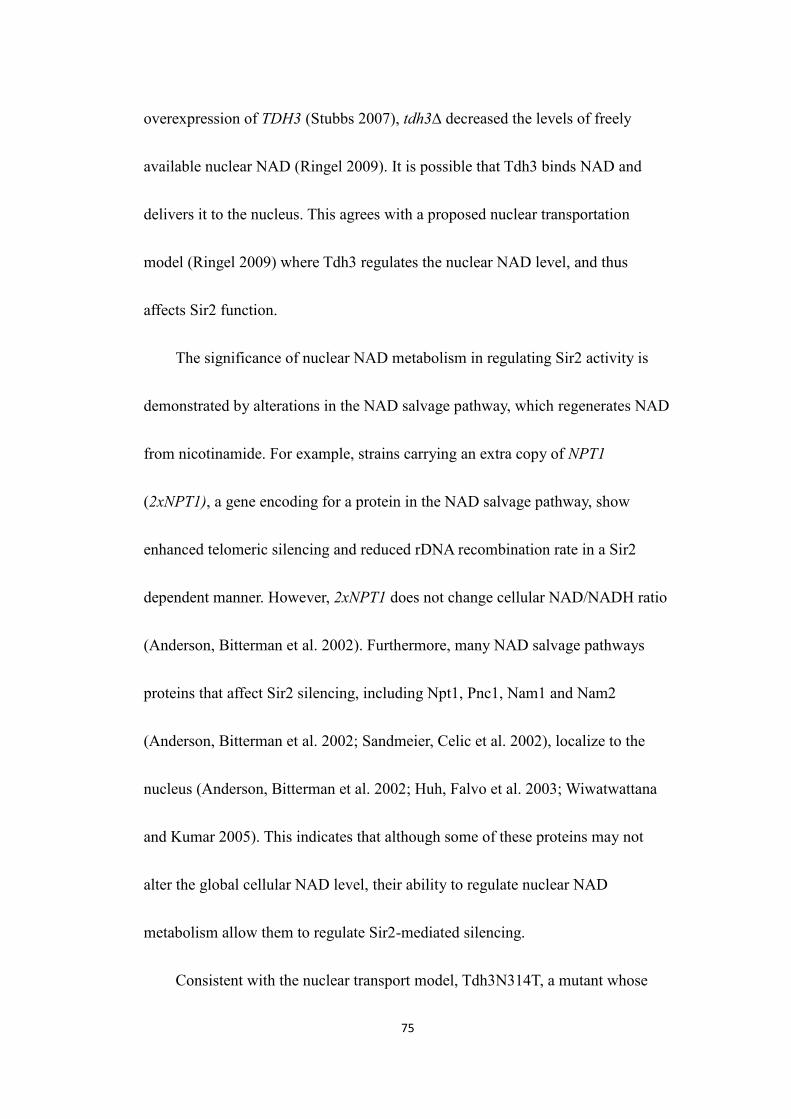
75
overexpression of TDH3 (Stubbs 2007), tdh3∆ decreased the levels of freely
available nuclear NAD (Ringel 2009). It is possible that Tdh3 binds NAD and
delivers it to the nucleus. This agrees with a proposed nuclear transportation
model (Ringel 2009) where Tdh3 regulates the nuclear NAD level, and thus
affects Sir2 function.
The significance of nuclear NAD metabolism in regulating Sir2 activity is
demonstrated by alterations in the NAD salvage pathway, which regenerates NAD
from nicotinamide. For example, strains carrying an extra copy of NPT1
(2xNPT1), a gene encoding for a protein in the NAD salvage pathway, show
enhanced telomeric silencing and reduced rDNA recombination rate in a Sir2
dependent manner. However, 2xNPT1 does not change cellular NAD/NADH ratio
(Anderson, Bitterman et al. 2002). Furthermore, many NAD salvage pathways
proteins that affect Sir2 silencing, including Npt1, Pnc1, Nam1 and Nam2
(Anderson, Bitterman et al. 2002; Sandmeier, Celic et al. 2002), localize to the
nucleus (Anderson, Bitterman et al. 2002; Huh, Falvo et al. 2003; Wiwatwattana
and Kumar 2005). This indicates that although some of these proteins may not
alter the global cellular NAD level, their ability to regulate nuclear NAD
metabolism allow them to regulate Sir2-mediated silencing.
Consistent with the nuclear transport model, Tdh3N314T, a mutant whose
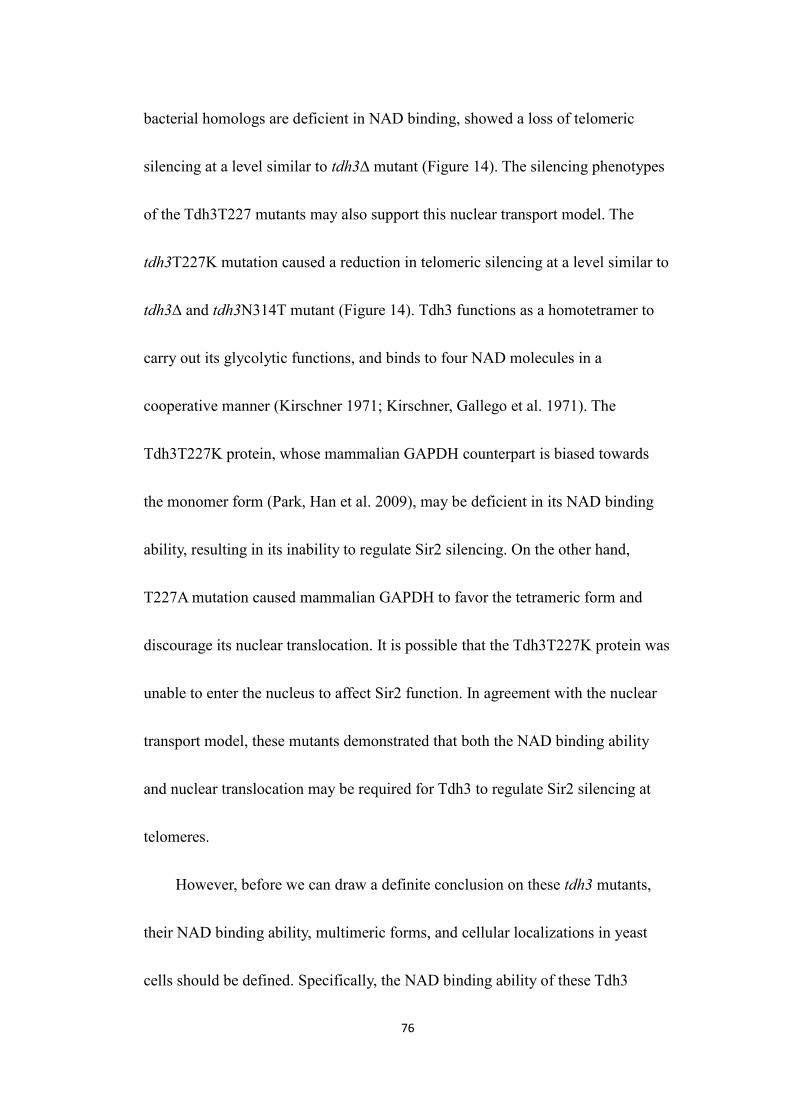
76
bacterial homologs are deficient in NAD binding, showed a loss of telomeric
silencing at a level similar to tdh3∆ mutant (Figure 14). The silencing phenotypes
of the Tdh3T227 mutants may also support this nuclear transport model. The
tdh3T227K mutation caused a reduction in telomeric silencing at a level similar to
tdh3∆ and tdh3N314T mutant (Figure 14). Tdh3 functions as a homotetramer to
carry out its glycolytic functions, and binds to four NAD molecules in a
cooperative manner (Kirschner 1971; Kirschner, Gallego et al. 1971). The
Tdh3T227K protein, whose mammalian GAPDH counterpart is biased towards
the monomer form (Park, Han et al. 2009), may be deficient in its NAD binding
ability, resulting in its inability to regulate Sir2 silencing. On the other hand,
T227A mutation caused mammalian GAPDH to favor the tetrameric form and
discourage its nuclear translocation. It is possible that the Tdh3T227K protein was
unable to enter the nucleus to affect Sir2 function. In agreement with the nuclear
transport model, these mutants demonstrated that both the NAD binding ability
and nuclear translocation may be required for Tdh3 to regulate Sir2 silencing at
telomeres.
However, before we can draw a definite conclusion on these tdh3 mutants,
their NAD binding ability, multimeric forms, and cellular localizations in yeast
cells should be defined. Specifically, the NAD binding ability of these Tdh3
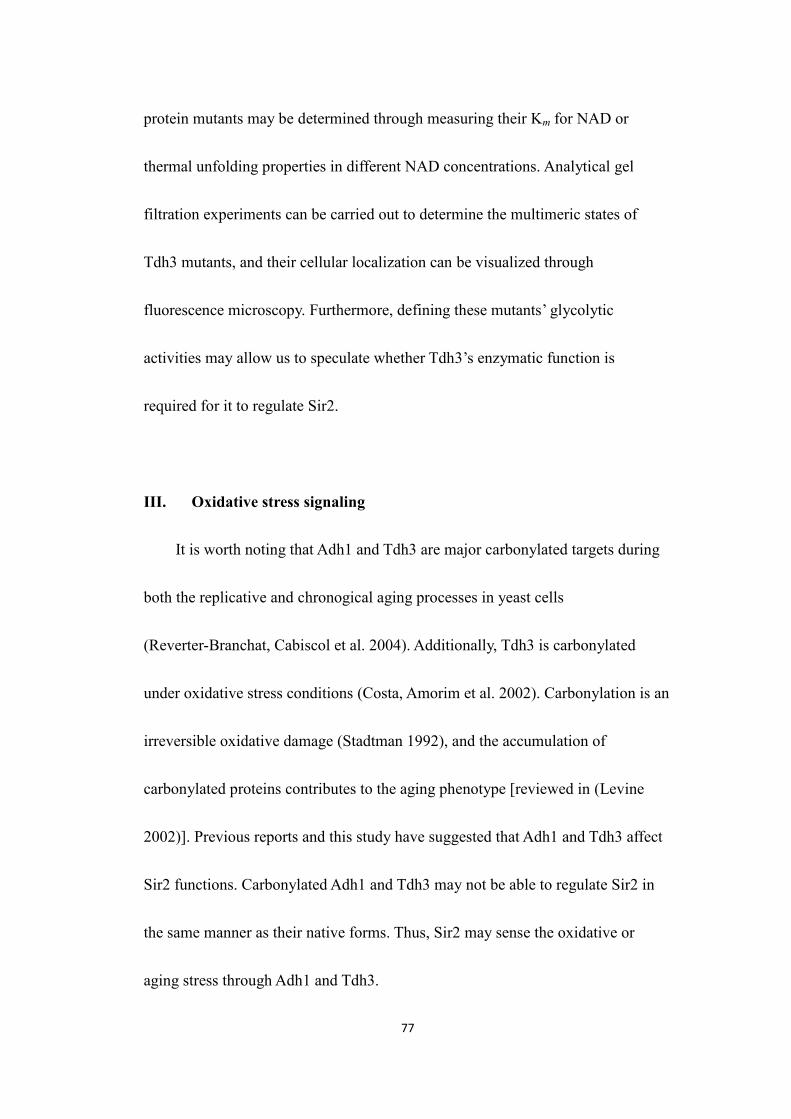
77
protein mutants may be determined through measuring their Km for NAD or
thermal unfolding properties in different NAD concentrations. Analytical gel
filtration experiments can be carried out to determine the multimeric states of
Tdh3 mutants, and their cellular localization can be visualized through
fluorescence microscopy. Furthermore, defining these mutants’ glycolytic
activities may allow us to speculate whether Tdh3’s enzymatic function is
required for it to regulate Sir2.
III. Oxidative stress signaling
It is worth noting that Adh1 and Tdh3 are major carbonylated targets during
both the replicative and chronogical aging processes in yeast cells
(Reverter-Branchat, Cabiscol et al. 2004). Additionally, Tdh3 is carbonylated
under oxidative stress conditions (Costa, Amorim et al. 2002). Carbonylation is an
irreversible oxidative damage (Stadtman 1992), and the accumulation of
carbonylated proteins contributes to the aging phenotype [reviewed in (Levine
2002)]. Previous reports and this study have suggested that Adh1 and Tdh3 affect
Sir2 functions. Carbonylated Adh1 and Tdh3 may not be able to regulate Sir2 in
the same manner as their native forms. Thus, Sir2 may sense the oxidative or
aging stress through Adh1 and Tdh3.
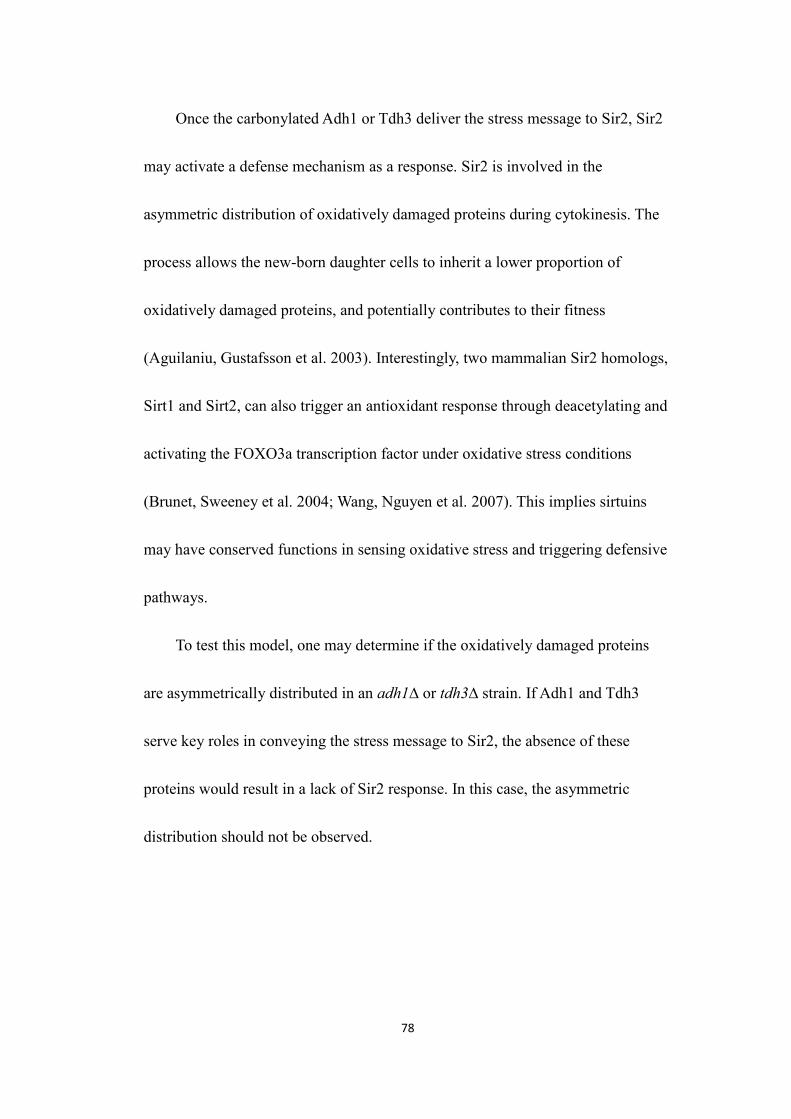
78
Once the carbonylated Adh1 or Tdh3 deliver the stress message to Sir2, Sir2
may activate a defense mechanism as a response. Sir2 is involved in the
asymmetric distribution of oxidatively damaged proteins during cytokinesis. The
process allows the new-born daughter cells to inherit a lower proportion of
oxidatively damaged proteins, and potentially contributes to their fitness
(Aguilaniu, Gustafsson et al. 2003). Interestingly, two mammalian Sir2 homologs,
Sirt1 and Sirt2, can also trigger an antioxidant response through deacetylating and
activating the FOXO3a transcription factor under oxidative stress conditions
(Brunet, Sweeney et al. 2004; Wang, Nguyen et al. 2007). This implies sirtuins
may have conserved functions in sensing oxidative stress and triggering defensive
pathways.
To test this model, one may determine if the oxidatively damaged proteins
are asymmetrically distributed in an adh1∆ or tdh3∆ strain. If Adh1 and Tdh3
serve key roles in conveying the stress message to Sir2, the absence of these
proteins would result in a lack of Sir2 response. In this case, the asymmetric
distribution should not be observed.
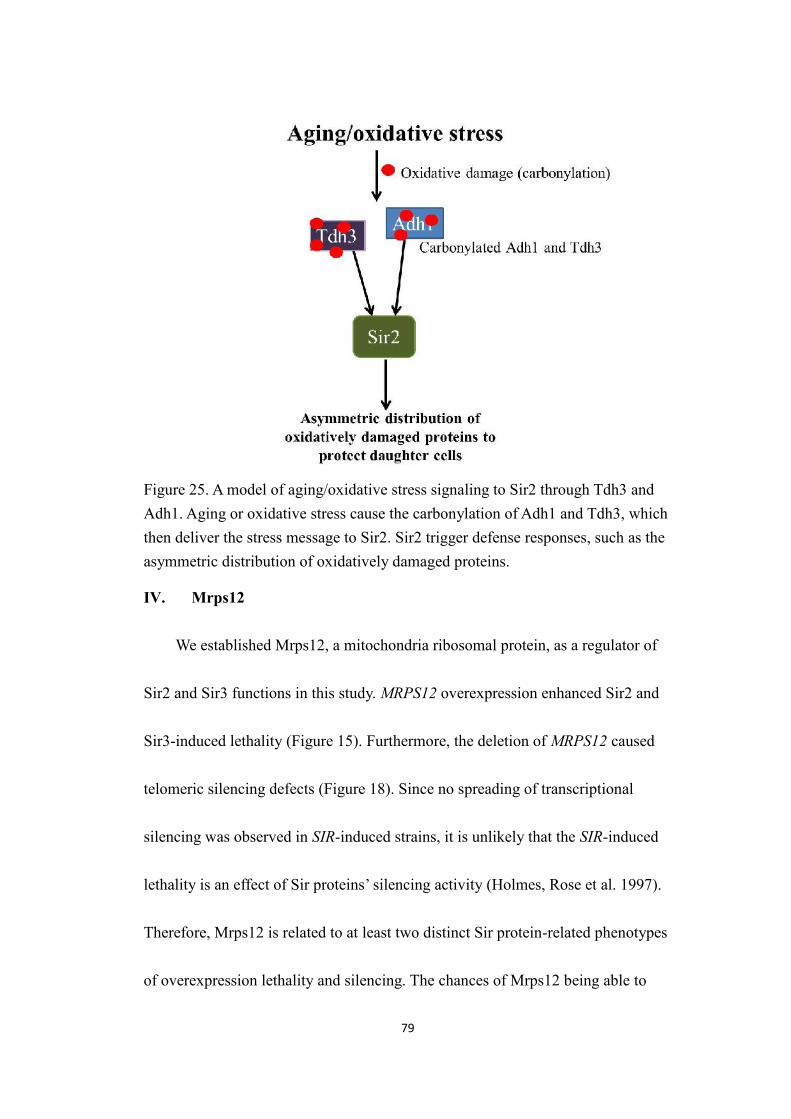
79
Figure 25. A model of aging/oxidative stress signaling to Sir2 through Tdh3 andAdh1. Aging or oxidative stress cause the carbonylation of Adh1 and Tdh3, whichthen deliver the stress message to Sir2. Sir2 trigger defense responses, such as theasymmetric distribution of oxidatively damaged proteins.
IV. Mrps12
We established Mrps12, a mitochondria ribosomal protein, as a regulator of
Sir2 and Sir3 functions in this study. MRPS12 overexpression enhanced Sir2 and
Sir3-induced lethality (Figure 15). Furthermore, the deletion of MRPS12 caused
telomeric silencing defects (Figure 18). Since no spreading of transcriptional
silencing was observed in SIR-induced strains, it is unlikely that the SIR-induced
lethality is an effect of Sir proteins’ silencing activity (Holmes, Rose et al. 1997).
Therefore, Mrps12 is related to at least two distinct Sir protein-related phenotypes
of overexpression lethality and silencing. The chances of Mrps12 being able to
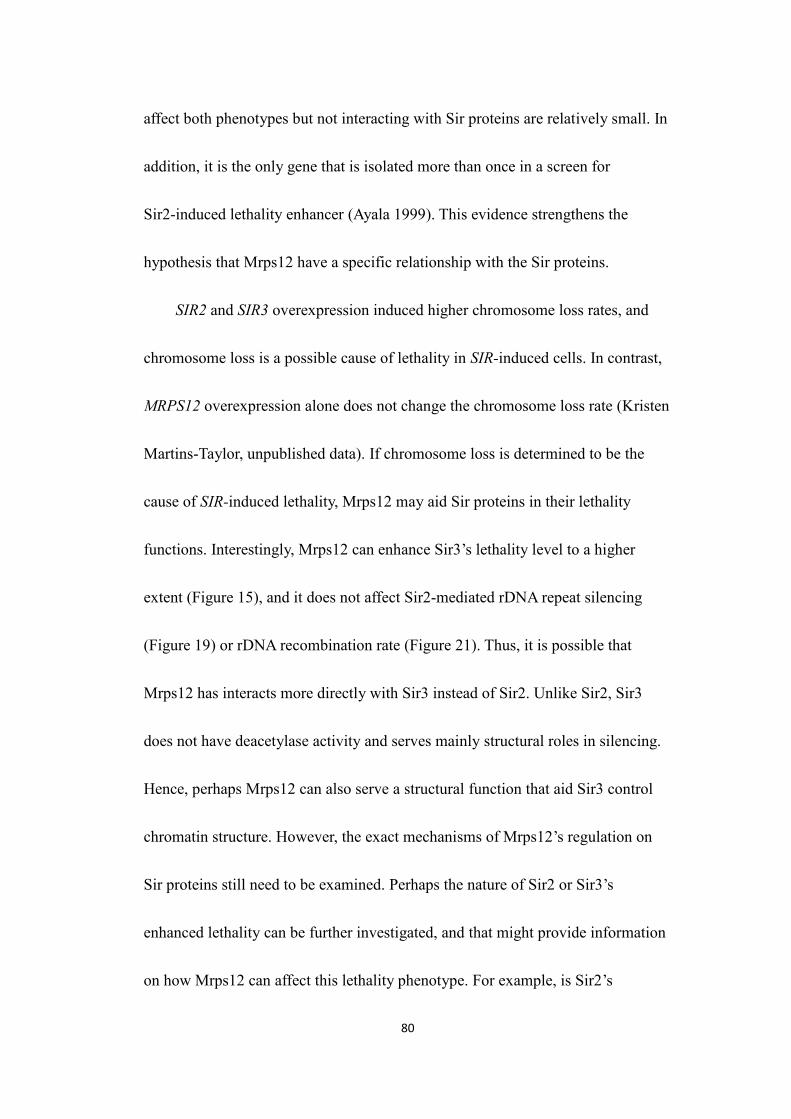
80
affect both phenotypes but not interacting with Sir proteins are relatively small. In
addition, it is the only gene that is isolated more than once in a screen for
Sir2-induced lethality enhancer (Ayala 1999). This evidence strengthens the
hypothesis that Mrps12 have a specific relationship with the Sir proteins.
SIR2 and SIR3 overexpression induced higher chromosome loss rates, and
chromosome loss is a possible cause of lethality in SIR-induced cells. In contrast,
MRPS12 overexpression alone does not change the chromosome loss rate (Kristen
Martins-Taylor, unpublished data). If chromosome loss is determined to be the
cause of SIR-induced lethality, Mrps12 may aid Sir proteins in their lethality
functions. Interestingly, Mrps12 can enhance Sir3’s lethality level to a higher
extent (Figure 15), and it does not affect Sir2-mediated rDNA repeat silencing
(Figure 19) or rDNA recombination rate (Figure 21). Thus, it is possible that
Mrps12 has interacts more directly with Sir3 instead of Sir2. Unlike Sir2, Sir3
does not have deacetylase activity and serves mainly structural roles in silencing.
Hence, perhaps Mrps12 can also serve a structural function that aid Sir3 control
chromatin structure. However, the exact mechanisms of Mrps12’s regulation on
Sir proteins still need to be examined. Perhaps the nature of Sir2 or Sir3’s
enhanced lethality can be further investigated, and that might provide information
on how Mrps12 can affect this lethality phenotype. For example, is Sir2’s
81
enzymatic function required to induce lethality? One could test the lethality
phenotype of an overexpressed catalytically-dead mutant. If the mutant still
caused lethality to cell, would MRPS12 overexpression enhance lethality in this
strain as well? Given the dynamic relationship between mammalian sirtuins and
mitochondria, studying the relationship between yeast Sir2 and Mrps12 may help
us understand how this signaling pathway is evolved.
V. Sir2: a potential regulator of metabolism?
Thus far, this study of Sir2’s relationship with metabolic proteins has been
focused on the regulation of Sir2 functions through metabolism. However, there is
a reasonable possibility that Sir2 can also mediate cell’s metabolic function. In
particular, Sir2 may be able to deacetylate and regulate the functions of specific
metabolic proteins like its bacterial and mammalian homologs.
No direct evidence has shown either one of Adh1, Tdh3 or Mrps12 is
acetylated in yeast cells. However, a bacterial GAPDH is acetylated and its
acetylation is strongly increased in a sirtuin mutant, cobB (Wang, Zhang et al.
2010). Additionally, human GAPDH is shown to be acetylated (Choudhary,
Kumar et al. 2009). Given that GAPDH is functionally conserved, these two
studies suggest that Tdh3 may also be acetylated, and its acetylation status may be
mediated by Sir2.
82
In addition to Tdh3, Mrps12 is another potential acetylation target of
sirtuins. Mice deficient in Sirt3, a mammalian homolog of Sir2 that localizes to
the mitochondria, exhibited mitochondrial protein hyperacetylation, implicating
Sirt3’s role in deacetylating mitochondrial proteins (Lombard, Alt et al. 2007).
Specifically, Sirt3 deacetylates another mitochondria ribosomal protein in
mammals, Mrpl10, and regulates mitochondrial synthesis. Given these results, it
may be worthwhile to investigate the acetylation status of Mrps12, Tdh3 and other
metabolic or mitochondrial proteins in a wild type and sir2∆ strain. Studying the
potential metabolic regulation by Sir2 would help us understand how Sir2 can
help a cell adjust to different metabolic states.
VI. Conclusion
We have demonstrated that three metabolic proteins, Adh1, Tdh3 and Mrps12,
regulate Sir2 and exert distinct effects on Sir2 functions. The links between these
proteins and Sir2 represent potential pathways that a cell can signal its metabolic
state to Sir2’s transcriptional regulation activity. Instead of being controlled solely
by a global NAD level, Sir2 can sense metabolic changes in multiple ways. Thus,
Sir2 may serve as a coordination center between cell metabolism and
transcriptional regulation that orchestrates different gene expression patterns in
response to varied metabolic states of a cell.
83
References
Aguilaniu, H., L. Gustafsson, et al. (2003). "Asymmetric inheritance ofoxidatively damaged proteins during cytokinesis." Science 299(5613):1751-1753.
Anderson, R. M., K. J. Bitterman, et al. (2002). "Manipulation of a nuclearNAD+ salvage pathway delays aging without altering steady-stateNAD+ levels." Journal of Biological Chemistry 277(21):18881-18890.
Anderson, R. M., K. J. Bitterman, et al. (2003). "Nicotinamide and PNC1govern lifespan extension by calorie restriction in Saccharomycescerevisiae." Nature 423(6936): 181-185.
Anderson, R. M., M. Latorre-Esteves, et al. (2003). "Yeast life-spanextension by calorie restriction is independent of NAD fluctuation."Science 302(5653): 2124-2126.
Astrom, S. U., T. W. Cline, et al. (2003). "The Drosophila melanogaster sir2+gene is nonessential and has only minor effects on position-effectvariegation." Genetics 163(3): 931-937.
Ayala, L. (1999). Novel Genes that collaborate with SIR2 in S. CerevisiaeSilencing Mechanism. Bachelor of Arts, Wesleyan University.
Bakker, B. M., K. M. Overkamp, et al. (2001). "Stoichiometry andcompartmentation of NADH metabolism in Saccharomycescerevisiae." FEMS Microbiol Rev 25(1): 15-37.
Balaban, R. S., S. Nemoto, et al. (2005). "Mitochondria, oxidants, andaging." Cell 120(4): 483-495.
Bedalov, A., T. Gatbonton, et al. (2001). "Identification of a small moleculeinhibitor of Sir2p." Proc Natl Acad Sci U S A 98(26): 15113-15118.
84
Bedalov, A., M. Hirao, et al. (2003). "NAD+-dependent deacetylase Hst1pcontrols biosynthesis and cellular NAD+ levels in Saccharomycescerevisiae." Mol Cell Biol 23(19): 7044-7054.
Begley, T. J., A. S. Rosenbach, et al. (2004). "Hot spots for modulatingtoxicity identified by genomic phenotyping and localizationmapping." Mol Cell 16(1): 117-125.
Belenky, P., K. L. Bogan, et al. (2007). "NAD+ metabolism in health anddisease." Trends Biochem Sci 32(1): 12-19.
Blander, G. and L. Guarente (2004). "The Sir2 family of proteindeacetylases." Annu Rev Biochem 73: 417-435.
Blank, H. M., C. Li, et al. (2008). "An increase in mitochondrial DNApromotes nuclear DNA replication in yeast." PLoS Genet 4(4):e1000047.
Brachmann, C. B., J. M. Sherman, et al. (1995). "The SIR2 gene family,conserved from bacteria to humans, functions in silencing, cell cycleprogression, and chromosome stability." Genes Dev 9(23):2888-2902.
Brunet, A., L. B. Sweeney, et al. (2004). "Stress-dependent regulation ofFOXO transcription factors by the SIRT1 deacetylase." Science303(5666): 2011-2015.
Canto, C., L. Q. Jiang, et al. (2010). "Interdependence of AMPK and SIRT1for metabolic adaptation to fasting and exercise in skeletal muscle."Cell Metab 11(3): 213-219.
Cheng, T. H. and M. R. Gartenberg (2000). "Yeast heterochromatin is adynamic structure that requires silencers continuously." Genes Dev14(4): 452-463.
Choudhary, C., C. Kumar, et al. (2009). "Lysine acetylation targets proteincomplexes and co-regulates major cellular functions." Science325(5942): 834-840.
85
Costa, V. M., M. A. Amorim, et al. (2002). "Hydrogen peroxide-inducedcarbonylation of key metabolic enzymes in Saccharomyces cerevisiae:the involvement of the oxidative stress response regulators Yap1 andSkn7." Free Radic Biol Med 33(11): 1507-1515.
Dastoor, Z. and J. L. Dreyer (2001). "Potential role of nuclear translocationof glyceraldehyde-3-phosphate dehydrogenase in apoptosis andoxidative stress." J Cell Sci 114(Pt 9): 1643-1653.
de Ruijter, A. J., A. H. van Gennip, et al. (2003). "Histone deacetylases(HDACs): characterization of the classical HDAC family." Biochem J370(Pt 3): 737-749.
Denu, J. M. (2003). "Linking chromatin function with metabolic networks:Sir2 family of NAD(+)-dependent deacetylases." Trends Biochem Sci28(1): 41-48.
Duee, E., L. Olivier-Deyris, et al. (1996). "Comparison of the structures ofwild-type and a N313T mutant of Escherichia coli glyceraldehyde3-phosphate dehydrogenases: implication for NAD binding andcooperativity." J Mol Biol 257(4): 814-838.
Eberharter, A., R. Ferreira, et al. (2005). "Dynamic chromatin: concertednucleosome remodelling and acetylation." Biol Chem 386(8):745-751.
Evans, C., K. L. Bogan, et al. (2010). "NAD+ metabolite levels as a functionof vitamins and calorie restriction: evidence for different mechanismsof longevity." BMC Chem Biol 10: 2.
Fabrizio, P., C. Gattazzo, et al. (2005). "Sir2 blocks extreme life-spanextension." Cell 123(4): 655-667.
Ferreira-da-Silva, F., P. J. Pereira, et al. (2006). "The crystal and solutionstructures of glyceraldehyde-3-phosphate dehydrogenase revealdifferent quaternary structures." Journal of Biological Chemistry281(44): 33433-33440.
86
Fox, C. A. and K. H. McConnell (2005). "Toward biochemical understandingof a transcriptionally silenced chromosomal domain inSaccharomyces cerevisiae." Journal of Biological Chemistry 280(10):8629-8632.
Fritze, C. E., K. Verschueren, et al. (1997). "Direct evidence for SIR2modulation of chromatin structure in yeast rDNA." EMBO J 16(21):6495-6509.
Frye, R. A. (2000). "Phylogenetic classification of prokaryotic and eukaryoticSir2-like proteins." Biochem Biophys Res Commun 273(2): 793-798.
Fuchs, J. and J. Loidl (2004). "Behaviour of nucleolus organizing regions(NORs) and nucleoli during mitotic and meiotic divisions in buddingyeast." Chromosome Res 12(5): 427-438.
Fujita, K., T. Horie, et al. (2001). "Cross-genomic analysis of thetranslational systems of various organisms." J Ind MicrobiolBiotechnol 27(3): 163-169.
Gavin, A. C., M. Bosche, et al. (2002). "Functional organization of the yeastproteome by systematic analysis of protein complexes." Nature415(6868): 141-147.
Gerhart-Hines, Z., J. T. Rodgers, et al. (2007). "Metabolic control of musclemitochondrial function and fatty acid oxidation throughSIRT1/PGC-1alpha." EMBO J 26(7): 1913-1923.
Goldring, E. S., L. I. Grossman, et al. (1971). "Petite mutation in yeast. II.Isolation of mutants containing mitochondrial deoxyribonucleic acidof reduced size." J Bacteriol 107(1): 377-381.
Goldstein, A. L. and J. H. McCusker (1999). "Three new dominant drugresistance cassettes for gene disruption in Saccharomyces cerevisiae."Yeast 15(14): 1541-1553.
Gottlieb, S. and R. E. Esposito (1989). "A new role for a yeast transcriptionalsilencer gene, SIR2, in regulation of recombination in ribosomal
87
DNA." Cell 56(5): 771-776.
Gottschling, D. E., O. M. Aparicio, et al. (1990). "Position effect at S.cerevisiae telomeres: reversible repression of Pol II transcription."Cell 63(4): 751-762.
Guarente, L. (2006). "Sirtuins as potential targets for metabolic syndrome."Nature 444(7121): 868-874.
Guarente, L. (2008). "Mitochondria--a nexus for aging, calorie restriction,and sirtuins?" Cell 132(2): 171-176.
Guarente, L. and F. Picard (2005). "Calorie restriction--the SIR2 connection."Cell 120(4): 473-482.
Haigis, M. C. and L. P. Guarente (2006). "Mammalian sirtuins--emergingroles in physiology, aging, and calorie restriction." Genes Dev 20(21):2913-2921.
Hanover, J. A. (2001). "Glycan-dependent signaling: O-linkedN-acetylglucosamine." FASEB J 15(11): 1865-1876.
Hara, M. R., N. Agrawal, et al. (2005). "S-nitrosylated GAPDH initiatesapoptotic cell death by nuclear translocation following Siah1binding." Nat Cell Biol 7(7): 665-674.
Hart, G. W., M. P. Housley, et al. (2007). "Cycling of O-linked[beta]-N-acetylglucosamine on nucleocytoplasmic proteins." Nature446(7139): 1017-1022.
Holmes, S. G., A. B. Rose, et al. (1997). "Hyperactivation of the silencingproteins, Sir2p and Sir3p, causes chromosome loss." Genetics 145(3):605-614.
Houtkooper, R. H., E. Pirinen, et al. (2012). "Sirtuins as regulators ofmetabolism and healthspan." Nat Rev Mol Cell Biol 13(4): 225-238.
Huang, J., I. L. Brito, et al. (2006). "Inhibition of homologous recombination
88
by a cohesin-associated clamp complex recruited to the rDNArecombination enhancer." Genes Dev 20(20): 2887-2901.
Huang, Y. (2002). "Transcriptional silencing in Saccharomyces cerevisiaeand Schizosaccharomyces pombe." Nucleic Acids Res 30(7):1465-1482.
Huh, W. K., J. V. Falvo, et al. (2003). "Global analysis of protein localizationin budding yeast." Nature 425(6959): 686-691.
Kaeberlein, M., K. T. Kirkland, et al. (2004). "Sir2-independent life spanextension by calorie restriction in yeast." PLoS Biol 2(9): E296.
Kaeberlein, M., M. McVey, et al. (1999). "The SIR2/3/4 complex and SIR2alone promote longevity in Saccharomyces cerevisiae by twodifferent mechanisms." Genes Dev 13(19): 2570-2580.
Kirschner, K. (1971). "Co-operative binding of nicotinamide-adeninedinucleotide to yeast glyceraldehyde-3-phosphate dehydrogenase. II.Stopped-flow studies at pH 8-5 and 40 degrees C." J Mol Biol 58(1):51-68.
Kirschner, K., E. Gallego, et al. (1971). "Co-operative binding ofnicotinamide-adenine dinucleotide to yeastglyceraldehyde-3-phosphate dehydrogenase. I. Equilibrium andtemperature-jump studies at pH 8-5 and 40 degrees C." J Mol Biol58(1): 29-50.
Kouzarides, T. (2007). "Chromatin modifications and their function." Cell128(4): 693-705.
Lamming, D. W., M. Latorre-Esteves, et al. (2005). "HST2 mediatesSIR2-independent life-span extension by calorie restriction." Science309(5742): 1861-1864.
Landry, J., J. T. Slama, et al. (2000). "Role of NAD(+) in the deacetylaseactivity of the SIR2-like proteins." Biochem Biophys Res Commun278(3): 685-690.
89
Landry, J., A. Sutton, et al. (2000). "The silencing protein SIR2 and itshomologs are NAD-dependent protein deacetylases." Proc Natl AcadSci U S A 97(11): 5807-5811.
Levine, R. L. (2002). "Carbonyl modified proteins in cellular regulation,aging, and disease." Free Radic Biol Med 32(9): 790-796.
Lin, S. J., P. A. Defossez, et al. (2000). "Requirement of NAD and SIR2 forlife-span extension by calorie restriction in Saccharomycescerevisiae." Science 289(5487): 2126-2128.
Lin, S. J., E. Ford, et al. (2004). "Calorie restriction extends yeast life spanby lowering the level of NADH." Genes Dev 18(1): 12-16.
Lin, S. J., M. Kaeberlein, et al. (2002). "Calorie restriction extendsSaccharomyces cerevisiae lifespan by increasing respiration." Nature418(6895): 344-348.
Liou, G. G., J. C. Tanny, et al. (2005). "Assembly of the SIR complex and itsregulation by O-acetyl-ADP-ribose, a product of NAD-dependenthistone deacetylation." Cell 121(4): 515-527.
Lombard, D. B., F. W. Alt, et al. (2007). "Mammalian Sir2 homolog SIRT3regulates global mitochondrial lysine acetylation." Mol Cell Biol27(24): 8807-8814.
Lu, S. P. and S. J. Lin (2010). "Regulation of yeast sirtuins by NAD(+)metabolism and calorie restriction." Biochim Biophys Acta 1804(8):1567-1575.
Matecic, M., S. Stuart, et al. (2002). "SIR2-induced inviability is suppressedby histone H4 overexpression." Genetics 162(2): 973-976.
Mishra, K. and D. Shore (1999). "Yeast Ku protein plays a direct role intelomeric silencing and counteracts inhibition by rif proteins." CurrBiol 9(19): 1123-1126.
Mishra, S., S. R. Ande, et al. (2011). "O-GlcNAc modification: why so
90
intimately associated with phosphorylation?" Cell Commun Signal9(1): 1.
North, B. J. and E. Verdin (2004). "Sirtuins: Sir2-related NAD-dependentprotein deacetylases." Genome Biol 5(5): 224.
Outten, C. E., R. L. Falk, et al. (2005). "Cellular factors required forprotection from hyperoxia toxicity in Saccharomyces cerevisiae."Biochem J 388(Pt 1): 93-101.
Park, J., D. Han, et al. (2009). "O-GlcNAcylation disruptsglyceraldehyde-3-phosphate dehydrogenase homo-tetramer formationand mediates its nuclear translocation " BBA - Prot. & Proteom.1794(2): 254-262.
Pereira, C. V., M. Lebiedzinska, et al. (2012). "Regulation and protection ofmitochondrial physiology by sirtuins." Mitochondrion 12(1): 66-76.
Qin, W., T. Yang, et al. (2006). "Neuronal SIRT1 activation as a novelmechanism underlying the prevention of Alzheimer disease amyloidneuropathology by calorie restriction." Journal of BiologicalChemistry 281(31): 21745-21754.
Ralser, M., S. Michel, et al. (2012). "Sirtuins as regulators of the yeastmetabolic network." Frontiers in Pharmacology 3.
Reid, R. J. and R. Rothstein (2004). "Stay close to your sister." Mol Cell14(4): 418-420.
Reverter-Branchat, G., E. Cabiscol, et al. (2004). "Oxidative damage tospecific proteins in replicative and chronological-agedSaccharomyces cerevisiae: common targets and prevention by calorierestriction." Journal of Biological Chemistry 279(30): 31983-31989.
Reverter-Branchat, G., E. Cabiscol, et al. (2007). "Chronological andreplicative life-span extension in Saccharomyces cerevisiae byincreased dosage of alcohol dehydrogenase 1." Microbiology 153(Pt11): 3667-3676.
91
Revollo, J. R., A. A. Grimm, et al. (2004). "The NAD biosynthesis pathwaymediated by nicotinamide phosphoribosyltransferase regulates Sir2activity in mammalian cells." Journal of Biological Chemistry279(49): 50754-50763.
Ringel, A. E. (2009). Tdh3 (a GAPDH isozyme) is a novel regulator ofSir2-mediated transcriptional silencing in yeast.
Roitel, O., O. Ivinova, et al. (2002). "Thermal unfolding used as a probe tocharacterize the intra- and intersubunit stabilizing interactions inphosphorylating D-glyceraldehyde-3-phosphate dehydrogenase fromBacillus stearothermophilus." Biochemistry 41(24): 7556-7564.
Rusche, L. N., A. L. Kirchmaier, et al. (2003). "The establishment,inheritance, and function of silenced chromatin in Saccharomycescerevisiae." Annu Rev Biochem 72: 481-516.
Sanders, B. D., K. Zhao, et al. (2007). "Structural basis for nicotinamideinhibition and base exchange in Sir2 enzymes." Mol Cell 25(3):463-472.
Sandmeier, J. J., I. Celic, et al. (2002). "Telomeric and rDNA silencing inSaccharomyces cerevisiae are dependent on a nuclear NAD(+)salvage pathway." Genetics 160(3): 877-889.
Sauve, A. A., C. Wolberger, et al. (2006). "The biochemistry of sirtuins."Annu Rev Biochem 75: 435-465.
Schmidt, M. T., B. C. Smith, et al. (2004). "Coenzyme specificity of Sir2protein deacetylases: implications for physiological regulation."Journal of Biological Chemistry 279(38): 40122-40129.
Schreiber Laboratory, B. i. (2012). Retrieved 4/4/12, 2012, fromhttp://www.broadinstitute.org/chembio/lab_schreiber/anims/animations/smdbHDAC.php.
Schwer, B. and E. Verdin (2008). "Conserved metabolic regulatory functionsof sirtuins." Cell Metab 7(2): 104-112.
92
Shah, Z. H., K. M. O'Dell, et al. (1997). "Metazoan nuclear genes formitoribosomal protein S12." Gene 204(1-2): 55-62.
Sinclair, D. A. and L. Guarente (1997). "Extrachromosomal rDNA circles--acause of aging in yeast." Cell 91(7): 1033-1042.
Sirover, M. A. (2005). "New nuclear functions of the glycolytic protein,glyceraldehyde-3-phosphate dehydrogenase, in mammalian cells." JCell Biochem 95(1): 45-52.
Smith, D. L., Jr., J. M. McClure, et al. (2007). "Calorie restriction extends thechronological lifespan of Saccharomyces cerevisiae independently ofthe Sirtuins." Aging Cell 6(5): 649-662.
Smith, J. S., C. B. Brachmann, et al. (2000). "A phylogenetically conservedNAD+-dependent protein deacetylase activity in the Sir2 proteinfamily." Proc Natl Acad Sci U S A 97(12): 6658-6663.
Smolka, M. B., C. P. Albuquerque, et al. (2007). "Proteome-wideidentification of in vivo targets of DNA damage checkpoint kinases."Proc Natl Acad Sci U S A 104(25): 10364-10369.
Stadtman, E. R. (1992). "Protein oxidation and aging." Science 257(5074):1220-1224.
Starai, V. J., H. Takahashi, et al. (2003). "Short-chain fatty acid activation byacyl-coenzyme A synthetases requires SIR2 protein function inSalmonella enterica and Saccharomyces cerevisiae." Genetics 163(2):545-555.
Straight, A. F., W. Shou, et al. (1999). "Net1, a Sir2-associated nucleolarprotein required for rDNA silencing and nucleolar integrity." Cell97(2): 245-256.
Stubbs, H. (2007). Suppressors of SIR2-induced lethality in Saccharomycescerevisiae, Wesleyan University.
Tanny, J. C., D. S. Kirkpatrick, et al. (2004). "Budding yeast silencing
93
complexes and regulation of Sir2 activity by protein-proteininteractions." Mol Cell Biol 24(16): 6931-6946.
Ventura, M., F. Mateo, et al. (2010). "Nuclear translocation ofglyceraldehyde-3-phosphate dehydrogenase is regulated byacetylation." Int J Biochem Cell Biol 42(10): 1672-1680.
Verdin, E., M. D. Hirschey, et al. (2010). "Sirtuin regulation of mitochondria:energy production, apoptosis, and signaling." Trends Biochem Sci35(12): 669-675.
Von Zglinicki, T. (2003). Aging at the Molecular Level, Kluwer Academic.
Wang, F., M. Nguyen, et al. (2007). "SIRT2 deacetylates FOXO3a inresponse to oxidative stress and caloric restriction." Aging Cell 6(4):505-514.
Wang, Q., Y. Zhang, et al. (2010). "Acetylation of metabolic enzymescoordinates carbon source utilization and metabolic flux." Science327(5968): 1004-1007.
Wiwatwattana, N. and A. Kumar (2005). "Organelle DB: a cross-speciesdatabase of protein localization and function." Nucleic Acids Res33(Database issue): D598-604.
Xu, W. and S. Zhao (2011). "Metabolism is regulated by protein acetylation."Frontiers in Biology 6(3): 213-218.
Yang, T. and A. A. Sauve (2006). "NAD metabolism and sirtuins: metabolicregulation of protein deacetylation in stress and toxicity." AAPS J8(4): E632-643.
Yu, J. and J. Auwerx (2009). "The role of sirtuins in the control of metabolichomeostasis." Ann N Y Acad Sci 1173 Suppl 1: E10-19.
Zakian, V. A. (1996). "Structure, function, and replication of Saccharomycescerevisiae telomeres." Annu Rev Genet 30: 141-172.
94
Zhao, S., W. Xu, et al. (2010). "Regulation of cellular metabolism by proteinlysine acetylation." Science 327(5968): 1000-1004.
Zheng, L., R. G. Roeder, et al. (2003). "S phase activation of the histone H2Bpromoter by OCA-S, a coactivator complex that contains GAPDH asa key component." Cell 114(2): 255-266.


![RNA interference (RNAi) [aka post-transcriptional gene silencing (PTGS)]](https://img.pdfslide.us/doc/110x75/56814467550346895db0fc81/rna-interference-rnai-aka-post-transcriptional-gene-silencing-ptgs.jpg)