Embed Size (px)
Citation preview

8092 2020 February 2020
Signaling and Employer Learning with Instruments Gaurab Aryal, Manudeep Bhuller, Fabian Lange

Impressum:
CESifo Working Papers ISSN 2364-1428 (electronic version) Publisher and distributor: Munich Society for the Promotion of Economic Research - CESifo GmbH The international platform of Ludwigs-Maximilians University’s Center for Economic Studies and the ifo Institute Poschingerstr. 5, 81679 Munich, Germany Telephone +49 (0)89 2180-2740, Telefax +49 (0)89 2180-17845, email [email protected] Editor: Clemens Fuest www.cesifo-group.org/wp
An electronic version of the paper may be downloaded · from the SSRN website: www.SSRN.com · from the RePEc website: www.RePEc.org · from the CESifo website: www.CESifo-group.org/wp

CESifo Working Paper No. 8092
Signaling and Employer Learning with Instruments
Abstract
The social and the private returns to education differ when education can increase productivity, and also be used to signal productivity. We show how instrumental variables can be used to separately identify and estimate the social and private returns to education within the employer learning framework of Farber and Gibbons [1996] and Altonji and Pierret [2001]. What an instrumental variable identifies depends crucially on whether the instrument is hidden from, or observed by, the employers. If the instrument is hidden then it identifies the private returns to education, but if the instrument is observed by employers then it identifies the social returns to education. Interestingly, however, among experienced workers the instrument identifies the social returns to education, regardless of whether or not it is hidden. We operationalize this approach using local variation in compulsory schooling laws across multiple cohorts in Norway. Our preferred estimates indicate that the social return to an additional year of education is 5%, and the private internal rate of return, aggregating the returns over the life-cycle, is 7.2%. Thus, 70% of the private returns to education can be attributed to education raising productivity and 30% to education signaling workers’ ability.
JEL-Codes: J240, J310, D830.
Keywords: signaling, human capital, employer learning, instruments.
Gaurab Aryal
Department of Economics University of Virginia
Charlottesville / VA / USA [email protected]
Manudeep Bhuller Department of Economics
University of Oslo & Statistics Norway Oslo / Norway
Fabian Lange Department of Economics
McGill University Montréal / Québec / Canada
[email protected] January 31, 2020 We thank Emily Nix, Leora Friedberg, John Pepper, Edwin Leuven, Peter Arcidiacono and participants at the 2018 Cowles Conference in Honor of Joseph Altonji, 2019 Essen Health Conference and seminar participants at University of Bergen, Ohio State University, Norges Bank, University of Southern California, University of Calgary, Goethe University Frankfurt, University of Alberta, University of British Columbia, University of Sussex, University of Delaware, University of Waterloo, University of Rochester, London School of Economics, Frisch Centre for Economic Research, Tinbergen Institute and Harris School of Public Policy for helpful comments. This project received generous financial support from the Research Council of Norway through grants 194339, 250516, 267428 and 275123, the Social Science and Humanities Research Council of Canada and the Canada Research Chair program.

1 Introduction
Two competing models rationalize the positive relation between earnings and education
that is universally found in data. Ever since Becker [1962], proponents of the human capital
model argue that education increases skills that are valued by employers. By contrast,
the job-market signaling model of Spence [1973] posits that education signals differences in
innate abilities among workers. Signaling, however, is inherently inefficient because workers
expend valuable resources just to signal their productivity. Thus, signaling creates a wedge
between the private returns and the social returns to education.1
Education policy requires empirical guidance on how large this wedge is, which in turn
requires us to identify the social returns and the private returns.2 The difficulties in sep-
arating signaling from human capital models, however, have long been recognized in the
literature; see Lange and Topel [2006] and the references therein. One way forward is to
recognize that if workers use education to signal their abilities at the start of their careers
then employers might also update their beliefs, i.e., learn, about workers’ abilities over time.
In two influential papers, Farber and Gibbons [1996] and Altonji and Pierret [2001]
(henceforth FG and AP, respectively) derive testable predictions of employer learning for
how earnings correlate with schooling and a proxy of unobserved ability at different points
of the life-cycle. In particular, AP use the Armed Forces Qualification Test (AFQT) score in
the NLSY1979 as a proxy for unobserved ability. They show that the variation in earnings
with schooling and the AFQT is consistent with employers that statistically discriminate
on the basis of schooling and learn about workers’ unobserved skills over time. Following
their lead, Lange [2007] shows that employers learn fast. Using the first-order condition
1There are other reasons why the private and social returns might differ from each other. For instance,there can be productive externalities beyond the employer-employee relationship [Acemoglu and Angrist,2000; Moretti, 2004], or education might also entail various non-production and non-pecuniary benefits, e.g.,reducing crime, improving public health [Lange and Topel, 2006; Lochner, 2011; Oreopoulos and Salvanes,2011]. While we abstract from these aspects in this paper, comprehensive measures of social returns ideallyshould aim to account for such spillovers. More broadly, education policy might also be concerned with fiscalexternalities, and be motivated by distributional impacts.
2For more on signaling and the human capital model, see Wolpin [1977]; Tyler et al. [2000]; Bedard[2001]; Fang [2006]; Hopkins [2012]; Clark and Martorell [2014]; Feng and Graetz [2017] and Arteaga [2018].
2

that characterizes schooling decisions, Lange [2007] identifies an upper bound on how much
signaling contributes to the private returns to education over a life-cycle. Lange [2007]
however is unable to point-estimate the private and the social returns to education and to
arrive at his bound, he needs to rely on strong behavioral assumptions regarding the costs of
education. The literature following AP thus relies heavily on the assumption that the AFQT
score is a valid proxy of unobserved ability. Even with this assumption, this literature has
so far only been able to deliver bounds on the private and social returns to education under
untestable behavioral assumptions.
In this paper, we broaden the empirical basis of the employer learning literature by asking:
what do instrumental variable (IV) estimates of the returns to education identify within the
employer learning framework of FG, AP, and Lange [2007]. We show that IV estimates of
the causal effects of education on wages allow us to point-identify the private and the social
returns to education. Unlike Lange [2007], our identification strategy does not rely on the
first-order condition for schooling choices and thus does not require specifying the costs and
benefits of schooling. And, unlike the extant literature that follows AP, our identification
strategy does not require access to a correlate of ability that is unobserved by the employers.
To this end, we present several identification results. First, we show that any conventional
IV estimate of the causal effect of education on wages, measured at sufficiently high level of
work experience, identifies the causal effect of schooling on productivity. This implies that
access to an IV and a repeated cross-section of wages across workers’ careers are sufficient to
identify the productivity effect of schooling. This interpretation of “long-run” IV estimates
follows directly from a limit result in the employer learning model that wages eventually
converge to the true productivity because employers eventually learn workers’ productivities.
Our second set of results illustrate how central the assumptions about employers’ knowl-
edge of the instruments are for interpreting the IV estimates. For that we distinguish between
a hidden IV and a transparent IV. We say that an IV is hidden if it is unobserved by employ-
ers, and that it is transparent if it is observed by the employers and priced into the wages.
3

If the IV is hidden then it identifies the private returns to education at each level of worker
experience; and if the IV is transparent then it identifies the social returns to education. For
our third result, we show how IV estimates measured at different levels of worker experience
identify the speed at which employers learn about workers’ productivity.
In summary, within the FG and AP framework of employer learning, a hidden IV is
sufficient to (i) point-identify the relative contributions of human capital and signaling in
the lifetime returns to education; and (ii) estimate the speed of learning. Any additional
information – either because we have access to multiple instruments or because of the avail-
ability of an ability correlate like the AFQT – allows testing and/or relaxing functional form
assumptions in the employer learning model.
We implement these ideas on a unique dataset consisting of all Norwegian males born
between 1950 and 1980, with earnings histories between 1967 and 2014. Between 1960 and
1975, Norway extended compulsory schooling from 7 to 9 years, but not simultaneously in
the entire country. Instead, compulsory schooling increased at different times for different
municipalities. This reform provides us with a hidden IV based on the local variation in
compulsory schooling across birth cohorts. We also observe an ability correlate in the form
of a cognitive test administered by the Norwegian military to all male conscripts around the
age of 18. This test score is not directly observed by employers.
Using these data, we examine how the IV returns to schooling vary across work expe-
rience, and interpret this through the lens of our employer learning model. The returns to
schooling start high at around 15% in the first year following graduation, and then decline,
rapidly at first and then slowly, until they stabilize to about 5-6%, after approximately 20
years of work experience. These findings are consistent with the hypothesis that employers
use past performance to learn about workers’ productivity, and the assumption that our IV
is hidden from the employers. Like Lange [2007] we find that employers learn fast.
Second, we quantify the contribution of signaling and human capital acquisition to the
lifetime returns to education. Our analysis reveals a productivity effect of education of 5%
4

and a private internal rate of return in lifetime earnings, discounted to the time of schooling
choice, of 7.2%. These estimates suggest that 70% of the private returns to schooling, over
the life-cycle, represents a productivity-enhancing effect of education and the remaining 30%
represents the signaling contribution of education. Thus, we find a non-negligible role for
signaling in explaining the positive returns to education estimated in our data.
Third, we compare our OLS estimates of returns to schooling and cognitive test scores
with estimates from previous studies that use the NLSY data. The patterns we uncover
in the Norwegian data are strikingly similar to those found by FG, AP, Lange [2007], and
Arcidiacono et al. [2010] for the NLSY. In Norway, the estimated return to one standard
deviation increase in the ability score increases from near zero in the first few years in the
labor market to about 7% after around 15 years of experience. The experience pattern in the
NLSY with respect to the AFQT is similar, except that the return to a standard deviation
increase in the AFQT score converges to approximately 14% after 15 years. Controlling for
the interaction between the ability score and experience, we find that OLS estimates of the
coefficients on years of schooling decline rapidly from about 10% to about 3% within the
first 20 years. Likewise, in the NLSY, the returns decline from about 9% to 6%.3
Finally, we consider two important extensions of our model. First, we allow the returns
to skill to vary with experience. That is, we allow for differential on-the-job growth in
productivity over time across workers with different skills. Identifying the signaling value
of education in this model is significantly more challenging because one has to disentangle
the effects of time-varying productivity and the effects of time-varying employer learning on
log-wages. We show that even in this model, a hidden IV identifies the private returns to
education; and a transparent IV identifies the social returns to education. Importantly, we
also show that access to both hidden and transparent IVs is sufficient to identify the speed
3We also find patterns very similar to Arcidiacono et al. [2010] who report that the evidence of employeris concentrated among the less educated. Like them we find that that the association between ability andlog-earnings increases with experience only for those with a high school degree or less. Among those with acollege degree or more, the returns for a one standard deviation increase in the ability score remain constantat around 6-7% across all years of experience.
5

of employer learning and the signaling value of education. However, in this more general
setting it not possible to identify the speed of learning only from a hidden IV.
Second, we revisit the assumption about homogeneous returns made in the FG and
AP framework. In recent decades, the literature on the returns to education [Card, 1999;
Heckman et al., 2006a] has provided evidence that the returns can vary across individuals.
Following this literature, we reframe our analysis within the potential outcomes framework,
e.g., Imbens and Angrist [1994], with a binary schooling outcome such as high or low school-
ing. We show that similar to our setting with homogeneous returns, even in this framework
with heterogeneity, hidden IV identifies the private returns among compliers, and with work
experience these returns converge to the social returns; and transparent IV identifies the
social returns to education. Further, we also consider the identification of the speed of learn-
ing. We show that because the speed of learning itself depends on the level of schooling, the
identification relies on specific assumptions about selection to schooling and heterogeneity
in employer learning across workers with different schooling.
The rest of our paper proceeds as follows. Section 2 describes the model of employer
learning as developed by FG, AP, and Lange [2007] and defines the private and the social
returns to education within this structure. Section 3 then discusses identification of the pri-
vate and the social returns to education in the model of employer learning using instrumental
variables. Section 4 presents the data and our empirical setting. Section 5 contains our main
empirical findings. We consider extensions to models with time-varying productivity returns
and heterogeneous returns, respectively, in Section 6. We conclude in Section 7.
2 Model of Employer Learning
In this section, we present the model of employer learning in a perfectly competitive labor
market, first proposed by FG and AP. Let worker i’s productivity be given by
χit = exp (βwsSi + βwqQi + Ai +H(t) + εit) ≡ exp(ψit), (1)
6

where S is the years of schooling, Q is a correlate of ability observed by employers but
unobserved by researchers, and A is ability unobserved (to employers and researchers) and
possibly correlated with the employer-observed correlates (S,Q). An example of a Q could
be knowledge of foreign languages, which is typically mentioned in job applicants’ resumes
and that can easily be verified. The function H(t) captures how log-productivity varies
with experience t = 0, 1, . . . ,∞. While we allow H(t) to be a nonparametric function of
t, we assume that it does not depend on either schooling or ability.4 Finally, εt represents
time-varying noise in the production process that is independent of all other variables.
To model employer learning we follow Lange [2007] and assume that εiti.i.d∼ N (0, σ2
ε) and
(Si, Qi, Ai)i.i.d∼ N (µ,Σ), across workers and across time.5 Let σ2
0 = V ar(Ai|Si, Qi) be the
conditional variance of Ai given (Si, Qi). Besides knowing (Si, Qi), every period employers
also observe total output (χit), which is equivalent to observing a signal ξit := Ai + εit
about i’s productivity. If we let Eit denote employers’ information about i in period t, then
Eit = (Si, Qi, ξti) with ξti = {ξiτ}τ<t as the history of all past signals.6
Assuming (Si, Qi, Ai) are jointly normal random variables implies that the conditional
expectation of Ai given information at t = 0, E [Ai|Ei0] = E [Ai|S,Q], is linear in (S,Q)
Ai = φA|SSi + φA|QQi + εA|S,Q, (2)
where εA|S,Q := Ai−E [Ai|S,Q]. Under perfect competition workers are paid their expected
output, conditional on the information available to the employers. The wage in period t
is then equal to the expected productivity conditional on Eit, so that Wit = E [χit|Eit] =
E [χit|Si, Qi, ξti ]. Taking the expectation of the log of (1) and using the fact that exp(Ai+εit)
4 When estimating (Section 4.4) we use H(t,Xi) which allows the experience profile to vary flexibly withindividual characteristics that include a full set of dummies for birth cohort and municipality, Xi. In Section6.1 we study the identification of an extension of our model where schooling and experience are nonseparable.
5 For much of what follows, S need not be Gaussian, but it simplifies the exposition of the argument.Without it, we would work with a linear projection of Ai on Si and Qi instead of the Equation (2).
6We assume that all employers have symmetric information about workers’ ability and past outputs. Forassessment of how to test asymmetry among current and potential employers and its effect on labor marketoutcomes, see, e.g., Kahn [2013], Pinkston [2009], Schonberg [2007] and Waldman [1984], among others.
7

is log-normal with conditional variance vt = V ar (Ai + εit|Eit), we get
lnWit = βwsSi + βwqQi + H (t) + E [Ai|Eit] , (3)
where H(t) ≡ H (t) + 12vt collects the terms that vary only with t but not across the realiza-
tions of ξti . For notational simplicity, we suppress H (t) until our empirical implementation.
We can use the Kalman filter to represent the process by which employers update their
expectations E [Ai|Eit]. It allows us to write the expectation of ability in a simple form as
E [Ai|Eit] = θtE [Ai|S,Q] + (1− θt) ξti , (4)
where ξti = 1t
∑τ<t ξiτ is the average of signals up to period t and θt = 1−κ
1+(t−1)κis the weight
on the initial signal (S,Q) with κ =σ20
σ20+σ2
ε∈ [0, 1]. In particular, equation (4) shows that
the conditional expectation of ability at time t is the weighted average of the expectation
at t = 0, before any additional information about productivity has been received, and the
average of all additional signals up to period t received by the employers.
The weight θt declines with experience (t) because with time, observed measures of
productivity become better predictors of productivity than the correlates (S,Q), which were
the only information available at t = 0. The rate at which θt declines, however, depends
on the parameter κ that Lange [2007] refers to as the “speed of learning.” The speed of
learning governs how quickly information about productivity accumulates in the market,
which depends on the information contained in the signals. In particular, if the signal-
to-noise ratio is high, i.e., when the variance of noise (ε) in production is small, so that
σ2ε/σ
20 is small, then κ will be close to 1, and the market quickly learns the ability A. But,
irrespective of κ, after a sufficiently long work experience employers will put all weights on
the new information, i.e., limt→∞ θt = 0, and the initial productivity correlates will become
less important determinants of earnings.
8

Social and Private Returns to Education
Next, we define social returns and private returns to education. To that end, note that
the coefficient βws in Equation (1) is not the causal effect of education on productivity,
but it is instead only the “partial” causal effect of schooling, holding the employer-observed
ability correlate, Q, and unobserved ability, A, fixed. Schooling, however, can causally affect
both Q and A, so the “total” causal effect of schooling on productivity also includes the
(indirect) effect on productivity mediated through (Q,A). We refer to this total causal
effect as the social returns to education. Education moreover also affects wages through
employers’ expectations about the ability of a worker, and these expectations can change
over the life cycle. We define private returns to be the expected earnings increase from an
additional year of schooling evaluated at the beginning of a life-cycle.
To formalize these two measures of returns, we need new notations and a simplifying
assumption. For a random variable Y , let δY |S denote the causal effect of S on Y and let
Y denote the part of Y that is not caused by schooling S but may correlate with S. More
formally, we assume that the conditional expectation of Y is additively separable and linear
in S. Furthermore, we let there be a linear causal relationship between S and (Q,A), i.e.,
Qi = δQ|SSi + Qi; and Ai = δA|SSi + Ai. (5)
Then, substituting (Q,A) from the above equations into Equation (1), we obtain
ψit =(βws + βwqδ
Q|S + δA|S)︸ ︷︷ ︸
:=δψ|S
Si + βwqQi + Ai + εit︸ ︷︷ ︸:=uit
≡ δψ|SSi + uit. (6)
The first term, δψ|S, in (6) is the total causal effect of schooling on productivity, or the social
return to education, and it captures the causal effect (direct and indirect) on other ability
components (Q,A). Thus (6) shows that an extra year of schooling increases Q by δQ|S
units, which in turn raises productivity by βwq, and it also raises ability A by δA|S units.
9

Consider now the private returns to education. Schooling can affect expected log-earnings
at t in three different ways: (i) directly, because employers use schooling to form expectations
about productivity; (ii) indirectly, because schooling may impact Q observed by employers
(as shown above in Equation (5)); and (iii) through learning, because schooling affects pro-
ductivity, which employers learn over time by observing workers’ outputs.
Substituting (2) and (4) in (3), and using ξti = 1tΣτ<t (Ai + εiτ ) = Ai + εti and that
E(Ai|Si, Qi) is linear and separable in Si andQi we get log-earnings as lnWit =(βws + θtφA|S
)Si+(
βwq + θtφA|Q)Qi + (1− θt) (Ai + εti) . Again using (5) in the above equation, we obtain
lnWit =(βws + θtφA|S
)Si +
(βwq + θtφA|Q
) (δQ|SSi + Qi
)+ (1− θt)
(δA|SSi + Ai + εti
)=
(βws + βwqδ
Q|S + δA|S + θt(φA|S + φA|QδQ|S − δA|S)
)︸ ︷︷ ︸:=δ
W |St
Si
+(βwq + θtφA|Q
)Qi + (1− θt)
(Ai + εti
)︸ ︷︷ ︸
:=uit
= δW |St Si + uit. (7)
The coefficient of schooling, δW |St , in Equation (7) is the private return to education. Com-
paring this coefficient with the coefficient in Equation (6), we get the following relationship:
δW |St︸︷︷︸
private returns
= δψ|S︸︷︷︸social returns
+ θt︸︷︷︸weight
(φA|S + φA|Qδ
Q|S − δA|S)︸ ︷︷ ︸
adjustment term
. (8)
Thus the private returns δW |St differs from the social return δψ|S if the effect of schooling
on expected A based on the information available to firms, which is captured by (φA|S +
φA|QδQ|S), differs from the causal effect of schooling on unobserved ability δA|S. The signal-
ing literature assumes that this “adjustment term” is non-negative, so that education has
signaling value, which in turn implies that δW |St ≥ δψ|S. For instance, in Spence [1973], the
ability is fixed and does not vary with S, i.e., δA|S = 0, implying that the adjustment term
is positive. While we think that the adjustment term being non-negative is consistent with
the theory of signaling, in a general model like ours, whether employers’ expectations of
10

worker productivity overshoot or undershoot the causal effect of schooling on ability is as
an empirical question. This wedge between private and social returns, however, disappears
with work experience, i.e., limt→∞ δW |St = δψ|S because limt→∞ θt = 0.
3 Identification
In this section, we study the identification of the social and private returns to education.
We show how commonly used estimators (e.g., ordinary least squares and instrumental
variables) are related to the private returns to education, the social returns to education,
and the speed of learning defined above. We begin by considering least-squares projections
of log-earnings on education over the life-cycle and then consider how one might proceed if
additional information is available in the form of: (i) a correlate of ability not observed by
the employers (e.g., AFQT score); and/or (ii) an instrument for schooling. We show that
what IV identifies depends crucially on whether the IV is observed by employers.
3.1 Bias in the OLS
Begin by considering the regression of log-earnings on years of schooling for any given level
of experience. Using Equation (7), we can derive the probability limit of the OLS estimate
of the coefficient for schooling, evaluated at experience t, to be
plim bOLSt = δW |St︸︷︷︸
private returns
+(βwq + θtφA|Q
) cov(Q, S)
var(S)+ (1− θt)
cov(A, S)
var(S)︸ ︷︷ ︸omitted variable bias
. (9)
The OLS estimate of the schooling coefficient is a biased estimate of the experience-specific
private return δW |St because the omitted ability components (Q, A) correlate with, but are
not caused by, schooling. This omitted ability bias is the main reason why researchers rely
on IV(s) to identify the returns to education. The magnitude of bias depends on the speed
of learning, κ, which determines the weight θt employers put at time t on the initial signal.
11

Now, let us consider what happens to this bias as workers accumulate work experience,
i.e., as t→∞. Taking the limit in (9) and using limt→∞ δW |St = δψ|S from (8) we get
plim(
limt→∞
bOLSt
)= δψ|S︸︷︷︸
social returns
+cov(βwqQ+ A, S
)var (S)︸ ︷︷ ︸
remaining bias
. (10)
Thus, even after employers observe a long history of outputs, the bias does not disappear.
We conclude that the OLS does not identify the private or the social returns to education.
3.2 Exploiting a Hidden Correlate of Ability
Now suppose that we have access to a correlate of ability, denoted by Z, and suppose Z
is unobserved by employers. We refer to this as a “hidden” correlate of ability. Further-
more, suppose that Ai = βAzZi + ηi, ηi ⊥ Zi so that ηi represents the productivity compo-
nent observed by neither researchers nor employers.7 Substituting Ai in Equation (1) gives
χit = exp (βwsSi + βwqQi + βAzZi + ηi +H(t) + εit) = exp(ψit), and following the steps from
Section B in [Lange, 2007], we can show that
E [lnWit|S,Z, t] = θtE [lnWi0|S,Z] + (1− θt)E [lnWi∞|S,Z] , (11)
where Wi0 is the wage received in period t = 0 and Wi∞ is the wage received at t→∞, when
enough information has been revealed so that worker productivity is known in the market.
The linearity of (11) allows us to estimate the speed of learning, κ, by projecting log-earnings
on (S,Z) across different work experience levels, t, because the weight θt depends only on
κ. Thus, the regression coefficients of log-earnings on (S,Z) converge from their t = 0 value
to their t =∞ value at a rate that depends only on κ, thereby identifying κ.
The projection coefficients obtained from estimating (11) across different experience lev-
7 βwq in Equation (1) accounts for variation in productivity with Q. Therefore, omitting Q in theprojection of Ai on Zi simply represents a normalization.
12

els, however, do not identify the causal effect of S or Z on productivity. These coefficients
are biased (even when t → ∞) because (S,Z) can be correlated with the omitted variables
(Q, η). Thus, while we can identify κ if we have a hidden correlate of ability, we cannot
identify the private or the social returns to education without additional information.
3.3 Instrumental Variables
Next, suppose that we have access to a binary instrument variable Di ∈ {0, 1}. In other
words, suppose Di satisfies the following standard assumptions for a valid IV.
Assumption 1. Instrumental Variables
1. (Exogeneity): uit ⊥ Di, where uit is defined in (6).
2. (First Stage): E[Si|Di = 0] 6= E[Si|Di = 1].
Under Assumption 1, for a binary instrument Di, in period t we get
plim bIVt :=E [lnWit|Di = 1, t]− E [lnWit|Di = 0, t]
E [Si|Di = 1, t]− E [Si|Di = 0, t]. (12)
Furthermore, using the fact that S is constant across t and limt→∞ lnWit = ψi, we get
plim(
limt→∞
bIVt
)=
E [ψi|Di = 1]− E [ψi|Di = 0]
E [Si|Di = 1]− E [Si|Di = 0]= δψ|S, (13)
where the second equality follows from Assumption 1-(1), which implies that the part of the
productivity, ψi, not caused by schooling, S, is orthogonal to the instrument, D. Thus, as
t → ∞ the IV identifies the causal effect of schooling on productivity. In other words, the
IV estimate of returns to education at sufficiently high levels of experience is a consistent
estimator of the causal effect of schooling on productivity.
Note that this identification strategy is valid irrespective of what the employers know
about D. Heuristically, in the long run everything about a worker’s ability is revealed to the
13

employers, and thus knowledge of the instrument itself has become irrelevant for wage setting.
For intermediate work experience (i.e., t <∞), however, what the IV identifies depends on
whether or not D is hidden from the employers. To determine how the information of
employers affects the interpretation of the IV estimates, we distinguish between hidden and
transparent instruments next.
Hidden Instrument
We begin with a setting where the instrument is unobserved by the employers, i.e., when Dh
is a hidden IV. We use the superscript h to refer a hidden IV.
Assumption 2. (Hidden Instrument) For all i,Dhi 6∈ Eit which implies lnWit⊥Dh
i |(Si, Qi, ξti).
Note that Assumption 2 is conceptually different from Assumption 1-(1). The latter as-
sumption asserts that the IV is conditionally independent of the determinants of productivity
not caused by schooling, whereas Assumption 2 captures the idea that given the information,
Et, wages do not depend on the instrument Dh, so lnWit = E [ψi|Eit] = E [ψi|Eit, Di].
The numerator in Equation (12) for a binary, hidden IV, Dhi , is
E[lnWit|Dh
i = 1]− E
[lnWit|Dh
i = 0]
= E[βwsSi + βwQQi + E
[Ai|Si, Qi, ξ
ti
]|Dh
i = 1, t]
−E[βwsSi + βwQQi + E
[Ai|Si, Qi, ξ
ti
]|Dh
i = 0, t]
where lnWit does not directly depend on Dhi because it is not used by the employers in the
wage setting. The IV, Dhi , affects lnWit only indirectly by affecting (Si, Qi, ξ
ti) that makes
up the information Eit used by employers to infer productivity. From Assumption 1 and
Equation (5) we get E[Qi|Dh
i , Si
]= δQ|SSi + Qi. Using that with Equation (2), the fact
that Dhi ⊥ Qi, and simplifying further gives
E[lnWit|Dh
i , t]
=((βws + βwQδ
Q|S)+ θt(φA|S + φA|Qδ
Q|S)+ (1− θt) δA|S)E[Si|Dh
i
],
=(δψ|S + θt
(φA|S + φA|Qδ
Q|S − δA|S))
E[Si|Dh
i
].
14

Then, taking the probability limit, we get
plim bIVh
t =E[lnWit|Dh
i = 1]− E
[lnWit|Dh
i = 0]
E[Si|Dh
i = 1]− E
[Si|Dh
i = 0] = δψ|S + θt
(φA|S + φA|Qδ
Q|S − δA|S).(14)
Comparing Equation (14) with the private returns defined in Equation (8), we can conclude
that, for every work experience level t, the hidden IV identifies the private returns to ed-
ucation, i.e., plim bIVh
t = δW |St . Further, we note that plim bIV
h
t converges to the social
return to education, δψ|S, as t → ∞. Thus, having access to a hidden IV and a repeated
cross-section of wages across workers’ careers is sufficient to identify the productivity effect
of education, i.e., the social return, as well as, the signaling value of education.
Besides the private and the social returns, a hidden IV also identifies the speed of learning
κ. To see this, note that we can express the probability limit of the hidden IV estimator as
plim bIVh
t = θt × bIV0 + (1− θt)× bIV∞ , where bIV0 is the private return to education at t = 0,
bIV∞ is the social return to education, and θt = 1−κ1+(t−1)κ
is the weight defined in Equation (4).
Using the IV estimates for all t = 0, . . . , T , we can estimate the RHS parameters using the
non-linear least squares method. Heuristically, we can “solve” for {bIV0 , bIV∞ , κ} from bIVh
t for
t = 0, . . . , T , and once we know κ we can determine θt for each t.
In many settings, Assumption 2 is a natural assumption. The clearest examples relate to
field experiments that provide subsidies or information that induce higher school enrollment.
In these cases, whether a student is in the control or treatment group is typically not known
to the (potential) employers. Some examples of hidden instruments from the empirical
literature in quasi-experimental settings include (i) the interaction of draft lottery number
and year of birth in Angrist and Krueger [1992]; (ii) the interaction of a policy intervention,
family background and season of birth in Pons and Gonzalo [2002]; (iii) parents’ education
and number of siblings in Taber [2001]; and (iv) the elimination of student aid programs
interacted with an indicator for a deceased father in Dynarski [2003]. Besides these, many
studies also exploit interactions of birth year and location of birth with locally implemented
15

policy reforms, e.g., Duflo [2001] and Meghir and Palme [2005], which are similar to our IV.
Transparent Instrument
We say that an instrumental variable is transparent if it is known to the employers and is
thus “priced-in” the wages. In other words, if the IV, Dt, is transparent, it is included in the
information set of the employers, but it is still a valid IV because it satisfies Assumption 1.
Let Eit := Eit ∪ {Dti} be the new set of information employers have about i in t.
Assumption 3. (Transparent Instrument) Employers observe Dti so that lnWit = E[ψit|Eit].
By Assumption 1, we have that transparent instruments satisfy the exclusion restriction
with respect to productivity ψ. Assumption 3, however, implies that the instrument is used
in wage setting and thus will not be orthogonal to wages conditional on schooling and other
controls. So if Dt is transparent, it violates the exclusion restriction for wages and thus does
not estimate the causal effect of schooling on individual wages (which is the private return),
but it estimates the social returns (the effect on productivity). To see the intuition as to how
transparent IV identifies the social returns to education, consider two workers i 6= j, who
have the same abilities and past outputs but different realizations of the instrument. Suppose
Dti = 1 but Dt
j = 0 and Si > Sj. Dt is transparent, so employers can deduce that Si > Sj
because of Dt and and not because of A. So if lnWi ≥ lnWj then this wage difference can
be attributed to the productivity effect of schooling. Therefore if the employers are informed
about the instrument, the IV estimate of returns to education is a consistent estimate of the
productivity effect of education on earnings, i.e.,
E[lnWit|Si, Dt
i
]= E
[δψ|SSi + ψ|Si, Dt
i
]= δψ|S × Si;
E[lnWit|Dt
i
]= δψ|SE
[Si|Dt
i
].
Hence the Wald estimator for a transparent IV, Dt, identifies the social returns to education
at all t, i.e., plim bIVt
t = δψ|S. Unlike the hidden IV, however, access to a transparent IV is
16

not sufficient to identify the signaling value of education or the speed of employer learning.
Examples of instruments used in the literature that are more likely to be transparent
than not are (i) tuitions at two- and four-year state colleges in Kane and Rouse [1995]; (ii)
a dummy for being a male aged 19-22 from Ontario in Lemieux and Card [2001]; (iii) local
labor market conditions in Cameron and Heckman [1998]; Cameron and Taber [2004] and
Carneiro et al. [2011]; (iv) change in minimum school-leaving age in the U.K. from 14 to 15
in Oreopoulos [2006]; and (v) the distance to the college in Card [1993], Kane and Rouse
[1995], Kling [2001] and Cameron and Taber [2004].
4 Data and Empirical Setting
In this section, we first describe our data sources, sample construction and the key variables
utilized in our analysis. Then we describe the Norwegian compulsory schooling reform that
we utilize as a source of exogenous variation in educational attainment to construct IV
estimates of the returns to education in log-earnings at each year of experience. Finally, we
discuss the empirical specifications motivated by the discussion in Section 3.
4.1 Data Sources and Sample Construction
Our empirical analysis uses several registry databases maintained by Statistics Norway.
These databases allow us to construct a rich longitudinal dataset containing records for
all Norwegian males from 1967 to 2014. We observe demographic information (e.g., co-
hort of birth and childhood municipality of residence) and socio-economic information (e.g.,
years of schooling and annual earnings) for these individuals. Importantly, the dataset also
includes a unique personal identifier which allows us to follow individuals’ earnings across
time. The personal identifier also allows us to merge information on IQ test scores for males
from the Norwegian Armed Forces to our dataset.
The Norwegian earnings data have several advantages over those available in most other
17

countries. First, there is no attrition from the original sample other than natural attrition due
to either death or out-migration. Second, our earnings data pertain to all individuals, and are
not limited to some sectors or occupations. Third, we can construct long earnings histories
that allow us estimate the returns to education at each year of labor market experience.
We restrict our sample to Norwegian males born between 1950 and 1980, including several
cohorts with earnings observed over a wide-range of labor market experiences.8 We restrict
the sample to males because the military IQ test scores are not available for females. We
further exclude immigrants as well as Norwegian males with missing information on either
of the following variables, including years of schooling, childhood municipality of residence,
IQ test score, or exposure to the compulsory schooling reform. Applying these restrictions
we retain a sample consisting of 732,163 Norwegian males born between 1950 and 1980.
Our primary outcome variable is the natural logarithm of pre-tax annual labor earnings.9
To limit variation in earnings across labor market experience due to the intensity of hours
of work, we focus only on full-time workers who are defined as having annual labor earnings
(adjusted for wage inflation) above the substantial gainful activity threshold (henceforth,
SGA) as defined by the Norwegian Social Security System.10 Restricting the sample to full-
time employed males, we retain 718, 237 individuals–thus most males are recorded having
a full-time employment spell at least once–and a panel data set comprising 14, 746, 755
person-year observations. On average an individual is thus observed working full-time for
20.5 years. This sample is utilized in the empirical part of our analysis. Note that this
sample is unbalanced: we have earnings for 579, 984 individuals in the initial year of work
experience and for 190, 900 individuals in the 30th year.
8 In our annual income panel data from 1967 to 2014, we observe the oldest cohort (1950) between ages17 and 64 and the youngest cohort (1980) up to age 34.
9 This measures excludes income from self-employment, capital income or unconditional cash transferssuch as social economic assistance, housing assistance, child allowance, etc.
10 The ideal outcome variable would be an hourly wage rate, however, this measure is not available formost of our sample period. By conditioning our sample to workers with earnings above the SGA threshold,we try to limit variability in earnings due to differences across individuals and over time in working hours. In2015, the SGA threshold was USD 10,650. Estimates using alternative thresholds are available upon request.
18

4.2 Measures of Schooling and IQ Test Scores
The first key regressor of interest is years of schooling corresponding to the highest level of
completed education. This variable is taken from Statistics Norway’s Education Register and
it is based on the educational attainment reports submitted by educational establishments
directly to Statistics Norway, which minimizes the chance of misreporting. Using the years of
schooling variable and the age at the start of each year, we construct a measure of potential
labor market experience as age minus years of schooling minus school starting age.11
Our second regressor of interest is the IQ test score accessed from the Norwegian Armed
Forces. In Norway, military service was compulsory for all able males in the birth cohorts
we study. Before each male entered the service, his medical and psychological suitability
was assessed. Most eligible Norwegian males in our sample took this test around their 18th
birthday. The IQ test score we use is a composite unweighted mean from three speeded
tests–arithmetics, word similarities, and figures.12
Figure 1 displays the average and the conditional density of IQ for each year of schooling
between 9 and 21 years. This figure illustrates two striking patterns in our data worth
noting. First, the measures of IQ and schooling are strongly correlated, with a correlation
of almost 0.5. Second, sharp increases in the average IQ score occur around the entry years
of high school (10 years) and college (13/14 years), with more gradual increases at later
stages of schooling. This pattern could be due to substantial ability-related (psychic) costs
for enrolling in high school or selective entry requirements enforced in the entry to higher
education in Norway.13
11 We measure age at the start of each year in order to follow individuals’ earnings from the first calendaryear (t ≥ 0) after the year of their graduation. We don’t use earnings from the year of their graduation,since most individuals would be enrollment in school at some point during that calendar year. As discussedabove, since we also restrict our sample to full-time observations, individuals working less than full-timeare dropped for years in which they work part-time or are non-employed and appear in the sample in theremaining years. Similarly, individuals performing military service do not enter the sample in service years.
12 The arithmetic test mirrors the test in the Wechsler Adult Intelligence Scale (WAIS), the word test issimilar to the vocabulary test in WAIS, and the figures test is comparable to the Raven Progressive Matrixtest. See Sundet et al. [2004] and Thrane [1977] for details.
13 As documented in Kirkeboen et al. [2016], Norway has a system where access to public higher educationis based on merit, and it is administered through a centralized admissions process. Students with higher
19

70
80
90
100
110
120
130
IQ
9 10 11 12 13 14 15 16 17 18 19 20 21
Years of Schooling
Figure 1: The Conditional Probability Density of IQ Test Scores on Years of Schooling.Note: The sample consists of Norwegian males born 1950-1980 observed in earnings data over years 1967-2014 with years ofpotential experience between 0 and 30 years with annual earnings above 1 SGA threshold (N=14,746,755). The IQ test scorealong the y-axis is standardized to have a mean of 100 and a standard deviation of 15. The black dotted line plots the averageIQ test score by individuals’ years of schooling, while the shaded areas plot the conditional probability density of IQ.
Arguably, Norway is an interesting setting to assess employer learning and the signaling
value of education for several reasons. First, the strong correlation between schooling and
ability test scores in our data suggests that schooling may predict ability, satisfying a neces-
sary condition for schooling to have a signaling value. Second, the Norwegian Armed Forces
do not provide certified information to conscripts containing their personal ability test scores
(e.g., diplomas), making it infeasible for conscripts to disclose this information in a verifiable
and credible manner in a job search process.14 It is thus reasonable to assume that employ-
ers do not observe the ability test scores from military conscription. Using the correlation
between the military IQ test scores and earnings across experience, researchers can thus infer
the process of employer learning. As discussed above, we allow for the possibility that other
correlates (as captured by Q in Section 2) of applicants’ ability could be revealed in the job
application process. Finally, most cohorts in our sample entered the labor market before the
arrival of online recruitment tools in the early 2000s, which might have altered the way in
GPAs from high school can thus more easily select into fields with high demand, and these students mayalso have higher IQ test scores in military conscription.
14 There is no legal obligation on the Norwegian Armed Forces to communicate the results of ability teststo conscripts undergoing such testing, and thus many conscripts may not even be familiar with their owntest scores. This further limits the possibility of voluntary disclosure of ability test scores by job applicantsand it is also not a common practice that Norwegian employers request such information from job seekers.
20

which employers tended to screen or recruit workers.
4.3 The Compulsory Schooling Reform
Between 1960 and 1975 Norway enacted a compulsory schooling reform that increased the
minimum required schooling from 7 to 9 years. This reform was implemented by different
municipalities–the lowest level of local administration–in different years. Thus, for more
than a decade, Norwegian schools were divided into two separate systems, where the length
of compulsory schooling depended on the birth year and the municipality of residence at age
14, which we refer to as the childhood municipality. We use the timing differences across
municipalities, induced by the staggered implementation of the reform, as our instrumental
variable for school years. For more on the reform see Black et al. [2005].15
Historical records provide information about the year in which the reform was imple-
mented for 672 out of the 732 municipalities in 1960. This information is missing for the
remaining 60 municipalities [Monstad et al., 2008]. As shown in Figure 2, there is consid-
erable variation in the fraction of birth cohort exposed to the reform (Figure 2-(a)) and in
the timing of reform even within local labor markets (Figure 2-(b)). In particular, panel (a)
shows that nobody born before 1946 was subjected to 9 years of compulsory schooling law,
whereas everyone born after 1960 was affected by the new law.
Figure 2-(b) shows that there is considerable variation even within the four largest local
labor markets (the four biggest metropolitan areas in Norway). For instance, the municipality
of Oslo city, which accounted for two-thirds of the population in the Oslo labor market region
in 1960, implemented the reform in 1967, whereas the timing of the reform varied between
1961 and 1971 across the remaining population living in one of the other 39 municipalities.16
As discussed in Section 3, to separately identify the private and the social returns to
education, the instrument should satisfy the standard IV assumptions (Assumption 1) and
15 This compulsory schooling reform in Norway has been used previously, albeit in different contexts, byMonstad et al. [2008]; Aakvik et al. [2010]; Machin et al. [2012], and Bhuller et al. [2017].
16 We use the classification of Norway into 160 local labor markets based on geographic commutingpatterns constructed by Gundersen and Juvkam [2013]. On average each market has 5 municipalities.
21

11.3
11.4
11.5
11.6
11.7
11.8
11.9
12
12.1
12.2
12.3
Ye
ars
of
Sch
oo
ling
0
10
20
30
40
50
60
70
80
90
100
Sh
are
of
Po
pu
latio
n (
%)
1946
1947
1948
1949
1950
1951
1952
1953
1954
1955
1956
1957
1958
1959
1960
Birth Cohort
Exposure to Compulsory School Reform (left y−axis)
Average Years of Schooling (right y−axis)
(a) Exposure across Birth Cohorts
0
.2
.4
.6
.8
1960 1962 1964 1966 1968 1970 1972 1974
Oslo
0
.2
.4
.6
.8
1960 1962 1964 1966 1968 1970 1972 1974
Bergen
0
.2
.4
.6
.8
1960 1962 1964 1966 1968 1970 1972 1974
Stavanger
0
.2
.4
.6
.8
1960 1962 1964 1966 1968 1970 1972 1974
Trondheim
Fraction of 1960 Population in Local Labor Marketby Year of Reform Implementation
(b) Timing within Local Labor Markets
Figure 2: Compulsory School Reform Across Birth Cohorts and Local Labor Markets.Note: The red line in plot (a) shows the cohort-specific share of population exposed to the compulsory school reform, whilethe black dots indicate the average years of schooling for Norwegian male cohorts born 1946-1960. Plot (b) shows the fractionof 1960 population in the four biggest local labor markets (concentrated around the four major cities) by the year of reformimplementation. Using the 1960 classification of municipalities, there were 40 municipalities in the Oslo region, 27 municipalitiesin the Trondheim region, and 25 municipalities each in the Bergen and Stavanger regions. The variation in the timing of reformwithin local labor markets (LLMs) is due to variation in the timing of reform across municipalities within LLMs.
also be a hidden instrument (Assumption 2). An implication of the latter assumption in our
setting is that employers are not informed about the interaction between a worker’s birth
cohort and the timing of compulsory school reform in the worker’s municipality of childhood.
For two reasons we think this assumption is reasonable in our setting. First, in contrast
to compulsory schooling laws legislated centrally in many countries or by the states in the
U.S. states, the timing of the implementation of the Norwegian compulsory school reform was
decentralized and decided at the local municipal level. This decentralized implementation is
consistent with our data, e.g., Figure 2-(b) that displays substantial variation in the timing
of the reform even within local labor markets. Within local labor markets, there are high
rates of commuting and mobility. This means that to know whether or not an individual
was treated, an employer not only would have to know the exact date of implementation for
each municipality, but would have to determine the childhood municipality of each worker
(or job applicant). While it might be easier to discern the place of residence and birth year,
from the CV, say, determining the childhood municipality would be difficult and expensive,
if not impossible.
22

Second, even if employers had information on each applicant’s birth year and childhood
municipality, retrieving information on exposure to compulsory school reform for each ap-
plicant would still be onerous and costly. The information on the timing of compulsory
reform was until recently not readily available in online public databases.17 Therefore, for
the 1946-1960 cohorts, graduating in an era long before the internet, this information would
not have been easily traceable for employers.
Even though we do not directly test the hidden instrument assumption, to substantiate
the identifying assumption that our IV is indeed hidden, we also restrict our analytical sample
in Section 5 by excluding workers who grew up in the municipality with the largest population
in each local labor market. Heuristically, by focusing on the subset of remaining workers,
for whom it is plausible to assume that the employers are uninformed about the timing of
reform in their childhood municipality and consequently their reform exposure status, we
argue that the hidden instrument assumption is likely to be satisfied in our setting. This
restricted – and our preferred – sample retains 422,749 individuals and 8,697,979 person-year
observations, which is 59% of the full sample. For completeness, we also present results from
the IV analysis for the full sample retaining individuals from the main municipality.
4.4 Empirical Specifications
4.4.1 Instrumental Variable Specification
Our first approach uses an instrumental variables (IV) specification, where we regress log-
earnings on schooling and control variables X at each experience t:
lnWit = aIVt + bIVt Si + eIVt Xi + uIVit , (15)
where lnWit and Si are log-earnings and years of schooling, respectively, and Xi is a vector of
control variables, including a full set of dummies for birth cohort and childhood municipality.
17 Previously, Monstad et al. [2008] tracked various historical documents and databases to constructinformation on the timing of reform for 672 out of 732 municipalities.
23

The IV specification consists of the second-stage Equation (15) and the first-stage equation
Si = r + dDhi + nXi + wi, (16)
where the binary instrument Dhi ∈ {0, 1} is equal to 1 if the individual was exposed to the
new schooling law, and 0 otherwise and X is as before a full set of dummies for birth cohort
and childhood municipality. An individual i is coded to be exposed if the reform had been
implemented in i’s childhood municipality of residence by the time he had turned 14.18
We estimate the system of Equations (16) and (15) by 2SLS, separately for each year of
experience, t.19 We use the childhood municipality indicators to control for unobservable de-
terminants of earnings or schooling fixed at the municipality level. By conditioning on these
indicators, we can compare individuals that grew up in the same municipality, yet were born
in different years, and therefore exploit variation in their schooling stemming from differen-
tial exposure to compulsory schooling requirements. By adding the birth cohort indicators,
we moreover control for aggregate changes in schooling and earnings across cohorts.
Our parameter of interest is bIVt , the coefficient on years of schooling at experience t.
We maintain the assumptions that (i) conditional on X, Dh satisfies Assumption 1, and
as discussed in Section 4.3, that in our setting (ii) Dh satisfies the hidden IV Assumption
2.20 As discussed in Section 3.3, under Assumption 2, bIVh
t converges to the social return to
education, δψ|S, as t→∞, and moreover, bIVh
t provides a consistent estimate of the private
return at t, δW |St , for any t < ∞. Thus, we can estimate the social returns to education as
bIVh
t→∞, and use the rate at which bIVh
t converges to bIV∞ to estimate the speed of learning, κ.
18 At that time the school starting age in Norway was 7 years, and before the reform the critical age atwhich a pupil would be required to take two additional years of schooling was 14 years. Cohorts with ages14 years or less at the time of school reform would be required to take the two additional years, while allcohorts aged above 14 at the time the new law went into effect would not.
19 Unlike Equation (15), there is no experience subscript t attached to the d coefficient on our instrumentDh in the first-stage equation because both compulsory schooling reform exposure status Dh and schoolingS are time-invariant variables. However, with an unbalanced panel and separate estimations by experience,the first-stage estimates of d will be allowed to vary by t. In practice, estimates of d are very stable acrossthe experience range that we consider despite differences in the sample composition by experience.
20 The reform timing is also uncorrelated with baseline municipality characteristics [Bhuller et al., 2017].
24

A challenge to identification of returns to schooling based on Equation (15) would be
that individuals growing up in different municipalities could have had different growth in
schooling and earnings even in the absence of a compulsory schooling reform (i.e., differential
trends across treatment units). Following Bhuller et al. [2017], we also test the stability
of our first-stage and IV estimates to the inclusion of extrapolated linear and quadratic
municipality-specific trends in education attainment and lifetime earnings estimated using
data on pre-reform cohorts as additional controls. We refer to estimates based on Equations
(16) and (15) as obtained from the baseline specification, and estimates that we get after
further controlling for municipality-specific trends as coming from the trends specification.
Finally, note that by estimating Equation (15) separately for each t, we also allow the
work experience to interact with individual characteristics Xi, weakening the functional form
assumption embedded in (1). In particular, in Equation (15) we have specified H(t,Xi) =
aIVt +eIVt Xi, where coefficients aIVt and eIVt can vary flexibly by experience, and thus flexibly
capture both a common experience profile and its interactions with Xi.
4.4.2 OLS Specification Using a Hidden Correlate
As discussed above, we can estimate the speed of learning κ using the IV estimates as well
as the estimates relying on the IQ test score as a hidden correlate (Section 3.2). This latter
approach requires projecting log-earnings on schooling S, IQ score, Z, and other control
variables, X, at different work experience level t:
lnWit = aOLSt + bOLSt Si + cOLSt Zi + eOLSt Xi + uOLSit . (17)
Under the assumptions that schooling does not independently enter H(t,X) and that Z is
unobserved in the market, we can use the regression estimates of {bOLSt , cOLSt } to obtain two
estimates of the speed of learning κ. See Lange [2007] for further details.
It is well known that log-earnings tend to be nonlinear in schooling. Thus, we cannot sim-
25

ply compare the OLS estimates and IV estimates that we get from Equations (15) and (17).
Comparing OLS and the IV estimates in the presence of non-linearities can be misleading
simply because the OLS and the IV estimates weigh different marginal returns to schooling
differently. We can, however, construct weighted OLS estimates that are comparable to the
IV estimates by first estimating the fully non-linear model in OLS and then weighting the
marginal returns using the weights that correspond to the IV estimator. This re-weighting
procedure ensures that the OLS estimates are obtained from the same support of schooling
distribution as the IV estimates and thus allows us to compare estimates of the speed of
learning across estimators in the presence of non-linearities. We refer to these re-weighted
OLS estimates as IV-weighted OLS estimates and denote them by {bWOLSt , cWOLS
t }.21
5 Main Results
This section contains our main empirical results. To begin, we present the IV estimates of
returns to education over work experience and use these estimates to determine the speed of
learning. We then use the same IV estimates for our main contribution, which is to provide
estimates of the private and social returns to education. The gap between these two returns
represents our estimate of the contribution of signaling to the return to education. Finally,
we present OLS estimates that use the IQ test score as a hidden correlate of ability.
5.1 IV Estimates of the Returns to Education
Table 1 column (1) displays the first-stage estimate of the effect of our compulsory schooling
reform instrument on years of schooling, as defined in Equation (16), for the full sample.
This estimate indicates that exposure to compulsory schooling reform increased completed
schooling by 0.237 years. The partial F-statistic is approximately 88, which means that weak
instrument bias is not a concern for our analysis.
21 We follow Angrist and Imbens [1995]; Løken et al. [2012] and Mogstad and Wiswall [2016], and provideadditional details on the re-weighting procedure in the Appendix Section A.1.
26

Table 1: First-Stage Estimates on Years of Schooling.
Full Sample Preferred Sample
Baseline Trends Baseline Trends
Specification Specification Specification Specification
(1) (2) (3) (4)
Instrument:
Exposure to Compulsory Schooling Reform 0.237*** 0.209*** 0.228*** 0.209***
(0.025) (0.034) (0.034) (0.040)
Municipality Fixed Effects X X X XCohort Fixed Effects X X X XMunicipality-Specific Trends X X
F-statistic (instrument) 87.7 37.9 45.7 27.7
Sample Mean Years of Schooling 12.36 12.36 12.27 12.27
Standard Deviation Years of Schooling 2.50 2.50 2.46 2.46
Note: The full estimation sample consists of Norwegian males born in 1950-1980 observed any time in earnings data over years1967-2014 with years of potential experience between 0 and 30 years and annual earnings above 1 SGA threshold (N=14,746,755).The restricted estimation sample further drops individuals who grew up in the municipality with the largest population sizein each of the 160 labor market regions in Norway (N=8,697,979). All estimations include fixed effects for birth cohortand childhood municipality. The trends specifications in columns (2) and (4) further also controls for linear and quadraticmunicipality-specific trends estimated using data on all pre-reform cohorts born 1930 or later and extrapolated to all post-reform cohorts, separately for each municipality. Standard errors are clustered at the local labor market region (160 groups).* p < 0.10, ** < 0.05, *** p < 0.01.
As described above, how we interpret the IV estimates depends crucially on whether the
IV is hidden or transparent. We are more confident that the IV is hidden when we restrict
ourselves to the variation across small municipalities that surround the core of large urban
agglomerations. Our preferred estimates therefore derive variation from a sample that ex-
cludes those born in the largest municipalities in the different labor markets. These estimates
are in column (3), and we can see that the effect of our IV on education is unchanged. We
repeat these two estimation exercises including municipality-specific trends (columns 2 and
4), and find that although the absolute effect is smaller, the conclusion does not change.
We now turn our attention to the second-stage IV estimates in Equation (15). Figure
3-(a) displays the IV estimates for the full sample, and these coefficients represent the private
returns to schooling, at each year of work experience. Similarly, Figure 3-(b) displays the
IV estimates for the restricted sample, and Figures 3-(c) and 3-(d) display the IV estimates
for each of these two samples with municipality-specific trends, respectively.
27

0
.05
.1
.15
.2
.25
Th
e E
ffe
cts
of
an
Extr
a Y
ea
r o
f S
ch
oo
ling
on
Lo
g−
Ea
rnin
gs (
Ch
an
ge
in
Lo
g−
Po
ints
)
0 5 10 15 20 25 30Years of Experience
Point Estimate 90% CI
(a) Full Sample–Baseline Specification
0
.05
.1
.15
.2
.25
Th
e E
ffe
cts
of
an
Extr
a Y
ea
r o
f S
ch
oo
ling
on
Lo
g−
Ea
rnin
gs (
Ch
an
ge
in
Lo
g−
Po
ints
)
0 5 10 15 20 25 30Years of Experience
Point Estimate 90% CI
(b) Preferred Sample–Baseline Specification
0
.05
.1
.15
.2
.25
Th
e E
ffe
cts
of
an
Extr
a Y
ea
r o
f S
ch
oo
ling
on
Lo
g−
Ea
rnin
gs (
Ch
an
ge
in
Lo
g−
Po
ints
)
0 5 10 15 20 25 30Years of Experience
Point Estimate 90% CI
(c) Full Sample–Trends Specification
0
.05
.1
.15
.2
.25
Th
e E
ffe
cts
of
an
Extr
a Y
ea
r o
f S
ch
oo
ling
on
Lo
g−
Ea
rnin
gs (
Ch
an
ge
in
Lo
g−
Po
ints
)
0 5 10 15 20 25 30Years of Experience
Point Estimate 90% CI
(d) Preferred Sample–Trends Specification
Figure 3: IV Estimates of the Returns to Schooling by Year of Experience.Note: The full estimation sample consists of Norwegian males born 1950-1980 observed in earnings data over years 1967-2014with years of potential experience between 0 and 30 years and annual earnings above 1 SGA threshold (N=14,746,755). Therestricted estimation sample further drops those growing up in the municipality with largest population size in each the 160labor market regions in Norway (N=8,697,979). Plots (a) and (b) display IV estimates from separate estimations of Equation(15) for each year of experience using the two samples, while plots (c) and (d) further control for municipality-specific trends.All estimations include fixed effects for birth cohort and childhood municipality. Standard errors are clustered at the local labormarket region (160 groups). The 90% confidence intervals corresponding to each point estimate are displayed as vertical bars.
All four panels exhibit point estimates that suggest high initial returns to schooling,
followed by a relatively steep decline during the first 5 years of work. Then, the returns
gradually stabilize and approach 5-6% for those with 15 years or more of work experience.
These patterns are consistent with employers learning about workers’ ability. Moreover,
these estimates also indicate that employers did not fully price in the variation in schooling
that is induced by the variation in compulsory schooling reform exposure, across cohorts and
28

Table 2: IV Estimates of the Speed of Employer Learning, Initial Value and Limit Value.
Full Sample Preferred Sample
(1) (2) (3) (4)
Years of
Schooling
Years of
Schooling
Years of
Schooling
Years of
Schooling
Speed of Learning κ 0.447*** 0.490*** 0.532*** 0.565***
(0.127) (0.110) (0.058) (0.055)
Initial Value bIV0 0.145*** 0.148*** 0.192*** 0.204***
(0.013) (0.014) (0.010) (0.010)
Limit Value bIV∞ 0.063*** 0.048*** 0.050*** 0.045***
(0.004) (0.004) (0.003) (0.003)
Weight θt on Initial Signal:
at t = 5 19.8% 17.2% 15.0% 13.3%
at t = 10 11.0% 9.4% 8.1% 7.1%
at t = 15 7.6% 6.5% 5.5% 4.9%
Municipality Fixed Effects X X X XCohort Fixed Effects X X X XMunicipality-Specific Trends X X
Note: The full estimation sample consists of Norwegian males born 1950-1980 observed in earnings data over years 1967-2014with years of potential experience between 0 and 30 years and annual earnings above 1 SGA threshold (N=14,746,755). Theestimates plotted in Figure 3(a) for the full estimation sample are used to construct the corresponding IV estimates of speed oflearning, initial value and limit value in columns (1)-(2). The estimates in columns (3)-(4) are similarly based on the estimatesplotted in Figure 3(b) for a restricted estimation sample in which the municipality with largest population size in each of the160 labor market regions in Norway is dropped (N=8,697,979).* p < 0.10, ** < 0.05, *** p < 0.01.
municipalities, which is consistent with our hidden IV assumption.
Table 2 displays the estimates of initial private returns to education (bIV0 ), social re-
turns to education (bIV∞ ) and speed of employer learning (κ) obtained using the coefficient
estimates shown in Figure 3 based on the non-linear least squares method discussed in Sec-
tion 3.3. Comparing the estimates across columns (1)-(4), we can see that the estimates
are robust with respect to sample restrictions and controls for municipality-specific trends.
In particular, we cannot reject that the equality of the speed of learning estimates across
columns (1)-(4). The point estimates of κ are between 0.447 and 0.565, which imply very
rapid learning on the part of employers. More precisely, our preferred estimate of the speed
of employer learning at 0.532 in Table 2-(3) implies that already after the first five years
of employment, employers put only 15% weight on the initial signal they received from the
29

worker, and after 15 years of employment history this weight further declines to 5.5%.
5.2 The Signaling Value of Education
Next, we use the estimates from Table 2 to determine the signaling value of education. Our
employer learning model implies that the limit return to education bIV∞ is the social returns
to education. The experience-specific IV estimates directly represent the private returns to
education. Using estimates of model parameters in Table 2, we can also construct estimates
of the private returns at each t. In Figure 4 we display the private and social returns based on
the estimates from Table 2-(3), as well as the experience-specific IV estimates. The scatter
plot displays the IV estimates obtained from the preferred sample in Figure 3-(b), and the
horizontal blue line is the estimated social return to education bIV∞ from Table 2-(3) at 5%.
In order to determine the signaling value of education we also need the private internal
rate of return (IRR) for an additional year of schooling. The private IRR is defined as the
discount rate that equates present discounted value of earnings over the career for different
choices of schooling. Using the experience-specific IV estimates of the private returns to
education (the scatter plot in Figure 4), we estimate the private IRR to be 7.2%.22 The
private IRR is 2.2 percentage points greater than the social returns to schooling at 5%. From
these estimates, we conclude that 70% of the private return to education can be attributed
to education raising the productivity of workers and 30% to the signaling value of education.
Alternatively, we can use the estimates of bIV0 = 0.192, bIV∞ = 0.05 and κ = 0.532 from
Table 2-(3) directly to calculate the private IRR at each t, corresponding to the red line in
Figure 4. Imposing this learning process and assuming a career length of 40 years, we obtain
an estimate of the private IRR of 7.2%. This estimate of the private IRR is identical to the
estimate we obtained using the experience-specific IV estimates, and so in both cases we
calculate that 30% of the private return to education can be attributed to signaling.
As an additional evidence that education has an effect on a measure of workers’ ability, we
22 For t > 31 and beyond retirement age, we assume that experience-specific IV estimates also equal 5%.
30

0
.05
.1
.15
.2
.25
Estim
ate
s o
f th
e R
etu
rns t
o S
ch
oo
ling
0 5 10 15 20 25 30 35 40Years of Experience
The Private Returns to Education
The Social Returns to Education
The Signaling Value of Education
IV Estimates of Returns to Education (from Figure 3(b))
Figure 4: The Private and Social Returns to Education.Note: The private and social returns to education plotted in the red and the blue lines, respectively, are constructed using theestimates in Table 2-(3). The scatter plot of IV estimates of returns to education uses the estimates displayed in Figure 3-(b).
also estimated specifications with the standardized IQ test score as the dependent variable
and years of schooling, instrumented using the compulsory schooling reform, as the main
independent variable. As presented in Table 3, these IV estimates show strong effects of
schooling on IQ, with an additional year of schooling at age 18 causing around 1/4 of a
standard deviation increase in IQ.23 This evidence shows that schooling increases a measure
of worker ability, which is expected to be highly correlated with workers’ productive skills.
While we are cautious in interpreting this as ‘direct’ evidence on a productivity return to
education, these results may indicate that part of the social return to education (see Equation
(6)) could arrive through a causal effect on workers’ ability.
Finally, we can also compare the estimate of the social returns to education of 5% with
23 Our IQ test score measure is standardized to have mean zero and a standard deviation (SD) equalto one. Using the same compulsory schooling reform for Norway, Brinch and Galloway [2012] documentedthat an additional year of schooling increased IQ scores measured at age 19 by 3.7 points. Their IQ testscore measure is scaled to have a mean of 100 and a SD of 15. In terms of magnitude, their estimate alsocorresponds to 1/4 of a SD increase in IQ. Carlsson et al. [2015] also document similar results for Sweden.
31

Table 3: IV Estimates of Years of Schooling on Standardized IQ Test Scores.
Full Sample Preferred Sample
Baseline Trends Baseline Trends
Specification Specification Specification Specification
(1) (2) (3) (4)
Reduced Form:
Exposure to Compulsory Schooling Reform 0.041*** 0.036*** 0.047*** 0.037***
(0.009) (0.013) (0.014) (0.016)
IV Estimates:
Years of Schooling at Age 18 0.265*** 0.235*** 0.318*** 0.258**
(0.055) (0.074) (0.075) (0.099)
Municipality Fixed Effects X X X XCohort Fixed Effects X X X XMunicipality-Specific Trends X X
Note: The estimation sample consists of Norwegian males born in 1950-1980 observed any time in earnings data over years 1967-2014 with years of potential experience between 0 and 30 years and annual earnings above 1 SGA threshold (N=14,746,755).The restricted estimation sample further drops individuals who grew up in the municipality with the largest population size ineach of the 160 labor market regions in Norway (N=8,697,979). The outcome in each regression is an IQ test score, which isstandardized to have a mean of zero and a standard deviation equal to one. All estimations include fixed effects for birth cohortand childhood municipality. The trends specifications in columns (2) and (4) further also controls for municipality-specifictrends estimated using data on all pre-reform cohorts born 1930 or later and extrapolated to all post-reform cohorts, separatelyfor each municipality. Standard errors are clustered at the local labor market region (160 groups).* p < 0.10, ** < 0.05, *** p < 0.01.
a standard Mincer returns to education – that is the (time constant) coefficient on years
of schooling in a non-interacted specification controlling for a flexible experience profile.
This comparison indicates how much the social returns differ from the observed average
differences in earnings in the population and is of interest since the Mincer coefficient is a
very commonly used indicator of the value of education. We find that the Mincer coefficient
is at 6.8%, exceeding the social returns by 1.8 percentage points.
5.3 OLS Estimates Using a Hidden Correlate of Ability
Next, we present results from the OLS specification that uses a correlate of ability that
is observed by us but not by the employers. We begin by presenting IV-weighted OLS
estimates of Equation (17), for each year of work experience, using the standardized IQ test
score as the hidden correlate of ability, and after controlling for municipality and cohort
32

fixed effects. Figures 5-(a) and 5-(b) display the IV-weighted OLS estimates of returns to
schooling, bWOLSt , and returns to IQ, cWOLS
t , respectively. The estimates of bWOLSt decline
rapidly in the first few years before stabilizing, and the estimates of cWOLSt increase with
experience, rapidly at first, and then slowly until stabilizing after 15 years.
Comparing Figures 5-(a) and 3-(a) we can see that the IV-weighted OLS and the IV
estimates of returns to schooling reflect a similar pattern although these two estimators
use different sources of variation. It is also noteworthy that the patterns in the returns to
schooling and IQ over the workers’ careers are surprisingly similarly to those found in the
NLSY using the AFQT score. For instance, Figure 1 in Lange [2007] indicates that the
returns to schooling decline early in the career and the returns to IQ score increase rapidly
before converging to stable, long-run, values after a few years.
Relatedly, Arcidiacono et al. [2010] also use the NLSY data and find that the returns
to the AFQT score increases with experience for those with a high school degree or less,
and for those with a college degree the returns to the AFQT score are constant over the
life-cycle. This led them to conclude that a college degree has a direct role in revealing
ability. Such a mechanism could be at play if employers are better informed about the
differences in cognitive ability among those with and without a college degree, possibly
because they observe transcripts, field of study, reference letters and students have additional
work experience, e.g., internships.
When we perform the same analysis as Arcidiacono et al. [2010], i.e., split our estimation
sample in two groups –one with at most a high school degree and other with a college degree–
we find similar results in our data. Figures 5-(c) and 5-(d) display the OLS estimates of
returns to schooling and IQ, respectively, for the first sample and Figures 5-(e) and 5-(f)
show the corresponding estimates for the second sample. We can see that the returns to
IQ increase with experience but only for those with at most high school degree, and for
those with a college degree the returns to IQ are constant at around 6-7% across all years of
experience. This pattern is consistent with a college degree revealing a worker’s ability also
33

0
.02
.04
.06
.08
.1
The E
ffects
of an E
xtr
a Y
ear
of S
choolin
gon L
og−
Earn
ings (
Change in L
og−
Poin
ts)
0 5 10 15 20 25 30Years of Experience
Point Estimate 95% CI
(a) Returns to Schooling: IV-Weighted OLS
0
.02
.04
.06
.08
.1
The E
ffects
of 1 S
D Incre
ase in IQ
on L
og−
Earn
ings (
Change in L
og−
Poin
ts)
0 5 10 15 20 25 30Years of Experience
Point Estimate 95% CI
(b) Returns to IQ: IV-Weighted OLS
0
.02
.04
.06
.08
.1
The E
ffects
of an E
xtr
a Y
ear
of S
choolin
gon L
og−
Earn
ings (
Change in L
og−
Poin
ts)
0 5 10 15 20 25 30Years of Experience
Point Estimate 95% CI
(c) Returns to Schooling: High School or Below
0
.02
.04
.06
.08
.1
The E
ffects
of 1 S
D Incre
ase in IQ
on L
og−
Earn
ings (
Change in L
og−
Poin
ts)
0 5 10 15 20 25 30Years of Experience
Point Estimate 95% CI
(d) Returns to IQ: High School or Below
0
.02
.04
.06
.08
.1
The E
ffects
of an E
xtr
a Y
ear
of S
choolin
gon L
og−
Earn
ings (
Change in L
og−
Poin
ts)
0 5 10 15 20 25 30Years of Experience
Point Estimate 95% CI
(e) Returns to Schooling: College or University
0
.02
.04
.06
.08
.1
The E
ffects
of 1 S
D Incre
ase in IQ
on L
og−
Earn
ings (
Change in L
og−
Poin
ts)
0 5 10 15 20 25 30Years of Experience
Point Estimate 95% CI
(f) Returns to IQ: College or University
Figure 5: OLS Estimates of the Returns to Schooling and IQ.Note: The estimation sample consists of Norwegian males born 1950-1980 observed in earnings data over years 1967-2014 withyears of potential experience between 0 and 30 years and annual earnings above 1 SGA threshold (N=14,746,755).
in the Norwegian labor market.
Next, we compare the IV-weighted OLS estimates to the OLS estimates we obtained
34
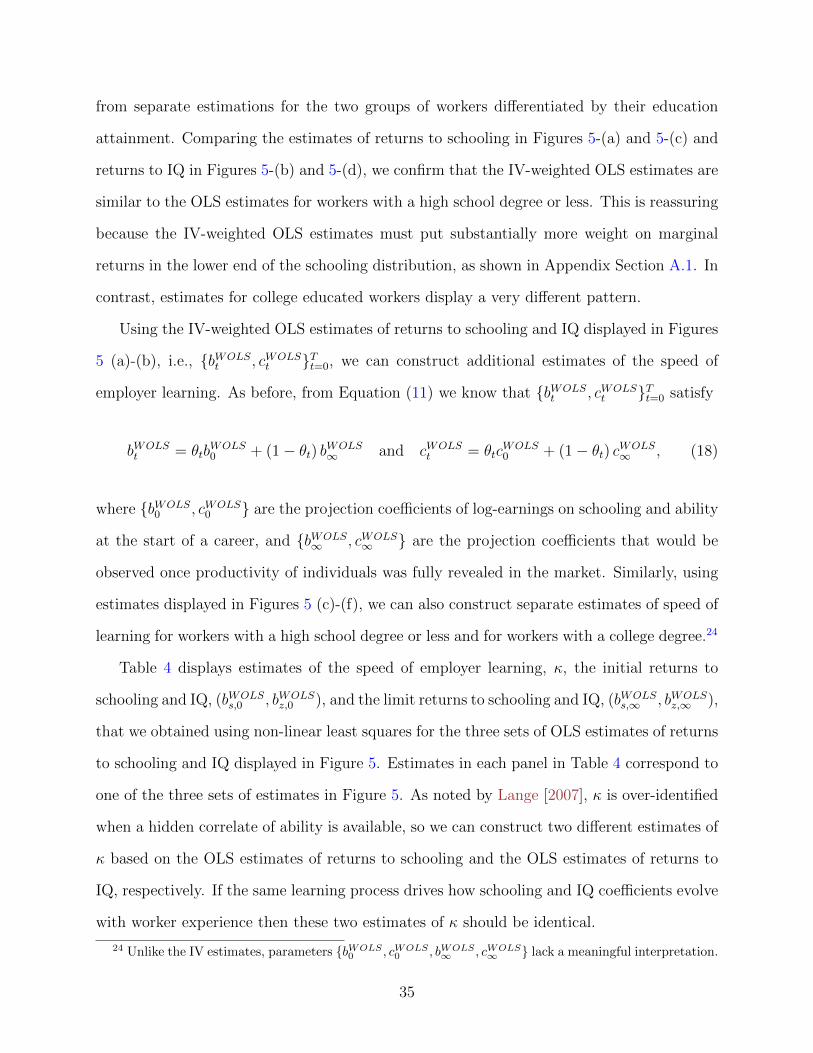
from separate estimations for the two groups of workers differentiated by their education
attainment. Comparing the estimates of returns to schooling in Figures 5-(a) and 5-(c) and
returns to IQ in Figures 5-(b) and 5-(d), we confirm that the IV-weighted OLS estimates are
similar to the OLS estimates for workers with a high school degree or less. This is reassuring
because the IV-weighted OLS estimates must put substantially more weight on marginal
returns in the lower end of the schooling distribution, as shown in Appendix Section A.1. In
contrast, estimates for college educated workers display a very different pattern.
Using the IV-weighted OLS estimates of returns to schooling and IQ displayed in Figures
5 (a)-(b), i.e., {bWOLSt , cWOLS
t }Tt=0, we can construct additional estimates of the speed of
employer learning. As before, from Equation (11) we know that {bWOLSt , cWOLS
t }Tt=0 satisfy
bWOLSt = θtb
WOLS0 + (1− θt) bWOLS
∞ and cWOLSt = θtc
WOLS0 + (1− θt) cWOLS
∞ , (18)
where {bWOLS0 , cWOLS
0 } are the projection coefficients of log-earnings on schooling and ability
at the start of a career, and {bWOLS∞ , cWOLS
∞ } are the projection coefficients that would be
observed once productivity of individuals was fully revealed in the market. Similarly, using
estimates displayed in Figures 5 (c)-(f), we can also construct separate estimates of speed of
learning for workers with a high school degree or less and for workers with a college degree.24
Table 4 displays estimates of the speed of employer learning, κ, the initial returns to
schooling and IQ, (bWOLSs,0 , bWOLS
z,0 ), and the limit returns to schooling and IQ, (bWOLSs,∞ , bWOLS
z,∞ ),
that we obtained using non-linear least squares for the three sets of OLS estimates of returns
to schooling and IQ displayed in Figure 5. Estimates in each panel in Table 4 correspond to
one of the three sets of estimates in Figure 5. As noted by Lange [2007], κ is over-identified
when a hidden correlate of ability is available, so we can construct two different estimates of
κ based on the OLS estimates of returns to schooling and the OLS estimates of returns to
IQ, respectively. If the same learning process drives how schooling and IQ coefficients evolve
with worker experience then these two estimates of κ should be identical.
24 Unlike the IV estimates, parameters {bWOLS0 , cWOLS
0 , bWOLS∞ , cWOLS
∞ } lack a meaningful interpretation.
35

Table 4: OLS Estimates of the Speed of Employer Learning, Initial Value and Limit Value.
Two Values of κ One Value of κ
(1) (2) (3) (4)
Years of
Schooling
IQ Test
Score
Years of
Schooling
IQ Test
Score
A. Full Sample – IV-Weighted OLS
Speed of Learning κ 0.386*** 0.127*** 0.214***
(0.045) (0.023) (0.029)
Initial Value (bWOLS0 , cWOLS
0 ) 0.096*** 0.007** 0.084*** -0.001
(0.004) (0.004) (0.004) (0.004)
Limit Value (bWOLS∞ , cWOLS
∞ ) 0.024*** 0.086*** 0.019*** 0.077***
(0.002) (0.004) (0.002) (0.003)
B. Compulsory/High School Sample – Standard OLS
Speed of Learning κ 0.333*** 0.065*** 0.104***
(0.034) (0.010) (0.015)
Initial Value (bOLS0 , cOLS0 ) 0.091*** 0.012*** 0.074*** 0.006**
(0.003) (0.002) (0.003) (0.003)
Limit Value (bOLS∞ , cOLS∞ ) 0.030*** 0.111*** 0.017*** 0.097***
(0.001) (0.006) (0.003) (0.004)
C. College/University Sample – Standard OLS
Speed of Learning κ 0.061 0.788 0.115
(0.056) (0.603) (0.080)
Initial Value (bOLS0 , cOLS0 ) 0.067*** 0.056*** 0.069*** 0.068***
(0.003) (0.004) (0.003) (0.002)
Limit Value (bOLS∞ , cOLS∞ ) 0.033*** 0.071*** 0.039*** 0.072***
(0.008) (0.001) (0.004) (0.002)
Municipality Fixed Effects X X X XCohort Fixed Effects X X X X
Note: The estimation sample consists of Norwegian males born 1950-1980 observed in earnings data over years 1967-2014with years of potential experience between 0 and 30 years and annual earnings above 1 SGA threshold (N=14,746,755). Theestimates of speed of learning, initial values of returns to schooling and IQ, and limit values of returns to schooling are obtainedfrom non-linear least squares estimations on the experience-specific returns to schooling and IQ presented in Figure 5.* p < 0.10, ** < 0.05, *** p < 0.01.
Alternatively, we can restrict the estimate of κ using the returns to schooling to be
the same as the κ using the returns to IQ. We implement both methods and present the
estimation results in Table 4. Estimates that allow for differential learning are in columns
(1)-(2) and the estimates that impose a common learning process are in columns (3)-(4).
Consistent with what we found in Figure 5, here too we find similar estimates of employer
36

learning, initial returns to schooling and IQ and limit returns to schooling and IQ across
panels A and B in Table 4. As earlier, in panel A we show results using the IV-weighted
OLS estimates, while in panel B we use OLS estimates for workers with a high school degree
or below. Moreover, the estimates of returns to schooling and speed of employer learning in
panels A-B, column (1), which allow for a differential learning process across schooling and
IQ, are also comparable to the corresponding IV estimates we presented in Table 2, column
(1). At conventional levels, we cannot reject the equality of the speed of learning κ across
these OLS estimates and the IV estimates presented earlier.
There are however two striking differences among the estimates in Table 4. First, compar-
ing estimates of the speed of learning κ across columns (1)-(2), we can reject the assumption
of a common learning process for schooling and IQ over worker experience.25 This result
suggests that a standard assumption made in the OLS approach that uses a hidden correlate
of ability to identify the speed of employer learning is violated in our context. Second, we
do not find any evidence of employer learning for workers with a college degree as shown in
panel C in Table 4, unlike the results shown in panels A-B.
6 Extensions
In this section, we consider two important extensions of our model. First, we consider an
environment where the returns to skill can vary with experience. The standard employer
learning model assumes that log-productivity is additively separable in experience and ed-
ucation. As a consequence, the social return is constant over time, and the only reason for
private returns to vary over time is employer learning. Now, if there is differential on-the-job
growth in productivity across workers with different skills [Arcidiacono et al., 2010], then the
social returns will also vary with experience. Second, we acknowledge that there is increasing
evidence that returns to education are heterogeneous (Card [1999]; Heckman et al. [2006a];
25In Section 6.2, we consider an environment with heterogeneous returns to education and discuss impli-cations for differential employer learning across schooling choices in a potential outcomes framework.
37

Carneiro et al. [2011]; among others). We therefore consider an environment with heteroge-
neous returns to education and define private and social returns within a potential outcomes
framework. For each of these two model extensions, we then determine data requirements
and assumptions that are sufficient for identification of key parameters of interest.
6.1 Time-Varying Returns
Here, we generalize of our model by allowing the returns to skill to vary flexibly with ex-
perience. We show that having access to hidden IV allows identifying the private returns
to education, and with transparent IV we can identify the (time-varying) social returns to
education. If we have both, hidden and transparent, IVs then that is sufficient to identify
key model parameters, including the signaling value of education and the speed of learning.
Only a hidden IV, however, is insufficient to determine the speed of learning.
To this end, we start by extending the log-productivity in (1) to
ψit = λt × [βwsSi + βwqQi + Ai] +H(t) + εit, (19)
where λt < ∞ is an experience-specific slope parameter, allowing the effects of workers’
composite ability, (βwsSi + βwqQi + Ai), on log-productivity to vary flexibly with t.26
Following the same steps that lead to (6) and (7), while suppressing H(t) for notational
convenience, we can express log-productivity as ψit = λtδψ|SSi+uit, and log-wages as lnWit =
λtδW |St Si + uit, where δψ|S and δ
W |St are defined as in (6) and (7), respectively. As can be
seen, both private returns to education, ∂ lnWit
∂S= λtδ
W |St , and the social returns to education,
∂ψit∂S
= λtδψ|S, vary over time. Nonetheless, the relationship between the two remains as in
(8). In particular, the private return is the sum of social return and an adjustment term,
which now depends on both θt and λt:
λtδW |St = λtδ
ψ|S + λtθt(φA|S + φA|Qδ
Q|S − δA|S), (20)
26 Our specification is similar to Equation (2) in Arcidiacono et al. [2010].
38

such that the adjustment term λtθt(φA|S + φA|Qδ
Q|S − δA|S)
vanishes with t because λt <∞,
and limt→∞ θt = 0. Thus, for workers with long work experience limt→∞∂ lnWit
∂S= limt→∞
∂χit∂S
.
Now, in order to identify the signaling value of education, we first have to separately
identify the effect of employer learning θt and the effect of time-varying productivity returns
λt on log-wages at each t. Let Dhi ∈ {0, 1} denote a hidden IV that satisfies Assumptions 1
and 2, and let Dti ∈ {0, 1} denote a transparent IV that satisfies Assumptions 1 and 3. As
before, Dh identifies the private returns to education:
plim bIVh
t =E[lnWit|Dh
i = 1, t]− E
[lnWit|Dh
i = 0, t]
E[Si|Dh
i = 1, t]− E
[Si|Dh
i = 0, t] = λt × δW |St . (21)
Similarly, if we have only a transparent instrument then we can identify the social returns
plim bIVt
t =E [lnWit|Dt
i = 1, t]− E [lnWit|Dti = 0, t]
E [Si|Dti = 1, t]− E [Si|Dt
i = 0, t]= λt × δψ|S. (22)
But if we also want to identify the speed of learning and the time-varying component of
the productivity λt, just having a hidden IV is not enough. Heuristically, comparing (13) and
(21) we can see that because the social return now varies with time, hidden IV is insufficient
to identify the signaling value of education, even with t → ∞. So to identify the signaling
value we have to separately identify the learning process from the time-varying returns to
education due to differential productivity growth. And for that transparent IV is sufficient.
From equations (21) and (22) for any t, we get
plim ∆IV,t :=plim bIV
h
t − plim bIVt
t
plim bIVt
t
=δW |St − δψ|S
δψ|S. (23)
Evaluating (23) at {t, t′ 6= t}, simplifying by using (20) and taking their ratios givesplim ∆IV,t
plim ∆IV,t′=
θtθt′
, which using the definition of θt identifies the speed of learning as
κ =plim ∆IV,t′ − plim ∆IV,t
(t− 1)× plim ∆IV,t − (t′ − 1)× plim ∆IV,t′. (24)
39

Thus, changes in the relative difference between estimates of the private and the social
returns to education across two time periods can identify the speed of employer learning.
For empirical implementation, we can use (t′, t) = (0, 1). Once we make the location nor-
malization λ0 = 1, we recover the time-invariant part of the social return using transparent
IV on log-wages, at the initial period from (22), i.e., plim bIVt
0 = δψ|S. From the definition of
θt we know that θ0 = 1, so we can also identify the time-invariant part of the adjustment term
using the difference between estimates of returns to education using a hidden and a transpar-
ent IV at the initial period from (20), i.e., plim bIVh
0 − plim bIVt
0 = (φA|S + φA|QδQ|S − δA|S).
Once we have the estimates, (bIVh
0 , bIVh
1 , bIVt
0 , bIVt
1 ), we can plug them in (24) to first identify
κ. Additionally, with estimates bIVh
t for t > 1, we can identify each component in (20).
Finally, as a corollary of the above identification results, we note that a transparent IV can
help us test the log-separability assumption embedded in the standard models of employer
learning, including ours in Section 2 by exploiting the following features. Importantly, using
a transparent IV alone we can identify the (time-varying) social returns to education at each
t, however, this is not sufficient to identify the speed of learning, or the signaling value of
education. In contrast, under the log-separability of education and experience, a hidden IV
is sufficient for identification of key model parameters, as we showed in Section 3.
6.2 Heterogeneous Returns
While we have only considered homogeneous returns to education, there is an increasing
recognition in the empirical literature that the returns can be heterogeneous across workers.
The advantages of having homogeneous returns in our employer learning model were that it
allowed us to keep the model tractable, and provide intuitive and informative characterization
of its empirical content. For instance, we were able to capture the learning process, the social
returns and the private returns, all with only one parameter each, and were also able to
compare our estimates and synthesize results across different studies and approaches. These
benefits notwithstanding, it is important to consider how our identification strategies would
40

change if the returns were heterogeneous. In Appendix Section A.2 we analyze this question
using the Neyman-Rubin potential outcomes framework with binary schooling choices, e.g.,
high or low schooling. For brevity, here we only present a summary of our main findings.
As before, we start by allowing workers’ productivity to depend on whether they obtain
high or low schooling. We now define the social returns to be the differences in potential
productivities across different choices of schooling, and similarly, define the private returns
to be the differences in potential wages across different choices of schooling. Thus, both mea-
sures of returns become worker-specific, and if we aggregate these returns across appropriate
subset of workers, we can define the average social returns and the average private returns,
or the social returns for the treated and the private returns for the treated, respectively.
Since Imbens and Angrist [1994] it is well-known that with heterogeneous returns an
IV identifies the local average treatment effect for those who are induced by the IV to
switch their schooling status. In particular, if the IV satisfies an appropriate monotonicity
condition then it identifies the treatment effect on the compliers, and hence, the causal effect
of schooling on workers who do not obtain schooling in the absence of the IV but obtain
schooling when “exposed” to the IV. We add to this result by showing that a hidden IV
identifies the private returns on the compliers, and that a transparent IV identifies the social
returns on the compliers. Furthermore, we show that even with heterogeneity private returns
converge to the social returns, as employers learn. And thus, for compliers with finite years of
experiences, the hidden IV identifies the private returns, and for those with long experience
it identifies the social and private returns.
The identification of the speed of learning, however, poses additional challenges, and re-
quires additional assumptions. The reason for this difficulty is that now, with heterogeneous
returns, the speed of learning can depend on the level of schooling, and the interpretation of
the earnings profile depends on whether we assume that it is easier for employers to learn the
abilities of those who have high schooling or of those who have low schooling. For instance,
all else equal, a worker with unusually high skills can have higher returns associated with a
41

schooling level, and about whom employers learn (and reward) quickly. To make progress,
we assume that the conditional distribution of productivity, given schooling is normal.
We show that the hidden IV estimates of returns to schooling, at each experience level,
can be expressed as a weighted linear combination of these schooling level-specific learning
parameters, where the weights depend on the extent of selection on unobserved productivity,
among the compliers. We can use this system of linear equations to identify the weights and
the speed of learning, as long as there is some selection between unobservable ability and
school choice. Heuristically, the selection plays the role of a rank condition, which is necessary
to “invert” a system of linear equations to identify unknown coefficients. For instance, if there
was no selection and the schooling decisions were uncorrelated with unobserved ability, then
this would lead to “bunching” in schooling and we will fail to infer the effect of employers
learning on wages. When there is selection, and if we assume that the speed of learning
for higher schooling level is faster than for low schooling and if this difference in speed is
constant over life-cycle, then we can identify the speed of learning.
Thus, our main results about the identification private and social returns under homo-
geneity carry through to a model with heterogeneous returns to education, with a caveat
that under latter we can only estimate average (private or social) returns for the compliers.
The learning process, however, differs substantially across these two regimes. In particular
we show that if the compliers are positively selected, then the private returns include a pos-
itive information return, assuming that the speed of learning increases with schooling, as in
Arcidiacono et al. [2010]. So, the identification of the learning parameters becomes more
involved when learning differs across schooling levels.
7 Conclusion
Education policy hinges on the estimates of private and social returns to education, but
these returns are notoriously difficult to estimate separately. In this paper, we determine
42

conditions under which instrumental variables allow us to separately identify the private and
social returns to education, within the context of an employer learning model.
We distinguish between two types of IVs: hidden IVs and transparent IVs, where the
former are unobserved by employers and thus not directly priced in the wages, while the latter
are observed by the employers and correctly factored in the wages. We show that hidden
IV identifies the private returns to education. If log-wage profiles are additively separable
in experience and schooling, hidden IV also help identify the social returns to education. A
transparent IV, by contrast, identifies the social returns to education at each level of work
experience. Building on this distinction between hidden and transparent IVs, we propose a
strategy to identify the returns to education that can be attributed to job market signaling.
Using data from Norway we estimate that the causal effect of schooling on productivity,
i.e., the social return to schooling, is 5% and the private return is 7.2%. The difference
between the two is attributable to the signaling value of education. In other words, we
estimate that 70% of the total private returns to education accrues to human capital and
30% accrues to signaling. Our estimates also suggest employers learn workers’ ability quickly.
We conclude this paper by pointing out a few shortcomings of our model. First, our
baseline specification of the employer learning model following Farber and Gibbons [1996]
and Altonji and Pierret [2001] assumes that the log-productivity is additively separable in
schooling, ability, and experience. While this assumption naturally emerges from various
formulations of the human capital model (e.g., the Ben-Porath model), it is still restrictive.
Moreover, the data patterns that are taken as evidence of employer learning [Lange, 2007]
are also compatible with other calibrations of human capital models [Kaymak, 2014]. While
we have taken steps (see Section 6.1) towards addressing these shortcomings, more work is
needed in this area, especially in settings where researchers have access to both hidden and
transparent instruments. In such settings, researchers can apply our identification results to
estimate the speed of learning and the signaling value of education.
Secondly, throughout our paper we have maintained an assumption of symmetric learning
43

across employers. In other words, our analysis assumes that switching jobs does not affect
the speed of learning. This implies that all current and future employers have the same
information about an employee. While there has been some empirical support in favor of
symmetric learning, at least for employees with low education [Schonberg, 2007], there is also
empirical evidence obtained from from wage changes across jobs that incumbent employers
have an information advantage [Gibbons and Katz, 1991; Kahn, 2013], which in turn can lead
to different speed of learning and different wage profiles; see Pinkston [2009]. The learning
process becomes significantly more complex when there is asymmetric learning, and when
workers and employers act strategically based on this asymmetry. In such settings, it is thus
quite challenging to determine the implications for social and private returns to education.
Having noted these limitations, we do believe that instrumental variable estimates can
provide useful information on the debate between proponents of the human capital and
signaling models of the returns to education. We hope that future researchers estimating
instrumental variable estimates of the returns to education will, as a matter of course, discuss
how informed employers are about the instruments and what this implies for interpreting
the instrumental variable estimates that are provided.
44

References
Aakvik, Arild, Kjell G. Salvanes, and Kjell Vaage. 2010. Measuring Heterogeneity in the
Returns to Education in Norway Using Educational Reforms. European Economic Review
54, no. 4:483–500. 21
Acemoglu, Daron and Joshua Angrist. 2000. How Large Are Human-Capital Externalities?
Evidence from Compulsory Schooling Laws. NBER Macroeconomics Annual 15:9–59. 2
Altonji, Joseph G. and Charles R. Pierret. 2001. Employer Learning and Statisical Discrim-
ination. Quarterly Journal of Economics 116, no. 1:313–350. 1, 2, 43
Angrist, Joshua D. and Guido W. Imbens. 1995. Two-Stage Least Squares Estimation
of Average Causal Effects in Models with Variable Treatment Intensity. Journal of the
American Statistical Association 90:431–442. 26, 51
Angrist, Joshua D. and Alan B. Krueger. 1992. Estimating the Payoff to Schooling Using
the Vietnam-Era Draft Lottery. NBER Working Paper 4067 . 15
———. 1999. Empirical Strategies in Labor Economics. In Handbook of Labor Economics,
eds. Orley Ashenfelter and David Card. Amsterdam: North-Holland, 1277–1366. 51
Arcidiacono, Peter, Patrick Bayer, and Aurel Hizmo. 2010. Beyond Signaling and Human
Capital: Education and the Revelation of Ability. American Economic Journal: Applied
Economics 2, no. 4:76–104. 5, 33, 37, 38, 42
Arteaga, Carolina. 2018. The Effect of Human Capital on Earnings: Evidence from a Reform
in Columbia’s Top University. Journal of Public Economics 157:212–225. 2
Becker, Gary S. 1962. Investment in Human Capital: A Theoretical Analysis. Journal of
Political Economy 70, no. 5:9–49. 2
Bedard, Kelly. 2001. Human Capital versus Signaling Models: University Access and High
School Dropouts. Journal of Political Economy 109, no. 4:749–775. 2
45

Bhuller, Manudeep, Magne Mogstad, and Kjell G. Salvanes. 2017. Life-Cycle Earnings,
Education Premiums, and Internal Rate of Return. Journal of Labor Economics 35,
no. 4:993–1030. 21, 24, 25
Black, Sandra E., Paul J. Devereux, and Kjell G. Salvanes. 2005. Why the Apple Doesn’t
Fall Far: Understanding Intergenerational Transmission of Human Capital. American
Economic Review 95, no. 1:437–449. 21
Brinch, Christian N. and Taryn A. Galloway. 2012. Schooling in Adolescence Raises IQ
Scores. Proceedings of the National Academy of Sciences of the United States of America
109, no. 2:425–430. 31
Cameron, Stephen V. and James J. Heckman. 1998. Life Cycle Schooling and Dynamic
Selection Bias: Models and Evidence for Five Cohorts of American Males. Journal of
Political Economy 106, no. 2:262–333. 17
Cameron, Stephen V. and Christopher R. Taber. 2004. Estimation of Educational Borrowing
Constraints Using Returns to Schooling. Journal of Political Economy 112, no. 1:132–182.
17
Card, David. 1993. Using Geographic Variation in College Proximity to Estimate the Return
to Schooling. NBER Working Paper 4483 . 17
———. 1999. The Causal Effect of Education on Earnings. In Handbook of Labor Economics,
vol. 3, eds. Orley Ashenfelter and David Card, chap. 30. Elsevier, 1801–1863. 6, 37
Carlsson, Magnus, Gordon B. Dahl, Bjorn Ockert, and Dan-Olof Rooth. 2015. The Effect of
Schooling on Cognitive Skills. Review of Economics and Statistics 97, no. 3:533–547. 31
Carneiro, Pedro, James J. Heckman, and Edward J. Vytlacil. 2011. Estimating Marginal
Returns to Education. American Economic Review 101, no. 6:2754–2781. 17, 38
46

Clark, Damon and Paco Martorell. 2014. The Signaling Value of a High School Diploma.
Journal of Political Economy 122, no. 2:282–318. 2
Duflo, Esther. 2001. Schooling and Labor Market Consequences of School Construction in
Indonesia: Evidence from an Unusual Policy Experiment. American Economic Review 91,
no. 4:795–813. 16
Dynarski, Susan M. 2003. Does Aid Matter? Measuring the Effect of Student Aid on College
Attendance and Completion. American Economic Review 93, no. 1:279–288. 15
Fang, Hanming. 2006. Disentangling the College Wage Premium: Estimating a Model with
Endogenous Education Choices. International Economic Review 47, no. 4:1151–1185. 2
Farber, Henry S. and Robert Gibbons. 1996. Learning and Wage Dynamics. Quarterly
Journal of Economics 111, no. 4:1007–1047. 1, 2, 43
Feng, Andy and Georg Graetz. 2017. A Question of Degree: The Effects of Degree Class on
Labor Market Outcomes. Economics of Education Review 61:140–161. 2
Gibbons, Robert and Lawrence Katz. 1991. Layoffs and Lemons. Journal of Labor Economics
9:351–380. 44
Gundersen, Frantz and Dag Juvkam. 2013. Inndelinger i senterstruktur, sentralitet og BA-
regioner. NIBR - rapport 2013:1 (in Norwegian) . 21
Heckman, James J, Lance J Lochner, and Petra E Todd. 2006a. Earnings Functions, Rates
of Return and Treatment Effects: The Mincer Equation and Beyond. Handbook of the
Economics of Education 1:307–458. 6, 37
Heckman, James J., Sergio Urzua, and Edward J. Vytlacil. 2006b. Understanding Instru-
mental Variables in Models with Essential Heterogeneity. Review of Economic Studies 88,
no. 3:389–432. 51
47

Hopkins, Edward. 2012. Job Market Signaling of Relative Position, or Becker Married to
Spence. Journal of the European Economic Association 10, no. 2:290–322. 2
Imbens, Guido W. and Joshua D. Angrist. 1994. Identification and Estimation of Local
Average Treatment Effects. Econometrica 62, no. 2:467–475. 6, 41, 54
Kahn, Lisa B. 2013. Asymmetric Information between Employers. American Economic
Journal: Applied Economics 5, no. 4:165–205. 7, 44
Kane, Thomas J. and Cecilia Elena Rouse. 1995. Labor-Market Returns to Two- and Four-
Year Colleges. American Economic Review 85, no. 3:600–614. 17
Kaymak, Baris. 2014. Postschooling Training Investment and Employer Learning. Journal
of Human Capital 8, no. 3:318–349. 43
Kirkeboen, Lars J., Edwin Leuven, and Magne Mogstad. 2016. Field of Study, Earnings,
and Self-Selection. Quarterly Journal of Economics 131, no. 3:1057–1111. 19
Kling, Jeffrey R. 2001. Interpreting Instrumental Variables Estimates of the Returns to
Schooling. Journal of Business and Economic Statistics 19, no. 3:358–364. 17
Lange, Fabian. 2007. The Speed of Employer Learning. Journal of Labor Economics 25,
no. 1:1–35. 2, 3, 4, 5, 6, 7, 8, 12, 25, 33, 35, 43
Lange, Fabian and Robert Topel. 2006. The Social Value of Education and Human Capital.
Handbook of the Economics of Education 1:459–509. 2
Lemieux, Thomas and David Card. 2001. Education, Earnings, and the ‘Canadian G.I. Bill’.
Canadian Journal of Economics 34, no. 2:313–344. 17
Lochner, Lance. 2011. Chapter 2 - Nonproduction Benefits of Education: Crime, Health,
and Good Citizenship. In Handbook of the Economics of Education, vol. 4, eds. Eric A.
Hanushek, Stephen Machin, and Ludger Woessmann. Elsevier, 183–282. 2
48

Løken, Katrine V., Magne Mogstad, and Matthew Wiswall. 2012. What Linear Estimators
Miss: The Effects of Family Income on Child Outcomes. American Economic Journal:
Applied Economics 4, no. 2:1–35. 26, 51
Machin, Stephen, Kjell G. Salvanes, and Panu Pelkonen. 2012. Education and Mobility.
Journal of the European Economic Association 10, no. 2:417–450. 21
Meghir, Costas and Marten Palme. 2005. Educational Reform, Ability, and Family Back-
ground. American Economic Review 95, no. 1:414–424. 16
Mogstad, Magne and Matthew Wiswall. 2016. Testing the Quantity–Quality Model of Fer-
tility: Estimation Using Unrestricted Family Size Models. Quantitative Economics 7,
no. 1:157–192. 26, 51
Monstad, Karin, Carol Propper, and Kjell G. Salvanes. 2008. Education and Fertility:
Evidence from a Natural Experiment. Scandinavian Journal of Economics 110, no. 4:827–
852. 21, 23
Moretti, Enrico. 2004. Estimating the Social Return to Higher Education: Evidence from
Longitudinal and Repeated Cross-Sectional Data. Journal of Econometrics 121, no. 1-
2:175–212. 2
Oreopoulos, P. 2006. Estimating Average and Local Average Treatment Effects of Education
when Compulsory Schooling Laws Really Matter. American Economic Review 96:152–175.
17
Oreopoulos, Philip and Kjell G. Salvanes. 2011. Priceless: The Nonpecuniary Benefits of
Schooling. Journal of Economic Perspectives 25, no. 1:159–184. 2
Pinkston, Joshua C. 2009. A Model of Asymmetric Employer Learning with Testable Impli-
cations. Review of Economic Studies 76, no. 1:367–394. 7, 44
49

Pons, Empar and Maria Teresa Gonzalo. 2002. Returns to Schooling in Spain: How Reliable
Are IV Estimates? Labour 16, no. 4:747–770. 15
Schonberg, Uta. 2007. Testing for Asymmeric Employer Learning. Journal of Labor Eco-
nomics 25, no. 4:651–691. 7, 44
Spence, Michael. 1973. Job Market Signaling. Quarterly Journal of Economics 87, no. 3:355–
374. 2, 10
Sundet, Jon Martin, Dag G. Barlaug, and Tore M. Torjussen. 2004. The End of the Flynn Ef-
fect? A Study of Secular Trends in Mean Intelligence Test Scores of Norwegian Conscripts
During Half a Century. Intelligence 32:349–362. 19
Taber, Christopher R. 2001. The Rising College Premium in the Eighties: Return to College
or Return to Unobserved Ability? Review of Economic Studies 68, no. 3:665–691. 15
Thrane, Vidkunn C. 1977. Evneprøving av utskrivingspliktige i Norge 1950-53. Arbeidsrap-
port nr. 26, INAS (in Norwegian) . 19
Tyler, John H., Richard J. Murnane, and John B. Willett. 2000. Estimating the Labor
Market Signaling Value of the GED. Quarterly Journal of Economics 115, no. 2:431–468.
2
Waldman, Michael. 1984. Job Assignments, Signalling, and Efficiency. The RAND Journal
of Economics 15, no. 2:255–267. 7
Wolpin, Kenneth I. 1977. Education and Screening. American Economic Review 67,
no. 5:949–958. 2
50

Appendix
A.1 Non-Linear Returns to Education
When the true relationship between log-earnings and schooling is non-linear, the marginal
effects of schooling on log-earnings differ across the support of schooling distribution. In such
settings, comparisons of OLS and IV estimates are complicated because linear OLS and IV
estimators typically identify different weighted averages of the marginal effects of schooling.27
It is, however, possible to re-weight margin-specific OLS estimates and construct IV-weighted
OLS estimates that are comparable to the IV estimates.
Let bWOLSt denote such IV-weighted OLS estimates. Consider the following non-linear
relationship between log-earnings and schooling:
lnWit = aOLSt +21∑s=8
γOLSs,t × 1 (Si ≥ s) + cOLSt Zit + etXi + uOLSit ;
bWOLSt =
21∑s=8
γOLSs,t × πIVs ; πIVs =cov (1 (Si ≥ s) , Di)
cov (Si, Di), (A.1)
where 1 (Si ≥ s) is an indicator for having at least s years of schooling, and Di ∈ {0, 1} is
a binary instrument which equals 1 if individual i was exposed to the compulsory schooling
reform. The parameter bWOLSt is a weighted sum of margin-specific OLS estimates γOLSs,t
from a non-linear relationship between schooling and log-earnings, using weights πIVs that
mimic the variation exploited by the IV estimator. Intuitively, the IV estimates emphasize
the marginal effects of schooling for those that are most affected by the instrument.
Using the specification in Equation (A.1), we can thus construct IV-weighted OLS es-
timates of returns to education. There are two components that determine the differences
between these estimates and the standard linear OLS estimates. One is the extent of non-
linearity in the margin-specific OLS estimates γOLSs,t , and the other one is the differences
27 See, e.g., discussions in Angrist and Imbens [1995]; Angrist and Krueger [1999]; Heckman et al. [2006b];Løken et al. [2012] and Mogstad and Wiswall [2016].
51

0
.1
.2
.3
.4
.5
.6
.7
.8
.9
Th
e E
ffe
cts
of
Ye
ar
of
Sch
oo
ling
on
Lo
g−
Ea
rnin
gs
(Re
lative
to
Ha
vin
g O
nly
7 Y
ea
rs o
f S
ch
oo
ling
)
8 9 10 11 12 13 14 15 16 17 18 19 20 21Years of Schooling
Point Estimate 95% CI
(a) Non-Linear Returns to Schooling
0
.1
.2
.3
.4
.5
Ma
rgin
−S
pe
cific
We
igh
ts
8 9 10 11 12 13 14 15 16 17 18 19 20 21Years of Schooling
OLS Weights
IV Weights
(b) Margin-Specific OLS and IV Weights
Figure A.1: Non-Linear Returns to Schooling and Margin-Specific OLS and IV Weights.Note: Panel (a) plots OLS estimates of returns to schooling at 10-20 years of experience from a specification with dummies foreach year of schooling, controlling for cohort and childhood municipality fixed effects, and flexible time trends. The estimationsample consists of Norwegian males born 1950-1980 observed in earnings data over years 1967-2014 with years of experiencebetween 10 and 20 years and annual earnings above 1 SGA threshold. The estimates show the returns to each year of schoolingrelative to 7 years of compulsory schooling. Panel (b) plots the margin-specific OLS and IV weights at each year of schooling.
between the IV weights πIVs and the corresponding OLS regression weights. In Figure A.1-
(a), we display the (stacked average of) estimates γOLSs,t at experiences t = (10, .., 20) for each
additional year of schooling relative to 7 years of compulsory schooling, which illustrates the
non-linear relationship between years of schooling and log-earnings in our data.
Next, in Figure A.1-(b), we display the margin-specific IV weights πs that are used to
obtain estimates bWOLSt =
∑s γ
OLSs,t πIVs . We also display the margin-specific weights for
a standard linear OLS regression, and as expected these weights differ substantially from
the IV weights. In particular, the IV places substantially more weight on the marginal
effects of schooling in the lower end of the schooling distribution. This is consistent with the
compulsory schooling reform instrument triggering changes in schooling attainment mainly
at the lower end of the schooling distribution.
52

A.2 Heterogeneous Returns to Education
In this section, we extend our model to allow heterogeneous returns to education, and de-
termine conditions under which we can use IVs to identify key model parameters. Using the
binary potential outcomes framework of Neyman-Rubin, let us assume that schooling takes
two values, Si ∈ {0, 1}, where Si = 1 (respectively, 0) denotes a higher (respectively, lower)
level of schooling. A worker i is characterized by a random vector of potential outcomes
{{ψ0,i, Q0,i}, {ψ1,i, Q1,i}}, where ψS,i denotes the time-invariant component of i’s productiv-
ity and QS,i is the skill correlate observed by employers, given i’s choice of Si. Thus, the
differences in abilities Ai in (1) are now subsumed in the two potential outcomes {ψ0,i, ψ1,i}.
Furthermore, without loss of generality we can normalize the latent variable (hidden
correlate) QS,i to be in productivity units, and express i’s productivity with schooling Si as
ψS,i = QS,i + ψS,i; ψS,i ⊥ QS,i, (A.2)
by projecting ψS,i onto QS,i, for those with Si = S, and normalizing the coefficient of QS,i
to be one and treating ψS,i as the “residual.” Thus, we can treat ψS,i as the productivity
differences across workers that are unobserved by the employers, which they learn about
using i’s past outputs that are noisy measures of worker productivity. In particular, using
the potential outcomes defined above, we can express realized productivity ψi,t at time t as:
ψi,t = Si ×[Q1,i + ψ1,i + ε1,i,t
]+ (1− Si)×
[Q0,i + ψ0,i + ε0,i,t
]+H(t), (A.3)
where εS,i,ti.i.d∼ N
(0, σ2
ε,S
)are mean-zero “noise” in the production process that are indepen-
dent of the model primitives, with possibly schooling dependent variances. For notational
ease, we suppress H(t) in the following.28
Worker i knows his potential outcomes {ψ0,i, Q0,i, ψ1,i, Q1,i}, but employers only observe
28Note that productivity ψi,t is expressed in levels and not in logs, because with this level of generality itis easier to work in levels. And as in Section 2, we maintain that S and H(t) are additively separable.
53

(Si, QS,i, ψti), where ψti = {ψi,τ}τ<t, and (QS,i, ψ
ti) are observed only for Si = S. Note that
observing ψi,t, conditional on Si and having observed QS,i, is informationally equivalent to
observing ξS,i,t = ψS,i + εS,i,t, i.e., a noisy measure of workers’ unobserved ability. We can
thus denote the employers’ information set by ESi,t = (Si, QS,i, ξtS,i), where ξtS,i = {ξS,i,τ}τ<t.
Wages are set equal to the expected productivity, conditional on information ESi,t, i.e.,
Wi,t = E[ψi,t
∣∣∣ESi,t] = Si ×[Q1,i + E
[ψ1,i
∣∣∣E1i,t
]]︸ ︷︷ ︸
:=W1,i,t
+(1− Si)×[Q0,i + E
[ψ0,i
∣∣∣E0i,t
]]︸ ︷︷ ︸
:=W0,i,t
= Si ×W1,i,t + (1− Si)×W0,i,t, (A.4)
where the second equality follows from the definition ψi,t in (A.3) and the independence and
zero-mean properties of εS,i,t, and WS,i,t denotes potential wage outcomes for different Si.
We can define the social returns and the private returns to schooling for i, respectively, as
δψ|Si := ψ1,i − ψ0,i = (Q1,i −Q0,i) +
(ψ1,i − ψ0,i
); (A.5)
δW |Si,t := W1,i,t −W0,i,t = (Q1,i −Q0,i) + E
[ψ1,i|E1
i,t
]− E
[ψ0,i|E0
i,t
]. (A.6)
Note that both the social returns δψ|Si and the private returns δ
W |Si,t are individual-specific.
The average social returns and average private returns are then the population averages
of (A.5) and (A.6), respectively, while measures such as social returns for the treated and
private returns for the treated are averages across the corresponding populations.
Instrumental Variables
To understand what a binary instrument identifies, we proceed analogous to Imbens and
Angrist [1994]. Let Si (Di) denote schooling conditional on Di ∈ {0, 1}, and define compliers
as C ≡{i|Si (1) = 1, and Si (0) = 0} and defiers as D ≡{i|Si (1) = 0, and Si (0) = 1}. Sim-
ilarly, we can define always-takers to be A ≡{i|Si (1) = 1, and Si (1) = 1} and never-takers
54

to be N ≡{i|Si (1) = 0, and Si (0) = 0}. Then, as before, the Wald estimator gives
plim bIVt :=E [Wi,t|Di = 1]− E [Wi,t|Di = 0]
E [Si|Di = 1]− E [Si|Di = 0]. (A.7)
As D satisfies monotonicity we get Pr(D) = 0, so we can write (A.7)’s denominator as
E [Si|Di = 1]− E [Si|Di = 0] = (E [Si|Di = 1,A]− E [Si|Di = 0,A])× Pr(A)
+ (E [Si|Di = 1,N]− E [Si|Di = 0,N])× Pr(N)
+ (E [Si|Di = 1,C]− E [Si|Di = 0,C])× Pr(C)
+ (E [Si|Di = 1,D]− E [Si|Di = 0,D])× Pr(D) = Pr(C). (A.8)
As in Section 3.3, we consider two types of binary instruments: a hidden IV, Dhi ∈ {0, 1},
and a transparent IV, Dti ∈ {0, 1}. With a hidden IV, we also know that i’s wage conditional
on employer information ESi,t does not depend on the IV itself. Thus, for Dhi , we have
E[Wi,t|Dhi = 1]− E[Wi,t|Dh
i = 0] =(E[Wi,t|Dh
i = 1,C]− E[Wi,t|Dhi = 0,C]
)× Pr(C)
=(E[W1,i,t|Dh
i = 1,C]− E[W0,i,t|Dhi = 0,C]
)× Pr(C)
= (E[W1,i,t|C]− E[W0,i,t|C])× Pr(C) = E[δW |Si,t |C]× Pr(C). (A.9)
The first equality follows from the law of total expectation, the second from the definition
of a complier and substituting for the potential outcomes from (A.4), the third from the
properties of a hidden IV, and the last from the definition of private returns in (A.6). Using
(A.8) and (A.9) in (A.7) with a hidden IV shows that plim bIVh
t = E[δW |Si,t
∣∣C], i.e., the Wald
estimator using a binary hidden IV identifies the private returns to education for compliers.
Next, we consider the identification with transparent IV, Dti ∈ {0, 1}. Wages equal
expected productivity given employer information (ESi,t, Dti), i.e., Wi,t = E[ψi,t|ESi,t, Dt
i] and
E [Wi,t|Dti] = E[E[ψi,t|ESi,t, Dt
i]|Dti] = E[ψi,t|Dt
i], which follows from the law of total expecta-
55

tion. Conditional on Dti, the average compensation equals the average product, and hence
E[Wi,t|Dt
i = 1]− E[Wi,t|Dt
i = 0] = E[ψi,t|Dti = 1]− E[ψi,t|Dt
i = 0] = E[ψ1,i − ψ0,i|C]× Pr (C)
= E[δψ|Si |C]× Pr (C) . (A.10)
Using (A.8) and (A.10) in (A.7) with a transparent IV shows that plim bIVt
= E[δψ|Si |C],
i.e., the Wald estimator using a binary transparent IV identifies the (constant) social return
to education for compliers. Therefore, as in the case with homogeneous returns, a transparent
IV identifies the social returns and a hidden IV identifies the private returns to education,
albeit now these returns are estimated only for the compliers. Note that this identification
result requires fewer assumptions than under homogeneous returns.
As a corollary to the above identification results, we note the following. In settings
where researchers have access to both a hidden IV and a transparent IV it is also possible to
identify a signaling value of education using plim bIVh
t and plim bIVt, as long as compliers
associated with each IV have identical average potential outcomes. The latter assumption
allows us to extrapolate outcomes from one set of compliers to the other, and thus, identify
a local signaling value of education. If, however, we have access to only a hidden IV, then
to apply the same idea as we proposed earlier for homogeneous returns in (14), we have
to verify if limt→ plim bIVh
t = E(δψ|Si |C), which in turn requires us to model the speed of
learning.
The Speed of Learning
Next, we consider the identification of the speed of learning by determining how quickly
information about workers is revealed in the market and reflected in their compensations.
But unlike with homogeneous returns, with heterogeneous returns, the speed of learning will
depend on schooling and on the selection between schooling and unobserved ability. So, to
identify these speeds of learning across schooling choices, additional assumptions are needed.
56

One such assumption is about the conditional distribution of productivity, given Si that
arises in equilibrium. Even though we do not model workers’ schooling decisions, to model the
learning process of the employers we need the productivity distribution. Let the unobserved
components of productivity, conditional on schooling S, follow a bivariate normal distribu-
tion, i.e.,(QS,i, ψS,i
)∼ N
((µQ,S, µψ,S)>,Σ
), where Σ is the diagonal vairance-covairance
matrix with conditional variances σ2Q,S and σ2
ψ,S, and from (A.2) Cov(QS,i, ψS,i|S) = 0.29
This assumption is strong because it is imposed directly on the outcomes of a model where
workers sort into schooling levels based on their abilities, and not only on the primitives.
Recall that wages are set equal to expected productivity conditional on employers’ infor-
mation set ESi,t = (Si, QS,i, ξtS,i), where ξtS,i = {ξS,i,τ}τ<t. Using the potential wage outcomes
defined in (A.4), and the Kalman property as in (4), we can thus express wages as
WS,i,t = QS,i + E[ψS,i|ESi,t
]= QS,i + θS,t × µψ,S + (1− θS,t)× ξtS,i, (A.11)
where for a schooling level S, θS,t := 1−κS1+(t−1)κS
is the weight that characterize the learning
process, and κS :=σ2ψ,S
σ2ψ,S+σ2
ε,Sis the speed of learning parameters, and ξtS,i = 1
t
∑τ<t ξS,i,τ is
the average of signals up to period t. So unlike with homogenous returns in (4) the speed of
learning depends on S. Taking the conditional expectation of (A.11) for (Si, QS,i, ψS,i) gives
E[WS,i,t|Si, QS,i, ψS,i] = QS,i + θS,t × µψ,S + (1− θS,t)× E[ξS,i,t|Si, QS,i, ψS,i
]= QS,i + θS,t × µψ,S + (1− θS,t)× ψS,i
= QS,i + µψ,S + (1− θS,t)×(ψS,i − µψ,S
). (A.12)
Thus, the wages for a worker with schooling S depend on the mean values of(QS, ψS
), and
on the product of (1− θS,t), which captures employers’ learning up to t and(ψS,i − µψ,S
),
which is the deviation in the unobserved productivity from the schooling specific mean.
Those with high ability will have large(ψS,i − µψ,S
)> 0, and are rewarded more for their
29 For a given S, (µQ,S,µψ,S , σ2Q,S , σ
2ψ,S) characterize realized outcomes and not the potential outcomes.
57

ability than those with lower ability, but only after the market has learned their abilities.
Substituting (A.6), (A.9) and (A.12) in (A.7) we can express the hidden IV estimate as
plim bIVh
t = E[(Q1,i −Q0,i) + (µψ,1 − µψ,0) + (1− θ1,t)
(ψ1,i − µψ,1
)− (1− θ0,t)
(ψ0,i − µψ,0
) ∣∣∣C]= E [(Q1,i −Q0,i) + (µψ,1 − µψ,0) |C]︸ ︷︷ ︸
c0
+ (1− θ1,t)E[(ψ1,i − µψ,1
)|C]
︸ ︷︷ ︸c1
− (1− θ0,t)E[(ψ0,i − µψ,0
)|C]
︸ ︷︷ ︸c2
≡ c0 + (1− θ1,t) c1 − (1− θ0,t) c2,
where θ0,t, θ1,t are known functions of t and of the signal-to-noise ratios that depend on Si = 0
and Si = 1, respectively. Note that as limt→∞ plim bIVh
t = c0 + c1 − c2 = E((Q1,i −Q0,i) +
(ψ1,i − ψ0,i)∣∣C) = E(δ
ψ|Si |C), the hidden IV estimate of the private returns can be used to
identify the social returns among the set of compliers with long work-experience, and the
returns to signaling at t as the difference (plim bIVh
t − limt→∞ plim bIVh
t ).
So, in order to identify the speed of learning we have to identify {κ0, κ1, c0, c1, c2} from
{bIV h
t }Tt=0 where T is sufficiently large. We conclude this section by noting the limits to the
ability to identify learning parameters using a hidden IV. In particular, we note that the
the speed of learning is not globally identified, regardless of the selectivity in the sample.
That is if there is no selectivity in schooling, and so E[ψ0,i − µψ,0
]= E
[ψ1,i − µψ,1
], then
the IV estimates of the returns to schooling is not sufficient to identify the speed of learning
parameters. Second, consider a value of the parameter vector (c0, c′1, c′2, κ′0, κ′1) as well its
permutated version (c0, c′2, c′1, κ′1, κ′0). Both of these values are consistent with {bIV h
t }Tt=0.
This suggests that we can identify the parameters up to a permutation of the parameters.
58