Embed Size (px)
Citation preview
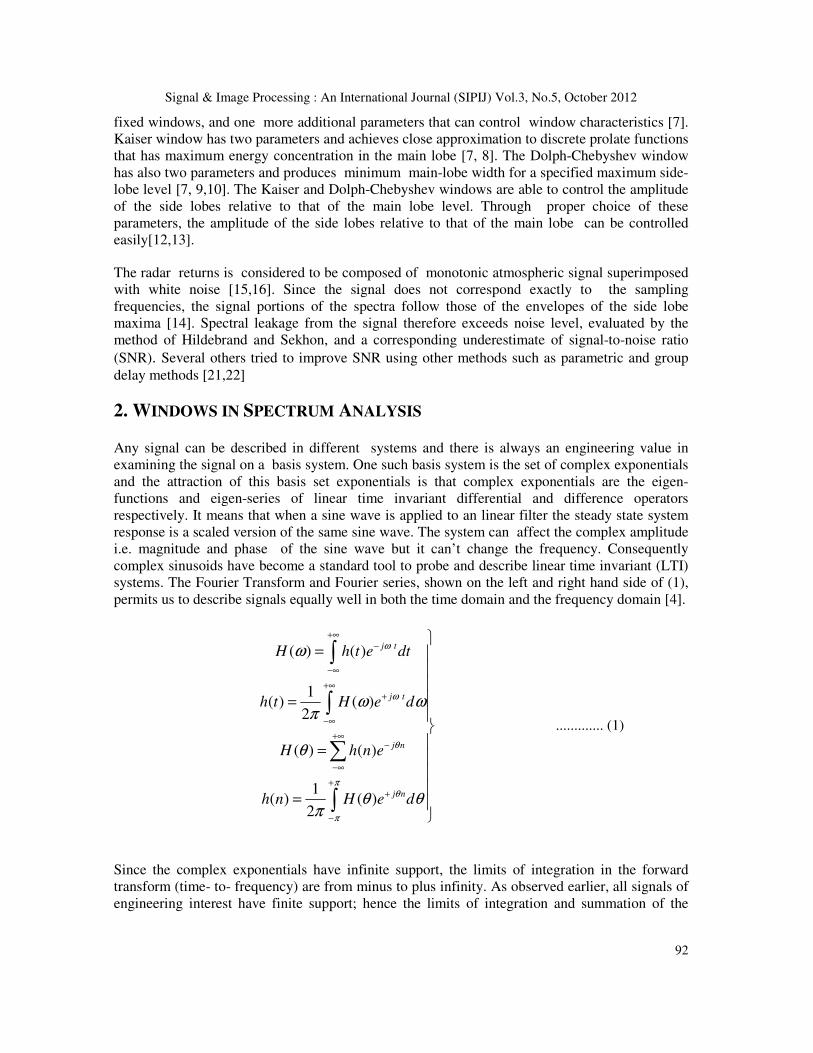
Signal & Image Processing : An International Journal (SIPIJ) Vol.3, No.5, October 2012
DOI : 10.5121/sipij.2012.3508 91
Signal to Noise Ratio(SNR) improvement of atmospheric signals using Variable windows
P.Jagadamba1 and P.Satyanarayana
2
1Assistant Professor (Senior Scale), Department of ECE, SKIT, Srikalahasti-517640.
[email protected] 2Professor of ECE, Department of ECE, S.V.University, Tirupati – 517 502.
Abstract:
Windows reduce the sidelobe leakages from the spectrum when applied to finite length time domain
sequence. Adjustable windows can be used to control the amplitude of sidelobes with respect to main lobe.
This paper presents the effect of window parameter in Dolph-chebyshev, Kaiser, Gaussian and Tukey
windows on the Signal to Noise Ratio(SNR) of radar returns and proposes an optimum value of window
parameters with which data may be weighed. A comparative study is made on the improvement of SNR
using these variable windows.
Keywords:
Dolph-chebyshev, Kaiser, Gaussian and Tukey windows, sidelobe leakages
1. INTRODUCTION
Generally windows are time-domain weighting functions used for reduction Gibbs’ oscillations
resulting from the truncation of a Fourier series. The conventional method that is adopted is to
multiply the data with a rectangular window of the same length as that of the data, finding
Discrete Fourier Transform of the multiplied sequence and from this finding the power spectrum.
The application of FFT to a finite length data leads to spectral leakage, picket fence effects and
spectrum broadening. Therefore a window which gives a spectrum that has minimum leakage is
naturally preferred. These effects can be reduced by weighting the data with suitable windows.
Therefore, the problem associated with the spectral estimation of a finite length data by the FFT
techniques is choosing efficient windows or data smoothing schemes for particular type of
signals. Windows are used to weigh complex time series of the in-phase and quadrature
components of the radar return samples prior to applying the DFT. The observed Doppler spectra
therefore represent convolution of the Fourier transforms of the original signals with those of the
weighting windows, projected onto the discrete (angular) frequencies.
Lot of work is reported in the literature on window functions. [1,2,3.4]. Windows can be
categorized as fixed type windows and adjustable type windows[5,6]. Fixed type windows have
one independent parameter, that is, the window length which controls the main-lobe width.
Adjustable windows have two or more independent parameters, that is, window length, as in
Signal & Image Processing : An International Journal (SIPIJ) Vol.3, No.5, October 2012
92
fixed windows, and one more additional parameters that can control window characteristics [7].
Kaiser window has two parameters and achieves close approximation to discrete prolate functions
that has maximum energy concentration in the main lobe [7, 8]. The Dolph-Chebyshev window
has also two parameters and produces minimum main-lobe width for a specified maximum side-
lobe level [7, 9,10]. The Kaiser and Dolph-Chebyshev windows are able to control the amplitude
of the side lobes relative to that of the main lobe level. Through proper choice of these
parameters, the amplitude of the side lobes relative to that of the main lobe can be controlled
easily[12,13].
The radar returns is considered to be composed of monotonic atmospheric signal superimposed
with white noise [15,16]. Since the signal does not correspond exactly to the sampling
frequencies, the signal portions of the spectra follow those of the envelopes of the side lobe
maxima [14]. Spectral leakage from the signal therefore exceeds noise level, evaluated by the
method of Hildebrand and Sekhon, and a corresponding underestimate of signal-to-noise ratio
(SNR). Several others tried to improve SNR using other methods such as parametric and group
delay methods [21,22]
2. WINDOWS IN SPECTRUM ANALYSIS
Any signal can be described in different systems and there is always an engineering value in
examining the signal on a basis system. One such basis system is the set of complex exponentials
and the attraction of this basis set exponentials is that complex exponentials are the eigen-
functions and eigen-series of linear time invariant differential and difference operators
respectively. It means that when a sine wave is applied to an linear filter the steady state system
response is a scaled version of the same sine wave. The system can affect the complex amplitude
i.e. magnitude and phase of the sine wave but it can’t change the frequency. Consequently
complex sinusoids have become a standard tool to probe and describe linear time invariant (LTI)
systems. The Fourier Transform and Fourier series, shown on the left and right hand side of (1),
permits us to describe signals equally well in both the time domain and the frequency domain [4].
( ) ( )
1( ) ( )
2
( ) ( )
1( ) ( )
2
j t
j t
j n
j n
H h t e dt
h t H e d
H h n e
h n H e d
ω
ω
θ
πθ
π
ω
ω ωπ
θ
θ θπ
+∞−
−∞
+∞+
−∞
+∞−
−∞
++
−
=
==
=
∫
∫
∑
∫
............. (1)
Since the complex exponentials have infinite support, the limits of integration in the forward
transform (time- to- frequency) are from minus to plus infinity. As observed earlier, all signals of
engineering interest have finite support; hence the limits of integration and summation of the
Signal & Image Processing : An International Journal (SIPIJ) Vol.3, No.5, October 2012
93
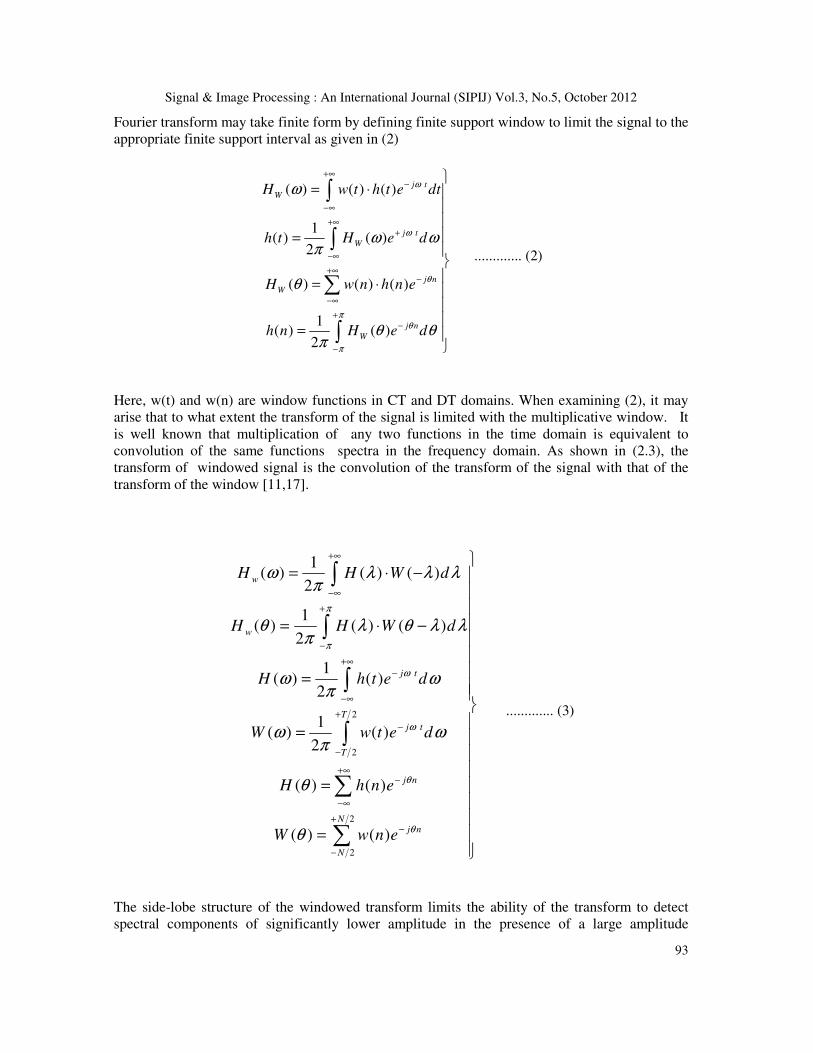
Fourier transform may take finite form by defining finite support window to limit the signal to the
appropriate finite support interval as given in (2)
( ) ( ) ( )
1( ) ( )
2
( ) ( ) ( )
1( ) ( )
2
j t
W
j t
W
j n
W
j n
W
H w t h t e dt
h t H e d
H w n h n e
h n H e d
ω
ω
θ
πθ
π
ω
ω ωπ
θ
θ θπ
+∞−
−∞
+∞+
−∞
+∞−
−∞
+−
−
= ⋅
== ⋅
=
∫
∫
∑
∫
............. (2)
Here, w(t) and w(n) are window functions in CT and DT domains. When examining (2), it may
arise that to what extent the transform of the signal is limited with the multiplicative window. It
is well known that multiplication of any two functions in the time domain is equivalent to
convolution of the same functions spectra in the frequency domain. As shown in (2.3), the
transform of windowed signal is the convolution of the transform of the signal with that of the
transform of the window [11,17].
2
2
2
2
1( ) ( ) ( )
2
1( ) ( ) ( )
2
1( ) ( )
2
1( ) ( )
2
( ) ( )
( ) ( )
w
w
j t
T
j t
T
j n
Nj n
N
H H W d
H H W d
H h t e d
W w t e d
H h n e
W w n e
π
π
ω
ω
θ
θ
ω λ λ λπ
θ λ θ λ λπ
ω ωπ
ω ωπ
θ
θ
+∞
−∞
+
−
+∞−
−∞
+
−
−
+∞−
−∞
+−
−
= ⋅ −
= ⋅ −=
=
= =
∫
∫
∫
∫
∑
∑
............. (3)
The side-lobe structure of the windowed transform limits the ability of the transform to detect
spectral components of significantly lower amplitude in the presence of a large amplitude
Signal & Image Processing : An International Journal (SIPIJ) Vol.3, No.5, October 2012
94
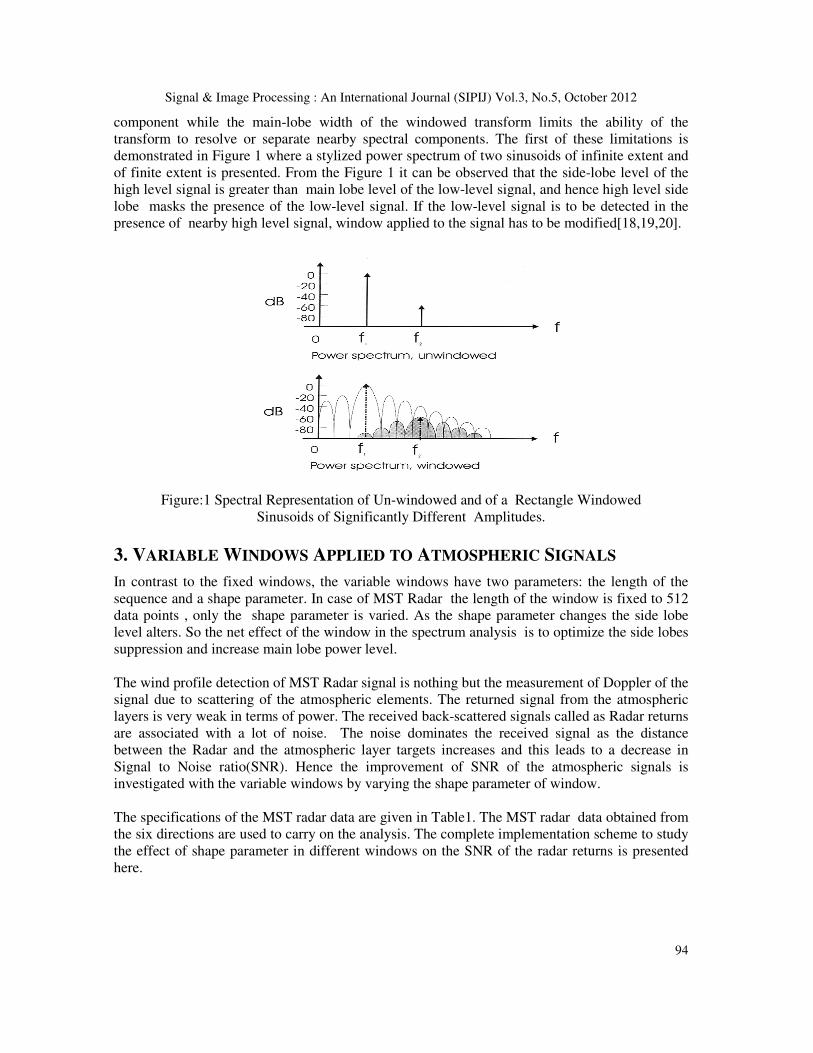
component while the main-lobe width of the windowed transform limits the ability of the
transform to resolve or separate nearby spectral components. The first of these limitations is
demonstrated in Figure 1 where a stylized power spectrum of two sinusoids of infinite extent and
of finite extent is presented. From the Figure 1 it can be observed that the side-lobe level of the
high level signal is greater than main lobe level of the low-level signal, and hence high level side
lobe masks the presence of the low-level signal. If the low-level signal is to be detected in the
presence of nearby high level signal, window applied to the signal has to be modified[18,19,20].
Figure:1 Spectral Representation of Un-windowed and of a Rectangle Windowed
Sinusoids of Significantly Different Amplitudes.
3. VARIABLE WINDOWS APPLIED TO ATMOSPHERIC SIGNALS
In contrast to the fixed windows, the variable windows have two parameters: the length of the
sequence and a shape parameter. In case of MST Radar the length of the window is fixed to 512
data points , only the shape parameter is varied. As the shape parameter changes the side lobe
level alters. So the net effect of the window in the spectrum analysis is to optimize the side lobes
suppression and increase main lobe power level.
The wind profile detection of MST Radar signal is nothing but the measurement of Doppler of the
signal due to scattering of the atmospheric elements. The returned signal from the atmospheric
layers is very weak in terms of power. The received back-scattered signals called as Radar returns
are associated with a lot of noise. The noise dominates the received signal as the distance
between the Radar and the atmospheric layer targets increases and this leads to a decrease in
Signal to Noise ratio(SNR). Hence the improvement of SNR of the atmospheric signals is
investigated with the variable windows by varying the shape parameter of window.
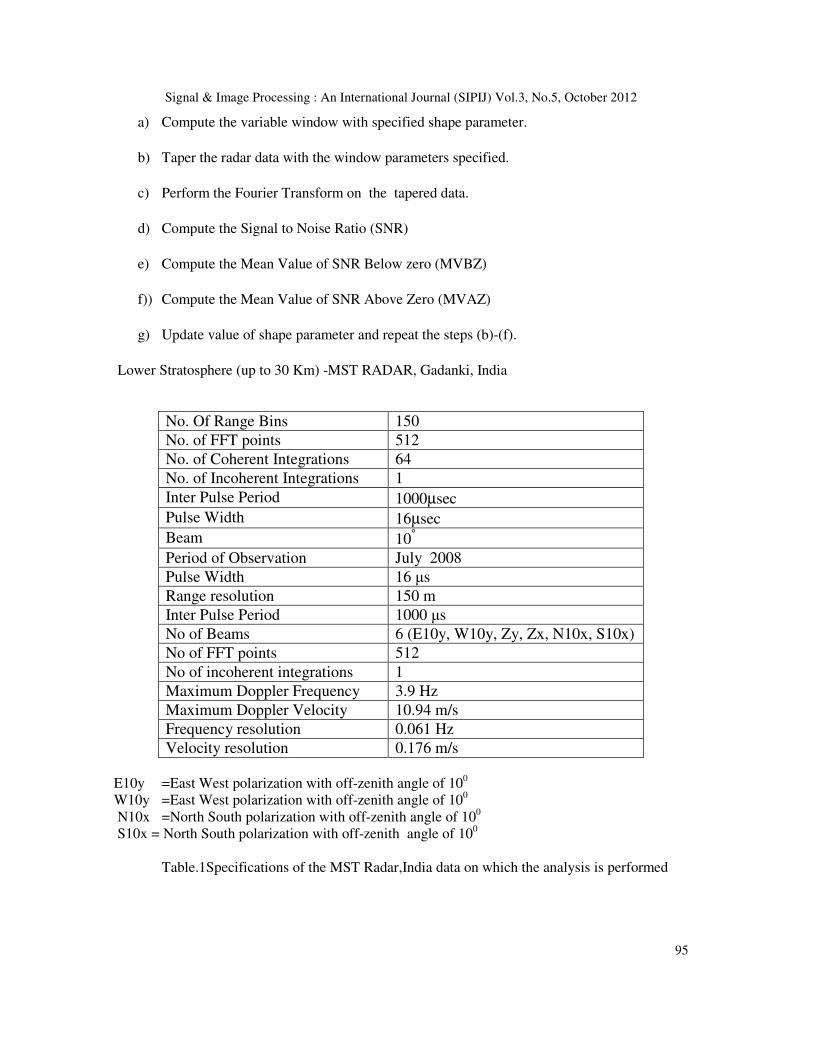
The specifications of the MST radar data are given in Table1. The MST radar data obtained from
the six directions are used to carry on the analysis. The complete implementation scheme to study
the effect of shape parameter in different windows on the SNR of the radar returns is presented
here.
Signal & Image Processing : An International Journal (SIPIJ) Vol.3, No.5, October 2012
95
a) Compute the variable window with specified shape parameter.
b) Taper the radar data with the window parameters specified.
c) Perform the Fourier Transform on the tapered data.
d) Compute the Signal to Noise Ratio (SNR)
e) Compute the Mean Value of SNR Below zero (MVBZ)
f)) Compute the Mean Value of SNR Above Zero (MVAZ)
g) Update value of shape parameter and repeat the steps (b)-(f).
Lower Stratosphere (up to 30 Km) -MST RADAR, Gadanki, India
No. Of Range Bins 150
No. of FFT points 512
No. of Coherent Integrations 64
No. of Incoherent Integrations 1
Inter Pulse Period 1000µsec
Pulse Width 16µsec
Beam 10°
Period of Observation July 2008
Pulse Width 16 µs
Range resolution 150 m
Inter Pulse Period 1000 µs
No of Beams 6 (E10y, W10y, Zy, Zx, N10x, S10x)
No of FFT points 512
No of incoherent integrations 1
Maximum Doppler Frequency 3.9 Hz
Maximum Doppler Velocity 10.94 m/s
Frequency resolution 0.061 Hz
Velocity resolution 0.176 m/s
E10y =East West polarization with off-zenith angle of 100
W10y =East West polarization with off-zenith angle of 100
N10x =North South polarization with off-zenith angle of 100
S10x = North South polarization with off-zenith angle of 100
Table.1Specifications of the MST Radar,India data on which the analysis is performed
Signal & Image Processing : An International Journal (SIPIJ) Vol.3, No.5, October 2012
96
4. DOLPH-CHEBYSHEV WINDOW ANALYSIS
The optimality criterion of the Dolph- Chebyshev window is that it’s the Fourier transform
exhibits main-lobe width narrowest for a selected/given side-lobe level. The Fourier transform of
Dolph-chebyshev window exhibits equal ripple for the specified side-lobe level. The Fourier
Transform of this window is a mapping of algebraic Nth Chebyshev polynomial to the Nth
order trigonometric Chebyshev polynomial by TN(X) = COS(Nq). The Dolph-Chebyshev window
is defined in terms of Fourier transform of uniformly spaced samples of the polynomial. These
samples are defined in.
( )
1
1
1 20
21
0
cosh cosh ( cos( ))
( ) ( 1) : 0 1cosh[ cosh ( )]
where is defined by :
1cosh cosh (10 )
and where A Sidelobe level in dB
( ) ( ) : and where ( ) (
k
A
N j nkN
k
kN
NW k k N
N
N
w n w k e W N k W k
π
β π
β
β
β
−
−
−−
−
=
= − ≤ < −
=
=
= − = −∑ )
....... (4)
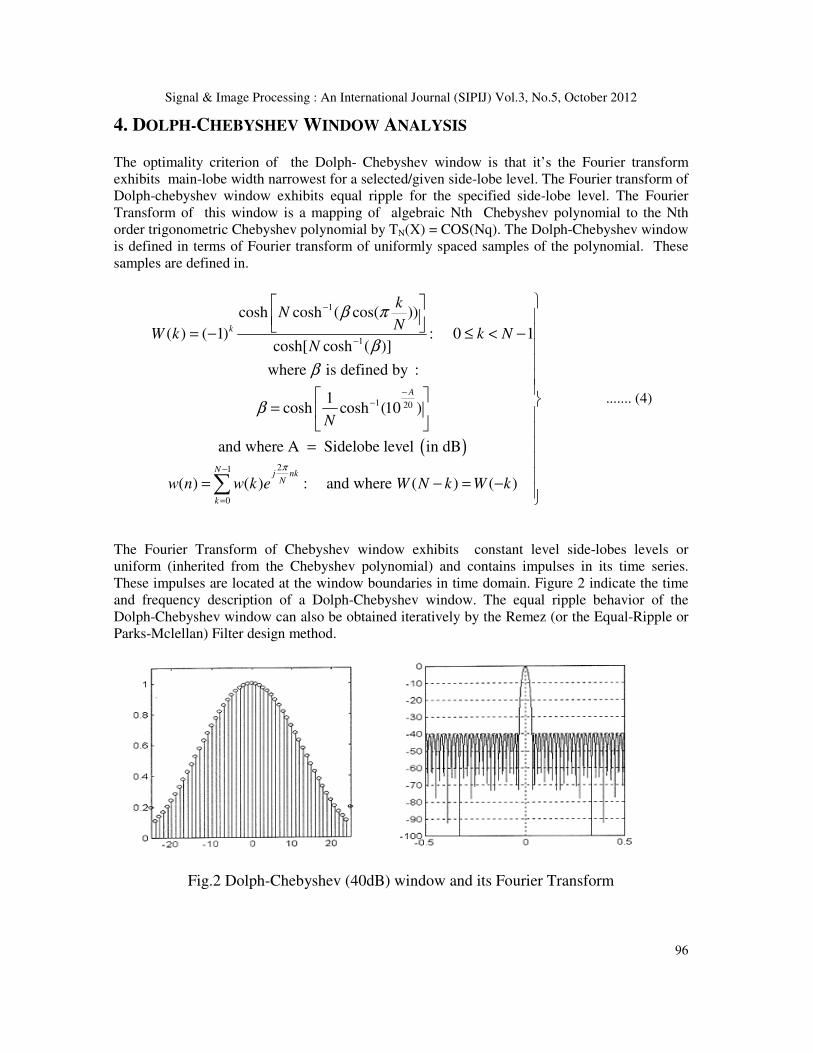
The Fourier Transform of Chebyshev window exhibits constant level side-lobes levels or
uniform (inherited from the Chebyshev polynomial) and contains impulses in its time series.
These impulses are located at the window boundaries in time domain. Figure 2 indicate the time
and frequency description of a Dolph-Chebyshev window. The equal ripple behavior of the
Dolph-Chebyshev window can also be obtained iteratively by the Remez (or the Equal-Ripple or
Parks-Mclellan) Filter design method.
Fig.2 Dolph-Chebyshev (40dB) window and its Fourier Transform
Signal & Image Processing : An International Journal (SIPIJ) Vol.3, No.5, October 2012
97
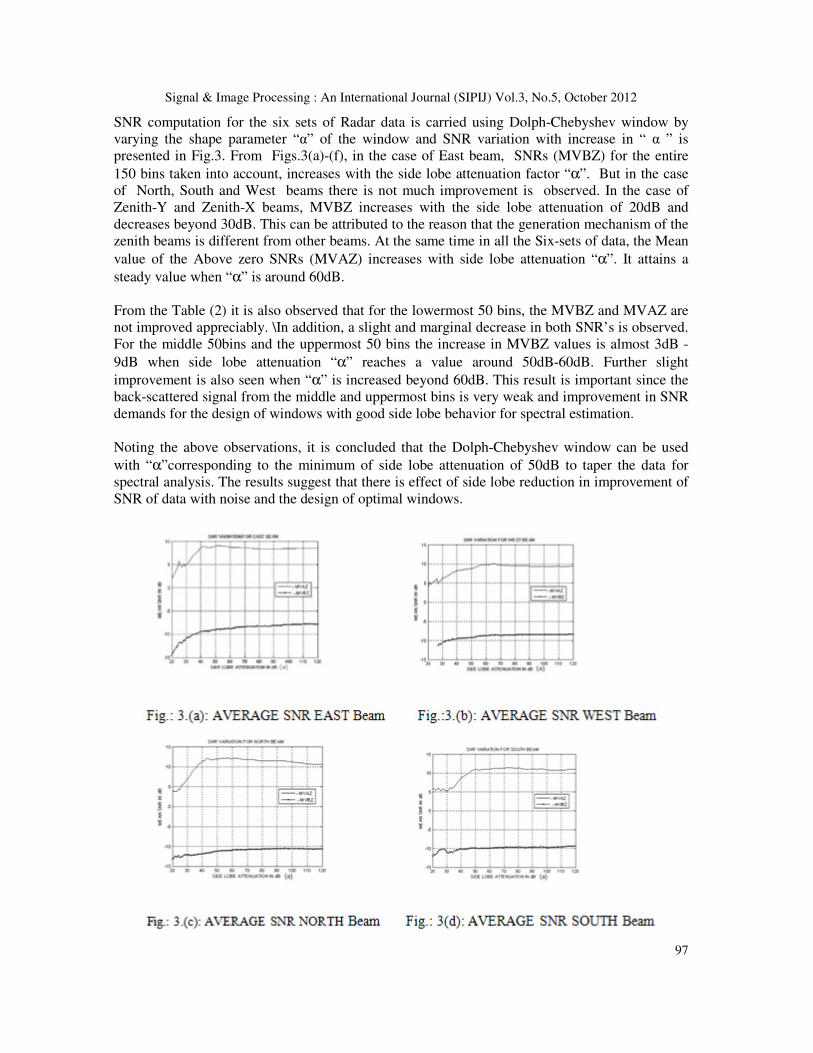
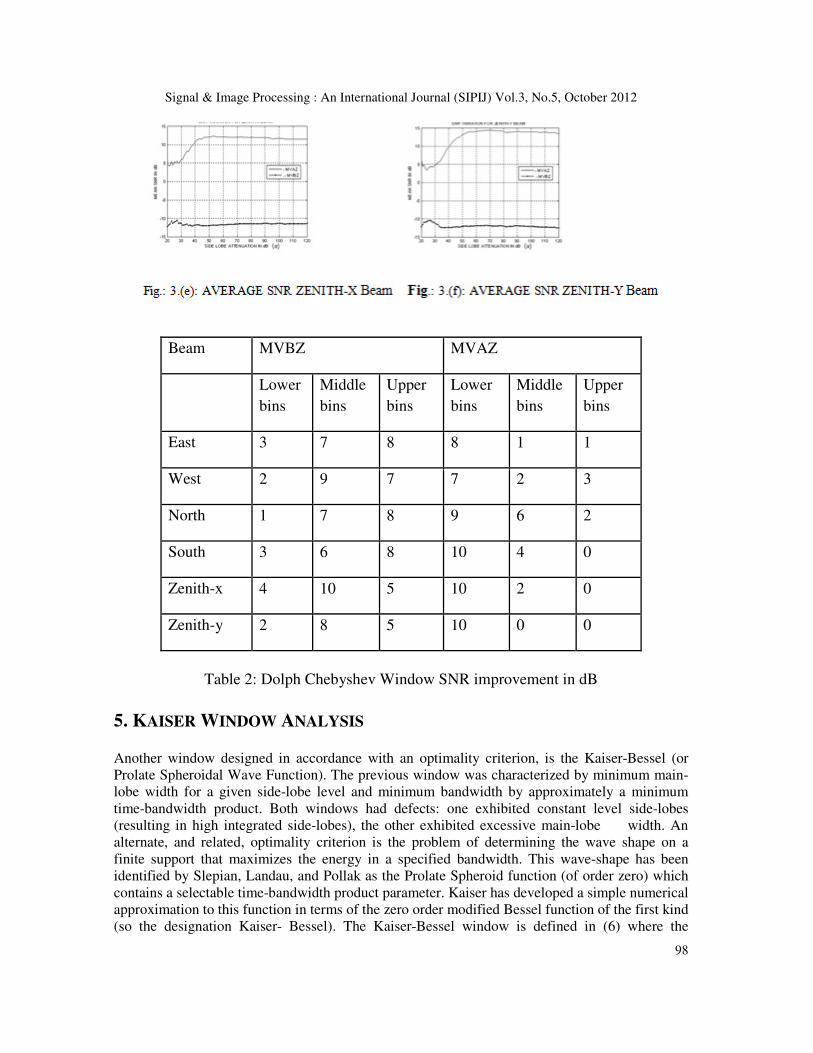
SNR computation for the six sets of Radar data is carried using Dolph-Chebyshev window by
varying the shape parameter “α” of the window and SNR variation with increase in “ α ” is
presented in Fig.3. From Figs.3(a)-(f), in the case of East beam, SNRs (MVBZ) for the entire
150 bins taken into account, increases with the side lobe attenuation factor “α”. But in the case
of North, South and West beams there is not much improvement is observed. In the case of
Zenith-Y and Zenith-X beams, MVBZ increases with the side lobe attenuation of 20dB and
decreases beyond 30dB. This can be attributed to the reason that the generation mechanism of the
zenith beams is different from other beams. At the same time in all the Six-sets of data, the Mean
value of the Above zero SNRs (MVAZ) increases with side lobe attenuation “α”. It attains a
steady value when “α” is around 60dB.
From the Table (2) it is also observed that for the lowermost 50 bins, the MVBZ and MVAZ are
not improved appreciably. \In addition, a slight and marginal decrease in both SNR’s is observed.
For the middle 50bins and the uppermost 50 bins the increase in MVBZ values is almost 3dB -
9dB when side lobe attenuation “α” reaches a value around 50dB-60dB. Further slight
improvement is also seen when “α” is increased beyond 60dB. This result is important since the
back-scattered signal from the middle and uppermost bins is very weak and improvement in SNR
demands for the design of windows with good side lobe behavior for spectral estimation.
Noting the above observations, it is concluded that the Dolph-Chebyshev window can be used
with “α”corresponding to the minimum of side lobe attenuation of 50dB to taper the data for
spectral analysis. The results suggest that there is effect of side lobe reduction in improvement of
SNR of data with noise and the design of optimal windows.
Signal & Image Processing : An International Journal (SIPIJ) Vol.3, No.5, October 2012
98
Beam MVBZ MVAZ
Lower
bins
Middle
bins
Upper
bins
Lower
bins
Middle
bins
Upper
bins
East 3 7 8 8 1 1
West 2 9 7 7 2 3
North 1 7 8 9 6 2
South 3 6 8 10 4 0
Zenith-x 4 10 5 10 2 0
Zenith-y 2 8 5 10 0 0
Table 2: Dolph Chebyshev Window SNR improvement in dB
5. KAISER WINDOW ANALYSIS
Another window designed in accordance with an optimality criterion, is the Kaiser-Bessel (or
Prolate Spheroidal Wave Function). The previous window was characterized by minimum main-
lobe width for a given side-lobe level and minimum bandwidth by approximately a minimum
time-bandwidth product. Both windows had defects: one exhibited constant level side-lobes
(resulting in high integrated side-lobes), the other exhibited excessive main-lobe width. An
alternate, and related, optimality criterion is the problem of determining the wave shape on a
finite support that maximizes the energy in a specified bandwidth. This wave-shape has been
identified by Slepian, Landau, and Pollak as the Prolate Spheroid function (of order zero) which
contains a selectable time-bandwidth product parameter. Kaiser has developed a simple numerical
approximation to this function in terms of the zero order modified Bessel function of the first kind
(so the designation Kaiser- Bessel). The Kaiser-Bessel window is defined in (6) where the
Signal & Image Processing : An International Journal (SIPIJ) Vol.3, No.5, October 2012
99
parameter α is the window's half time-bandwidth product. The series for the Bessel function
converges quite rapidly due to the k! in the denominator.
The transform of the Kaiser-Bessel window is (within very low level aliasing terms) the function
shown in (7), We see that this function tends to sin( )
( )
x
x when the spectral argument is evaluated
beyond the time-bandwidth related main-lobe bandwidth.
It must be noted that the Kaiser window can also be approximated by samples of the main-lobe of
its spectra since the window is self-replicating under the tune-limiting and band-limiting
operations.
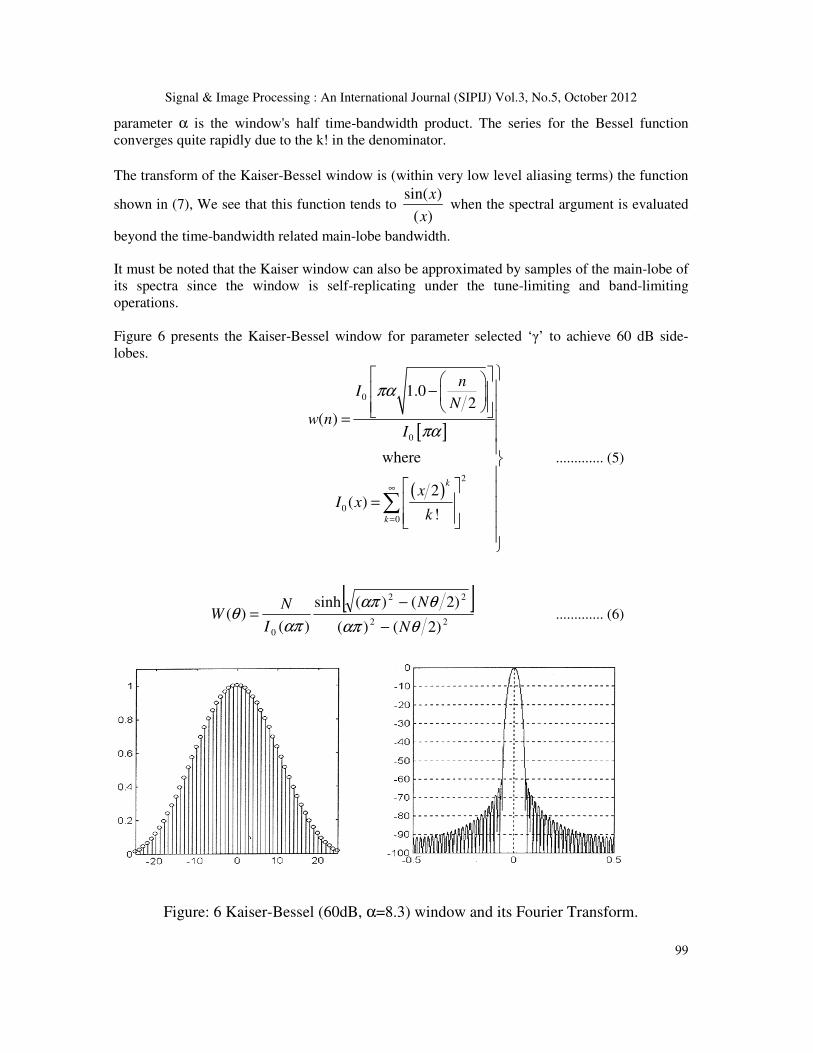
Figure 6 presents the Kaiser-Bessel window for parameter selected ‘γ’ to achieve 60 dB side-
lobes.
[ ]
( )
0
0
2
0
0
1.02
( )
where
2( )
!
k
k
nI
Nw n
I
xI x
k
πα
πα
∞
=
− =
=
∑
............. (5)
[ ]22
22
0 )2()(
)2()(sinh
)()(
θαπ
θαπ
απθ
N
N
I
NW
−
−= ............. (6)
Figure: 6 Kaiser-Bessel (60dB, α=8.3) window and its Fourier Transform.
Signal & Image Processing : An International Journal (SIPIJ) Vol.3, No.5, October 2012
100
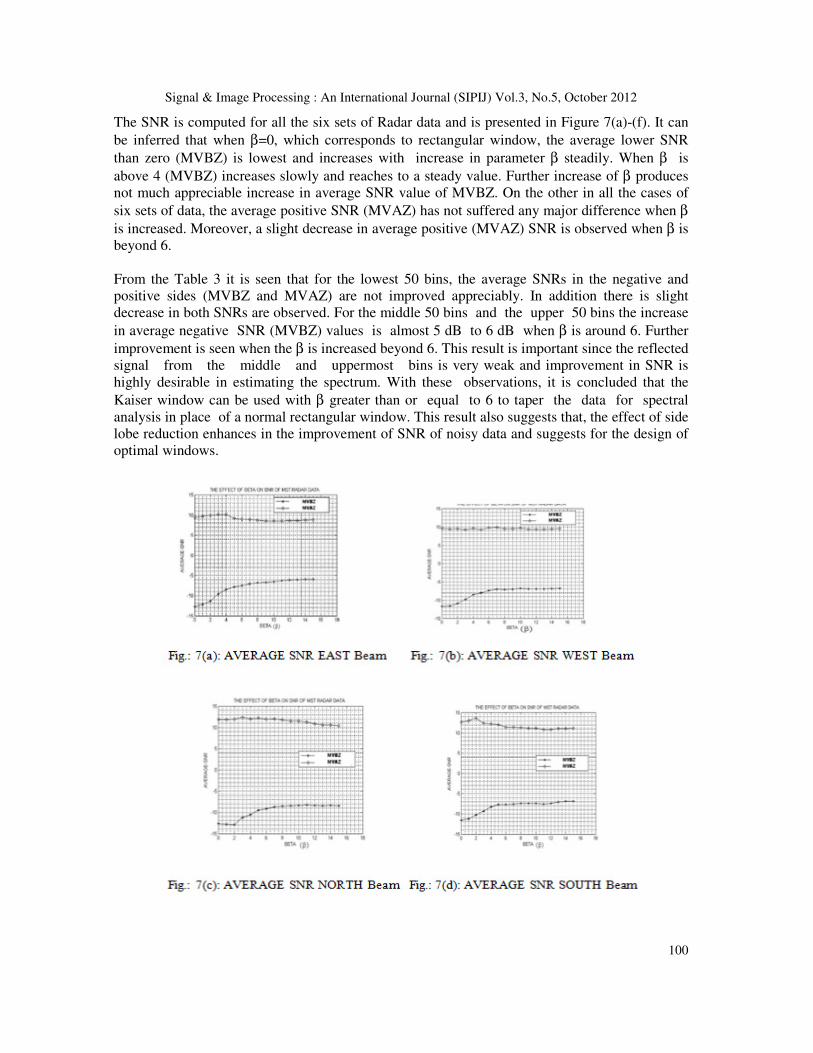
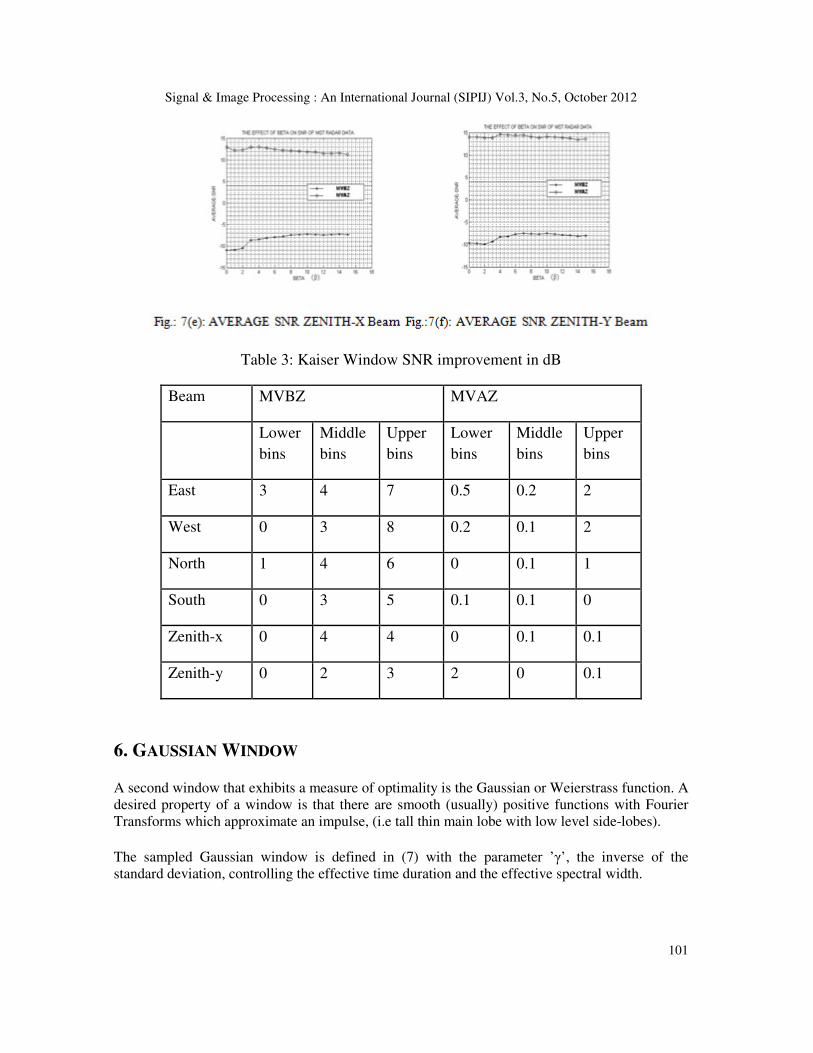
The SNR is computed for all the six sets of Radar data and is presented in Figure 7(a)-(f). It can
be inferred that when β=0, which corresponds to rectangular window, the average lower SNR
than zero (MVBZ) is lowest and increases with increase in parameter β steadily. When β is
above 4 (MVBZ) increases slowly and reaches to a steady value. Further increase of β produces
not much appreciable increase in average SNR value of MVBZ. On the other in all the cases of
six sets of data, the average positive SNR (MVAZ) has not suffered any major difference when β
is increased. Moreover, a slight decrease in average positive (MVAZ) SNR is observed when β is
beyond 6.
From the Table 3 it is seen that for the lowest 50 bins, the average SNRs in the negative and
positive sides (MVBZ and MVAZ) are not improved appreciably. In addition there is slight
decrease in both SNRs are observed. For the middle 50 bins and the upper 50 bins the increase
in average negative SNR (MVBZ) values is almost 5 dB to 6 dB when β is around 6. Further
improvement is seen when the β is increased beyond 6. This result is important since the reflected
signal from the middle and uppermost bins is very weak and improvement in SNR is
highly desirable in estimating the spectrum. With these observations, it is concluded that the
Kaiser window can be used with β greater than or equal to 6 to taper the data for spectral
analysis in place of a normal rectangular window. This result also suggests that, the effect of side
lobe reduction enhances in the improvement of SNR of noisy data and suggests for the design of
optimal windows.
Signal & Image Processing : An International Journal (SIPIJ) Vol.3, No.5, October 2012
101
Table 3: Kaiser Window SNR improvement in dB
Beam MVBZ MVAZ
Lower
bins
Middle
bins
Upper
bins
Lower
bins
Middle
bins
Upper
bins
East 3 4 7 0.5 0.2 2
West 0 3 8 0.2 0.1 2
North 1 4 6 0 0.1 1
South 0 3 5 0.1 0.1 0
Zenith-x 0 4 4 0 0.1 0.1
Zenith-y 0 2 3 2 0 0.1
6. GAUSSIAN WINDOW
A second window that exhibits a measure of optimality is the Gaussian or Weierstrass function. A
desired property of a window is that there are smooth (usually) positive functions with Fourier
Transforms which approximate an impulse, (i.e tall thin main lobe with low level side-lobes).
The sampled Gaussian window is defined in (7) with the parameter ’γ’, the inverse of the
standard deviation, controlling the effective time duration and the effective spectral width.
Signal & Image Processing : An International Journal (SIPIJ) Vol.3, No.5, October 2012
102
2
1( ) exp
2 2
nw n
Nγ
= −
............. (7)
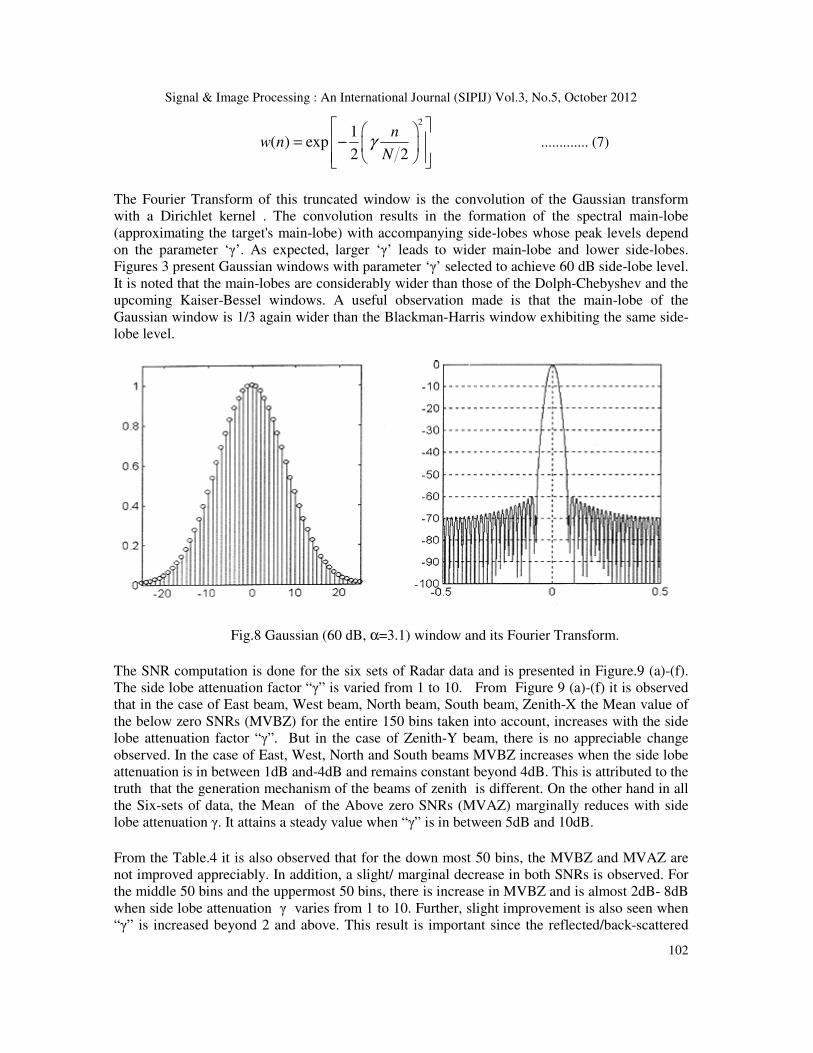
The Fourier Transform of this truncated window is the convolution of the Gaussian transform
with a Dirichlet kernel . The convolution results in the formation of the spectral main-lobe
(approximating the target's main-lobe) with accompanying side-lobes whose peak levels depend
on the parameter ‘γ’. As expected, larger ‘γ’ leads to wider main-lobe and lower side-lobes.
Figures 3 present Gaussian windows with parameter ‘γ’ selected to achieve 60 dB side-lobe level.
It is noted that the main-lobes are considerably wider than those of the Dolph-Chebyshev and the
upcoming Kaiser-Bessel windows. A useful observation made is that the main-lobe of the
Gaussian window is 1/3 again wider than the Blackman-Harris window exhibiting the same side-
lobe level.
Fig.8 Gaussian (60 dB, α=3.1) window and its Fourier Transform.
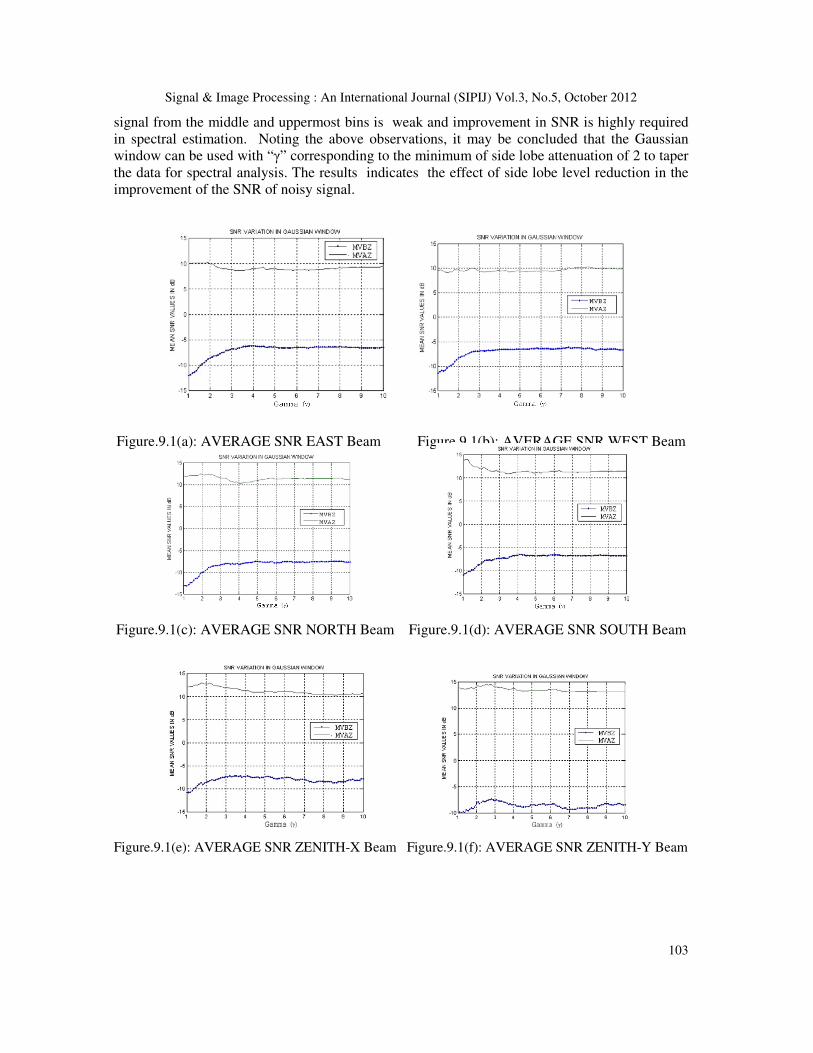
The SNR computation is done for the six sets of Radar data and is presented in Figure.9 (a)-(f).
The side lobe attenuation factor “γ” is varied from 1 to 10. From Figure 9 (a)-(f) it is observed
that in the case of East beam, West beam, North beam, South beam, Zenith-X the Mean value of
the below zero SNRs (MVBZ) for the entire 150 bins taken into account, increases with the side
lobe attenuation factor “γ”. But in the case of Zenith-Y beam, there is no appreciable change
observed. In the case of East, West, North and South beams MVBZ increases when the side lobe
attenuation is in between 1dB and-4dB and remains constant beyond 4dB. This is attributed to the
truth that the generation mechanism of the beams of zenith is different. On the other hand in all
the Six-sets of data, the Mean of the Above zero SNRs (MVAZ) marginally reduces with side
lobe attenuation γ. It attains a steady value when “γ” is in between 5dB and 10dB.
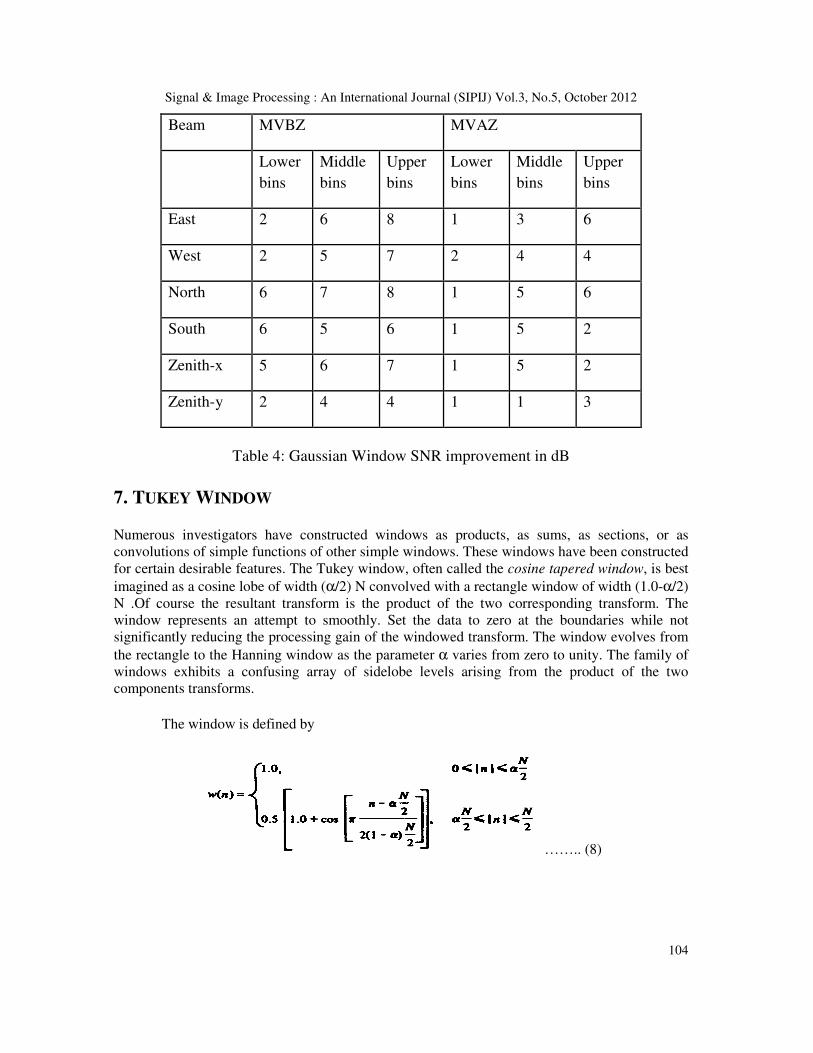
From the Table.4 it is also observed that for the down most 50 bins, the MVBZ and MVAZ are
not improved appreciably. In addition, a slight/ marginal decrease in both SNRs is observed. For
the middle 50 bins and the uppermost 50 bins, there is increase in MVBZ and is almost 2dB- 8dB
when side lobe attenuation γ varies from 1 to 10. Further, slight improvement is also seen when
“γ” is increased beyond 2 and above. This result is important since the reflected/back-scattered
Signal & Image Processing : An International Journal (SIPIJ) Vol.3, No.5, October 2012
103
signal from the middle and uppermost bins is weak and improvement in SNR is highly required
in spectral estimation. Noting the above observations, it may be concluded that the Gaussian
window can be used with “γ” corresponding to the minimum of side lobe attenuation of 2 to taper
the data for spectral analysis. The results indicates the effect of side lobe level reduction in the
improvement of the SNR of noisy signal.
Figure.9.1(a): AVERAGE SNR EAST Beam Figure.9.1(b): AVERAGE SNR WEST Beam
Figure.9.1(c): AVERAGE SNR NORTH Beam Figure.9.1(d): AVERAGE SNR SOUTH Beam
Figure.9.1(e): AVERAGE SNR ZENITH-X Beam Figure.9.1(f): AVERAGE SNR ZENITH-Y Beam
Signal & Image Processing : An International Journal (SIPIJ) Vol.3, No.5, October 2012
104
Beam MVBZ MVAZ
Lower
bins
Middle
bins
Upper
bins
Lower
bins
Middle
bins
Upper
bins
East 2 6 8 1 3 6
West 2 5 7 2 4 4
North 6 7 8 1 5 6
South 6 5 6 1 5 2
Zenith-x 5 6 7 1 5 2
Zenith-y 2 4 4 1 1 3
Table 4: Gaussian Window SNR improvement in dB
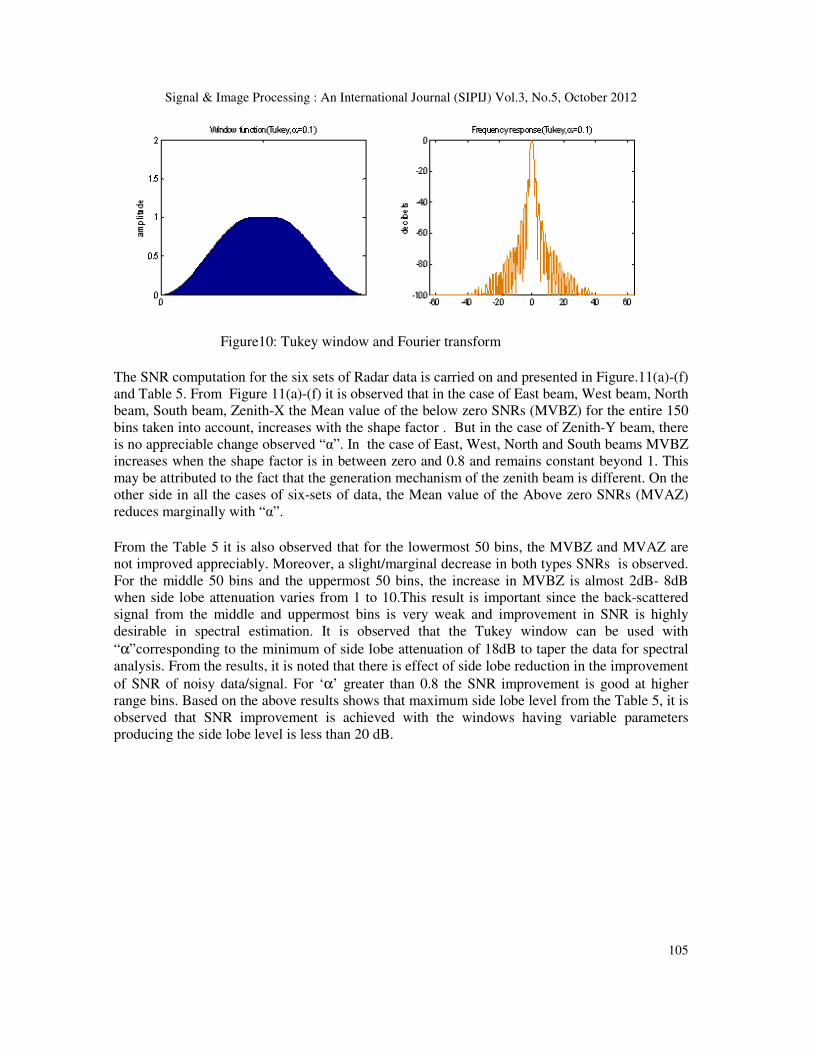
7. TUKEY WINDOW
Numerous investigators have constructed windows as products, as sums, as sections, or as
convolutions of simple functions of other simple windows. These windows have been constructed
for certain desirable features. The Tukey window, often called the cosine tapered window, is best
imagined as a cosine lobe of width (α/2) N convolved with a rectangle window of width (1.0-α/2)
N .Of course the resultant transform is the product of the two corresponding transform. The
window represents an attempt to smoothly. Set the data to zero at the boundaries while not
significantly reducing the processing gain of the windowed transform. The window evolves from
the rectangle to the Hanning window as the parameter α varies from zero to unity. The family of
windows exhibits a confusing array of sidelobe levels arising from the product of the two
components transforms.
The window is defined by
…….. (8)
Signal & Image Processing : An International Journal (SIPIJ) Vol.3, No.5, October 2012
105
Figure10: Tukey window and Fourier transform
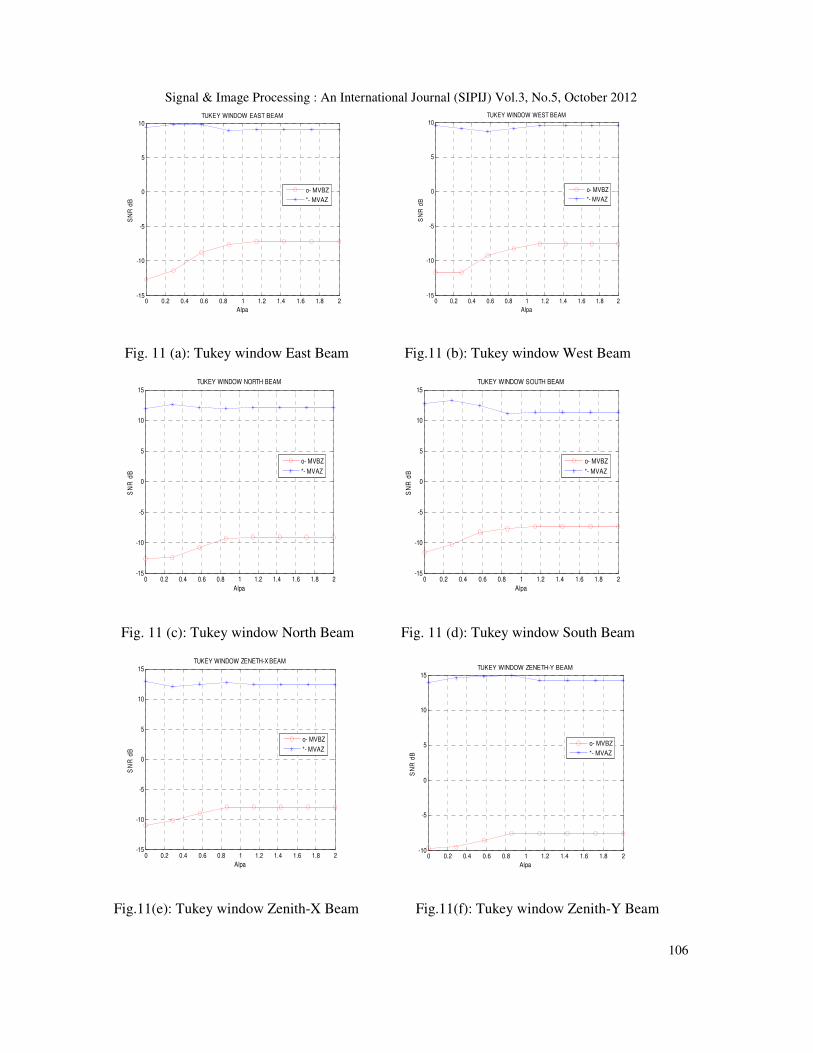
The SNR computation for the six sets of Radar data is carried on and presented in Figure.11(a)-(f)
and Table 5. From Figure 11(a)-(f) it is observed that in the case of East beam, West beam, North
beam, South beam, Zenith-X the Mean value of the below zero SNRs (MVBZ) for the entire 150
bins taken into account, increases with the shape factor . But in the case of Zenith-Y beam, there
is no appreciable change observed “α”. In the case of East, West, North and South beams MVBZ
increases when the shape factor is in between zero and 0.8 and remains constant beyond 1. This
may be attributed to the fact that the generation mechanism of the zenith beam is different. On the
other side in all the cases of six-sets of data, the Mean value of the Above zero SNRs (MVAZ)
reduces marginally with “α”.
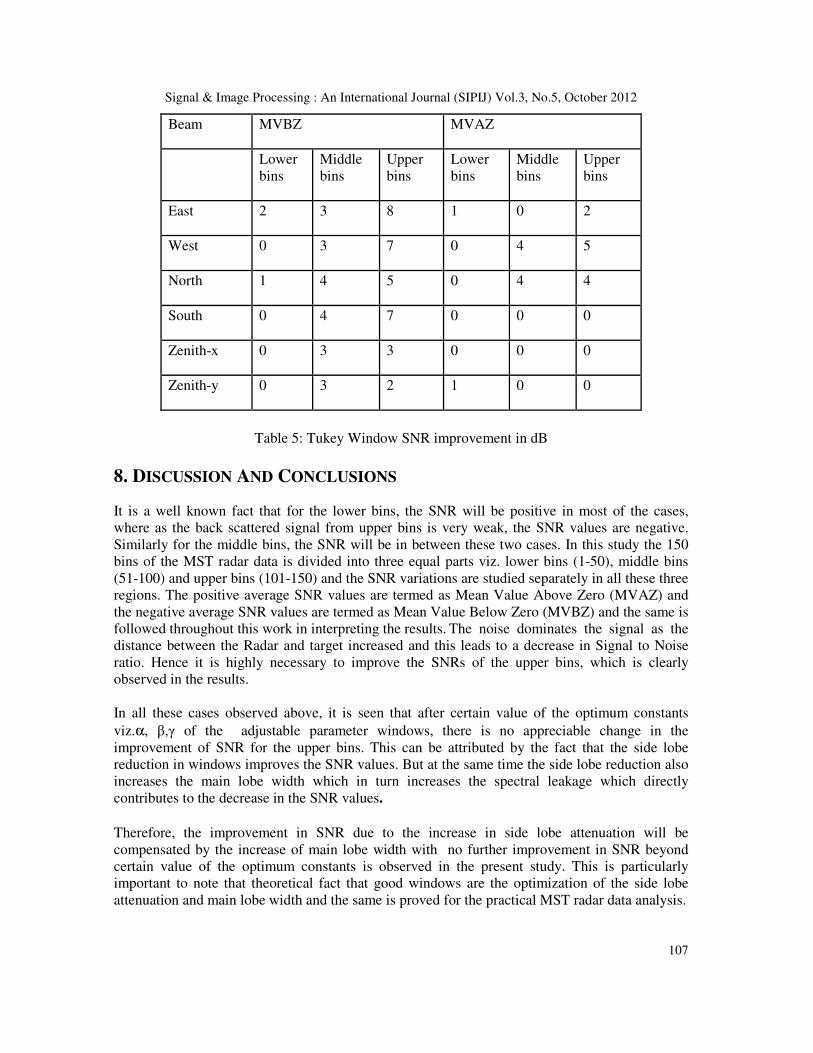
From the Table 5 it is also observed that for the lowermost 50 bins, the MVBZ and MVAZ are
not improved appreciably. Moreover, a slight/marginal decrease in both types SNRs is observed.
For the middle 50 bins and the uppermost 50 bins, the increase in MVBZ is almost 2dB- 8dB
when side lobe attenuation varies from 1 to 10.This result is important since the back-scattered
signal from the middle and uppermost bins is very weak and improvement in SNR is highly
desirable in spectral estimation. It is observed that the Tukey window can be used with
“α”corresponding to the minimum of side lobe attenuation of 18dB to taper the data for spectral
analysis. From the results, it is noted that there is effect of side lobe reduction in the improvement
of SNR of noisy data/signal. For ‘α’ greater than 0.8 the SNR improvement is good at higher
range bins. Based on the above results shows that maximum side lobe level from the Table 5, it is
observed that SNR improvement is achieved with the windows having variable parameters
producing the side lobe level is less than 20 dB.
Signal & Image Processing : An International Journal (SIPIJ) Vol.3, No.5, October 2012
106
0 0.2 0.4 0.6 0.8 1 1.2 1.4 1.6 1.8 2-15
-10
-5
0
5
10
Alpa
SN
R d
B
TUKEY WINDOW EAST BEAM
o- MVBZ
*- MVAZ
0 0.2 0.4 0.6 0.8 1 1.2 1.4 1.6 1.8 2-15
-10
-5
0
5
10
Alpa
SN
R d
B
TUKEY WINDOW WEST BEAM
o- MVBZ
*- MVAZ
Fig. 11 (a): Tukey window East Beam Fig.11 (b): Tukey window West Beam
0 0.2 0.4 0.6 0.8 1 1.2 1.4 1.6 1.8 2-15
-10
-5
0
5
10
15
Alpa
SN
R d
B
TUKEY WINDOW NORTH BEAM
o- MVBZ
*- MVAZ
0 0.2 0.4 0.6 0.8 1 1.2 1.4 1.6 1.8 2-15
-10
-5
0
5
10
15
Alpa
SN
R d
B
TUKEY WINDOW SOUTH BEAM
o- MVBZ
*- MVAZ
Fig. 11 (c): Tukey window North Beam Fig. 11 (d): Tukey window South Beam
0 0.2 0.4 0.6 0.8 1 1.2 1.4 1.6 1.8 2-15
-10
-5
0
5
10
15
Alpa
SN
R d
B
TUKEY WINDOW ZENETH-X BEAM
o- MVBZ
*- MVAZ
0 0.2 0.4 0.6 0.8 1 1.2 1.4 1.6 1.8 2-10
-5
0
5
10
15
Alpa
SN
R d
B
TUKEY WINDOW ZENETH-Y BEAM
o- MVBZ
*- MVAZ
Fig.11(e): Tukey window Zenith-X Beam Fig.11(f): Tukey window Zenith-Y Beam
Signal & Image Processing : An International Journal (SIPIJ) Vol.3, No.5, October 2012
107
Beam MVBZ MVAZ
Lower
bins
Middle
bins
Upper
bins
Lower
bins
Middle
bins
Upper
bins
East 2 3 8 1 0 2
West 0 3 7 0 4 5
North 1 4 5 0 4 4
South 0 4 7 0 0 0
Zenith-x 0 3 3 0 0 0
Zenith-y 0 3 2 1 0 0
Table 5: Tukey Window SNR improvement in dB
8. DISCUSSION AND CONCLUSIONS
It is a well known fact that for the lower bins, the SNR will be positive in most of the cases,
where as the back scattered signal from upper bins is very weak, the SNR values are negative.
Similarly for the middle bins, the SNR will be in between these two cases. In this study the 150
bins of the MST radar data is divided into three equal parts viz. lower bins (1-50), middle bins
(51-100) and upper bins (101-150) and the SNR variations are studied separately in all these three
regions. The positive average SNR values are termed as Mean Value Above Zero (MVAZ) and
the negative average SNR values are termed as Mean Value Below Zero (MVBZ) and the same is
followed throughout this work in interpreting the results. The noise dominates the signal as the
distance between the Radar and target increased and this leads to a decrease in Signal to Noise
ratio. Hence it is highly necessary to improve the SNRs of the upper bins, which is clearly
observed in the results.
In all these cases observed above, it is seen that after certain value of the optimum constants
viz.α, β,γ of the adjustable parameter windows, there is no appreciable change in the
improvement of SNR for the upper bins. This can be attributed by the fact that the side lobe
reduction in windows improves the SNR values. But at the same time the side lobe reduction also
increases the main lobe width which in turn increases the spectral leakage which directly
contributes to the decrease in the SNR values.
Therefore, the improvement in SNR due to the increase in side lobe attenuation will be
compensated by the increase of main lobe width with no further improvement in SNR beyond
certain value of the optimum constants is observed in the present study. This is particularly
important to note that theoretical fact that good windows are the optimization of the side lobe
attenuation and main lobe width and the same is proved for the practical MST radar data analysis.
Signal & Image Processing : An International Journal (SIPIJ) Vol.3, No.5, October 2012
108
REFERENCES
[1] Marple. S.L., Jr., Digital Spectral Analysis & with Applications, Prentice-Hall, Inc., Englewood
Cliffs, NJ,1987.
[2] S.M.Kay., Modern Spectral Estimation, Prentice-Hall, Inc., Englewood Cliffs, NJ, 1988.
[3] Harris. F.J., on the use of windows for harmonic analysis with the discrete Fourier transform, Proc.
IEEE, 66, pp.51-83 1978.
[4] T. Saram¨ki, “Finite impulse response filter design,” in Handbook for Digital Signal Processing, S. K.
Mitra and J. F. Kaiser,Eds., Wiley, New York, NY, USA, 1993.
[5] Nuttall. H Albert . "Some Windows with Very Good Side lobe Behavior" IEEE Transactions on
Acoustics, Speech, and Signal Processing. Vol. ASSP-29 (February 1981). pp. 84-91.
[6] Alan V. Oppenheim and Ronald W.Schafer,” Descrite Time Signal Processing” Prentice Hall
International. Inc (1998).
[7] G.H Reddy et al “The Effect of b in Kaiser Window on The SNR of MST Radar Signals”,
Proceedings of the National conference on MST Radar and Signal Processing, S.V University,
Tirupati, July-2006, pp.24-25.
[8] P. Lynch, “The Dolph-Chebyshev window, a simple optimal filter,” Monthly Weather Review,
vol.125, 1997, pp. 655-660.
[9] Stuart. W. A. Bergen and Andreas Antoniou, “Design of Ultraspherical Window Functions with
Prescribed Spectral Characteristics”, EURASIP Journal on Applied Signal Processing 13, 2004,
pp.2053-2065.
[10] Hilderbrand P.H. and R.S.Sekhon, Objective determination of the noise level in Doppler
spectra,J.appl.meterol.13, 1974, 808-811.
[11] Ward. H. R. "Properties of Dolph-Chebyshev Weighting Functions", IEEE Trans. Aerospace and
Elec. Syst., Vol. AES-9, No. 5, Sept.1973, pp. 785-786.
[12] Vaseghi Saed , Advanced Digital Signal Processing and Noise Reduction, John Wiley Sons Ltd,
2000.
[13] S. L. Marple, Jr., “Digital Spectral Analysis with Applications”, Englewood Clis,NJ: Prentice-Hall,
1987.
[14] Erman OZDEMIR, ” Super-resolution spectral estimation methods for buried and through-the-wall
object detection , M.S thesis., Electrical and Electronics Engineering, Middle East Technical
University, 2005
[15] Anandan .V.K, ”Signal and Data processing techniques for Atmospheric Radar ”,Ph.D Thesis,2003,
S.V University Tirupathi-517502,India.
[16] Anandan .V.K,” Atmospheric Data processor –Technical user Reference manual”, NMRF
Publications,2007, Tirupathi-517502, India.
[17] P.Jagadamba and P.Satyanarayana,“The effect of window parameter (α ) in Dolph-chebyshev window
on the processing of atmospheric signals “, International Journal of Engineering research and
Applications(IJERA),ISSN:2248-9622,Vol.1,Issue 2,July- August 2011,pp 109-116.
[18] P.Jagadamba and P.Satyanarayana, “ The effect of Tukey window in improving the signal-to-noise
Ratio (SNR) of atmospheric signals”, International Journal of Electronics, Electrical and
Communication Engineering , ISSN:0975-4814,Vol.3,No.2,July- December, 2011, pp 155-161.
[19] P.Jagadamba and P.Satyanarayana, “The effect of window parameter (γ ) in Gaussian window on the
processing of atmospheric signals”, Journal of innovation in Electronics & Communication:
Special issue on Signal processing and Communication techniques,ISSN:2249- 9946, Vol.2,Issue 2,
Jan. 2012, pp 101-103.
[20] P.Jagadamba and P.Satyanarayana, “ The effect of window parameter in Kaiser and Gaussian
Windows on the processing of atmospheric signals ”, Journal of innovation in Electronics &
Communication ,ISSN:2249:9946,Vol.2,Issue 2, July-Dec.2012,pp 52-57.1185-1195 ,.
[21] K.Nagi Reddy, Dr.S.Narayana Reddy, Dr.ASR Reddy “ Significance of Complex group
delayfunctions in Spectrum Estimation”. pp: 114-133, Signal &Image Processing; An International
Journal(SIPIJ) Vol.2,No.1,March 2011
Signal & Image Processing : An International Journal (SIPIJ) Vol.3, No.5, October 2012
109
[22] K.Nagi Reddy, Dr.S.Narayana Reddy and Dr ASR Reddy “Parametric Methods of Spectral
Estimation of MST Radar Data”, IUP Journal of Telecommunications, Vol. II, No. 3, pp. 55-74,
August 2010.
AUTHORS
P. Jagdamba did her B. Tech and M. Tech from S.V. University, Tirupati. Presently
working for Ph. D in S.V. University. She has 10 years of teaching experience. She
published 11 research papers in National and International Journals. Her present interest
includes RADAR systems and signal processing.
Prof. P. Sathyanarayana did his B.E, M. Tech and Ph. D from S.V. University, Tirupati. He
has more than 30 years of Teaching and Research experience. He guided 3 Ph. D and 30 M.
Tech Students. He is member of several committees such as NBA, UGC, AICTE etc,. His
current interests include signal processing and image processing.