Embed Size (px)
Citation preview
Original Investigations
Signal-to-Noise Ratio and Detective Quantum Efficiency Analysis of Optically Coupled
CCD Mammography Imaging Systems
Hong Liu, PhD 1, Laur ie L. Fa ja rdo , MD 1, Bill C. P e n n y PhD 2
From 1the Department of Radiology, University of Virginia Health Sciences Center, Charlottesville, VA; and 2the Department of Radiology, University of Chicago Hospitals, Chicago, IL.
Supported in part by the Whitaker Foundation (Biomedical Engineering Research Grant) and by NIH grant CA69043.
Address reprint requests to H. Liu, PhD, Depart- ment of Radiology, University of Virginia, Health Sciences Center, Charlottesville, VA 22908.
Received October 24, 1995, and accepted for publication after revision June 4, 1996.
Acad Radiol 1996;3:799-805 O1996, Association of University Radiologists
R a t i o n a l e a n d Object ives . Design considerations for x-ray systems with optically coupled charge-coupled devices require an understanding of the characteristics of cascaded multistage imaging chains. Performance evalua- tions rely on accurate analyses of signal-to-noise ratio, noise power spec- trum, and detective quantum efficiency.
Methods . Theoretic models of signal-to-noise ratio, noise power spec- trum, and detective quantum efficiency were extended to analyze the opti- cally coupled charge-coupled device and other electronic x-ray imaging sys- tems. The descriptions of h o w to measure or compute these parameters are provided.
Results . The results of our quantitative analysis illustrate that x-ray quan- tum-noise limitation can be obtained without an image intensifier by using a low additive noise charge-coupled device.
Conc lu s io n . This theoretic model and experimental method provide a useful tool for developing optoelectronic x-ray imaging systems for digital mammography and other radiologic procedures.
Key Words . Charge-coupled device detector; digital mammography; sig- nal-to-noise ratio; noise power spectrum; detective quantum efficiency; quantum efficiency.
T he optically coupled charge-coupled device (CCD) and its applications for digital mammography and for other radiologic procedures have
been investigated [1,2], and the principles and unique features of some labo- ratory systems have been reported [3,4]. Although measurements of the modulation transfer function (MTF) and contrast transfer function have been performed [1,2,5], x-ray quantum efficiency and corresponding imaging char- acteristics such as signal-to-noise ratio (SNR), noise power spectrum (NPS), and detective quantum efficiency (DQE) have not been investigated in detail. Because these parameters are crucial to design considerations and perfor- mance evaluations such as patient radiation dose, comprehensive modeling of SNR, NPS, and DQE analyses for optically coupled CCD x-ray imaging sys- tems is necessary.
799
LIU ET AL Vol. 3, No. 10, October 1996
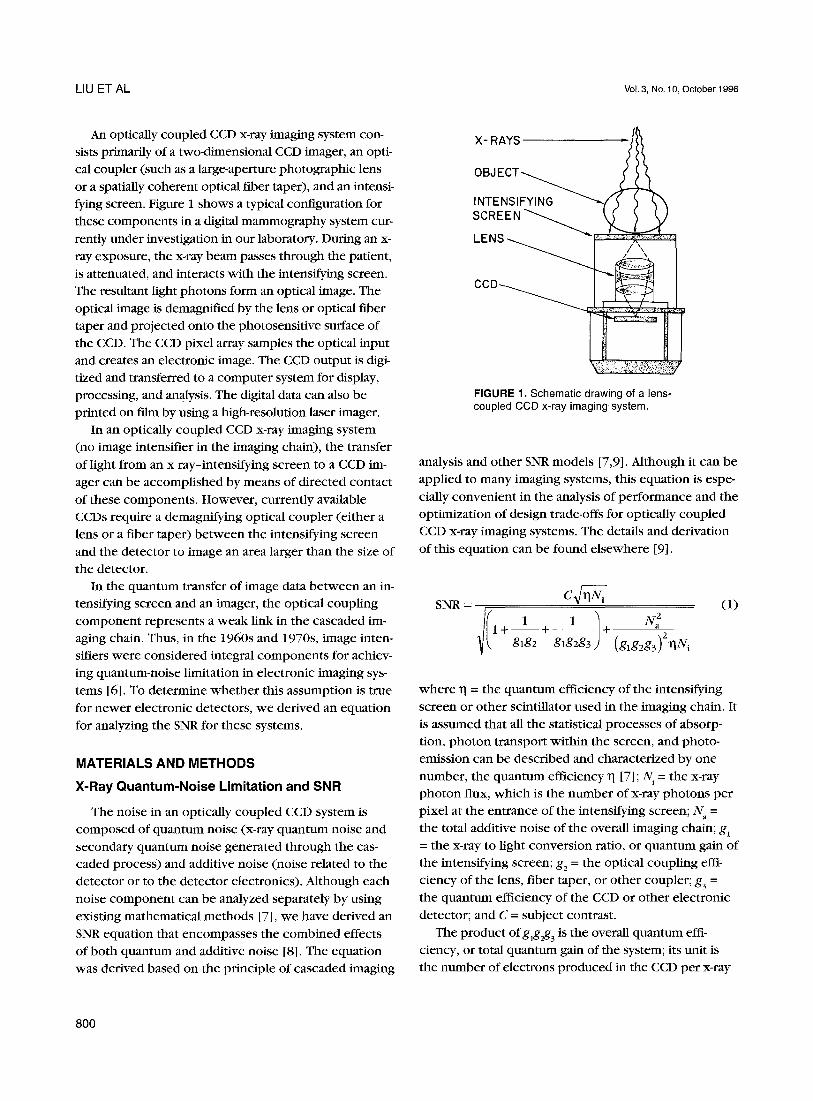
An optically coupled CCD x-ray imaging system con-
sists primarily of a two-dimensional CCD imager, an opti-
cal coupler (such as a large-aperture photographic lens
or a spatially coherent optical fiber taper), and an intensi-
fying screen. Figure 1 shows a typical configuration for
these components in a digital mammography system cur-
rently under investigation in our laboratory. During an x-
ray exposure, the x-ray beam passes through the patient,
is attenuated, and interacts with the intensifying screen. The resultant light photons form an optical image. The
optical image is demagnified by the lens or optical fiber
taper and projected onto the photosensitive surface of
the CCD. The CCD pixel array samples the optical input
and creates an electronic image. The CCD output is digi-
tized and transferred to a computer system for display,
processing, and analysis. The digital data can also be
printed on film by using a high-resolution laser imager.
In an optically coupled CCD x-ray imaging system
(no image intensifier in the imaging chain), the transfer
of light from an x ray-intensifying screen to a CCD im-
ager can be accomplished by means of directed contact
of these components. However, currently available CCDs require a demagnifying optical coupler (either a
lens or a fiber taper) between the intensifying screen
and the detector to image an area larger than the size of
the detector. In the quantum transfer of image data between an in-
tensifying screen and an imager, the optical coupling
component represents a weak link in the cascaded im- aging chain. Thus, in the 1960s and 1970s, image inten-
sifiers were considered integral components for achiev-
ing quantum-noise limitation in electronic imaging sys-
tems [6]. To determine whether this assumption is true
for newer electronic detectors, we derived an equation
for analyzing the SNR for these systems.
MATERIALS AND METHODS
X-Ray Quantum-Noise Limitation and SNR
The noise in an optically coupled CCD system is
composed of quantum noise (x-ray quantum noise and
secondary quantum noise generated through the cas- caded process) and additive noise (noise related to the
detector or to the detector electronics). Although each
noise component can be analyzed separately by using
existing mathematical methods [7], we have derived an
SNR equation that encompasses the combined effects
of both quantum and additive noise [8]. The equation
was derived based on the principle of cascaded imaging
X- RAYS
SCREEN"--...........,
LENS -~_ //'Xk
FIGURE 1. Schematic drawing of a lens- coupled CCD x-ray imaging-system.
analysis and other SNR models [7,91. Mthough it can be
applied to many imaging systems, this equation is espe-
cially convenient in the analysis of performance and the optimization of design trade-offs for optically coupled
CCD x-ray imaging systems. The details and derivation
of this equation can be found elsewhere [9].
SNR = C ~ i (1)
1 1 + - - + + 2
gig2 glg2g3 (glg2g3) qNi
where B = the quantum efficiency of the intensifying
screen or other scintillator used in the imaging chain. It
is assumed that all the statistical processes of absorp-
tion, photon transport within the screen, and photo-
emission can be described and characterized by one
number, the quantum efficiency rl [7]; N~ = the x-ray photon flux, which is the number of x-ray photons per
pixel at the entrance of the intensifying screen; N =
the total additive noise of the overall imaging chain; gl
= the x-ray to light conversion ratio, or quantum gain of
the intensifying screen; g2 = the optical coupling effi-
ciency of the lens, fiber taper, or other coupler; g3 =
the quantum efficiency of the CCD or other electronic
detector; and C = subject contrast.
The product ofglg~g 3 is the overall quantum effi-
ciency, or total quantum gain of the system; its tmit is
the number of electrons produced in the CCD per x-ray
800
Vol. 3, No. 10, October 1996 S IGNAL-TO-NOISE RATIO AND DETECTIVE Q U A N T U M EFFICIENCY ANALYSIS
photon absorbed in the scintillator (electrons per x-ray).
The quantum efficiency of a Min-R medium mammo-
graphic screen (Eastman Kodak) has been estimated at
q = 0.65 [10]. Assuming a typical mammographic
screen entrance exposure of 12 mR (3.096 C/kg) and
an average x-ray photon energy of 20 keV, the number
of x-ray photons per pixel at the entrance of the inten-
sifying screen, for a detector having a 0.048 x 0.048-
mm pixel size, is Nj = 1,600 x-ray photons per pixel.
Therefore, the number of absorbed x-ray photons per
pixel is: N~ = 1,040 x-ray photons per pixel. For this
analysis, a contrast (6) of 1 was assumed. For a system
using a cooled CCD, the total additive noise, Na. is usu-
ally less than 15 electrons; for television (TV) tubes, N
is usually larger than 500 electrons. The data for the
CCD are from the manufacturer 's data sheet (Photomet-
ric, Tucson, AZ); TV tube data were compiled from sev-
eral review papers [11-13]. The x ray-to-l ight conver-
sion ratio (gl) of a high-resolution mammography inten-
sifting screen is reported to be 400-600 in the forward
direction [14]. Conservative estimates of g 3 are: (a)
0.35 for a front-illuminated CCD; (b) 0.60 for a back-il-
luminated CCD; and (c) 0.20 for a TV tube. From our
previous work [15], we have estimated the optical cou-
pling efficiency of a lens to be:
0.75 = (2)
g2 4F2(1 + M)2 +1
where F is the F number (the ratio of the focal length
to the effective diameter) of the lens, and M is the
demagnification ratio. For instance, for an F / 0 . 8 (F =
0.8) lens working at a demagnification factor of 2, g2 =
3.1%. Equation 1 can be used to illustrate the dominant
noise component in a cascaded electronic imaging sys- tem. For instance, if the total quantum gain, g l g ~ 3 ' of
the imaging chain is small or the additive noise, N , is
large, the value of the denominator is larger than 1.
Then the SNR of the system is dominated by one of the
cascaded stages or by additive noise. When gagzg3 is
small, the additive noise, N , will affect the perfor-
mance of the system significantly. As glg2g3 becomes
large, the value of the denominator approaches 1 and
the equation reduces to SNR = C ~/qN~, representing a
perfect x-ray quantum noise-limited, additive noise-
free imaging system.
As an example of the application of equation 1, we
use parameters typical for lens-coupled TV camera sys-
terns, which were extensively investigated in the 1960s
and 1970s. Substituting glgig3 = (500)(0.031)(0.2) = 3.1
and N = 500 into equation 1 we have:
SNR --
x / ~ 2 + 2 5
I(1+. . .+ 3~) + 5002 (3.1)2(1,040)
C q ~ i C ~ = 0.2 C q~/-q--~ 5.1
(3)
This example illustrates that the lens-coupled TV sys-
tem is not x-ray quantum-noise limited and that it is the
additive noise (?Ca), not the total quantum gain (gl&g3)
that dominates the SNR~
The introduction of the image intensifier provided a
solution to the additive noise problem by boosting the
image signal and increasing quantum gain. The value
for glg~g 3 may approach 400; therefore, the SNR of an image intensifier-TV system can be expressed as:
SNR = J/ 500 1 +. . . + 400 (400)2(1,040)
c - - - 0.99 C ~x/-~i
x/1 + 0.004 1.002
(4)
The image intensifier-TV system is absolutely x-ray
quantum-noise limited, and both analog and digital im-
age intensifier-TV systems are used currently in many
clinical procedures. However, electro-optical devices
such as image intensifiers have limitations that reduce
spatial resolution and contrast sensitivity. Mammogra-
phy, which requires high spatial resolution and high
contrast sensitivity, cannot be performed with a con- ventional image intensifier,TV system. When equations
1-4 are examined more closely, it is theoretically intui-
tive that x-ray quantum-noise limitation might be achieved without an image intensifier if the additive
noise level were greatly reduced. Modern CCD recep-
tors, which have additive noise levels as low as 15 elec-
trons, are suitable detector candidates. For current CCD
devices, a typical total quantum gain can be expressed
as: glgzg3 = (500)(0.031)(0.6) = 9.3 electrons per x-ray
photon.
801
LIU ET A L Vol. 3, No. 10, October 1996
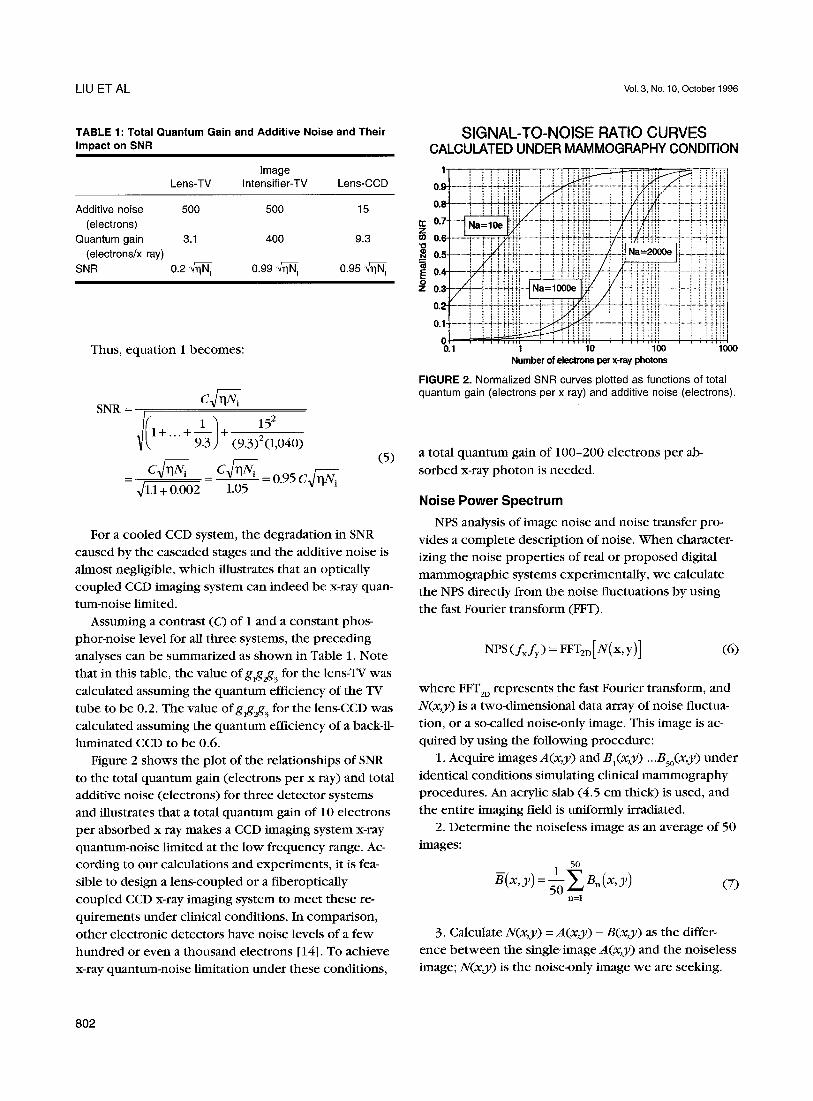
TABLE 1 : Total Quantum Gain and Additive Noise and Their Impact on SNR
Image Lens-TV Intensifier-TV Lens-CCD
Additive noise 500 500 15 (electrons)
Quantum gain 3.1 400 9.3 (electrons/x ray)
SNR 0.2 ~]rlN~ 0.99 ~ 0.95
Thus, equation 1 becomes:
SNR=
m
~Jl.1 + 0.002
c n,/~,
ill+ 152 (9.3)2(1,040)
~ n,/~, _ c n,/~-<, -0 .95c n,~, 1.05
( 5 )
For a cooled CCD system, the degradation in SNR
caused by the cascaded stages and the additive noise is
almost negligible, which illustrates that an optically
coupled CCD imaging system can indeed be x-ray quan-
tum-noise limited.
Assuming a contrast (C) of 1 and a constant phos-
phor-noise level for all three systems, the preceding
analyses can be summarized as shown in Table 1. Note
that in this table, the value ofglgzg 3 for the lens-TV was
calculated assuming the quantum efficiency of the TV
tube to be 0.2. The value ofg~g2g 3 for the lens-CCD was
calculated assuming the quantum efficiency of a back-il-
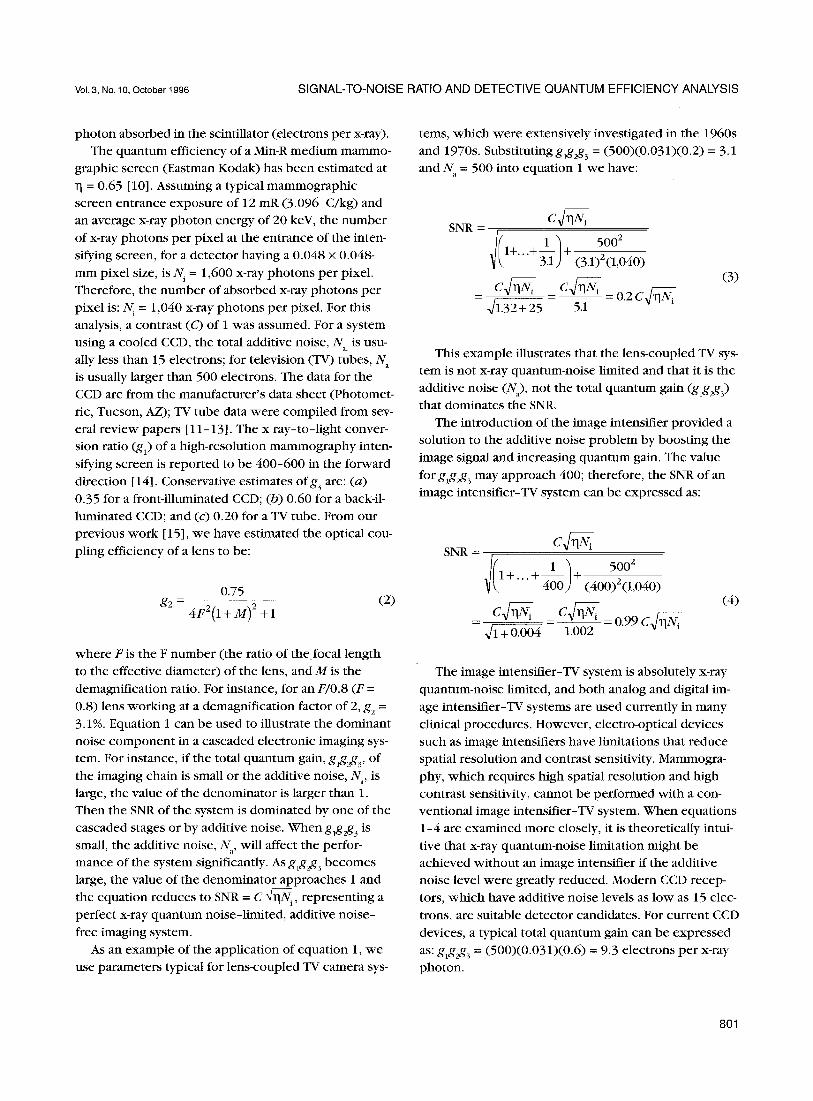
luminated CCD to be 0.6. Figure 2 shows the plot of the relationships of SNR
to the total quantum gain (electrons per x ray) and total
additive noise (electrons) for three detector systems
and illustrates that a total quantum gain of 10 electrons
per absorbed x ray makes a CCD imaging system x-ray
quantum-noise limited at the low frequency range. Ac-
cording to our calculations and experiments, it is fea-
sible to design a lens-coupled or a fiberoptically
coupled CCD x-ray imaging system to meet these re-
quirements under clinical conditions. In comparison,
other electronic detectors have noise levels of a few
hundred or even a thousand electrons [14]. To achieve
x-ray quantum-noise limitation under these conditions,
SIGNAL-TO-NOISE RATIO CURVES CALCULATED UNDER M A M M O G R A P H Y CONDITION
{i .............. i- - Tii' i i Hi i iiiiiii i - i - ' , . . . . . . . . . . . . .
0. - { - i ! i i i i ............. i - i i i i i ........... i i .......... iiii 0.4 - i - i - i 4 - i i i . . i i ............... ~ - 4 i - 4 i H H . . . . . . b - , . - i - i . . i . i i i i ........... i - i - ~ - i 4 i i - i
0. - - i - - 4 - ~ i - N i i i ............ ! - - - i i ' ¢ i i ~ . . . . . - 4 - - i - i i 4 i .............. i - i - i - 4 i N - i
O . " . . . . . . . . . . . . . . . . . . . . . .
0.1 1 10 100 1000 Number of electron9 per x-ray photons
FIGURE 2. Normalized SNR curves plotted as functions of total quantum gain (electrons per x ray) and additive noise (electrons).
a total quantum gain of 100-200 electrons per ab-
sorbed x-ray photon is needed.
Noise Power Spec t rum
NPS analysis of image noise and noise transfer pro-
vides a complete description of noise. When character-
izing the noise properties of real or proposed digital
mammographic systems experimentally, we calculate the NPS directly from the noise fluctuations by using
the fast Fourier transform (FFT).
NPS ( fxfy) = FFT2D[N(x,y)] (6)
where FFT2D represents the fast Fourier transform, and
N(x,y) is a two-dimensional data array of noise fluctua-
tion, or a so-called noise-only image. This image is ac-
quired by using the following procedure:
1. Acquire images A(x,y) and Bl(x,y) ...Bso(X,y) under
identical conditions simulating clinical mammography
procedures. An acrylic slab (4.5 cm thick) is used, and the entire imaging field is uniformly irradiated.
2. Determine the noiseless image as an average of 50
images:
50
~ ( x , y / - - ~ B . ( x , y / (7) n = l
3. Calculate N(x,y) = A(x,y) - B(x,y) as the differ-
ence between the single, image A(x,y) and the noiseless
image; N(x,y) is the noise-only image we are seeking.
802
Vol. 3, No, 10, October 1996 SIGNAL-TO-NOISE RATIO AND DETECTIVE QUANTUM EFFICIENCY ANALYSIS
4. NPS(fxfr) is a two-dimensional data array in the frequency domain. We assume the p roposed CCD imag-
ing system to be symmetric in the x and y directions;
therefore, a slice of the data, NPS(fx), is used to evalu- ate the noise propert ies of the whole image.
By repeating these procedures 20 times (n --- 20), 20
NPS(fx) curves are generated. Further, the NPS(f X) is normalized, and the normalized NPS is given by:
1 NPS(fx ) (8) 1
n p s ( f x ) = 20 NPS(0) n=l
The averaging process in equation 8 is used to re- duce statistical uncertainty.
This discussion of NPS provides a foundation for un-
derstanding the concep t of noise propagat ion in a cas- caded imaging chain and its relation to the SNR and
DQE. The measured NPS curves of various optically coupled CCD x-ray imaging systems can be found in the
literature [16,17].
Detective Quantum Efficiency DQE expresses the SNR transfer characteristics of an
imaging system as a function of the spatial f requency
[16,18,19]:
D Q E ( f ) = SNR2°ut(f) SNR~n(f) (9)
where SNRout00 is the output SNR, and SNRm(f) is the input SNR. The DQEff) provides a measure of h o w effi- ciently the imaging system transfers information in
terms of spatial frequency. To determine DQE00, we conducted the following derivation:
2 SNR2out ( f ) - Sout ( f )
NPS(f )
_ Soeut (0)MTF2(f)
NPS(O)nps(f) (10)
= SNR2out (0) MTF2 ( f ) n p s ( f )
Where Surf f ) is the output signal, it can be expressed
as the product of its zero f requency value, S t(0), and MTF(f) [20]. Similarly, the NPS0 r) can be expressed by
its normalized form, nps(f), and the normalization fac-
tor NPS(O). Assuming the input x-ray quanta obey Poisson statis-
tics and have a flat noise spect rum within the range of
the spatial f requency of practical interest, then
SNR2n ( f ) = SNR 2 (0) = N i (11)
where Nj is the incident x-ray pho ton flux (number of
x-ray photons per pixel at the entrance of the intensify-
ing screen). Thus,
D Q E ( f ) = SNR2°ut(O)MTF2(f)
SNR.2m ( O ) n p s ( f )
= DQE(O) MTF2 ( f ) (12)
n p s ( f )
where the ratio MTF2(f)/nps(f) provides a spatial fre- quency modulat ion te rm for DQE.
DQE(O) can be determined by using the following
method. We have shown that, at zero frequency, re- peating equation 1 above:
SNRout (0) = c S-<
J(i+ 1+ gig2 glgig3 (glg2g3) l"lNi (13)
and SNR1.7(O ) = C ~ i
Therefore,
DQE(0) - SNR2°ut(O) SNR.2m(0)
q
1+ 1 1 Na 2 + -~
2 gig2 glg2g3 (glg2g3) TlNi
(14)
Analyses of DQE(0) and of SNR at low frequency
provide a useful tool for evaluating design trade-offs for electronic x-ray imaging systems, such as choice of scintillator, optical coupling techniques, and electronic imagers.
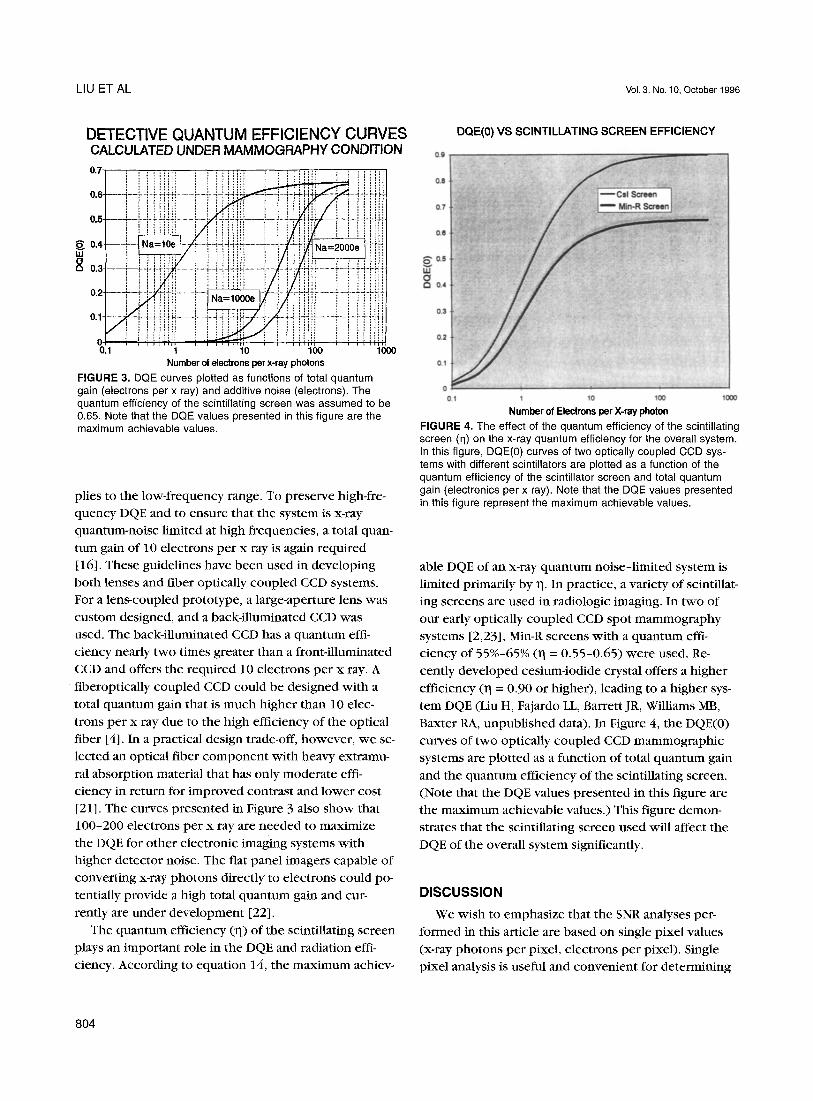
By using equation 14, the DQE(0) values for several electronic x-ray imaging systems were plot ted as a func-
tion of total quantum gain (glg2g3) and the additive noise (N a) in Figure 3. For a system with low additive
noise, such as the optically coupled CCD, a total quan-
tum gain of 10 electrons per x ray brings the DQE close to its max imum value. Increasing the total gain further will not improve the DQE significantly. This analysis ap-
803
LIU ET AL Vol. 3, No. 10, October 1996
DETECTIVE QUANTUM EFFICIENCY CURVES CALCULATED UNDER MAMMOGRAPHY CONDITION
.... i'iiii'i 0.° ...... t ....... i - i ! iH . . . . . . . . . . . . . . . . . . . . . . . . . . . . ' " - . . . . . . i . . . . . . . . . . . . . .
O.
o . , . . . . ,-ii-i." 8 o.a -- ii-lif .i-iiiiii .............. i - i4 i i i i l
°- I 0.1 1 10 100 1000
Number of electrons per x-ray photons
FIGURE 3. DQE curves plotted as functions of total quantum gain (electrons per x ray) and additive noise (electrons). The quantum efficiency of the scintillating screen was assumed to be 0.65. Note that the DOE values presented in this figure are the maximum achievable values.
plies to the low-frequency range. To preserve high-fre-
quency DQE and to ensure that the system is x-ray
quantum-noise limited at high frequencies, a total quan-
tum gain of 10 electrons per x ray is again required
[16]. These guidelines have been used in developing
both lenses and fiber optically coupled CCD systems.
For a lens-coupled prototype, a large-aperture lens was
custom designed, and a back-illuminated CCD was
used. The back-illuminated CCD has a quantum effi-
ciency nearly two times greater than a front-illuminated
CCD and offers the required 10 electrons per x ray. A
fiberoptically coupled CCD could be designed with a
total quantum gain that is much higher than 10 elec-
trons per x ray due to the high efficiency of the optical
fiber [4]. In a practical design trade-off, however, we se-
lected an optical fiber component with heavy extramu-
ral absorption material that has only moderate effi-
ciency in return for improved contrast and lower cost
[21]. The curves presented in Figure 3 also show that
100-200 electrons per x ray are needed to maximize
the DQE for other electronic imaging systems with higher detector noise. The flat panel imagers capable of
converting x-ray photons directly to electrons could po-
tentially provide a high total quantum gain and cur-
rently are under development [22].
The quantum efficiency (1]) of the scintillating screen
plays an ,npor tant role in the DQE and radiation effi-
ciency. According to equation 14, the maximum achier-
DQE(0) VS SCINTILLATING SCREEN EFFICIENCY
0.9
0.8
0.7
0.6
O~0.5
0 ~ o.4
0.3
0.2
o.1
o 0.1 1 10 100 10(]0
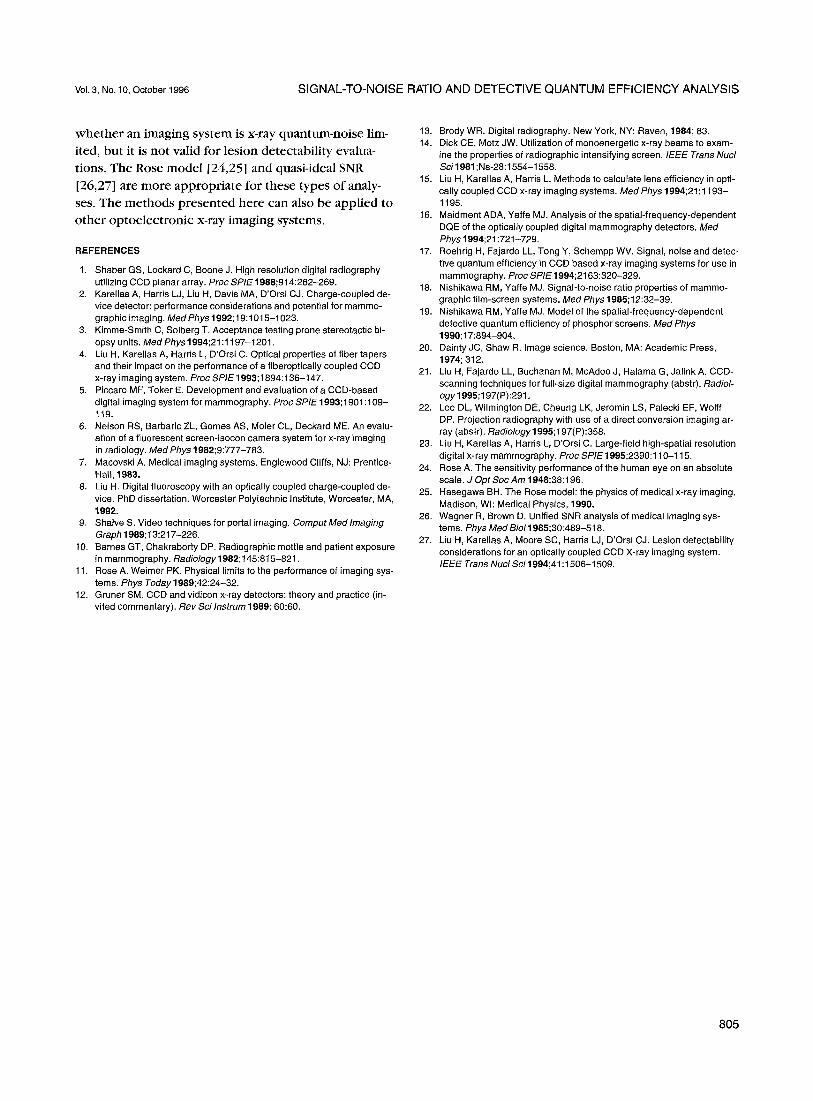
Number of Electrons per X-ray photon FIGURE 4. The effect of the quantum efficiency of the scintillating screen (q) on the x-ray quantum efficiency for the overall system. In this figure, DQE(O) curves of two optically coupled CCD sys- tems with different scintillators are plotted as a function of the quantum efficiency of the scintillator screen and total quantum gain (electronics per x ray). Note that the DQE values presented in this figure represent the maximum achievable values,
able DQE of an x-ray quantum noise-limited system is
limited primarily by 1]. In practice, a variety of scintillat-
ing screens are used in radiologic imaging. In two of
our early optically coupled CCD spot mammography
systems [2,23], Min-R screens with a quantum effi-
ciency of 55%-65% (1] = 0.55-0.65) were used. Re-
cently developed cesium-iodide crystal offers a higher
efficiency (1] = 0.90 or higher), leading to a higher sys-
tem DQE (Liu H, Fajardo LL, Barrett JR, Williams MB,
Baxter RA, unpublished data). In Figure 4, the DQE(0)
curves of two optically coupled CCD mammographic
systems are plotted as a function of total quantum gain
and the quantum efficiency of the scintillating screen.
(Note that the DQE values presented in this figure are
the maximum achievable values.) This figure demon-
strates that the scintillating screen used will affect the
DQE of the overall system significantly.
DISCUSSION
We wish to emphasize that the SNR analyses per-
formed in this article are based on single pixel values
(x-ray photons per pixel, electrons per pixel). Single
pixel analysis is useful and convenient for determining
804
Vol. 3, No. 10, October 1996 S I G N A L - T O - N O I S E RATIO A N D D E T E C T I V E Q U A N T U M E F F I C I E N C Y ANALYSIS
whether an imaging system is x-ray quantum-noise lim-
ited, but it is not valid for lesion detectability evalua-
tions. The Rose model [24,25] and quasi-ideal SNR
[26,27] are more appropriate for these types of analy-
ses. The methods presented here can also be applied to
other optoelectronic x-ray imaging systems.
REFERENCES
1. Shaber GS, Lockard C, Boone J. High resolution digital radiography utilizing CCD planar array. Proc SPIE 1988;914:262-269.
2. Karellas A, Harris L J, Liu H, Davis MA, D'Orsi CJ. Charge-coupled de- vice detector: performance considerations and potential for mammo- graphic imaging. Med Phys 1992;19:1015-1023.
3. Kimme-Smith C, Solberg T. Acceptance testing prone stereotactic bi- opsy units. Med Phys 1994;21:1197-1201.
4. Liu H, Karellas A, Harris L, D'Orsi C. Optical properties of fiber tapers and their impact on the performance of a fiberoptically coupled CCD x-ray imaging system, Proc SPIE 1993; 1894:136-147.
5. Piccare MF, Toker E. Development and evaluation of a CCD-based digital imaging system for mammography. Proc SPIE 1993;1901 : 109- 119.
6. Nelson RS, Barbaric ZL, Gomes AS, Moler CL, Deckard ME. An evalu- ation of a fluorescent screen-isocon camera system for x-ray imaging in radiology. Med Phys 1982;9:777-783.
7. Macovski A. Medical imaging systems, Englewood Cliffs, N J: Prentice- Hall, 1983.
8. Liu H. Digital fluoroscopy with an optically coupled charge-coupled de- vice. PhD dissertation. Worcester Polytechnic Institute, Worcester, MA, 1992.
9. Shalve S. Video techniques for portal imaging. ComputMedlmaging Graph 1989; 13:217-226.
10. Barnes GT, Chakraborty DP. Radiographic mottle and patient exposure in mammography. Radiology1982;145:815-821.
11. Rose A, Weimer PK. Physical limits to the performance of imaging sys- tems. Phys Today 1989;42:24-32.
12. Gruner SM. CCD and vidicon x-ray detectors: theory and practice (in- vited commentary). Rev Sci Instrum 1989; 60:60.
13. Brody WR. Digital radiography. New York, NY: Raven, 1984; 83. 14. Dick CE, Motz JW. Utilization of monoenergetic x-ray beams to exam-
ine the properties of radiographic intensifying screen. IEEE Trans Nucl Sci 1981 ;Ns-28:1554-1558.
15. Liu H, Karellas A, Harris L. Methods to calculate lens efficiency in opti- cally coupled CCD x-ray imaging systems. Med Phys 1994;21:1193- 1195.
16. Maidment ADA, Yaffe MJ. Analysis of the spatial-frequency-dependent DQE of the optically coupled digital mammography detectors. Med Phys 1994;21:721-729.
17. Roehrig H, Fajardo LL, Tong Y, Schempp WV. Signal, noise and detec- tive quantum efficiency in CCD based x-ray imaging systems for use in mammography. Proc SPIE 1994;2163:320-329.
18. Nishikawa RM, Yaffe MJ. Signal-to-noise ratio properties of mammo- graphic film-screen systems. MedPhys 1985;12:32-39.
19. Nishikawa RM, Yaffe MJ. Model of the spatial-frequency-dependent detective quantum efficiency of phosphor screens. Med Phys 1990;17:894-904.
20. Dainty JC, Shaw R. Image science. Boston, MA: Academic Press, 1974; 312.
21. Liu H, Fajardo LL, Buchanan M, McAdoo J, Halama G, Jalink A. CCD- scanning techniques for full-size digital mammography (abstr). Radiol- ogy1995;197(P):291.
22. Lee DL, Wilmington DE, Cheung LK, Jeromin LS, Palecki EF, Wolff DP. Projection radiography with use of a direct conversion imaging ar- ray (abstr). Radiology 1995; 197(P):358.
23. Liu H, Karellas A, Harris L, D'Orsi C. Large-field high-spatial resolution digital x-ray mammography. Proc SPIE 1995;2390:110-115.
24, Rose A. The sensitivity performance of the human eye on an absolute scale. J Opt Soc Am 1948;38:196.
25. Hasegawa BH. The Rose model: the physics of medical x-ray imaging. Madison, Wh Medical Physics, 1990.
26, Wagner R, Brown D. Unified SNR analysis of medical imaging sys- tems. Phys Med Biol 1985;30:489-518.
27. Liu H, Karellas A, Moore SC, Harris L J, D'Orsi CJ. Lesion detectability considerations for an optically coupled CCD X-ray imaging system. I E EE Trans Nucl Sci 1994;41:1506-1509.
805