Embed Size (px)
Citation preview

1
Signal Replacement with an Interchange
Department of Civil and Environmental Engineering
The University of North Carolina at Charlotte
Charlotte, North Carolina
28223-0001
August 2007

2
Technical Report Documentation Page
1. Report No.FHWA/NC/2006-45
2. Government Accession No. 3. Recipient’s Catalog No.
4. Title and SubtitleSignal Replacement with an Interchange
5. Report DateAugust 24, 2007
6. Performing Organization Code
7. Author(s):Martin R. Kane, Caroline M. Kone, William Andrew Eagle
8. Performing Organization Report No.
9. Performing Organization Name and AddressDepartment of Civil & Environmental Engineering
10. Work Unit No. (TRAIS)
University of North Carolina at CharlotteCharlotte, North Carolina 28223-0001
11. Contract or Grant No.
12. Sponsoring Agency Name and AddressNorth Carolina Department of TransportationResearch and Analysis Group
13. Type of Report and Period CoveredFinal ReportJuly 2005 - March 2007
1 South Wilmington StreetRaleigh, North Carolina 27601
14. Sponsoring Agency Code2006-11
Supplementary Notes:
16. AbstractThe purpose of this research effort is to evaluate unique intersection designs for their suitability for use in lieuof an existing or proposed traffic signal. Traffic signals can cause unnecessary delay and capacity restrictionsdue to the operational characteristics of signalized intersections. This project identified alternative intersection(interchange) designs that could be implemented at signalized intersections that would serve the current trafficand also provide a higher capacity for the main traffic movement. Analyses were conducted primarily usingSYNCHRO 6 software from Trafficware Ltd. To model the different intersection/interchange designs identifiedfor analysis. Eight designs were selected for in-depth analysis: Continuous Flow, Center –Turn Overpass,Echelon, Median U-turn, Michigan Diamond, Quadrant, SPUI, and Tight Diamond. While the Tight Diamondperformed very well in the simulation, the consensus of experienced traffic engineers (Thrower, Naylor, et al.)was that there were errors in the simulation that resulted in much better than expected results. Further analysiswill be conducted on this design, not related to this project, to see if the problem can be identified. Because ofthe lack of confidence in the Tight Diamond results, the Tight Diamond will not be included in therecommendations. When the different designs were evaluated at selected locations in different areas of thestate, the lower cost designs usually prevailed based on predicted traffic levels and construction costs. Theevaluated designs did indicate a significant increase in capacity when compared to a “regular” signalizedintersection.
17. Key WordsUnconventional Intersection Designs; Alternativedesigns for signalized intersections; Center-TurnOverpass; Continuous Flow Intersection; EchelonIntersection; Quadrant Intersection; MichiganDiamond Intersection; Median U-turn Intersection;Single Point Urban Interchange; SPUI; RuralSignalized intersections; High-capacity intersections;
18. Distribution Statement
19. Security Class if. (of this report)Unclassified
20. Security Classif. (of this page)Unclassified
21. No. of Pages170
22. Price
Form DOT F 1700.7 (8-72) Reproduction of completed page authorized

3
DISCLAIMER
The contents of this report reflect the views of the author(s) and not necessarily the
views of the University. The author(s) are responsible for the facts and the accuracy of the
data presented herein. The contents do not necessarily reflect the official views or policies
of either the North Carolina Department of Transportation or the Federal Highway
Administration at the time of publication. This report does not constitute a standard,
specification, or regulation.

4
Acknowledgments
The people involved in this research project at UNC Charlotte wish to thank the members of the oversight committee for all of their input and helping to focus the research effort. In particular, the research effort was greatly helped by the cooperation and information from the Roadway Design Unit regarding design criteria and cost estimates. I would like to personally thank everyone involved on this project for being flexible and understanding allowing me to extend the project while addressing some personal health and family issues.
5
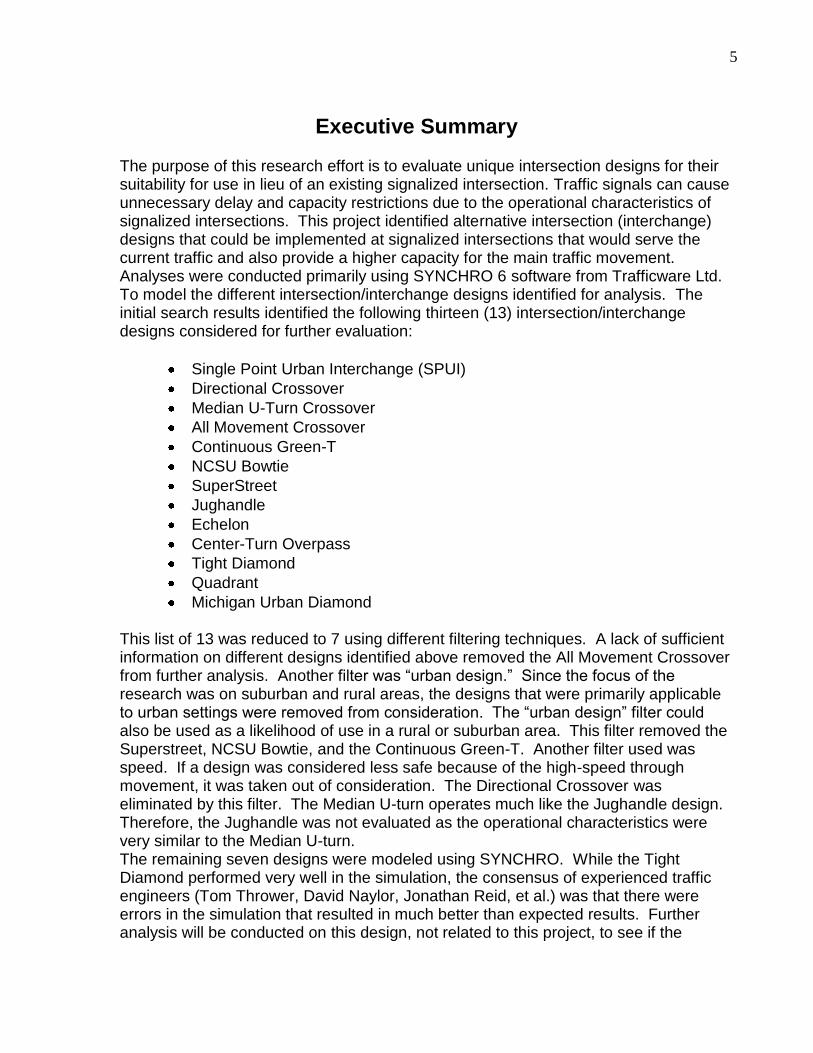
Executive Summary The purpose of this research effort is to evaluate unique intersection designs for their suitability for use in lieu of an existing signalized intersection. Traffic signals can cause unnecessary delay and capacity restrictions due to the operational characteristics of signalized intersections. This project identified alternative intersection (interchange) designs that could be implemented at signalized intersections that would serve the current traffic and also provide a higher capacity for the main traffic movement. Analyses were conducted primarily using SYNCHRO 6 software from Trafficware Ltd. To model the different intersection/interchange designs identified for analysis. The initial search results identified the following thirteen (13) intersection/interchange designs considered for further evaluation:
Single Point Urban Interchange (SPUI)
Directional Crossover
Median U-Turn Crossover
All Movement Crossover
Continuous Green-T
NCSU Bowtie
SuperStreet
Jughandle
Echelon
Center-Turn Overpass
Tight Diamond
Quadrant
Michigan Urban Diamond
This list of 13 was reduced to 7 using different filtering techniques. A lack of sufficient information on different designs identified above removed the All Movement Crossover from further analysis. Another filter was “urban design.” Since the focus of the research was on suburban and rural areas, the designs that were primarily applicable to urban settings were removed from consideration. The “urban design” filter could also be used as a likelihood of use in a rural or suburban area. This filter removed the Superstreet, NCSU Bowtie, and the Continuous Green-T. Another filter used was speed. If a design was considered less safe because of the high-speed through movement, it was taken out of consideration. The Directional Crossover was eliminated by this filter. The Median U-turn operates much like the Jughandle design. Therefore, the Jughandle was not evaluated as the operational characteristics were very similar to the Median U-turn. The remaining seven designs were modeled using SYNCHRO. While the Tight Diamond performed very well in the simulation, the consensus of experienced traffic engineers (Tom Thrower, David Naylor, Jonathan Reid, et al.) was that there were errors in the simulation that resulted in much better than expected results. Further analysis will be conducted on this design, not related to this project, to see if the

6
problem can be identified. Because of the lack of confidence in the Tight Diamond results, the Tight Diamond will not be included in the recommendations. When the different designs were evaluated at selected locations in different areas of the state, the lower cost designs (e.g., Median U-turn, Quadrant) usually prevailed based on predicted traffic levels and construction costs. The evaluated designs did indicate a significant increase in capacity when compared to a “regular” signalized intersection.
7
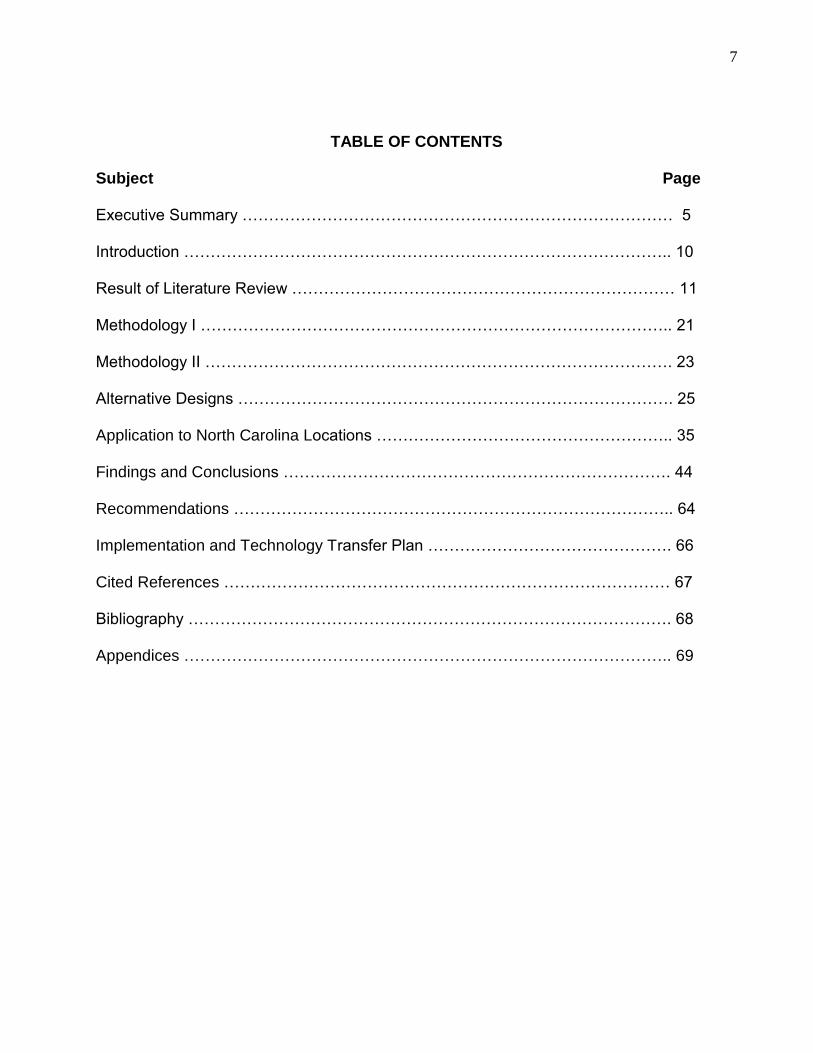
TABLE OF CONTENTS Subject Page Executive Summary ……………………………………………………………………… 5 Introduction ……………………………………………………………………………….. 10 Result of Literature Review ……………………………………………………………… 11 Methodology I …………………………………………………………………………….. 21 Methodology II ……………………………………………………………………………. 23 Alternative Designs ………………………………………………………………………. 25 Application to North Carolina Locations ……………………………………………….. 35 Findings and Conclusions ………………………………………………………………. 44 Recommendations ……………………………………………………………………….. 64 Implementation and Technology Transfer Plan ………………………………………. 66 Cited References ………………………………………………………………………… 67 Bibliography ………………………………………………………………………………. 68 Appendices ……………………………………………………………………………….. 69

8
LIST OF TABLES Table Title Page
1. Summary Comparison …………………………………………………………………19 2. Typical Intersection Base Volumes ………………………………………………… 21 3. Intersection Scenarios ………………………………………………………………… 22 4. Failure Volumes for Intersection Types …………………………………………….. 34 5. Suitable Intersection Failure Volumes ……………………………………………… 36 6. Provided Construction Cost Estimates ……………………………………………… 36 7. Suitable Intersection Summary ………………………………………………………. 37 8. Final Construction Cost Estimates ………………………………………………… .. 39 9. Delay Costs …………………………………………………………………………….. 40 10. Change of Delay Costs ………….……………………………………………………. 41 11. Benefits …………………………………………………………………………………. 41 12. Costs ……………………………………………………………………………………. 42 13. Benefit/Cost Ratios Grade Separated Design………………………………………. 42
13A. Benefit/Cost Ratios At-Grade Design …………………………………………….. 43 14. Intersection Recommendations ……………………………………………………….43 15. Scenario 1 Volumes …………………………………………………………………… 49 16. Scenario 1 Measures of Effectiveness ……………………………………………… 49 17. Scenario 1 Measures of Effectiveness ……………………………………………… 50 18. Scenario 2 Volumes …………………………………………………...……………… 50 19. Scenario 2 Measures of Effectiveness ……………………………………………… 51 20. Scenario 2 Measures of Effectiveness ……………………………………………… 51 21. Scenario 3 Volumes ……………………………………………………………………52 22. Scenario 3 Measures of Effectiveness ……………………………………………… 52 23. Scenario 3 Measures of Effectiveness ……………………………………………… 53 24. Scenario 4 Volumes ……………………………………………………………………53 25. Scenario 4 Measures of Effectiveness ……………………………………………… 54 26. Scenario 4 Measures of Effectiveness ……………………………………………… 54 27. Scenario 5 Volumes ……………………………………………………………………55 28. Scenario 5 Measures of Effectiveness ……………………………………………… 55 29. Scenario 5 Measures of Effectiveness ……………………………………………… 56 30. Scenario 6 Volumes ……………………………………………………………………56 31. Scenario 6 Measures of Effectiveness ……………………………………………… 57 32. Scenario 6 Measures of Effectiveness …………………………………………….…57 33. Scenario 7 Volumes ……………………………………………………………………58 34. Scenario 7 Measures of Effectiveness ……………………………………………….59 35. Scenario 7 Measures of Effectiveness ……………………………………………… 59 36. Scenario 8 Volumes ……………………………………………………………………60 37. Scenario 8 Measures of Effectiveness ……………………………………………… 60 38. Scenario 8 Measures of Effectiveness ……………………………………………… 61 39. Final Construction Cost Estimates …………… …………………………………. 62 40. Benefit/Cost Ratios Grade Separated Design …………………………………… 62 40A. Benefit/Cost Ratios At Grade Design …………………………………………….. 63 41. Summary of Designs with One Intersection …………………………………………64 42. Summary of Designs with Three Intersections …………………………………….. 65
9
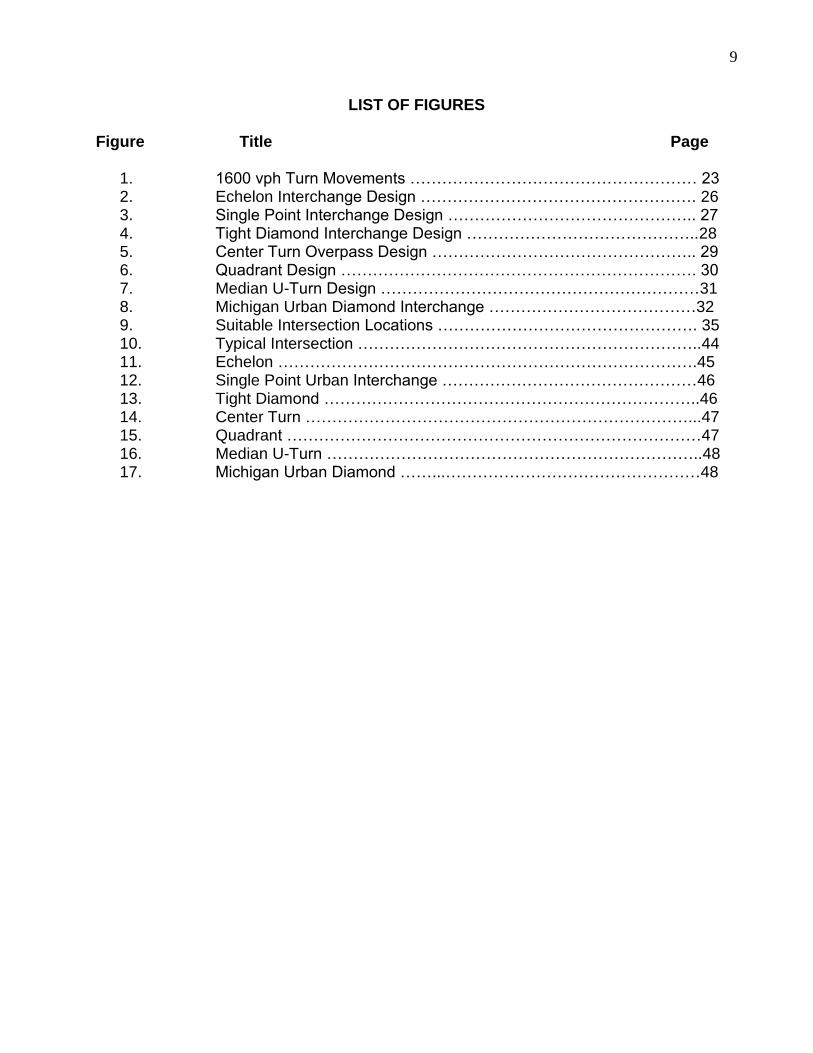
LIST OF FIGURES Figure Title Page
1. 1600 vph Turn Movements ……………………………………………… 23 2. Echelon Interchange Design ……………………………………………. 26 3. Single Point Interchange Design ……………………………………….. 27 4. Tight Diamond Interchange Design ……………………………………..28 5. Center Turn Overpass Design ………………………………………….. 29 6. Quadrant Design …………………………………………………………. 30 7. Median U-Turn Design ……………………………………………………31 8. Michigan Urban Diamond Interchange …………………………………32 9. Suitable Intersection Locations …………………………………………. 35 10. Typical Intersection ………………………………………………………..44 11. Echelon …………………………………………………………………….45 12. Single Point Urban Interchange …………………………………………46 13. Tight Diamond ……………………………………………………………..46 14. Center Turn ………………………………………………………………...47 15. Quadrant ……………………………………………………………………47 16. Median U-Turn ……………………………………………………………..48 17. Michigan Urban Diamond ……...…………………………………………48
10
INTRODUCTION
The purpose of this research effort is to evaluate unique intersection designs for
their suitability for use in lieu of an existing or proposed signalized intersection. Signalized intersections present a problem for handling cross traffic (minor movement). It is possible to manually control a traffic signal, change the signal display to flashing yellow for the through movement and flashing red for the cross traffic, or turn off a signal and use police to control traffic. Each of these scenarios will require through movement traffic (main movement) to stop to allow cross traffic to be serviced. There are a number of general “traditional” solutions, such as grade separation, that can be used to serve the cross traffic without needing to stop the main movement of traffic. There are also a number of “unique” or non-traditional designs for intersections and interchanges that have been proposed to use in place of the traditional grade separated intersection designs. Some of these unique designs have been used in various locations throughout the United States. Other unique designs have been modeled using computer simulation but have not been constructed.
The purpose of this research effort is to evaluate unique intersection designs for their suitability for use in lieu of an existing signalized intersection. Thirteen designs were identified through the literature search process for a more detailed evaluation. After a more in depth process of gathering information about the identified designs six of the designs were dropped from further evaluation. Some information about the general operation of some of the constructed designs came from phone conversations with officials in the states where the designs were in use. Evaluations of all the designs considered were conducted using SYNCHRO based computer simulation.
Different designs were evaluated using two different approaches. The first approach (Methodology I) used a base design for comparison. This base design was the “standard” signalized intersection and used permitted left turns on all approaches. The Measures of Effectiveness (MOE) used in this evaluation were: Total delay, Level of Service (LOS), Intersection Capacity Utilization (ICU) percent, and ICU LOS. Traffic volumes were selected for each movement to reflect what would reasonably be expected at rural or suburban intersection when there was “heavy” demand. The four MOEs were calculated for the base design. Including the base level of traffic, there were 8 volume scenarios evaluated for the base intersection and the 7 unique intersection designs. The results were then tabulated and compared. The purpose of this type of evaluation is to show the advantages and disadvantages of the unique intersection designs compared to the base signalized intersection as the base intersection approached capacity.
The second approach for evaluation (Methodology II) was to increase the volume on the different approaches to the intersection based on a pre-determined process. The different designs were then “loaded to failure” and the results tabulated. Measures of Effectiveness for this evaluation approach were LOS and total entering volume. The evaluation process also identified several locations in the state where the different designs might be applied and the suitability of each design for the different locations.
11
RESULT OF LITERATURE REVIEW
A literature review was completed in order to better understand the research that
has been done regarding unconventional intersection designs. The majority of the research focused on urban or suburban areas. There was little focus on rural, high speed roadways. The remainder of this chapter summarizes the research that was reviewed.
Design of Single Point Urban Interchanges
Between 1990 and 2000 vehicle miles-traveled (VMT) increased 28.2% and is expected to increase another 35% by 2010. With this great increase the amount of delay time and vehicle emissions will increase as well. The 2002 Federal Highway Administration’s Condition and Performance report showed that the additional travel time during peak congested times when compared to non-peak times increased from 37% in 1990 to 51% in 2000. Most of this traffic occurs on the freeway system and on service interchanges. One of the more common solutions to this problem is to build a Diamond Interchange. One problem with the Diamond interchange is that as volume increases congestion increases and the other problem is that it requires a large right-of-way. Another type of interchange was designed in 1970 by Greiner Engineering Sciences Inc., which offered a larger carrying capacity without the problems of congestion like those experienced with the Diamond interchange. This new design was called the Single Signal interchange or the Single Point Urban interchange (SPUI) because of its odd geometry [8]. In this report some of the key geometric and operational properties were studied and the influence of these properties on the design of SPUIs were discussed. Some of the important geometric properties were grade separation, skew angle, roadway characteristics, signal phasing, left and right turn radii as well as the amount of traffic that would be on the roadway. The states were surveyed to gather opinions on how they ranked these geometric properties and it was found that most states ranked right-of-way as their number one reason for the use of SPUIs. It is commonly agreed that SPUIs are not very effective where pedestrians need to cross the road or where there is a need for frontage roads. One of the biggest reasons that states do not use SPUIs is the fact that the construction costs are very high. Many states also believe that SPUIs will confuse drivers as well [8].
Median Crossover Guideline Statement
Divided median facilities separate opposing travel lanes, which control left turn conflicts. This allows some recovery area for out of control vehicles as well as a place for future lanes to be paved if needed. Median divided facilities improve traffic flow, reduce congestion and have lower crash rates. If the facility is divided median crossovers would be needed to allow turning and through movements. The placement of a median crossover must be considered very heavily because crossovers introduce conflict points and could reduce the safety of the facility [1].

12
Types of crossover design The following crossover types are listed from most desirable to least desirable.
Use of alternate routes and access: This uses the existing infrastructure to provide the same service a crossover would.
Directional Crossovers: A directional crossover provides a turn for only one direction. These crossovers provide for the predominant movement and prove to be much safer for the public. These only allow the major street to turn onto side streets no straight across movement or left turn is allowed from the side street.
Median U-turn Crossovers: allow for a u-turn for the major street, but no through movement from a side street.
All-Movement Crossover: provide for all movements at the intersection. The use of these crossovers is reserved for situations where sufficient space is available and all other crossover designs are not viable. The use of this crossover decreases capacity and increases delay and congestion.
General guidelines for median crossover installations on new and existing facilities
All median crossovers on new and existing facilities will be evaluated from an operational and safety perspective. Adequate spacing will be examined to determine if the proposed crossover is justified. The availability of adequate spacing alone will not warrant a new crossover. It is the responsibility of the requesting party to provide the justification for a crossover. Only the appropriate type of crossover will be considered for the facility based on the safety and operational needs of that facility. A median crossover will not be allowed if a left turn deceleration lane of adequate length cannot be provided and the crossover will not impede of the storage space of any other intersections. U-turns must be either correctly accommodated or restricted and the proper design vehicle must be used to accommodate all movements. All current NCDOT sight distances must be met where the crossover will be installed and the grade of the crossover may not exceed 5%. Special consideration must be given to the vertical profile of any median crossover that has the potential for future signalization. The median width may not be less than 16 feet.
Median Crossover Guidelines for NC Streets and Highways
Interstate and non-interstate highways with full control of access
No public-use median crossovers will be allowed. U-turn median openings for emergency and service vehicles can be allowed when an engineering study clearly indicates a need [1].
The spacing of the median openings should abide by the following guidelines:
U-turn median openings can be provided if they are needed and may be placed in a safe location where decision sight distance is available.
The crossover must be placed at least one half mile away from any overhead structure and at least one mile from any acceleration or deceleration ramps.
The crossovers also must be signed properly [1].
13
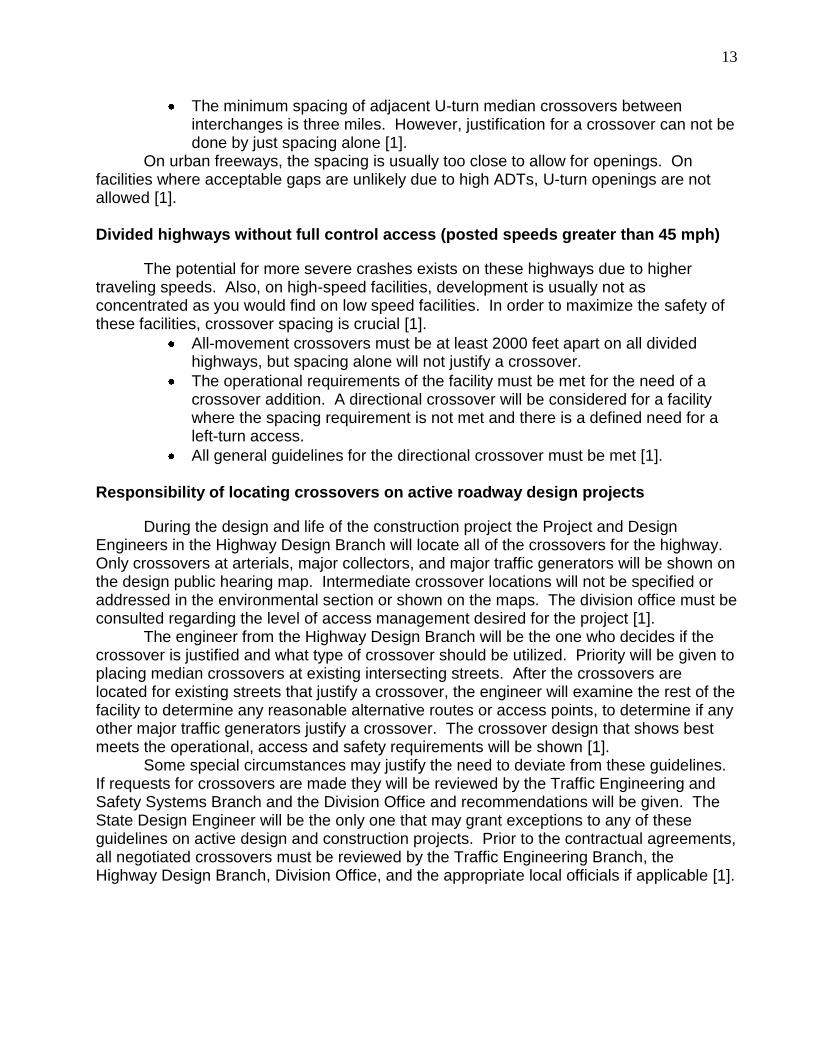
The minimum spacing of adjacent U-turn median crossovers between interchanges is three miles. However, justification for a crossover can not be done by just spacing alone [1].
On urban freeways, the spacing is usually too close to allow for openings. On facilities where acceptable gaps are unlikely due to high ADTs, U-turn openings are not allowed [1].
Divided highways without full control access (posted speeds greater than 45 mph)
The potential for more severe crashes exists on these highways due to higher traveling speeds. Also, on high-speed facilities, development is usually not as concentrated as you would find on low speed facilities. In order to maximize the safety of these facilities, crossover spacing is crucial [1].
All-movement crossovers must be at least 2000 feet apart on all divided highways, but spacing alone will not justify a crossover.
The operational requirements of the facility must be met for the need of a crossover addition. A directional crossover will be considered for a facility where the spacing requirement is not met and there is a defined need for a left-turn access.
All general guidelines for the directional crossover must be met [1].
Responsibility of locating crossovers on active roadway design projects
During the design and life of the construction project the Project and Design Engineers in the Highway Design Branch will locate all of the crossovers for the highway. Only crossovers at arterials, major collectors, and major traffic generators will be shown on the design public hearing map. Intermediate crossover locations will not be specified or addressed in the environmental section or shown on the maps. The division office must be consulted regarding the level of access management desired for the project [1].
The engineer from the Highway Design Branch will be the one who decides if the crossover is justified and what type of crossover should be utilized. Priority will be given to placing median crossovers at existing intersecting streets. After the crossovers are located for existing streets that justify a crossover, the engineer will examine the rest of the facility to determine any reasonable alternative routes or access points, to determine if any other major traffic generators justify a crossover. The crossover design that shows best meets the operational, access and safety requirements will be shown [1].
Some special circumstances may justify the need to deviate from these guidelines. If requests for crossovers are made they will be reviewed by the Traffic Engineering and Safety Systems Branch and the Division Office and recommendations will be given. The State Design Engineer will be the only one that may grant exceptions to any of these guidelines on active design and construction projects. Prior to the contractual agreements, all negotiated crossovers must be reviewed by the Traffic Engineering Branch, the Highway Design Branch, Division Office, and the appropriate local officials if applicable [1].

14
Responsibility of locating new crossovers on existing facilities
The approval of median crossovers requests for existing highways is the responsibility of the Traffic Engineering and Safety Systems Branch. Any request that may come to Roadway Design or Design Services shall be given to the appropriate Division Engineer. The Division Engineer shall perform a traffic engineering investigation using all of the criteria given in these guidelines. The Division Engineer shall provide a written report with the recommendations which will be forwarded to the Traffic Engineering and Safety Systems Branch for further study. The Traffic Engineering and Safety Systems Branch will conduct necessary investigations, which include discussions with other branches, units, and appropriate local officials if applicable. The State Traffic Engineer is responsible for the final approval or denial of the requests. The State Traffic Engineer will be the only person responsible for granting exceptions to these guidelines on all existing facilities. The Division Engineer will then be notified of the decision reached [1].
Crossovers considered for private developments on existing facilities
A private development will be responsible for the funding and installation of an added median crossover as long as it justifies direct access and the benefits of the median crossover. It is the responsibility of the requesting party to provide justification for new crossovers. If the proper information is not provided, the proposal will not be reviewed. The developer must submit a full set of plans and specify the exact location, design and construction requirements for the proposed median crossover. Only the appropriate crossover that meets the operational and safety requirements of the facility will be considered. Approval of the crossover is subject to a traffic engineering study and approval procedures as outlined in these guidelines [1].
Any drainage structures required for the crossover are the responsibility of the developer and must be funded by either the developer or the applicant at their expense. After the construction is completed in accordance with the Division of Highways requirements and standards, and passes an inspection by the District Engineer, the Division of Highways will assume ownership and maintenance of the crossover [1].
Failure to comply with the location, design, or construction requirements will result in the crossover being barricaded or removed until the problems have been corrected at the expense of the applicant. Once the Division of Highways assumes ownership, the median crossover will then be subject to the regulations under the police power of the State [1].
The department retains the authority to close or modify any crossover that it deems to be operationally unsafe for the traveling public; or causes a delay, congestion or adversely impacts the operation of traffic [1].
Special use crossovers
Median crossovers for special purposes will only be considered after a traffic engineering study. Emergency response plans and the expected level of need, in addition to geometric limitations of the current facility will be used in the consideration for all special

15
use crossovers. All approved special use crossovers will be appropriately designed, delineated, and regulated. Adequate spacing alone will not justify the need for a new crossover [1].
Travel Efficiency of Unconventional Suburban Arterial Intersection Designs
Lower cost design strategies for intersections are greatly needed to reduce congestion on major suburban arterials where all of the conventional techniques have been attempted. This paper reports the possible gains in travel efficiency from three unconventional designs: the median U-turn, where a left turn is utilized to cross the arterial about 180 meters away from the major intersection; continuous green-T (CGT) intersections, where one or two lanes at the top of the “T” always have a green light; and the North Carolina State University (NCSU) Bowtie, where all the left turning traffic goes through a roundabout on a side street about 180 meters away from the major intersection. Traf-Netsim 4.0 was used to simulate the unconventional designs as well as a conventional design for comparison in three experiments [4]. The three experiments showed that all designs have the ability to increase the travel efficiency. The CGT intersection reduced both travel and stop time at the three-legged intersections having a volume of 400 vehicles per hour per lane or more. The median U-turn was even more efficient than the CGT as you increased the volume going through the intersection. The NCSU Bowtie was used in an experiment with a four-legged intersection and the results show that travel and stop time were reduced from the conventional configuration at around 900 or more critical through vehicles per hour. There are some questions that remain about the unconventional strategies, but the possibility they have to reduce the travel and stop times is clearly shown [4]. Five unconventional alternatives
When Urban and Suburban arterials become congested, there is often no
immediate relief. Intelligent Transportation systems offer hope too far into the future (and mostly target freeways). Widening arterials, creating overpasses or flyovers, upgrading to interchanges, and building bypasses are expensive and highly disruptive solutions. Five unconventional alternatives will be considered: Median U-Turn, Bowtie, Superstreet, Jughandle, and Continuous Flow intersections [10].
Unconventional alternatives for intersections have two goals in common: To reduce delay for through vehicles and to reduce conflict points, spacing out any remaining points as much as possible. This incidentally increases safety [10]. Median U-turn
Median U-Turns reduce the number of phases at a signalized intersection to two, by
eliminating signalized left turns. Vehicles wanting to turn left off of the arterial must proceed beyond their turn, make a U turn, and return to make a right. Vehicles wanting to make a left turn on to an arterial must first go right, and then make a U-turn [10].

16
ADVANTAGES
Reduced delay for through arterial traffic
Increased capacity at the main intersection
Easier progression for through arterial traffic
Fewer stops for through traffic
Fewer threats to crossing pedestrians
Fewer and more separated conflict points [10] DISADVANTAGES
Driver confusion
Driver disregard of the left turn prohibition at the main intersection
Increased delay for left-turning traffic
Increased travel distances for left-turning traffic
Increased stops for left-turning traffic
Larger rights-of-way along the arterial
Higher operation costs for extra signals
Longer cross street minimum green times or two-cycle pedestrian crossing
May harm roadside business traffic [10] IDEAL LOCATION
Ideal Placement of Median U-Turns should be where there is minimal left turn traffic. Arterials with narrow medians and no easy way to widen are poor candidates [10]. Bowtie
Bowtie intersections are a variation on the Median U-Turn. Bowties utilize
roundabouts on the cross street to accommodate left turns. The main intersection only requires two phases. U-turns are difficult, requiring vehicles to travel through both roundabouts and the intersection three times [10]. ADVANTAGES
Reduced delay for through arterial traffic
Increased capacity at the main intersection
Reduced stops for through arterial traffic
Easier progression for through arterial traffic
Fewer threats to crossing pedestrians
Reduced and separated conflict points [10] DISADVANTAGES
Driver confusion
Driver disregard for left turn prohibition at main intersection
Increased delay for left-turning and cross street through traffic
Increased travel distances for left-turning traffic
Increased stops for left-turning and cross street through traffic
Additional right-of-way for the roundabouts

17
Difficult arterial U-turns [10] IDEAL LOCATION
Bowties should be considered at arterials where high through volumes conflict with moderate to low cross street and left turn volumes. Design locations must be relatively far apart [10]. Superstreet
Superstreet designs change four-approach intersections into two independent
three-approach intersections by requiring cross street through and left turn traffic both to and from the main arterial to use directional crossovers. This allows each direction to have its own signal timing [10]. ADVANTAGES
Reduced delay for through arterial traffic and for one pair of left turns
Reduced stops for through arterial traffic
Near perfect two-way progression at all times with any signal spacing for through arterial traffic
Fewer threats to crossing pedestrians
Reduced and separated conflict points [10] DISADVANTAGES
Driver and pedestrian confusion
Increased delay for cross street through traffic and for one pair of left turns
Increased travel distances for cross street through traffic and for one pair left turns
Slow two-stage crossing of arterial for pedestrians
Additional right-of-way along the arterial [10] IDEAL LOCATION
Consider where high arterial through volumes conflict with moderate to low cross street through volumes. Design suffers from the same restrictions as Median U-turn: arterials with narrow medians [10]. Jughandle
Jughandles utilize ramps diverging from the right side of the arterial to
accommodate all turns from the arterial. Ramps begin prior to the intersection. Left turns from arterial use the ramp, then turn left on the cross street at the ramp terminal, which are stop-controlled for left turns, and yield-controlled for right turns [10]. ADVANTAGES
Reduced delay for through arterial traffic
Reduced stops for through arterial traffic
Easier progression for through arterial traffic
Narrower right-of-way needed along the arterial
18
Reduced and separated conflict points [10] DISADVANTAGES
Driver confusion
Driver disregard for left turn prohibitions at the main intersection
Increased delay for left turns from the arterial
Increased travel distances for left turns from the arterial
Increased stops for left turns from the arterial
Pedestrians must cross ramps and the main intersection
Additional right-of-way for ramps
Additional construction and maintenance costs for ramps
Lack of access to arterial for parcels next to ramps [10] IDEAL LOCATION
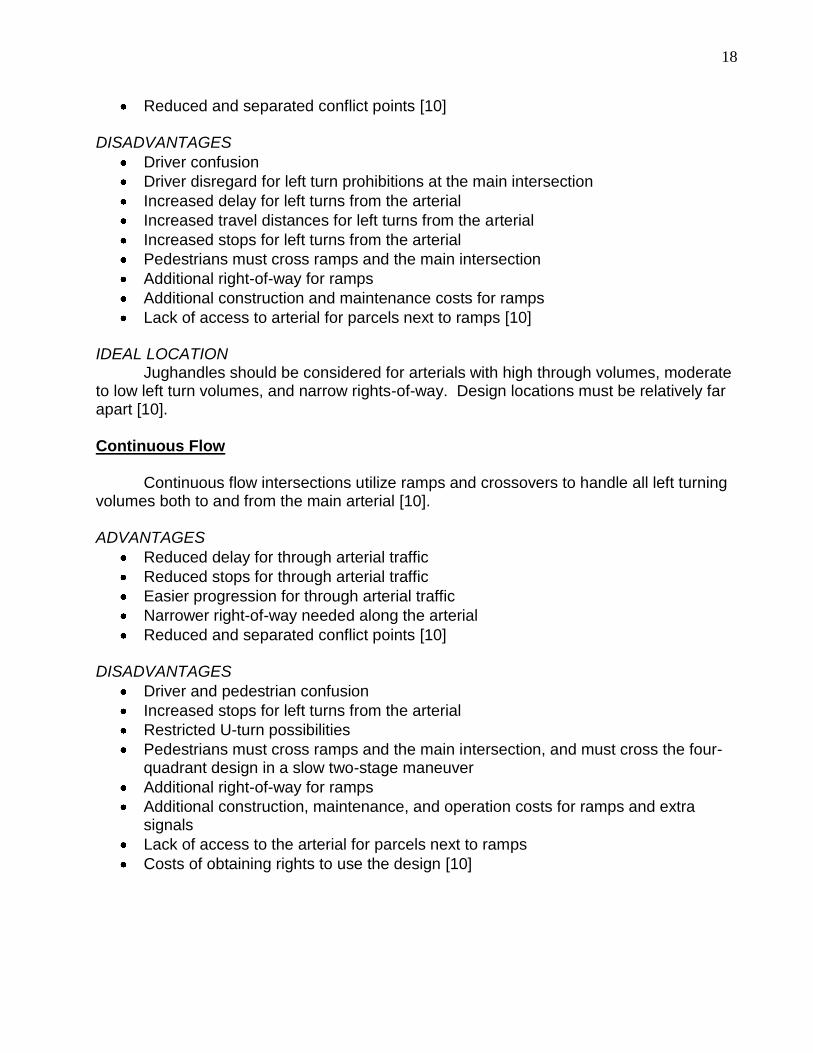
Jughandles should be considered for arterials with high through volumes, moderate to low left turn volumes, and narrow rights-of-way. Design locations must be relatively far apart [10]. Continuous Flow
Continuous flow intersections utilize ramps and crossovers to handle all left turning
volumes both to and from the main arterial [10]. ADVANTAGES
Reduced delay for through arterial traffic
Reduced stops for through arterial traffic
Easier progression for through arterial traffic
Narrower right-of-way needed along the arterial
Reduced and separated conflict points [10] DISADVANTAGES
Driver and pedestrian confusion
Increased stops for left turns from the arterial
Restricted U-turn possibilities
Pedestrians must cross ramps and the main intersection, and must cross the four-quadrant design in a slow two-stage maneuver
Additional right-of-way for ramps
Additional construction, maintenance, and operation costs for ramps and extra signals
Lack of access to the arterial for parcels next to ramps
Costs of obtaining rights to use the design [10]
19
IDEAL LOCATION Continuous flow designs are best used on arterials with high through volumes and
little demand for U-turns. Some right-of-way must be available along the arterial near the intersection. Design locations must be relatively far apart [10].
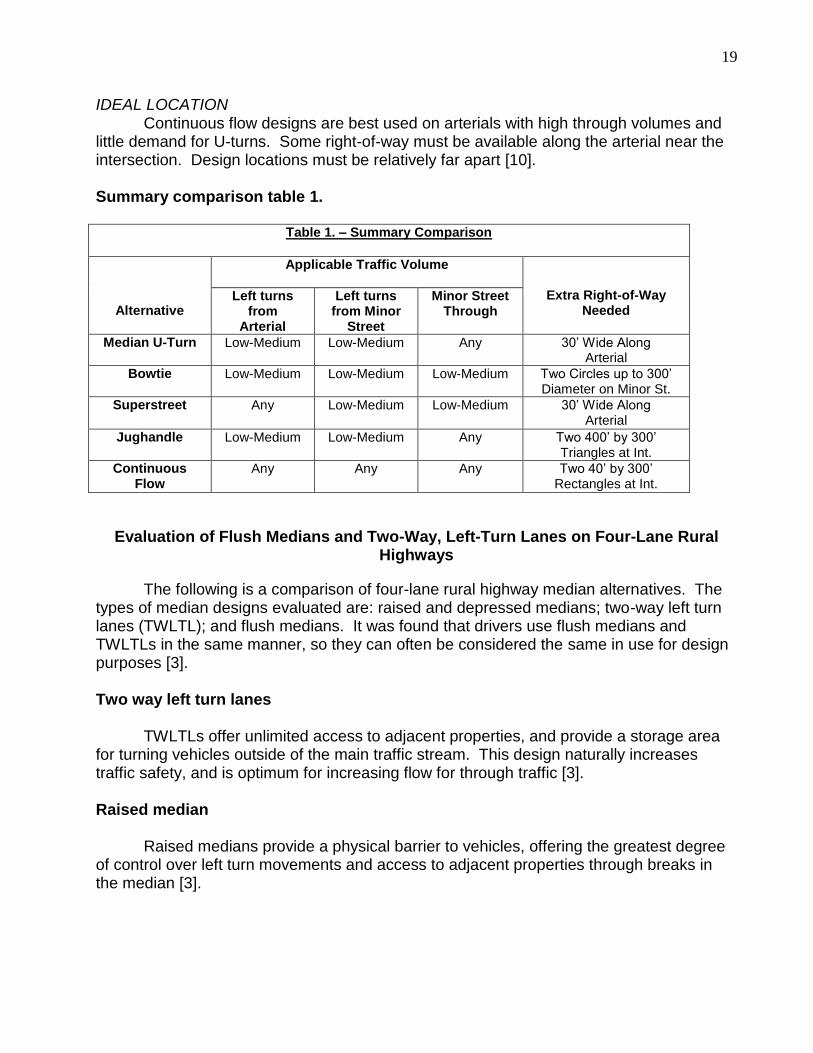
Summary comparison table 1.
Table 1. – Summary Comparison
Alternative
Applicable Traffic Volume
Extra Right-of-Way Needed
Left turns from
Arterial
Left turns from Minor
Street
Minor Street Through
Median U-Turn Low-Medium Low-Medium Any 30’ Wide Along Arterial
Bowtie Low-Medium Low-Medium Low-Medium Two Circles up to 300’ Diameter on Minor St.
Superstreet Any Low-Medium Low-Medium 30’ Wide Along Arterial
Jughandle Low-Medium Low-Medium Any Two 400’ by 300’ Triangles at Int.
Continuous Flow
Any Any Any Two 40’ by 300’ Rectangles at Int.
Evaluation of Flush Medians and Two-Way, Left-Turn Lanes on Four-Lane Rural Highways
The following is a comparison of four-lane rural highway median alternatives. The types of median designs evaluated are: raised and depressed medians; two-way left turn lanes (TWLTL); and flush medians. It was found that drivers use flush medians and TWLTLs in the same manner, so they can often be considered the same in use for design purposes [3]. Two way left turn lanes
TWLTLs offer unlimited access to adjacent properties, and provide a storage area
for turning vehicles outside of the main traffic stream. This design naturally increases traffic safety, and is optimum for increasing flow for through traffic [3]. Raised median
Raised medians provide a physical barrier to vehicles, offering the greatest degree
of control over left turn movements and access to adjacent properties through breaks in the median [3].

20
Flush median Flush medians are intended to function as a raised median, but use pavement
markings instead of a physical barrier to control turning movements. While illegal, drivers largely ignore the markings, and use the median as a TWLTL. The markings are ineffective unless the resources to constantly enforce the laws exist [3].
Summary For low density four-lane roads (access point density < 14.5/kilometer), flush
medians and TWLTLs performed virtually identical to each other in terms of effects on traffic volume and accident rates. No sites of higher density which utilize flush medians were found for comparison, although it is well documented that TWLTLs perform well on such roads (reducing accident rates by 20-30%), and it can be assumed that flush medians would perform similarly [3].
Once the intersection types were selected and described, it was necessary to find other studies relevant to this research. Because congestion is caused by left-turning traffic, it is important to review research on left-turn treatments. James L. Pline, PE wrote about such treatments and guidelines that should be followed at intersections. He discussed the need for site considerations as well as driver expectancy. This was followed by a summary of an innovative intersection design used by New York State [7]. It was also necessary to view other research that has been performed on the treatment of medians. An article by Karen K. Dixon, John L. Hibbard, and Chris Mroczka discussed the public perception of different median treatments. The treatments researched were a raised median and the Two-Way-Left-Turn-Lane (TWLTL). It was found that commercial property owners preferred the TWLTL and residential property owners preferred the raised median [2]. Similar research was performed for rural highways. The article then compared the use of raised medians, TWLTL, and flush medians. The research, performed in Texas, suggested that the use of TWLTL should be used instead of flush medians [3].

21
METHODOLOGY I
A fictional, isolated, rural intersection was modeled using the SYNCHRO traffic
modeling software. This intersection acted as a basic intersection onto which changes in traffic volume demand would be placed. The major approach had two through lanes, one left turn lane, and one right turn lane in each direction. Each design was modeled using a speed of 45 mph and 55 mph on the major approach in order to determine if speed was a factor that affects the measures of effectiveness. The minor approach had one through lane and one left turn lane in each direction. The speed on the minor approach was set at 45 miles per hour because it would most likely be a collector or local road. All lane widths were 12 feet. The storage length for all turn lanes was 200 feet. Each intersection approach had a 0% grade. Neither parking nor bus stops were permitted near the intersection.
Traffic volumes (measured in vehicles per hour) were added after the typical intersection was modeled. More vehicles per hour were placed on the major approach than on the minor approach. Few turn vehicles were added when compared to through movements. The volumes for each movement are summarized in Table 2.
Table 2 – Typical Intersection Base Volumes
Approach Left Turns (veh/hr) Through (veh/hr) Right Turns
(veh/hr)
Northbound (Major)
150 1200 150
Southbound (Major)
150 1200 150
Eastbound (Minor)
50 400 50
Westbound (Minor)
50 400 50
Several measures of effectiveness of the typical intersection were noted. These
measures of effectiveness were delay, level of service (LOS), intersection capacity utilization (ICU) %, and ICU LOS. Delay is based on the average total delay at an intersection. It includes delay caused by the signal timing and by queue lengths. Delay is measured in seconds per vehicle. The delay is then converted into a letter known as the LOS. ICU % describes how much of an intersection’s capacity is being used. For example, an intersection operating at an ICU % of 70% has 30% of its capacity not being used. The percentage is then converted into a letter known as the ICU LOS.
The typical intersection was operating with an overall delay of 29.5 seconds/vehicle at a LOS C. The ICU % was 91.8%. This means that the intersection was operating with less than 10% reserve capacity available. Small increases in volume would most likely cause the intersection to operate at capacity. This was chosen to be the appropriate starting point for the analysis. If the intersection had been operating at a LOS A it would be hard for the unconventional alternatives to show improvement. With the intersection

22
operating near capacity the alternatives can show either a positive or negative change in the LOS.
The unconventional intersections that were studied had advantages and disadvantages for different types of traffic volume scenarios. For example, one intersection design might work well at an intersection with high through volumes, but might fail at an intersection with high left turn volumes. Therefore, all of the unconventional intersection designs were modeled based on the original traffic volumes. The eight intersection scenarios are shown in Table 3. Turning movement volumes were added to simulate an intersection with high turning movements. Through movement volumes were increased to simulate intersections with high through volumes. The measures of effectiveness of each design for the eight scenarios were analyzed. The best two scenarios based on these measures of effectiveness were noted and summarized in the form of a table. This table could easily be used by transportation engineers as a starting point when designing a rural intersection. A separate table was created that ranked the unconventional intersection designs based on cost. Ranking was determined based upon the amount of right-of-way needed, the number of bridges, length of retaining wall, and amount of fill needed for the design. The cost table may also help a transportation engineer when deciding which design to further explore.
Table 3 – Intersection Scenarios
Scenario Description
1
Basic Intersection Without Added Volume
2 Added Left Turn Volumes From Major
Approach
3 Added Left Turn Volumes From Minor
Approach
4 Added Left Turn Volumes From Both
Major And Minor Approaches
5 Added Right Turn Volumes From Major
Approach
6 Added Right Turn Volumes From Minor
Approach
7 Added Right Turn Volumes From Both
Major And Minor Approaches
8 Added Through Volumes From Minor
Approach

23
METHODOLOGY II The selected designs were again evaluated using SYNCHRO simulation. This evaluation loaded the different designs with traffic volumes and then increased the volumes until capacity was reached (LOS E), failure occurred (LOS F) or the total volume entering reached 8047 vehicles per hour.
AutoCAD was used to draw each of the non-traditional intersection types. The geometrics of each intersection type drawn in AutoCAD were submitted to the North Carolina Department of Transportation (NCDOT). A committee at NCDOT used these drawings to generate basic construction costs for each of the eight designated intersection types.
Once the drawings were completed, SYNCHRO ver. 6 (SYNCHRO) was used to model the eight intersection types for evaluation and analysis. This was performed to determine the LOS of each type of intersection based upon hourly volumes of traffic. All SYNCHRO models were subjected to NCDOT design guidelines including a minimum initial green time of 7.0 seconds, a yellow time of 5.0 seconds, and an all-red time of 2.0 seconds. Also used in each SYNCHRO model was a peak hour factor (PHF) of .92 and a heavy vehicle percentage of 2%. From here, the signal network was optimized for each model.
Next, a base count of 1600 vehicles per hour (vph) was used. On the major thoroughfare, each through movement had 400 vph while each turn movement had 25 vph. On the minor approach, each through movement had 270 vph and the turn movements had 15 vph each. See Figure 1 following.
Figure 1. 1600 vph Turn Movements
These initial counts were increased by 10% and the analysis was run again. This
process was repeated until the intersection reached an LOS E, LOS F, or until the count
25
15
25 400 25
15 Minor
Major
15
270
15
270 15 400

24
reached 8047 vph. The turn movement counts for each hourly volume, from 1600 vph to 8047 vph, can be viewed in Appendix A.
Once the intersection types were modeled, intersections in North Carolina were inventoried to find candidates for the study. Criteria were set by the researcher, members of a committee existing of faculty among UNC Charlotte, and staff within the NCDOT. The criteria of fit intersections included a speed limit of at least 55 miles per hour (mph), a rural area, and a remote signal; no other signals within two miles. A compilation of locations where likely intersections would be was provided by NCDOT. An inventory of the most suitable intersections was created following visits to areas matching the criteria. Once a location was found, measurements were made to determine lane widths and lengths. Pictures were taken on each approach to be used later for reference.
The geometrics of the suitable intersections were drawn in AutoCAD for review by NCDOT. These drawings were used by the committee to approve the selected intersections.
After suitable intersections were found, they were modeled using SYNCHRO. The geometrics of the intersections were modeled using the measured lane lengths and widths from the site. The traffic was modeled through the same process of using 1600 vph and increasing the amount of traffic by 10% until the intersection reached LOS E, LOS F, or until the intersection reached 8047 vph. The same guidelines for signal timing, PHF, and heavy vehicles used in the analysis of the intersection types were used as well. When the suitable intersections were identified, construction costs were compiled by committee members in NCDOT for each intersection type.
Next, traffic volumes were gathered for the locations of each suitable intersection. This was accomplished by referring to the NCDOT website, which has links to the Annual Average Daily Traffic (AADT) counts for roadways in North Carolina [6]. The state maintains a separate file for each county. After the counts were gathered, the intersections were grouped together based upon the AADT for the area.
Finally, a benefit/cost analysis was performed to determine which intersection type was best suited for each intersection. By calculating the cost of delay for each vehicle using the intersection and comparing it to the construction and operations and maintenance costs, the analysis was performed.
25
ALTERNATIVE DESIGNS
INTRODUCTION The eight intersection scenarios can be improved with the addition of traditional or
unconventional designs. The traditional design improvements used in this study were lane additions and optimization of the signal timing. The unconventional intersection designs that were used in this study are:
Echelon Interchange
Single Point Urban Interchange
Tight Diamond Interchange
Quadrant
Median U-Turn
Michigan Urban Diamond
Center Turn Overpass ECHELON
The Echelon design is a very unique interchange. The design separates two approaches by grade. Two adjacent approaches (e.g. – Northbound and Eastbound) are elevated while the other two approaches (Southbound and Westbound) remain at-grade. Any two adjacent approaches can be chosen to be elevated [1]. Figure 2 illustrates the design of an Echelon interchange. The design results in a pair of intersections. The elevated approaches act like the intersection of two one way streets. The same is true for the approaches at-grade. Both intersections are controlled by a two phase signal. According to Jonathan Reid, “The Echelon design is most appropriate at high-volume intersections located within a signalized network…The Echelon interchange has the greatest overall operations benefits where the arterial and cross street volumes are similar” [5].
This design is suitable for areas that see frequent pedestrian traffic. All pedestrians can cross at-grade. The pedestrians do not cross any roadway that has traffic moving in both directions. The pedestrians also do not wait as long to cross because the two phase signal is shorter [1].

26
Figure 2 – Echelon Interchange Design
http://attap.umd.edu/UAID
SINGLE POINT URBAN INTERCHANGE
The design of the Single Point Urban Interchange (SPUI) separates the through movements on the main roadway from all other movements. The through movements are separated by either an overpass or an underpass. All other movements meet at a single intersection. Figure 3 shows a SPUI design with the main through movements passing underneath the signalized intersection. Jonathan Reid writes, “The SPUI is particularly efficient compared to other interchanges where left-turn movements are heavy and/or where there are other signalized intersections nearby” [5].

27
Figure 3 – Single Point Urban Interchange Design
http://attap.umd.edu/UAID
The single signal replaces the two closely spaced intersections found at conventional Diamond Interchanges. The single, signalized intersection allows for better progression on the minor roadway. However, the single intersection requires a larger area to be paved [1]. TIGHT DIAMOND
The Tight Diamond Interchange is almost identical to a conventional Diamond Interchange. However, the Tight Diamond Interchange places the ramps as close as possible to the main roadway. This not only saves right-of-way, but it also may decrease delay in some cases. Figure 4 illustrates the design of a Tight Diamond Interchange. The Tight Diamond operates best when turn movements are imbalanced or much higher than the through movements [1].

28
Figure 4 – Tight Diamond Interchange Design
http://attap.umd.edu/UAID
CENTER TURN OVERPASS The Center Turn Overpass is another uniquely designed interchange. This design
elevates all of the left turn movements at an intersection. All other movements stay at-grade. Vehicles making left turns pass through a two phase signal above the main intersection. Through movements and right turns are made at the main intersection at-grade. This intersection is also controlled by a two phase signal. Jonathan Reid writes, “The Center Turn Overpass’s greatest operational benefits compared to a conventional intersections design occur where the arterial and cross street volumes are similar, and left-turn volumes are moderate to high” [5]. Figure 5 illustrates a Center Turn Overpass Design.
The Center Turn Overpass works well in areas with high left turn volumes. Through movements do not have to wait for left turning vehicles. The ramps for the left turn movements are also confined to the median [1]. “A minimal CTO approach roadway can be built within a 32-foot median, assuming two 12-foot approach and departure lanes and 2-foot offsets to the outside 2-foot concrete barriers” [1]. This reduces the need for large amounts of right-of-way.

29
Figure 5 – Center Turn Overpass Design
http://attap.umd.edu/UAID
QUADRANT The Quadrant design utilizes an extra roadway constructed in one of the
intersection’s four quadrants. This roadway can be seen in Figure 6. Left turn movements are prohibited at the main intersection. Vehicles wanting to make left turns must use the quadrant roadway. The Quadrant design operates best where through volumes on the major approach are high and all other movements have moderate to low volumes [1].
Only a two phase traffic signal system is needed at the main intersection. This is due to the prohibition of left turn movements. The T-intersections at both ends of the quadrant roadway require a three phase traffic signal system. All three signals must be

30
coordinated. Proper offset times between signals allows vehicles on the main roadway to progress through the intersections without stopping. This optimizes through movements on the main roadway.
There are several other important features of the Quadrant design. It is important the intersections at each end of the quadrant roadway be T-intersections. The coordination of the signals would be negatively affected if a fourth leg were added to one of these intersections. The area closed in by the quadrant roadway may be developed. However, the area may be left unused if additional traffic demand from a development is not desired [1].
Figure 6 – Quadrant Design
http://attap.umd.edu/UAID

31
MEDIAN U-TURN
The Median U-Turn design prohibits left turn movements at the intersection. The
design can be seen in Figure 7. Vehicles turning left from the major approach must first pass through the main intersection. Then the vehicles must make a U-turn. The vehicles complete the left turn by turning right at the main intersection. Vehicles turning left from the minor approach must first turn right onto the major roadway. Then they must make a U-turn and proceed through the main intersection to complete the left turn. The Median U-Turn design operates best where the major approach has high through volumes and moderate to low left turn volumes [1].
Figure 7 – Median U-Turn Design
http://attap.umd.edu/UAID
The prohibition of left turns at the main intersection is one of the key features of the design. Only two phases are needed because of the lack of left turn movements. More time can also be given to the through movements because of the lack of left turn movements.
As seen in Figure 7, vehicles crossing the major roadway must pass through two traffic signals. The second signal in this progression must stay green for some time after the first signal has turned red. This allows all vehicles to pass through the intersection without any left waiting in the center.

32
It is also necessary to coordinate the U-turn signal with the signal at the main intersection. Vehicles leaving the U-turn intersection should reach the main intersection as it turns green. This is the most efficient condition.
MICHIGAN URBAN DIAMOND The Michigan Urban Diamond Interchange is similar to the Median U-Turn Design.
Both designs prohibit left turns at the main intersection. Vehicles wanting to turn left must pass the main intersection and then make a U-turn. The Michigan Urban Diamond Interchange is different from the Median U-Turn Design because the through lanes on the main roadway are separated by grade from the rest of the movements. All of the signalized intersections are separated from the main roadway through movements using ramps and bridges. Figure 8 shows the design of the Michigan Urban Diamond Interchange [1]. According to Jonathan Reid, “The Michigan Urban Diamond has the greatest timesaving benefits on arterials that have high through-movements and moderate or low volumes of left-turns and cross street movements”[5].
Figure 8 – Michigan Urban Diamond Interchange
http://attap.umd.edu/UAID
Of the ten states chosen for questioning about alternative intersection treatments used, only six responded. Those who replied were Michigan, Texas, Illinois, Wyoming,
33
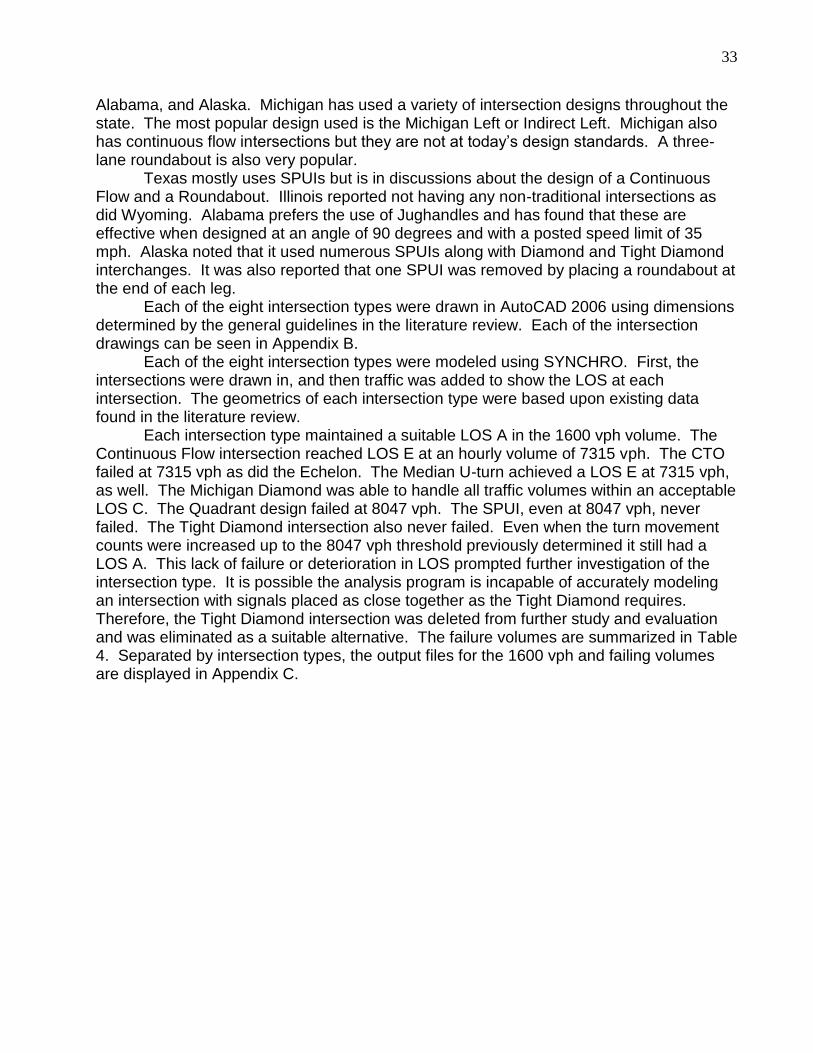
Alabama, and Alaska. Michigan has used a variety of intersection designs throughout the state. The most popular design used is the Michigan Left or Indirect Left. Michigan also has continuous flow intersections but they are not at today’s design standards. A three-lane roundabout is also very popular. Texas mostly uses SPUIs but is in discussions about the design of a Continuous Flow and a Roundabout. Illinois reported not having any non-traditional intersections as did Wyoming. Alabama prefers the use of Jughandles and has found that these are effective when designed at an angle of 90 degrees and with a posted speed limit of 35 mph. Alaska noted that it used numerous SPUIs along with Diamond and Tight Diamond interchanges. It was also reported that one SPUI was removed by placing a roundabout at the end of each leg. Each of the eight intersection types were drawn in AutoCAD 2006 using dimensions determined by the general guidelines in the literature review. Each of the intersection drawings can be seen in Appendix B. Each of the eight intersection types were modeled using SYNCHRO. First, the intersections were drawn in, and then traffic was added to show the LOS at each intersection. The geometrics of each intersection type were based upon existing data found in the literature review. Each intersection type maintained a suitable LOS A in the 1600 vph volume. The Continuous Flow intersection reached LOS E at an hourly volume of 7315 vph. The CTO failed at 7315 vph as did the Echelon. The Median U-turn achieved a LOS E at 7315 vph, as well. The Michigan Diamond was able to handle all traffic volumes within an acceptable LOS C. The Quadrant design failed at 8047 vph. The SPUI, even at 8047 vph, never failed. The Tight Diamond intersection also never failed. Even when the turn movement counts were increased up to the 8047 vph threshold previously determined it still had a LOS A. This lack of failure or deterioration in LOS prompted further investigation of the intersection type. It is possible the analysis program is incapable of accurately modeling an intersection with signals placed as close together as the Tight Diamond requires. Therefore, the Tight Diamond intersection was deleted from further study and evaluation and was eliminated as a suitable alternative. The failure volumes are summarized in Table 4. Separated by intersection types, the output files for the 1600 vph and failing volumes are displayed in Appendix C.

34
Table 4. Failure Volumes for Intersection Types
Intersection Type Failure Point
Continuous Flow 7315 vph (LOS E)
CTO 7315 vph (LOS E)
Echelon 7315 vph (LOS F)
Median U-turn 7315 vph (LOS E)
Michigan Diamond 8047 vph (LOS C)
Quadrant 8047 vph (LOS E)
SPUI 8047 vph (LOS D)
Tight Diamond 8047 vph (LOS A)

35
Application to North Carolina Locations
Six suitable intersections were discovered in the inventory process. Two are located in the mountain region (mountainous), three are in the Piedmont region (rolling), and one is in the coastal region (level). These locations are represented as stars in Figure 9, following.
Figure 9. Suitable Intersection Locations
One of the mountainous intersections was NC Hwy 280 at Forge Mountain Road (SR 1316) in Henderson County. The other mountainous intersection is US Hwy 19-74-129 at Locust Street (SR 1436), is located in Cherokee County. The three intersections in the rolling areas include NC Hwy 152 at Old Concord Road (SR 1002) in Rowan County, US Hwy 29 at Pitt School Road (SR 1036) in Cabarrus County, and US Hwy 74 at Forest Hills School Road (SR 1754) in Union County. The last intersection, located in the level region, is US Hwy 158 at US Hwy 258 in Hertford County. Using the dimensions gathered in the inventory process, the suitable intersections found were drawn in AutoCAD using the same version previously noted. Each of the intersection drawings can be seen Appendix D. After dimensions were taken, the intersections were modeled using SYNCHRO traffic analysis program. Existing lane widths and lengths were used for the geometrics and an hourly volume was applied for modeling of the traffic. The same process of increasing the hourly volume by 10% starting with 1600 vph was used. Also used from prior modeling were the set guidelines for signal timing, PHF, and heavy vehicles. Each suitable intersection was modeled with 1600 vph as the base traffic volume. NC Hwy 280 at Forge Mountain Road (SR 1316) had a LOS B at the initial volume of 1600 vph and reached a LOS F at 4541 vph. The intersection of US Hwy 19-74-129 at Locust Street (SR 1436) had a LOS B at the initial 1600 vph volume and achieved a LOS E at 4995 vph. The intersection of NC Hwy 152 at Old Concord Road (SR 1002) was a LOS B at the initial volume. It reached a LOS E at 2835 vph. The intersection of US Hwy 29 at Pitt School Road (SR 1036) had a LOS B at 1600 vph and failed with a LOS E at 4995 vph.
36
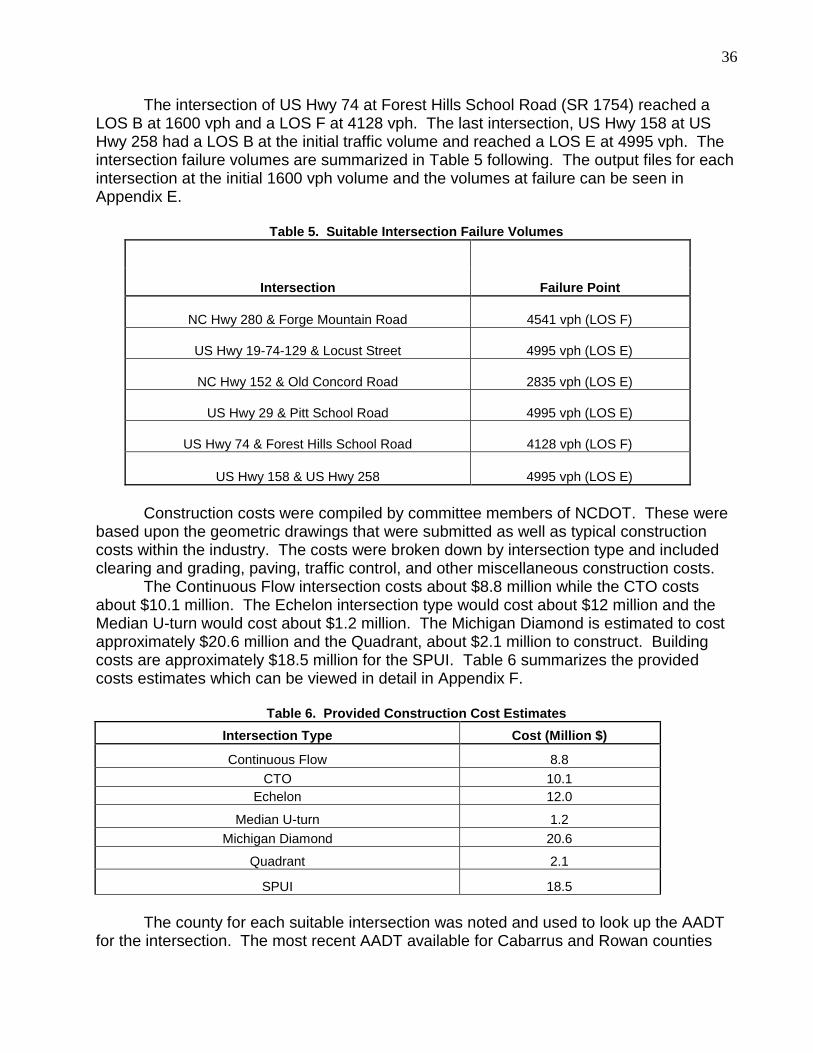
The intersection of US Hwy 74 at Forest Hills School Road (SR 1754) reached a LOS B at 1600 vph and a LOS F at 4128 vph. The last intersection, US Hwy 158 at US Hwy 258 had a LOS B at the initial traffic volume and reached a LOS E at 4995 vph. The intersection failure volumes are summarized in Table 5 following. The output files for each intersection at the initial 1600 vph volume and the volumes at failure can be seen in Appendix E.
Table 5. Suitable Intersection Failure Volumes
Intersection Failure Point
NC Hwy 280 & Forge Mountain Road 4541 vph (LOS F)
US Hwy 19-74-129 & Locust Street 4995 vph (LOS E)
NC Hwy 152 & Old Concord Road 2835 vph (LOS E)
US Hwy 29 & Pitt School Road 4995 vph (LOS E)
US Hwy 74 & Forest Hills School Road 4128 vph (LOS F)
US Hwy 158 & US Hwy 258 4995 vph (LOS E)
Construction costs were compiled by committee members of NCDOT. These were
based upon the geometric drawings that were submitted as well as typical construction costs within the industry. The costs were broken down by intersection type and included clearing and grading, paving, traffic control, and other miscellaneous construction costs.
The Continuous Flow intersection costs about $8.8 million while the CTO costs about $10.1 million. The Echelon intersection type would cost about $12 million and the Median U-turn would cost about $1.2 million. The Michigan Diamond is estimated to cost approximately $20.6 million and the Quadrant, about $2.1 million to construct. Building costs are approximately $18.5 million for the SPUI. Table 6 summarizes the provided costs estimates which can be viewed in detail in Appendix F.
Table 6. Provided Construction Cost Estimates
Intersection Type Cost (Million $)
Continuous Flow 8.8
CTO 10.1
Echelon 12.0
Median U-turn 1.2
Michigan Diamond 20.6
Quadrant 2.1
SPUI 18.5
The county for each suitable intersection was noted and used to look up the AADT
for the intersection. The most recent AADT available for Cabarrus and Rowan counties

37
was for year 2004. The remaining four counties, Cherokee, Henderson, Hertford, and Union each had data from 2005. In order to have all count data in the same year, a growth rate of 3% was applied to the Cabarrus and Rowan county volumes. The percentage used is based upon current growth rates used in typical traffic analyses in the corporate setting.
After applying the growth rate, each county had AADT for the year 2005. For Cabarrus County, the AADT for US Hwy 29 became 30,000 vehicles per day (vpd) and for Pitt School Road the volume became 9000 vpd. The counts for Rowan County became 9000 vpd for NC Hwy 152 and 4500 vpd for Old Concord Road [6].
In Henderson County, NC Hwy 280 had an AADT of 13,000 vpd. The traffic volumes for Cherokee County revealed an AADT of 8000 vpd on US Hwy 19-74-129 and about 1300 vpd for Locust Street. Hertford County had traffic volumes of 5000 vpd on US Hwy 158 and 4000 vpd on US Hwy 258. The last 2005 data, used for Union County, showed an AADT of 21,000 vpd on US Hwy 74 [6]. The AADT maps can be seen in Appendix G. Table 7 summarizes the suitable intersections by traffic volume and location.
Table 7. Suitable Intersection Summary
Intersection Location Terrain AADT (vpd)
NC Hwy 280 & Forge Mountain Road Mountains Mountainous 13,000
US Hwy 19-74-129 & Locust Street Mountains Mountainous 8,000
NC Hwy 152 & Old Concord Road Piedmont Rolling 9,000
US Hwy 29 & Pitt School Road Piedmont Rolling 30,000
US Hwy 74 & Forest Hills School Road Piedmont Rolling 21,000
US Hwy 158 & US Hwy 258 Eastern Level 5,000
Operation and Maintenance costs were also gathered for a typical four-legged
signalized intersection. These costs included annual utility costs, signal cabinet replacement in year ten, and annual maintenance costs. The annual maintenance costs consist of preventative maintenance and emergency calls.
After the data was gathered, a benefit/cost analysis was performed to determine the best intersection design for each suitable intersection found in North Carolina.
Each suitable intersection was compared to the cost estimates for the intersection types provided by NCDOT. Some adjustments of the numbers were needed because each cost estimate was slightly different. Some of the estimates were evaluating the conversion of existing grade separation to an intersection type. Others evaluated converting an existing at-grade intersection to one of the non-traditional intersection types. One intersection type, the Continuous Flow, was evaluated assuming a new location (Appendix F). For consistency, each suitable intersection location, beginning with the mountainous intersections, will be evaluated by comparing the costs of the different intersection types for the area. The first mountainous intersection evaluated, NC Hwy 280 and Forge Mountain Road, services 13,000 vpd. The Continuous Flow cost estimate needed to be adjusted for this location. Because the construction estimate assumed a new site, adjustments were made to the cost of excavation and clearing and grubbing. Since this intersection is an

38
existing location already at-grade, the estimated cost was reduced by about $660 thousand, making the construction cost about $8.1 million. The next intersection type needing cost adjustment for this location is the CTO. This cost estimate is listed as converting an existing at-grade intersection to a CTO, but because the intersection is in the mountains, the cost of creating a grade separation would be lower because the minor approaches are already elevated. The cost of the earthwork and abutments is reduced by about half, approximately $550,000, and this makes the construction cost about $9.4 million. There would also be a cost reduction in the conversion to an Echelon intersection. The provided cost estimate is for converting an at-grade intersection to an Echelon. Once again, with this intersection being in the mountains, the grade separation would be less expensive. The cost of earthwork decreases by about $98,000 making the final construction cost around $11.8 million. A cost adjustment for the Median U-turn is unnecessary because the estimate is based upon converting an existing at-grade intersection. The construction cost estimate would remain at $1.2 million. There would be a slight cost adjustment to the estimate given for the Michigan Diamond. The estimate is based upon converting a grade separated intersection to a Michigan Diamond. The intersection of NC Hwy 280 and Forge Mountain Road is not grade separated; however, the minor roadway is elevated. The reduction in the earthwork costs would be about half of the given estimate. This would reduce the cost by almost $385,000, making the estimated construction cost at $20.2 million. For the next intersection type, the Quadrant, there would be no adjustment in the cost because the estimate is based upon converting an existing at-grade intersection. This would leave the approximate cost of construction at $2.1 million. There would be an adjustment on the estimate for a SPUI at this location. The given cost estimate is based upon converting an existing grade separated intersection. This would cause a reduction in the cost of excavation and the ramps. The price would be reduced by about $1.2 million, making the final cost around $17.0 million.
The next intersection to be evaluated was US Hwy 19-74-129 and Locust Street. This intersection has about 8,000 vpd and is also in the mountains. The costs would be the same as those for the intersection of NC Hwy 280 & Forge Mountain Road because of the similar terrain.
The intersections in the Piedmont, or rolling terrain, were then evaluated together. As noted previously, the intersection of NC Hwy 152 and Old Concord Road has about 9,000 vpd. The intersection of US Hwy 29 and Pitt School Road has about 30,000 vpd and the intersection of US Hwy 74 and Forest Hills School Road has about 21,000 vpd. The estimate provided for the Continuous Flow intersection type is assuming a new location. There would be some adjustment in the excavating costs by about $380 thousand making the final construction estimate $8.4 million for all rolling terrain locations.
The cost estimates for the CTO, Echelon, and Median U-turn would remain as they were provided. All three were based upon converting an existing at-grade intersection into each specific type. This keeps the costs for the CTO, Echelon, and Median U-turn at $10.1 million, $12.0 million, and $1.2 million, respectively.
There would need to be adjustments made to the construction cost estimate for the Michigan Diamond. The existing estimate is for converting an existing grade separated

39
intersection. The intersections in the rolling terrain are not grade separated. Because they are in such terrain, the cost reduction would be about $256,000, a 1/3 reduction in the cost given for earthwork. This lowers the final estimate to $20.3 million.
There was no cost reduction for the Quadrant intersection as the estimate was for converting existing at-grade intersections. This leaves the costs at $2.1 million for the Quadrant. The cost estimate for constructing a SPUI at these locations would be adjusted. The price of excavation and ramps would be reduced by $510,000, a 1/3 reduction in the costs, bringing the total estimated cost to around $17.8 million.
The last intersection evaluated for construction costs, on level terrain, was US Hwy 158 and US Hwy 258 in Hertford County. This intersection sees about 5,000 vpd. Once again, the cost estimate for the Continuous Flow intersection type was assuming a new location. There was a reduction in the cost of excavation of approximately $380 thousand. This particular intersection already has such a wide median giving it more right-of-way so there would not be as much to excavate. The new total to build a Continuous Flow intersection at this location is approximately $8.4 million. The cost estimates given for the CTO, Median U-turn, and Quadrant would remain as given. Each are priced assuming a conversion of an existing at-grade intersection like this one. The construction cost for a CTO would be about $10.1 million, an Echelon around $12.0 million, a Median u-turn around or near $1.2 million, and a Quadrant almost $2.1 million.
The Michigan Diamond cost estimate is assuming an existing grade separation. There would be double the cost of earthwork and structures, around $3.8 million to be implemented at this level, at-grade location. This brings the construction cost to almost $25.0 million. The same cost doubling would occur for the SPUI, raising the cost for excavation and ramps to almost $4.7 million, and bringing the estimated construction cost to around $21.2 million. Table 8 summarizes the final estimated construction costs.
Table 8. Final Construction Cost Estimates
Intersection Type Cost (Million $)
Continuous Flow 8.1 8.1 8.4 8.4 8.4 8.4
CTO 9.4 9.4 10.1 10.1 10.1 10.1
Echelon 11.8 11.8 12.0 12.0 12.0 12.0
Median U-turn 1.2 1.2 1.2 1.2 1.2 1.2
Michigan Diamond 20.2 20.2 20.3 20.3 20.3 25.0
Quadrant 2.1 2.1 2.1 2.1 2.1 2.1
SPUI 17.0 17.0 17.8 17.8 17.8 21.2
NC
Hw
y 2
80 &
Fo
rge
Mo
un
tain
Ro
ad
US
Hw
y 1
9-7
4-1
29
&
Lo
cu
st
Str
eet
NC
Hw
y 1
52 &
Old
Co
nco
rd R
oad
US
Hw
y 2
9 &
P
itt
Sch
oo
l R
oad
US
Hw
y 7
4 &
Fo
rest
Hills
Sch
oo
l R
oad
US
Hw
y 1
58
& U
S H
wy
258

40
The unique characteristics of each suitable intersection could, of course, affect the overall cost of construction for any of the designs presented. These cost estimates were based upon NCDOT provided estimates and any adjustments to the costs were based upon general assumptions of the research committee.
To effectively compare the benefit/cost ratios of the suitable intersections with those of the unconventional design, it was necessary to determine the operations and maintenance costs of an intersection and factor them with construction costs. The operations and maintenance costs were gathered from NCDOT personnel. They included annual utilities costs of $600 per year. The costs of preventative maintenance and routine or emergency repairs was approximately $2,000 per year. Also included in the given operations and maintenance costs were replacement signal cabinet costs; about $12,000 every ten years. NCDOT also stated that the typical life of an intersection was 20 years.
After the operations and maintenance costs were finalized, it was necessary to determine the cost of delay for each suitable intersection and intersection type. The delay, found in the SYNCHRO output files, was multiplied by $15/vehicle/hour [9]. The cost of delay was determined by the research committee to be reasonable. This estimate was also based upon the assumption of one occupant per vehicle. The delay for each suitable intersection was found and multiplied by the factor. Then, the delay for each intersection type at the corresponding maximum volume was found and multiplied by the cost. A summary of the costs for each intersection and each intersection type at the corresponding volumes can be seen in Table 9.
Table 9. Delay Costs
Intersection Delay Cost ($/hr)
NC Hwy 280 & Forge Mountain Road 1515.6 411.1 315.0 473.0 215.7 161.8 250.4 263.0
US Hwy 19-74-129 & Locust Street 1400.7 782.3 531.8 882.5 266.4 178.5 294.8 513.4
NC Hwy 152 & Old Concord Road 738.3 177.7 107.5 125.2 114.3 73.8 100.8 98.4
US Hwy 29 & Pitt School Road 1677.5 782.3 531.8 882.5 266.4 178.5 294.8 513.4
US Hwy 74 & Forest Hills School Road 997.6 295.8 216.7 297.6 175.4 137.6 182.3 203.5
US Hwy 158 & US Hwy 258 1300.8 782.3 531.8 882.5 266.4 178.5 294.8 513.4
Exis
tin
g
Continu
ous
Flo
w
CT
O
Echelo
n
Med
ian
U-t
urn
Mic
hig
an
Dia
mon
d
Quadra
nt
SP
UI
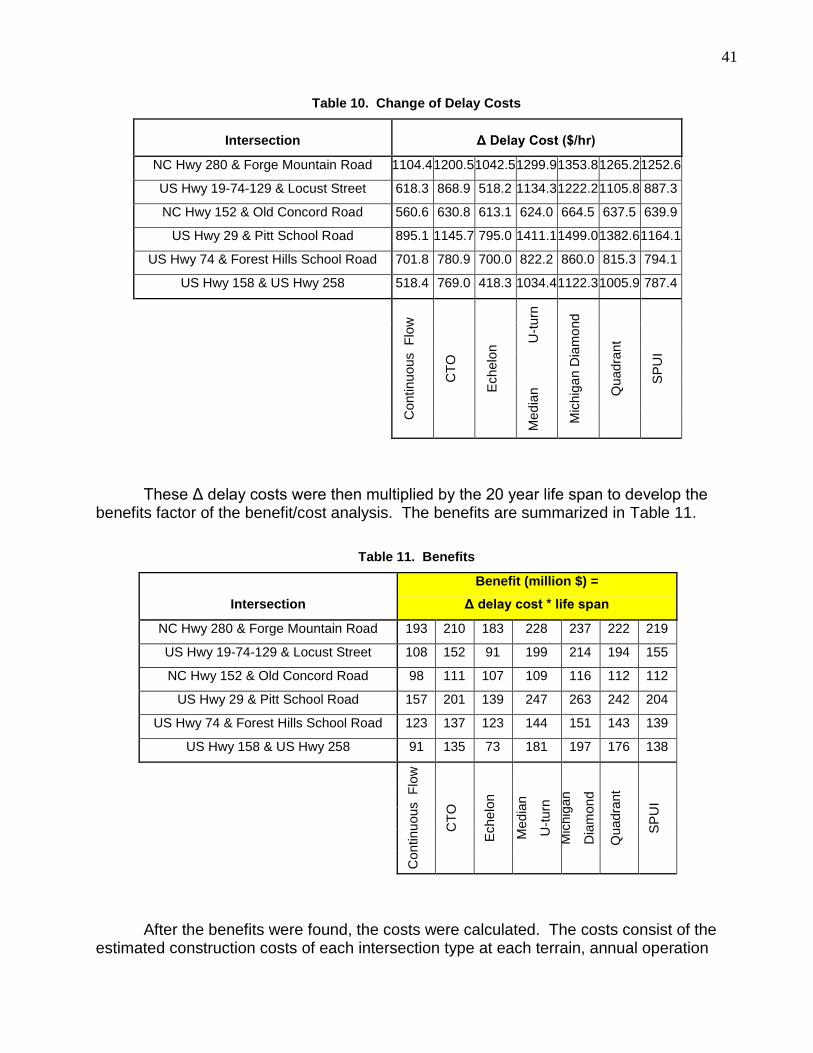
After the cost of delay was found, the next step was to determine the change of (Δ)
delay. This was done by subtracting the costs of delay of each intersection type from the existing delay cost of each intersection. For example, the Δ delay for NC Hwy 280 & Forge Mountain Road and the Continuous Flow was $1104.4/hour ($1515.6-$411.1). The Δ delays for each intersection versus intersection type are summarized in Table 10.
41
Table 10. Change of Delay Costs
Intersection Δ Delay Cost ($/hr)
NC Hwy 280 & Forge Mountain Road 1104.4 1200.5 1042.5 1299.9 1353.8 1265.2 1252.6
US Hwy 19-74-129 & Locust Street 618.3 868.9 518.2 1134.3 1222.2 1105.8 887.3
NC Hwy 152 & Old Concord Road 560.6 630.8 613.1 624.0 664.5 637.5 639.9
US Hwy 29 & Pitt School Road 895.1 1145.7 795.0 1411.1 1499.0 1382.6 1164.1
US Hwy 74 & Forest Hills School Road 701.8 780.9 700.0 822.2 860.0 815.3 794.1
US Hwy 158 & US Hwy 258 518.4 769.0 418.3 1034.4 1122.3 1005.9 787.4
Continu
ous F
low
CT
O
Echelo
n
Med
ian
U
-turn
Mic
hig
an D
iam
ond
Quadra
nt
SP
UI
These Δ delay costs were then multiplied by the 20 year life span to develop the
benefits factor of the benefit/cost analysis. The benefits are summarized in Table 11.
Table 11. Benefits
Intersection
Benefit (million $) =
Δ delay cost * life span
NC Hwy 280 & Forge Mountain Road 193 210 183 228 237 222 219
US Hwy 19-74-129 & Locust Street 108 152 91 199 214 194 155
NC Hwy 152 & Old Concord Road 98 111 107 109 116 112 112
US Hwy 29 & Pitt School Road 157 201 139 247 263 242 204
US Hwy 74 & Forest Hills School Road 123 137 123 144 151 143 139
US Hwy 158 & US Hwy 258 91 135 73 181 197 176 138
Continu
ous F
low
CT
O
Echelo
n
Med
ian
U-t
urn
Mic
hig
an
Dia
mon
d
Quadra
nt
SP
UI
After the benefits were found, the costs were calculated. The costs consist of the
estimated construction costs of each intersection type at each terrain, annual operation

42
and maintenance costs of $2,600/year times the life span of 20 years, and the signal box replacement costs of $24,000 ($12,000 every ten years). A summary of the costs are displayed in Table 12.
Table 12. Costs
Intersection
Cost (million $) = initial cost + Other O&M +
O&M*life span
NC Hwy 280 & Forge Mountain Road 8.176 9.476 12.33 1.771 20.7 2.716 17.64
US Hwy 19-74-129 & Locust Street 8.176 9.476 12.11 1.62 20.46 2.641 17.58
NC Hwy 152 & Old Concord Road 8.476 10.18 12.28 1.511 20.6 2.408 18.13
US Hwy 29 & Pitt School Road 8.476 10.18 12.43 1.746 20.69 2.767 18.51
US Hwy 74 & Forest Hills School Road 8.476 10.18 12.34 1.58 20.64 2.499 18.22
US Hwy 158 & US Hwy 258 8.476 10.18 12.26 1.574 25.21 2.595 21.74
Continu
ous F
low
CT
O
Echelo
n
Med
ian
U-t
urn
Mic
hig
an D
iam
ond
Quadra
nt
SP
UI
Next, the benefit/cost analysis was performed by dividing the benefits by the costs.
The higher costs of the Quadrant, Michigan Diamond, and Median U-turn designs, which are three closely spaced and coordinated signalized intersections compared to essentially one intersection makes separating these designs into a separated table for reference purposes. Table 13 shows the benefit–cost ratios for the single intersection designs. Table 13A shows the benefit-cost ratios for the three intersection designs.
Table 13. Benefit/Cost Ratios, Grade Separated Design
Intersection B/C ratio
NC Hwy 280 & Forge Mountain Road 11.5 22.2 14.8
12.4
US Hwy 19-74-129 & Locust Street 10.5 16.1 7.5 8.8
NC Hwy 152 & Old Concord Road 5.7 10.9 8.7 6.2
US Hwy 29 & Pitt School Road 12.7 19.7 11.2 11.0
US Hwy 74 & Forest Hills School Road 7.3 13.4 9.9 7.6
US Hwy 158 & US Hwy 258 7.8 13.2 6.0 6.3
Mic
hig
an
Dia
mon
d
CT
O
Echelo
n
SP
UI

43
Table 13A. Benefit/Cost Ratios, At-Grade Design
Intersection B/C ratio
NC Hwy 280 & Forge Mountain Road
128.6 23.6 81.6
US Hwy 19-74-129 & Locust Street 122.7 13.2 73.4
NC Hwy 152 & Old Concord Road 72.3 11.56 46.4
US Hwy 29 & Pitt School Road 141.6 18.52 87.6
US Hwy 74 & Forest Hills School Road 91.2 14.51 57.2
US Hwy 158 & US Hwy 258 115.1 10.74 67.9
Med
ian
U-t
urn
Mic
hig
an D
iam
ond
Quadra
nt
Based on the characteristics of the location, predicted volumes, and
construction costs, recommended treatments for the North Carolina locations are shown in table 14.
Table 14. Intersection Recommendations
Intersection Recommended Intersection Type(s)
NC Hwy 280 & Forge Mountain Road Median U-turn
US Hwy 19-74-129 & Locust Street Median U-turn
NC Hwy 152 & Old Concord Road Median U-turn, Quadrant
US Hwy 29 & Pitt School Road Michigan Diamond
US Hwy 74 & Forest Hills School Road Continuous Flow
US Hwy 158 & US Hwy 258 Median U-turn

44
Findings and Conclusions
A total of 64 intersection models were created using the SYNCHRO software. Eight intersection designs were modeled having eight different traffic volume scenarios. As stated earlier, the following measures of effectiveness were noted for each model: intersection delay, LOS, ICU %, and ICU LOS. A table was created for each scenario. The measures of effectiveness of each intersection design were placed into these tables. Appendices A through H show more detailed information about the intersection designs. Each design was modeled using a speed of 45 mph and 55 mph in order to determine if speed was a factor that affects the measures of effectiveness. The intersections were then evaluated in order to determine which designs worked well for each scenario. As stated before, each unconventional intersection design was modeled using SYNCHRO. Figure 10 through Figure 17 show screen captions of the eight intersection designs as modeled using the SYNCHRO software. Unsignalized intersections are marked with a black dot. Signalized intersections are marked with a white dot.
Figure 10 – Typical Intersection
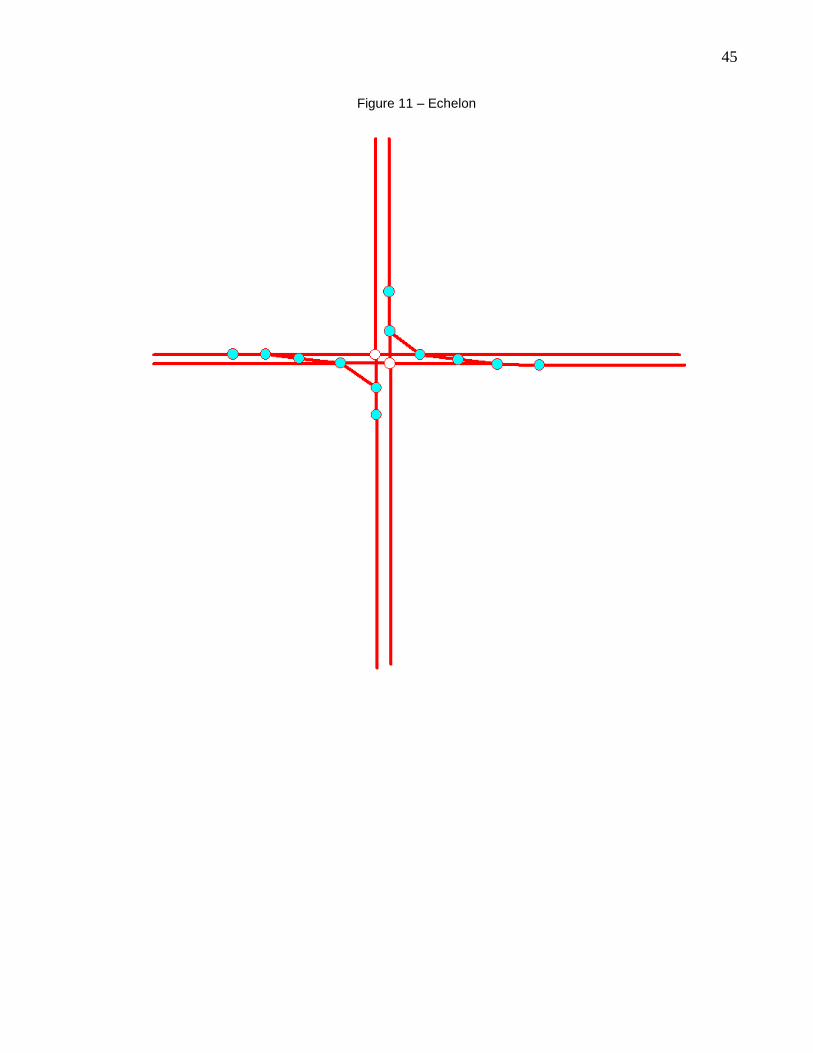
45
Figure 11 – Echelon

46
Figure 12 – Single Point Urban Interchange
Figure 13 – Tight Diamond

47
Figure 14 – Center Turn
Figure 15 – Quadrant

48
Figure 16 – Median U-Turn
Figure 17 – Michigan Urban Diamond
Some of the unconventional intersection designs consisted of more than one intersection. Therefore, it would not have been fair to analyze all of the intersections together. The unconventional intersection designs that consisted of three different intersections were evaluated as a group. These intersection designs were the following: Center Turn, Quadrant, Median U-Turn, and Michigan Urban Diamond. The remaining intersections, which consisted of only one distinct intersection, were evaluated as another group. SCENARIO 1 Scenario 1 was used as the base condition. The major approach had high through volumes with low turn volumes. The minor approach had low volumes when compared to

49
the major approach. These volumes were chose in order to simulate the intersection of an arterial and a cross-street. The volumes form each approach can be seen in Table 15.
Table 15 – Scenario 1 Volumes
Approach Left Turns (veh/hr) Through (veh/hr) Right Turns (veh/hr)
Northbound (Major)
140 1200 140
Southbound (Major)
140 1200 140
Eastbound (Minor)
50 400 50
Westbound (Minor)
50 400 50
The Echelon and Single Point Urban Interchange operated best in Scenario 1
among the one intersection models. The Echelon had a LOS B with a very low delay time. The ICU LOS was B. The Single Point Urban Interchange had a LOS B with a slightly higher delay time. The ICU LOS was A. Both designs had a considerable amount of unused capacity.
The Median U-Turn and the Michigan Urban Diamond had the best measures of effectiveness in Scenario 1. The Michigan Urban Diamond worked best. It had a LOS A and an ICU LOS A at all intersections. The Median U-Turn had a LOS A at all intersections. However, the ICU LOS was worse at all intersections. The Median U-Turn design was operating close to capacity. Table 16 and Table 17 summarize the Scenario 1measures of effectiveness for the designs with one intersection and more than one intersection, respectively.
Table 16 – Scenario 1 Measures of Effectiveness
Design Measure of
Effectiveness Primary
Intersection
Typical
Delay (s) 25.1
LOS C
ICU % 81.7
ICU LOS D
Echelon
Delay (s) 13.7
LOS B
ICU % 60.9
ICU LOS B
Single Point Urban
Interchange
Delay (s) 19.5
LOS B
ICU % 46.7
ICU LOS A
Tight Diamond
Delay (s) 22.2
LOS C
ICU % 55.4
ICU LOS B

50
Table 17 – Scenario 1 Measures of Effectiveness
Design Measure of
Effectiveness Primary
Intersection Secondary
Intersection Secondary
Intersection
Center Turn
Overpass
Delay (s) 17.9 12.3 7.8
LOS B B A
ICU % 65.4 17.3 65.4
ICU LOS C A C
Quadrant
Delay (s) 18.0 8.2 8.0
LOS B A A
ICU % 72.1 44.8 60.1
ICU LOS C A C
Median U-Turn
Delay (s) 9.4 9.6 9.6
LOS A A A
ICU % 66.1 83.5 83.7
ICU LOS C E E
Michigan Urban
Diamond
Delay (s) 6.0 3.7 3.7
LOS A A A
ICU % 45.1 37.2 37.4
ICU LOS A A A
SCENARIO 2 Scenario 2 used the same volumes as Scenario 1 and added left turn volumes from to the major approach. The volumes from each approach can be seen in Table 18.
Table 18 – Scenario 2 Volumes
Approach Left Turns (veh/hr) Through (veh/hr) Right Turns (veh/hr)
Northbound (Major)
280 1200 140
Southbound (Major)
280 1200 140
Eastbound (Minor)
50 400 50
Westbound (Minor)
50 400 50
The Echelon and Tight Diamond operated best in Scenario 2 among the one
intersection models. The Echelon had a LOS B with a very low delay time. The ICU LOS was B. The Tight Diamond had a LOS B with a higher delay time. The ICU LOS was B. Both designs had a considerable amount of unused capacity.
The Center Turn and the Michigan Urban Diamond operated well in the Scenario 2 condition. The Michigan Urban Diamond worked best. It had a LOS A and an ICU LOS A at all intersections. The Center Turn had a LOS B at all intersections. These intersections were operating at very short delay times, almost LOS A. The intersections were also operating at an ICU LOS C or above. Therefore, all movements had capacity for 20% more volume [14]. Table 19 and Table 20 summarize the Scenario 2 measures of

51
effectiveness for the designs with one intersection and more than one intersection, respectively.
Table 19 – Scenario 2 Measures of Effectiveness
Design Measure of
Effectiveness Primary
Intersection
Typical
Delay (s) 23.9
LOS C
ICU % 81.9
ICU LOS D
Echelon
Delay (s) 13.5
LOS B
ICU % 60.9
ICU LOS B
Single Point Urban
Interchange
Delay (s) 21.0
LOS C
ICU % 50.7
ICU LOS A
Tight Diamond
Delay (s) 18.9
LOS B
ICU % 55.4
ICU LOS B
Table 20 – Scenario 2 Measures of Effectiveness
Design Measure of
Effectiveness Primary
Intersection Secondary
Intersection Secondary
Intersection
Center Turn
Overpass
Delay (s) 13.7 13.5 9.4
LOS B B A
ICU % 65.4 24.5 65.4
ICU LOS C A C
Quadrant
Delay (s) 30.0 12.2 34.9
LOS C B C
ICU % 83.4 52.5 72.3
ICU LOS E A C
Median U-Turn
Delay (s) 9.9 14.9 14.9
LOS A B B
ICU % 70.0 87.4 95.3
ICU LOS C E F
Michigan Urban
Diamond
Delay (s) 7.5 6.0 6.0
LOS A A A
ICU % 53.7 52.3 60.3
ICU LOS A A B
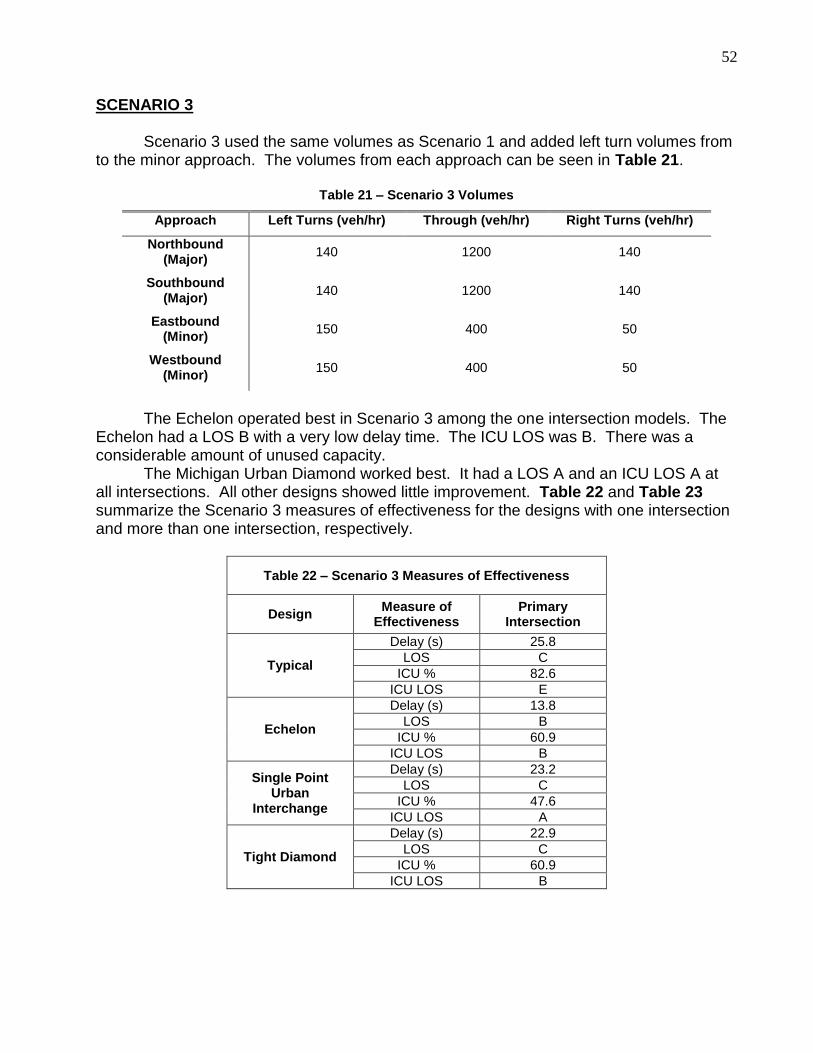
52
SCENARIO 3 Scenario 3 used the same volumes as Scenario 1 and added left turn volumes from to the minor approach. The volumes from each approach can be seen in Table 21.
Table 21 – Scenario 3 Volumes
Approach Left Turns (veh/hr) Through (veh/hr) Right Turns (veh/hr)
Northbound (Major)
140 1200 140
Southbound (Major)
140 1200 140
Eastbound (Minor)
150 400 50
Westbound (Minor)
150 400 50
The Echelon operated best in Scenario 3 among the one intersection models. The
Echelon had a LOS B with a very low delay time. The ICU LOS was B. There was a considerable amount of unused capacity.
The Michigan Urban Diamond worked best. It had a LOS A and an ICU LOS A at all intersections. All other designs showed little improvement. Table 22 and Table 23 summarize the Scenario 3 measures of effectiveness for the designs with one intersection and more than one intersection, respectively.
Table 22 – Scenario 3 Measures of Effectiveness
Design Measure of
Effectiveness Primary
Intersection
Typical
Delay (s) 25.8
LOS C
ICU % 82.6
ICU LOS E
Echelon
Delay (s) 13.8
LOS B
ICU % 60.9
ICU LOS B
Single Point Urban
Interchange
Delay (s) 23.2
LOS C
ICU % 47.6
ICU LOS A
Tight Diamond
Delay (s) 22.9
LOS C
ICU % 60.9
ICU LOS B

53
Table 23 – Scenario 3 Measures of Effectiveness
Design Measure of
Effectiveness Primary
Intersection Secondary
Intersection Secondary
Intersection
Center Turn
Overpass
Delay (s) 13.7 11.2 9.4
LOS B B A
ICU % 65.4 21.7 65.4
ICU LOS C A C
Quadrant
Delay (s) 19.9 7.7 9.4
LOS B A A
ICU % 72.9 49.8 61.0
ICU LOS C A B
Median U-Turn
Delay (s) 9.7 16.6 16.6
LOS A B B
ICU % 68.9 86.3 92.0
ICU LOS C E F
Michigan Urban
Diamond
Delay (s) 6.4 4.1 4.1
LOS A A A
ICU % 45.1 48.0 53.7
ICU LOS A A A
SCENARIO 4 Scenario 4 used the same volumes as Scenario 1 and added left turn volumes from both the major and minor approaches. The volumes from each approach can be seen in Table 24.
Table 24 – Scenario 4 Volumes
Approach Left Turns (veh/hr) Through (veh/hr) Right Turns (veh/hr)
Northbound (Major)
280 1200 140
Southbound (Major)
280 1200 140
Eastbound (Minor)
150 400 50
Westbound (Minor)
150 400 50
The Echelon operated best in Scenario 4 among the one intersection models. The
Echelon had a LOS B with a very low delay time. The ICU LOS was B. There was a considerable amount of unused capacity.
The Center Turn and the Michigan Urban Diamond operated best in this scenario. The Michigan Urban Diamond worked best. It had a LOS A and an ICU LOS A at all intersections. The primary intersection of the Center Turn design had a LOS B, but its delay time was very low. It was operating close to a LOS A. One of the secondary intersections was also operating at a LOS B with a low delay time. The other secondary
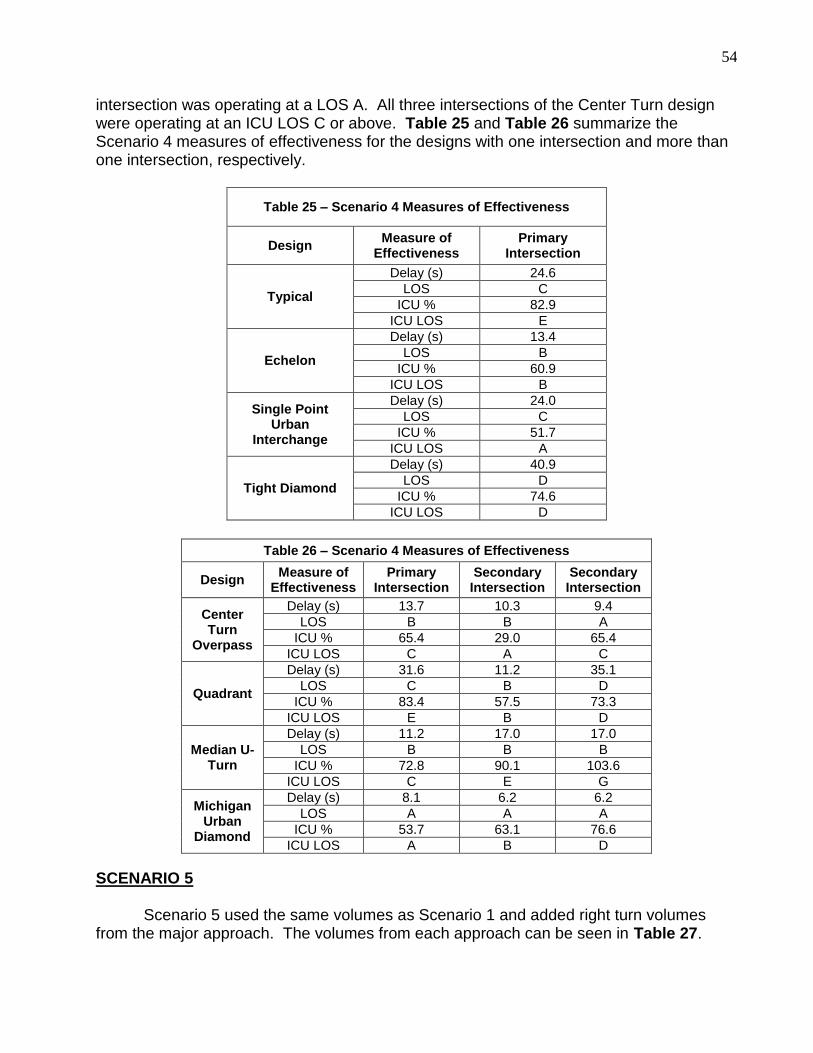
54
intersection was operating at a LOS A. All three intersections of the Center Turn design were operating at an ICU LOS C or above. Table 25 and Table 26 summarize the Scenario 4 measures of effectiveness for the designs with one intersection and more than one intersection, respectively.
Table 25 – Scenario 4 Measures of Effectiveness
Design Measure of
Effectiveness Primary
Intersection
Typical
Delay (s) 24.6
LOS C
ICU % 82.9
ICU LOS E
Echelon
Delay (s) 13.4
LOS B
ICU % 60.9
ICU LOS B
Single Point Urban
Interchange
Delay (s) 24.0
LOS C
ICU % 51.7
ICU LOS A
Tight Diamond
Delay (s) 40.9
LOS D
ICU % 74.6
ICU LOS D
Table 26 – Scenario 4 Measures of Effectiveness
Design Measure of
Effectiveness Primary
Intersection Secondary
Intersection Secondary
Intersection
Center Turn
Overpass
Delay (s) 13.7 10.3 9.4
LOS B B A
ICU % 65.4 29.0 65.4
ICU LOS C A C
Quadrant
Delay (s) 31.6 11.2 35.1
LOS C B D
ICU % 83.4 57.5 73.3
ICU LOS E B D
Median U-Turn
Delay (s) 11.2 17.0 17.0
LOS B B B
ICU % 72.8 90.1 103.6
ICU LOS C E G
Michigan Urban
Diamond
Delay (s) 8.1 6.2 6.2
LOS A A A
ICU % 53.7 63.1 76.6
ICU LOS A B D
SCENARIO 5 Scenario 5 used the same volumes as Scenario 1 and added right turn volumes from the major approach. The volumes from each approach can be seen in Table 27.

55
Table 27 – Scenario 5 Volumes
Approach Left Turns (veh/hr) Through (veh/hr) Right Turns (veh/hr)
Northbound (Major)
140 1200 280
Southbound (Major)
140 1200 280
Eastbound (Minor)
50 400 50
Westbound (Minor)
50 400 50
The Echelon and Single Point Urban Interchange operated best in Scenario 5
among the one intersection models. The Echelon had a LOS B with a very low delay time. The ICU LOS was B. The Single Point Urban Interchange had a LOS B with a higher delay time. The ICU LOS was A. Both designs had a considerable amount of unused capacity.
The Quadrant, Median U-Turn, and Michigan Urban Diamond operated best in this scenario. Of these three designs, the Michigan Urban Diamond operated best. It had a LOS A and an ICU LOS A at all intersections. The Median U-Turn had a LOS A at all intersections. However, the ICU % suggested that all of the intersections were operating close to capacity. The Quadrant’s primary intersection operated at a LOS B. The delay time corresponded with a median LOS B. The ICU LOS for all intersections in the Quadrant design was better than an ICU LOS C. The intersections had unused capacity on all movements. Table 28 and Table 29 summarize the Scenario 5 measures of effectiveness for the designs with one intersection and more than one intersection, respectively.
Table 28 – Scenario 5 Measures of Effectiveness
Design Measure of
Effectiveness Primary
Intersection
Typical
Delay (s) 24.1
LOS C
ICU % 81.7
ICU LOS D
Echelon
Delay (s) 13.2
LOS B
ICU % 60.9
ICU LOS B
Single Point Urban
Interchange
Delay (s) 19.5
LOS B
ICU % 46.7
ICU LOS A
Tight Diamond
Delay (s) 21.1
LOS C
ICU % 72.7
ICU LOS C

56
Table 29 – Scenario 5 Measures of Effectiveness
Design Measure of
Effectiveness Primary
Intersection Secondary
Intersection Secondary
Intersection
Center Turn
Overpass
Delay (s) 15.7 12.3 10.5
LOS B B B
ICU % 69.8 17.3 69.8
ICU LOS C A C
Quadrant
Delay (s) 17.2 8.4 8.3
LOS B A A
ICU % 72.1 50.2 60.1
ICU LOS C A B
Median U-Turn
Delay (s) 9.1 10.0 10.0
LOS A A A
ICU % 66.1 87.4 87.6
ICU LOS C E E
Michigan Urban
Diamond
Delay (s) 6.4 4.8 4.8
LOS A A A
ICU % 53.7 44.6 44.7
ICU LOS A A A
SCENARIO 6 Scenario 6 used the same volumes as Scenario 1 and added right turn volumes from the minor approach. The volumes from each approach can be seen in Table 30.
Table 30 – Scenario 6 Volumes
Approach Left Turns (veh/hr) Through (veh/hr) Right Turns (veh/hr)
Northbound (Major)
140 1200 140
Southbound (Major)
140 1200 140
Eastbound (Minor)
50 400 100
Westbound (Minor)
50 400 100
The Echelon and Single Point Urban Interchange operated best in Scenario 6
among the one intersection models. The Echelon had a LOS B with a very low delay time. The ICU LOS was B. The Single Point Urban Interchange had a LOS B with a higher delay time. The ICU LOS was A. Both designs had a considerable amount of unused capacity.
The Median U-Turn and the Michigan Urban Diamond had the best measures of effectiveness in Scenario 6. The Michigan Urban Diamond operated better than the Median U-Turn. The Michigan Urban Diamond had a LOS A and an ICU LOS A at all intersections. The Median U-Turn had a LOS B at the primary intersection. The delay time at the primary intersection was just below the boundary for a LOS A. The secondary

57
intersections had a LOS A. However, the ICU LOS was worse at all intersections. The Median U-Turn design was operating close to capacity. Table 31 and Table 32 summarize the Scenario 6 measures of effectiveness for the designs with one intersection and more than one intersection, respectively.
Table 31 – Scenario 6 Measures of Effectiveness
Design Measure of
Effectiveness Primary
Intersection
Typical
Delay (s) 22.0
LOS C
ICU % 78.6
ICU LOS D
Echelon
Delay (s) 13.7
LOS B
ICU % 60.9
ICU LOS B
Single Point Urban
Interchange
Delay (s) 19.5
LOS B
ICU % 46.7
ICU LOS A
Tight Diamond
Delay (s) 22.4
LOS C
ICU % 58.6
ICU LOS B
Table 32 – Scenario 6 Measures of Effectiveness
Design Measure of
Effectiveness Primary
Intersection Secondary
Intersection Secondary
Intersection
Center Turn
Overpass
Delay (s) 15.1 8.6 11.0
LOS B A B
ICU % 67.0 17.3 67.0
ICU LOS C A C
Quadrant
Delay (s) 18.1 9.0 8.9
LOS B A A
ICU % 72.1 47.4 61.5
ICU LOS C A B
Median U-Turn
Delay (s) 10.1 8.9 8.9
LOS B A A
ICU % 66.1 84.9 85.1
ICU LOS C E E
Michigan Urban
Diamond
Delay (s) 5.7 3.7 3.7
LOS A A A
ICU % 45.1 39.8 40.0
ICU LOS A A A
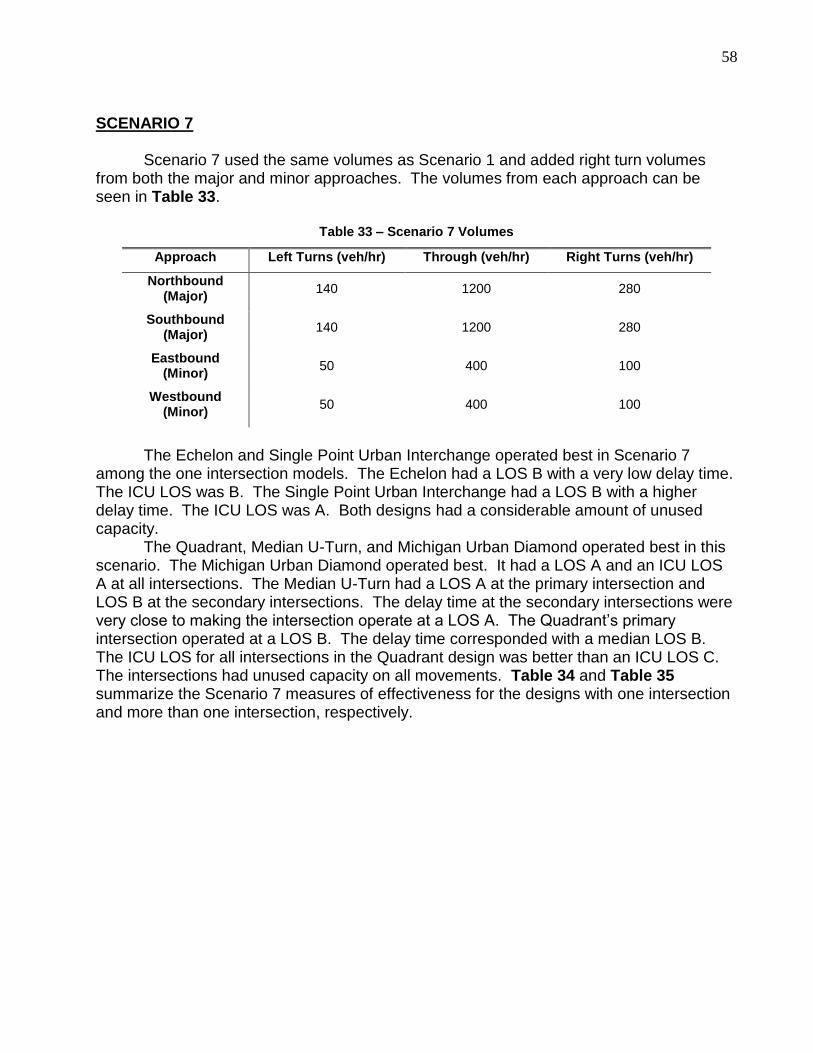
58
SCENARIO 7 Scenario 7 used the same volumes as Scenario 1 and added right turn volumes from both the major and minor approaches. The volumes from each approach can be seen in Table 33.
Table 33 – Scenario 7 Volumes
Approach Left Turns (veh/hr) Through (veh/hr) Right Turns (veh/hr)
Northbound (Major)
140 1200 280
Southbound (Major)
140 1200 280
Eastbound (Minor)
50 400 100
Westbound (Minor)
50 400 100
The Echelon and Single Point Urban Interchange operated best in Scenario 7
among the one intersection models. The Echelon had a LOS B with a very low delay time. The ICU LOS was B. The Single Point Urban Interchange had a LOS B with a higher delay time. The ICU LOS was A. Both designs had a considerable amount of unused capacity.
The Quadrant, Median U-Turn, and Michigan Urban Diamond operated best in this scenario. The Michigan Urban Diamond operated best. It had a LOS A and an ICU LOS A at all intersections. The Median U-Turn had a LOS A at the primary intersection and LOS B at the secondary intersections. The delay time at the secondary intersections were very close to making the intersection operate at a LOS A. The Quadrant’s primary intersection operated at a LOS B. The delay time corresponded with a median LOS B. The ICU LOS for all intersections in the Quadrant design was better than an ICU LOS C. The intersections had unused capacity on all movements. Table 34 and Table 35 summarize the Scenario 7 measures of effectiveness for the designs with one intersection and more than one intersection, respectively.

59
Table 34 – Scenario 7 Measures of Effectiveness
Design Measure of
Effectiveness Primary
Intersection
Typical
Delay (s) 21.2
LOS C
ICU % 78.6
ICU LOS D
Echelon
Delay (s) 13.2
LOS B
ICU % 60.9
ICU LOS B
Single Point Urban
Interchange
Delay (s) 19.5
LOS B
ICU % 46.7
ICU LOS A
Tight Diamond
Delay (s) 21.3
LOS C
ICU % 75.9
ICU LOS D
Table 35 – Scenario 8 Measures of Effectiveness
Design Measure of
Effectiveness Primary
Intersection Secondary
Intersection Secondary
Intersection
Center Turn
Overpass
Delay (s) 17.7 12.3 11.7
LOS B B B
ICU % 70.6 17.3 70.6
ICU LOS C A C
Quadrant
Delay (s) 22.3 8.5 7.3
LOS C A A
ICU % 77.4 50.0 60.1
ICU LOS D A B
Median U-Turn
Delay (s) 10.8 9.6 9.6
LOS B A A
ICU % 71.4 83.5 83.7
ICU LOS C E E
Michigan Urban
Diamond
Delay (s) 7.6 3.7 3.7
LOS A A A
ICU % 50.3 37.2 37.4
ICU LOS A A A
SCENARIO 8 Scenario 8 used the same volumes as Scenario 1 and added through volumes from the minor approach. The volumes from each approach can be seen in Table 36.

60
Table 36 – Scenario 8 Volumes
Approach Left Turns (veh/hr) Through (veh/hr) Right Turns (veh/hr)
Northbound (Major)
140 1200 140
Southbound (Major)
140 1200 140
Eastbound (Minor)
50 500 50
Westbound (Minor)
50 500 50
The Echelon operated best in Scenario 8 among the one intersection models. The
Echelon had a LOS B with a median delay time. The ICU LOS was C. There was some unused capacity.
The Median U-Turn and the Michigan Urban Diamond operated best in this scenario. The Michigan Urban Diamond operated best. It had a LOS A and an ICU LOS A at all intersections. The Median U-Turn had a LOS B at the primary intersection. The delay time at the primary intersection was very close to making the intersection operate at a LOS A. The secondary intersections operated at a LOS A. The primary intersection had some unused capacity. The secondary intersections were operating near capacity. Table 37 and Table 38 summarize the Scenario 8 measures of effectiveness for the designs with one intersection and more than one intersection, respectively.
Table 37 – Scenario 8 Measures of Effectiveness
Design Measure of
Effectiveness Primary
Intersection
Typical
Delay (s) 18.6
LOS B
ICU % 73.0
ICU LOS C
Echelon
Delay (s) 16.5
LOS B
ICU % 66.2
ICU LOS C
Single Point Urban
Interchange
Delay (s) 20.6
LOS C
ICU % 51.9
ICU LOS A
Tight Diamond
Delay (s) 28.9
LOS C
ICU % 60.9
ICU LOS B

61
Table 38 – Scenario 8 Measures of Effectiveness
Design Measure of
Effectiveness Primary
Intersection Secondary
Intersection Secondary
Intersection
Center Turn
Overpass
Delay (s) 17.7 12.3 11.7
LOS B B B
ICU % 70.6 17.3 70.6
ICU LOS C A C
Quadrant
Delay (s) 22.3 8.5 7.3
LOS C A A
ICU % 77.4 50.0 60.1
ICU LOS D A B
Median U-Turn
Delay (s) 10.8 9.6 9.6
LOS B A A
ICU % 71.4 83.5 83.7
ICU LOS C E E
Michigan Urban
Diamond
Delay (s) 7.6 3.7 3.7
LOS A A A
ICU % 50.3 37.2 37.4
ICU LOS A A A
Of the ten states chosen for questioning about alternative intersection treatments used, only six responded. Those who replied were Michigan, Texas, Illinois, Wyoming, Alabama, and Alaska. Michigan has used a variety of intersection designs throughout the state. The most popular design used is the Michigan Left or Indirect Left. Michigan also has continuous flow intersections but they are not at today’s design standards. A three-lane roundabout is also very popular. Texas mostly uses SPUIs but is in discussions about the design of a Continuous Flow and a Roundabout. Illinois reported not having any non-traditional intersections as did Wyoming. Alabama prefers the use of Jughandles and has found that these are effective when designed at an angle of 90 degrees and with a posted speed limit of 35 mph. Alaska noted that it used numerous SPUIs along with Diamond and Tight Diamond interchanges. It was also reported that one SPUI was removed by placing a roundabout at the end of each leg. The construction costs for each of the analyzed designs were calculated by personnel from NCDOT. The estimated costs are shown in table 39. Using these construction cost estimates, benefit-cost ratios were calculated for six locations in different areas of North Carolina (table 40).

62
Table 39. Final Construction Cost Estimates
Intersection Type Cost (Million $)
Continuous Flow 8.1 8.1 8.4 8.4 8.4 8.4
CTO 9.4 9.4 10.1 10.1 10.1 10.1
Echelon 11.8 11.8 12.0 12.0 12.0 12.0
Median U-turn 1.2 1.2 1.2 1.2 1.2 1.2
Michigan Diamond 20.2 20.2 20.3 20.3 20.3 25.0
Quadrant 2.1 2.1 2.1 2.1 2.1 2.1
SPUI 17.0 17.0 17.8 17.8 17.8 21.2
N
C H
wy 2
80 &
Fo
rge
Mo
un
tain
Ro
ad
US
Hw
y 1
9-7
4-1
29
&
Lo
cu
st
Str
eet
NC
Hw
y 1
52 &
Old
Co
nco
rd R
oad
US
Hw
y 2
9 &
P
itt
Sch
oo
l R
oad
US
Hw
y 7
4 &
Fo
rest
Hills
Sch
oo
l R
oad
US
Hw
y 1
58
& U
S H
wy
258
Table 40. Benefit/Cost Ratios, Grade Separated Intersection Design
Table 40A.
Intersection B/C ratio
NC Hwy 280 & Forge Mountain Road 11.5 22.2 14.8
12.4
US Hwy 19-74-129 & Locust Street 10.5 16.1 7.5 8.8
NC Hwy 152 & Old Concord Road 5.7 10.9 8.7 6.2
US Hwy 29 & Pitt School Road 12.7 19.7 11.2 11.0
US Hwy 74 & Forest Hills School Road 7.3 13.4 9.9 7.6
US Hwy 158 & US Hwy 258 7.8 13.2 6.0 6.3
Mic
hig
an D
iam
ond
CT
O
Echelo
n
SP
UI

63
Table 40A. Benefit/Cost Ratios, At-Grade Design
Intersection B/C ratio
NC Hwy 280 & Forge Mountain Road
128.6 23.6 81.6
US Hwy 19-74-129 & Locust Street 122.7 13.2 73.4
NC Hwy 152 & Old Concord Road 72.3 11.56 46.4
US Hwy 29 & Pitt School Road 141.6 18.52 87.6
US Hwy 74 & Forest Hills School Road 91.2 14.51 57.2
US Hwy 158 & US Hwy 258 115.1 10.74 67.9
Med
ian
U-t
urn
Continu
ous F
low
Quadra
nt

64
Recommendations
Several other characteristics were noted after the intersections were evaluated. The Michigan Urban Diamond had a LOS A and an ICU LOS A in all scenarios. This design grade-separates the major approach through movements from all other movements. Therefore, there was much less traffic volume going through the signalized intersections. This could account for the abnormally high LOS and ICU LOS. This design was determined to be suited for areas that see a large amount of through volume from the major approach.
The Echelon operated well in all scenarios. However, it was noted that there are many merging areas in the design. These areas were not taken into account during the analysis. Further research of these merge areas may find that the Echelon does not work well in all scenarios.
Almost all of the unconventional intersections operated better than the typical intersection. However, the typical intersection operated better than the Tight Diamond in certain scenarios. The typical intersection operated better in Scenario 2 and Scenario 4. Both of these scenarios have high left turn volumes from the major approach. The Tight Diamond did not operate well in any scenario. It worked best in Scenario 2. The delay was 18.9 s/veh at a LOS B. The ICU% was 55.4% at an ICU LOS B. The summary of the results of this study can be found in Table 41 and Table 42. The best two scenarios based on the measures of effectiveness were chosen from each design. Some intersection designs were given more than two stars. This was because some of the measures of effectiveness were exactly the same for more than one scenario. It should also be noted that speed did not affect the measures of effectiveness. For the specific locations in North Carolina, the recommended designs to use are listed in table 14. Generally, the lower cost designs are recommended at locations where traffic volumes are lower and the predicted traffic volume growth rate is relatively low. The locations where traffic volumes are higher and the traffic volume growth rate is higher, the more costly designs are recommended.
Table 41 – Summary of Designs with One Intersection
Scenario Echelon Single Point
Urban Interchange
Tight Diamond
1 X
2 X
3
4
5 X X X
6 X
7 X X
8

65
Table 42 – Summary of Designs with Three Intersections
Scenario Center Turn Quadrant Median U-Turn
Michigan Urban Diamond
1 X
2 X
3 X
4 X
5 X X
6 X
7 X X
8
Table 41 and Table 42 can be used by others as a starting point when designing a
rural intersection. The tables show which designs would most likely operate best at a rural intersection. The engineer would first find which scenario is most like the traffic volumes at the real intersection. The intersection designs with a star in that scenario would be good choices to start analyzing. The tables clearly show in which scenario the designs operate best. The traffic volume characteristics for each scenario can be found in the Analysis of Alternatives. This study shows that the Echelon design operated well where there were a large number of right turn movements from the major approach. The Single Point Urban Interchange operated best where there were high right turn movements from any approach. The Tight Diamond design operated best where there were high left or right turn movements from the major approach. The Center Turn design operated best where there were high left turn movements from any approach. The Quadrant and Median U-turn designs operated best where there were high right turn movements from the major approach. The Michigan Urban Diamond operated best where there were higher through volumes on the minor approach.
66
IMPLEMENTATION AND TECHNOLOGY TRANSFER PLAN
The information presented in this report provides a starting point for identifying
suitable intersection designs for high-speed suburban and rural intersections where a signal my already exist or where warrants support the installation of a signal. The increase in capacity and the reduction of delay, especially for the main through movement, provided by these designs make them a reasonable alternative to a traffic signal. The tables throughout the report provide information that can be used for reasonable comparison between a “standard” signalization application and the innovative designs described in the report. Much of the information used in this report to estimate costs and benefits is general in nature and does not lend itself well to some kind of standardized spreadsheet or other computer based application. The tables and data are in a format that engineers at all levels should be able to understand and apply to specific locations. There no additional training necessary for NCDOT employees to be able to use and understand this information.

67
Cited References
[1] Barbour, D. Revised median crossover guidelines. Memo. North Carolina Department of Transportation. Raleigh, NC. 2003 [2] Dixon, Karen K., John L. Hibbard, and Chris Mroczka. Public Perception of Median Treatment for Developed Urban Roads. TRB Circular E-C019: Urban Street Symposium [3] Fitzpatrick, K. & Balke, K. An Evaluation of Flush Medians and Two-way, Left-turn Lanes on Four-lane Rural Highways. Transportation Research Board. Washington, D.C. 1995. [4] Hummer, J., & Boone, J. The Travel Efficiency of Unconventional Suburban Arterial Intersection Designs. Transportation Research Board. Washington, D.C. Paper No. 95-0043. 1995.
[5] Merritt, David R. , Geometric Design Features of Single-Point Urban Interchanges. Transportation Research Record Number 1385, Highway and Facility Design, Intersection and Interchange Design 1993
[6] North Carolina Department of Transportation (NCDOT) traffic survey unit. Traffic Survey Maps. Available online at: http://www.ncdot.org/it/gis/DataDistribution/TrafficSurveyMaps/
[7] Pline, James L. , P.E. Left-turn Treatments at Intersections. National Cooperative Highway Research Program Synthesis 225, A Synthesis of Highway Practice. 1996.
[8] Qureshi, M., Spring, G., Lasod, R., & Sugathan, N. 2004. Design of single point urban interchanges. Missouri Department of Transportation. Jefferson City, MO. Report No. RDT 04-011. [9] Texas Transportation Institute, 2005 Annual Urban Mobility Report, 3135 TAMU,
College Station, Texas, 77843-3135

68
Bibliography
An Applied Technology and Traffic Analysis Program. Unconventional Arterial Intersection Design. 2004. Retrieved April 1, 2006, from http://attap.umd.edu/UAID.php American Association of State Highway and Transportation Officials. A Policy on Geometric Design of Highways and Streets (4th ed.). 2001. Washington, DC.
Bared, J.G., & Kaisar, E.I Median U-turn Design as an Alternative Treatment for Left Turns at Signalized Intersections. ITE Journal, 72 (2): 50-54. 2002. Bruce, Michael G. and Paul W. Gruner 2006. Continuous Flow Intersections. CE News Vol. 17, No.12
Henderson, S.M., & Stamatiadis, N. Use of Median U-turns to Improve Traffic Flow Along Urban Arterials. Journal of the Transportation Research Forum, 40 (2): 137-145. 2001 Hummer, J. & Reid, J. Unconventional Left-turn Alternatives for Urban and Suburban Arterials. Transportation Research Board. Circular E-C019: Urban Street Symposium. Washington, D.C. 1995 Husch, D. & Albeck, J. SYNCHRO 6 User Guide. Trafficware, Albany, CA 2004.
Kane, M.R. Signal Replacement With an Interchange. Research Proposal. University of North Carolina at Charlotte. Department of Civil Engineering. 2005.
Messer, C. J., J. A. Bonneson, S. D. Anderson, and W. F. McFarland, Single Point Urban Interchange Design and Operations Analysis. National Cooperative Highway Research Program Report 345. December 1991.
Qureshi, M., Spring, G., Lasod, R., & Sugathan, N. 2004. Design of single point urban interchanges. National Technical Information Service. Springfield, VA. Reid, J. 2004. Unconventional arterial intersection design, management and operations strategies. Parsons Brinckerhoff, New York.
Reid, J.D. 2000. Using quadrant roadways to improve arterial intersection operations. ITE Journal, 70 (6): 34-36, 43-45.

69
Appendices

70
APPENDIX A – TURN MOVEMENT COUNTS
Turn Movement Counts 1600-2578 vph
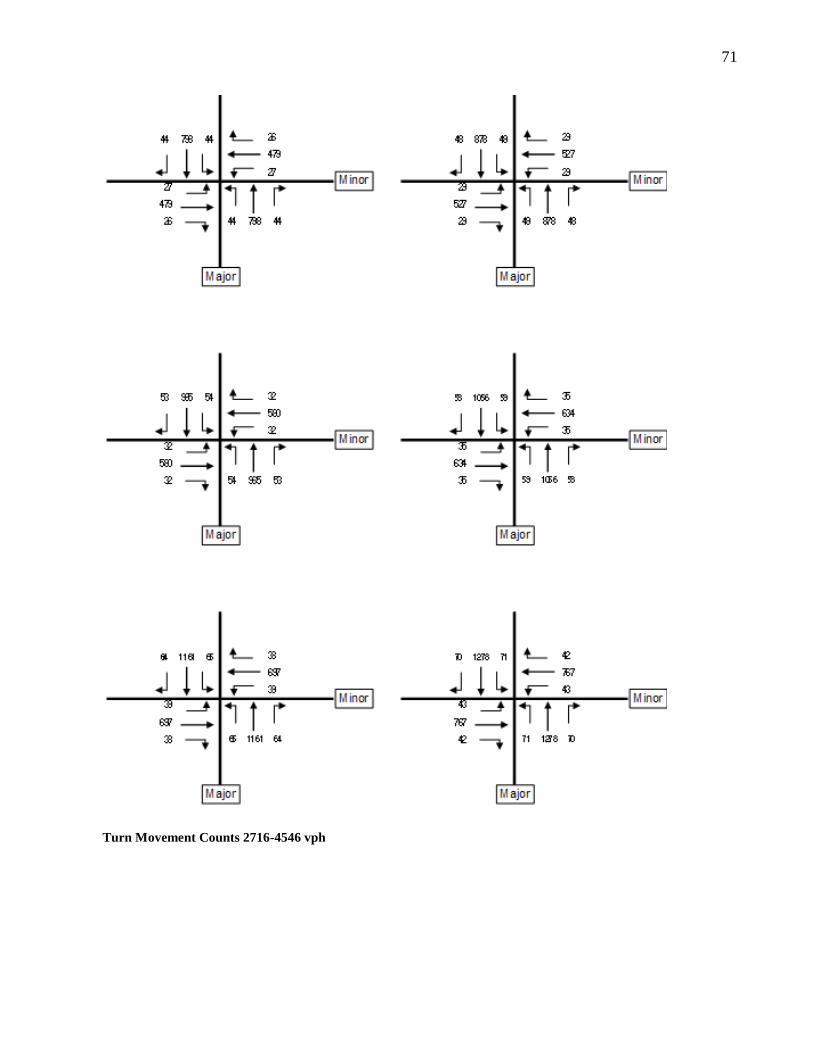
71
Turn Movement Counts 2716-4546 vph

72
Turn Movement Counts 4995 - 8047 vph
APPENDIX B – AUTOCAD DRAWINGS OF INTERSECTION TYPES
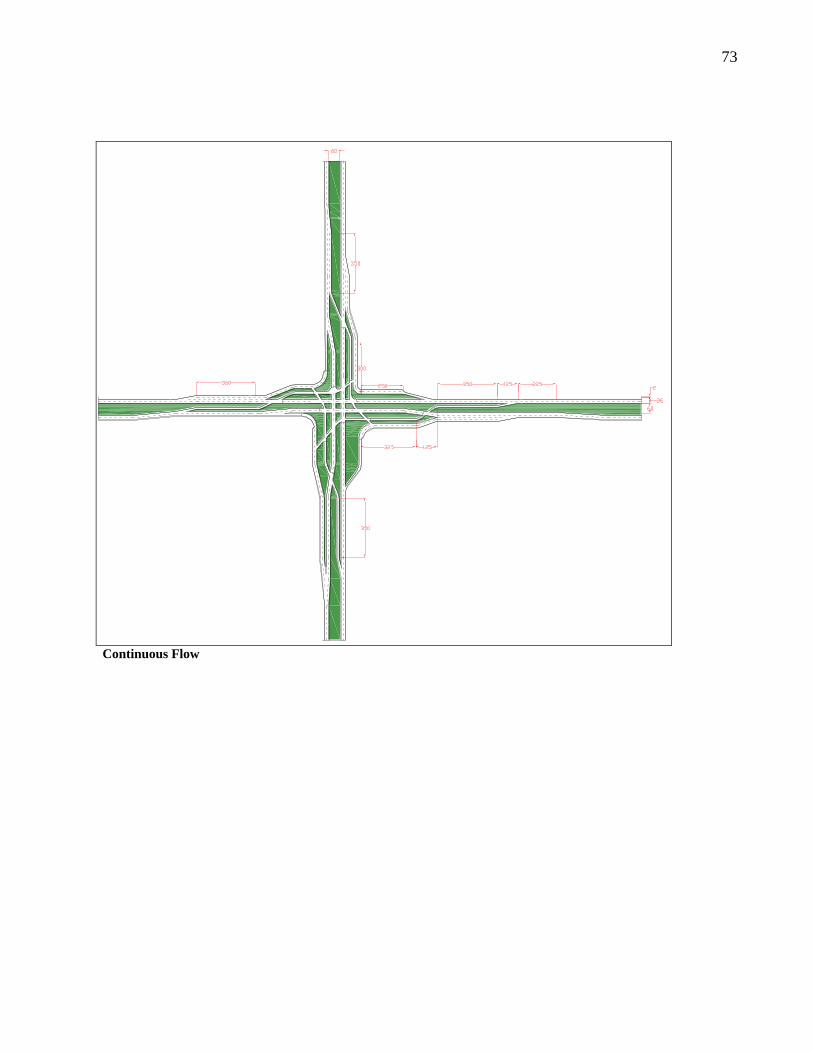
73
Continuous Flow

74
Continuous Flow Detail

75
CTO

76
CTO Detail
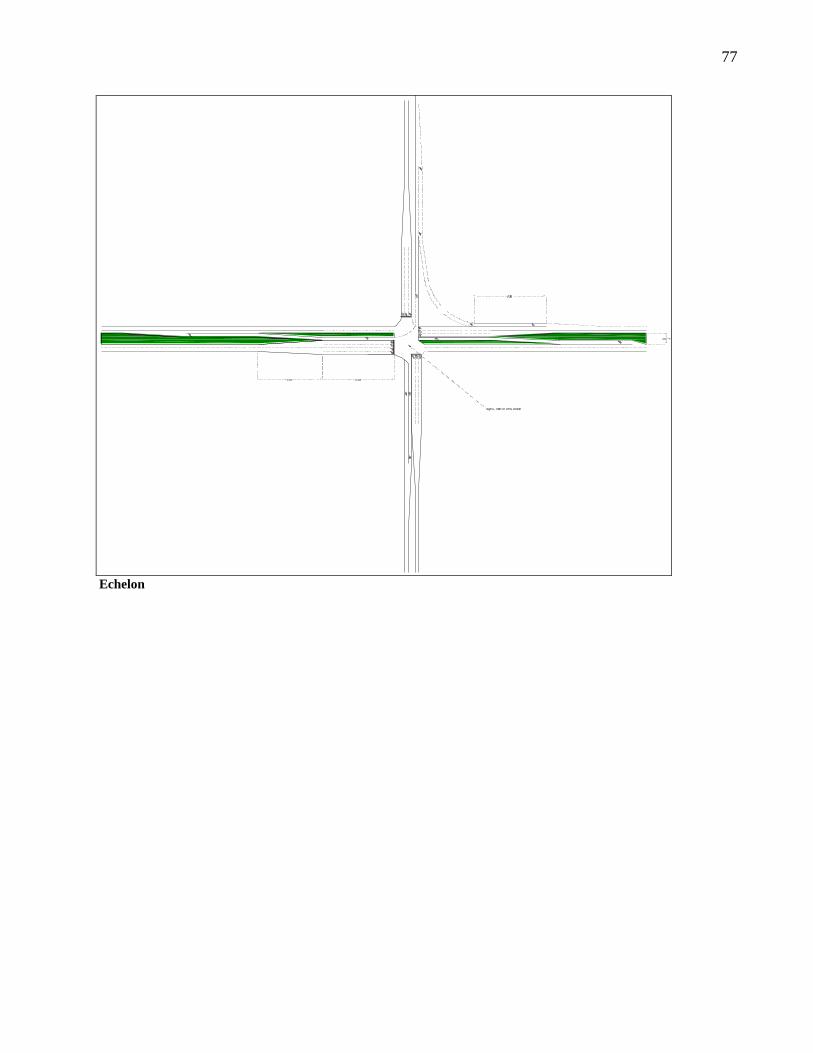
77
Echelon

78
Echelon Detail
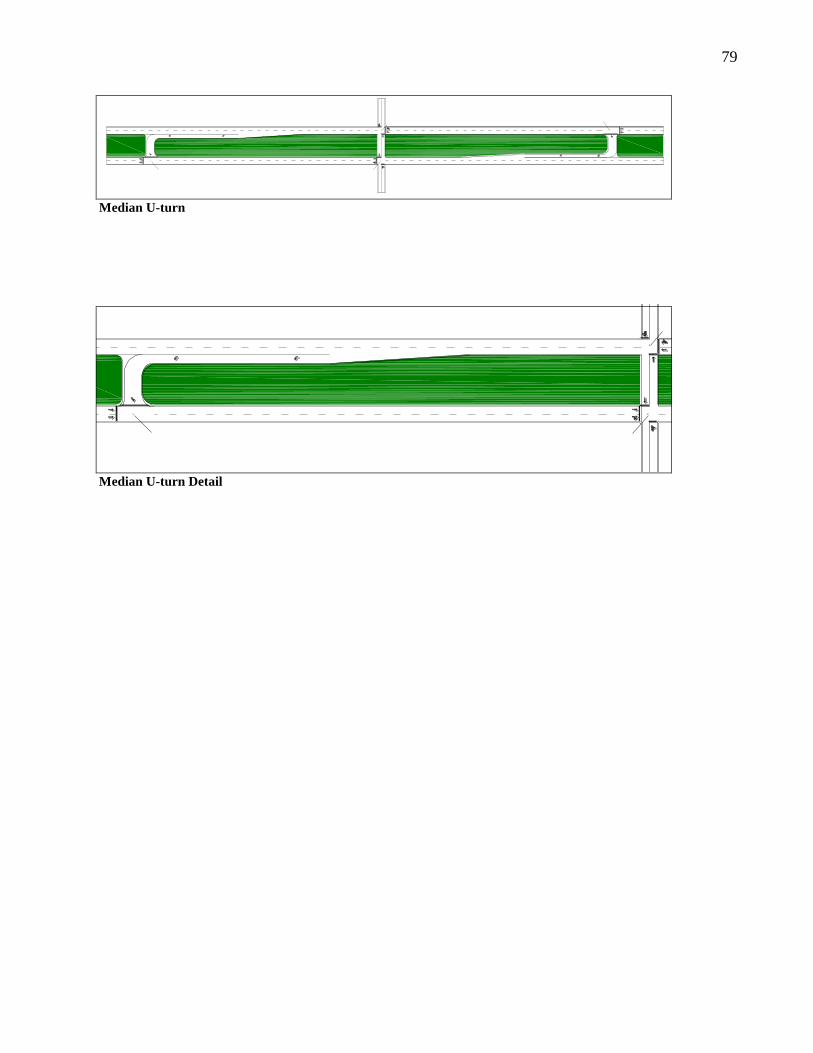
79
Median U-turn
Median U-turn Detail

80
Michigan Diamond
Michigan Diamond Detail

81
Quadrant
Quadrant Detail

82
SPUI
SPUI Detail

83
Tight Diamond

84
Tight Diamond Detail
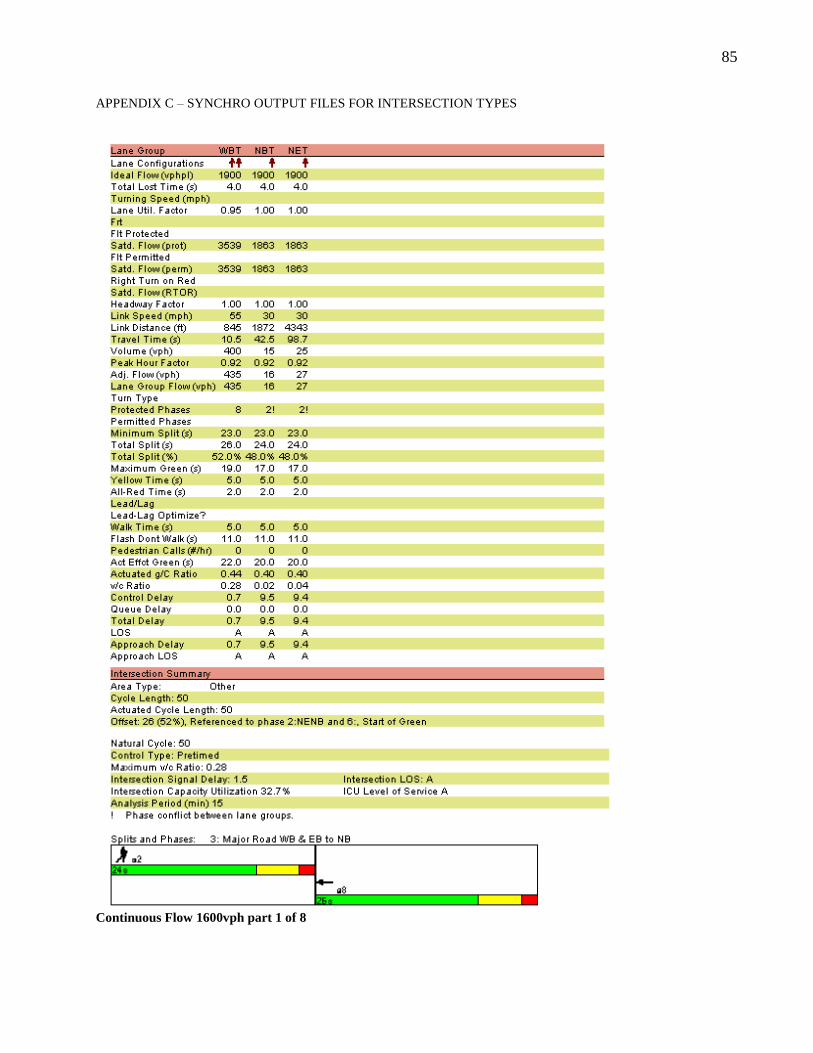
85
APPENDIX C – SYNCHRO OUTPUT FILES FOR INTERSECTION TYPES
Continuous Flow 1600vph part 1 of 8
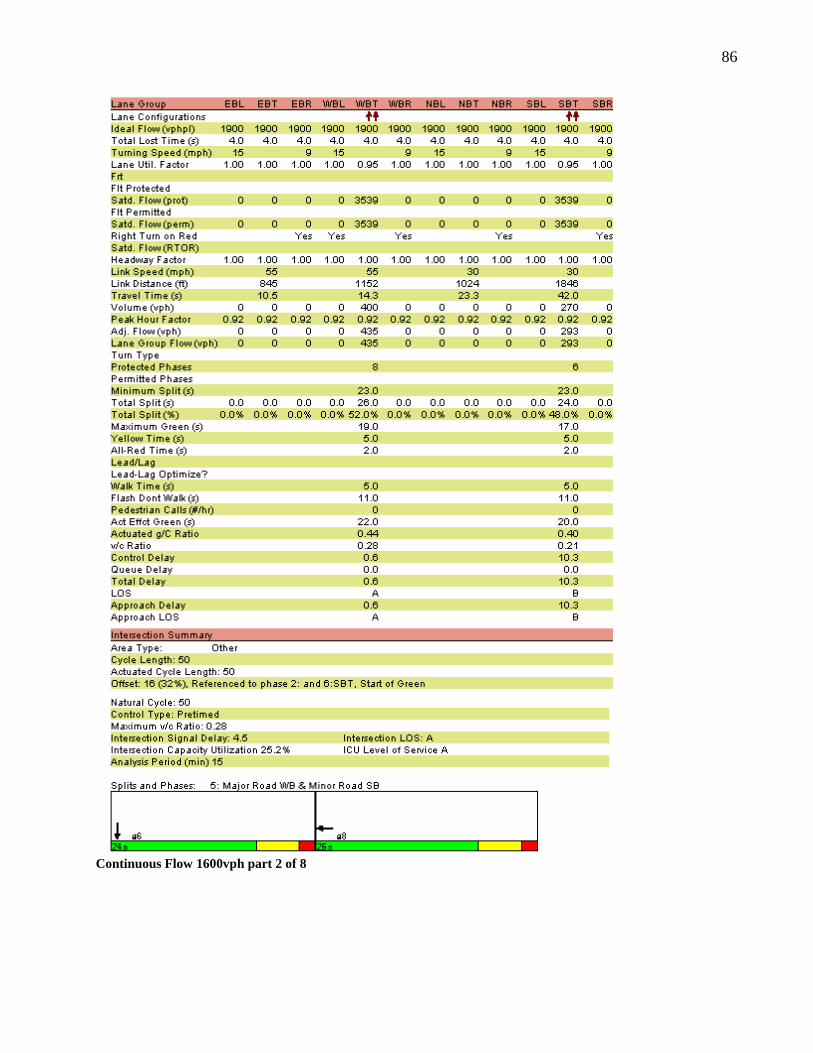
86
Continuous Flow 1600vph part 2 of 8

87
Continuous Flow 1600vph part 3 of 8

88
Continuous Flow 1600vph part 4 of 8

89
Continuous Flow 1600vph part 5 of 8

90
Continuous Flow 1600vph part 6 of 8

91
Continuous Flow 1600vph part 7 of 8
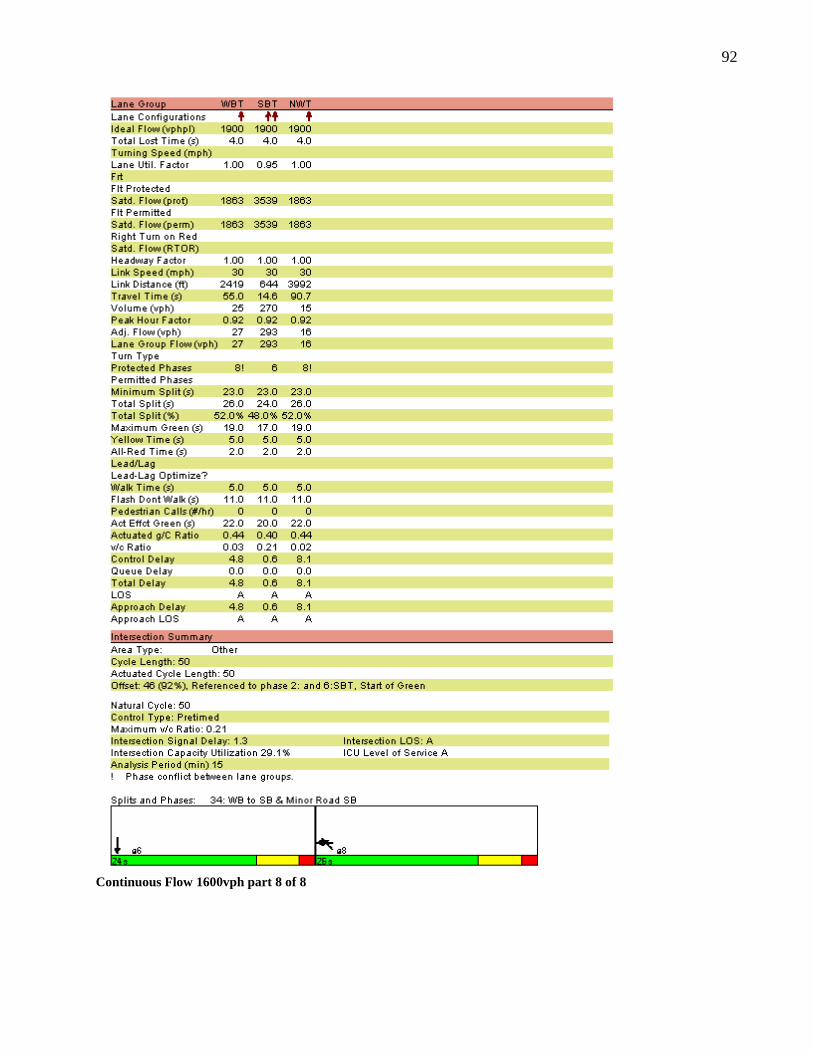
92
Continuous Flow 1600vph part 8 of 8

93
Continuous Flow 7315vph part 1 of 8

94
Continuous Flow 7315vph part 2 of 8

95
Continuous Flow 7315vph part 3 of 8

96
Continuous Flow 7315vph part 4 of 8

97
Continuous Flow 7315vph part 5 of 8

98
Continuous Flow 7315vph part 6 of 8
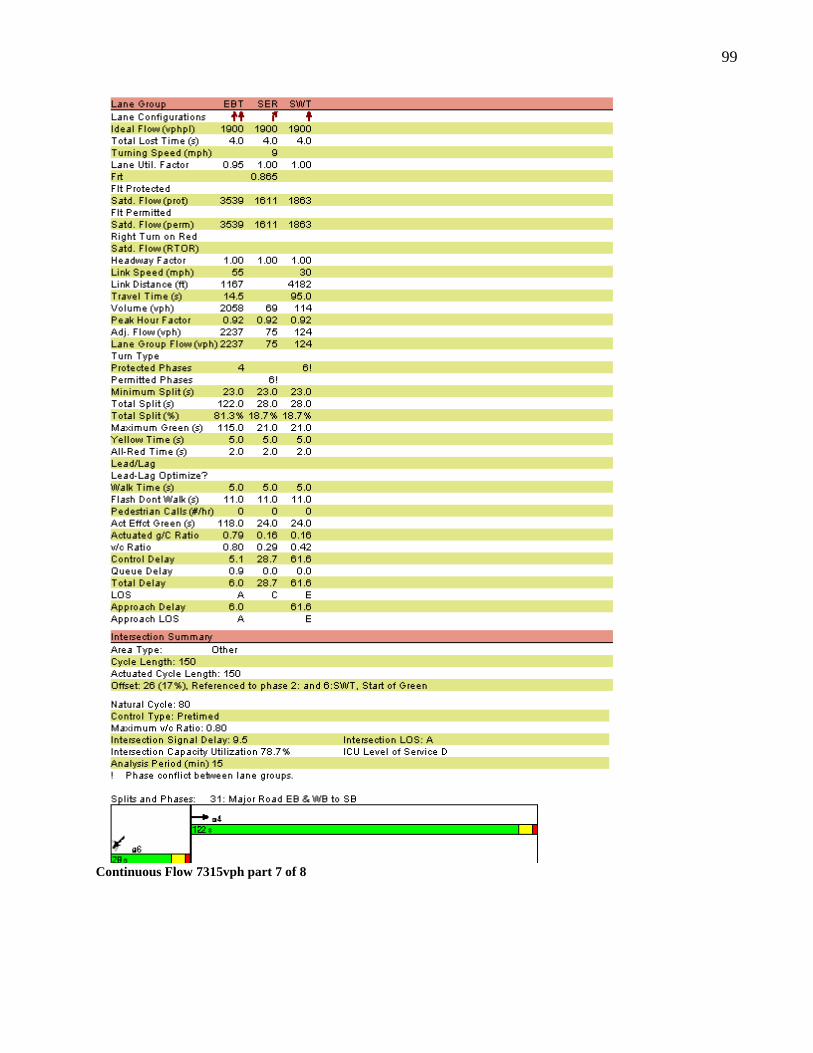
99
Continuous Flow 7315vph part 7 of 8

100
Continuous Flow 7315vph part 8 of 8

101
CTO 1600vph part 1 of 2

102
CTO 1600vph part 2 of 2

103
CTO 7315vph part 1 of 2

104
CTO 7315vph part 2 of 2

105
Echelon 1600vph part 1 of 2

106
Echelon 1600vph part 2 of 2

107
Echelon 7315vph part 1 of 2

108
Echelon 7315vph part 2 of 2

109
Median U-turn 1600vph part 1 of 4

110
Median U-turn 1600vph part 2 of 4

111
Median U-turn 1600vph part 3 of 4

112
Median U-turn 1600vph part 4 of 4

113
Median U-turn 7315vph part 1 of 4

114
Median U-turn 7315vph part 2 of 4

115
Median U-turn 7315vph part 3 of 4
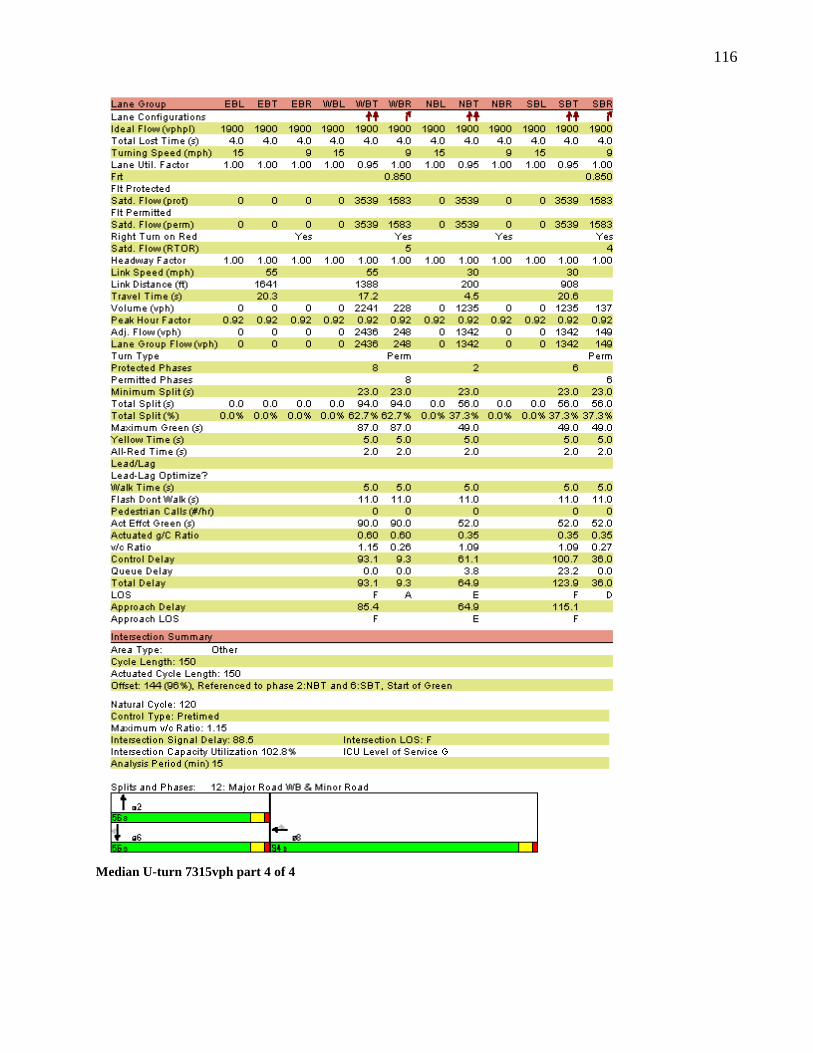
116
Median U-turn 7315vph part 4 of 4

117
Michigan Diamond 1600vph part 1 of 4

118
Michigan Diamond 1600vph part 2 of 4

119
Michigan Diamond 1600vph part 3 of 4

120
Michigan Diamond 1600vph part 4 of 4

121
Michigan Diamond 8047vph part 1 of 4
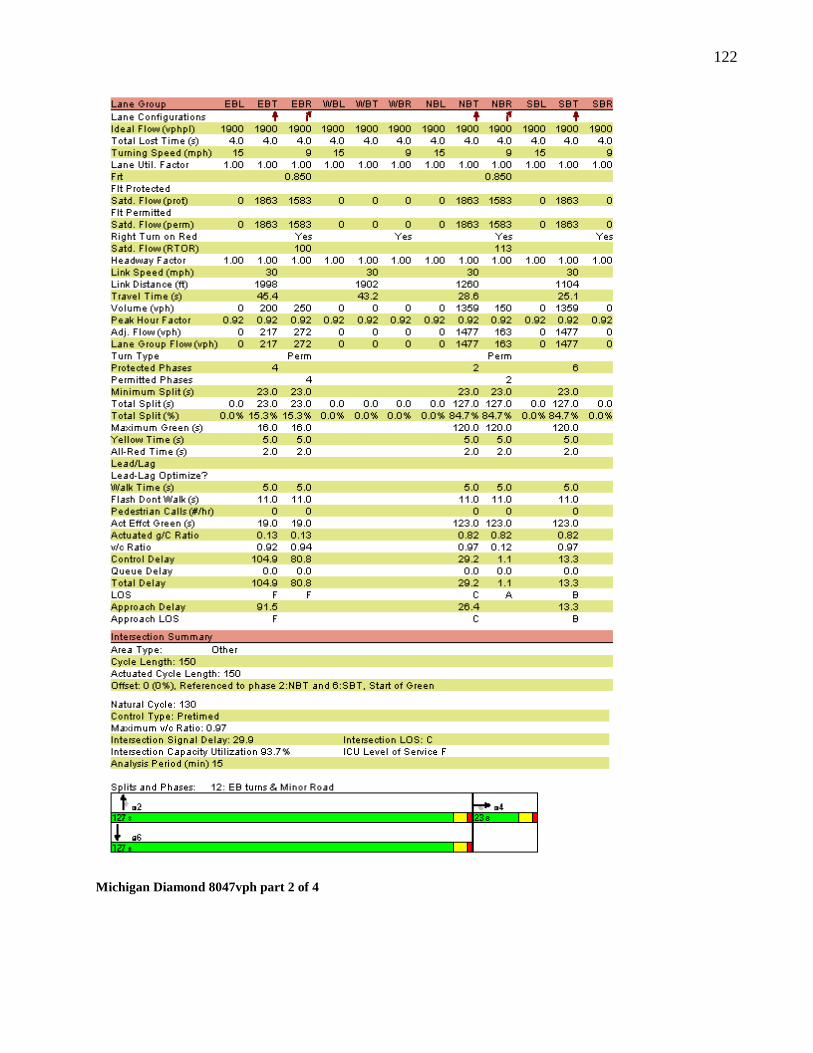
122
Michigan Diamond 8047vph part 2 of 4

123
Michigan Diamond 8047vph part 3 of 4
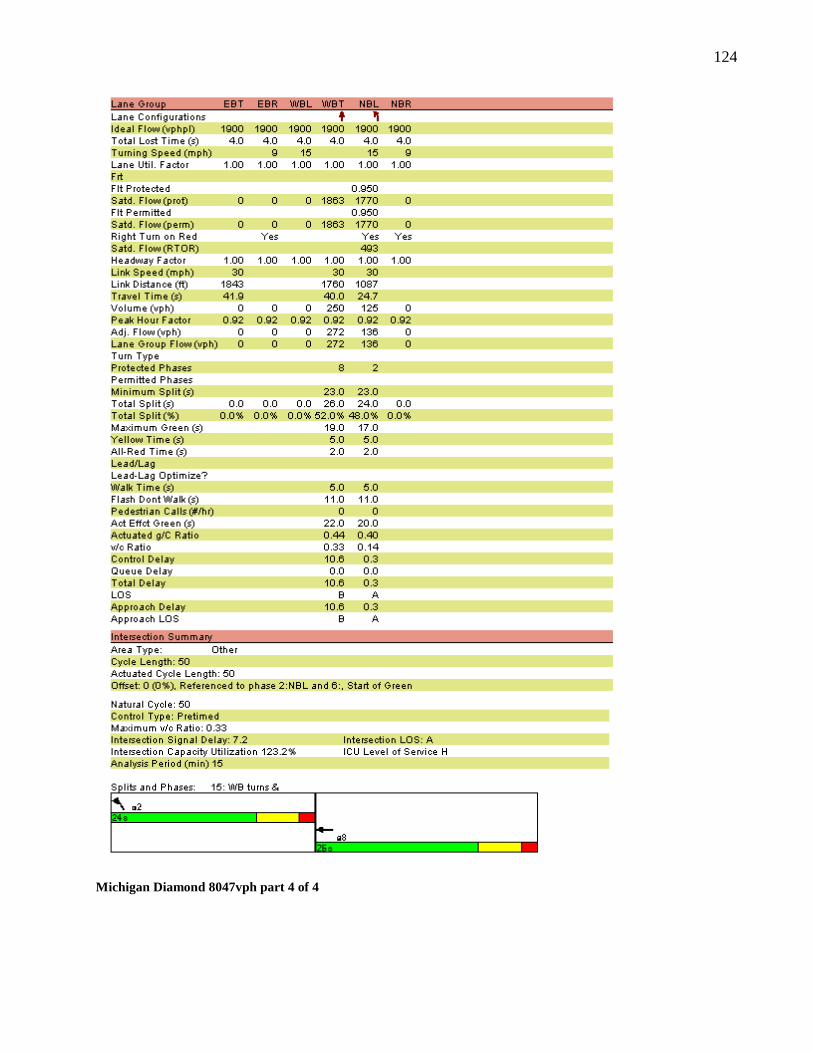
124
Michigan Diamond 8047vph part 4 of 4
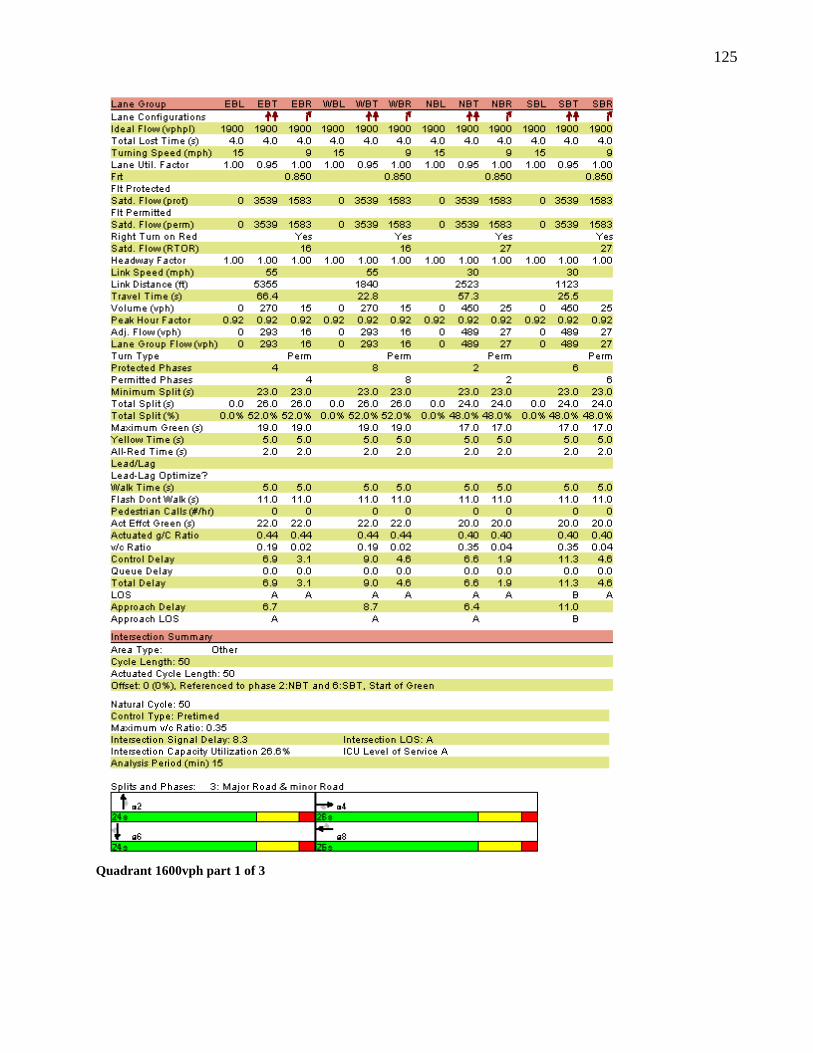
125
Quadrant 1600vph part 1 of 3

126
Quadrant 1600vph part 2 of 3
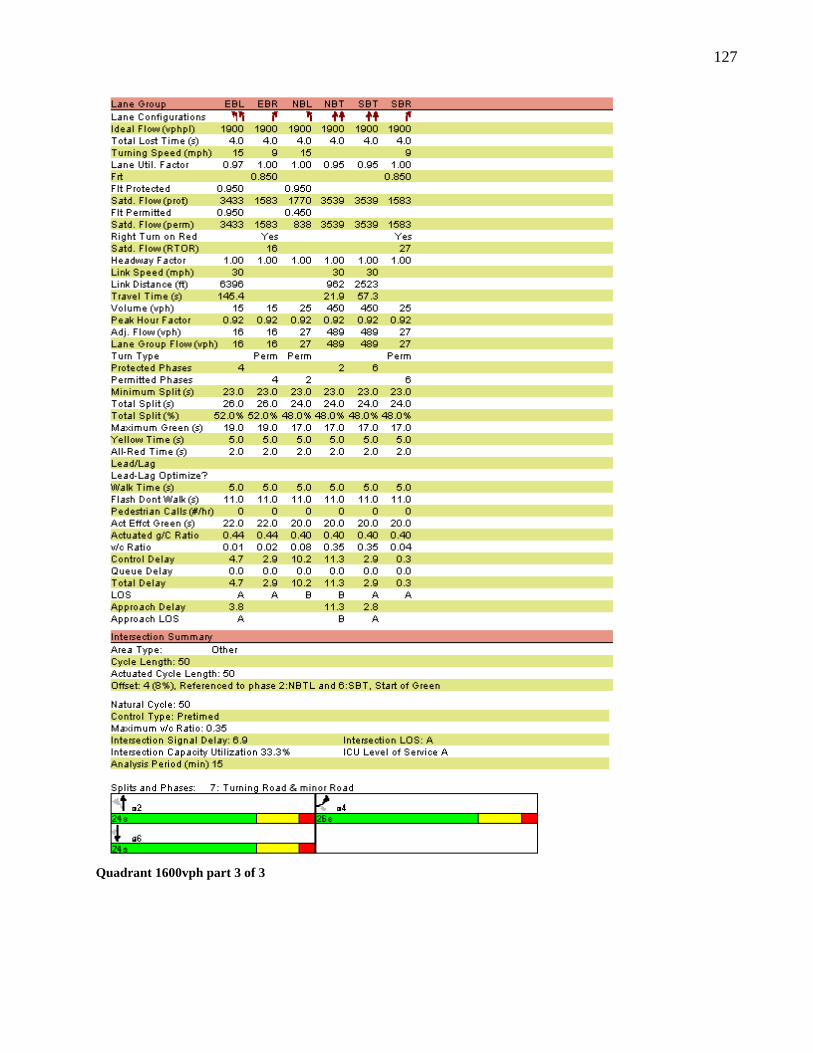
127
Quadrant 1600vph part 3 of 3

128
Quadrant 8047vph part 1 of 3

129
Quadrant 8047vph part 2 of 3

130
Quadrant 8047vph part 3 of 3
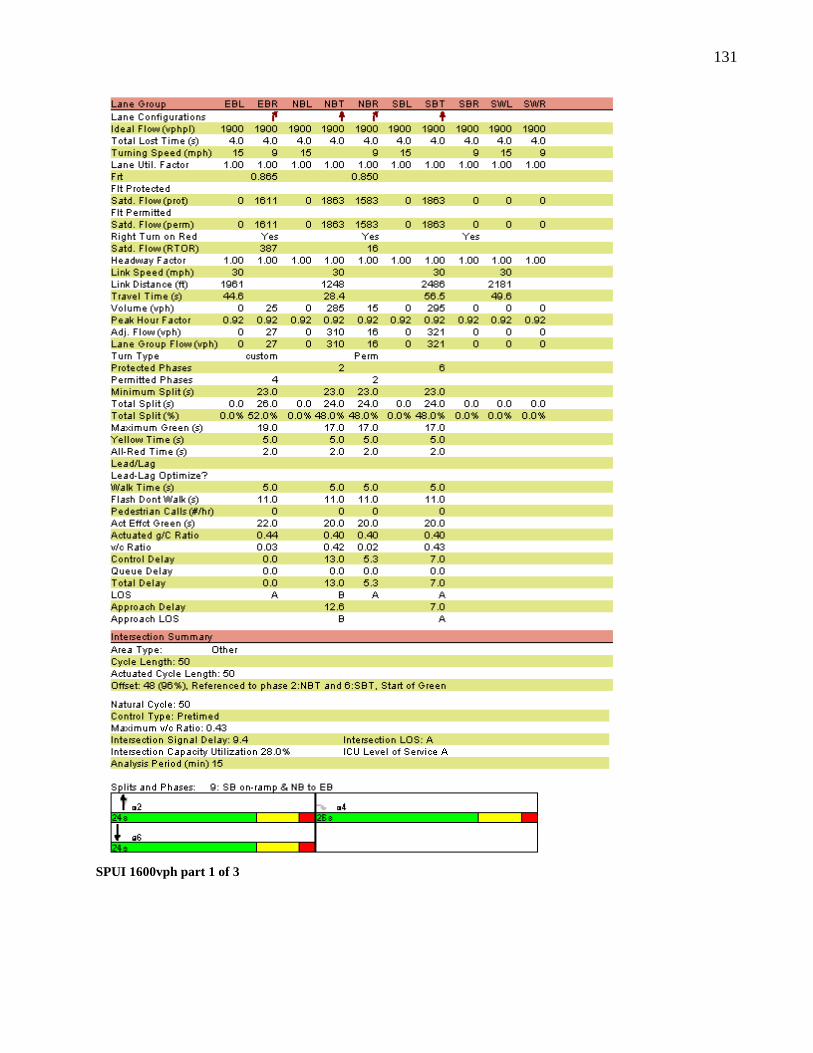
131
SPUI 1600vph part 1 of 3

132
SPUI 1600vph part 2 of 3

133
SPUI 1600vph part 3 of 3

134
SPUI 8047vph part 1 of 3

135
SPUI 8047vph part 2 of 3

136
SPUI 8047vph part 3 of 3
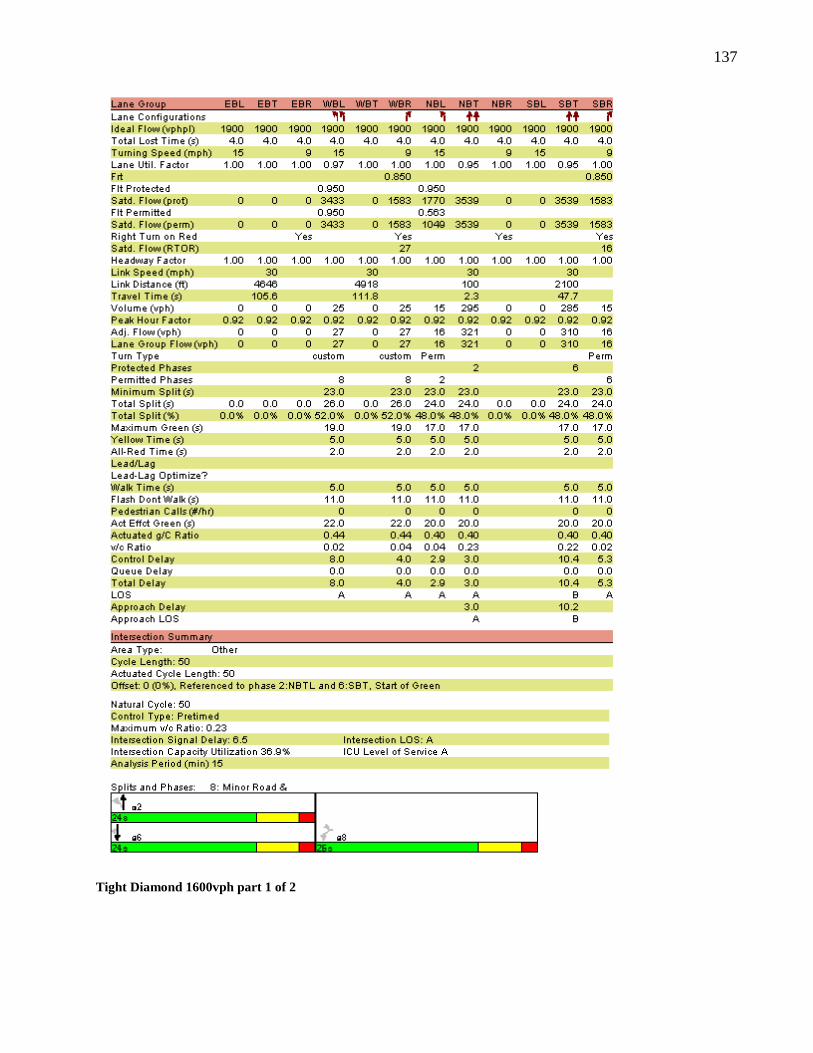
137
Tight Diamond 1600vph part 1 of 2

138
Tight Diamond 1600vph part 2 of 2
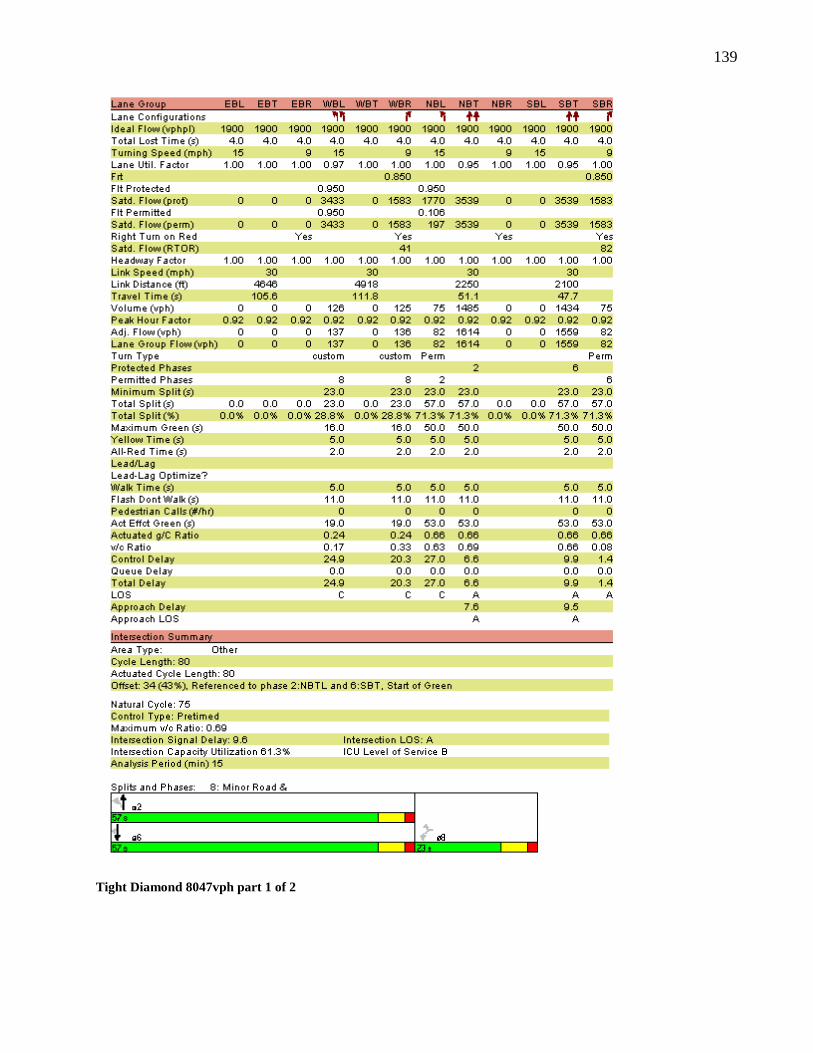
139
Tight Diamond 8047vph part 1 of 2

140
Tight Diamond 8047vph part 2 of 2

141
APPENDIX D – SUITABLE INTERSECTION DRAWINGS
NC Hwy 280 & Forge Mountain Road
US Hwy 19-74-129 & Locust Street
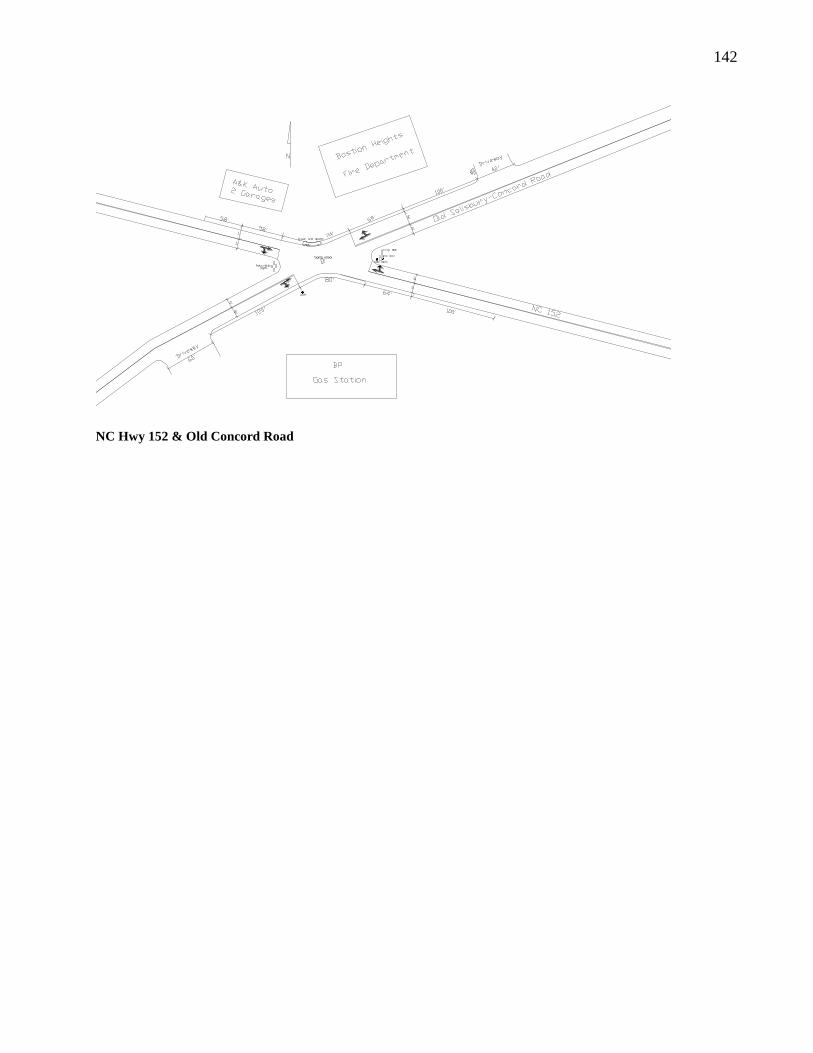
142
NC Hwy 152 & Old Concord Road

143
US Hwy 29 & Pitt School Road

144
US Hwy 74 & Forest Hills School Road
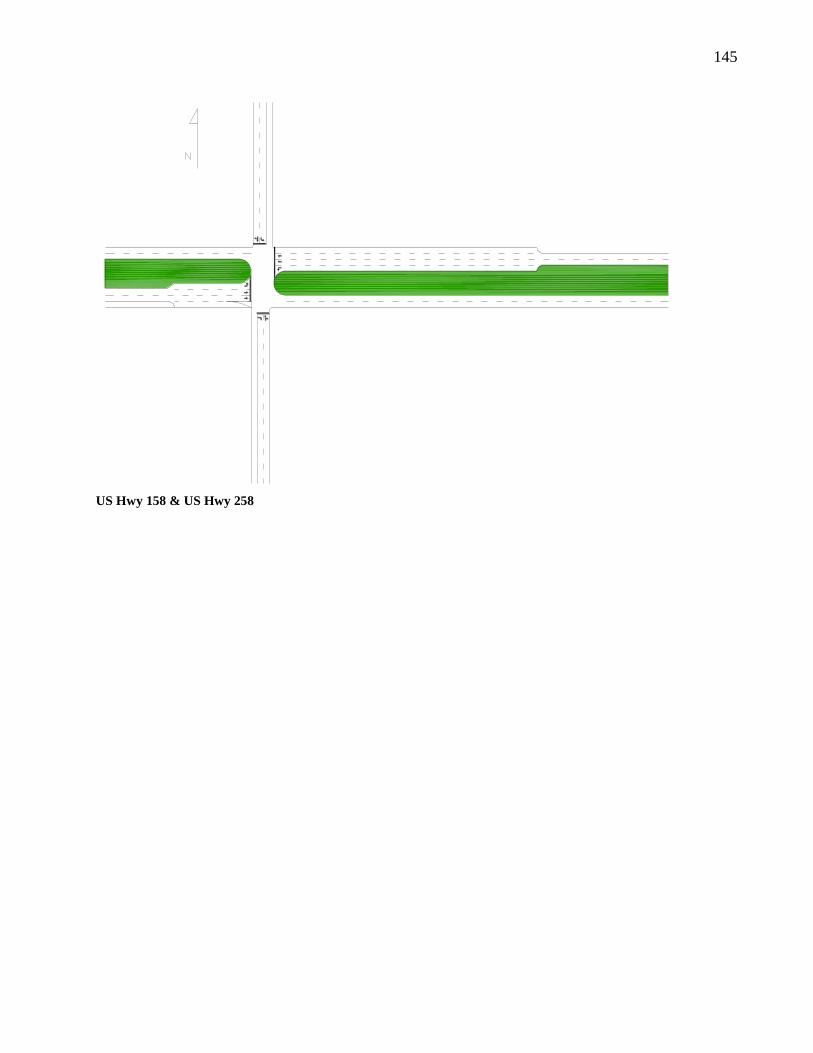
145
US Hwy 158 & US Hwy 258

146
APPENDIX E – SYNCHRO OUTPUT FILES FOR SUITABLE INTERSECTIONS
NC Hwy 280 & Forge Mountain Road 1600vph
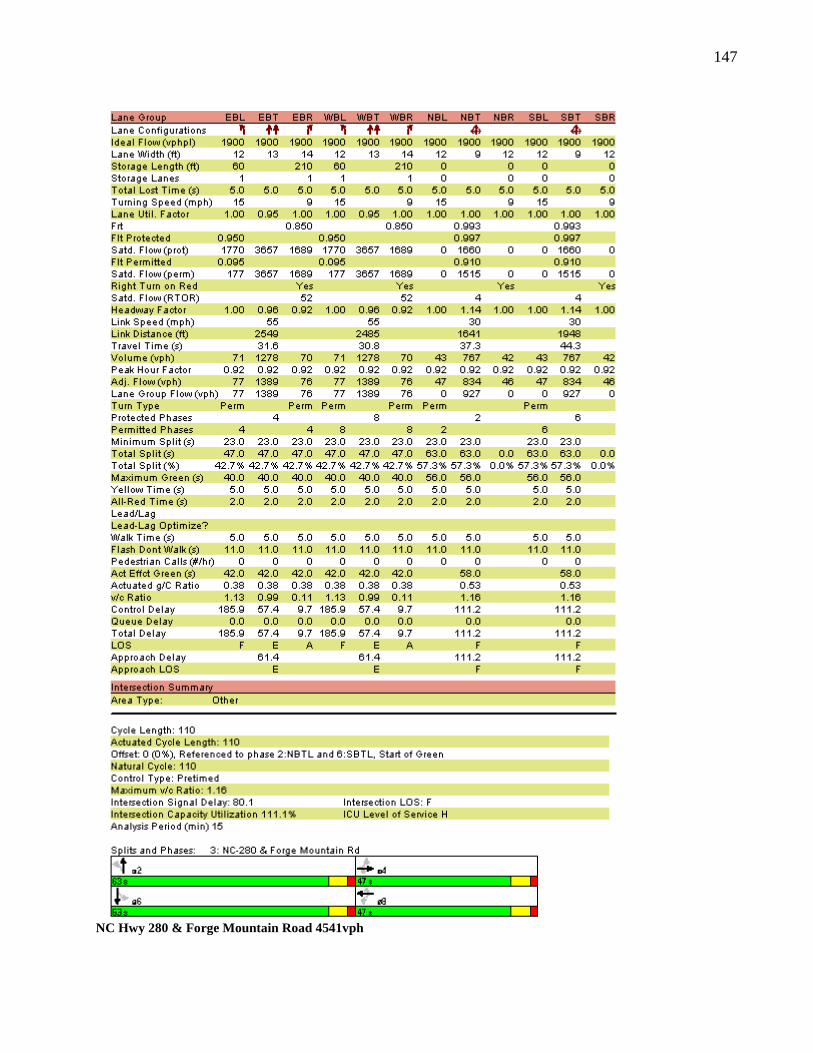
147
NC Hwy 280 & Forge Mountain Road 4541vph

148
US Hwy 19-74-129 & Locust Street 1600vph

149
US Hwy 19-74-129 & Locust Street 4995vph
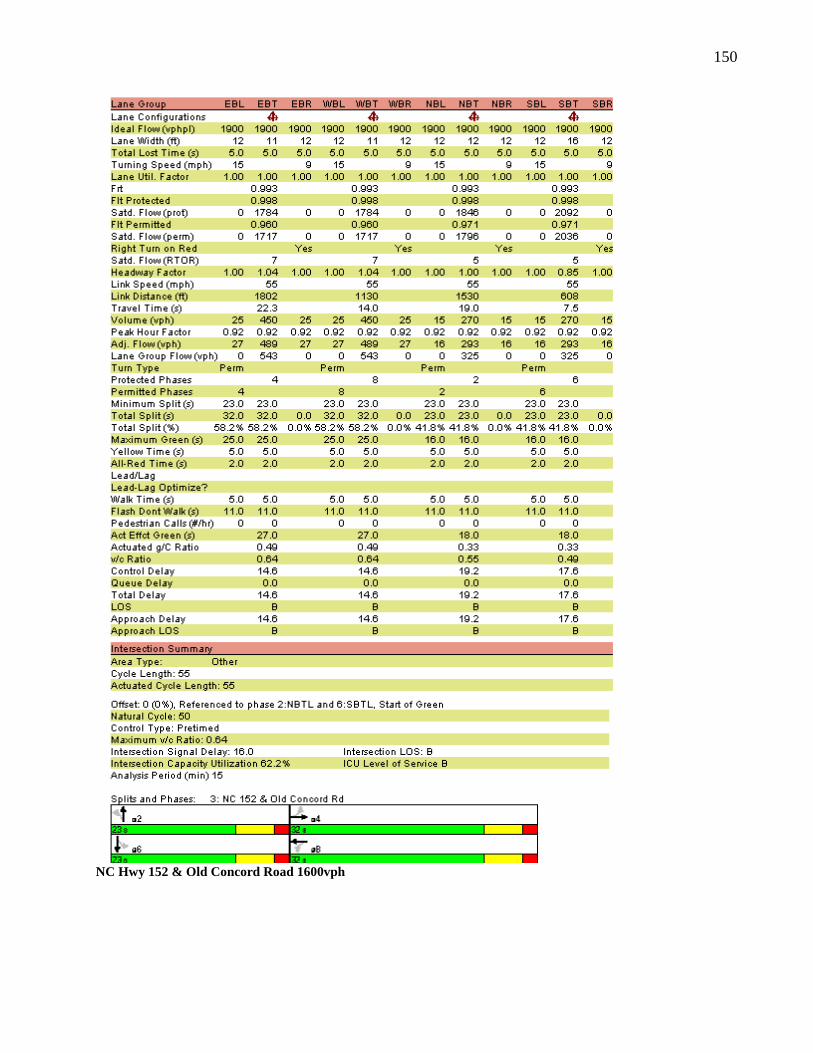
150
NC Hwy 152 & Old Concord Road 1600vph

151
NC Hwy 152 & Old Concord Road 2835vph

152
US Hwy 29 & Pitt School Road 1600vph

153
US Hwy 29 & Pitt School Road 4995vph

154
Hwy 74 & Forest Hills School Road 1600vph

155
US Hwy 74 & Forest Hills School Road 4128vph
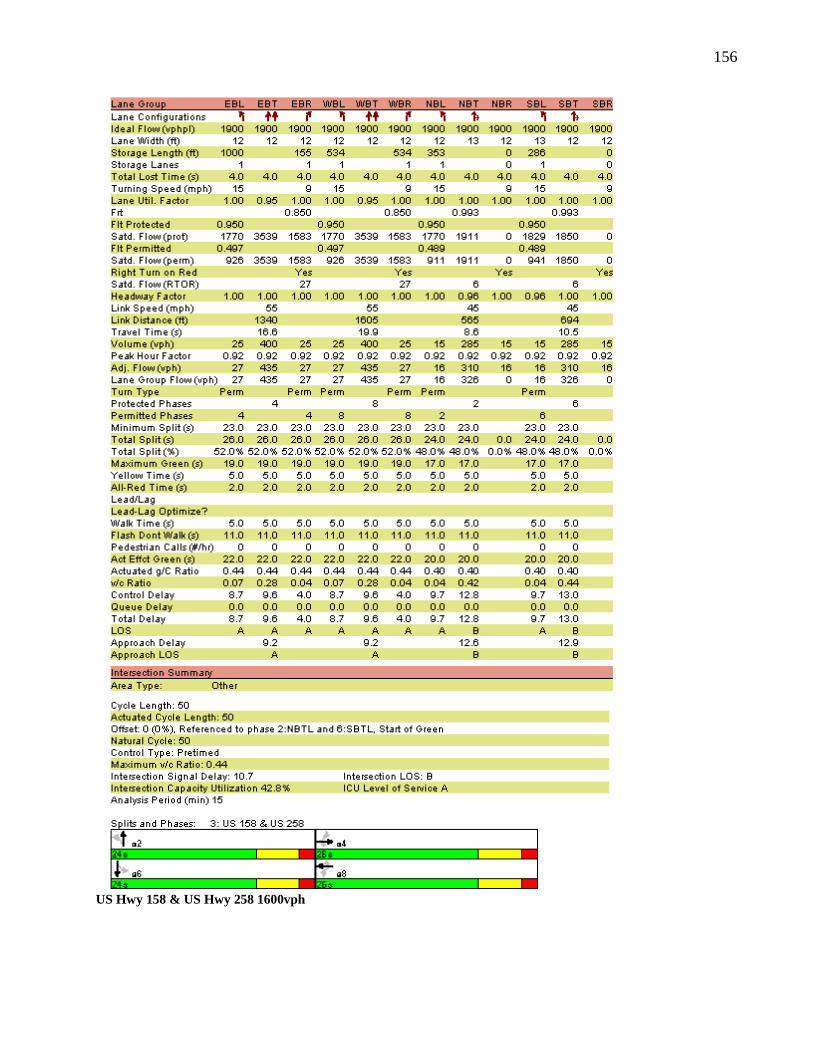
156
US Hwy 158 & US Hwy 258 1600vph
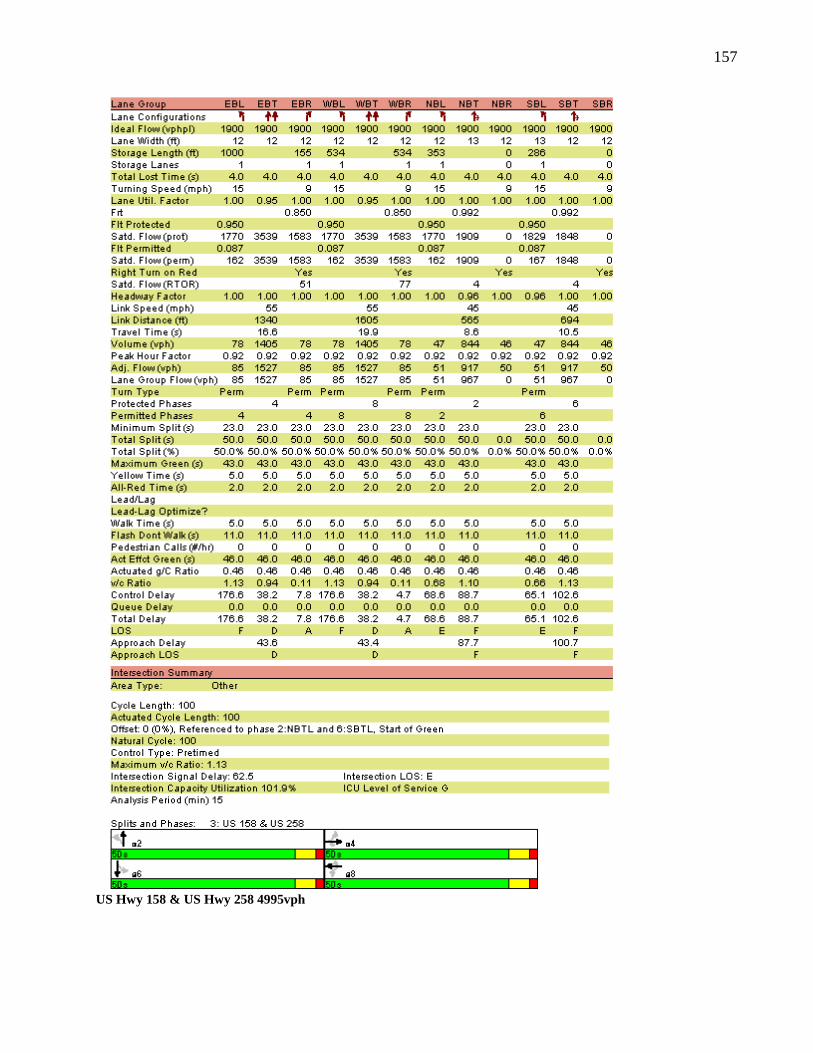
157
US Hwy 158 & US Hwy 258 4995vph

158
APPENDIX F. ESTIMATED CONSTRUCTION COSTS
Continuous Flow Cost Estimate

159
CTO Cost Estimate

160
Echelon Cost Estimate

161
Median U-turn Cost Estimate

162
Michigan Diamond Cost Estimate

163
Quadrant Cost Estimate

164
SPUI Cost Estimate

165
Tight Diamond Cost Estimate

166
APPENDIX G – TRAFFIC SURVEY MAPS
AADT NC Hwy 152 & Old Concord Road 2004

167
AADT US Hwy 29 & Pitt School Road 2004

168
AADT NC Hwy 280 & Forge Mountain Road 2005

169
AADT US Hwy 19-74-129 & Locust Street 2005
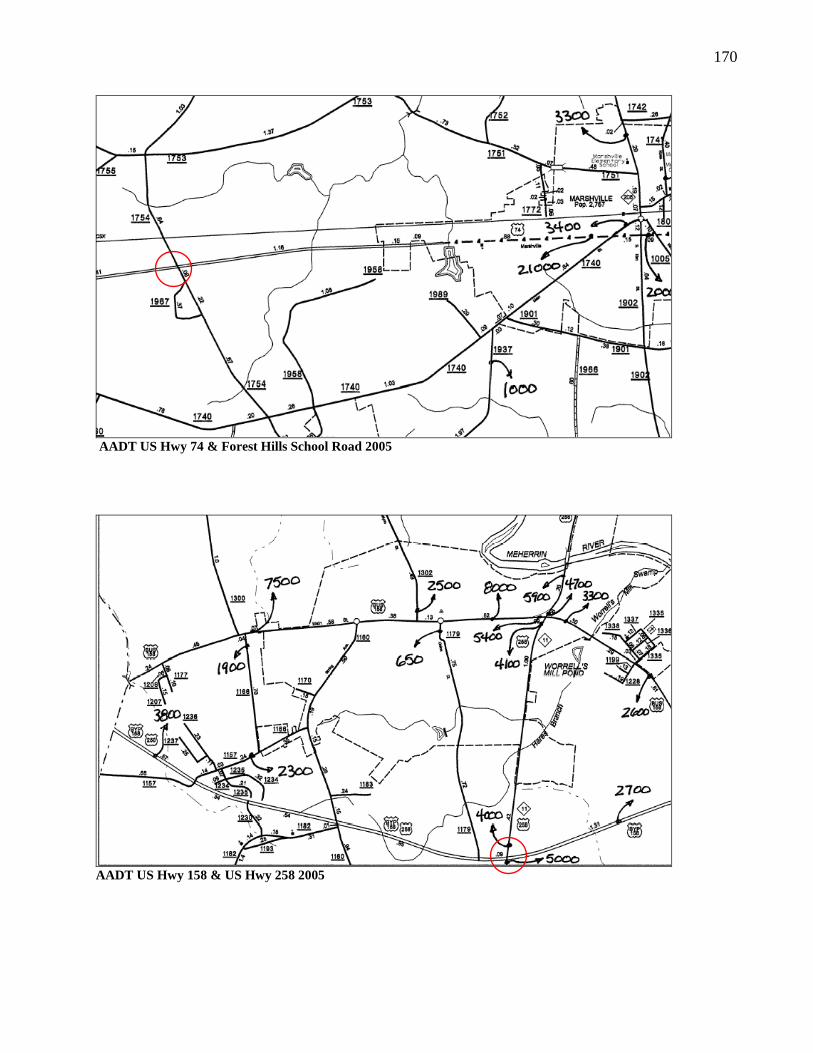
170
AADT US Hwy 74 & Forest Hills School Road 2005
AADT US Hwy 158 & US Hwy 258 2005