Embed Size (px)
Citation preview
1
LINE OF
SIGHT
Choosing the Factor: Not Which But When Michael Hunstad, PhD Head of Quantitative Research, Global Equity Meggan Friedman Senior Investment Strategist, Global Equity Hosted by Brendan Maton
The Equity Imperative
© 2015 Northern Trust Corporation
2
Your Speakers
Meggan Friedman Senior Investment Strategist, Global Equity
• Meggan helps to create current thought leadership for global investors and to deliver comprehensive investment solutions across the equity spectrum.
• Meggan has been with Northern Trust since 2011 and has 19 years of industry experience.
• Meggan has a bachelor degree from Northwestern University and an M.B.A from Harvard Business School.
• Meggan was named “Best on the Street” by Wall Street Journal in 2010 and 2011.
Michael Hunstad, PhD Head of Quantitative Research, Global Equity
• Michael leads Quantitative research within the Global Equity Team. • Michael has been with Northern Trust since 2012 and has 15 years
industry experience. • He holds a PhD in applied mathematics as well as an MBA in
quantitative finance and an MA in econometrics.
3
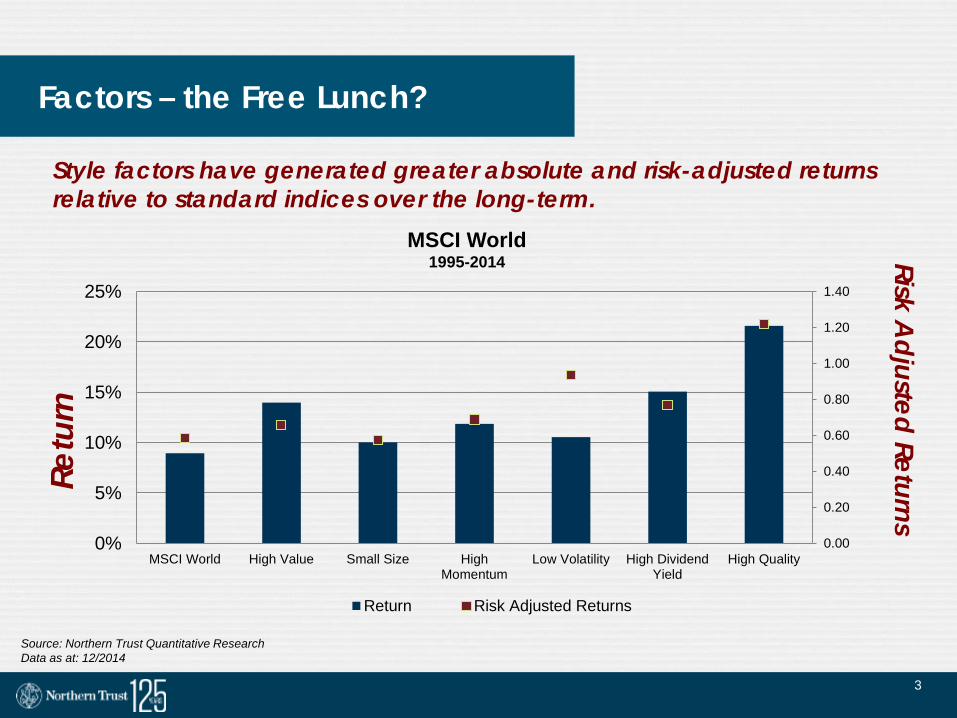
Factors – the Free Lunch? Re
turn
Risk A
djusted Returns
MSCI World 1995-2014
Source: Northern Trust Quantitative Research Data as at: 12/2014
Style factors have generated greater absolute and risk-adjusted returns relative to standard indices over the long-term.
0.00
0.20
0.40
0.60
0.80
1.00
1.20
1.40
0%
5%
10%
15%
20%
25%
MSCI World High Value Small Size HighMomentum
Low Volatility High DividendYield
High Quality
Return Risk Adjusted Returns
4
Factor Cycles

5
Source: Bloomberg and Northern Trust Quantitative Research Each month from January 1979 to June 2014 all stocks in the Russell 3000 universe were ranked on the MSCI Barra definition of Value and put into equally weighted quintiles. The subsequent return for each quintile is computed with the resultant value factor return defined as the first quintile (highest value) return minus the benchmark return.
Serious Risk
Sustained underperformance is a primary risk in factor investing
$0.00
$0.50
$1.00
$1.50
$2.00
$2.50
$3.00
1979 1982 1985 1988 1991 1994 1997 2000 2003 2006 2009 2012
Value Factor Cumulative Returns US Broadcap Benchmark

6
Value Cycles
0.0%
1.0%
2.0%
3.0%
4.0%
5.0%
6.0%
7.0%
% o
f Tot
al V
aria
tion
Months
High Value
Source: Bloomberg, MSCI Barra and Northern Trust Quantitative Research
The value cycle lasts for approximately
47 months
7
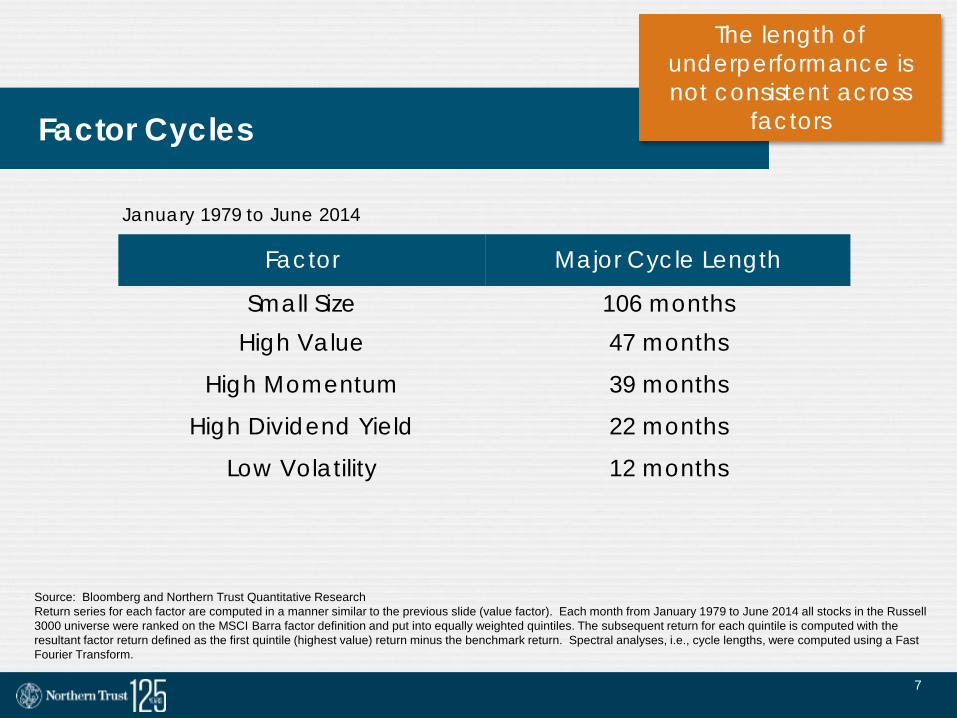
Factor Cycles
Factor Major Cycle Length
Small Size 106 months High Value 47 months
High Momentum 39 months
High Dividend Yield 22 months
Low Volatility 12 months
Source: Bloomberg and Northern Trust Quantitative Research Return series for each factor are computed in a manner similar to the previous slide (value factor). Each month from January 1979 to June 2014 all stocks in the Russell 3000 universe were ranked on the MSCI Barra factor definition and put into equally weighted quintiles. The subsequent return for each quintile is computed with the resultant factor return defined as the first quintile (highest value) return minus the benchmark return. Spectral analyses, i.e., cycle lengths, were computed using a Fast Fourier Transform.
The length of underperformance is not consistent across
factors
January 1979 to June 2014
8
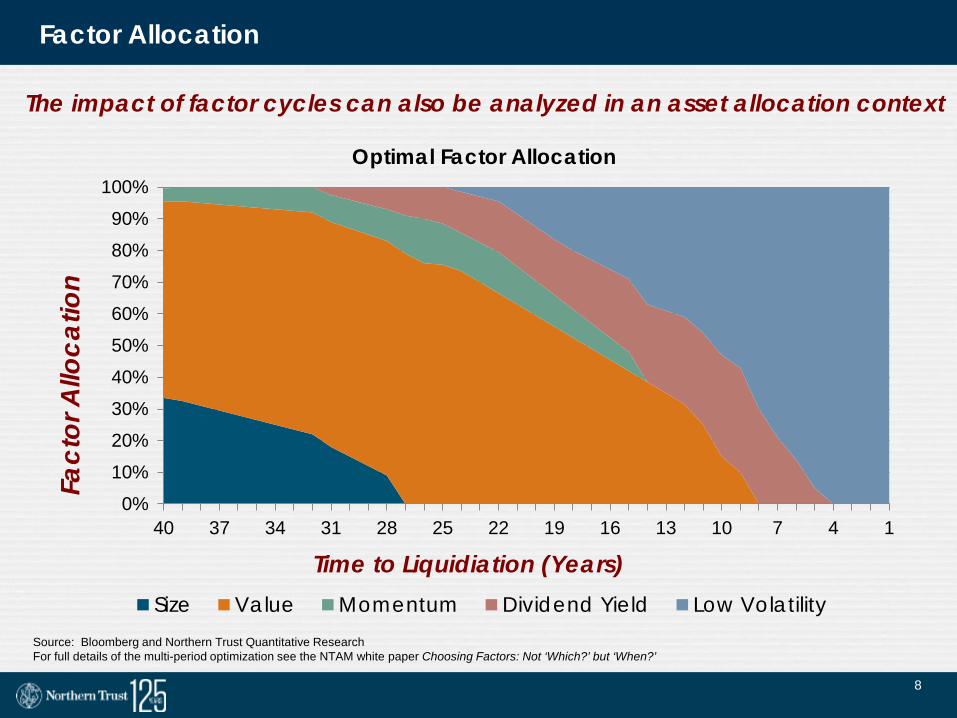
Source: Bloomberg and Northern Trust Quantitative Research For full details of the multi-period optimization see the NTAM white paper Choosing Factors: Not ‘Which?’ but ‘When?’
Factor Allocation
The impact of factor cycles can also be analyzed in an asset allocation context
0%10%20%30%40%50%60%70%80%90%
100%
40 37 34 31 28 25 22 19 16 13 10 7 4 1
Fact
or A
lloca
tion
Time to Liquidiation (Years)
Optimal Factor Allocation
Size Value Momentum Dividend Yield Low Volatility
9
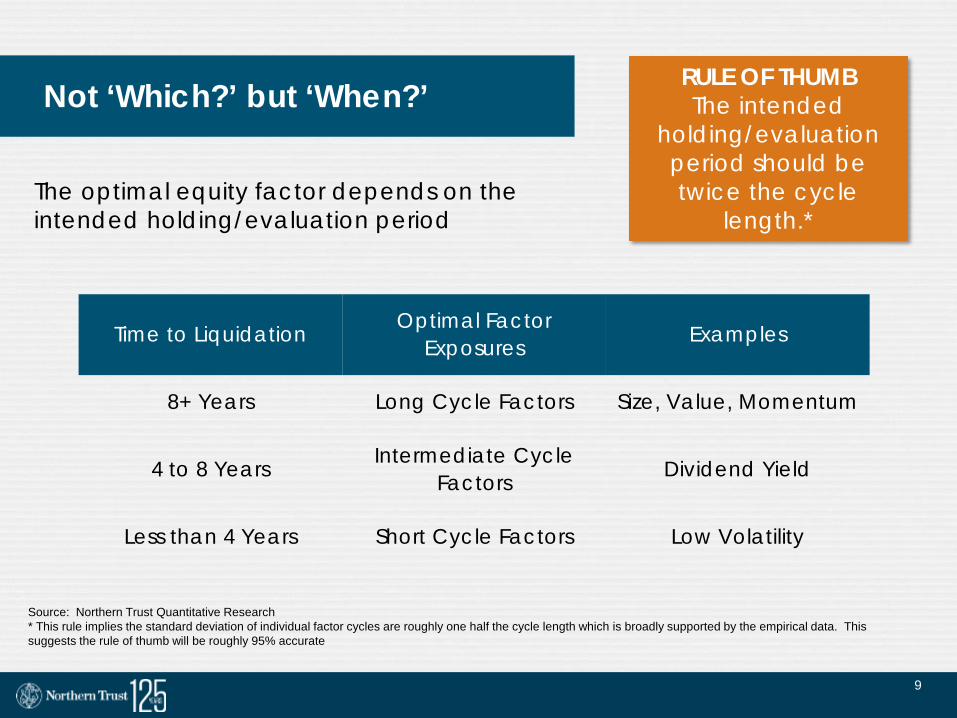
Time to Liquidation Optimal Factor Exposures Examples
8+ Years Long Cycle Factors Size, Value, Momentum
4 to 8 Years Intermediate Cycle Factors Dividend Yield
Less than 4 Years Short Cycle Factors Low Volatility
Not ‘Which?’ but ‘When?’
The optimal equity factor depends on the intended holding/evaluation period
Source: Northern Trust Quantitative Research * This rule implies the standard deviation of individual factor cycles are roughly one half the cycle length which is broadly supported by the empirical data. This suggests the rule of thumb will be roughly 95% accurate
RULE OF THUMB The intended
holding/evaluation period should be twice the cycle
length.*

10
Multi-factor Portfolios
11
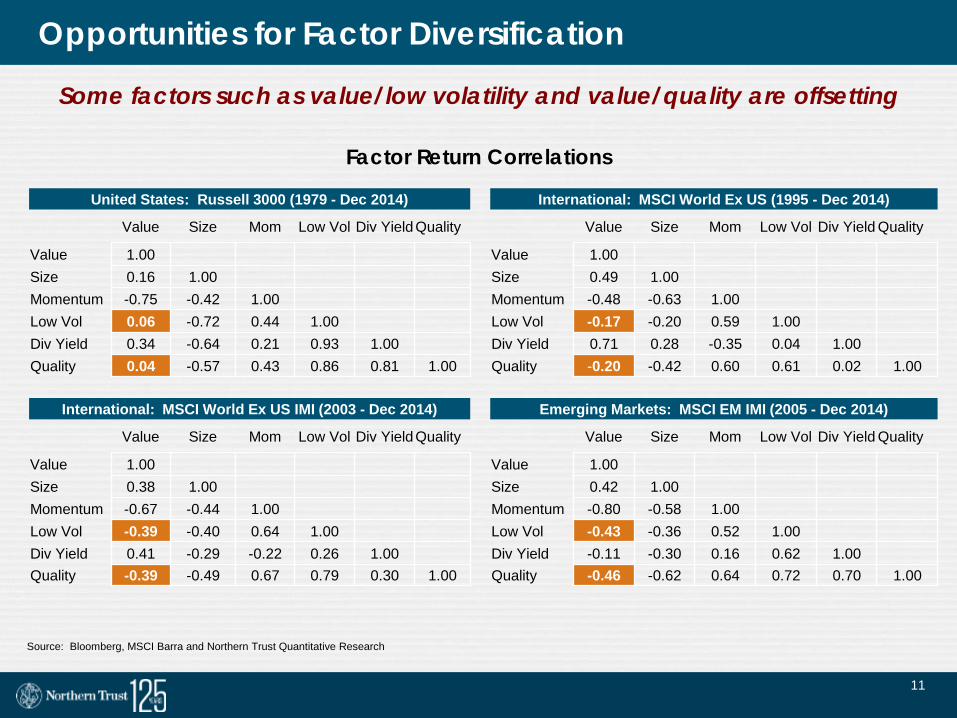
Opportunities for Factor Diversification
Some factors such as value/low volatility and value/quality are offsetting
Source: Bloomberg, MSCI Barra and Northern Trust Quantitative Research
Factor Return Correlations
United States: Russell 3000 (1979 - Dec 2014) International: MSCI World Ex US (1995 - Dec 2014)
Value Size Mom Low Vol Div Yield Quality Value Size Mom Low Vol Div Yield Quality
Value 1.00 Value 1.00 Size 0.16 1.00 Size 0.49 1.00 Momentum -0.75 -0.42 1.00 Momentum -0.48 -0.63 1.00 Low Vol 0.06 -0.72 0.44 1.00 Low Vol -0.17 -0.20 0.59 1.00 Div Yield 0.34 -0.64 0.21 0.93 1.00 Div Yield 0.71 0.28 -0.35 0.04 1.00 Quality 0.04 -0.57 0.43 0.86 0.81 1.00 Quality -0.20 -0.42 0.60 0.61 0.02 1.00
International: MSCI World Ex US IMI (2003 - Dec 2014) Emerging Markets: MSCI EM IMI (2005 - Dec 2014)
Value Size Mom Low Vol Div Yield Quality Value Size Mom Low Vol Div Yield Quality
Value 1.00 Value 1.00 Size 0.38 1.00 Size 0.42 1.00 Momentum -0.67 -0.44 1.00 Momentum -0.80 -0.58 1.00 Low Vol -0.39 -0.40 0.64 1.00 Low Vol -0.43 -0.36 0.52 1.00 Div Yield 0.41 -0.29 -0.22 0.26 1.00 Div Yield -0.11 -0.30 0.16 0.62 1.00 Quality -0.39 -0.49 0.67 0.79 0.30 1.00 Quality -0.46 -0.62 0.64 0.72 0.70 1.00

12
0.0%
1.0%
2.0%
3.0%
4.0%
5.0%
6.0%
7.0%
426
.0 1
42.0
85.
2 6
0.9
47.
3 3
8.7
32.
8 2
8.4
25.
1 2
2.4
20.
3 1
8.5
17.
0 1
5.8
14.
7 1
3.7
12.
9 1
2.2
11.
5 1
0.9
10.
4
% o
f Tot
al V
aria
tion
Months
Quality and Value Spectrums
Value Quality
0.0%
1.0%
2.0%
3.0%
4.0%
5.0%
6.0%
7.0%
426
.0 1
42.0
85.
2 6
0.9
47.
3 3
8.7
32.
8 2
8.4
25.
1 2
2.4
20.
3 1
8.5
17.
0 1
5.8
14.
7 1
3.7
12.
9 1
2.2
11.
5 1
0.9
10.
4
% o
f Tot
al V
aria
tion
Months
Low Volatility and Value Spectrums
Value Volatility
Factor Diversification
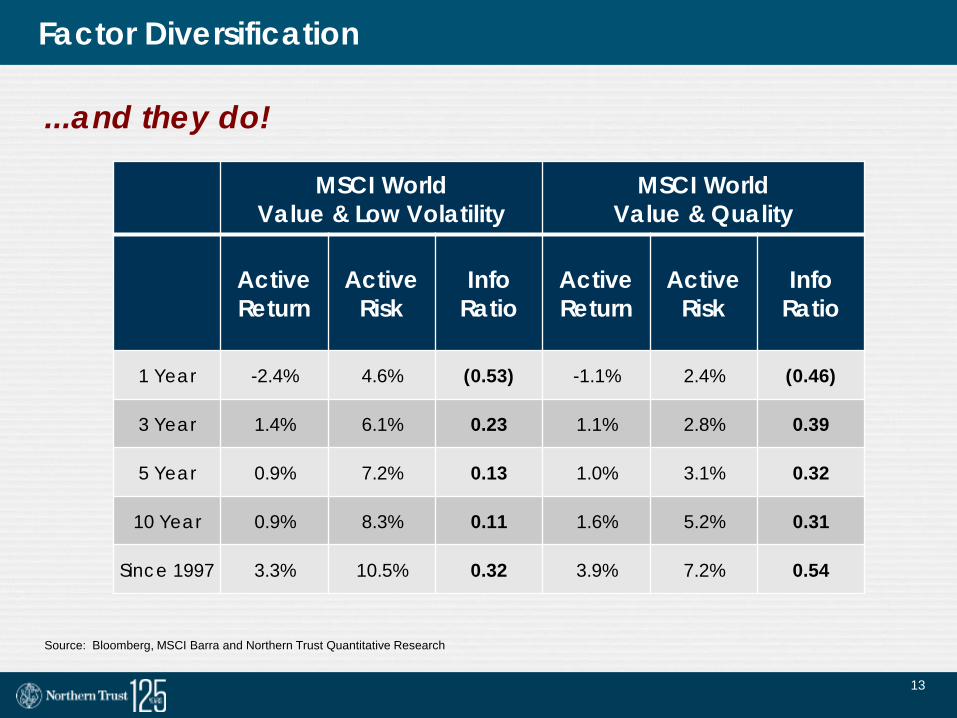
Multi-factor portfolios composed of factors of similar frequency should generate better diversification and higher risk adjusted returns...
Source: Bloomberg, MSCI Barra and Northern Trust Quantitative Research
13
Factor Diversification
MSCI World Value & Low Volatility
MSCI World Value & Quality
Active Return
Active Risk
Info
Ratio
Active Return
Active Risk
Info Ratio
1 Year -2.4% 4.6% (0.53) -1.1% 2.4% (0.46)
3 Year 1.4% 6.1% 0.23 1.1% 2.8% 0.39
5 Year 0.9% 7.2% 0.13 1.0% 3.1% 0.32
10 Year 0.9% 8.3% 0.11 1.6% 5.2% 0.31
Since 1997 3.3% 10.5% 0.32 3.9% 7.2% 0.54
...and they do!
Source: Bloomberg, MSCI Barra and Northern Trust Quantitative Research

14
0.0%
1.0%
2.0%
3.0%
4.0%
5.0%
6.0%
7.0%
426
.0 2
13.0
142
.0 1
06.5
85.
2 7
1.0
60.
9 5
3.3
47.
3 4
2.6
38.
7 3
5.5
32.
8 3
0.4
28.
4 2
6.6
25.
1 2
3.7
22.
4 2
1.3
20.
3 1
9.4
18.
5 1
7.8
17.
0 1
6.4
15.
8 1
5.2
14.
7 1
4.2
13.
7 1
3.3
12.
9 1
2.5
12.
2 1
1.8
11.
5 1
1.2
10.
9 1
0.7
10.
4 1
0.1
% o
f Tot
al V
aria
tion
Months
Quality Spectrum
Quality as a Diversifier
Quality is an excellent diversifier as it operates at multiple frequencies
Source: Bloomberg, MSCI Barra and Northern Trust Quantitative Research
15
Factor Cycles and Stock Specific Risk

16
Stock Specific Risk – A Natural Habitat??
Factor neutrality may be difficult for managers that take specific risk
Source: Northern Trust Quantitative Research, Factset, BARRA Represents average specific risk for Russell 1000 from 1979 to March 2015
Volatility Size Value Growth
Quintile Specific Risk Standard
Deviation Specific Risk Standard
Deviation Specific Risk Standard
Deviation Specific Risk Standard
Deviation
High 42.0 16.0 20.9 9.4 27.8 14.6 34.8 16.9 2 29.8 9.8 24.3 11.3 24.1 11.5 27.5 12.5 3 24.4 7.7 26.7 12.0 25.1 11.7 24.3 10.6 4 20.6 6.6 27.7 12.4 26.3 12.3 22.7 9.7
Low 16.6 5.3 33.8 16.3 30.2 14.7 23.4 10.8
Q1 - Q5 25.4 (12.9) (2.3) 11.4
Momentum Quality Dividend Yield
Quintile Specific Risk Standard
Deviation Specific Risk Standard
Deviation Specific Risk Standard
Deviation
High 29.7 13.6 20.8 11.2 19.0 8.1
2 23.5 10.8 24.3 11.1 22.1 8.6
3 22.8 10.3 25.4 12.5 24.9 10.0
4 24.4 11.2 27.2 13.8 31.9 16.5
Low 23.0 16.2 32.2 17.0 34.5 14.2
Q1 - Q5 6.6 (11.3) (15.4)

17
The Consequences of Specific Risk
-0.70
-0.50
-0.30
-0.10
0.10
0.30
0.50
0.70
DividendYield
Quality Momentum Size Value Volatility Growth
BARR
A F
acto
r Exp
osur
e
Example Fundamental Manager
In pursuing stock specific risk, fundamental managers often find it in its natural habitat
Threshold of Materiality
Threshold of Materiality
Source: Northern Trust Quantitative Research, Factset, BARRA As of May 2015 – manager generates appox. 9% tracking error against benchmark and holds about 25 names
18
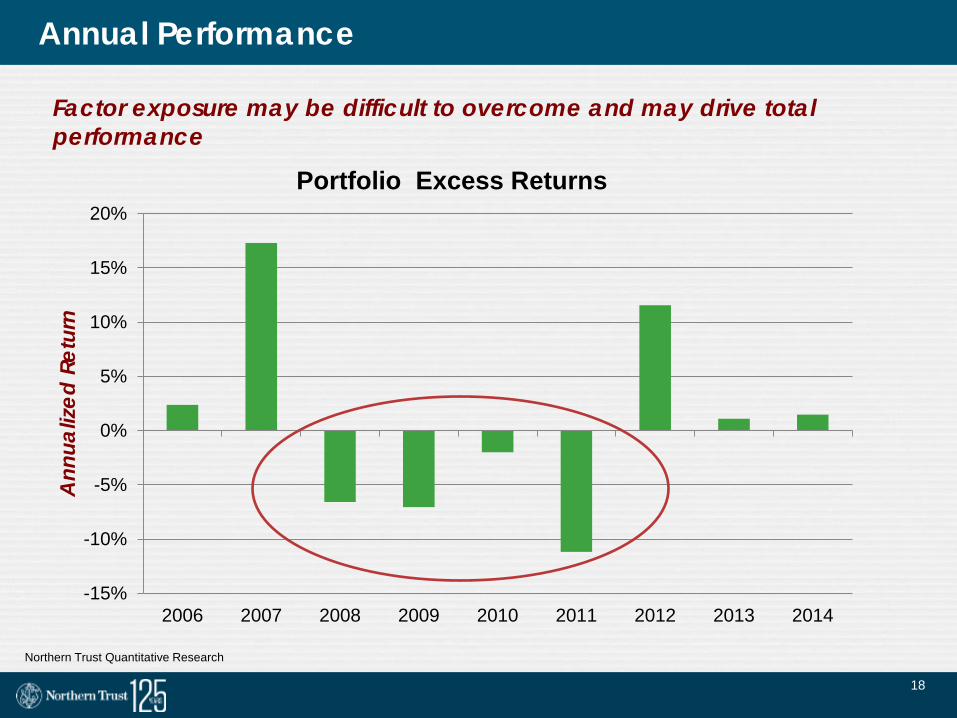
Annual Performance
-15%
-10%
-5%
0%
5%
10%
15%
20%
2006 2007 2008 2009 2010 2011 2012 2013 2014
Ann
ualiz
ed R
etur
n
Portfolio Excess Returns
Factor exposure may be difficult to overcome and may drive total performance
Northern Trust Quantitative Research

19
A Repeated Pattern
-0.20
0.00
0.20
0.40
0.60
0.80
1.00
1.20
3 Year Pre-hire 3 Year Post-hire 3 Year Post-fire
Info
rmat
ion
Ratio
3 Year Pre and Post Hire and Fire IRs
From Goyal, A. and Wahal, S., “The Selection and Termination of Investment Managers by Plan Sponsors,” Journal of Finance 63(4) 1805‒1847, 2008
These cycles may strongly influence the hiring and firing of active equity managers
20
Engineering Equity: Product Design
21
Factor Based Investing Since 1994
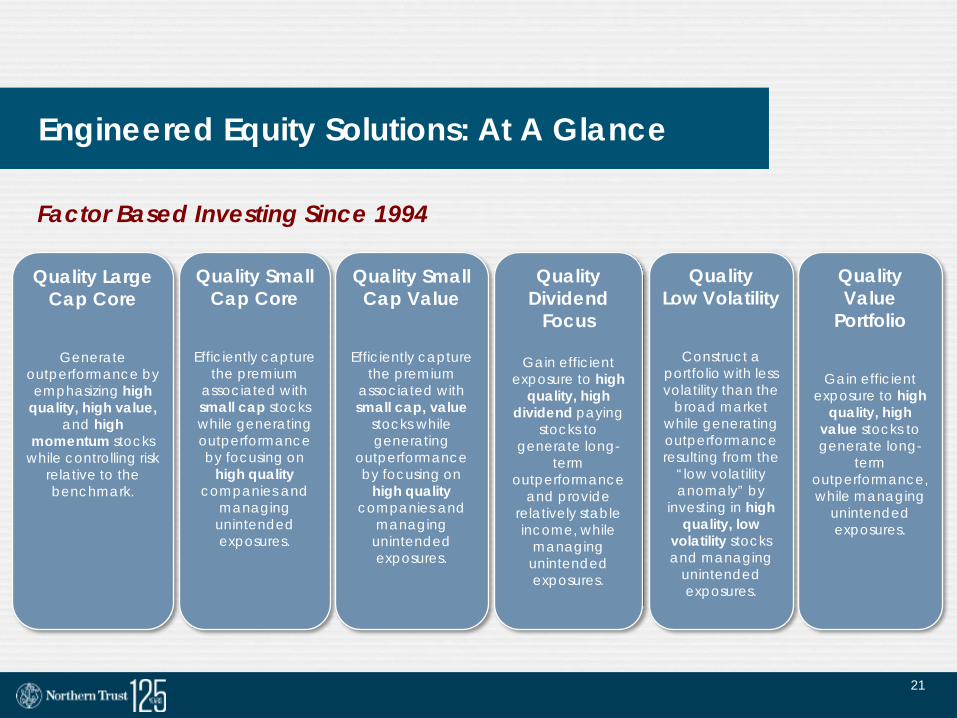
Quality Small Cap Core
Efficiently capture the premium
associated with small cap stocks while generating outperformance by focusing on
high quality companies and
managing unintended exposures.
Quality Small Cap Value
Efficiently capture the premium
associated with small cap, value
stocks while generating
outperformance by focusing on
high quality companies and
managing unintended exposures.
Quality Large Cap Core
Generate outperformance by emphasizing high
quality, high value, and high
momentum stocks while controlling risk
relative to the benchmark.
Quality Dividend
Focus
Gain efficient exposure to high
quality, high dividend paying
stocks to generate long-
term outperformance
and provide relatively stable income, while
managing unintended exposures.
Quality Low Volatility
Construct a portfolio with less volatility than the
broad market while generating outperformance resulting from the
“low volatility anomaly” by
investing in high quality, low
volatility stocks and managing
unintended exposures.
Quality Value
Portfolio
Gain efficient exposure to high
quality, high value stocks to generate long-
term outperformance, while managing
unintended exposures.
Engineered Equity Solutions: At A Glance
Factor Based Investing Since 1994
22
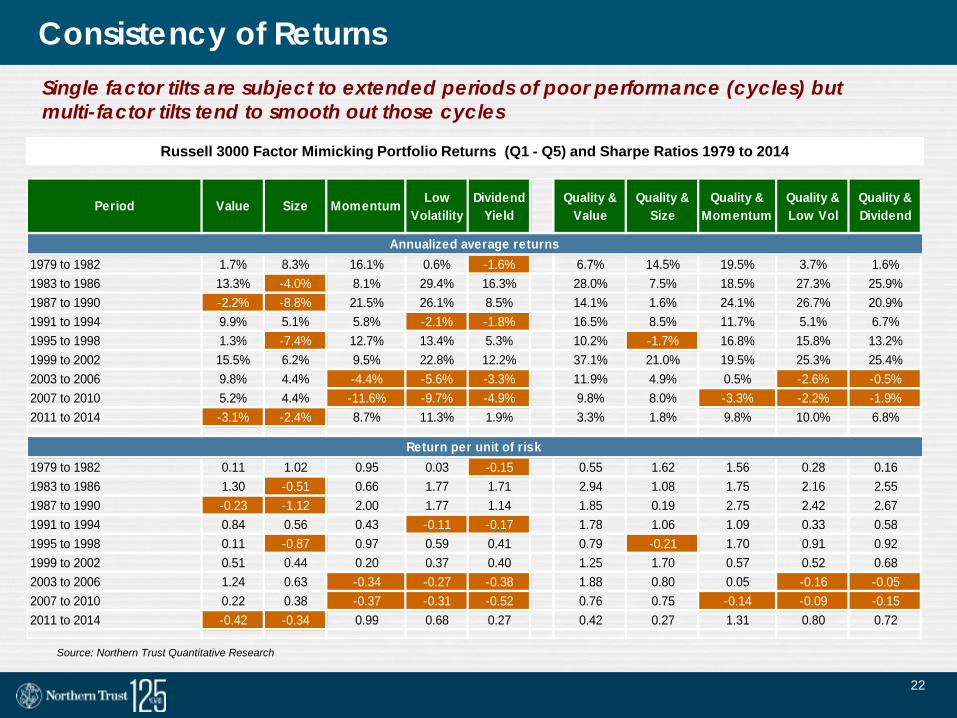
Consistency of Returns Single factor tilts are subject to extended periods of poor performance (cycles) but multi-factor tilts tend to smooth out those cycles
Russell 3000 Factor Mimicking Portfolio Returns (Q1 - Q5) and Sharpe Ratios 1979 to 2014
Source: Northern Trust Quantitative Research
Period Value Size Momentum LowVolatility
DividendYield
Quality &Value
Quality &Size
Quality &Momentum
Quality &Low Vol
Quality &Dividend
1979 to 1982 1.7% 8.3% 16.1% 0.6% -1.6% 6.7% 14.5% 19.5% 3.7% 1.6%1983 to 1986 13.3% -4.0% 8.1% 29.4% 16.3% 28.0% 7.5% 18.5% 27.3% 25.9%1987 to 1990 -2.2% -8.8% 21.5% 26.1% 8.5% 14.1% 1.6% 24.1% 26.7% 20.9%1991 to 1994 9.9% 5.1% 5.8% -2.1% -1.8% 16.5% 8.5% 11.7% 5.1% 6.7%1995 to 1998 1.3% -7.4% 12.7% 13.4% 5.3% 10.2% -1.7% 16.8% 15.8% 13.2%1999 to 2002 15.5% 6.2% 9.5% 22.8% 12.2% 37.1% 21.0% 19.5% 25.3% 25.4%2003 to 2006 9.8% 4.4% -4.4% -5.6% -3.3% 11.9% 4.9% 0.5% -2.6% -0.5%2007 to 2010 5.2% 4.4% -11.6% -9.7% -4.9% 9.8% 8.0% -3.3% -2.2% -1.9%2011 to 2014 -3.1% -2.4% 8.7% 11.3% 1.9% 3.3% 1.8% 9.8% 10.0% 6.8%
1979 to 1982 0.11 1.02 0.95 0.03 -0.15 0.55 1.62 1.56 0.28 0.161983 to 1986 1.30 -0.51 0.66 1.77 1.71 2.94 1.08 1.75 2.16 2.551987 to 1990 -0.23 -1.12 2.00 1.77 1.14 1.85 0.19 2.75 2.42 2.671991 to 1994 0.84 0.56 0.43 -0.11 -0.17 1.78 1.06 1.09 0.33 0.581995 to 1998 0.11 -0.87 0.97 0.59 0.41 0.79 -0.21 1.70 0.91 0.921999 to 2002 0.51 0.44 0.20 0.37 0.40 1.25 1.70 0.57 0.52 0.682003 to 2006 1.24 0.63 -0.34 -0.27 -0.38 1.88 0.80 0.05 -0.16 -0.052007 to 2010 0.22 0.38 -0.37 -0.31 -0.52 0.76 0.75 -0.14 -0.09 -0.152011 to 2014 -0.42 -0.34 0.99 0.68 0.27 0.42 0.27 1.31 0.80 0.72
Annualized average returns
Return per unit of risk

23
-20%
-15%
-10%
-5%
0%
5%
10%
15%
20%
25%
Northern Trust Quality Low Volatility S&P 500 Low Volatility MSCI USA Minimum Volatility
Low Volatility Strategies: Sector Exposure Comparison
Sector Weights vs. Russell 1000
Source: Northern Trust Quantitative Research. Data as of 3/31/2015.
24
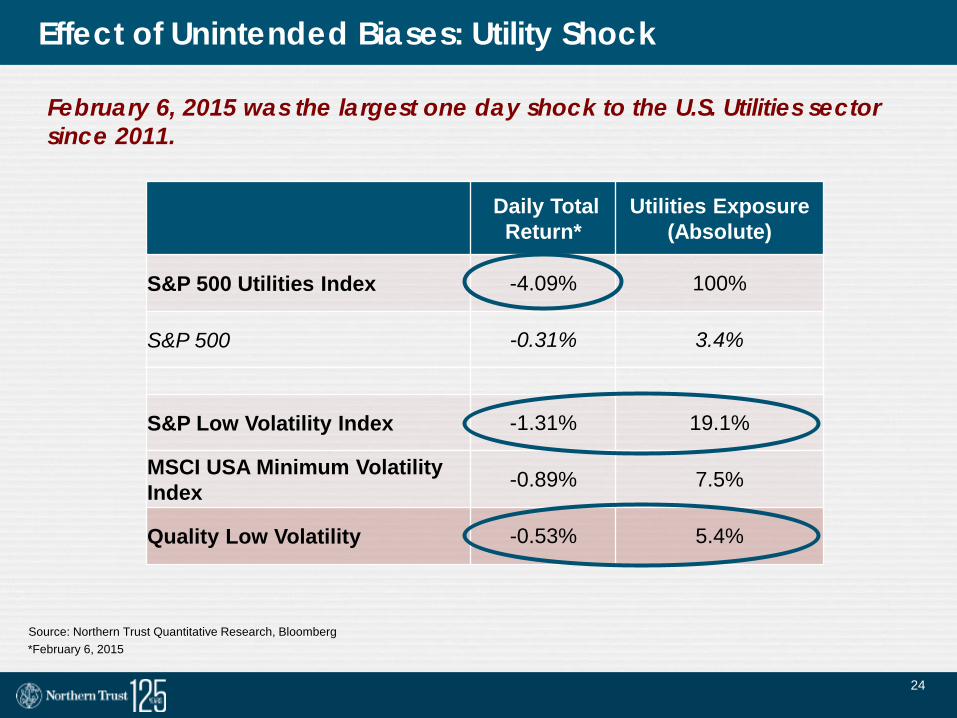
Effect of Unintended Biases: Utility Shock
February 6, 2015 was the largest one day shock to the U.S. Utilities sector since 2011.
Daily Total Return*
Utilities Exposure (Absolute)
S&P 500 Utilities Index -4.09% 100%
S&P 500 -0.31% 3.4%
S&P Low Volatility Index -1.31% 19.1%
MSCI USA Minimum Volatility Index -0.89% 7.5%
Quality Low Volatility -0.53% 5.4%
*February 6, 2015 Source: Northern Trust Quantitative Research, Bloomberg
25
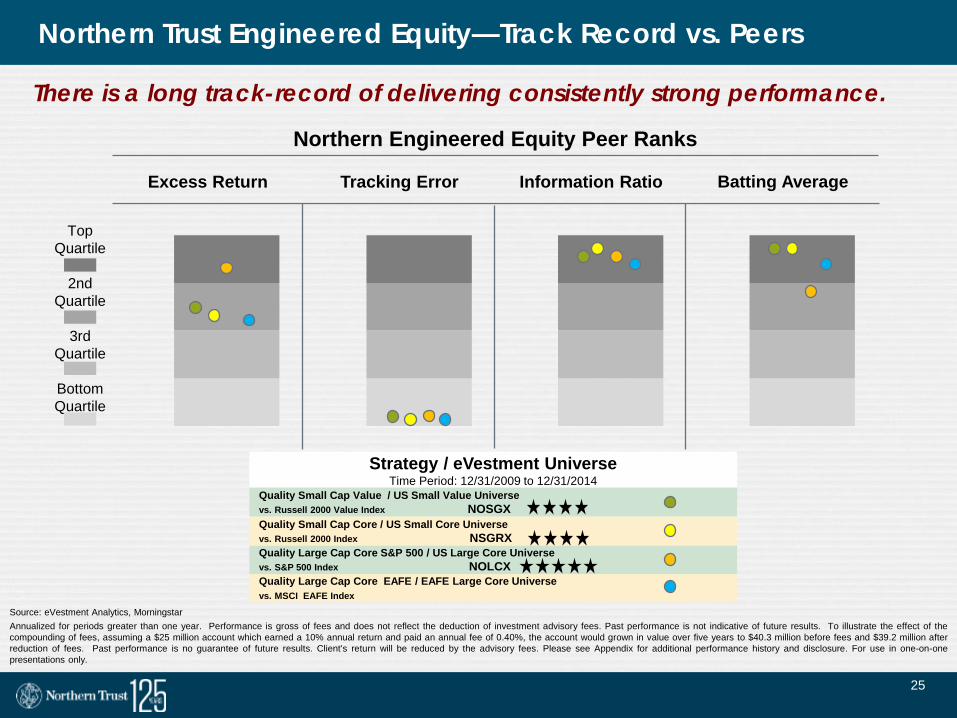
Top Quartile
2nd
Quartile
3rd Quartile
Bottom Quartile
Excess Return Tracking Error Batting Average Information Ratio
Northern Engineered Equity Peer Ranks
Strategy / eVestment Universe Time Period: 12/31/2009 to 12/31/2014
Quality Small Cap Value / US Small Value Universe vs. Russell 2000 Value Index NOSGX Quality Small Cap Core / US Small Core Universe vs. Russell 2000 Index NSGRX Quality Large Cap Core S&P 500 / US Large Core Universe vs. S&P 500 Index NOLCX Quality Large Cap Core EAFE / EAFE Large Core Universe vs. MSCI EAFE Index
Source: eVestment Analytics, Morningstar Annualized for periods greater than one year. Performance is gross of fees and does not reflect the deduction of investment advisory fees. Past performance is not indicative of future results. To illustrate the effect of the compounding of fees, assuming a $25 million account which earned a 10% annual return and paid an annual fee of 0.40%, the account would grown in value over five years to $40.3 million before fees and $39.2 million after reduction of fees. Past performance is no guarantee of future results. Client’s return will be reduced by the advisory fees. Please see Appendix for additional performance history and disclosure. For use in one-on-one presentations only.
Northern Trust Engineered Equity—Track Record vs. Peers
There is a long track-record of delivering consistently strong performance.
26
Questions?
Michael Hunstad
Meggan Friedman
27
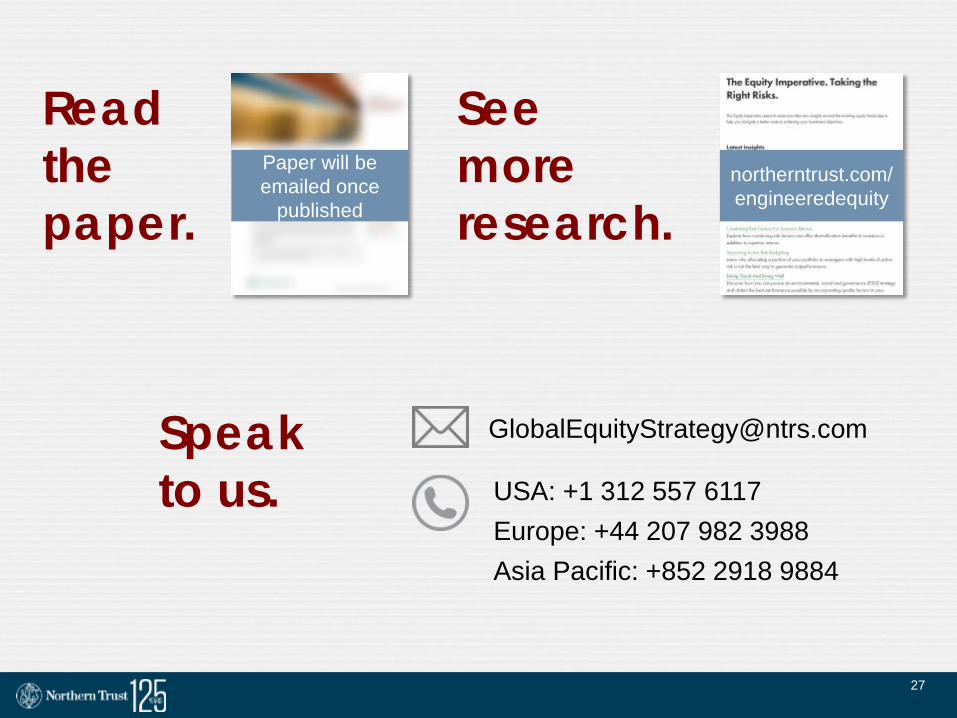
Read the paper.
See more research.
Speak to us.
northerntrust.com/ engineeredequity
USA: +1 312 557 6117 Europe: +44 207 982 3988 Asia Pacific: +852 2918 9884
Paper will be emailed once
published
28
Important Information
This material is directed to eligible counterparties and professional clients only and should not be relied upon by retail investors. This presentation is intended only for the exclusive benefit and use of our clients. Northern Trust and its affiliates may have positions in, and may effect transactions in, the markets, contracts and related investments described herein, which positions and transactions may be in addition to, or different from, those taken in connection with the investments described herein. Important Information Regarding Hypothetical Returns – Where hypothetical portfolio data is presented, the portfolio analysis assumes the hypothetical portfolio maintained a consistent asset allocation (rebalanced monthly) for the entire time period shown. Hypothetical portfolio data is based on publicly available index information. All information is assumed to be accurate and complete but is not guaranteed. Hypothetical portfolio data contained herein does not represent the results of an actual investment portfolio but reflects the historical index performance of the strategy described which were selected with the benefit of hindsight. Components of the hypothetical portfolio were selected primarily utilizing actual historic market risk and return data. If the hypothetical portfolio would have been actively managed, it would have been subject to market conditions that could have materially impacted performance and possibly resulted in a significant decline in portfolio value. The information in this presentation reflects prevailing market conditions and our judgment as of this date, which are subject to change. Past performance is no guarantee of future results. All material has been obtained from sources believed to be reliable, but the accuracy, completeness and interpretation cannot be guaranteed. The information does not constitute investment advice or a recommendation to buy or sell any security and is subject to change without notice Issued in the UK by Northern Trust Global Investments Limited (NTGIL). NTGIL is authorised and regulated by the Financial Conduct Authority in the United Kingdom. Registered in England 03929218. Registered Office: 50 Bank Street, London E14 5NT. Northern Trust Global Investments (NTGI) comprises Northern Trust Investments, N.A. (NTI), Northern Trust Global Investments Limited (NTGIL), Northern Trust Global Investments Japan, K.K. (NTGIJ), the investment advisor division of The Northern Trust Company (TNTC) and Northern Trust Global Advisors, Inc. (NTGA), and its subsidiaries to offer investment products and services to personal and institutional markets. As of 03/31/2015, NTGI had assets under management totaling $960.1 billion. For purposes of compliance with the Global Investment Performance Standards (GIPS®), we have defined our firm as Northern Trust Global Investments Services (NTGIS, a subset of NTGI) that includes those investment products managed by NTI, NTGIL, NTGIJ, and TNTC that are distributed through national channels. 03/31/2015 Northern Trust Asset Management Services had assets under management totaling $791.8 billion.


![lr V≤ Xmg]m{Y - samarthramdas400.in/cite>MaUHù_cr](https://img.pdfslide.us/doc/110x75/5af7c1867f8b9a44658b7d2d/lr-v-xmgmy-.jpg)
![ekuuh; v/;{k egksn;]finance.rajasthan.gov.in/docs/budget/statebudget/2018...VISION-2020](https://img.pdfslide.us/doc/110x75/5ab6d01e7f8b9ab7638e1dfe/ekuuh-vk-egksn.jpg)