Embed Size (px)
Citation preview
Sierra Leone National Nutrition Survey 2017 SLNNS 2017
i | P a g e
SIERRA LEONE
NATIONAL NUTRITION
SURVEY 2017

Sierra Leone National Nutrition Survey 2017 SLNNS 2017
ii | P a g e
SIERRA LEONE
NATIONAL NUTRITION SURVEY 2017
August 28 – October 10, 2017
Sierra Leone National Nutrition Survey 2017 SLNNS 2017
iii | P a g e
FOREWORD The implementation of Sierra Leone National Nutrition Survey 2017 was led by technical oversight and management of Action Against Hunger’s Consultant, Dr Tom Oguta, who was recruited from Action Against Hunger Canada roster of SMART Survey consultants. The consultant managed the survey from Planning, Implementation, Data Analysis, and Reporting. The consultant disseminated preliminary report in October 2017 and collected inputs from participants that were used later to finalize the report. The consultant did coordination of the survey from training, field pretest, including management of Data entry, quality control, and analysis and reporting. This report summarizes the findings of Sierra Leone National Nutrition Survey of 2017, funded by Irish Aid and carried out by the Ministry of Health and Sanitation (MoHS), Directorate of Food and Nutrition (DFN) and Action Against Hunger. The fieldwork took place between August 28th and October 10th, 2017. Additional information regarding Sierra Leone National Nutrition Survey 2017 can be obtained from: Directorate of Food and Nutrition Ministry of Health and Sanitation, Sierra Leone Central Medical Stores, Freetown Sierra Leone Telephone: +23276300770 Email: [email protected] Further information regarding Sierra Leone National Nutrition Survey can also be obtained from: Country Director/Head of Mission Action Against Hunger, 10 Sall Drive Cockle Bay, Off Aberdeen Road Freetown, Sierra Leone Telephone: +23278151217 Email: [email protected] National Coordination and Management Committee of SLNNS 2017 Aminata Shamit Koroma (Directorate of Food and Nutrition-MOHS Sierra Leone) Kajali Paintal (Nutrition Program Manager-UNICEF Hannah Yankson (Nutrition Officer- World Health Organization- WHO) Fortune Maduma (Nutrition Officer-World Food Program-WFP) Damarice Ager (Action Against Hunger-Health and Nutrition HoD) Mumin Kallon (Action Against Hunger (Deputy HoD Nutrition) Francis Tommy (Statistics Sierra Leone- Principal Statistician) Dr. Mohammed Foh (SUN Secretariat) Dr Brima Kargbo Anwar Ali Chief Medical officer Country Director Ministry of Health and Sanitation Action Against Hunger Sierra Leone

Sierra Leone National Nutrition Survey 2017 SLNNS 2017
iv | P a g e
ACKNOWLEDGEMENT
The Directorate of Food and Nutrition within the Ministry of Health and Sanitation role is to oversee
nutrition status of Sierra Leonian population and offer directives for improving and ensuring
population to meet their nutritional needs in order to prevent undernutrition. The implementation of
Sierra Leone National Nutrition Survey 2017 remained successful because of joint efforts and
consultations with Nutrition Technical Working Group (NTWG) members that include UNICEF,
WFP, WHO, FAO, MAFFS, Sun Secretariat, Statistics Sierra Leone, Action Against Hunger, Helen
Keller, Focus 1000 and other individuals who might have not been mentioned. The coordination of
SLNNSwas well organized and managed by the DFN from inception to final implementation of the
activity. The NTWG were exceptional during this period since they were also responding to the
Mudsilde emergency at the same time, this did not prevent them from ensuring the two important
activities were accomplished simaltaniously.
The DFN and entire NTWG would like to convey special gratitude to Irish Aid for funding the
Survey, and Action Against Hunger for providing the leadership on successful completion of the
survey in collaboration with the DFN and NTWG members. Special thanks goes to Sierra Leone
Statistics, Francis Tommy who was instrumental in ensuring sampling was done in accordance with
incountry policies and production of maps that supported survey team in the field throughout the
activity implementation. Special recognition is extended to WHO, UNICEF, FAO, WFP, MAFFS,
SUN Secretariat, Action Against Hunger and Helen Keller for technical support offered during the
activity implementation till preliminary and final report dissemination; their contribution especially
during preliminary report dissemination made it easier for consultant to produce final results timely.
More recognition and thanks goes to DHMT members, the DMOs who offered technical insight
during preliminary report dissemination.
DFN and Action Against Hunger would also like to extend further gratitude to WHO and Focus 1000
for their support in providing Tablets for data collection and WFP for transportation assistance in
Makeni and Tonkolili districts. Lastly, the DFN would like to extend appreciation to Action Against
Hunger not only for managing funds and logistics and entire coordination but also technical support
thorought the survey. The enormous technical oversight offered from Action Against Hunger
headquarter in Paris from Nutrition and Health Technical Advisors was commendable; these include
identification, evaluation and recruitment of survey consultant, remote backup to the consultant and
final dissemination of report to stakeholders.
Aminata Shamit Koroma
Director of Food and Nutrition
Ministry of Health and Sanitation

Sierra Leone National Nutrition Survey 2017 SLNNS 2017
v | P a g e
Table of Contents
FOREWORD ................................................................................................................................................ iii
ACKNOWLEDGEMENT ............................................................................................................................. iv
List of Tables .............................................................................................................................................. viii
List of Figures ............................................................................................................................................... ix
List of Abbreviations & Acronyms ............................................................................................... x Glossary ....................................................................................................................................................... xii
EXECUTIVE SUMMARY ........................................................................................................................... xv
1. INTRODUCTION ...................................................................................................................... 1 1.1 General Background ........................................................................................................................... 1
1.2 Justification ........................................................................................................................................... 3
1.3 Nutrition Context .................................................................................................................................. 3
1.3.1 Sources of Nutrition Information ............................................................................................... 3
1.3.2 Nutrition Situation in the country: Secondary Review ........................................................... 4
2 OBJECTIVES ........................................................................................................................... 5 2.1 Overall Objective .................................................................................................................................. 5
2.2 Specific Objectives .............................................................................................................................. 5
3. METHODOLOGY ..................................................................................................................... 6 3.1 Study Design ........................................................................................................................................ 6
3.2 Study Population .................................................................................................................................. 6
3.3 Sampling ............................................................................................................................................... 6
3.3.1 Sampling Strategy ....................................................................................................................... 6
3.3.2 Sample Size Calculation ............................................................................................................ 6
3.3.3 Cluster Selection ......................................................................................................................... 8
3.3.4 Household Selection ................................................................................................................... 8
3.4 Conceptual Framework ....................................................................................................................... 9
3.5 Study Tools ........................................................................................................................................... 9
3.6 Field Data Collection Procedures .................................................................................................... 10
3.6.1 Social mobilization .................................................................................................................... 10
3.6.2 Consent Process ....................................................................................................................... 10
3.6.3 Team Selection and Composition........................................................................................... 10
3.6.4 Team Training & Pretesting ..................................................................................................... 11
3.6.5 Interviews and Measurements ................................................................................................ 12
4. DATA MANAGEMENT PLAN .................................................................................................13 4.1 Data Collection ................................................................................................................................... 13

Sierra Leone National Nutrition Survey 2017 SLNNS 2017
vi | P a g e
4.2 Data Processing and Analysis Plan ................................................................................................ 13
4.3 Data Quality Control .......................................................................................................................... 13
5. SURVEY COORDINATION & MANAGEMENT .......................................................................14 5.1 Study Coordination ............................................................................................................................ 14
5.2 Logistics & Management .................................................................................................................. 16
5.3 Partners Participation ........................................................................................................................ 16
6. SURVEY RESULTS ................................................................................................................17 6.1 Demographic Characteristics of the Survey Population (households and children) ............... 17
6.2 Child Nutrition Status (Anthropometric Results) ........................................................................... 20
6.2.1 Prevalence of acute Malnutrition based on Weight-for-Height Z scores (WHZ) ............. 20
6.2.2 Prevalence of acute Malnutrition based on Mid Upper Arm Circumference (MUAC) .... 23
6.2.2.1 Age Disaggregated Levels of Wasting in Children 6-59 months based on Weight-for-
Height Z scores (WHZ) .......................................................................................................................... 26
6.2.2.2 Age Disaggregated Levels of Wasting in Children 6-59 months based on MUAC .... 26
6.2.3 Prevalence of Underweight based on Weight-for-Age Z scores (WAZ) ........................... 27
6.2.3.1 Age Disaggregated Levels of Underweight based on Weight-for-Age Z scores (WAZ)
29
6.2.4 Prevalence of Stunting based on Height-for-Age Z scores (HAZ) .................................... 30
6.2.4.1 Age Disaggregated Levels of Stunting based on Height-for-Age Z scores (HAZ) ..... 32
6.2.5 Prevalence of Overweight of children (6-59) based on Weight-for-Height Z scores
(WHZ) 32
6.3 Maternal Health and Nutrition .......................................................................................................... 34
6.3.1 Demographic distribution of Women of Reproductive Age (15-49 Years) ....................... 34
6.3.2 Nutrition Status of Women (15-49 years) .............................................................................. 34
6.3.3 Dietary Diversity among Women (15-49 years) ................................................................... 36
6.4 Mortality Results ................................................................................................................................ 39
6.6 Health Programmes Coverage ........................................................................................................ 42
6.7 Infant and Young Child Feeding (IYCF) Practices........................................................................ 43
6.7.1 Breastfeeding Practices ........................................................................................................... 43
6.7.2 Complementary Feeding Practices ........................................................................................ 45
6.7.3 Child Dietary Diversity among children (6-23 months) ........................................................ 46
6.8 Food Security & Livelihoods ............................................................................................................ 49
6.8.1 Households’ Cultivation, Livestock Ownership and Staple Foods .................................... 49
6.8.2 Households’ Source of Income and Food Expenditures ..................................................... 50
6.8.3 Households’ Food Consumption & Dietary Diversity ........................................................... 52
6.8.4 Household’s Hunger, Livelihood Shocks and Coping Strategies ...................................... 53

Sierra Leone National Nutrition Survey 2017 SLNNS 2017
vii | P a g e
6.9 Water, Sanitation & Hygiene (WASH) ............................................................................................ 56
6.9.1 Water Access & Quality ........................................................................................................... 56
6.9.2 Access to Sanitation Facilities ................................................................................................ 59
6.9.3 Hygiene Practices ..................................................................................................................... 60
7. DISCUSSION .........................................................................................................................61 7.1 Nutrition Situation .............................................................................................................................. 61
7.2 Death Rates ........................................................................................................................................ 63
7.3 IYCF Practices ................................................................................................................................... 64
7.4 Food Security ..................................................................................................................................... 66
7.5 Possible factors associated with Malnutrition in Sierra Leone .................................................... 66
8. CONCLUSIONS & RECOMMENDATIONS .............................................................................68 8.1 Conclusions ........................................................................................................................................ 68
8.2 Recommendations ............................................................................................................................. 68
9. ANNEXES ................................................................................................................................. I Annex A: Household Survey Tool ...................................................................................................... I
Annex B: Child & Maternal Data Tools ............................................................................................ III
Annex C: Demography & Mortality Questionnaires ....................................................................... IX
Annex D: Sample of Local Events Calendar ................................................................................... X
Annex E: List of Survey Team Members ........................................................................................ XI
Annex F: Team Members Roles & Responsibilities .................................................................... XIII
Annex G: Referral Form .................................................................................................................... XV
Annex H: List of Selected EAs/Clusters ........................................................................................ XVI
10. REFERENCES .................................................................................................................... XXVI

Sierra Leone National Nutrition Survey 2017 SLNNS 2017
viii | P a g e
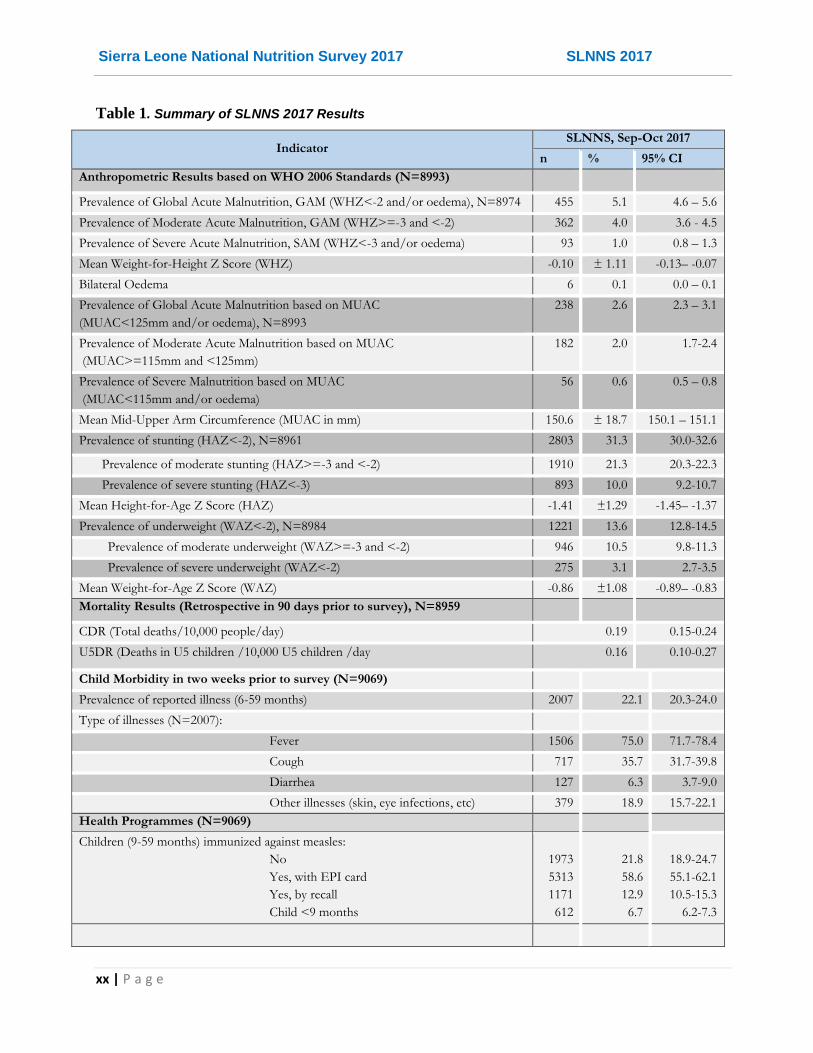
List of Tables Table 1. Summary of SLNNS 2017 Results ................................................................................................... xx
Table 2: Sample size calculation for anthropometric, mortality and IYCF surveys .......................................... 7
Table 3: Distribution of age and sex of sample .............................................................................................. 17
Table 4: Response Rate and Geographic Coverage of the SLNNS 2017 ..................................................... 18
Table 5: Prevalence of acute malnutrition based on weight-for-height z- score and/or oedema by sex ....... 20
Table 6: Prevalence of Global, Moderate and Severe Acute Malnutrition in Children (6-59 months) based on
WHZ Scores by District................................................................................................................................... 20
Table 7: Data Quality Evaluation Report for the SLNNS 2017 ....................................................................... 21
Table 8: Prevalence of acute malnutrition by age, based on weight-for-height Z scores and/or oedema ..... 23
Table 9: Distribution of acute malnutrition and oedema based on weight-for-height z-scores ...................... 23
Table 10: Prevalence of acute malnutrition based on MUAC cut off's (and/or oedema) and by sex ............. 23
Table 11: Prevalence of Global, Moderate and Severe Acute Malnutrition in Children (6-59 months) based on
MUAC by District ............................................................................................................................................ 25
Table 12: Prevalence of acute malnutrition by age, based on MUAC cut off's and/or oedema ..................... 25
Table 13: Age Disaggregated wasting among 6-23 months and 24-59 months ............................................ 26
Table 14: Age Disaggregated wasting (based on MUAC) among 6-23 months and 24-59 months .............. 27
Table 15: Prevalence of underweight based on weight-for-age z-scores by sex ........................................... 27
Table 16: Prevalence of underweight by age, based on weight-for-age z-scores ......................................... 28
Table 17: Prevalence of National, Moderate and Severe Underweight in Children (6-59 months) based on
WAZ Scores by District ................................................................................................................................... 29
Table 18: Age Disaggregated Underweight among 6-23 months and 24-59 months .................................... 30
Table 19: Prevalence of stunting based on height-for-age z-scores and by sex ........................................... 30
Table 20: National prevalence of stunting by age based on height-for-age z-scores .................................... 30
Table 21: Prevalence of National, Moderate and Severe Stunting in Children (6-59 months) based on HAZ
Scores by District ............................................................................................................................................ 31
Table 22: Age Disaggregated Stunting Rates among 6-23 months and 24-59 months ................................. 32
Table 23: National prevalence of overweight based on weight for height cut offs and by sex (no oedema) . 33
Table 24: National prevalence of overweight by age based on weight-for-heightz-scores ............................ 33
Table 25: Mean z-scores, Design Effects and excluded subjects .................................................................. 33
Table 26: Demographic distribution of assessed women (15-49 years) by district ........................................ 34
Table 27: Acute Malnutrition among Women (15-49 years) based on MUAC by district ............................... 35
Table 28: Nutrition status of Women (15-49 years) based on Body Mass Index (BMI) by district ................. 36
Table 29: Women Consumption of Different Food Groups by district ............................................................ 37
Table 30: Proportion of Women Consuming Minimum Dietary Diversity by district ....................................... 38
Table 31: Mortality Rates SLNNS 2017.......................................................................................................... 39
Table 32: Prevalence of reported common illness among children (6-59 months) ........................................ 40
Table 33: Health facility where treatment services are sought (6-59 months) by district ............................... 41
Table 34: Immunization Status and Programme Coverage by district ........................................................... 42
Table 35: Breast-feeding Practices among infant and young children (0-23 months) by district ................... 43
Table 36: Exclusive and Continued Breast feeding Indicators, SLNNS 2017 ................................................ 44
Table 37: Complementary Feeding Indicators, SLNNS 2017 ........................................................................ 45
Table 38: Dietary Diversity and Meal Frequency among children (6-23 months by district ........................... 46
Table 39: Consumption of different food groups among children (6-23 months by district ............................ 47
Table 40: Household’s Crop Cultivation, Livestock Ownership and Main Staple Foods ............................... 49
Table 41: Main Sources of Income & Livelihoods .......................................................................................... 51
Table 42: Household Food Expenditures ....................................................................................................... 51
Table 43: Households Experience of Shocks in the preceding 12 Months .................................................... 53
Table 44: Households Experience of Hunger the preceding 4 Weeks ........................................................... 54

Sierra Leone National Nutrition Survey 2017 SLNNS 2017
ix | P a g e
Table 45: Households Coping Strategies during food stress in the preceding one month ............................ 55
Table 46: Households Main Source of drinking water .................................................................................... 56
Table 47: Households access to drinking water ............................................................................................. 57
Table 48: Households Time to collect water and household Water Use ........................................................ 58
Table 49: Households Access to Sanitation Facilities .................................................................................... 59
Table 50: Household members’ hand washing practices ............................................................................... 60
Table 51: WHO Classification of severity of malnutrition in a community ...................................................... 61
List of Figures
Figure 1: Map of Sierra Leone showing geographic location and the district administrative units ... 1
Figure 2: UNICEF Conceptual Framework of Malnutrition .............................................................. 9
Figure 3: SLNNS 2017 Organogram ............................................................................................ 15
Figure 4: Population age and sex pyramid ................................................................................... 18
Figure 5: Map of Data Submission Points Showing Coverage in SLNNS 2017 ............................ 19
Figure 6: Distribution of weight-for-height Z Scores ..................................................................... 22
Figure 7: Cumulative distributions of Wasting based on MUAC, SLNNS 2017 ............................. 24
Figure 8: Distributions of weight-for-age Z scores in Children 6-59 months, SLNNS 2017 ........... 28
Figure 9: Distributions of Height-for Age Z Scores in Children 6-59 Months, SLNNS 2017 .......... 31
Figure 10: Food groups most consumed by children in 24 hr recall.............................................. 48
Figure 11 National Rates of Key IYCF Indicators, SLNNS 2017 .................................................. 48
Figure 12: Household's Main Source of Income ........................................................................... 50
Figure 13: Changes in Mean Household Dietary Diversity Score (HDDS) for 2014 and 2017 ...... 52
Figure 14: Household Dietary Diversity based on 12 food groups, SLNNS 2017 ......................... 53
Figure 15: Trends in levels of acute malnutrition (WHZ<-2 or oedema WHO 2006) ..................... 63
Figure 16: Trends in Mortality Rates (2010-2017) in Sierra Leone ............................................... 64

Sierra Leone National Nutrition Survey 2017 SLNNS 2017
x | P a g e
List of Abbreviations & Acronyms
AAH-
SL
: Action Against Hunger, Sierra
leone
ITN : Insecticide Treated Net
ACF-F : Action Contre La Faim, France IYCF : Infant and Young Child
feeding
BMI : Body Mass Index LLITN : Long Lasting Insecticide
Treated Net
CDR : Crude Death Rate MAM : Moderate Acute Malnutrition
CHC : Community Health Center MICS : Multiple Indicator Cluster
Survey
CHP : Community Health Post MOHS : Ministry of Health and
Sanitation
CI : Confidence interval (at 95%
throughout report)
MUAC : Mid Upper Arm Circumference
CSD : Child Survival and Development NCA : Nutrition Causal Analysis
DEFF : Design Effect NFNS-
IP
: National Food and Nutrition
Security Implementation Plan
DFN : Directorate of Food and Nutrition NFNSP : National Food and Nutrition
Security Policy
DHS : Demographic Health Survey NGO : Non-Governmental
Organization
EA : Enumeration Area NNIS : National Nutrition Information
System
ENA : Emergency Nutrition Assessments NNS : National Nutrition Strategy
EPI : Expanded Programme on
Immunization
OTP : Out-Patient Therapeutic
Programme
FCS : Food Consumption Score PLW : Pregnant & Lactating Women
FCG : Food Consumption Group PPS : Probability Proportional to
Size
FSL : Food Security and Livelihoods PRSP : Poverty Reduction Strategy
Papers
GAM : Global Acute Malnutrition rCSI : reduced Coping Strategy
Index
GFD : General Food Distribution RUSF : Ready to Use Supplementary
Food
HAZ : Height for Age Z scores RUTF : Ready to Use Therapeutic
Food

Sierra Leone National Nutrition Survey 2017 SLNNS 2017
xi | P a g e
HDDS : Household Dietary Diversity Score SAM : Severe Acute Malnutrition
HFA : Height for Age SC : Stabilization Centre
HH : Household SCUK : Save the children, UK
HHS : Household Hunger Scale SD : Standard Deviation (measure
of spread around the mean)
HKI : Hellen Keller International SE : Standard Error
HMIS : Health Management Information
System
SFP : Supplementary Feeding
Programme
IDPs : Internally Displaced Persons SLNNS : Sierra Leone National
Nutrition Survey
IMAM : Integrated Management of Acute
Malnutrition
SMART : Standardized Monitoring and
Assessment of Relief and
Transitions
INGO : International Non-Governmental
Organization
SSL : Statistics Sierra Leone
IPC : Integrated Phase Classification TFC : Therapeutic Feeding Program
TWG : Technical Working Group
TSFP : Targeted Supplementary Feeding
Program
WAZ : Weight for Age Z scores
U5DR : Under 5 Death Rate WFA : Weight for Age
UNHCR : United Nations Higher
Commission for Refugees
WFP : World Food Program
UNICEF : United Nations International
Children’s Emergency Fund
WFH : Weight for Height
VAD : Vitamin A Deficiency WHO : World Health Organization
WASH : Water, Sanitation and Hygiene WHZ : Weight for Height Z scores
VAS : Vitamin A Supplementation
Sierra Leone National Nutrition Survey 2017 SLNNS 2017
xii | P a g e
Glossary
Body mass index (BMI): An index of weight-for-height that is commonly used to classify
underweight, overweight and obesity in adults. . It is defined as the weight in kilograms divided by
the square of the height in metres (kg/m2). Both high and low indexes are associated with poor
health. The normal range for a healthy adult is 18.5 to 24.9. A BMI below 18.5 is considered too
lean, while one above 25 is considered overweight. A BMI greater than 30 is considered obese,
and one greater than 40 is considered morbidly obese.
Breastfeeding: Child having received breast milk either directly from the mother or wet nurse
breast within the last 12 hours.
Coping Strategies Index (CSI): A numerical indicator of household food security based on a questionnaire about what people do in the absence of sufficient food or money to buy such food. CSI is used to predict food crises, identify specific areas of greatest need, and assess the impact of food aid programs in emergencies and to outline long-term trends.
Exclusive breastfeeding: means that the infant receives only breast milk. No other liquids or
solids are given – not even water – with the exception of oral rehydration solution, or drops/syrups
of vitamins, minerals or medicines. Exclusive breast-feeding is recommended for the first six
months of life.
Food security: situation that exists when 'all people, at all times, have physical and economic
access to sufficient, safe, and nutritious food to meet their dietary needs and food preferences for
an active and healthy life'. It entails availability, access, and utilization of sufficient food by all
people at all times for an active, healthy life.
Food Consumption Score (FCS): Food consumption pattern is computed based on Food
Consumption Score (FCS), which is a weighted score of frequency of consumption of food groups
and the nutritional value of the food. Based on the FCS, households are classified into food
consumption groups as poor, borderline, acceptable.
Global Acute Malnutrition (GAM) is the term used to include all children with moderate wasting,
severe wasting and/or oedema. It is defined as weight-for-height below -2 standard deviations
from the mean, and or no oedema.
Household Dietary Diversity Score (HDDS): is a measure of the range of food groups (cereals, vegetables, meat, fish, etc) consumed in a household over a reference period (24 hours recall). Twelve food groups are used in the evaluation and the HDDS ranges from 0 to 12. Households Dietary Diversity relates to nutrient adequacy (coverage of basic needs in terms of macro and micronutrients) and to diet variety/balance, which are two of the main components of diet quality.
Household Hunger Scale (HHS): is a tool to measure household food deprivation, used to improve targeting of interventions and evaluate food security policies. A simple questionnaire produces one of three scores: Little to no household hunger; moderate household hunger; and severe household hunger.
Integrated Food Security Phase Classification (IPC): is a scale developed by UN agencies and NGOs using existing data (mortality rates, GAM, access to food and water, security, etc) to place geographical areas into phases of food security ranging from “Generally food secure” to “Famine”, with the aim of harmonizing humanitarian analysis of and responses to crises, and ensuring the most efficient allocation of resources.

Sierra Leone National Nutrition Survey 2017 SLNNS 2017
xiii | P a g e
Livelihood: refers to the ways in which people earn an income, provide for themselves and their families. Programs that support livelihoods are designed to increase communities' ability to survive (economic, weather, etc) shocks.
Low Birth Weight (LBW): An infant born weighing less than 2,500 grams (5.5 pounds). In rural areas, this is estimated by the infant’s “relative size” to other babies, as assessed by the birth attendant or mother.
Malnutrition: refers to deficiencies, excesses or imbalances in a person’s intake of energy and/or
nutrients. Malnutrition covers two (2) broad groups of conditions: 1) undernutrition -which includes
stunting (low height for age), wasting (low weight for height), underweight (low weight for age) and
micronutrient deficiencies or insufficiencies (a lack of important vitamins and minerals); 2)
overnutrition – which includes overweight, obesity and diet-related noncommunicable diseases
(such as heart disease, stroke, diabetes and cancer).
Mid-upper arm circumference (MUAC): One of the anthropometric measures used in assessing
nutritional status. It is always measured on the left arm.
Moderate acute malnutrition (MAM) or moderate wasting: is defined as weight-for-height
between -3 and -2 standard deviations from the mean, or mid-upper arm circumference (MUAC)
between 115 and 125 mm, and no oedema).
Oedema: Pitting oedema on both feet (bilateral oedema) is the sign of kwashiorkor. Any
person with bilateral oedema has severe malnutrition and is classified as severely malnourished
even if the WFH z- score is normal.
Severe Acute Malnutrition (SAM) is the term used to include all children with severe wasting or
mid-upper arm circumference (MUAC) below 115 mm or children who have oedema.
Severe stunting, wasting, or underweight rate: A common benchmark used in health and
nutrition studies. It is technically defined as the percentage of children under five years of age who
suffer from severe stunting, wasting, or underweight, defined, respectively, as having a height-for-
age, weight-for-height, or weight-for-age value that is equal to or smaller than the value
corresponding to three standard deviations below the median of the WHO reference population—
that is, the value corresponding to –3 Z-scores with respect to WHO reference population (see
also the definitions of stunting, wasting, and underweight).
Stunted growth, also known as stunting is impaired growth and development that children
experience from poor nutrition, repeated infection, and inadequate psychosocial stimulation; and
major effect of, or adaptation to – chronic (as opposed to acute) malnutrition, which can impede
both physical and cognitive development. Children are defined as stunted (short for one’s age) if
their height-for-age is more than two standard deviations below the WHO Child Growth Standards
median.
Undernutrition: defined as failure to get enough nutrients for a healthy body, undernutrition takes
four (4) broad sub-forms of undernutrition: wasting, stunting, underweight, and deficiencies in
vitamins and minerals.
Underweight: When a child has low weight compared to other children his or her age.
“Underweight” is one way to measure malnutrition. It is defined as weight-for-age that is equal to
or smaller than the value corresponding to two standard deviations below the median of the global

Sierra Leone National Nutrition Survey 2017 SLNNS 2017
xiv | P a g e
reference population— that is, the value corresponding to –2 Z-scores with respect to the global
reference population (a population with a distribution of weight-for-age values that is considered
normal by international standards).
Vitamin A deficiency: A form of micronutrient deficiency resulting from inadequate intake or high
loss of vitamin A. Symptoms include growth retardation, night blindness in mild deficiency, and
xerophthalmia (drying of the cornea), which leads to complete blindness. In areas where vitamin A
deficiency is a public health problem, routine vitamin A supplementation is recommended in
infants and children 6-59 months of age as a public health intervention every 6 months to improve
vitamin A status and reduce child morbidity and mortality in the long term.
Wasting: Being thin in relation to one’s height is defined as weight-for-height less than minus two
standard deviations below the median of WHO reference population. It is a symptom of acute
undernutrition in children, usually a consequence of insufficient food intake or a high incidence of
infectious diseases, especially diarrhoea.
Z-score: also known as standard score is the number of standard deviations from the mean of a
normalized distribution of a reference population, in this case the WHO reference population. It is
calculated as the difference between individual value and the population mean, divided by the
population standard deviation.

Sierra Leone National Nutrition Survey 2017 SLNNS 2017
xv | P a g e
EXECUTIVE SUMMARY
The Sierra Leone National Nutrition Survey 2017 started on 28 August and ended on October 10,
2017. The Directorate of Food and Nutrition (DFN) of Sierra Leone’s Ministry of Health and
Sanitation (MOHS) and Action Against Hunger Sierra Leone, with funding from Irish Aid
conducted the survey in close collaboration and partnership with Sierra Leone Nutrition Technical
Working Group (TWG). A nutrition and mortality assessment using SMART methodology was
applied and the survey covered 15 statistical (14 districts plus 1) domains countrywide, including
the two districts of Bonthe and Kailahun that were not assessed during 2014 SLNNS. The main
objective of the survey was to assess the current nutrition status of the population especially
children 6-59 months old and women of reproductive age (15-49 years of age). Also included in
the survey was a retrospective mortality rate in the population at district level; and to evaluate the
major contextual factors contributing to undernutrition such as infant and young child feeding
(IYCF) practices; Food Security; Water, Sanitation and Hygiene (WASH); and Health situation in
Sierra Leone. Sierra Leone National Nutrition survey using SMART methodology assessment
carried out in 2014 compared with 2010 Sierra Leone National Nutrition survey results had shown
improvements prior to Ebola crisis. Hitherto, no up-to-date data for nutrition was available in
Sierra Leone that reflects post-Ebola context. The survey findings would thus help to evaluate
progress in nutrition interventions and to guide further program planning priorities for direct and
indirect nutrition interventions.
A two-stage cluster sampling methodology was used, and a total of 9069 children aged 6‐59
months from 9469 households in 477 clusters were examined for anthropometry, 4550 children
aged 0-23 months assessed forIYCF practices including 1106 children aged 0-5 months assessed
for exclusive breastfeeding practices. A total of 9,496 women (2, 784 pregnant/lactating and 6712
non pregnant/lactating) were assessed for their nutrition status and dietary diversity. Assessment
on mortality was conducted concurrently in 8959 households with the mean household size of 4.5
(±1.9) persons. Household related data, such as food security and livelihoods, water, sanitation
and hygiene (WASH) as well as health access were also collected in the 9469 households during
the assessment.
The national prevalence of Global Acute Malnutrition (GAM) was 5.1% (95%CI: 4.6-5.6),
moderate acute malnutrition (MAM) was 4.0% (95% CI: 3.6-4.5) and the severe acute malnutrition
(SAM) rate (WHZ<‐3 or oedema) was 1.0% (95%CI: 0.8-1.3), including six (0.1%) cases of
oedema. Boys were more acutely malnourished than girls were (p<0.05), and younger children
(aged 6-29 months) were more malnourished (p<0.05) than the older (aged 30-59 months)
children.
The results indicate acute malnutrition at indicate a poor nutrition situation phase (GAM rate of
5.0-9.9%) according to WHO classification according to WHO classification, and translate to
47,861 wasted children nationally. Although SLNNS 2017 findings shows slight increase in GAM
and MAM rates, but compared to the SLNNS 2014 findings, GAM and MAM rates were 4.7%
(95% CI: 4.3-5.2) and 3.7% (95% CI: 3.3-4.1) respectively. The deterioration is not statistically
significant, even after adjusting for the exclusion of two districts (Bonthe and Kailahun) that were
not assessed during SLNNS 2014, but significant deterioration during SLNNS 2017 was observed
in the Western Area especially Urban section.

Sierra Leone National Nutrition Survey 2017 SLNNS 2017
xvi | P a g e
The national prevalence of stunting (HAZ<-2) was 31.3% (95% CI: 30.0-32.6) translating to
293,736 stunted children (based on 2015 population census) with 21.3% (95% CI: 20.3-22.3)
moderately stunted and 10.0% (95% CI: 9.2-10.7) severely stunted, with more boys than girls
reportedly stunted (p<0.05). Stunting rates were also not statistically different compared to the
SLNNS 2014 findings, even after exclusion of the two districts. Although the levels of both wasting
and stunting have shown an improving trend over the past 10 years, stunting rates remain high
(>30%) indicating a persistent serious chronic malnutrition according to WHO Classification that
needs to be addressed comprehensively.
The national prevalence of acute malnutrition using MUAC (<23 cm) was 5.7% among the
pregnant and/or lactating women and 5.1% based on BMI of non pregnant/lactating women. The
prevalence of overweight and obesity was 18.4% and 7.5% respectively.
The crude death rate (CDR) and under five death rate (U5DR) of 0.19 (95% CI: 0.15-0.24) and
0.16 (95% CI; 0.10-0.27) were recorded respectively. The national (CDR) and (U5DR) rates are
below the SPHERE alert thresholds of 1/10,000/day and 2/10,000/day respectively and no
significant change observed from the (CDR) of 0.36 deaths/10,000/day and (U5DR) of and 0.83
under five deaths/10,000/day reported in SLNNS 2014.
Although breastfeeding is a widespread practice among the population with nearly all the
assessed children 0-23 months ever breastfed (99.1%), 88.2% still breastfeeding and 61.6% of 0-
6 months breastfed exclusively. There are significant variations in rates of breastfeeding and
complementary feeding indicators in some districts especially Western Area Urban, Bonthe and
Tonkolili that would require more effort to promote optimum breastfeeding benefits.
Complementary foods are still introduced to a large number of children (40%) before the age of
six months which is earlier than the WHO’s recommendation of initiation of complementary
feeding from 6 months. Mothers’ practice of early introduction to complementary feeding expose
these children to unhygienic feeding conditions and vulnerability to illnesses. More than 70% of
the children receive undiversified diet with poor monotonous diets reported widely in all the
districts. More than 50% of the children (6-24 months) assessed do not meet the recommended
minimum meal frequency for their age and breast feeding status and very few (13.9%) are fed on
vitamin A rich foods.
Although no disease outbreak was reported during the assessment, about one-quarter (22.1%) of
children had reportedly suffered from one or more childhood illnesses in the two weeks prior to
the assessment. Of those, who fell ill 75% of the children had fever; about 36% had cough and
6% reportedly had diarrhea. A further 19% reported suffering from other illnesses especially skin
and eye infections. Proportion of children who slept under mosquito net was (93.4%) and vitamin
A supplementation coverage was (80.3%) indicating good coverage. However, measles
immunization coverage was (71.5%) and deworming coverage was (69.1%)1 in the preceding 6
months. There was a short fall in deworming coverage below SPHERE recommended standard
levels of 80%, but this short fall could be attributed to recall bais since the SLNNS 2017 was
conducted 4 months after the last deworming campaign, as post event coverage survey for
deworming conducted within a week indicated coverage over 85%.
1 It is worth noting that the rates are likely to be higher given that the SMART survey was 4 months after the last round of mass deworming and is
subject to recall bias. All post event coverage surveys performed within the recommended 1 month show deworming coverage well over 85%

Sierra Leone National Nutrition Survey 2017 SLNNS 2017
xvii | P a g e
In conclusion acute nutrition situation in the country is poor, chronic malnutrition as expressed by
high stunting rates is serious according to WHO reference classifications although crude and
under five mortality rates remain below the SPHERE alert levels. The occurrence of both under
and over nutrition in children and women is an indication of the emerging double burden and
complexity of malnutrition in the country.
Even though the key underlying factors affecting the nutritional status of the children i.e. morbidity,
food insecurity, poor child care, lack of safe drinking water and limited sanitation and hygiene
facilities remain key risk factors, it is important to note that malnutrition is multifaceted and chronic
malnutrition is hinged on the basal socio-economic, education and cultural structures. The 2013
GoSL Nutrition for Growth (N4G) commitment of reducing the prevalence of stunting from 25.7%
to 11.7% by 2020, and achieving the 2030 Agenda for Sustainable Development of meeting
internationally agreed targets on stunting and wasting in children under 5 years of age by 2025
require continued concerted and integrated efforts among all the relevant sectors in the country. Table 1 provides a summary of the key findings. Specific recommendations are outlined below:
The poor acute nutrition situation and serious chronic nutrition situation in the country is
attributed to multiple and interrelated factors that call for continued integrated intervention efforts
to address both immediate needs in addition to developing long-term strategies to enhance
access to basic services; support to sustain livelihood systems and social protection mechanisms.
Specific recommendations include:
Immediate Interventions
Evaluate the need to maintain scale up of IMAM programme for rehabilitation of acutely malnourished children through sustained active case finding, continued self-referrals and capacity building of the existing CHP, CHC and MCHP staff and the community to manage acutely malnourished children.
Since the surveys has shown that nutrition admissions screening using MUAC is less sensitive and leaves out a significant proportion of deserving malnourished cases, the GoSL/MoHS should review the guidelines to use weight-for-height Z scores for admissions and encourage its implementation at the community/health facility levels.
Since the establishment of the national IMAM program and supportive treatment programs and associated WASH, food security and livelihood interventions by DFNS, line ministries and national NGOs with support from international UN and NGO partners, the MoHS covered many facilities and districts which did not have nutrition (SC,OTP, STP) services. It is important to maintain these services and to scale-up to more places that still do not have these nutrition services.
Protect the significant gains made over the years by strengthening the interagency and interdepartmental emergency response teams amidst the risks of shocks such as Ebola and cholera outbreaks, land/mud slides, flooding and droughts arising from climatic changes.
Cognizant to intensified health and nutrition education and interventions for improving social security, water, sanitation and hygiene (WASH) practices alongside nutrition programmes by the government and different UN & NGO programmes, these programmes need to be strengthened through integrated planning and implementation. Health, FSL and WASH based interventions should complement national nutrition programs in order to address the underlying causes of malnutrition
Conduct an integrated Nutrition Causal Analysis (NCA) Study for malnutrition such as LinkNCA to identify the predominant causes of stunting in a few satellite districts and prioritize
Sierra Leone National Nutrition Survey 2017 SLNNS 2017
xviii | P a g e
key areas of intervention. The study should include a qualitative enquiry to understand why boys tend to be more malnourished in the country as shown in this survey.
Conduct a Cost of Hunger (COHA) study for Sierra Leone to quantify the economic impact of malnutrition on the country’s development for high-level advocacy to the government and financial institutions/partners to invest more on nutrition.
Coverage (SQUEAC or SLEAC) survey to evaluate coverage in districts with ongoing health and nutrition interventions by the government and different agencies since SMART survey is just indicative as it only determines the immunization status of the entire population.
Intensify health and nutrition education activities on good IYCF practices targeting caregivers with focus on promoting exclusive breastfeeding, appropriate young child feeding, diet diversification, and improvements in household hygiene including health seeking behaviors and practices, through women support groups within the communities who are advocating for optimal IYCF. Continued health education to sensitize the community on domestic treatment of drinking water and proper disposal of human faecal waste to avoid contamination of water sources is encouraged.
Long term Interventions
Put stunting prevention into the forefront of the national nutrition agenda targeting the critical first 1000 days of life to produce greater impacts on health and education in the medium-term and on economic productivity and inclusive growth in the longer term.
Support food and agriculture based interventions in complement to national nutrition programmes that focus on evidence based (Bhutta, et al. 2015) preventive and treatment layers in the management of acute and chronic malnutrition. Focus should be given to the improvement of nutrition sensitive community and household food production systems that produce diverse nutrient-rich cereal foods, legumes, fruits and vegetable.
Review policies relating to nutrition and food security based on the new evidence presented by the SMART survey, more specifically, the survey data should be used in the process of reviewing the National Food and Nutrition Security Implementation Plan to pave the way for integrated multisectoral and multistakeholder coordination to address undernutrition in Sierra Leone.
Improve the policy environment to promote and deliver IYCF practices and services by ensuring the availability of legislation on the Regulation on Marketing of the breast milk substitutes.
Increase supply of and access to more nutritious/diverse foods through social and behaviour change communication on consumption of fruits, vegetables and pulses (legumes), through home production and/or market purchase. There is need to further complement recipes preparation and promotion to improve the diversification of the meals.
Scale-up the six monthly point of contact nationwide that promotes the timely introduction of hygienically prepared, nutrient dense complementary foods with the mothers’ participation under supervision intergrated within a package of high-impact interventions including VAS, deworming and routine counselling on child-spacing and provision of family planning commodotites as appropriate,
Support milk production and consumption in collaboration with relevant institutions, ministries and departments to improve dietary diversity from animal source foods.
Strengthen the national nutrition surveillance system in integration with HMIS for better monitoring of nutrition status trends, and implementation of both nutrition sensitive and nutrition specific programmes. Given the recurrent food deficit during hunger gap periods, encourage partners to support periodic annual SMART surveys in specific districts of intervention especially during the lean seasons to provide timely data for monitoring and any

Sierra Leone National Nutrition Survey 2017 SLNNS 2017
xix | P a g e
early warning signs. Continue the 3-year periodic national nutrition SMART surveys to provide with data on nutrition situation and assess the progress towards global, regional and national commitments to eliminate hunger in the country.
The communities need to be trained on sanitation and maintenance of the water systems in order to address the issues of limited access to safe water. Provision of sanitary facilities including building of latrines at household level in settled populations or at strategic locations in the bomas/villages for appropriate disposal of human excretal waste. This should be coupled with awareness on the need to use such facilities.
Initiate and maintain programmes for treatment and prevention of the emerging overweight and obesity in adults such as behaviour change communication (BCC) for adoption and maintenance of lifestyle behaviors contributing to both dietary intake and physical activity.
Sierra Leone National Nutrition Survey 2017 SLNNS 2017
xx | P a g e
Table 1. Summary of SLNNS 2017 Results
Indicator SLNNS, Sep-Oct 2017
n % 95% CI
Anthropometric Results based on WHO 2006 Standards (N=8993)
Prevalence of Global Acute Malnutrition, GAM (WHZ<-2 and/or oedema), N=8974 455 5.1 4.6 – 5.6
Prevalence of Moderate Acute Malnutrition, GAM (WHZ>=-3 and <-2) 362 4.0 3.6 - 4.5
Prevalence of Severe Acute Malnutrition, SAM (WHZ<-3 and/or oedema) 93 1.0 0.8 – 1.3
Mean Weight-for-Height Z Score (WHZ) -0.10 ± 1.11 -0.13– -0.07
Bilateral Oedema 6 0.1 0.0 – 0.1
Prevalence of Global Acute Malnutrition based on MUAC
(MUAC<125mm and/or oedema), N=8993
238 2.6 2.3 – 3.1
Prevalence of Moderate Acute Malnutrition based on MUAC
(MUAC>=115mm and <125mm)
182 2.0 1.7-2.4
Prevalence of Severe Malnutrition based on MUAC
(MUAC<115mm and/or oedema)
56 0.6 0.5 – 0.8
Mean Mid-Upper Arm Circumference (MUAC in mm) 150.6 ± 18.7 150.1 – 151.1
Prevalence of stunting (HAZ<-2), N=8961 2803 31.3 30.0-32.6
Prevalence of moderate stunting (HAZ>=-3 and <-2) 1910 21.3 20.3-22.3
Prevalence of severe stunting (HAZ<-3) 893 10.0 9.2-10.7
Mean Height-for-Age Z Score (HAZ) -1.41 ±1.29 -1.45– -1.37
Prevalence of underweight (WAZ<-2), N=8984 1221 13.6 12.8-14.5
Prevalence of moderate underweight (WAZ>=-3 and <-2) 946 10.5 9.8-11.3
Prevalence of severe underweight (WAZ<-2) 275 3.1 2.7-3.5
Mean Weight-for-Age Z Score (WAZ) -0.86 ±1.08 -0.89– -0.83
Mortality Results (Retrospective in 90 days prior to survey), N=8959
CDR (Total deaths/10,000 people/day) 0.19 0.15-0.24
U5DR (Deaths in U5 children /10,000 U5 children /day 0.16 0.10-0.27
Child Morbidity in two weeks prior to survey (N=9069)
Prevalence of reported illness (6-59 months) 2007 22.1 20.3-24.0
Type of illnesses (N=2007):
Fever 1506 75.0 71.7-78.4
Cough 717 35.7 31.7-39.8
Diarrhea 127 6.3 3.7-9.0
Other illnesses (skin, eye infections, etc) 379 18.9 15.7-22.1
Health Programmes (N=9069)
Children (9-59 months) immunized against measles:
No
Yes, with EPI card
Yes, by recall
Child <9 months
1973
5313
1171
612
21.8
58.6
12.9
6.7
18.9-24.7
55.1-62.1
10.5-15.3
6.2-7.3

Sierra Leone National Nutrition Survey 2017 SLNNS 2017
xxi | P a g e
Children who received vitamin A supplement 7278 80.3 77.6-82.9
Children who slept under net (LLITN) last night 8471 93.4 92.1-94.7
Proportion (12-59 months) dewormed in the last 6 months (N=7876) 5445 69.1 65.9-72.3
IYCF (IYCF) Practices (N=4550)
Proportion of children (0-23 months) ever breastfed 4507 99.1 98.7-99.4
Proportion currently breastfeeding 4011 88.2 86.9-89.5
Proportion fed on colostrum (N=1106) 892 80.7 76.7-84.6
Proportion Exclusive Breast Feeding (N=1106) 681 61.6 58.0-65.1
Proportion bottle feeding 1058 23.3 20.9-25.6
Timely initiation of breastfeeding (with 1 hr of birth) 2585 56.8 52.8-60.9
Continued breastfeeding at 1 year (12-15 months) [N=510] 432 94.5 92.2-96.8
Timely introduction of complementary feeding (6-8 months) [N=426] 234 55.2 49.4-61.0
Proportion meeting minimum dietary diversity (6-23 months) [N=3444] 1023 29.7 26.6-32.8
Proportion meeting minimum meal frequency (6-23 months) [N=3444] 1518 44.1 41.2-46.9
Women Nutrition Status (N=9480)
Acute Malnutrition by MUAC in PLWs (N=2770) 157 5.7 4.8-6.6
Acute Malnutrition by MUAC in non PLWs (N=6710) 10 0.1 0.0-0.2
Acute Malnutrition by BMI in non PLWs (N=6712) 345 5.1 4.5-5.8
Proportion of overweight women (BMI=25.0-29.9) 1236 18.4 17.3-19.5
Proportion of oobese women (BMI=>30) 502 7.5 6.7-8.3
Proportion meeting minimum dietary diversity for women (MDD-W), N=9496 6494 68.4 65.4-71.4
WASH Results (N=9467)
Access to safe water source (Borehole, protected well/spring) 6491 68.6 64.8-72.3
Take recommended time (<30 minutes) to collect water (including queuing time): 7411 78.3 75.3-81.2
Appropriate treatment method (boiling, chlorination) 164 5.5 2.7-8.1
Mean amount of water (litres) used by household/day 82.5 ±57.3 79.1-85.9
Optimal (adequate) water use (15L/person/day) 5821 61.5 58.6-64.4
Access to sanitation facility (latrine/toilet) 1879 19.8 16.9-22.8
Hand washing at (at least 3) critical times: 2899 30.6 27.0-34.2
Hand washing with soap 6813 72.0 68.9-75.0
Food Security Results (N=9469)
Household’s main source of income:
Sale of crops/farm produce
Petty trading
Skilled labour
Salaried work
3298
1393
1315
850
34.8
14.7
13.9
9.0
31.5-38.2
13.2-16.2
11.9-15.8
7.6 – 10.3
Household’s main source of staple food:
Purchases
Own production
Work for food/Labour exchange
6373
2683
110
67.3
28.3
1.2
63.8-70.8
25.1-31.6
0.7-1.6

Sierra Leone National Nutrition Survey 2017 SLNNS 2017
xxii | P a g e
Households that own livestock 3834 40.5 37.3-43.7
Households that cultivated in the current season 4543 48.0 44.4-51.6
Households that experienced some shock in the previous one year 1768 18.7 16.4-21.0
Households that applied at least one coping strategy in the previous 30 days 2019 21.3 18.7-24.0
Mean Reduced Coping Strategy Index (rCSI) 3.2 ±7.3 2.7 – 3.6
Level of coping strategies applied (rCSI)
No or low (rCSI<4)
Medium (rCSI of 4-9)
High (rCSI ≥10)
7560
520
1389
79.8
5.5
14.7
77.2-82.4
4.2-6.8
12.5-16.9
Mean Household Hunger Scale (HHS) 0.7 ±1.2 0.6 – 0.8
Level of household hunger experienced (HHS)
None or light
Moderate
Severe
7329
1993
147
77.4
21.0
1.6
74.5-80.2
18.4-23.7
0.7-2.4
Mean household dietary diversity score (HDDS) in past 24 hours 5.3 ±2.3 5.1 - 5.5

Sierra Leone National Nutrition Survey 2017 SLNNS 2017
1 | P a g e
1. INTRODUCTION
1.1 General Background
Sierra Leone is located on the West Coast of Africa and covers an area of about 72,000 square
kilometers (28,000 square miles). It extends from latitude 7 degrees north to 10 degrees north,
and from longitude 10 degrees west to 14 degrees west. The country is bordered by the Republic
of Guinea on the north and northeast, and the Republic of Liberia on the east and southeast;
while the Atlantic Ocean extends approximately 340 kilometers (211 miles) on the west and
southwest (Fig 1).
Figure 1: Map of Sierra Leone showing geographic location and the district administrative units
Sierra Leone has a total population of 7,092,113 (3,601,135 females and 3,490,178 males) of
which 4,187,016 (59%) live in the rural and 2,905,097 (41%) live in the urban areas2. The average
annual growth rate between 2004 and 2015 is 3.2 percent with the total fertility rate (TFR) is
estimated at 5.2 children per woman. Characteristic of a young demography, 40.9% of the
population are children (below 15 years old), 55.6% are a working age (15-64 years old) and only
3.5% are aged 65 years and above.
Administratively, Sierra Leone is divided into four regions. Each region is sub-divided into districts,
and each district is divided into chiefdoms and wards for Western Urban and Rural Area. Overall,
2 2015 Population and Housing Census (PHC, 2015)
Sierra Leone National Nutrition Survey 2017 SLNNS 2017
2 | P a g e
there are 14 districts subdivided into 149 chiefdoms and 12 wards based on the 2015 population
and census data3. Among the 14 districts, there are five city councils and 14 district councils,
including Freetown, the capital, total of 19 local councils (SSL, 2006). Sierra Leone has four main
physical regions: the Freetown Peninsula has raised beaches and hills, the Coastal Plains, the
Interior Lowlands, and the Interior Plateau. The Freetown Peninsula consists of three roughly
parallel ranges of highlands that are narrow but extend about 30 kilometers south of Freetown.
The country experiences two main seasons: the dry season, between November and May, and
the wet/ rainy season, from April/May to November.
The economy of Sierra Leone is predominantly agricultural, which has accounted for about half of
the real gross domestic product (GDP). Coffee, cocoa, and fish are the major agricultural exports
of the country. According to the African Development Bank economic outlook, Sierra Leone has
achieved modest economic growth rates in the post-war period that peaked at 20.7% in 2013 with
the launching of the government's Agenda for Prosperity 2013-18 (A4P). The economy is
recovering from the twin shocks of: i) unprecedented decline in international iron ore prices
starting in late 2013; and ii) the outbreak of Ebola Virus Disease (EVD) in 2014, and real GDP
growth recovered from 21.1% in 2015 to 4.3% in 2016 (ADB, 2017). The continued double-digit
gross domestic product (GDP) growth resulted from resumption in iron ore production combined
with government investment in infrastructure (construction, electricity) as well as buoyant activities
in agriculture, tourism and services. Sierra Leone is essentially a supply-constrained mono-
cultural economy depending on a few commodities for output and export. Following these shocks,
the authorities, in very close partnership with donors and other stakeholders, prioritized the
country’s immediate strategic interventions in the context of the Post-Ebola Recovery Plan
(PERP), which is a refocusing of the A4P as launched in late 2015. With nominal GDP projected
at SLL 22.69 trillion in 2016 (IMF projection of USD 4.289 billion for 2016), Sierra Leone is the
154th economy in the world and 38th in Africa but offering significant business opportunities.
According to the International Food Policy Research Institute (IFPRI), Sierra Leone with Global
Hunger Index (GHI) of 38.3 in 2017 scores among the highest in the global rating of 119 countries
with sufficient data, signifying Alarming levels (GHI 35-49.9) of hunger (IFPRI, 2017)4.
In 2014 to 2015, Sierra Leone experienced the world’s most widespread Ebola Virus Disease
(EVD) outbreak along with neighboring countries Guinea and Liberia. The Ebola outbreak had
negative impact on health and socioeconomic situation of the populations, particularly the most
vulnerable, presenting a high rate of under-five mortality (156 deaths per 1,000 live births).
However, as no comprehensive assessments had been carried out in the country, this remains an
assumption linked to the pre-existing weak health system and the indirect consequences of the
emergency status declared for the first time in August 2014. In particular, the high rates of
infections occurring in the first phase of the EVD outbreak. The quarantine measures adopted by
the Government of Sierra Leone (GoSL) to limit the spread of the disease, and the closure of the
markets have contributed to an initial disruption in the provision of basic health services and a
loss of trust in the health system by the communities. Also loss in livelihood and an overall
increase in the rates of food insecurity. Furthermore, the Human Development Report 2016
3 The GOSL has since added 2 new districts making a total of 16 districts. However, 14 districts of the 2015 PHC data were used in this survey. 4 GHI calculated for four indicators: 1) the percentage of the population that is undernourished, 2) the percentage of children under age five who suffer from wasting (low weight for height), 3) the percentage of children under age five who suffer from stunting (low height for age), and 4) the percentage of children who die before the age of five (child mortality).

Sierra Leone National Nutrition Survey 2017 SLNNS 2017
3 | P a g e
indicates that women were disproportionately affected by the Ebola outbreak; they faced higher
risks of infection because of their role in caring for the sick. As a result, their essential maternal
health uptake reduced notably in antenatal, perinatal and postnatal care. Nutrition indicators in
Sierra Leone showed improvement in comparison with 2010 and 2014 Standardized Monitoring
and Assessment of Relief and Transitions (SMART) survey results prior to Ebola crisis.
1.2 Justification
In order to assess the impact of the various interventions designed in addressing the high prevalence of malnutrition, especially stunting levels, evaluate progress towards Sustainable Development Goals (SDGs 2030); and to monitor the nutritional status of specific population groups in Sierra Leone. The first national nutrition survey was conducted in 2010 and the second in 2014 using SMART methodology. Therefore, the Government of Sierra Leone (GoSL) led by the Ministry of Health & Sanitation (MoHS) and its partners planned to conduct the third National Nutrition Survey (NNS) using SMART Methodology. The current survey would enhance comparison of results given the use of standard study design, timing of the nutrition surveys, indicators assessed and data analysis including analysis of trends. The Directorate of Food and Nutrition Security (DFNS) at MoHS conducts SMART surveys at regular times at the same period every two-three years to obtain data across timelines and therefore enable trend analysis. The implementation of national nutrition survey using SMART methodology is known to enhance the quality, validity and reliability of survey data generated and ultimately enable for comparison and efficient prioritization and targeting of interventions and resources.
The NNS 2017 also assessed the severity and geographical distribution of contextual factors associated with malnutrition. Furthermore, the study findings provide the platform for policy and strategy development to prioritize the programs for short, medium and long-term direct and indirect interventions at the national and district level. Results from this survey would further complement the just concluded Multiple Indicator Cluster Survey (MICS) 2017 and contribute to the National Nutrition Information System (NNIS) for strengthened surveillance of the nutrition situation in the country. The NNIS also uses Integrated Management of Acute Malnutrition (IMAM) program data, community level screening data and other sources of quantitative and qualitative data from government and partners to provide up-to-date information on the nutrition situation in the country. The information on nutrition, mortality, infant & young child feeding and associated factors would allow for improved program planning and monitoring for better maternal & child survival outcomes.
1.3 Nutrition Context
1.3.1 Sources of Nutrition Information
Nutrition SMART surveys provide the main sources of reliable nutrition information at district and national levels. Desk review of secondary data was mainly based the NNS 2010 and NNS 2014 reports. Other sources of national nutrition indicators have been the MICS 2010, Demographic, and Health Survey (DHS) 2013. The National Nutrition Information System (NNIS) is another source of nutrition information. NNIS provides surveillance data on IMAM program and community level nutrition screening. Other sources such as the Census Report 2015 provided information on the demographic and livelihood context of the country.
Sierra Leone National Nutrition Survey 2017 SLNNS 2017
4 | P a g e
1.3.2 Nutrition Situation in the country: Secondary Review
According to the NNS 2014, the national prevalence5 of global acute malnutrition (GAM) was 4.7% (4.3 – 5.2 95% CI) and the severe acute malnutrition (SAM) rate was 1% (0.9 – 1.2 95% CI). These results indicate “acceptable” acute nutrition situation based on WHO classification for severity levels of acute malnutrition. However, Stunting rate was still moderately high at 28.8% (27.5 – 30.2 95% CI). Some districts reported GAM rates above 5% threshold indicating nutrition situation at Poor levels according to WHO classification; these were Pujehun (5.0%), Moyamba (5.0%), Kenema (5.5%), Port Loko (5.5%), and Tonkolili (6.6%).
The rates of stunting varied by district with half of the districts reporting rates above the high level of >30% such as Kono (30.1%), Port Loko (32.2%), Bombali (33.3%), Moyamba (34.5%), Kenema (39.6%), Pujehun (41.0%) and Tonkolili (41.2%).
The national prevalence of both GAM and stunting rates have been showing an improving trend since 2008 assessment, with GAM rates reducing from 10.9% in 2008, 6.9% in 2010 to 4.7% in 2014; and stunting rates reducing from 37.4% in 2008, 34.1% in 2010 to 28.8% in 2014. The trends have been reflected at the level of districts as well, and it was expected that this trend would hold in the current NNS 2017.
According to the UNICEF Conceptual framework, the causes of malnutrition is multifaceted and is associated with poor food consumption/ dietary diversity and high morbidity burden in less favourable environments aggravated by poor IYCF practices, livelihood shocks, water and sanitation. The improvements in the nutrition situation can thus be attributed to the national IMAM program and supportive treatment programs and associated WASH, food security and livelihood interventions by DFNS, line ministries and national NGOs with support from international UN and NGO partners.
5 Covering all districts except two – Kailahun and Bonthe.
Sierra Leone National Nutrition Survey 2017 SLNNS 2017
5 | P a g e
2 OBJECTIVES
2.1 Overall Objective
The overall objective of the Sierra Leone National SMART Survey (SLNSS) 2017 was to
determine and evaluate the current nutrition status of the population (especially children 6-59
months old and women of reproductive age (15-49 years of age) and the retrospective mortality
rate in the population at national and district levels. The major contextual factors contributing to
malnutrition such as IYCF, Food Security, WASH and Health situation in Sierra Leone were also
assessed in order to define program-planning priorities for direct and indirect nutrition
interventions.
2.2 Specific Objectives
1. To determine prevalence of acute malnutrition among children 6-59 months to estimate of acute and chronic malnutrition (global acute malnutrition, underweight and stunting) at the national level and in the 14 districts of Sierra Leone.
2. To assess maternal nutrition status in Women of Reproductive Age (15-49 years old) at the national level and in the 14 districts6 of Sierra Leone.
3. To assess coverage of access to key primary health care services for child survival outcomes at the national level and in the 14 districts of Sierra Leone.
4. To assess two- week retrospective morbidity among children 6-59 months at the national level and in the 14 districts of Sierra Leone.
5. To assess retrospective mortality (Crude Mortality and U5 Mortality rates) over 3 months recall period among populations at the national level and in the 14 districts of Sierra Leone.
6. To assess other contextual factors contributing to malnutrition such as Food Security, Dietary Diversity for Women and WASH at the national level and in the 14 districts of Sierra Leone.
7. To assess levels of Infant and Young Child (IYCF) practices among mothers/primary caregivers of 0-23 months old children in Sierra Leone.
6 Western Area Urban, Western Area Slums, Western Area Rural; Kono, Kenema, Kailahun; Bo, Pujehun, Moyamba, Bonthe; Kambia,
Port Loko, Koinadugu, Tonkolili, and Bombali.

Sierra Leone National Nutrition Survey 2017 SLNNS 2017
6 | P a g e
3. METHODOLOGY
3.1 Study Design
The NNS 2017 mainly employed a cross-sectional design using the Standardized Monitoring and Assessment of Relief and Transition (SMART) methodology. This methodology provides a basic integrated method for assessing nutritional status and mortality rate as well as other associated factors including food security, morbidity, health programs, and WASH hence providing the basis for understanding the magnitude and severity of nutrition situation in the 14 districts to be assessed and among the populations of the Western Area slums.
3.2 Study Population
The SLNNS 2017 targeted primarily mothers or women in the reproductive age (15-49 years) and children less than five years for household interviews and measurement. The following definitions applied for the sake of this study:
A household is defined as a group of people who routinely eat out of the same pot and live on the same compound (or physical location). It is possible that they will live in different structures. Sharing the pot is the unifying factor for households.
Definition of HH head: is member of the family who manages the family resources and decisions (He/She is the final decision maker on most of the decision related to income allocation and major family activities).
Respondent is the mother or caregiver in the household.
3.3 Sampling
3.3.1 Sampling Strategy
A two-stage cluster sampling approach was applied in the NNS 2017, to select sampling units at different levels (clusters and households) in each district.
3.3.2 Sample Size Calculation
The sample size for nutrition, mortality and IYCF were determined by using the July 9th 2015
updated version of ENA for SMART (2011), by entering all the required data in the planning menu
of the ENA delta software. The data entered into the software included estimated prevalence of
global acute malnutrition (GAM) and crude death rate (CDR), desired precision, design effect
(DEFF), average household size based on the most recent 2015 census data, percentage of
under five children (in the 6-59 months for anthropometry and 0-23 months for IYCF), non-
response rate and recall period. July 16th, the Day of the African Child was taken as the beginning
of the recall period for the 3 months retrospective mortality assessment. Prevalence of GAM and
CDR and other parameters were estimated from the NNS 2014 for each district. The software
(ENA) calculated the sample size based on the formula below:
where;
N: is the total sample size
Z: is the normal deviate (confidence limit) taken as 1.96 at 95% confidence level p: proportion of global acute malnutrition (GAM) in the study population d: is the acceptable degree of accuracy (precision) desired Deff: Design effect
NRR: Non-response rate (expected)
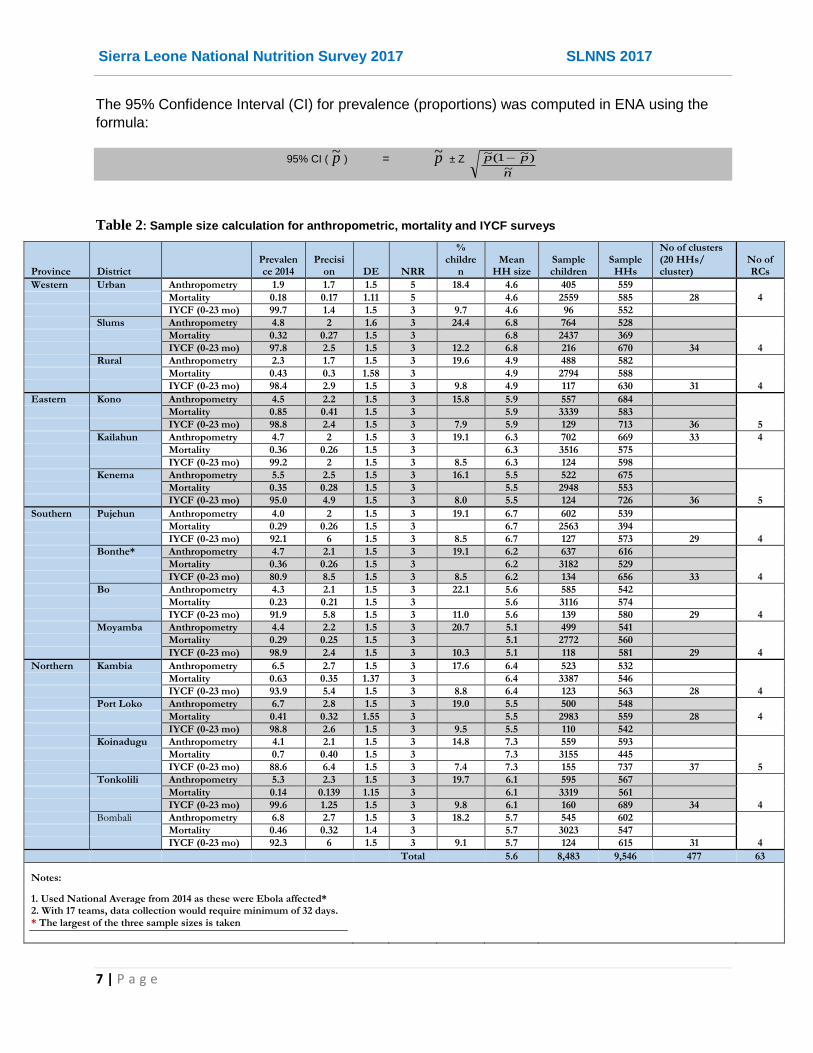
Sierra Leone National Nutrition Survey 2017 SLNNS 2017
7 | P a g e
The 95% Confidence Interval (CI) for prevalence (proportions) was computed in ENA using the
formula:
95% CI ( p~ ) = p~ ± Z
n
pp~
)~1(~
Table 2: Sample size calculation for anthropometric, mortality and IYCF surveys
Province District
Prevalence 2014
Precision DE NRR
% childre
n Mean
HH size Sample children
Sample HHs
No of clusters (20 HHs/ cluster)
No of RCs
Western Urban Anthropometry 1.9 1.7 1.5 5 18.4 4.6 405 559
Mortality 0.18 0.17 1.11 5
4.6 2559 585 28 4
IYCF (0-23 mo) 99.7 1.4 1.5 3 9.7 4.6 96 552
Slums Anthropometry 4.8 2 1.6 3 24.4 6.8 764 528
Mortality 0.32 0.27 1.5 3
6.8 2437 369
IYCF (0-23 mo) 97.8 2.5 1.5 3 12.2 6.8 216 670 34 4
Rural Anthropometry 2.3 1.7 1.5 3 19.6 4.9 488 582
Mortality 0.43 0.3 1.58 3
4.9 2794 588
IYCF (0-23 mo) 98.4 2.9 1.5 3 9.8 4.9 117 630 31 4
Eastern Kono Anthropometry 4.5 2.2 1.5 3 15.8 5.9 557 684
Mortality 0.85 0.41 1.5 3
5.9 3339 583
IYCF (0-23 mo) 98.8 2.4 1.5 3 7.9 5.9 129 713 36 5
Kailahun Anthropometry 4.7 2 1.5 3 19.1 6.3 702 669 33 4
Mortality 0.36 0.26 1.5 3
6.3 3516 575
IYCF (0-23 mo) 99.2 2 1.5 3 8.5 6.3 124 598
Kenema Anthropometry 5.5 2.5 1.5 3 16.1 5.5 522 675
Mortality 0.35 0.28 1.5 3
5.5 2948 553
IYCF (0-23 mo) 95.0 4.9 1.5 3 8.0 5.5 124 726 36 5
Southern Pujehun Anthropometry 4.0 2 1.5 3 19.1 6.7 602 539
Mortality 0.29 0.26 1.5 3
6.7 2563 394
IYCF (0-23 mo) 92.1 6 1.5 3 8.5 6.7 127 573 29 4
Bonthe* Anthropometry 4.7 2.1 1.5 3 19.1 6.2 637 616
Mortality 0.36 0.26 1.5 3
6.2 3182 529
IYCF (0-23 mo) 80.9 8.5 1.5 3 8.5 6.2 134 656 33 4
Bo Anthropometry 4.3 2.1 1.5 3 22.1 5.6 585 542
Mortality 0.23 0.21 1.5 3
5.6 3116 574
IYCF (0-23 mo) 91.9 5.8 1.5 3 11.0 5.6 139 580 29 4
Moyamba Anthropometry 4.4 2.2 1.5 3 20.7 5.1 499 541
Mortality 0.29 0.25 1.5 3
5.1 2772 560
IYCF (0-23 mo) 98.9 2.4 1.5 3 10.3 5.1 118 581 29 4
Northern Kambia Anthropometry 6.5 2.7 1.5 3 17.6 6.4 523 532
Mortality 0.63 0.35 1.37 3
6.4 3387 546
IYCF (0-23 mo) 93.9 5.4 1.5 3 8.8 6.4 123 563 28 4
Port Loko Anthropometry 6.7 2.8 1.5 3 19.0 5.5 500 548
Mortality 0.41 0.32 1.55 3
5.5 2983 559 28 4
IYCF (0-23 mo) 98.8 2.6 1.5 3 9.5 5.5 110 542
Koinadugu Anthropometry 4.1 2.1 1.5 3 14.8 7.3 559 593
Mortality 0.7 0.40 1.5 3
7.3 3155 445
IYCF (0-23 mo) 88.6 6.4 1.5 3 7.4 7.3 155 737 37 5
Tonkolili Anthropometry 5.3 2.3 1.5 3 19.7 6.1 595 567
Mortality 0.14 0.139 1.15 3
6.1 3319 561
IYCF (0-23 mo) 99.6 1.25 1.5 3 9.8 6.1 160 689 34 4
Bombali Anthropometry 6.8 2.7 1.5 3 18.2 5.7 545 602
Mortality 0.46 0.32 1.4 3
5.7 3023 547
IYCF (0-23 mo) 92.3 6 1.5 3 9.1 5.7 124 615 31 4
Total
5.6 8,483 9,546 477 63
Notes:
1. Used National Average from 2014 as these were Ebola affected* 2. With 17 teams, data collection would require minimum of 32 days.
* The largest of the three sample sizes is taken

Sierra Leone National Nutrition Survey 2017 SLNNS 2017
8 | P a g e
Taking, the largest of the sample sizes, 507-746 households are required in each district to be assessed in the integrated SMART assessment. Based on the number of households, and the minimum number of clusters (25) recommended for a SMART survey, there were 28-37 clusters per district to cover in 32 days, assuming each team can interview 20 HHs in a day. To enhance measurement of IYCF indicators with high precision, IYCF analysis for some indicators would be aggregated at the national level.
3.3.3 Cluster Selection
Upon compilation of the sample sizes and number of clusters required, the cluster sampling with
probability proportionate to size (PPS) design was employed for the survey based on SMART
guidelines. In the first stage, the Statistics Sierra Leone (SS) selected between 32-42 clusters or
Enumeration Areas (EAs) per district from an updated list of population data (2015 Census) for
the targeted geographical areas of study (Annex F) using probability proportionate to size (PPS)
strategy. Based on ENA guidelines, the number of clusters includes a 10% plus 1 replacement
clusters (RCs) reserved in each district to be visited in case a critical number (10%) of the
targeted clusters (52-67) are not reachable during data collection for some unavoidable reasons,
which the teams would have to seek approval from the SMART consultant/national coordination
team. Statistics Sierra Leone also provided the maps for each of the EAs to aid in identifying their
locations.
3.3.4 Household Selection
In the second stage, households would be selected in the field using simple random sampling
(SRS) techniques after population listing. In the randomly selected enumeration areas/localities,
the survey teams did contact the local leadership/elder who helped in the segmentation (if large –
more than 100 households in the rural or 200 in the urban area) and listing the households within
the village/segment, from which a list of households was generated to form a cluster. After
completing the list of all households (HHs) in a cluster, twenty households were then be selected
for quantitative survey by folding papers with all the households, shuffling and randomly picking
the required number. Concensus was reached beforehand that a neutral party such as the
chief/community guide would do the picking so that they feel part of the exercise and understand
that the households that would be selected are random; Twenty (20) households were picked
randomly and interviewed per cluster.

Sierra Leone National Nutrition Survey 2017 SLNNS 2017
9 | P a g e
3.4 Conceptual Framework
The NNS 2017 design for indicators, tools and analysis is based on the UNICEF Conceptual
Framework of Malnutrition (Fig 2.) below
Figure 2: UNICEF Conceptual Framework of Malnutrition
The framework underpins the immediate and underlying factors associated with malnutrition and that was collected in the survey.
3.5 Study Tools
Structured and semi structured questionnaires were used to conduct household interview (Household Quantitative Tool – Annex A); this includes Food Security & Livelihood Questionnaires and WASH questionnaire. Data on child anthropometry, morbidity, health and IYCF were collected in the respective anthropometry and IYCF questionnaires (Annex B) while mortality data was collected using the demography & mortality questionnaire (Annex C). Maternal health and nutrition and minimum dietary diversity for women (MDD-W) questionnaires was used to collect the suggested data on women of the reproductive age (15-49 years). For standardization and ease of interpretation and in- and inter-country comparizons, the questions have been adopted from local tools to mirror the indicators collected in 2014, and with addition of MDD-W and framed in such away that they are consistent with international studies and methodologies such as DHS/HHS, and MICS protocols. The tools have been peer-reviewed by the members of the nutrition technical working group (TWG), AAH technical support team and

Sierra Leone National Nutrition Survey 2017 SLNNS 2017
10 | P a g e
different stakeholders, and comments incorporated into the final protocol by the consultant. The final questionnaires have been programmed in Open Data Kit (ODK v1.10.1) and forms downloaded into the tablets (SMART mobile phones) for enumerators.
The survey tools thus cover indicators from several sections including:
1) Mortality and demography (household srtucture)
2) Child anthropometry
3) Morbidity, Immunization & Health Seeking Behaviours of child
4) IYCF
5) Household Food Consumption and Dietary Patterns
6) Shocks and coping strategies
7) WASH
8) Women Anthropometry and
9) Minimum Dietary Diversity for Women
3.6 Field Data Collection Procedures
Survey teams adhered to this protocol of procedures during data collection in the field.
3.6.1 Social mobilization
The DFNS sent official communication to the district health authorities, District Medical Officers (DMOs) one week ahead of the field survey. The team supervisors were also provided with letters of introduction explaining the ongoing national survey as an important national activity. The authorities would then work closely with the district and community social mobilizers and the survey teams to broadcast and communicate the information in their areas of jurisdiction in preparation of the teams’ arrival at the villages/localities. The teams were also provided with AAH_SL T-shirts and vehicles with AAH (the organization supporting the SMART survey) markings for ease of identification by the community.
At the community level, the supervisor presented and introduced the team to the local leader/chief, who would then assist them identify a community leader/guide to lead them through the village/locality.
3.6.2 Consent Process
At the household, the survey teams would present themselves to a responsible adult member of the household (not a guest). In this survey, the primary respondent is the mother or caregiver of the child or the person responsible for food preparation on the recall day. After introductions of the team members, the supervisor (team leader) would briefly explain to the respondent the purpose of their study, who has funded/supported it, how the data would be gathered, the expected duration of the interview and how the findings of the study would be used. Prior to the interview, a verbal consent was obtained from the respondent, an adult member of the household. This was indicated on the Cluster Control Form, documenting the non-response households as well.
3.6.3 Team Selection and Composition
The survey team members were selected from the NNS database comprising of DFNS staff, district nutritionists, staff from the Statistics Sierra Leone and other persons who have participated

Sierra Leone National Nutrition Survey 2017 SLNNS 2017
11 | P a g e
in previous similar surveys.Totla number of seventy three (73) persons proposed for recruitment were trained and after a pre-test, standardization exercise and post-test evaluation during the training; 68 members were selected to serve as supervisors, team leaders and enumerators, leaving 5 persons on standby. The selection of team members and constitution of teams was based on knowledge of English and a local language spoken in the districts to assess (Krio, Mende, Temne, Loko, Limba, etc), previous experience in similar studies/assessments, and physical fitness. The team composition also took into account gender balance by having at least a woman in the team for ease of handling the interviews with respondents as well as the children.
A total number of 17 teams undertook the fieldwork. Each team consisted of four (4) members – a supervisor, team leader, and two (2) nutrition enumerators in addition to the village/field guide. Based on the length of the household questionnaires and the long distances expected in the field, each team interviewed twenty (20) households per cluster in a day. In the late stages of data collection in Western Urban Area, the DFN recalled back seven (7) nutritionists who doubled as supervisors and replaced them with nutritionists from national office. The consultant offered quick training for the new team before they were deployed to the field; the team also had previous SMART survey experience so the replacement did not affect quality of data collected in Western Urban.
The NNS 2017 coordination team of five members led by the SMART consultant, 2 persons from the DFN, 1 staff from AAH-SL and 1 from WFP coordinated and oversee the data collection and field management through the team supervisors.
3.6.4 Team Training & Pretesting
Training of the SLNNS 2017 teams was conducted at the Armed Forces Educational Center (AFEC) in Freetown. The survey teams received training on basic package for SMART methodology for 6 days between Monday 28th August and Saturday 2nd September, including a standardization test and field pretesting exercise in the last two days respectively. The training covered the following key topics: Review of the objectives and scope of the nutrition survey including anthropometric measurements (height/length, weight and MUAC measurement techniques with emphases on taking accurate measurements). Practical lessons to evaluate enumerators’ ability to measure accuracy; interview techniques; assessment of health status of the child (illness); immunization and mortality data; sampling procedures; data recording procedure and quality controls; handling of equipment; and the general courtesy during the assessment.
The SMART consultant from AAH led the training with assistance of two other MoHS staff – Kadiatu Fofana and Mutivah Kappia who had received SMART managers training in Ghana in 2013. The training used power point presentations, discussions, Q&A sessions, Quizzes, role-plays and practical sessions.
Standardisation exercise was conducted at the training venue for the 17 pair of enumerators with the trainers assisting in the set-up and organization of the stations and supervisors assisting in management of the teams. Standardization exercise is a pre-survey practice recommended by SMART methodology and involves repeated measurements of weight, height and MUAC for 10 children between 1 and 5 years by each of the enumerators. Pre-testing of the questionnaire and equipment was carried out in 34 households (each team interviewing 2 households) in Lakka villages in the outskirts of Freetown, which are not part of the actual assessment.

Sierra Leone National Nutrition Survey 2017 SLNNS 2017
12 | P a g e
3.6.5 Interviews and Measurements
Interviews were conducted by the enumerators who have been trained on the type of data to be collected by each specific question/item, the reason the data is collected and how; reading verbatim from the questionnaire in the tablet. Interviews would require a private set-up as is allowable within the respondent’s homestead. Children’s ages, if they do not have birth registration documents, were estimated to the nearest month using an appropriate local events calendar (Annex D) enriched for each district. Where the question requires single response, the responses had been coded and programmed to select one response and so the exact response from the respondent; and where there are possible multiple responses, the application would allow more than one box to be checked. The application has also enabled programming of special filters for questions such that only questions that are supposed to follow a suitable response would appear.
Household estimates as proportions of income and food source, expenditures, etc was done using proportional piling techniques. Anthropometric measurements were done according to the SMART guidelines using electronic scales for weight in kg (to the nearest 1 decimal place). Rigid height boards for height (for both child and woman) or length in cm (to the nearest 1 decimal place) and MUAC tape (for child and adult) for Mid-Upper Arm Circumference in cm (to the nearest 1 decimal place). Children less than 24 months (or below 87 cm) was measured lying down for length while children 24-59 months (or 87 cm and above) was measured for standing height as recommended in the SMART guidelines.

Sierra Leone National Nutrition Survey 2017 SLNNS 2017
13 | P a g e
4. DATA MANAGEMENT PLAN
4.1 Data Collection
In order to collect data quickly and in real time, 4-5 teams worked in a district at a time (i.e. 4
districts at a time). This was conducted in 6 weeks and started on 6th September such that the
bulk of data collection would be completed by 30th September, except for Western urban, slums
and rural areas that spilled over to October 10th. Data was collected and captured using ODK built
xls forms developed by the consultant and downloaded into the tablets.
4.2 Data Processing and Analysis Plan
Since, the mobile phones/tablets were used for data capturing, anthropometric data was uploaded daily or every other day depending on access to internet and analyzed using SMART recommended software ENA (Delta Version 2011 and latest update of July 9, 2015). Anthropometric data was reviewed by the supervisor every day for completeness of the questionnaire, plausibility of measurements and identification of any cases of malnutrition that would require referral in line with SMART guidelines. In order to enhance data quality control and allow the supervisor to provide feedback to the teams and to the coordinators the supervisor recorded the day’s work on the cluster control form and upload the finalized forms/data to the server as soon as they access internet. The anthropometric and other data was merged into the meta-data set in other formats such as EPI Info and SPSS for integrated analysis. Analysis was undertaken in Freetown using both ENA and EPI Info in the second and third week of October by the consultant.
Rates of malnutrition and mortality were generated in ENA software, while further analysis that
include frequency distributions to derive the prevalence of various food security, nutrition and
health indicators and mean/median distributions were derived for continuous variables. The
analysis was done separately for each district and weighted rates generated for global aggregated
data for the national rates.
4.3 Data Quality Control
The data quality control began right from the questionnaire design all through to the processing and cleaning stage. Quality of data was ensured through: (i) adequate training (ii) monitoring of fieldwork by coordination team, (iii) crosschecking of filled questionnaires on daily basis; recording of observations; confirmation of disease outbreaks; severe malnutrition and oedema cases by team leaders. All households sampled were visited and recorded including empty houses; (iv) daily review with the teams to address any difficulties encountered; (v) progress evaluation according to the time schedule and progress reports shared among the coordination team on regular basis. Continous data entry (vi); cleaning and plausibility checks in ENA for SMART; (vii) monitoring accuracy of equipment (weighing scales) by regularly measuring objects of known weights and (viii) continuous reinforcement of good practices such as good probing, accuracy of measurements taken, shouting of measurements by both the enumerators reading and recording them.
Sierra Leone National Nutrition Survey 2017 SLNNS 2017
14 | P a g e
5. SURVEY COORDINATION & MANAGEMENT
5.1 Study Coordination
The study was managed by the National SMART Survey National Coordination and Management Committee derived from Technical Working Group (TWG) that constitute members from key agencies including Ministry of Health and Sanitation, UNICEF WHO, WFP, Hellen Keller, FAO, and MoH/DFN among others. Under the leadership of the director Aminata Shamit Koroma, MoH/DFN would appoint a focal person to represent it on the National Coordination and Management Committee (NCMC) for the study.
The national survey is led by a consultant recruited by Action Against Hunger (AAH), with strong SMART survey and analysis capabilities and experience in SMART surveys. He was complemented by a team of local Action Against Hunger experts and personnel from the government and partner agencies with variable experience and skills. The MoHS and Action Against Hunger provided the overall coordination support in logistics and community mobilization. The survey team consisted of 17 teams, a coordination team of 5 persons working closely with 17 supervisors, 1 supervisor assigned to each team.

Sierra Leone National Nutrition Survey 2017 SLNNS 2017
15 | P a g e
Figure 3: SLNNS 2017 Organogram
Sierra Leone National SMART Survey
Technical Working Group (SLNNS-TWG)
Supervisor Team 1
1 National
Coordinator/MoHS
Agency TWG members
and Focal Persons
Supervisor Team 3
Supervisor Team 2
Supervisor Team n (...17)
Supervisor Team 4
Team 1
1 Team Leader
2 Enumerators
Lead Survey Consultant/ AAH
1 National Coordinator Freetown/DFN
1 National Coordinator Freetown/AAH
1 National Coordinator Field/DFN
1 National Coordinator Field (AAH)
1 National Coordinator Field (WFP)
Team 2
1 Team Leader
2 Enumerators
Team 3
1 Team Leader
2 Enumerators
Team 4
1 Team Leader
2 Enumerators
Team n (17)
1 Team Leader
2 Enumerators
Sierra Leone National Nutrition Survey 2017 SLNNS 2017
16 | P a g e
5.2 Logistics & Management
Action Against Hunger facilitated the drafting of budgets, contracts for the consultant and the survey teams and logistics for the team training and field work including sourcing for the equipment, tablets, vehicles, training venue and refreshments besides communication and operational costs during the field work. AAH also organized consultant’s meeting with TWG/stakeholders. The DFNS facilitated the identification and recruitment of survey teams, release and assigning of the government staff/nutritionists to undertake the survey, coordination of the teams during training and fieldwork, social mobilization and general policy and operational guidance to the exercise. Each team was asigned a 4X4 vehicle, a set of anthropometric equipment (electronic weighing scale, height board, and MUAC tapes), WHZ charts, Local Events Calendar, Cluster Control Forms, Referral Forms, copy of letter of introduction, list of clusters and 2 tablets.
5.3 Partners Participation
The DFNS/MoHS and SS have largely been involved in the implementation of this survey from GoSL side. MOHS has provided personnel and guidance for the survey and SS provided staff, sampling for clusters and maps for the EAs. AAH with financial support from the Irish Aid is the main technical partner for the SLNNS 2017 with technical back up from Action Against Hunger Nutrition Technical Advisors from Paris. WFP provided two cars for (besides one staff to the coordination team) for data collection while UNICEF provided the anthropometric equipment and Statistics Sierra Leone provided sampling for clusters and maps for the EAs. Significant contributions also came from other members of TWG in form of tablets (Focus 1000 and WHO), planning and review of the objectives and tools.

Sierra Leone National Nutrition Survey 2017 SLNNS 2017
17 | P a g e
6. SURVEY RESULTS
6.1 Demographic Characteristics of the Survey Population (households and children)
A total number of 10,175 children aged of 0-59 months were assessed in the Sierra Leone
National Nutrition Survey 2017. Of these 9069 children (4486 boys and 4573 girls), aged 6‐59
months were assessed for anthropometry and morbidity in the 15 districts/units nationally. IYCF
information was collected among 4550 children (0-23 months) of which 1106 were under 6
months (0-5 months) and assessed for exclusive breastfeeding practices. The survey covered a
total number of 9,469 households of which 8959 households responded to mortality
questionnaire. The mean household size was 4.5 (±1.9). Most of the assessed households were
residents (97.2%) while a few households were returnees (1.4%) and IDPs (1.4%). Most of the
households were male-headed (82.3%), but still a significant proportion of the households were
female-headed (17.7%).
The distribution of the assessed children by age and sex among the younger (6-29 months) and
older (30-59 months) shows that the younger were slightly oversampled (p<0.05), although the
overall ratio (ratio: 0.99) was still within the acceptable range (value should be around 0.85). Boys
and girls were equally represented (ratio: 1.0) as expected (Table 3).
Table 3: Distribution of age and sex of sample
Boys Girls Total Ratio
AGE (mo) no. % no. % no. % Boy:girl
6-17 1147 49.7 1163 50.3 2310 25.5 1.0
18-29 1070 48.5 1138 51.5 2208 24.4 0.9
30-41 1067 48.8 1120 51.2 2187 24.1 1.0
42-53 884 51.0 850 49.0 1734 19.1 1.0
54-59 318 51.3 302 48.7 620 6.8 1.1
Total 4486 49.5 4573 50.5 9059 100.0 1.0
The presence of younger children than their older counterparts is possibly an error occurring from age estimation in the population in which a significant proportion of home deliveries and events were registered later at the health facilities by mother’s recall or where birth records are not available. Analysis flagged a number of age measurement errors even where exact birth dates from child cards were recorded. From the plausibility report, seven percent of children had no exact birthday.

Sierra Leone National Nutrition Survey 2017 SLNNS 2017
18 | P a g e
Figure 4: Population age and sex pyramid
Table 4: Response Rate and Geographic Coverage of the SLNNS 2017
Province District Households Total Population (Mortality)
Total Children Children (0-23 mo)
% Children U5s Mean HH Size
Sampled Assessed Response Rate
Sampled Assessed Sampled
Assessed
Sampled
Assessed Sampled Assessed Planned
Assessed
Western Urban 585 653 111.6 2559 2844 405 758 96 315 18.4 20.6 4.6 4.7
Slums 670 553 82.5 2437 2097 764 691 216 335 24.4 30.2 6.8 3.9
Rural 630 642 101.9 2794 2478 488 709 117 321 19.6 26.5 4.9 4.0
Eastern Kono 713 723 101.4 3339 3560 557 781 129 329 15.8 18.9 5.9 5.3
Kailahun 669 656 98.1 3516 2684 702 728 124 271 19.1 19.3 6.3 4.3
Kenema 726 669 92.1 2948 2364 522 612 124 309 16.1 26.2 5.5 3.8
Southern Pujehun 573 709 123.7 2563 2351 602 759 127 338 19.1 29.6 6.7 4.3
Bonthe 656 612 93.3 3182 2199 637 600 134 299 19.1 22.7 6.2 3.9
Bo 580 560 96.6 3116 2300 585 628 139 274 22.1 23.4 5.6 4.5
Moyamba 581 580 99.8 2772 2831 499 637 118 286 20.7 21.2 5.1 4.8
Northern Kambia 563 548 97.3 3387 2543 523 613 123 300 17.6 16.2 6.4 5.3
Port Loko 559 548 98.0 2983 2238 500 575 110 250 19.0 20.1 5.5 5.4
Koinadugu 737 759 103.0 3155 3128 559 764 155 347 14.8 20.1 7.3 4.7
Tonkolili 689 639 92.7 3319 2536 595 743 160 332 19.7 25.2 6.1 4.5
Bombali 615 618 100.5 3023 2446 545 577 124 124 18.2 16.8 5.7 4.6
National 9,546 9,469 99.2 45,093 38,599 8,483 10,175 1,996 4550 19.1 22.1 5.6 4.5
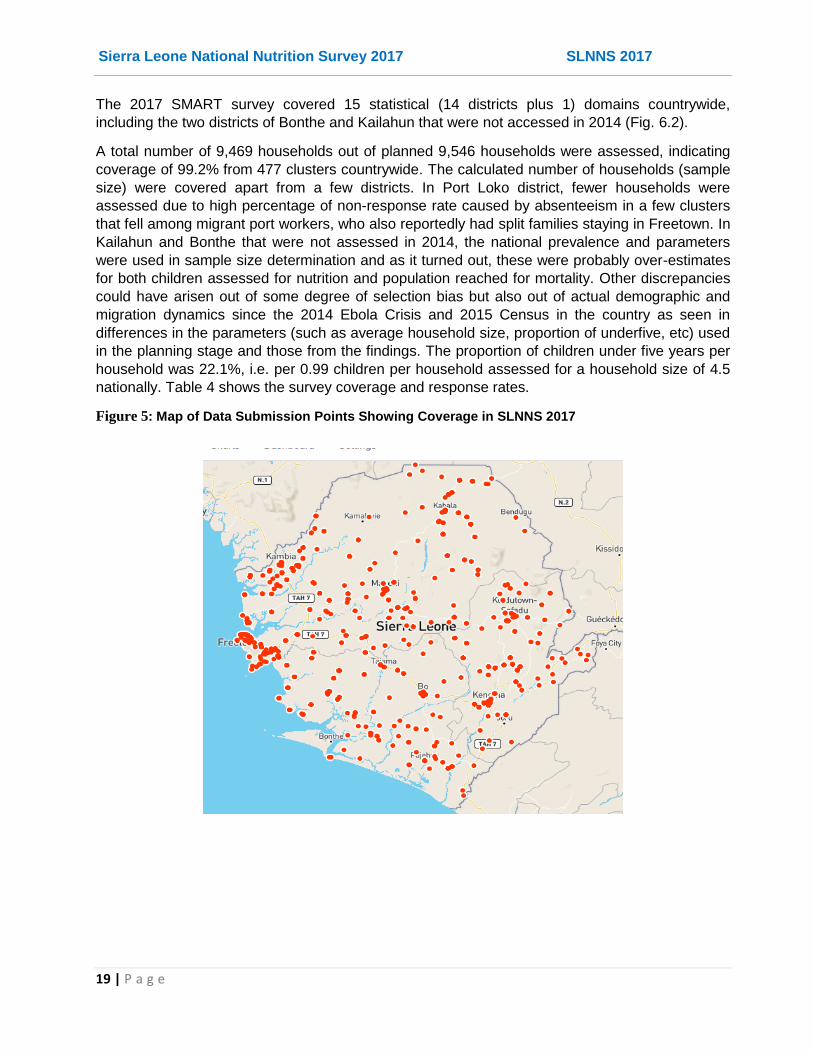
Sierra Leone National Nutrition Survey 2017 SLNNS 2017
19 | P a g e
The 2017 SMART survey covered 15 statistical (14 districts plus 1) domains countrywide,
including the two districts of Bonthe and Kailahun that were not accessed in 2014 (Fig. 6.2).
A total number of 9,469 households out of planned 9,546 households were assessed, indicating
coverage of 99.2% from 477 clusters countrywide. The calculated number of households (sample
size) were covered apart from a few districts. In Port Loko district, fewer households were
assessed due to high percentage of non-response rate caused by absenteeism in a few clusters
that fell among migrant port workers, who also reportedly had split families staying in Freetown. In
Kailahun and Bonthe that were not assessed in 2014, the national prevalence and parameters
were used in sample size determination and as it turned out, these were probably over-estimates
for both children assessed for nutrition and population reached for mortality. Other discrepancies
could have arisen out of some degree of selection bias but also out of actual demographic and
migration dynamics since the 2014 Ebola Crisis and 2015 Census in the country as seen in
differences in the parameters (such as average household size, proportion of underfive, etc) used
in the planning stage and those from the findings. The proportion of children under five years per
household was 22.1%, i.e. per 0.99 children per household assessed for a household size of 4.5
nationally. Table 4 shows the survey coverage and response rates.
Figure 5: Map of Data Submission Points Showing Coverage in SLNNS 2017
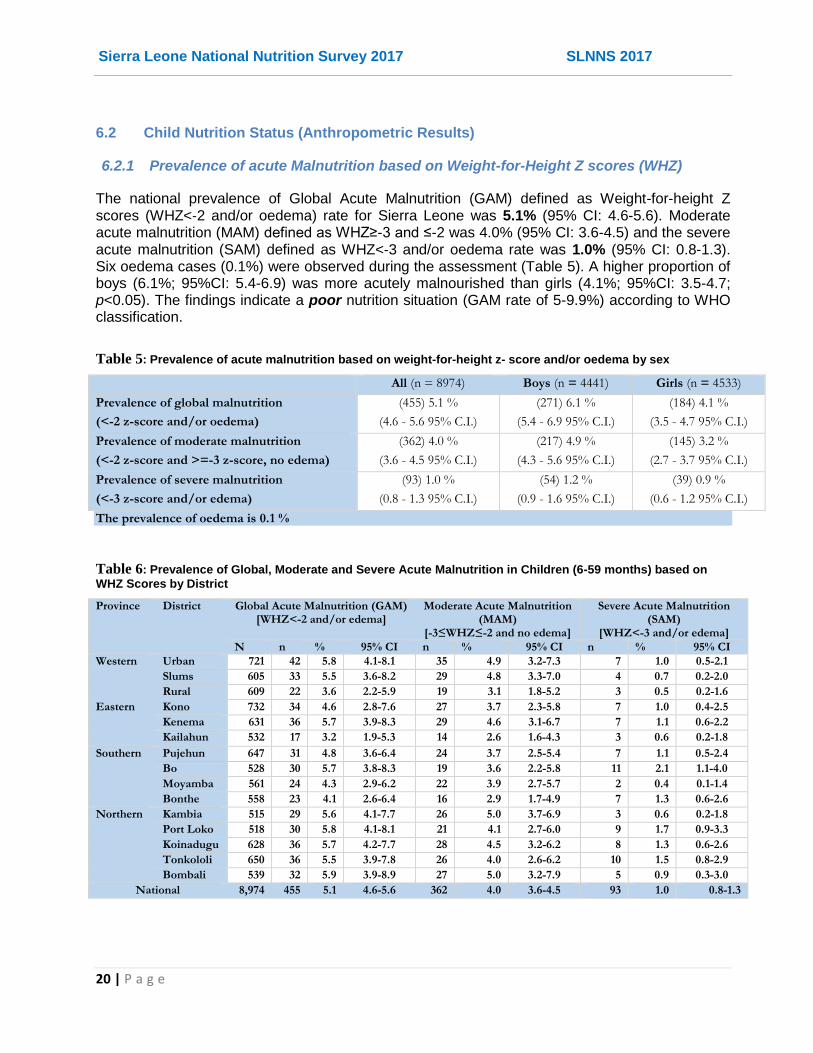
Sierra Leone National Nutrition Survey 2017 SLNNS 2017
20 | P a g e
6.2 Child Nutrition Status (Anthropometric Results)
6.2.1 Prevalence of acute Malnutrition based on Weight-for-Height Z scores (WHZ)
The national prevalence of Global Acute Malnutrition (GAM) defined as Weight-for-height Z scores (WHZ<‐2 and/or oedema) rate for Sierra Leone was 5.1% (95% CI: 4.6-5.6). Moderate acute malnutrition (MAM) defined as WHZ≥-3 and ≤-2 was 4.0% (95% CI: 3.6-4.5) and the severe acute malnutrition (SAM) defined as WHZ<‐3 and/or oedema rate was 1.0% (95% CI: 0.8-1.3). Six oedema cases (0.1%) were observed during the assessment (Table 5). A higher proportion of boys (6.1%; 95%CI: 5.4-6.9) was more acutely malnourished than girls (4.1%; 95%CI: 3.5-4.7; p<0.05). The findings indicate a poor nutrition situation (GAM rate of 5-9.9%) according to WHO classification.
Table 5: Prevalence of acute malnutrition based on weight-for-height z- score and/or oedema by sex
All (n = 8974) Boys (n = 4441) Girls (n = 4533)
Prevalence of global malnutrition
(<-2 z-score and/or oedema)
(455) 5.1 %
(4.6 - 5.6 95% C.I.)
(271) 6.1 %
(5.4 - 6.9 95% C.I.)
(184) 4.1 %
(3.5 - 4.7 95% C.I.)
Prevalence of moderate malnutrition
(<-2 z-score and >=-3 z-score, no edema)
(362) 4.0 %
(3.6 - 4.5 95% C.I.)
(217) 4.9 %
(4.3 - 5.6 95% C.I.)
(145) 3.2 %
(2.7 - 3.7 95% C.I.)
Prevalence of severe malnutrition
(<-3 z-score and/or edema)
(93) 1.0 %
(0.8 - 1.3 95% C.I.)
(54) 1.2 %
(0.9 - 1.6 95% C.I.)
(39) 0.9 %
(0.6 - 1.2 95% C.I.)
The prevalence of oedema is 0.1 %
Table 6: Prevalence of Global, Moderate and Severe Acute Malnutrition in Children (6-59 months) based on
WHZ Scores by District
Province District Global Acute Malnutrition (GAM) [WHZ<-2 and/or edema]
Moderate Acute Malnutrition (MAM)
[-3≤WHZ≤-2 and no edema]
Severe Acute Malnutrition (SAM)
[WHZ<-3 and/or edema]
N n % 95% CI n % 95% CI n % 95% CI
Western Urban 721 42 5.8 4.1-8.1 35 4.9 3.2-7.3 7 1.0 0.5-2.1
Slums 605 33 5.5 3.6-8.2 29 4.8 3.3-7.0 4 0.7 0.2-2.0
Rural 609 22 3.6 2.2-5.9 19 3.1 1.8-5.2 3 0.5 0.2-1.6
Eastern Kono 732 34 4.6 2.8-7.6 27 3.7 2.3-5.8 7 1.0 0.4-2.5
Kenema 631 36 5.7 3.9-8.3 29 4.6 3.1-6.7 7 1.1 0.6-2.2
Kailahun 532 17 3.2 1.9-5.3 14 2.6 1.6-4.3 3 0.6 0.2-1.8
Southern Pujehun 647 31 4.8 3.6-6.4 24 3.7 2.5-5.4 7 1.1 0.5-2.4
Bo 528 30 5.7 3.8-8.3 19 3.6 2.2-5.8 11 2.1 1.1-4.0
Moyamba 561 24 4.3 2.9-6.2 22 3.9 2.7-5.7 2 0.4 0.1-1.4
Bonthe 558 23 4.1 2.6-6.4 16 2.9 1.7-4.9 7 1.3 0.6-2.6
Northern Kambia 515 29 5.6 4.1-7.7 26 5.0 3.7-6.9 3 0.6 0.2-1.8
Port Loko 518 30 5.8 4.1-8.1 21 4.1 2.7-6.0 9 1.7 0.9-3.3
Koinadugu 628 36 5.7 4.2-7.7 28 4.5 3.2-6.2 8 1.3 0.6-2.6
Tonkololi 650 36 5.5 3.9-7.8 26 4.0 2.6-6.2 10 1.5 0.8-2.9
Bombali 539 32 5.9 3.9-8.9 27 5.0 3.2-7.9 5 0.9 0.3-3.0
National 8,974 455 5.1 4.6-5.6 362 4.0 3.6-4.5 93 1.0 0.8-1.3
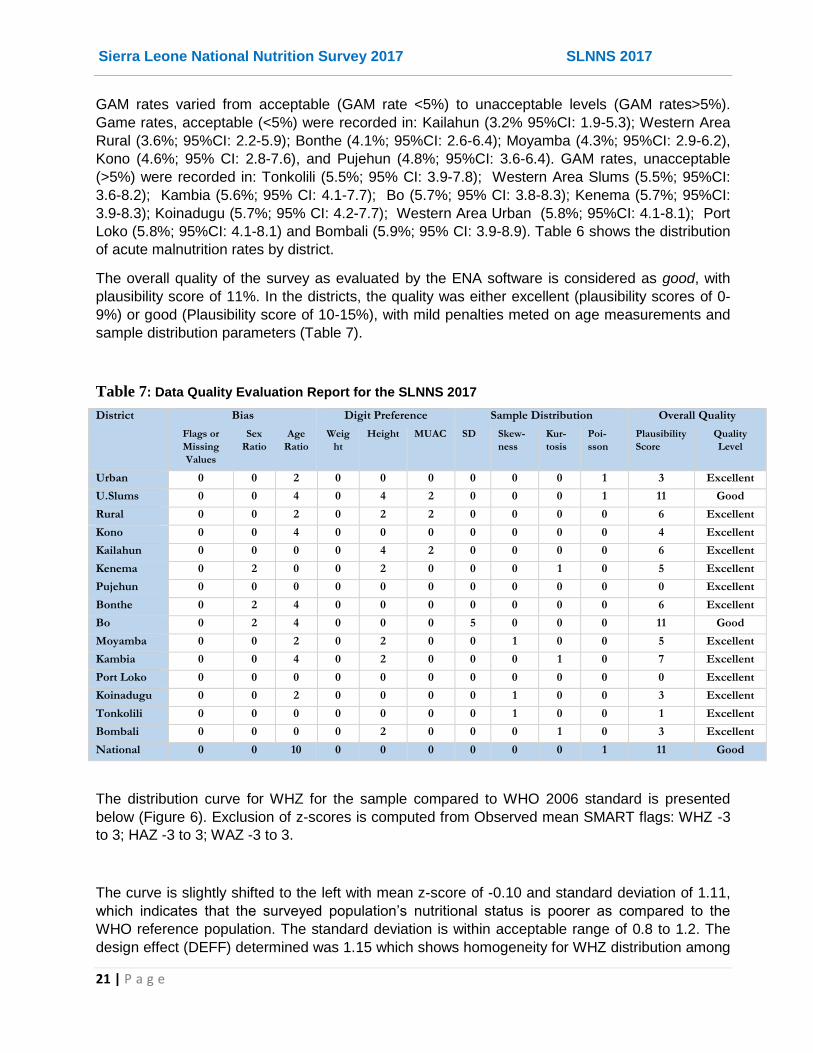
Sierra Leone National Nutrition Survey 2017 SLNNS 2017
21 | P a g e
GAM rates varied from acceptable (GAM rate <5%) to unacceptable levels (GAM rates>5%).
Game rates, acceptable (<5%) were recorded in: Kailahun (3.2% 95%CI: 1.9-5.3); Western Area
Rural (3.6%; 95%CI: 2.2-5.9); Bonthe (4.1%; 95%CI: 2.6-6.4); Moyamba (4.3%; 95%CI: 2.9-6.2),
Kono (4.6%; 95% CI: 2.8-7.6), and Pujehun (4.8%; 95%CI: 3.6-6.4). GAM rates, unacceptable
(>5%) were recorded in: Tonkolili (5.5%; 95% CI: 3.9-7.8); Western Area Slums (5.5%; 95%CI:
3.6-8.2); Kambia (5.6%; 95% CI: 4.1-7.7); Bo (5.7%; 95% CI: 3.8-8.3); Kenema (5.7%; 95%CI:
3.9-8.3); Koinadugu (5.7%; 95% CI: 4.2-7.7); Western Area Urban (5.8%; 95%CI: 4.1-8.1); Port
Loko (5.8%; 95%CI: 4.1-8.1) and Bombali (5.9%; 95% CI: 3.9-8.9). Table 6 shows the distribution
of acute malnutrition rates by district.
The overall quality of the survey as evaluated by the ENA software is considered as good, with
plausibility score of 11%. In the districts, the quality was either excellent (plausibility scores of 0-
9%) or good (Plausibility score of 10-15%), with mild penalties meted on age measurements and
sample distribution parameters (Table 7).
Table 7: Data Quality Evaluation Report for the SLNNS 2017
District Bias Digit Preference Sample Distribution Overall Quality
Flags or
Missing
Values
Sex
Ratio
Age
Ratio
Weig
ht
Height MUAC SD Skew-
ness
Kur-
tosis
Poi-
sson
Plausibility
Score
Quality
Level
Urban 0 0 2 0 0 0 0 0 0 1 3 Excellent
U.Slums 0 0 4 0 4 2 0 0 0 1 11 Good
Rural 0 0 2 0 2 2 0 0 0 0 6 Excellent
Kono 0 0 4 0 0 0 0 0 0 0 4 Excellent
Kailahun 0 0 0 0 4 2 0 0 0 0 6 Excellent
Kenema 0 2 0 0 2 0 0 0 1 0 5 Excellent
Pujehun 0 0 0 0 0 0 0 0 0 0 0 Excellent
Bonthe 0 2 4 0 0 0 0 0 0 0 6 Excellent
Bo 0 2 4 0 0 0 5 0 0 0 11 Good
Moyamba 0 0 2 0 2 0 0 1 0 0 5 Excellent
Kambia 0 0 4 0 2 0 0 0 1 0 7 Excellent
Port Loko 0 0 0 0 0 0 0 0 0 0 0 Excellent
Koinadugu 0 0 2 0 0 0 0 1 0 0 3 Excellent
Tonkolili 0 0 0 0 0 0 0 1 0 0 1 Excellent
Bombali 0 0 0 0 2 0 0 0 1 0 3 Excellent
National 0 0 10 0 0 0 0 0 0 1 11 Good
The distribution curve for WHZ for the sample compared to WHO 2006 standard is presented
below (Figure 6). Exclusion of z-scores is computed from Observed mean SMART flags: WHZ -3
to 3; HAZ -3 to 3; WAZ -3 to 3.
The curve is slightly shifted to the left with mean z-score of -0.10 and standard deviation of 1.11,
which indicates that the surveyed population’s nutritional status is poorer as compared to the
WHO reference population. The standard deviation is within acceptable range of 0.8 to 1.2. The
design effect (DEFF) determined was 1.15 which shows homogeneity for WHZ distribution among

Sierra Leone National Nutrition Survey 2017 SLNNS 2017
22 | P a g e
the clusters, lower than the DEFF of 1.5 used in the planning for sample size determination for
this survey.
Figure 6: Distribution of weight-for-height Z Scores
The cases of malnutrition however appeared to be clustered more in certain clusters and districts
as indicated by index of dispersion (ID) values for WHZ<-2 (ID=1.12, p<0.05) and for WHZ<-3
(ID=1.11, p<0.05)7. For instance, oedema was reported in only four districts (Kailahun,
Koinadugu, Kenema and Port Loko).
The prevalence of acute malnutrition (WHZ<-2 and/or oedema) by age is presented in Table 8
and shows a higher proportion of acutely malnourished among the 6-17 months old children and
among the 18-29 months old children. Further analysis showed that prevalence of acute
malnutrition was significantly higher among the younger (6-29 months) children (GAM 7.8%;
95%CI: 7.0-8.7) than among the older (30-59 months) children (GAM 2.7%; 95%CI: 2.2-3.1), with
younger almost three times more likely to be malnourished (RR=2.922; 95%CI: 2.390-3.572). The
difference (p<0.05) in the distribution of acute malnutrition among the younger (6-29 months) and
older (30-59 months) age groups is not entire unexpected given this age bracket includes the
critical 6-23 months children that are more vulnerable to the risks of poor IYCF practices and
associated infections and malnutrition. Table 9 shows the distribution of acute malnutrition based
on WHZ and oedema. Six kwashiorkor cases were reported.
7 The Index of Dispersion (ID) indicates the degree to which the cases are aggregated into certain clusters (the degree to which there
are "pockets"). If ID has p value between 0.05 and 0.95 the cases are aggregated into certain cluster (there appear to be pockets of cases).

Sierra Leone National Nutrition Survey 2017 SLNNS 2017
23 | P a g e
Table 8: Prevalence of acute malnutrition by age, based on weight-for-height Z scores and/or oedema
Severe wasting
(<-3 z-score)
Moderate wasting
(>= -3 and <-2 z-score )
Normal
(> = -2 z score)
Oedema
Age (mo) Total no. No. % No. % No. % No. %
6-17 2283 44 1.9 175 7.7 2064 90.4 0 0.0
18-29 2184 22 1.0 95 4.3 2064 94.5 3 0.1
30-41 2172 9 0.4 53 2.4 2110 97.1 0 0.0
42-53 1723 7 0.4 26 1.5 1687 97.9 3 0.2
54-59 612 5 0.8 13 2.1 594 97.1 0 0.0
Total 8974 87 1.0 362 4.0 8519 94.9 6 0.1
Table 9: Distribution of acute malnutrition and oedema based on weight-for-height z-scores
<-3 z-score >=-3 z-score
Oedema present Marasmic kwashiorkor No.
0 (0.0 %)
Kwashiorkor No.
6 (0.1 %)
Oedema absent Marasmic No.
96 (1.1 %)
Not severely malnourished No. 8888
(98.9 %)
6.2.2 Prevalence of acute Malnutrition based on Mid Upper Arm Circumference (MUAC)
As shown in Table 10, the national prevalence of global acute malnutrition based on MUAC
(<125mm) and/or oedema was 2.6% (95% CI: 2.3-3.1), moderate acute malnutrition based on
MUAC (MUAC≥115mm and ≤125 mm, and no oedema) was 2.0% (95% CI: 1.7-2.4) and of
severe acute malnutrition (MUAC<115mm and/or oedema) was 0.6% (95% CI: 0.5-0.8). Acute
malnutrition by MUAC (<125 mm/oedema) was equally distributed among boys (2.4%; 95% CI:
1.9-2.9) and girls (2.9%: 95% CI: 2.4-3.5).
Table 10: Prevalence of acute malnutrition based on MUAC cut off's (and/or oedema) and by sex
All (n = 8993) Boys (n = 4454) Girls (n = 4539)
Prevalence of global malnutrition –
GAMMUAC (< 125 mm and/or oedema)
(238) 2.6 %
(2.3 - 3.1 95% C.I.)
(106) 2.4 %
(1.9 - 2.9 95% C.I.)
(132) 2.9 %
(2.4 - 3.5 95% C.I.)
Prevalence of moderate malnutrition
(< 125 mm and >= 115 mm, no oedema)
(182) 2.0 %
(1.7 - 2.4 95% C.I.)
(76) 1.7 %
(1.3 - 2.2 95% C.I.)
(106) 2.3 %
(1.9 - 2.8 95% C.I.)
Prevalence of severe malnutrition
(< 115 mm and/or oedema)
(56) 0.6 %
(0.5 - 0.8 95% C.I.)
(30) 0.7 %
(0.5 - 1.0 95% C.I.)
(26) 0.6 %
(0.4 - 0.8 95% C.I.)
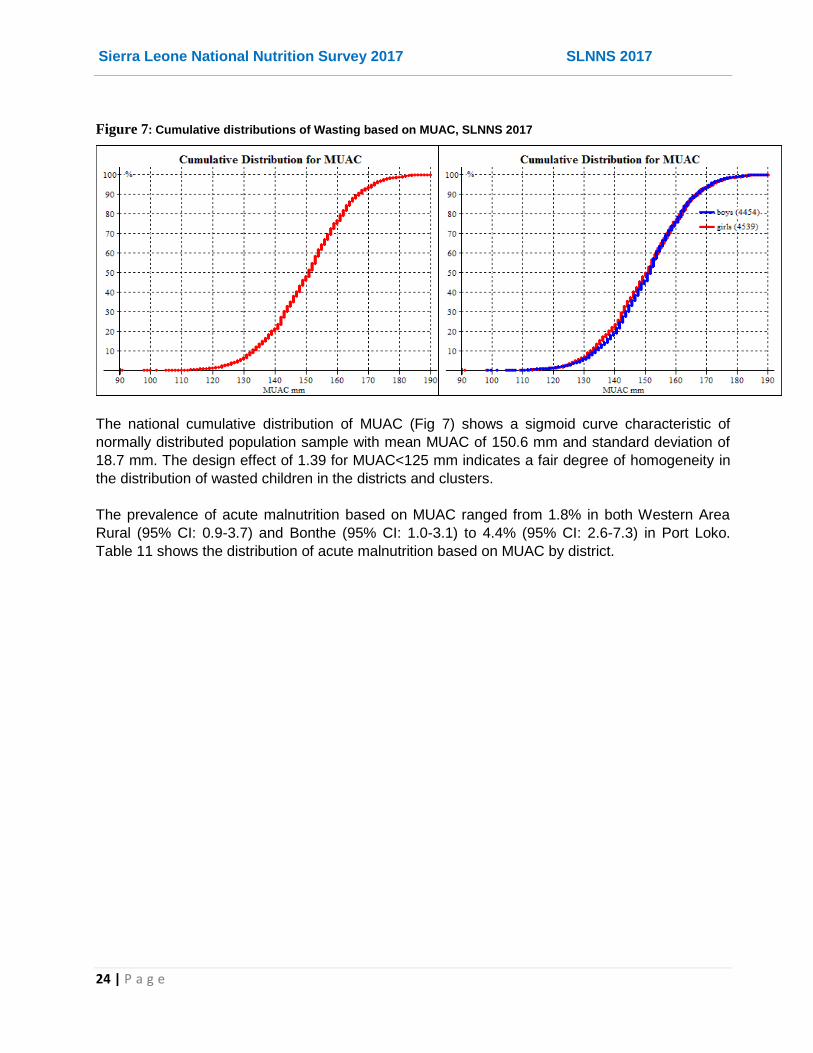
Sierra Leone National Nutrition Survey 2017 SLNNS 2017
24 | P a g e
Figure 7: Cumulative distributions of Wasting based on MUAC, SLNNS 2017
The national cumulative distribution of MUAC (Fig 7) shows a sigmoid curve characteristic of
normally distributed population sample with mean MUAC of 150.6 mm and standard deviation of
18.7 mm. The design effect of 1.39 for MUAC<125 mm indicates a fair degree of homogeneity in
the distribution of wasted children in the districts and clusters.
The prevalence of acute malnutrition based on MUAC ranged from 1.8% in both Western Area
Rural (95% CI: 0.9-3.7) and Bonthe (95% CI: 1.0-3.1) to 4.4% (95% CI: 2.6-7.3) in Port Loko.
Table 11 shows the distribution of acute malnutrition based on MUAC by district.

Sierra Leone National Nutrition Survey 2017 SLNNS 2017
25 | P a g e
Table 11: Prevalence of Global, Moderate and Severe Acute Malnutrition in Children (6-59 months)
based on MUAC by District
Province District Global Acute Malnutrition (MUAC<125 mm and/or
oedema)
Moderate Acute Malnutrition (MUAC≥115 mm and ≤-125
mm and no oedema)
Severe Acute Malnutrition (SAM)
(MUAC<115mm and/or odema)
N n % 95% CI n % 95% CI n % 95% CI
Western Urban 721 14 1.9 1.1-3.4 10 1.4 0.7-2.6 4 0.6 0.2-1.5
U.Slums 605 12 2.0 1.1-3.5 10 1.7 0.9-3.0 2 0.3 0.1-1.4
Rural 613 11 1.8 0.9-3.7 7 1.1 0.5-2.8 4 0.7 0.2-1.8
Eastern Kono 732 10 1.4 0.6-3.0 8 1.1 0.4-2.6 2 0.3 0.1-1.1
Kenema 631 19 3.0 1.7-5.2 13 2.1 1.0-4.2 6 1.0 0.5-2.0
Kailahun 534 15 2.8 1.6-4.8 12 2.2 1.3-4.0 3 0.6 0.2-1.7
Southern Pujehun 648 25 3.9 2.5-5.8 20 3.1 2.0-4.8 5 0.8 0.3-1.7
Bo 529 15 2.8 1.5-5.3 9 1.7 0.8-3.5 6 1.1 0.5-2.8
Moyamba 562 14 2.5 1.3-4.7 13 2.3 1.2-4.5 1 0.2 0.0-1.4
Bonthe 558 10 1.8 1.0-3.1 6 1.1 0.5-2.3 4 0.7 0.3-1.9
Northern Kambia 516 15 2.9 1.6-5.2 10 1.9 1.1-3.5 5 1.0 0.4-2.2
Port Loko 520 23 4.4 2.6-7.3 18 3.5 2.0-5.9 5 1.0 0.4-2.5
Koinadugu 633 24 3.8 2.0-6.9 19 3.0 1.6-5.5 5 0.8 0.3-2.2
Tonkololi 652 21 3.2 2.0-5.0 18 2.8 1.7-4.6 3 0.5 0.2-1.4
Bombali 539 10 1.9 1.0-3.5 9 1.7 0.8-3.3 1 0.2 0.0-1.4
National 8,993 238 2.6 2.3-3.1 182 2.0 1.7-2.4 56 0.6 0.5-0.8
In all the districts, the prevalence of acute malnutrition by MUAC was lower than prevalence by
weight-for-height z scores.
Table 12 shows the national prevalence of acute malnutrition based on MUAC by age. Again a
higher proportion of the younger children aged 6-29 months were acutely malnourished using
MUAC (p<0.05) than the older counterparts (30-59 months).
Table 12: Prevalence of acute malnutrition by age, based on MUAC cut off's and/or oedema
Severe wasting
(< 115 mm)
Moderate wasting
(>= 115 mm and < 125 mm)
Normal
(> = 125 mm )
Oedema
Age (mo) Total no. No. % No. % No. % No. %
6-17 2292 35 1.5 126 5.5 2131 93.0 0 0.0
18-29 2190 12 0.5 49 2.2 2129 97.2 3 0.1
30-41 2175 3 0.1 3 0.1 2169 99.7 0 0.0
42-53 1724 0 0.0 6 0.3 1718 99.7 3 0.2
54-59 612 0 0.0 1 0.2 611 99.8 0 0.0
Total 8993 50 0.6 185 2.1 8758 97.4 6 0.1
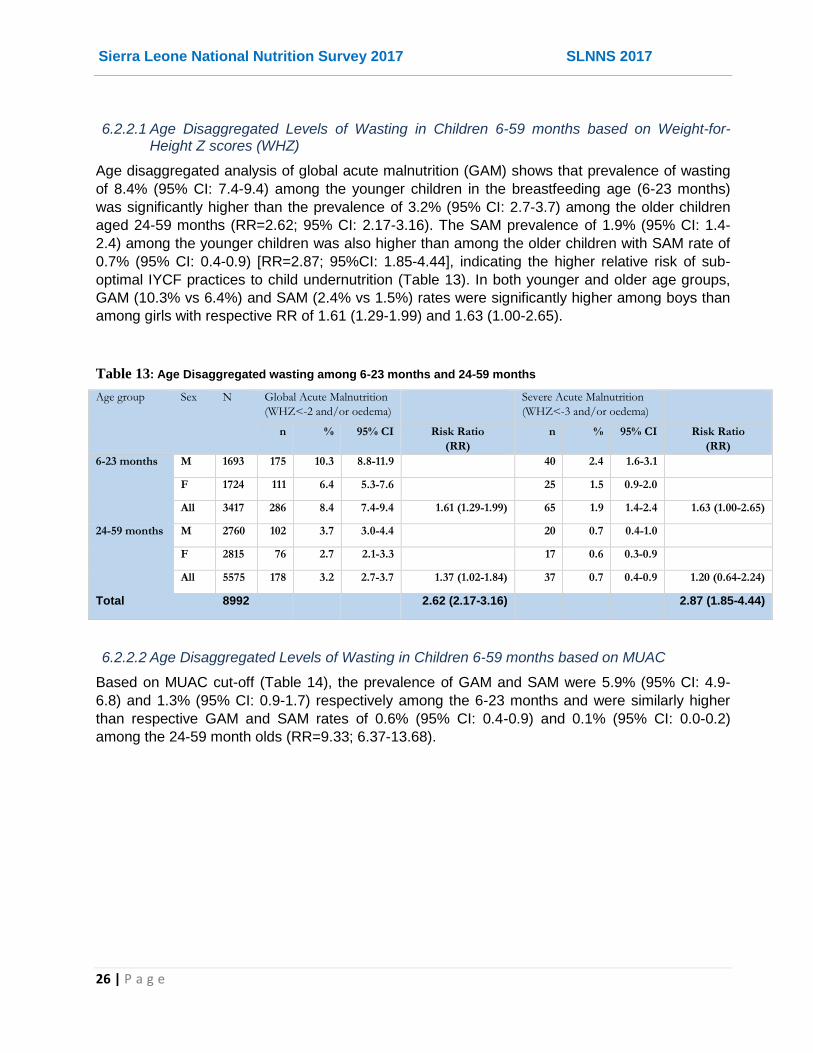
Sierra Leone National Nutrition Survey 2017 SLNNS 2017
26 | P a g e
6.2.2.1 Age Disaggregated Levels of Wasting in Children 6-59 months based on Weight-for-Height Z scores (WHZ)
Age disaggregated analysis of global acute malnutrition (GAM) shows that prevalence of wasting
of 8.4% (95% CI: 7.4-9.4) among the younger children in the breastfeeding age (6-23 months)
was significantly higher than the prevalence of 3.2% (95% CI: 2.7-3.7) among the older children
aged 24-59 months (RR=2.62; 95% CI: 2.17-3.16). The SAM prevalence of 1.9% (95% CI: 1.4-
2.4) among the younger children was also higher than among the older children with SAM rate of
0.7% (95% CI: 0.4-0.9) [RR=2.87; 95%CI: 1.85-4.44], indicating the higher relative risk of sub-
optimal IYCF practices to child undernutrition (Table 13). In both younger and older age groups,
GAM (10.3% vs 6.4%) and SAM (2.4% vs 1.5%) rates were significantly higher among boys than
among girls with respective RR of 1.61 (1.29-1.99) and 1.63 (1.00-2.65).
Table 13: Age Disaggregated wasting among 6-23 months and 24-59 months
Age group Sex N Global Acute Malnutrition
(WHZ<-2 and/or oedema)
Severe Acute Malnutrition
(WHZ<-3 and/or oedema)
n % 95% CI Risk Ratio
(RR)
n % 95% CI Risk Ratio
(RR)
6-23 months M 1693 175 10.3 8.8-11.9 40 2.4 1.6-3.1
F 1724 111 6.4 5.3-7.6 25 1.5 0.9-2.0
All 3417 286 8.4 7.4-9.4 1.61 (1.29-1.99) 65 1.9 1.4-2.4 1.63 (1.00-2.65)
24-59 months M 2760 102 3.7 3.0-4.4 20 0.7 0.4-1.0
F 2815 76 2.7 2.1-3.3 17 0.6 0.3-0.9
All 5575 178 3.2 2.7-3.7 1.37 (1.02-1.84) 37 0.7 0.4-0.9 1.20 (0.64-2.24)
Total 8992 2.62 (2.17-3.16) 2.87 (1.85-4.44)
6.2.2.2 Age Disaggregated Levels of Wasting in Children 6-59 months based on MUAC
Based on MUAC cut-off (Table 14), the prevalence of GAM and SAM were 5.9% (95% CI: 4.9-
6.8) and 1.3% (95% CI: 0.9-1.7) respectively among the 6-23 months and were similarly higher
than respective GAM and SAM rates of 0.6% (95% CI: 0.4-0.9) and 0.1% (95% CI: 0.0-0.2)
among the 24-59 month olds (RR=9.33; 6.37-13.68).

Sierra Leone National Nutrition Survey 2017 SLNNS 2017
27 | P a g e
Table 14: Age Disaggregated wasting (based on MUAC) among 6-23 months and 24-59 months
Age
group
Sex N Global Acute Malnutrition (WHZ<-2 and/or
oedema)
Severe Acute Malnutrition (WHZ<-3
and/or oedema)
n % 95% CI Risk Ratio
(RR)
n % 95% CI Risk Ratio
(RR)
6-23
months
M 1693 87 5.1 4.0-6.3 24 1.4 0.9-2.0
F 1724 113 6.6 5.3-7.8 20 1.2 0.6-1.7
All 3417 200 5.9 4.9-6.8 0.78 (0.60-1.02) 44 1.3 0.9-1.7 1.22 (0.67-2.22)
24-59
months
M 2762 18 0.7 0.3-1.0 4 0.1 0.0-0.3
F 2819 17 0.6 0.3-0.9 2 0.1 0.0-0.2
All 5581 35 0.6 0.4-0.9 1.08 (0.55-2.13) 6 0.1 0.0-0.2 2.0 (0.37-11.2)
Total 8998 9.33 (6.37-13.68) 12.0 (5.1-28.3)
6.2.3 Prevalence of Underweight based on Weight-for-Age Z scores (WAZ)
The national prevalence of children underweight was 13.6% (95% CI: 12.8-14.5) with 10.5% (95%
CI: 9.8-11.3) moderately underweight and 3.1% (95% CI: 2.7-3.5) severely underweight (Table
15). The level of underweight was significantly higher (p<0.05) in boys (15.5%; 95% CI: 14.3-16.7
than in girls (11.7%; 95% CI: 10.7-12.8). Table 16 shows the national distribution of underweight
by age and Fig. 8 shows the national distributions of WAZ scores.
Table 15: Prevalence of underweight based on weight-for-age z-scores by sex
All (n = 8984) Boys (n = 4449) Girls (n = 4535)
Prevalence of underweight
(<-2 z-score)
(1221) 13.6 %
(12.8 - 14.5 95% C.I.)
(689) 15.5 %
(14.3 - 16.7 95% C.I.)
(532) 11.7 %
(10.7 - 12.8 95% C.I.)
Prevalence of moderate underweight
(<-2 z-score and >=-3 z-score)
(946) 10.5 % (9.8 - 11.3 95% C.I.)
(517) 11.6 % (10.6 - 12.7 95% C.I.)
(429) 9.5 %
(8.6 - 10.4 95% C.I.)
Prevalence of severe underweight
(<-3 z-score)
(275) 3.1 %
(2.7 - 3.5 95% C.I.)
(172) 3.9 %
(3.3 - 4.5 95% C.I.)
(103) 2.3 %
(1.8 - 2.8 95% C.I.)

Sierra Leone National Nutrition Survey 2017 SLNNS 2017
28 | P a g e
Table 16: Prevalence of underweight by age, based on weight-for-age z-scores
Severe underweight
(<-3 z-score)
Moderate underweight
(>= -3 and <-2 z-score )
Normal
(> = -2 z score)
Oedema
Age (mo) Total no. No. % No. % No. % No. %
6-17 2290 99 4.3 287 12.5 1904 83.1 0 0.0
18-29 2186 93 4.3 256 11.7 1837 84.0 3 0.1
30-41 2175 49 2.3 211 9.7 1915 88.0 0 0.0
42-53 1721 19 1.1 136 7.9 1566 91.0 3 0.2
54-59 612 15 2.5 56 9.2 541 88.4 0 0.0
Total 8984 275 3.1 946 10.5 7763 86.4 6 0.1
Figure 8: Distributions of weight-for-age Z scores in Children 6-59 months, SLNNS 2017
As shown on Table 17, the prevalence of underweight by district ranged from 10.8% (95% CI: 8.3-
13.8) in Western Area Rural to 16.8% (95% CI: 13.3-21.0) in Pujehun district.

Sierra Leone National Nutrition Survey 2017 SLNNS 2017
29 | P a g e
Table 17: Prevalence of National, Moderate and Severe Underweight in Children (6-59 months) based on WAZ
Scores by District
6.2.3.1 Age Disaggregated Levels of Underweight based on Weight-for-Age Z scores (WAZ)
Analysis of age disaggregated underweight levels shows that prevalence of underweight of 16.7%
(95% CI: 15.3-18.1) among the younger children in the breastfeeding age (6-23 months) was
significantly higher than the prevalence of 11.7% (95% CI: 10.7-12.7) among the older children
aged 24-59 months (RR=1.42; 95% CI: 1.27-1.59). The SAM prevalence of 4.3% (95% CI: 3.6-
5.1) among the younger children was also higher than 2.3% (95% CI: 1.9-2.7) among the older
children (RR=1.88; 95% CI: 1.46-2.41), indicating the higher vulnerability of this age group to
undernutrition (Table 18). In both younger and older age groups, global underweight (19.4% vs
13.9%) and severe underweight (5.7% vs 3.0%) rates were significantly higher among boys than
among girls with respective RR of 1.39 (1.20-1.62) and 1.88 (1.35-2.62).
Province District Global Underweight (WAZ<-2)
Moderate Underweight (-3≤WAZ≤-2)
Severe Underweight (WAZ<-3)
N n % 95% CI n % 95% CI n % 95% CI
Western Urban 721 90 12.5 9.9-15.6 78 10.8 8.6-13.6 12 1.7 1.0-2.7
U.Slums 605 94 15.5 12.7-18.9 79 13.1 10.4-16.2 15 2.5 1.2-5.0
Rural 613 66 10.8 8.3-13.8 45 7.3 5.1-10.4 21 3.4 2.2-5.3
Eastern Kono 732 99 13.5 11.0-16.6 75 10.2 8.3-12.6 24 3.3 2.2-4.9
Kenema 630 99 15.7 12.3-19.8 74 11.7 9.0-15.2 25 4.0 2.4-6.5
Kailahun 532 67 12.6 9.7-16.1 49 9.2 6.8-12.3 18 3.4 2.0-5.7
Southern Pujehun 648 109 16.8 13.3-21.0 84 13.0 9.7-17.2 25 3.9 2.3-6.3
Bo 529 76 14.4 10.5-19.4 53 10.0 7.2-13.8 23 4.3 2.5-7.3
Moyamba 562 65 11.6 9.4-14.1 51 9.1 7.2-11.4 14 2.5 1.6-4.0
Bonthe 558 62 11.1 7.8-15.6 50 9.0 5.9-13.3 12 2.2 1.2-3.9
Northern Kambia 515 68 13.2 9.7-17.8 59 11.5 8.4-15.4 9 1.7 0.8-3.6
Port Loko 517 63 12.2 9.3-15.8 49 9.5 7.2-12.4 14 2.7 1.6-4.6
Koinadugu 631 84 13.3 10.5-16.7 63 10.0 7.5-13.2 21 3.3 2.1-5.2
Tonkololi 652 98 15.0 11.9-18.7 71 10.9 8.5-13.9 27 4.1 2.7-6.2
Bombali 539 81 15.0 11.5-19.3 66 12.2 9.6-15.5 15 2.8 1.6-4.9
National 8,984 1,221 13.6 12.8-14.5 964 10.5 9.8-11.3 275 3.1 2.7-3.5

Sierra Leone National Nutrition Survey 2017 SLNNS 2017
30 | P a g e
Table 18: Age Disaggregated Underweight among 6-23 months and 24-59 months
Age group Sex N Underweight (WAZ<-2) Severe Underweight (WAZ<-3)
n % 95% CI Risk Ratio
(RR)
n % 95% CI Risk Ratio
(RR)
6-23
months
M 1692 329 19.4 17.4-21.5 96 5.7 4.5-6.9
F 1721 240 13.9 12.3-15.6 52 3.0 2.2-3.8
All 3413 569 16.7 15.3-18.1 1.39 (1.20-1.62) 148 4.3 3.6-5.1 1.88 (1.35-2.62)
24-59
months
M 2761 362 13.1 11.6-14.6 78 2.8 2.2-3.5
F 2816 292 10.4 9.2-11.6 51 1.8 1.3-2.3
All 5577 654 11.7 10.7-12.7 1.26 (1.08-1.48) 129 2.3 1.9-2.7 1.56 (1.09-2.23)
Total 8990 1.42 (1.27-1.59) 1.88 (1.46-2.41)
6.2.4 Prevalence of Stunting based on Height-for-Age Z scores (HAZ)
The national prevalence of stunting (HAZ<-2) was 31.3% (95% CI: 30.0-32.6) with 21.3% (95%
CI: 20.3-22.3) moderately stunted and 10.0% (95% CI: 9.2-10.7) severely stunted (Table 19). A
higher percentage of boys (35.2%; 95% CI: 33.5-36.9) than girls (27.4%; 95% CI: 25.8-29.1) were
stunted (p<0.05). Stunting levels are however distributed equally among the younger (6-29
months) and older (30-59 months) age groups (p>0.05). Table 20 shows the national distribution
of stunting by age of the child and Fig. 9 shows the national distributions of HAZ scores.
Table 19: Prevalence of stunting based on height-for-age z-scores and by sex
All (n = 8961) Boys (n = 4434) Girls (n = 4527)
Prevalence of stunting
(<-2 z-score)
(2803) 31.3 %
(30.0 - 32.6 95% C.I.)
(1561) 35.2 %
(33.5 - 36.9 95% C.I.)
(1242) 27.4 %
(25.8 - 29.1 95% C.I.)
Prevalence of moderate stunting
(<-2 z-score and >=-3 z-score)
(1910) 21.3 %
(20.3 - 22.3 95% C.I.)
(1041) 23.5 %
(22.1 - 24.9 95% C.I.)
(869) 19.2 %
(17.9 - 20.5 95% C.I.)
Prevalence of severe stunting
(<-3 z-score)
(893) 10.0 %
(9.2 - 10.7 95% C.I.)
(520) 11.7 %
(10.7 - 12.8 95% C.I.)
(373) 8.2 %
(7.4 - 9.1 95% C.I.)
Table 20: National prevalence of stunting by age based on height-for-age z-scores
Severe stunting
(<-3 z-score)
Moderate stunting
(>= -3 and <-2 z-score )
Normal
(> = -2 z score)
Age (mo) Total no. No. % No. % No. %
6-17 2282 171 7.5 370 16.2 1741 76.3
18-29 2180 264 12.1 550 25.2 1366 62.7
30-41 2171 252 11.6 464 21.4 1455 67.0
42-53 1719 158 9.2 398 23.2 1163 67.7
54-59 609 48 7.9 128 21.0 433 71.1
Total 8961 893 10.0 1910 21.3 6158 68.7

Sierra Leone National Nutrition Survey 2017 SLNNS 2017
31 | P a g e
Figure 9: Distributions of Height-for Age Z Scores in Children 6-59 Months, SLNNS 2017
The HAZ curves are shifted to the left, showing a poorer stunting level in Sierra Leone, compared
to the WHO (2006) international reference population. When disaggregated by district, the
prevalence of stunting ranged from 23.0% (95% CI: 19.9-26.5) in Western Area Urban; 27.3%
(95% CI: 22.8-32.3) in Western Area Slums; 27.7% (95% CI: 21.4-35.1) in Port Loko; and 29.0%
(95% CI: 24.6-33.8) in Western Area Rural; to rates above 30% in the rest of the districts with the
highest stunting prevalence of 38.7% (95% CI: 34.1-43.6) reported in Pujehun district (Table 21).
Table 21: Prevalence of National, Moderate and Severe Stunting in Children (6-59 months) based on HAZ
Scores by District
Province District Global Stunting (HAZ<-2)
Moderate Stunting (-3≤HAZ≤-2)
Severe Stunting (HAZ<-3)
N n % 95% CI n % 95% CI n % 95% CI
Western Urban 721 166 23.0 19.9-26.5 110 15.6 13.4-18.0 56 7.8 5.8-10.3
Slums 605 165 27.3 22.8-32.3 114 19.2 15.5-23.4 51 8.4 5.9-11.8
Rural 607 176 29.0 24.6-33.8 120 20.7 16.9-25.1 56 9.2 7.3-11.5
Eastern Kono 730 224 30.7 26.6-35.2 147 20.8 18.1-23.8 77 10.5 8.0-13.8
Kenema 631 221 35.0 29.1-41.5 146 23.9 19.7-28.7 75 11.9 8.7-16.0
Kailahun 530 183 34.5 29.8-39.6 131 25.5 21.6-30.0 52 9.8 7.2-13.2
Southern Pujehun 646 250 38.7 34.1-43.6 172 27.5 23.8-31.5 78 12.1 9.2-15.7
Bo 527 169 32.1 26.7-38.0 116 22.5 18.0-27.8 53 10.1 7.4-13.5
Moyamba 561 197 35.1 30.5-40.0 127 22.8 19.6-26.4 70 12.5 9.5-16.3
Bonthe 558 175 31.4 26.5-36.6 133 24.2 19.9-29.0 42 7.5 5.4-10.4
Northern Kambia 514 169 32.9 26.9-39.5 128 25.3 20.9-30.2 41 8.0 5.5-11.4
Port Loko 519 144 27.7 21.4-35.1 97 19.4 14.9-24.9 47 9.1 6.0-13.4
Koinadugu 627 196 31.3 26.3-36.7 124 20.5 16.7-24.9 72 11.5 8.9-14.6
Tonkololi 646 195 30.2 25.9-34.9 132 20.9 17.2-25.1 63 9.8 7.6-12.4
Bombali 539 173 32.1 27.7-36.8 113 21.1 17.4-25.4 60 11.1 7.9-15.5
National 8,961 2,803 31.3 30.0-32.6 1,910 21.3 20.3-22.3 893 10.0 9.2-10.7

Sierra Leone National Nutrition Survey 2017 SLNNS 2017
32 | P a g e
6.2.4.1 Age Disaggregated Levels of Stunting based on Height-for-Age Z scores (HAZ)
The prevalence of stunting of 28.2% (95% CI: 26.5-29.9) with severe stunting of 9.3% (95% CI:
8.2-10.3) among the younger children in the breastfeeding age (6-23 months) and was
significantly lower among the older children aged 24-59 months (Table 22) in which the
prevalence of stunting and severe stunting was 33.4% (95% CI: 31.8-35.1) and 10.8% (95% CI:
9.8-11.7) respectively. The younger children aged 6-23 months were thus less likely to be stunted
(RR=0.84; 95% CI: 0.79-0.91) and severely stunted (RR=0.86; 95% CI: 0.75-0.98) than the older
children (24-59 months). It is important to note that if stunting is not prevented in the first two
years of life, then the effects are irreversible in later years and the prevalence is cumulative, thus
likely to be higher. However, global stunting (33.8% vs 22.6%) and severe stunting (12.1% vs
6.5%) rates were significantly more prevalent among boys than among girls with respective RR of
1.50 (1.34-1.67) and 1.85 (1.50-2.30) in younger age group and similarly among the older age
group.
Table 22: Age Disaggregated Stunting Rates among 6-23 months and 24-59 months
Age
group
Sex N Stunting (HAZ<-2) Severe Stunting (HAZ<-3)
n % 95% CI Risk Ratio
(RR)
n % 95% CI Risk Ratio
(RR)
6-23
months
M 1693 573 33.8 31.5-36.2 204 12.1 10.4-13.7
F 1723 390 22.6 20.5-24.7 112 6.5 5.3-7.7
All 3416 963 28.2 26.5-29.9 1.50 (1.34-1.67) 316 9.3 8.2-10.3 1.85 (1.50-2.30)
24-59
months
M 2762 1005 36.4 34.2-38.6 332 12.0 10.7-13.3
F 2818 861 30.6 28.5-32.6 269 9.5 8.4-10.7
All 5580 1866 33.4 31.8-35.1 1.19 (1.10-1.29) 601 10.8 9.8-11.7 1.26 (1.09-1.45)
Total 8996 0.84 (0.79-0.91) 0.86 (0.75-0.98)
6.2.5 Prevalence of Overweight of children (6-59) based on Weight-for-Height Z scores (WHZ)
The national prevalence of overweight (WHZ>2) in children 6-59 months was 2.3% (95% CI: 2.0-
2.6) with severe overweight of 0.3% (95% CI: 0.2-0.5). The prevalence of overweight was not
statistically different among the boys (2.5%; 95% CI: 2.1-3.1) and girls (2.0%; 95% CI: 1.6-2.5%)
assessed nationally (Table 23). Table 24 shows national prevalence of overweight among the U5
children by age. The distribution of overweight was higher among the older (30-59 months) than
among the younger (6-29 months) age group, but this was not statistically significant (p>0.05).

Sierra Leone National Nutrition Survey 2017 SLNNS 2017
33 | P a g e
Table 23: National prevalence of overweight based on weight for height cut offs and by sex (no oedema)
All (n = 8974) Boys (n = 4441) Girls (n = 4533)
Prevalence of overweight (WHZ > 2) (205) 2.3 %
(2.0 - 2.6 95% C.I.)
(113) 2.5 %
(2.1 - 3.1 95% C.I.)
(92) 2.0 %
(1.6 - 2.5 95% C.I.)
Prevalence of severe overweight (WHZ > 3) (31) 0.3 %
(0.2 - 0.5 95% C.I.)
(17) 0.4 %
(0.2 - 0.6 95% C.I.)
(14) 0.3 %
(0.2 - 0.6 95% C.I.)
Table 24: National prevalence of overweight by age based on weight-for-heightz-scores
Overweight (WHZ > 2) Severe Overweight (WHZ > 3)
Age (months) Total no. No. % No. %
6-17 2283 37 1.6 4 0.2
18-29 2184 64 2.9 9 0.4
30-41 2172 67 3.1 12 0.6
42-53 1723 34 2.0 6 0.3
54-59 612 3 0.5 0 0.0
Total 8974 205 2.3 31 0.3
Table 25 shows the distribution of the sample statistics for the survey. The mean Z scores for
wasting (WHZ), underweight (WAZ) and stunting (HAZ) were -0.10±1.11; -0.86±1.08 and -
0.41±1.29 respectively, all indicating poorer nutrition situation compared to WHO reference
population. The standard deviations are within the acceptable range of 0.8-1.2 for WHZ
(SD=1.11) and WAZ (SD=1.08); but as expected slightly higher (1.29) for HAZ.
Table 25: Mean z-scores, Design Effects and excluded subjects
Indicator n Mean z-scores ± SD
Design Effect (z-score < -2)
z-scores not available*
z-scores out of range
Weight-for-Height 8968 -0.10±1.11 1.15 74 14
Weight-for-Age 8984 -0.86±1.08 1.41 69 3
Height-for-Age 8961 -1.41±1.29 1.83 63 32
* contains for WHZ and WAZ the children with edema.

Sierra Leone National Nutrition Survey 2017 SLNNS 2017
34 | P a g e
6.3 Maternal Health and Nutrition
6.3.1 Demographic distribution of Women of Reproductive Age (15-49 Years)
About one third (29.2%) of the 9527 women assessed nationally aged 15-49 years were pregnant
or lactating (Table 26). The proportion of those pregnant/ lactating ranged from 12.7% in Western
Area Urban to 48% in Kailahun. The overall mean age was 27 (±7.2) years with mean age of 26.1
(±6.0) years among the pregnant and lactating women and 27.4 (±7.6) years among the non-
pregnant/ lactating group. The mean age of the assessed women ranged narrowly from 26.1
(±7.5) in Kambia to 28.0 (±7.4) in Port Loko.
Table 26: Demographic distribution of assessed women (15-49 years) by district
6.3.2 Nutrition Status of Women (15-49 years)
The national prevalence of acute malnutrition using MUAC (<23 cm) was 5.7% (95% CI: 4.8-6.6)
among the pregnant and/or lactating women (PLW) but much lower (MUAC<18.5 cm) at 0.1%
(95% CI: 0.0-0.2) among the non-pregnant/lactating women (Table 27). The prevalence of acute
malnutrition (MUAC<23 cm) varied from 0% in Western Area rural to 8.4% in Kailahun.
District Woman's physiological status Mean Age (Years)
Total Non pregnant/lactating
Pregnant or lactating
N n % n % N Mean SD
Bo 563 348 61.8% 215 38.2% 562 27.5 7.1
Bombali 594 476 80.1% 118 19.9% 594 27.5 6.8
Bonthe 546 426 78.0% 120 22.0% 546 27.7 7.3
Kailahun 598 311 52.0% 287 48.0% 598 27.4 7.2
Kambia 618 361 58.4% 257 41.6% 617 26.1 7.5
Kenema 614 405 66.0% 209 34.0% 614 26.7 6.7
Koinadugu 777 555 71.4% 222 28.6% 777 26.6 7.6
Kono 804 626 77.9% 178 22.1% 804 26.6 7.3
Moyamba 585 490 83.8% 95 16.2% 585 27.1 7.1
Port Loko 470 253 53.8% 217 46.2% 470 28.0 7.4
Pujehun 574 372 64.8% 202 35.2% 574 27.3 6.6
Tonkolili 659 474 71.9% 185 28.1% 659 27.9 7.6
WA-Rural 705 530 75.2% 175 24.8% 705 26.3 7.5
WA-Slums 640 438 68.4% 202 31.6% 640 26.9 6.4
WA-Urban 780 681 87.3% 99 12.7% 780 27.0 6.9
Total 9,527 6,746 70.8% 2,781 29.2% 9525 27.0 7.2
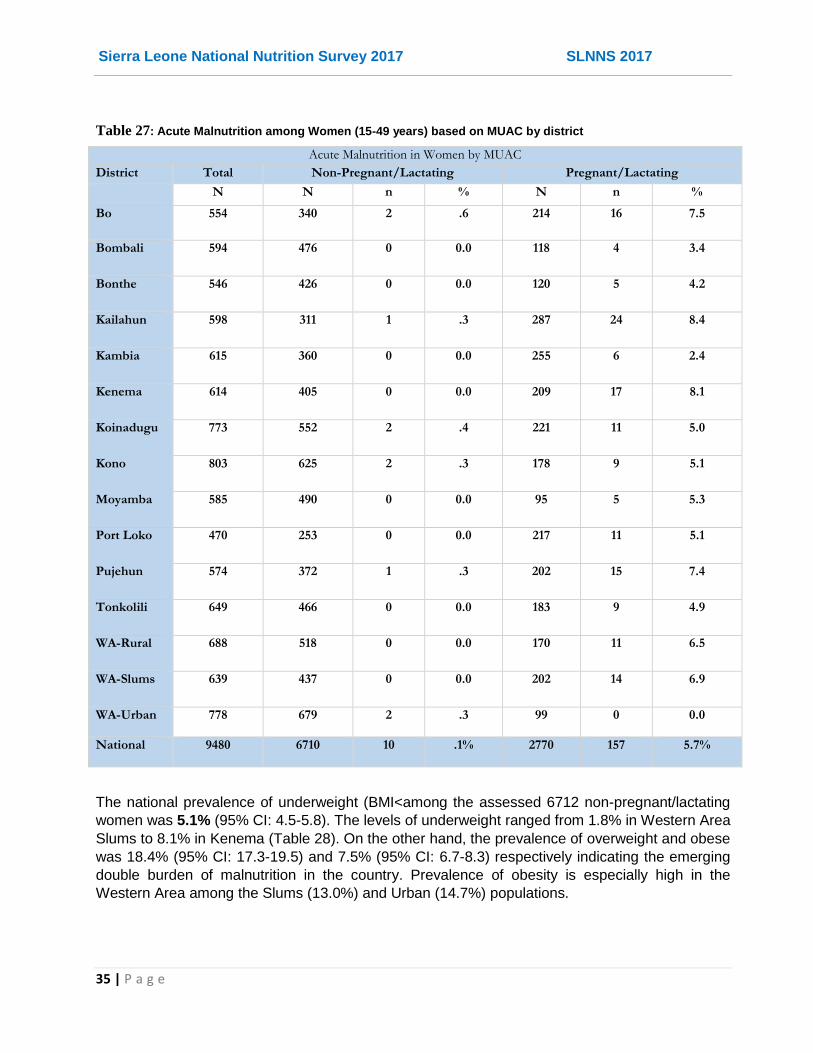
Sierra Leone National Nutrition Survey 2017 SLNNS 2017
35 | P a g e
Table 27: Acute Malnutrition among Women (15-49 years) based on MUAC by district
Acute Malnutrition in Women by MUAC
District Total Non-Pregnant/Lactating Pregnant/Lactating
N N n % N n %
Bo 554 340 2 .6 214 16 7.5
Bombali 594 476 0 0.0 118 4 3.4
Bonthe 546 426 0 0.0 120 5 4.2
Kailahun 598 311 1 .3 287 24 8.4
Kambia 615 360 0 0.0 255 6 2.4
Kenema 614 405 0 0.0 209 17 8.1
Koinadugu 773 552 2 .4 221 11 5.0
Kono 803 625 2 .3 178 9 5.1
Moyamba 585 490 0 0.0 95 5 5.3
Port Loko 470 253 0 0.0 217 11 5.1
Pujehun 574 372 1 .3 202 15 7.4
Tonkolili 649 466 0 0.0 183 9 4.9
WA-Rural 688 518 0 0.0 170 11 6.5
WA-Slums 639 437 0 0.0 202 14 6.9
WA-Urban 778 679 2 .3 99 0 0.0
National 9480 6710 10 .1% 2770 157 5.7%
The national prevalence of underweight (BMI<among the assessed 6712 non-pregnant/lactating
women was 5.1% (95% CI: 4.5-5.8). The levels of underweight ranged from 1.8% in Western Area
Slums to 8.1% in Kenema (Table 28). On the other hand, the prevalence of overweight and obese
was 18.4% (95% CI: 17.3-19.5) and 7.5% (95% CI: 6.7-8.3) respectively indicating the emerging
double burden of malnutrition in the country. Prevalence of obesity is especially high in the
Western Area among the Slums (13.0%) and Urban (14.7%) populations.

Sierra Leone National Nutrition Survey 2017 SLNNS 2017
36 | P a g e
Table 28: Nutrition status of Women (15-49 years) based on Body Mass Index (BMI) by district
Acute Malnutrition in Women based on BMI
District Total Underweight (BMI<18.5)
Healthy/normal (BMI 18.5-24.9)
Overweight (BMI 25.0-29.9)
Obese (BMI>=30)
N n % n % n % n %
Bo 340 11 3.2 228 67.1 73 21.5 28 8.2
Bombali 476 21 4.4 351 73.7 81 17.0 23 4.8
Bonthe 426 14 3.3 294 69.0 87 20.4 31 7.3
Kailahun 311 14 4.5 232 74.6 55 17.7 10 3.2
Kambia 360 23 6.4 272 75.6 48 13.3 17 4.7
Kenema 405 33 8.1 298 73.6 57 14.1 17 4.2
Koinadugu 552 44 8.0 397 71.9 92 16.7 19 3.4
Kono 626 28 4.5 459 73.3 95 15.2 44 7.0
Moyamba 490 26 5.3 326 66.5 94 19.2 44 9.0
Port Loko 253 20 7.9 170 67.2 42 16.6 21 8.3
Pujehun 372 30 8.1 261 70.2 64 17.2 17 4.6
Tonkolili 466 17 3.6 330 70.8 91 19.5 28 6.0
WA-Rural 517 26 5.0 341 66.0 104 20.1 46 8.9
WA-Slums 438 8 1.8 288 65.8 85 19.4 57 13.0
WA-Urban 680 30 4.4 382 56.2 168 24.7 100 14.7
National 6712 345 5.1% 4629 69.0 1236 18.4 502 7.5
6.3.3 Dietary Diversity among Women (15-49 years)
Nationally, the dietary consumption pattern was characterized by frequent consumption of foods
from grains (90.8%), dark green leafy vegetables (76.7%), and nuts & seeds (75.5%) food groups
in a 24-hour recall. Organ meat (10.9%), vitamin A rich fruits (18.0%), meat & poultry (23.3%),
eggs (24.3%), and vitamin A- rich vegetables, roots & tubers (25.1%) were least frequently
consumed. White roots/tubers and plantain (58.5%), pulses (54.5%) other vegetables (33.8%)
and other fruits (32.4%) were moderately consumed by women.
When reconstituted into 10 food groups, similar pattern is observed with grains, white roots &
tubers being the most frequently consumed (96.3%) and eggs (24.3%) least frequently consumed
by women (Table 29).

Sierra Leone National Nutrition Survey 2017 SLNNS 2017
37 | P a g e
Table 29: Women Consumption of Different Food Groups by district
District
Grains, white
roots & tubers [A+B] Pulses [C]
Nuts and seeds [D] Dairy [E]
Meat, poultry &
fish [F+G+H] Eggs [I]
Dark green leafy vegetables [J]
Other vitamin A rich fruits and vegetables [K+L]
Other vegetables [M]
Other fruits [N]
n % n % n % n % n % n % n % n % n % n % Bo 552 99.5 417 75.1 471 84.9 193 34.8 547 98.6 274 48.7 414 73.5 213 37.8 311 55.2 202 36.4
Bombali 576 97.0 362 60.9 523 88.0 122 20.5 557 93.8 177 29.8 499 84.0 214 36.0 150 25.3 107 18.0
Bonthe 459 84.1 154 28.2 348 63.7 36 6.6 542 99.3 80 14.7 220 40.3 79 14.5 196 35.9 197 36.1
Kailahun 594 99.3 356 59.5 495 82.8 96 16.1 587 98.2 128 21.4 533 89.1 273 45.7 311 52.0 220 36.8
Kambia 600 97.1 282 45.6 426 68.9 43 7.0 559 90.5 46 7.4 531 85.9 150 24.3 266 43.0 187 30.3
Kenema 557 90.7 289 47.1 374 60.9 127 20.7 566 92.2 96 15.6 358 58.3 205 33.4 146 23.8 202 32.9
Koinadugu 749 96.3 469 60.3 644 82.8 286 36.8 728 93.6 139 17.9 609 78.3 283 36.4 218 28.0 166 21.3
Kono 794 98.8 506 62.9 630 78.4 264 32.8 768 95.5 208 25.9 766 95.3 302 37.6 258 32.1 259 32.2
Moyamba 582 99.5 392 67.0 461 78.8 132 22.6 571 97.6 145 24.8 523 89.4 215 36.8 276 47.2 330 56.4
Port Loko 447 95.1 228 48.5 319 67.9 47 10.0 445 94.7 30 6.4 344 73.2 180 38.3 101 21.5 102 21.7
Pujehun 572 99.7 221 38.5 272 47.4 96 16.7 555 96.7 24 4.2 496 86.4 103 17.9 134 23.3 88 15.3
Tonkolili 640 98.0 353 54.1 586 89.7 123 18.8 632 96.8 123 18.7 456 69.2 95 14.4 193 29.3 199 30.5
WA-Rural 669 97.2 390 56.7 556 80.8 222 32.3 684 99.4 281 39.9 298 42.3 143 20.3 118 16.8 245 35.6
WA-Slums 620 96.9 306 47.8 485 75.8 223 34.8 635 99.2 183 28.6 540 84.4 133 20.8 170 26.6 129 20.2
WA-Urban 729 93.6 454 58.3 582 74.7 347 44.5 764 98.1 377 48.3 692 88.7 215 27.6 357 45.8 446 57.3
Total 9140 96.3 5179 54.5 7172 75.5 2357 24.8 9140 96.3 2311 24.3 7279 76.4 2803 29.4 3205 33.6 3079 32.4

Sierra Leone National Nutrition Survey 2017 SLNNS 2017
38 | P a g e
Based on dietary diversity scores from 10 food groups, the mean dietary diversity score (MDDS-
W) was 5.4 ±1.9 food groups and 68.4% (95% CI: 65.4-71.4) of the assessed women met the
minimum dietary diversity for women (MDDW). The proportion varies from district to district
ranging from 43% in Pujehun to 92.4% in Bo (Table 30).
Table 30: Proportion of Women Consuming Minimum Dietary Diversity by district
Women Consuming MDD from 10 food groups Mean Minimum Dietary Diversity Score for Women
(MDDS-W) District Total No
( <5 Food Groups) Yes
(≥5 Food groups)
N n % n % N Mean SD
Bo 555 42 7.6% 513 92.4% 555 6.5 1.6
Bombali 594 220 37.0% 374 63.0% 594 5.5 2.1
Bonthe 546 303 55.5% 243 44.5% 546 4.2 1.5
Kailahun 598 108 18.1% 490 81.9% 598 6.0 1.7
Kambia 618 244 39.5% 374 60.5% 618 5.0 1.8
Kenema 614 263 42.8% 351 57.2% 614 4.8 1.8
Koinadugu 778 163 21.0% 615 79.0% 778 5.5 1.5
Kono 804 231 28.7% 573 71.3% 804 5.9 2.3
Moyamba 585 144 24.6% 441 75.4% 585 6.2 2.3
Port Loko 470 224 47.7% 246 52.3% 470 4.8 1.5
Pujehun 574 327 57.0% 247 43.0% 574 4.5 1.7
Tonkolili 653 211 32.3% 442 67.7% 653 5.2 1.4
WA-Rural 688 183 26.6% 505 73.4% 688 5.2 1.7
WA-Slums 640 197 30.8% 443 69.2% 640 5.4 1.6
WA-Urban 779 142 18.2% 637 81.8% 779 6.4 2.1
National 9496 3002 31.6% 6494 68.4% 9496 5.4 1.9
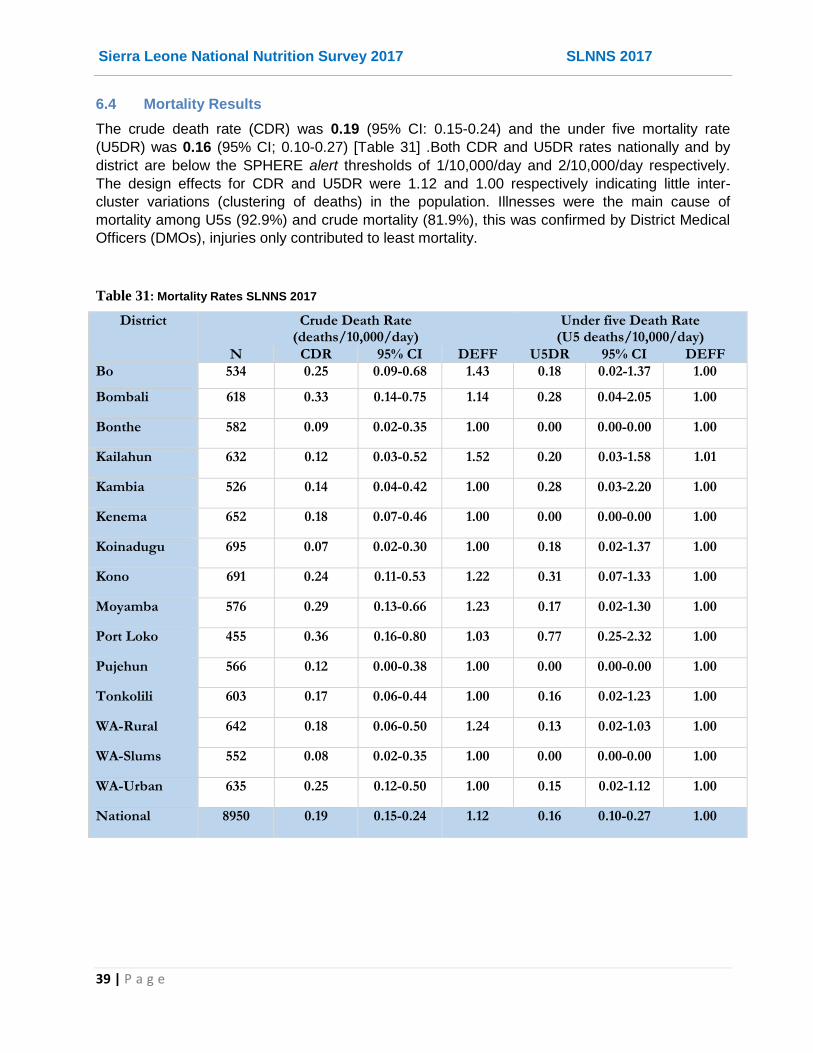
Sierra Leone National Nutrition Survey 2017 SLNNS 2017
39 | P a g e
6.4 Mortality Results
The crude death rate (CDR) was 0.19 (95% CI: 0.15-0.24) and the under five mortality rate
(U5DR) was 0.16 (95% CI; 0.10-0.27) [Table 31] .Both CDR and U5DR rates nationally and by
district are below the SPHERE alert thresholds of 1/10,000/day and 2/10,000/day respectively.
The design effects for CDR and U5DR were 1.12 and 1.00 respectively indicating little inter-
cluster variations (clustering of deaths) in the population. Illnesses were the main cause of
mortality among U5s (92.9%) and crude mortality (81.9%), this was confirmed by District Medical
Officers (DMOs), injuries only contributed to least mortality.
Table 31: Mortality Rates SLNNS 2017
District Crude Death Rate (deaths/10,000/day)
Under five Death Rate (U5 deaths/10,000/day)
N CDR 95% CI DEFF U5DR 95% CI DEFF
Bo 534 0.25 0.09-0.68 1.43 0.18 0.02-1.37 1.00
Bombali 618 0.33 0.14-0.75 1.14 0.28 0.04-2.05 1.00
Bonthe 582 0.09 0.02-0.35 1.00 0.00 0.00-0.00 1.00
Kailahun 632 0.12 0.03-0.52 1.52 0.20 0.03-1.58 1.01
Kambia 526 0.14 0.04-0.42 1.00 0.28 0.03-2.20 1.00
Kenema 652 0.18 0.07-0.46 1.00 0.00 0.00-0.00 1.00
Koinadugu 695 0.07 0.02-0.30 1.00 0.18 0.02-1.37 1.00
Kono 691 0.24 0.11-0.53 1.22 0.31 0.07-1.33 1.00
Moyamba 576 0.29 0.13-0.66 1.23 0.17 0.02-1.30 1.00
Port Loko 455 0.36 0.16-0.80 1.03 0.77 0.25-2.32 1.00
Pujehun 566 0.12 0.00-0.38 1.00 0.00 0.00-0.00 1.00
Tonkolili 603 0.17 0.06-0.44 1.00 0.16 0.02-1.23 1.00
WA-Rural 642 0.18 0.06-0.50 1.24 0.13 0.02-1.03 1.00
WA-Slums 552 0.08 0.02-0.35 1.00 0.00 0.00-0.00 1.00
WA-Urban 635 0.25 0.12-0.50 1.00 0.15 0.02-1.12 1.00
National 8950 0.19 0.15-0.24 1.12 0.16 0.10-0.27 1.00

Sierra Leone National Nutrition Survey 2017 SLNNS 2017
40 | P a g e
6.5: Children’s Morbidity
The national prevalence of retrospective child morbidity was 22.1% (95% CI: 20.3-24.0) from 14-day recall (Table 32). The rates varied from 12.4% in Moyamba to 41.2% in Port Loko reporting child getting ill in 14 days prior to the survey. Majority of these had fever (75.0%; 95% CI: 71.7-78.4), but many also had cough (35.7%; 95% CI: 31.7-39.8) or diarrhea (6.3%; 95% CI: 3.7-9.0). Other illnesses (18.9%; 95% CI: 15.7-22.1) reported included skin infections (rashes, boils, burns and blisters), eye infections, malaria and anaemia.
Table 32: Prevalence of reported common illness among children (6-59 months)
Child Morbidity in last 14 days
District Fell ill in last 14 days
Fever Cough Diarrhoea Other Illnesses
N n % n % n % n % n %
Bo 531 84 15.8 66 78.6 25 29.8 1 1.2 10 11.9
Bombali 543 173 31.9 150 86.7 36 20.8 1 .6 12 6.9
Bonthe 567 92 16.2 77 83.7 21 22.8 0 0.0 7 7.6
Kailahun 536 191 35.6 170 89.0 81 42.4 19 9.9 50 26.2
Kambia 535 79 14.8 41 51.9 27 34.2 6 7.6 20 25.3
Kenema 632 103 16.3 72 69.9 36 35.0 4 3.9 7 6.8
Koinadugu 654 191 29.2 56 29.3 40 20.9 9 4.7 137 71.7
Kono 736 167 22.7 135 80.8 28 16.8 3 1.8 8 4.8
Moyamba 563 70 12.4 48 68.6 12 17.1 1 1.4 13 18.6
Port Loko 522 215 41.2 191 88.8 114 53.0 68 31.6 29 13.5
Pujehun 648 159 24.5 122 76.7 93 58.5 0 0.0 24 15.1
Tonkolili 658 126 19.1 98 77.8 49 38.9 1 .8 21 16.7
WA-Rural 615 83 13.5 48 57.8 40 48.2 0 0.0 8 9.6
WA-Slums 607 117 19.3 112 95.7 84 71.8 4 3.4 26 22.2
WA-Urban 722 157 21.7 120 76.4 31 19.7 10 6.4 7 4.5
Total 9069 2007 22.1 1506 75.0 717 35.7 127 6.3 379 18.9

Sierra Leone National Nutrition Survey 2017 SLNNS 2017
41 | P a g e
Most of the child illnesses were treated at the public health facilities (84.3%) especially in
community health facilities i.e. CHP, CHC or MCHP (50.5%), or hospital (28.6%). Another 7.3%
sought treatment in a private health facilities/services including private clinics (1.5%), traditional
practitioners (3.2%) or home/self treatments (2.5%), but a significant proportion 8.4% did not seek
treatment from any treatment at all. Table 33 shows the type of health facilities/services sought for
the child illnesses by district and nationally.
Table 33: Health facility where treatment services are sought (6-59 months) by district
District
Public Health Facility/services Private health facility/services
Total None Total Hospital
Pharmacy/
Chemist
Mobile/ outreach
clinic
Community Health Facility
(CHP/CHC, MCHP) Total
Private clinic
Traditional
practitioner
Others (e.g.
home treatment
)
N n % n % n % n % n % n % n % n % n % n % Bo 84 6 7.1 67 79.8 5 6.0 10 11.9 2 2.4 50 59.5 11 13.1 8 9.5 1 1.2 2 2.4
Bombali 173 18 10.4 152 87.9 11 6.4 6 3.5 0 0.0 135 78.0 3 1.7 1 .6 1 .6 1 .6
Bonthe 92 6 6.5 75 81.5 37 40.2 2 2.2 1 1.1 35 38.0 11 12.0 2 2.2 9 9.8 0 0.0
Kailahun 191 12 6.3 177 92.7 4 2.1 6 3.1 1 .5 166 86.9 2 1.0 0 0.0 0 0.0 2 1.0
Kambia 79 21 26.6 57 72.2 27 34.2 2 2.5 0 0.0 28 35.4 1 1.3 1 1.3 0 0.0 0 0.0
Kenema 103 6 5.8 93 90.3 58 56.3 5 4.9 0 0.0 30 29.1 4 3.9 0 0.0 4 3.9 0 0.0
Koinadugu 191 4 2.1 182 95.3 177 92.7 1 .5 3 1.6 1 .5% 5 2.6 0 0.0 5 2.6 0 0.0
Kono 167 15 9.0 148 88.6 8 4.8 1 .6 3 1.8 136 81.4 4 2.4 0 0.0 3 1.8 1 .6
Moyamba 70 6 8.6 62 88.6 23 32.9 0 0.0 0 0.0 39 55.7 2 2.9 0 0.0 2 2.9 0 0.0
Port Loko 215 4 1.9 154 71.6 51 23.7 4 1.9 1 .5 98 45.6 57 26.5 2 .9 11 5.1 44 20.5
Pujehun 159 17 10.7 142 89.3 35 22.0 1 .6 0 0.0 106 66.7 0 0.0 0 0.0 0 0.0 0 0.0
Tonkolili 126 13 10.3 93 73.8 35 27.8 6 4.8 0 0.0 52 41.3 20 15.9 1 .8 18 14.3 1 .8
WA-Rural 83 14 16.9 67 80.7 24 28.9 14 16.9 0 0.0 29 34.9 2 2.4 2 2.4 0 0.0 0 0.0
WA-Slums 117 23 19.7 94 80.3 25 21.4 19 16.2 0 0.0 50 42.7 0 0.0 0 0.0 0 0.0 0 0.0
WA-Urban 157 4 2.5 129 82.2 55 35.0 15 9.6 0 0.0 59 37.6 24 15.3 14 8.9 10 6.4 0 0.0
Total 2007 169 8.4 1692 84.3 575 28.6 92 4.6 11 .5 1014 50.5 146 7.3 31 1.5 64 3.2 51 2.5
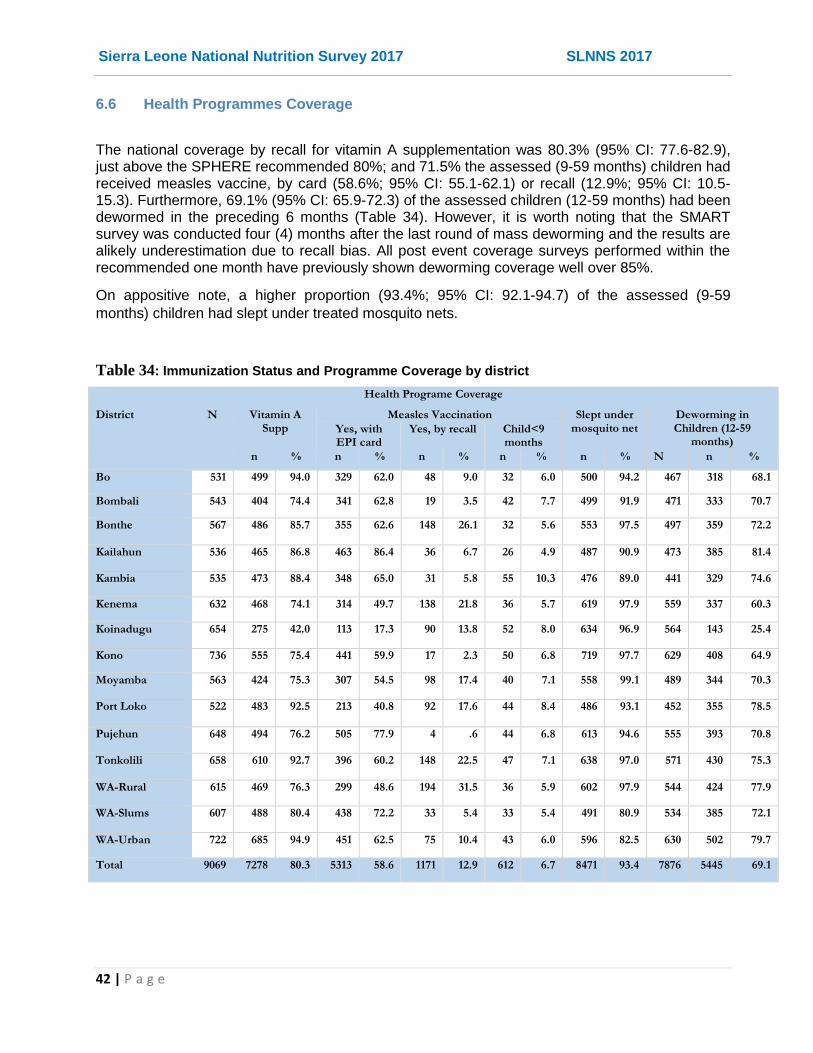
Sierra Leone National Nutrition Survey 2017 SLNNS 2017
42 | P a g e
6.6 Health Programmes Coverage
The national coverage by recall for vitamin A supplementation was 80.3% (95% CI: 77.6-82.9), just above the SPHERE recommended 80%; and 71.5% the assessed (9-59 months) children had received measles vaccine, by card (58.6%; 95% CI: 55.1-62.1) or recall (12.9%; 95% CI: 10.5-15.3). Furthermore, 69.1% (95% CI: 65.9-72.3) of the assessed children (12-59 months) had been dewormed in the preceding 6 months (Table 34). However, it is worth noting that the SMART survey was conducted four (4) months after the last round of mass deworming and the results are alikely underestimation due to recall bias. All post event coverage surveys performed within the recommended one month have previously shown deworming coverage well over 85%.
On appositive note, a higher proportion (93.4%; 95% CI: 92.1-94.7) of the assessed (9-59
months) children had slept under treated mosquito nets.
Table 34: Immunization Status and Programme Coverage by district
Health Programe Coverage
District N Vitamin A Supp
Measles Vaccination Slept under mosquito net
Deworming in Children (12-59
months) Yes, with EPI card
Yes, by recall Child<9 months
n % n % n % n % n % N n %
Bo 531 499 94.0 329 62.0 48 9.0 32 6.0 500 94.2 467 318 68.1
Bombali 543 404 74.4 341 62.8 19 3.5 42 7.7 499 91.9 471 333 70.7
Bonthe 567 486 85.7 355 62.6 148 26.1 32 5.6 553 97.5 497 359 72.2
Kailahun 536 465 86.8 463 86.4 36 6.7 26 4.9 487 90.9 473 385 81.4
Kambia 535 473 88.4 348 65.0 31 5.8 55 10.3 476 89.0 441 329 74.6
Kenema 632 468 74.1 314 49.7 138 21.8 36 5.7 619 97.9 559 337 60.3
Koinadugu 654 275 42.0 113 17.3 90 13.8 52 8.0 634 96.9 564 143 25.4
Kono 736 555 75.4 441 59.9 17 2.3 50 6.8 719 97.7 629 408 64.9
Moyamba 563 424 75.3 307 54.5 98 17.4 40 7.1 558 99.1 489 344 70.3
Port Loko 522 483 92.5 213 40.8 92 17.6 44 8.4 486 93.1 452 355 78.5
Pujehun 648 494 76.2 505 77.9 4 .6 44 6.8 613 94.6 555 393 70.8
Tonkolili 658 610 92.7 396 60.2 148 22.5 47 7.1 638 97.0 571 430 75.3
WA-Rural 615 469 76.3 299 48.6 194 31.5 36 5.9 602 97.9 544 424 77.9
WA-Slums 607 488 80.4 438 72.2 33 5.4 33 5.4 491 80.9 534 385 72.1
WA-Urban 722 685 94.9 451 62.5 75 10.4 43 6.0 596 82.5 630 502 79.7
Total 9069 7278 80.3 5313 58.6 1171 12.9 612 6.7 8471 93.4 7876 5445 69.1

Sierra Leone National Nutrition Survey 2017 SLNNS 2017
43 | P a g e
6.7 Infant and Young Child Feeding (IYCF) Practices
6.7.1 Breastfeeding Practices
Among the assessed infants and young children (0-23 months), 99.1% (95% CI: 98.7-99.4) were
ever-breastfed nationally, with prevalence varying from 97.6% in Pujehun to 100% in Moyamba.
Nationally, 56.8%, 39.1% and 2.5% were first initiated to breast milk within the first hour, within
the one day and after one day respectively (Table 35). The proportion of all the children
breastfeeding at the time of the survey were 88.2% (95% CI: 86.9-89.5), with prevalence ranging
from 80.9% in Kono to 98.0% in Koinadugu. Notably, 23.3% (95% CI: 20.9-25.6) of the assessed
children (0-23 months) were reportedly bottle-fed; with prevalence varying by district from 11.7%
in Bonthe to 38.1% in Western Area Urban.
Table 35: Breast-feeding Practices among infant and young children (0-23 months) by district
Child ever breastfed How long after birth child was put to breast Breastfeeding (breastfed yesterday)
Bottle feeding (bottle-fed yesterday)
District N Less than 1
hour
Within the first day (24
hours)
After the first day
(>24 hours)
Don't know
n (95% CI) n % n % n % n % n (95% CI) n (95% CI)
Bo 274 272 99.3
(98.3-100)
218 79.6 52 19.0 1 .4 3 1.1 251 91.6
(86.1-97.1)
65 23.7
(18.6-28.9)
Bombali 244 243 99.6
(98.8-100)
111 45.5 116 47.5 11 4.5 6 2.5 201 82.4
(76.2-88.6)
54 22.1
(12.2-32.1)
Bonthe 299 298 99.7
(99.0-100)
142 47.5 155 51.8 1 .3 1 .3 243 81.3
(77.3-85.2)
35 11.7
(6.7-16.7)
Kailahun 271 269 99.3
(98.3-100)
183 67.5 84 31.0 3 1.1 1 .4 248 91.5
(87.7-95.4)
77 28.5
(22.0-34.8)
Kambia 300 299 99.7
(99.0-100)
141 47.0 156 52.0 3 1.0 1 .3 278 92.7
(89.2-96.2)
43 14.3
(8.1-19.9)
Kenema 309 303 98.1
(96.3-99.8)
238 77.0 64 20.7 4 1.3 3 1.0 270 87.4
(82.6-92.1)
40 12.9
(7.3-18.6)
Koinadugu 347 343 98.8
(97.8-99.9)
203 58.5 95 27.4 32 9.2 17 4.9 340 98.0
(96.4-99.6)
107 30.8
(25.4-36.3)
Kono 329 328 99.7
(99.1-100)
138 41.9 175 53.2 7 2.1 9 2.7 266 80.9
(73.4-88.3)
69 20.9
(10.7-31.3)
Moyamba 286 286 100.0 161 56.3 118 41.3 5 1.7 2 .7 259 90.6
(85.4-95.7)
77 26.9
(16.6-37.2)
Port Loko 250 246 98.4
(95.9-100)
165 66.0 60 24.0 18 7.2 7 2.8 226 90.4
(85.6-95.2)
56 22.4
(12.9-32.3)
Pujehun 338 330 97.6
(95.4-99.9)
178 52.7 155 45.9 4 1.2 1 .3 305 90.2
(87.1-93.4)
47 13.9
(8.6-19.2)
Tonkolili 332 326 98.2
(95.7-100)
114 34.3 195 58.7 14 4.2 8 2.4 307 92.5
(88.5-96.4)
74 22.3
(12.9-32.3)
WA-Rural 321 319 99.4
(98.6-100)
220 68.5 94 29.3 4 1.2 3 .9 274 85.4
(81.3-90.6)
78 24.3
(14.6-34.0)
WA-Slums 335 332 99.1
(98.1-100)
185 55.2 145 43.3 2 .6 3 .9 288 86.0
(81.3-90.6)
116 34.6
(21.0-48.3)
WA-Urban 315 313 99.4
(98.5-100)
188 59.7 115 36.5 7 2.2 5 1.6 255 81.0
(75.5-86.4)
120 38.1
(28.0-48.2)
Total 4550 4507 99.1 (98.7-99.4)
2585 56.8 1779 39.1 116 2.5 70 1.5 4011 88.2 (86.9-89.5)
1058 23.3 (20.9-25.6)

Sierra Leone National Nutrition Survey 2017 SLNNS 2017
44 | P a g e
Table 36: Exclusive and Continued Breast feeding Indicators, SLNNS 2017
Timely initiation of breastfeeding (0-23 months)
Exclusive Breastfeeding (0-5 months)
Child (0-5 months) fed on Colostrums
Continued breastfeeding at 1 year (12-15 months)
District N n % (95% CI) N n % (95% CI) n % (95% CI) N n % (95% CI)
Bo 274 218 79.6 (72.5-86.6)
69 47 68.1 (54.9-81.4)
49 71.0 (52.9-89.2)
32 32 100.0
Bombali 244 111 45.5 (30.4-60.6)
34 22 64.7 (47.2-82.2)
26 76.5 (58.9-94.0)
31 29 93.5 (84.8-100)
Bonthe 299 142 47.5 (35.8-59.2)
70 32 45.7 (33.2-58.3)
64 91.4 (84.2-98.7)
35 32 91.4 (82.2-100)
Kailahun 271 183 67.5 (55.2-79.9)
76 51 67.1 (51.8-82.4)
67 88.2 (77.3-99.0)
29 28 96.6 (90.0-100)
Kambia 300 141 46.7 (33.2-60.1)
77 43 54.4 (47.4-62.9)
67 85.9 (76.7-95.1)
21 20 95.2 (86.9-100)
Kenema 309 238 77.0 (64.8-89.3)
96 52 54.2 (42.3-66.1)
91 94.8 (90.7-98.9)
38 37 97.4 (92.3-100)
Koinadugu 347 203 58.5 (47.6-69.4)
110 81 73.6 (64.0-83.3)
37 33.6 (19.1-48.1)
38 37 97.4 (92.5-100)
Kono 329 138 41.9 (27.5-56.4)
45 31 68.9 (53.5-84.3)
33 73.3 (60.1-86.6)
43 34 79.1 (63.7-94.4)
Moyamba 286 161 56.3 (39.8-72.8)
65 43 66.2 (49.1-83.2)
51 78.5 (66.3-90.6)
28 27 96.4 (89.9-100)
Port Loko 250 165 66.0 (53.0-79.0)
53 34 64.2 (48.7-79.6)
42 79.2 (60.4-98.1)
28 27 96.4 (89.9-100)
Pujehun 338 178 52.7 (31.8-73.5)
111 68 61.3 (49.2-73.3)
103 92.8 (88.1-99.3)
35 34 97.1 (91.7-100)
Tonkolili 332 114 34.6 (21.7-47.6)
85 54 63.5 (53.4-73.6)
75 88.2 (77.9-98.6)
34 33 97.1 (91.3-100)
WA-Rural 321 220 68.5 (55.8-81.2)
94 62 66.0 (53.5-78.4)
86 91.5 (86.0-97.0)
25 24 96.0 (88.1-100)
WA-Slums 335 185 55.2 (35.2-75.3)
84 50 59.5 (47.1-71.9)
75 89.3 (79.4-99.2)
38 38 100.0
WA-Urban 315 188 59.7 (46.2-73.2)
37 11 30.6 (14.9-46.2)
25 69.4 (53.4-85.5)
55 50 90.9 (82.6-99.3)
Total 4550 2585 56.8 (52.8-60.9)
1106 681 61.6 (58.0-65.1)
891 80.6 (76.7-84.6)
510 482 94.5 (92.2-96.8)
Exclusive breastfeeding rate among the infants aged 0-5 months was 61.6% (95% CI: 58.0-65.1)
nationally. A high proportion of the children (80.6%; 95% CI: 76.7-84.6) were fed on colostrums.
The prevalence of continued breastfeeding at 1 year among the children aged 12-15 months was
94.5% (95% CI: 92.2-96.8). Table 36 shows the distribution of exclusive and continued key
breastfeeding indicators by district, even though the disaggregated sample sizes are small and so
interpretation at the national levels is recommended.

Sierra Leone National Nutrition Survey 2017 SLNNS 2017
45 | P a g e
6.7.2 Complementary Feeding Practices
The national mean age at introduction of complementary foods was 5.3 (±2.2) months among
children aged 6-23 months, with majority (57.9%) of the children introduced to solid, semi-solid or
soft foods at the sixth month. The prevalence of timely introduction of complementary (solid, semi-
solid or soft) foods among 6-8 months was 55.2% (95% CI: 49.4-61.0). The mean feeding
frequency was 2.5 (±1.2) times (Table 37).
Table 37: Complementary Feeding Indicators, SLNNS 2017
Complementary Feeding Practices (6-23 Months)
Age (in months) at Introduction of solid, semi-solid or soft foods (6-23 months)
Feeding Frequency Timely Introduction (6-8 months) of solid, semi-solid or soft foods
District N Mean SD N Mean SD N n % 95% CI
Bo 205 5.7 1.6 205 2.6 .8 22 10 45.5 25.0-66.0
Bombali 210 4.5 2.3 210 2.2 1.0 23 12 52.2 32.6-71.7
Bonthe 229 5.5 2.1 229 2.8 1.5 23 13 56.5 32.7-80.3
Kailahun 195 6.1 1.6 195 2.5 .9 19 13 68.4 49.2-87.7
Kambia 221 5.3 1.9 221 2.7 1.5 44 26 59.1 39.3-78.9
Kenema 213 5.4 2.7 213 2.3 1.0 28 14 50.0 24.1-75.9
Koinadugu 237 2.3 2.3 237 2.1 1.7 36 4 11.1 2.9-19.3
Kono 284 5.4 2.5 284 2.0 .8 32 21 65.6 44.0-87.2
Moyamba 221 6.1 1.4 221 2.4 .8 27 21 77.8 55.4-99.0
Port Loko 197 5.3 2.4 197 2.6 1.5 32 10 31.3 12.6-49.9
Pujehun 227 5.7 2.1 227 2.5 1.0 31 22 71.0 51.3-90.6
Tonkolili 248 5.3 2.2 248 2.2 1.1 33 21 63.6 45.3-82.0
WA-Rural 227 6.1 1.5 227 2.3 .8 26 21 80.8 63.9-97.6
WA-Slums 251 5.8 1.4 251 2.9 .9 23 12 52.2 31.6-72.8
WA-Urban 279 5.7 1.4 279 3.1 1.5 25 14 56.0 33.4-78.6
Total 3444 5.3 2.2 3444 2.5 1.2 424 234 55.2 49.4-61.0

Sierra Leone National Nutrition Survey 2017 SLNNS 2017
46 | P a g e
6.7.3 Child Dietary Diversity among children (6-23 months)
The mean number of food groups consumed by children aged 6-23 months was 2.8 (±1.5)
nationally out of a total of 6 food groups and varied from 1.5 (±1.5) food groups in Koinadugu to
3.5 (±1.5) food groups in Bombali. The proportion of children meeting minimum dietary diversity
for their breastfeeding status was 29.7% (95% CI: 26.6-32.8) nationally and varied by district
ranging from 5.5% in Koinadugu to 50% in Bombali.
Table 38: Dietary Diversity and Meal Frequency among children (6-23 months by district
The proportion of children meeting minimum meal frequency for their specific ages was 44.1%
(95% CI: 41.2-46.9) nationally and varied by district ranging from 21.8% in Kono to 58.5% in Bo
district (Table 38).
The consumption of animal source foods was generally good especially for meat, poultry and fish
products (68.5%). However, consumption of Vitamin A rich foods (yellow or orange coloured fruits
& vegetables) was poor at 13.9% nationally (Figure 10).
Number of food groups consumed
Minimum Dietary Diversity Minimum Meal Frequency
District N Mean SD n % 95% CI n % 95% CI
Bo 205 3.3 1.3 95 46.3 33.8-58.9 120 58.5 48.6-68.5
Bombali 210 3.5 1.4 105 50.0 38.5-61.5 63 30.0 18.2-41.8
Bonthe 229 2.5 1.1 32 14.0 6.4-21.5 89 38.9 28.9-48.8
Kailahun 195 2.8 1.3 58 29.7 20.2-39.3 108 55.4 43.9-66.9
Kambia 221 2.3 1.3 44 19.8 11.3-28.4 106 47.7 37.8-57.7
Kenema 213 2.2 1.5 50 23.5 12.6-34.4 73 34.3 25.3-43.2
Koinadugu 237 1.5 1.3 13 5.5 0.5-10.5 111 46.8 35.5-58.2
Kono 284 3.4 1.6 123 43.3 29.1-57.5 62 21.8 13.1-30.5
Moyamba 221 3.2 1.6 86 38.9 26.0-51.8 95 43.0 32.7-53.3
Port Loko 197 2.3 1.1 27 13.7 7.1-20.3 91 46.2 37.5-54.9
Pujehun 227 2.0 1.3 32 14.1 7.7-20.5 117 51.5 41.0-62.1
Tonkolili 248 2.8 1.5 70 28.3 17.0-39.7 82 33.2 24.8-41.6
WA-Rural 227 3.4 1.2 108 47.6 36.6-58.6 71 31.3 21.6-41.0
WA-Slums 251 2.6 1.2 64 25.5 16.2-34.8 165 65.7 57.0-74.5
WA-Urban 279 3.4 1.5 116 41.6 30.7-52.4 165 59.1 49.7-68.6
Total 3444 2.8 1.5 1023 29.7 26.6-32.8 1518 44.1 41.2-46.9
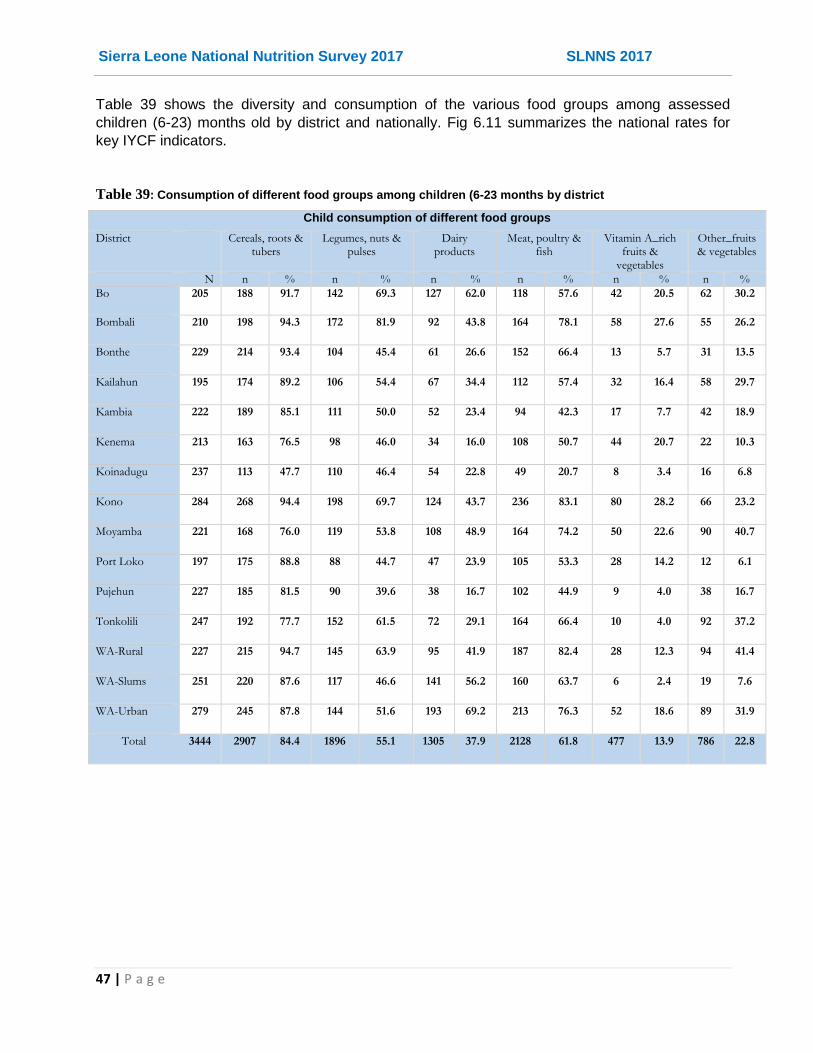
Sierra Leone National Nutrition Survey 2017 SLNNS 2017
47 | P a g e
Table 39 shows the diversity and consumption of the various food groups among assessed
children (6-23) months old by district and nationally. Fig 6.11 summarizes the national rates for
key IYCF indicators.
Table 39: Consumption of different food groups among children (6-23 months by district
Child consumption of different food groups
District Cereals, roots & tubers
Legumes, nuts & pulses
Dairy products
Meat, poultry & fish
Vitamin A_rich fruits &
vegetables
Other_fruits & vegetables
N n % n % n % n % n % n %
Bo 205 188 91.7 142 69.3 127 62.0 118 57.6 42 20.5 62 30.2
Bombali 210 198 94.3 172 81.9 92 43.8 164 78.1 58 27.6 55 26.2
Bonthe 229 214 93.4 104 45.4 61 26.6 152 66.4 13 5.7 31 13.5
Kailahun 195 174 89.2 106 54.4 67 34.4 112 57.4 32 16.4 58 29.7
Kambia 222 189 85.1 111 50.0 52 23.4 94 42.3 17 7.7 42 18.9
Kenema 213 163 76.5 98 46.0 34 16.0 108 50.7 44 20.7 22 10.3
Koinadugu 237 113 47.7 110 46.4 54 22.8 49 20.7 8 3.4 16 6.8
Kono 284 268 94.4 198 69.7 124 43.7 236 83.1 80 28.2 66 23.2
Moyamba 221 168 76.0 119 53.8 108 48.9 164 74.2 50 22.6 90 40.7
Port Loko 197 175 88.8 88 44.7 47 23.9 105 53.3 28 14.2 12 6.1
Pujehun 227 185 81.5 90 39.6 38 16.7 102 44.9 9 4.0 38 16.7
Tonkolili 247 192 77.7 152 61.5 72 29.1 164 66.4 10 4.0 92 37.2
WA-Rural 227 215 94.7 145 63.9 95 41.9 187 82.4 28 12.3 94 41.4
WA-Slums 251 220 87.6 117 46.6 141 56.2 160 63.7 6 2.4 19 7.6
WA-Urban 279 245 87.8 144 51.6 193 69.2 213 76.3 52 18.6 89 31.9
Total 3444 2907 84.4 1896 55.1 1305 37.9 2128 61.8 477 13.9 786 22.8

Sierra Leone National Nutrition Survey 2017 SLNNS 2017
48 | P a g e
Figure 10: Food groups most consumed by children in 24 hr recall
Figure 11 National Rates of Key IYCF Indicators, SLNNS 2017

Sierra Leone National Nutrition Survey 2017 SLNNS 2017
49 | P a g e
6.8 Food Security & Livelihoods
6.8.1 Households’ Cultivation, Livestock Ownership and Staple Foods
A total number of 9,469 households were assessed for food security and livelihoods, of which
17.7% were female headed. Nearly half (48.0%; 95% CI: 44.4-51.6) of the assessed households
reported to have cultivated in the recent/current season, with the least proportion (0.4%) found in
the Western Area Slums as expected, and the highest proportion (81.7%) found in Kailahun
district. Nationally 40.5% (95% CI: 37.3-43.7) of the assessed households owned some livestock,
again with proportion of households ranging from the least in Western Area Slums (4.3%) to
61.7% in Kambia.
Rice is the main staple food nationally (97.4%) and in all the districts with proportion of
households reporting it as their staple ranging from 92.5% in Kambia to nearly all in the Western
Area Urban (99.7%) and Slums (99.8%). Overall, the main source of the staple foods (Table 40) is
market/shop purchases (67.3%; 95% CI: 63.8-70.8) followed by own production (28.3%; 95% CI:
25.1-31.6).
Table 40: Household’s Crop Cultivation, Livestock Ownership and Main Staple Foods
Sex of Household Head (N=9469) Cultivated in the recent
season (N=9469)
HH own Livestock (N=9469)
Main Source of Staple Food
District Male Female Rice as Staple food
Purchases Own production
n % n % n % n % % % %
Bo 451 80.5 109 19.5 319 57.0 200 35.7 99.6 53.6 41.8
Bombali 486 78.6 132 21.4 198 32.0 247 40.0 99.7 64.2 32.3
Bonthe 473 77.3 139 22.7 133 21.7 166 27.1 92.6 56.2 28.3
Kailahun 556 84.8 100 15.2 536 81.7 314 47.9 95.3 71.6 27.3
Kambia 439 80.1 109 19.9 368 67.2 338 61.7 92.5 74.3 24.1
Kenema 495 74.0 174 26.0 260 38.9 153 22.9 98.2 52.5 43.2
Koinadugu 658 86.7 101 13.3 594 78.3 411 54.2 98.6 54.4 44.0
Kono 619 85.6 104 14.4 338 46.7 333 46.1 95.4 67.9 26.7
Moyamba 503 86.7 77 13.3 389 67.1 313 54.0 97.2 55.3 42.4
Port Loko 424 77.4 124 22.6 226 41.2 175 31.9 98.9 71.4 26.3
Pujehun 567 80.0 142 20.0 486 68.5 437 61.6 95.5 78.6 21.4
Tonkolili 578 90.5 61 9.5 498 77.9 355 55.6 99.5 65.3 31.6
WA-Rural 548 85.4 94 14.6 131 20.4 243 37.9 99.2 66.5 17.4
WA-Slums 474 85.7 79 14.3 2 .4 24 4.3 99.8 95.8 1.8
WA-Urban 525 80.4 128 19.6 65 10.0 125 19.1 99.7 85.3 12.9
National 7796 82.3 1673 17.7 4543 48.0 3834 40.5 97.4 67.3% 28.3%
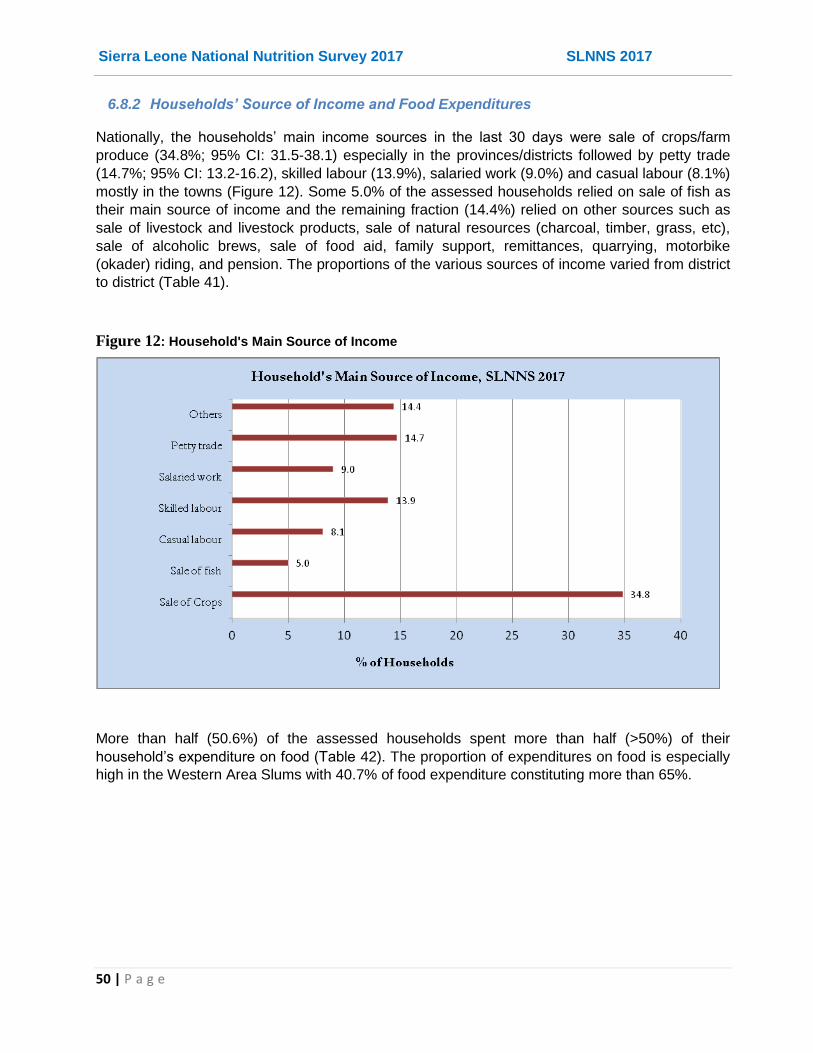
Sierra Leone National Nutrition Survey 2017 SLNNS 2017
50 | P a g e
6.8.2 Households’ Source of Income and Food Expenditures
Nationally, the households’ main income sources in the last 30 days were sale of crops/farm
produce (34.8%; 95% CI: 31.5-38.1) especially in the provinces/districts followed by petty trade
(14.7%; 95% CI: 13.2-16.2), skilled labour (13.9%), salaried work (9.0%) and casual labour (8.1%)
mostly in the towns (Figure 12). Some 5.0% of the assessed households relied on sale of fish as
their main source of income and the remaining fraction (14.4%) relied on other sources such as
sale of livestock and livestock products, sale of natural resources (charcoal, timber, grass, etc),
sale of alcoholic brews, sale of food aid, family support, remittances, quarrying, motorbike
(okader) riding, and pension. The proportions of the various sources of income varied from district
to district (Table 41).
Figure 12: Household's Main Source of Income
More than half (50.6%) of the assessed households spent more than half (>50%) of their
household’s expenditure on food (Table 42). The proportion of expenditures on food is especially
high in the Western Area Slums with 40.7% of food expenditure constituting more than 65%.

Sierra Leone National Nutrition Survey 2017 SLNNS 2017
51 | P a g e
Table 41: Main Sources of Income & Livelihoods
Main Household's Source of Income
District Total Sale of Crops
Sale of fish Casual labour
Skilled labour
Salaried work
Petty trading
Others
N n % n % n % n % n % n % n %
Bo 560 286 51.1 22 3.9 18 3.2 59 10.5 49 8.8 66 11.8 60 10.7
Bombali 618 203 32.8 11 1.8 163 26.4 50 8.1 34 5.5 92 14.9 65 10.5
Bonthe 612 144 23.5 120 19.6 93 15.2 105 17.2 41 6.7 36 5.9 73 11.9
Kailahun 656 427 65.1 1 .2 12 1.8 117 17.8 25 3.8 43 6.6 31 4.7
Kambia 548 202 36.9 3 .5 32 5.8 99 18.1 33 6.0 107 19.5 72 13.1
Kenema 669 283 42.3 3 .4 75 11.2 43 6.4 58 8.7 86 12.9 121 18.1
Koinadugu 759 374 49.3 3 .4 56 7.4 43 5.7 30 4.0 97 12.8 156 20.6
Kono 723 194 26.8 5 .7 77 10.7 176 24.3 58 8.0 89 12.3 124 17.2
Moyamba 580 277 47.8 45 7.8 39 6.7 29 5.0 27 4.7 88 15.2 75 12.9
Port Loko 548 267 48.7 39 7.1 27 4.9 68 12.4 25 4.6 76 13.9 46 8.4
Pujehun 709 203 28.6 20 2.8 38 5.4 105 14.8 41 5.8 61 8.6 241 34.0
Tonkolili 639 273 42.7 4 .6 38 5.9 56 8.8 19 3.0 79 12.4 170 26.6
WA-Rural 642 130 20.2 114 17.8 50 7.8 101 15.7 78 12.1 104 16.2 65 10.1
WA- Slums 553 3 .5 75 13.6 25 4.5 135 24.4 158 28.6 133 24.1 24 4.3
WA-Urban 653 32 4.9 13 2.0 28 4.3 129 19.8 174 26.6 236 36.1 41 6.3
Total 9469 3298 34.8 478 5.0 771 8.1 1315 13.9 850 9.0 1393 14.7 1364 14.4
Table 42: Household Food Expenditures
Proportion of Household's expenditure on food District Total 0% 1-50% 51-65% >65%
N n % n % n % n %
Bo 560 0 0.0 302 53.9 196 35.0 62 11.1
Bombali 618 0 0.0 388 62.8 134 21.7 96 15.5
Bonthe 612 1 .2 250 40.8 240 39.2 121 19.8
Kailahun 656 0 0.0 211 32.2 345 52.6 100 15.2
Kambia 548 1 .2 192 35.0 333 60.8 22 4.0
Kenema 669 2 .3 264 39.5 174 26.0 229 34.2
Koinadugu 759 0 0.0 327 43.1 173 22.8 259 34.1
Kono 723 0 0.0 536 74.1 176 24.3 11 1.5
Moyamba 580 3 .5 397 68.4 128 22.1 52 9.0
Port Loko 548 2 .4 360 65.7 75 13.7 111 20.3
Pujehun 709 1 .1 332 46.8 227 32.0 149 21.0
Tonkolili 639 0 0.0 281 43.8 292 45.5 69 10.7
WA-Rural 642 0 0.0 222 40.1 209 37.8 122 22.1
WA- Slums 553 0 0.0 144 22.5 235 36.8 260 40.7
WA-Urban 653 0 0.0 455 69.7 171 26.2 27 4.1
Total 9469 10 .1 4661 49.2 3108 32.8 1690 17.8

Sierra Leone National Nutrition Survey 2017 SLNNS 2017
52 | P a g e
6.8.3 Households’ Food Consumption & Dietary Diversity
The mean household dietary diversity score (HDDS) was 5.3 (±2.3) food groups out of a possible
maximum of 12 food groups. When disaggregated by district in 2017 the mean HDDS varied with
mean HDDS ranging from 4.2 (±2.2) in Bo to 7.3 (±2.1) in Pujehun as in (Figure 13).
The dietary diversity was characterized by frequent consumption of cereals (94.5%), fish (84.0%),
fats/oils (77.4%) and vegetables (74.3%) [Figure 14].
Figure 13: Changes in Mean Household Dietary Diversity Score (HDDS) for 2014 and 2017
In this study, FCS and CSI results were not adequately collected and presented within the
Consolidated Approach for Reporting Indicators of Food Security (CARI) 8 food security console
since limited data was collected on coping strategies and food expenditure indicators. Data
collected on CSI was only sufficient to analyse reduced coping strategy index (rCSI), with more
likely association to malnutrition.
8 CARI is a methodology for analysing and reporting the level of food insecurity within a population and replaces the old CFSVA
methodololgy of classifying food security phase using FCS alone.

Sierra Leone National Nutrition Survey 2017 SLNNS 2017
53 | P a g e
Figure 14: Household Dietary Diversity based on 12 food groups, SLNNS 2017
6.8.4 Household’s Hunger, Livelihood Shocks and Coping Strategies
A significant proportion (18.7%; 95% CI: 16.4-21.0) of the assessed households reported
experiencing some shock(s) in the preceding one year (Table 43), mostly in the form of high
cost/prices of food (26%), loss of a close family member (20.4%), insecurity (15.4%), floods
(9.4%), water scarcity (5.1%), crop failures (4.1%) and/or land/mud slides (1.2%).
Table 43: Households Experience of Shocks in the preceding 12 Months
Experienced Shock
Insecurity High food prices
Floods Human Sickness
Water scarcity
Bereave-ment
Crop failure
District N n % n % n % n % n % n % n % n %
Bo 560 98 17.5 3 3.1 54 55.1 0 0.0 0 0.0 0 0.0 4 4.1 0 0.0
Bombali 618 143 23.1 39 27.3 14 9.8 0 0.0 74 51.7 3 2.1 43 30.1 4 2.8
Bonthe 612 66 10.8 3 4.5 18 27.3 3 4.5 35 53.0 1 1.5 15 22.7 5 7.6
Kailahun 656 271 41.3 55 20.3 97 35.8 6 2.2 14 5.2 22 8.1 16 5.9 13 4.8
Kambia 548 94 17.2 18 19.1 48 51.1 7 7.4 15 16.0 1 1.1 37 39.4 8 8.5
Kenema 669 59 8.8 2 3.4 5 8.5 3 5.1 36 61.0 2 3.4 18 30.5 6 10.2
Koinadugu 759 61 8.0 2 3.3 14 23.0 1 1.6 7 11.5 0 0.0 7 11.5 13 21.3
Kono 723 108 14.9 52 48.1 9 8.3 0 0.0 30 27.8 0 0.0 37 34.3 1 .9
Moyamba 580 176 30.3 29 16.5 20 11.4 2 1.1 89 50.6 0 0.0 40 22.7 5 2.8
Port Loko 548 159 29.0 1 .6 3 1.9 0 0.0 135 84.9 0 0.0 29 18.2 1 .6
Pujehun 709 61 8.6 15 24.6 42 68.9 4 6.6 2 3.3 21 34.4 0 0.0 9 14.8
Tonkolili 639 151 23.6 11 7.3 33 21.9 3 2.0 61 40.4 0 0.0 53 35.1 8 5.3
WA-Rural 642 84 13.1 23 27.4 39 46.4 15 17.9 23 27.4 18 21.4 22 26.2 0 0.0
WA-Slums 553 153 27.7 11 7.2 58 37.9 104 68.0 9 5.9 23 15.0 4 2.6 0 0.0
WA-Urban 653 84 12.9 9 10.7 5 6.0 18 21.4 20 23.8 0 0.0 36 42.9 0 0.0
Total 9469 1768 18.7 273 15.4 459 26.0 166 9.4 550 31.1 91 5.1 361 20.4 73 4.1
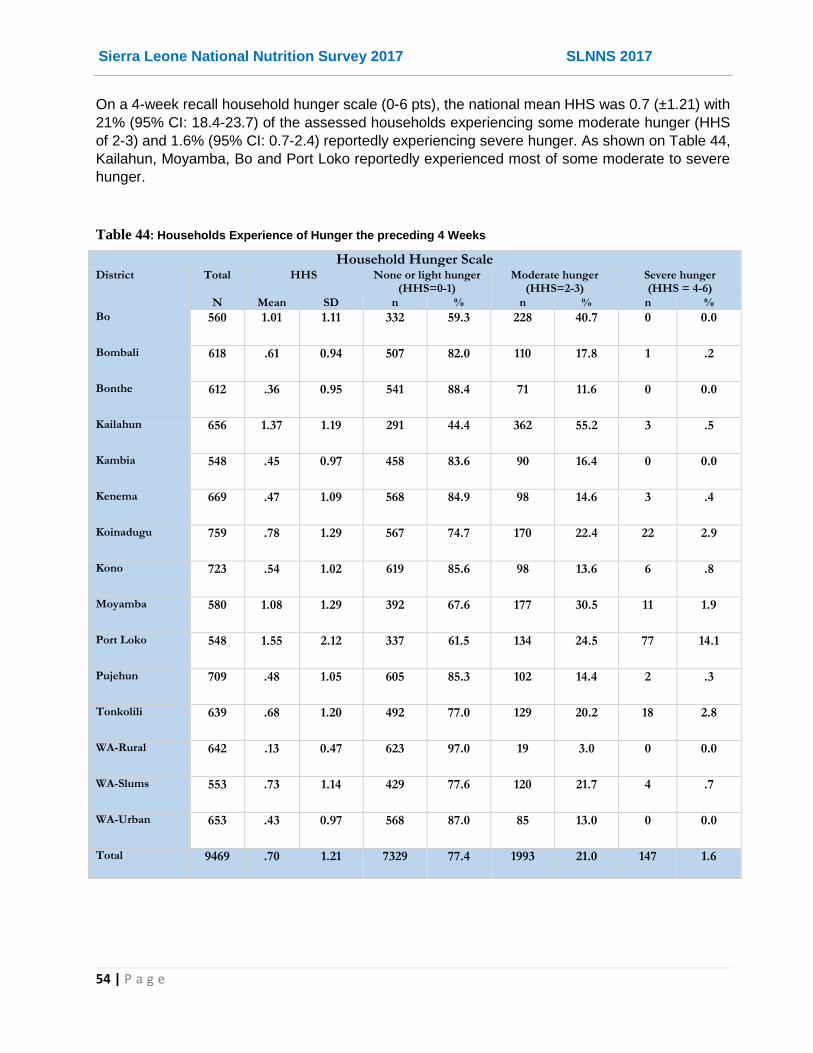
Sierra Leone National Nutrition Survey 2017 SLNNS 2017
54 | P a g e
On a 4-week recall household hunger scale (0-6 pts), the national mean HHS was 0.7 (±1.21) with
21% (95% CI: 18.4-23.7) of the assessed households experiencing some moderate hunger (HHS
of 2-3) and 1.6% (95% CI: 0.7-2.4) reportedly experiencing severe hunger. As shown on Table 44,
Kailahun, Moyamba, Bo and Port Loko reportedly experienced most of some moderate to severe
hunger.
Table 44: Households Experience of Hunger the preceding 4 Weeks
Household Hunger Scale District Total HHS None or light hunger
(HHS=0-1) Moderate hunger
(HHS=2-3) Severe hunger (HHS = 4-6)
N Mean SD n % n % n %
Bo 560 1.01 1.11 332 59.3 228 40.7 0 0.0
Bombali 618 .61 0.94 507 82.0 110 17.8 1 .2
Bonthe 612 .36 0.95 541 88.4 71 11.6 0 0.0
Kailahun 656 1.37 1.19 291 44.4 362 55.2 3 .5
Kambia 548 .45 0.97 458 83.6 90 16.4 0 0.0
Kenema 669 .47 1.09 568 84.9 98 14.6 3 .4
Koinadugu 759 .78 1.29 567 74.7 170 22.4 22 2.9
Kono 723 .54 1.02 619 85.6 98 13.6 6 .8
Moyamba 580 1.08 1.29 392 67.6 177 30.5 11 1.9
Port Loko 548 1.55 2.12 337 61.5 134 24.5 77 14.1
Pujehun 709 .48 1.05 605 85.3 102 14.4 2 .3
Tonkolili 639 .68 1.20 492 77.0 129 20.2 18 2.8
WA-Rural 642 .13 0.47 623 97.0 19 3.0 0 0.0
WA-Slums 553 .73 1.14 429 77.6 120 21.7 4 .7
WA-Urban 653 .43 0.97 568 87.0 85 13.0 0 0.0
Total 9469 .70 1.21 7329 77.4 1993 21.0 147 1.6

Sierra Leone National Nutrition Survey 2017 SLNNS 2017
55 | P a g e
About one in five (21.3%; 95% CI: 18.7-24.0) of the assessed households reported experiencing
some food shortage and/or income to buy food and applying at least one coping strategy in the
previous one month (Table 45). The coping strategies reportedly adopted by the households most
frequently included relying on less preferred/cheaper foods (95.5%), limiting portion size at
mealtime (89.2%) and reducing the number of meals in a day (82.7%). The mean reduced coping
strategy index (rCSI) was 3.2 (±7.3). Although a majority of the households reported applying no
or low (79.9%) coping strategy, a significant proportion still reported applying medium to high level
of coping.
Table 45: Households Coping Strategies during food stress in the preceding one month
District Total Coped rCSI Non or low coping (rCSI of 0-3)
Medium coping (rCSI of 4-9)
High coping (rCSI>=10)
N n % Mean SD n % n % n %
Bo 560 89 15.9 1.7 4.3 473 84.5 53 9.5 34 6.1
Bombali 618 171 27.7 3.2 7.2 471 76.2 76 12.3 71 11.5
Bonthe 612 75 12.3 1.1 3.7 543 88.7 44 7.2 25 4.1
Kailahun 656 283 43.1 5.1 7.1 380 57.9 123 18.8 153 23.3
Kambia 548 113 20.6 3.4 7.9 442 80.7 20 3.6 86 15.7
Kenema 667 73 10.9 2.3 7.0 598 89.4 2 .3 69 10.3
Koinadugu 759 64 8.4 1.1 4.0 698 92.0 14 1.8 47 6.2
Kono 723 129 17.8 2.1 5.5 616 85.2 32 4.4 75 10.4
Moyamba 580 223 38.4 7.4 11.1 371 64.0 26 4.5 183 31.6
Port Loko 548 213 38.9 5.5 7.4 331 60.4 37 6.8 180 32.8
Pujehun 709 106 15.0 2.6 6.5 602 84.9 8 1.1 99 14.0
Tonkolili 639 195 30.5 6.1 10.9 452 70.7 23 3.6 164 25.7
WA-Rural 642 58 9.0 2.1 7.4 589 91.7 6 .9 47 7.3
WA-Slums 553 123 22.2 3.3 6.8 435 78.7 21 3.8 97 17.5
WA-Urban 653 104 15.9 2.0 5.4 559 85.6 35 5.4 59 9.0
Total 9467 2019 21.3 3.2 7.3 7560 79.8 520 5.5 1389 14.7

Sierra Leone National Nutrition Survey 2017 SLNNS 2017
56 | P a g e
6.9 Water, Sanitation & Hygiene (WASH)
6.9.1 Water Access & Quality
Most households assessed reportedly draw their drinking water from protected sources (Table 46)
considered to be safe (68.6%; 95% CI: 64.8-72.3) including boreholes (24.9%), household/piped
connection/tanker (22.1%) and protected shallow wells (18.8%). Many other households however
draw their drinking water from unprotected sources such as rivers/streams (20.2%), open shallow
wells (6.4%) or pond/dam (1.7%).
Table 46: Households Main Source of drinking water
Household's Main Sources of Water for Drinking
District Total Borehole/ tube well
Protected shallow well
Open shallow well
Protected spring
River/ stream Household connection/ Stand pipe/
Tanker
Dam/ pond Others
N n % n % n % n % n % n % n % n %
Bo 560 193 34.5 231 41.3 21 3.8 0 0.0 107 19.1 8 1.4 0 0.0 0 0.0
Bombali 618 323 52.3 69 11.2 52 8.4 10 1.6 92 14.9 60 9.7 1 .2 11 1.8
Bonthe 612 224 36.6 103 16.8 93 15.2 36 5.9 127 20.8 2 .3 0 0.0 27 4.4
Kailahun 656 180 27.4 121 18.4 52 7.9 25 3.8 207 31.6 26 4.0 45 6.9 0 0.0
Kambia 548 116 21.2 116 21.2 31 5.7 1 .2 130 23.7 133 24.3 0 0.0 21 3.8
Kenema 667 203 30.4 137 20.5 49 7.3 112 16.8 24 3.6 127 19.0 0 0.0 15 2.2
Koinadugu 759 112 14.8 121 15.9 22 2.9 26 3.4 239 31.5 232 30.6 0 0.0 7 .9
Kono 723 270 37.3 169 23.4 53 7.3 0 0.0 124 17.2 39 5.4 1 .1 67 9.3
Moyamba 580 193 33.3 99 17.1 48 8.3 1 .2 239 41.2 0 0.0 0 0.0 0 0.0
Port Loko 548 158 28.8 154 28.1 53 9.7 0 0.0 149 27.2 24 4.4 0 0.0 10 1.8
Pujehun 709 112 15.8 24 3.4 13 1.8 0 0.0 164 23.1 396 55.9 0 0.0 0 0.0
Rural 642 141 22.0 141 22.0 58 9.0 9 1.4 106 16.5 165 25.7 19 3.0 3 .5
Slums 553 6 1.1 90 16.3 22 4.0 0 0.0 0 0.0 360 65.1 75 13.6 0 0.0
Tonkolili 639 122 19.1 144 22.5 23 3.6 3 .5 191 29.9 136 21.3 19 3.0 1 .2
Urban 653 6 .9 65 10.0 15 2.3 35 5.4 13 2.0 382 58.5 0 0.0 137 21.0
Total 9467 2359 24.9 1784 18.8 605 6.4 258 2.7 1912 20.2 2090 22.1 160 1.7 299 3.2

Sierra Leone National Nutrition Survey 2017 SLNNS 2017
57 | P a g e
Majority (78.3%; 95% CI: 75.3-81.2) takes less than 30 minutes to fetch water (return trip
including queuing/ waiting) as recommended by SPHERE (2011). Majority (72.4%) of the
assessed households that does not have access to safe/protected water does nothing and only
5.5% apply appropriate treatment (chlorination) to water before drinking (Table 47). Decanting
(14.7%) is the most common treatment for drinking water, although apart from chlorination (5.5%)
a few households also filter (4.6%), or boil (2.8%) water before drinking.
Table 47: Households access to drinking water
Household has access to safe water source
HHs taking recommended time
to access water
Treatment of Drinking Water
District Total No Yes Any treatment Appropriate Treatment
N n % n % n % N n % n %
Bo 560 122 21.8 438 78.2 448 80.0 122 55 45.1 1 .8
Bombali 618 157 25.4 461 74.6 472 76.4 157 39 24.8 0 0.0
Bonthe 612 248 40.5 364 59.5 554 90.5 248 18 7.3 0 0.0
Kailahun 656 292 44.5 364 55.5 494 75.3 292 122 41.8 19 6.5
Kambia 548 176 32.1 372 67.9 333 60.8 176 19 10.8 0 0.0
Kenema 667 103 15.4 564 84.6 551 82.6 103 26 25.2 3 2.9
Koinadugu 759 266 35.0 493 65.0 566 74.6 266 188 70.7 0 0.0
Kono 723 246 34.0 477 66.0 588 81.3 246 92 37.4 27 11.0
Moyamba 580 287 49.5 293 50.5 403 69.5 287 15 5.2 0 0.0
Port Loko 548 216 39.4 332 60.6 397 72.4 216 33 15.3 0 0.0
Pujehun 709 176 24.8 533 75.2 683 96.3 176 27 15.3 0 0.0
W. Rural 642 238 37.2 401 62.8 574 89.8 238 24 10.1 0 0.0
Slums 553 186 29.0 456 71.0 497 77.4 186 23 12.4 6 3.2
Tonkolili 639 98 17.7 455 82.3 448 81.0 98 69 70.4 60 61.2
W. Urban 653 165 25.3 488 74.7 403 61.7 165 71 43.0 48 29.1
Total 9467 2976 31.4 6491 68.6 7411 78.3 2976 821 27.6 164 5.5

Sierra Leone National Nutrition Survey 2017 SLNNS 2017
58 | P a g e
Most households used 60 litres of water in a day, with a mean water use of 82.5 litres per day,
excluding water for washing clothes (Table 48). All people should have safe and equitable access
to a sufficient quantity of water for drinking and personal & domestic hygiene. Based on the size
of household, most (61.5%; 95% CI: 58.6-64.4) of the assessed households have above the
recommended average water requirement for drinking, cooking and personal hygiene of 15
litres/person/day in any household (SPHERE, 2011). However, distance to the water source, time
taken to fetch water including queuing time, and number of water collecting and storage
containers may limit access to sufficient quantity of water for household use among the remaining
38.5% households that do not meet the daily minimum water requirement.
Table 48: Households Time to collect water and household Water Use
District Total Recommended Time
HH Water Use (L/day)
Individual Water Use (L/px/day)
Optimum Water Use (>=15 L/px/day)
N n % N Mean Median Mean SD n %
Bo 560 448 80.0 560 86.7 60.0 22.5 24.3 314 56.1
Bombali 618 472 76.4 618 66.3 60.0 16.3 7.2 387 62.6
Bonthe 612 554 90.5 611 64.9 60.0 19.1 11.2 402 65.8
Kailahun 656 494 75.3 656 100.4 80.0 26.3 24.2 387 59.0
Kambia 548 333 60.8 548 81.1 60.0 16.4 9.1 272 49.6
Kenema 667 551 82.6 667 98.0 80.0 27.2 15.0 609 91.3
Koinadugu 759 566 74.6 759 77.7 60.0 18.4 16.4 399 52.6
Kono 723 588 81.3 723 74.4 60.0 15.0 7.3 386 53.4
Moyamba 580 403 69.5 579 63.9 60.0 15.0 8.9 290 50.1
Port Loko 548 397 72.4 548 136.6 100.0 28.0 22.0 386 70.4
Pujehun 709 683 96.3 709 83.6 60.0 21.3 12.1 436 61.5
WA-Rural 642 574 89.8 639 66.1 60.0 15.7 7.6 334 52.3
WA-Slums 553 497 77.4 642 68.1 60.0 19.2 10.8 403 62.8
Tonkolili 639 448 81.0 553 99.5 80.0 28.0 21.1 438 79.2
Urban 653 403 61.7 653 78.5 60.0 18.1 11.9 378 57.9
Total 9467 7411 78.3 9465 82.5 60.0 20.3 15.7 5821 61.5
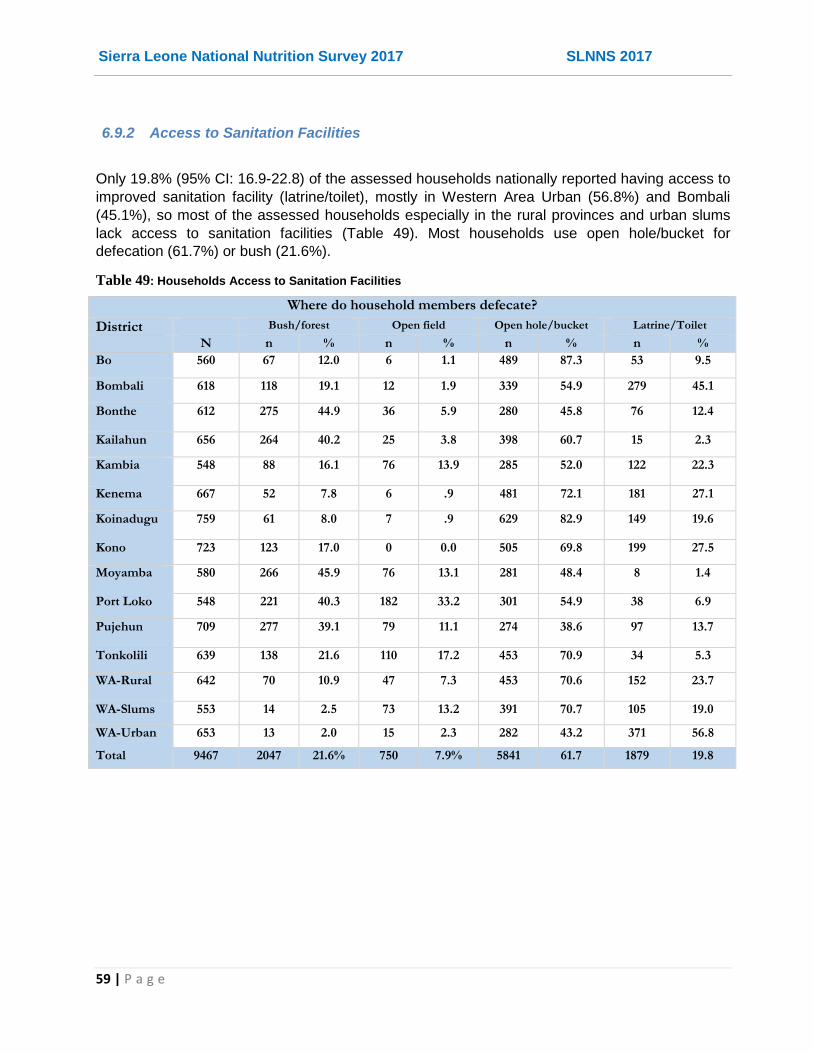
Sierra Leone National Nutrition Survey 2017 SLNNS 2017
59 | P a g e
6.9.2 Access to Sanitation Facilities
Only 19.8% (95% CI: 16.9-22.8) of the assessed households nationally reported having access to
improved sanitation facility (latrine/toilet), mostly in Western Area Urban (56.8%) and Bombali
(45.1%), so most of the assessed households especially in the rural provinces and urban slums
lack access to sanitation facilities (Table 49). Most households use open hole/bucket for
defecation (61.7%) or bush (21.6%).
Table 49: Households Access to Sanitation Facilities
Where do household members defecate?
District Bush/forest Open field Open hole/bucket Latrine/Toilet
N n % n % n % n %
Bo 560 67 12.0 6 1.1 489 87.3 53 9.5
Bombali 618 118 19.1 12 1.9 339 54.9 279 45.1
Bonthe 612 275 44.9 36 5.9 280 45.8 76 12.4
Kailahun 656 264 40.2 25 3.8 398 60.7 15 2.3
Kambia 548 88 16.1 76 13.9 285 52.0 122 22.3
Kenema 667 52 7.8 6 .9 481 72.1 181 27.1
Koinadugu 759 61 8.0 7 .9 629 82.9 149 19.6
Kono 723 123 17.0 0 0.0 505 69.8 199 27.5
Moyamba 580 266 45.9 76 13.1 281 48.4 8 1.4
Port Loko 548 221 40.3 182 33.2 301 54.9 38 6.9
Pujehun 709 277 39.1 79 11.1 274 38.6 97 13.7
Tonkolili 639 138 21.6 110 17.2 453 70.9 34 5.3
WA-Rural 642 70 10.9 47 7.3 453 70.6 152 23.7
WA-Slums 553 14 2.5 73 13.2 391 70.7 105 19.0
WA-Urban 653 13 2.0 15 2.3 282 43.2 371 56.8
Total 9467 2047 21.6% 750 7.9% 5841 61.7 1879 19.8

Sierra Leone National Nutrition Survey 2017 SLNNS 2017
60 | P a g e
6.9.3 Hygiene Practices
Most households have their members wash hands after defecation (96.0%), however, less than
half of the assessed households reportedly have their members wash their hands before eating
(45.7%), before cooking (43.3%) and where applicable before cleaning baby’s bottom after
defecation (22.8%) with the rates varying from district to district (Table 50). Majority (72.0%; 95%
CI: 68.9-75.0) of the assessed households reported using soap while washing hands. However,
only 30.6% (95% CI: 27.0-34.2) of the households had their members consistently wash their
hands at all the three critical points (after defecation, before eating and before cooking/preparing
food).
Table 50: Household members’ hand washing practices
Hand Washing & Hygiene Practices
District N after defecation
before eating after cleaning baby
before cooking Other times (e.g. before
milking)
Use soap for hand washing
Wash hands at 3 critical points
n % n % n % n % n % n % N %
Bo 560 558 99.6 73 13.0 48 8.6 108 19.3 0 0.0 340 60.7 39 7.0
Bombali 618 609 98.5 452 73.1 118 19.1 373 60.4 5 .8 467 75.6 360 58.3
Bonthe 612 576 94.1 213 34.8 63 10.3 127 20.8 6 1.0 338 55.2 69 11.3
Kailahun 656 649 98.9 207 31.6 17 2.6 93 14.2 2 .3 443 67.5 38 5.8
Kambia 548 514 93.8 93 17.0 75 13.7 203 37.0 3 .5 327 59.7 52 9.5
Kenema 667 618 92.7 207 31.0 124 18.6 232 34.8 41 6.1 472 70.8 119 17.8
Koinadugu 759 750 98.8 381 50.2 275 36.2 345 45.5 174 22.9 506 66.7 317 41.8
Kono 723 717 99.2 422 58.4 166 23.0 368 50.9 9 1.2 501 69.3 322 44.5
Moyamba 580 579 99.8 340 58.6 227 39.1 426 73.4 135 23.3 524 90.3 331 57.1
Port Loko 548 449 81.9 237 43.2 16 2.9 106 19.3 1 .2 294 53.6 24 4.4
Pujehun 709 691 97.5 544 76.7 338 47.7 465 65.6 58 8.2 614 86.6 429 60.5
Tonkolili 639 566 88.6 301 47.1 275 43.0 384 60.1 154 24.1 432 67.6 256 40.1
WA-Rural 642 624 97.2 190 29.6 92 14.3 239 37.2 33 5.1 412 64.2 121 18.8
WA-Slums 553 545 98.6 392 70.9 150 27.1 287 51.9 4 .7 539 97.5 233 42.1
WA-Urban 653 647 99.1 272 41.7 177 27.1 346 53.0 9 1.4 604 92.5 189 28.9
Total 9467 9092 96.0 4324 45.7 2161 22.8 4102 43.3 634 6.7 6813 72.0 2899 30.6

Sierra Leone National Nutrition Survey 2017 SLNNS 2017
61 | P a g e
7. DISCUSSION
7.1 Nutrition Situation
The prevalence of global acute malnutrition (GAM) rate of 5.1% (95%CI: 4.6-5.6), moderate acute
malnutrition of 4.0% (95% CI: 3.6-4.5) and severe acute malnutrition (SAM) rate (WHZ<‐3 or
edema) of 1.0% (95%CI: 0.8-1.3) indicate a poor nutrition situation phase (GAM rate of 5.0-9.9%)
of malnutrition in the country’s population according to WHO classification (Table 51). When
compared to the immediate past assessment of 2014, the results indicate a slight deterioration
from the acceptable phase with respective GAM, MAM and SAM rates of 4.7% (95% CI: 4.3-5.2),
3.7% (95% CI: 3.3-4.1) and 1.0% (95% CI: 0.9-1.2), though the increase in GAM rates is not
statistically significant. It is important to note that, this difference was not significant even after
accounting for (leaving out) two districts (Bonthe and Kailahun) that were not assessed in 2014. It
is also notable that the national point prevalence for SAM remained the same, but the slight
increase was observed in the MAM rates. After adjusting for the two districts, the national GAM,
MAM and SAM levels remained at similar levels of 5.3% (95% CI: 4.8-5.8), 4.3% (95% CI: 3.8-
4.8) and 1.1% (95% CI: 0.8-1.3). However, significant deterioration was observed in the Western
Area especially Urban, where GAM, MAM and SAM rates changed from 1.9% (95% CI: 1.2-3.1),
1.8% (95% CI: 1.1-3.0), and 0.1% (0.0-0.9) in 2014 to 5.8% (95% CI: 4.1-8.1), 4.9% (95% CI: 3.2-
7.3) and 1.0% (95% CI: 0.5-2.1) in 2017 respectively. It is remarkable to note that the Western
Area has since 2014 experienced multiple shocks with devastating effects including mudslide
/landslide, floods and watery diarrhea besides Ebola outbreak.
Table 51: WHO Classification of severity of malnutrition in a community
WHO Classification of severity of malnutrition in a community
Type of Malnutrition Prevalence cut- off Mean Z Scores Severity of Malnutrition
Prevalence of Global Acute
Malnutrition
(WHZ<-2 and/or Oedema)
< 5% > -0.40 Acceptable
5.0 – 9.9% -0.40 – -0.69 Poor
10.0 – 14.9% -0.70 - -0.99 Serious
>=15% < -1.00 Critical
Prevalence of Underweight
(WAZ<-2)
< 10% - Low (Acceptable)
10.0 – 19.9% - Medium (Poor)
20.0 – 29.9% - High (Serious)
>=30% - Very high (Critical)
Prevalence of Stunting
(HAZ<-2)
< 20% - Low (Acceptable)
20.0 – 29.9% - Medium (Poor)
30.0 – 39.9% - High (Serious)
>=40% - Very high (Critical)
Similarly, after adjusting for the two districts, the respective prevalence of national, moderate and
severe underweight were 13.8% (95% CI: 13.0-14.8), 10.7% (95% CI: 10.0-11.5) and 3.1% (95%
Sierra Leone National Nutrition Survey 2017 SLNNS 2017
62 | P a g e
CI: 2.7-3.6) and did not differ significantly from the 2014 rates of 12.9% (95% CI: 11.9-14.0), 9.8%
(95% CI: 9.0-10.6) and 3.2% (95% CI: 2.7-3.7) when Bonthe and Kailahun were exclude.
Wasting, the main indicator of acute malnutrition occurs because of recent rapid weight loss, or a
failure to gain weight within a relatively short period of time and according to the UNICEF
framework of Malnutrition may be the result of inadequate food intake or recent episode of illness.
Wasting occurs more commonly in children under five years old, often during the stage when
complementary foods are being introduced and children are more susceptible to infectious
diseases, explaining why acute malnutrition was higher among the younger (6-29 months) than
the older children (30-59 months). The younger age group includes the critical breastfeeding age
(6-23.9 months) during which the child experiences multiple challenges in terms of the quality and
quantity of food consumed as well as frequent infections resulting from poor feeding practices and
conditions. Recovery from wasting is relatively quick once optimal feeding, health, and care are
restored. Wasting occurs because of deficiencies in both macronutrients (fat, carbohydrate and
protein) and some micronutrients (vitamins and minerals). When combined with bilateral edema
(presents as swelling in both feet), an essential indicator for determining the presence of Severe
Acute Malnutrition or kwashiorkor, the Global Acute Malnutrition prevalence is a universal
measure of the severity of malnutrition and health of a community. Oedema results from the
excessive accumulation of extracellular fluid because of severe nutritional deficiencies, and is a
serious cause for concern. All children identified with bilateral oedema were referred immediately
for treatment at the nearest health facility for In-Patient Care. This was was done to the six (6)
cases that were identified during the SLNNS 2017 since presence of bilateral oedema is classified
as severe malnutrition.
The national prevalence of stunting (HAZ<-2) of 31.3% (95% CI: 30.0-32.6); 21.3% (95% CI: 20.3-
22.3) moderate and 10.0% (95% CI: 9.2-10.7) severe stunting indicates high or serious situation
of chronic malnutrition according to WHO Classification (Table 51). There was a slight
deterioration from the 2014 findings of 28.8% (95% CI: 27.5-30.2), 21.0% (95% CI: 19.9-22.1),
and 7.8% (95% CI: 7.2-8.5) for global, moderate and severe stunting respectively. It is important
to note that, there was no significant difference even after adjusting for the two districts, as the
national stunting, moderate stunting and severe stunting rates remained at similar levels of 31.1%
(95% CI: 29.7-32.5), 20.9% (95% CI: 19.9-22.0) and 10.1% (95% CI: 9.4-11.0) respectively.
Stunting is common in areas of low food security, and acute malnutrition is instigated by a
combination of economic, agricultural production, lack of access to diversified diets and
consumption of insufficient essential nutrients as well as health-related factors. The
consequences of the stunting can be looked at in the short-term in terms of mortality from
infections, in particular pneumonia, malaria and diarrhea; in medium term, cognitive, education
and behavioral aspects of child development; and in long term, the risk of poor health and lower
attainment of socio-economic productivity throughout lifetime and are irreversible.
The analysis of trends in prevalence of malnutrition have generally shown decrease (Figure 15) in acute and chronic (stunting) since 2008, however the 2017 findings indicate a plateau and no significant improvement from 2014 results, partly for the reasons aforementioned. The rates are however better than the previous 2008-2010 rates and the regional prevalence in Sub-Saharan Africa (SSA) and West and Central Africa (WCA) as shown in Figure 15. Caused by
The gender differential levels observed in the results with higher prevalence of malnutrition seen
in boys compared to girls cannot be explained by this study and would require further study on

Sierra Leone National Nutrition Survey 2017 SLNNS 2017
63 | P a g e
causal analysis and Knowledge, Attitude and Practices (KAP) analysis for any preferential
treatment or exposure of the boy child at this critical age (6-59 months).
Figure 15: Trends in levels of acute malnutrition (WHZ<-2 or oedema WHO 2006)
SSA – Sub Saharan Africa WCA – Western and Central Africa
7.2 Death Rates
The retrospective crude and under five death rates of 0.19 (95% CI: 0.15-0.24) and 0.16 (95% CI;
0.10-0.27) are both below the SPHERE alert thresholds of 1/10,000/day and 2/10,000/day
respectively. The findings indicate stable situation from the CDR of 0.36 deaths/10,000/day and
U5DR of and 0.83 under five deaths/10,000/day reported in SLNNS 2014 and the 2010 rates of
0.83 (95% CI: 0.75-0.91) and 1.18 (95% CI: 1.03-1.35) for CDR and U5DR respectively. Most
deaths by recall were caused by illnesses both in under fives (92.9%) and in total (81.9%) and
occurred in their current locations (79.2%). Figure 16 shows that mortality rates have remained
within the SPHERE acceptable thresholds since 2010.

Sierra Leone National Nutrition Survey 2017 SLNNS 2017
64 | P a g e
Figure 16: Trends in Mortality Rates (2010-2017) in Sierra Leone
7.3 IYCF Practices
On a positive note, breastfeeding is a widespread practice among the population with nearly all
the assessed children 0-23 months ever breastfed (99.1%), 88.2% still breastfeeding and 61.6%
of 0-6 months breastfed exclusively. The rate of breastfeeding drops steadily with age with 94.5%
of continued breastfeeding at 1 year. Breastfeeding guarantees food and fluid security in infants
for the first six month and provides active immune protection. There is however, significant
variations in rates of breastfeeding indicators and some districts especially Western Area Urban,
Bonthe and Tonkolili would require more effort to promote optimum breastfeeding benefits.
Complementary foods are still introduced to a large number of children (40%) before the age of
six months which is earlier than the WHO’s recommendation that mother’s exclusively breastfeed
their children (give an infant no other liquids or foods apart from breast milk up until six months of
age). Early introduction to complementary foods or failing to exclusively breastfeed a child
exposes the child to unhygienic feeding conditions and increases their vulnerability to infection
and other illnesses. This is especially a real risk in the congested slums and rural environments in
some districts such as Bo, Kailahun, Kambia, and Port Loko where water is not treated and/or
regular hand-washing with soap is not universally practiced making the children more vulnerable
to diarrheal infections.
Sub-optimal feeding of infant and young child during illness is prevalent, with introduction of semi
solid and solid foods in terms of diversity and frequency. More than 70% of the children do not

Sierra Leone National Nutrition Survey 2017 SLNNS 2017
65 | P a g e
receive diversified diet with poor monotonous diets reported widely in all the districts but most
particularly in Koinadugu, Port Loko, Bonthe and Pujehun. More than 50% of the children (6-24
months) assessed do not meet the recommended minimum meal frequency for their age and
breast feeding status and very few (13.9%) are fed on vitamin A rich foods.
Poor breastfeeding and complementary feeding habits are known to expose children to morbidity,
malnutrition and even death. The rates of acute and chronic malnutrition higher among the
breastfeeding age are indicative of the effect of sub-optimal IYCF practices among the population.
Sierra Leone National Nutrition Survey 2017 SLNNS 2017
66 | P a g e
7.4 Food Security
The assessment findings indicate that a significant proportion of population face food shortage,
hunger and food insecurity based on poor food consumption and dietary diversity. The main
source of the staple food (rice) is market/shop purchases with the main source of income from
sale of crops/farm produce yet the population is just coming out of the lean season (June-August)
and less than half (48%) have reported cultivating their lands. Limited income compounded by
increased food prices, these factors put a strain on the households, with more than half reportedly
spending more than half of disposable income on food. Rice and wheat foods are however;
readily available in the market stores from adequate imports and with the onset of the rains during
the survey in September, there is increased availability of variety of foods including green corn
harvest, fruits and vegetables.
Since 2014, many poor households in Sierra Leone have experienced new or increased food
insecurity as Ebola-related fears and restrictions on movement and mass gatherings disrupted
free trade, increased food prices and reduced household income. According to the Famine Early
Warning Systems Network (FEWSNET) forecast general improvement in the food security
situation to IPC Phase 19 until January 2018 due harvest prospects from the sufficient rainfall,
combined with normal market and labor activities that would allow poor households to meet their
food needs.
7.5 Possible factors associated with Malnutrition in Sierra Leone
In Sierra Leone, like many other developing countries in the region, and based on the UNICEF
conceptual framework of malnutrition, morbidity and dietary intake are the immediate causes of
malnutrition underlain by food insecurity, poor maternal and child care and poor/unhygienic
environment. Morbidity and malnutrition have interchangeable cause-effect relationship and may
both result in mortality of affected groups in population.
Frequent illnesses as reported in nearly one-quarter of the assessed children, from one or more
communicable childhood diseases (e.g. fever, cough, diarrhea, skin infections, eye infections
among others) in the two weeks prior to the assessment is a possible contributive factor to the
poor nutrition situation. MOHS also enlists malaria and pneumonia as the common reported
causes of morbidity in health facilities during the rainy season. Morbidity levels are aggravated by
the poor WASH conditions in many parts of the country characterized by poor access to safe
drinking water, lack of sanitation facilities and poor hand-washing practices at critical times.
Inadequate food consumption directly results into nutrient intake deficits and a significant
contributing factor to the poor nutrition situation. Many of the households who are food insecure
may not consume sufficient food in terms of quantity and variety of nutrients for health and vitality.
Although there is high consumption of starchy staple cereal and plantain, consumption of iron-rich
9 *The Integrated Phase Classification (IPC) is a standardized tool that classifies the severity and magnitude of food in security from Minimal (IPC 1) to
Famine (IPC 5).

Sierra Leone National Nutrition Survey 2017 SLNNS 2017
67 | P a g e
animal source foods such as milk, meat and eggs is very poor by households across the districts,
and so is the case for consumption of Vitamin A-rich (yellow or orange-fleshed) fruits/vegetables.
There is however good fish and vegetable oil consumption. Most households have no lactating
livestock, and milk mostly consumed in tea/coffee drinks is purchased as powder milk at high
prices for many households. Qualitative analysis shows that households generally take two meals
in a day (breakfast and lunch) and a typical meal in a locality is monotonous and less diversified in
diet. Breakfast is prepared with boiled cassava or sometimes sweet potatoes and taken with
drinking water, and lunch is prepared with boiled white rice and relish of soup or broth. Soup at
times may be enriched with palm oil, beans or fish, and condiments of flavouring powder, onions,
pepper (green or red). The broth may be prepared from green leafy vegetables, cassava or sweet
potato leaves and enriched with fish or kain kain, which some households grow at their
backyard/kitchen gardens. The minority households that take a third meal (supper) typically serve
bread with tea (white or black) or cocoa with sugar; and sometimes enrich the meal with eggs or
fried fish.

Sierra Leone National Nutrition Survey 2017 SLNNS 2017
68 | P a g e
8. CONCLUSIONS & RECOMMENDATIONS
8.1 Conclusions
In conclusion, the nutrition situation in the country is poor, with global acute malnutrition (GAM)
rate of 5.1% (95%CI: 4.6-5.6). The crude and under five mortality rates of 0.19 (95% CI: 0.15-
0.24) and 0.16 (95% CI: 0.10-0.27) also remain below the SPHERE alert levels. Although the
levels of both wasting and stunting has shown an improving trend in the previous two national
surveys, the current findings have shown a worsening situation post-Ebola period with prevalence
of stunting rates of 31.3% (95% CI: 30.0-32.6), and remains high (>30%) indicating a persistent
serious chronic malnutrition according to WHO Classification, this trend needs to be addressed
comprehensively. These rates are equivalent to 47,861 wasted children and 293,736 stunted
children in 2017 respectively.
The existence of both under and over nutrition in children and women indicates the emerging
double burden and complexity of malnutrition in the country. The national prevalence of acute
malnutrition using MUAC (<23 cm) was 5.7% among the pregnant and/or lactating women and
5.1% based on BMI of non pregnant/lactating women. On the extreme right hand of the
distribution, the prevalence of overweight and obese was 18.4% and 7.5% respectively.
Even though the key underlying factors affecting the nutritional status of the children i.e. morbidity,
food insecurity, poor child care, lack of safe drinking water and limited sanitation and hygiene
facilities remain key risk factors, it is important to note that malnutrition is multifaceted and chronic
malnutrition is hinged on the basal socio-economic, education and cultural structures. Reducing
the prevalence of stunting from 25.7% to 11.7% by 2020 as per Nutrition for Growth (N4G),
commitments that GoSL undertook in 2013 require continued concerted and integrated efforts
among all the relevant sectors in the country. Similarly, achieving by 2025, the internationally
agreed targets on stunting and wasting in children under 5 years of age, and addressing the
nutritional needs of adolescent girls, pregnant and lactating women and older persons10 as part of
the 2030 Agenda for Sustainable Development require renewed commitments and
comprehensive stunting reduction strategies.
8.2 Recommendations
The poor acute nutrition situation and serious chronic nutrition situation in the country is
attributed to multiple and interrelated factors that call for continued integrated interventions. These
efforts should address both immediate needs as well as develop long-term strategies to enhance
access to public health services; support to sustain livelihood systems and social protection
mechanisms. Specific recommendations include:
10 Indicator 2.2 of Goal 2 of the Sustainable Development Goals (SDG). “ By 2030, end all forms of malnutrition....”
Sierra Leone National Nutrition Survey 2017 SLNNS 2017
69 | P a g e
Immediate Interventions
Evaluate the need to maintain scale up of IMAM programme for rehabilitation of acutely malnourished children through sustained active case finding, continued self-referrals and capacity building of the existing CHP, CHC and MCHP staff and the community to manage acutely malnourished children.
Since the surveys has shown that nutrition admissions screening using MUAC is less sensitive and leaves out a significant proportion of deserving malnourished cases, the GoSL/MoHS should review the guidelines to use weight-for-height Z scores for admissions and encourage its implementation at the community/health facility levels.
Since the establishment of the national IMAM program and supportive treatment programs and associated WASH, food security and livelihood interventions by DFNS, line ministries and national NGOs with support from international UN and NGO partners, the MoHS covered many facilities and districts which did not have nutrition (SC,OTP, STP) services. It is important to maintain these services and to scale-up to more places that still do not have these nutrition services.
Protect the significant gains made over the years by strengthening the interagency and interdepartmental emergency response teams amidst the risks of shocks such as Ebola and cholera outbreaks, land/mud slides, flooding and droughts arising from climatic changes.
Cognizant to intensified health and nutrition education and interventions for improving social security, water, sanitation and hygiene (WASH) practices alongside nutrition programmes by the government and different UN & NGO programmes, these programmes need to be strengthened through integrated planning and implementation. Health, FSL and WASH based interventions should complement national nutrition programs in order to address the underlying causes of malnutrition
Conduct an integrated Nutrition Causal Analysis (NCA) Study for malnutrition such as LinkNCA to identify the predominant causes of stunting in a few satellite districts and prioritize key areas of intervention. The study should include a qualitative enquiry to understand why boys tend to be more malnourished in the country as shown in this survey.
Conduct a Cost of Hunger (COHA) study for Sierra Leone to quantify the economic impact of malnutrition on the country’s development for high-level advocacy to the government and financial institutions/partners to invest more on nutrition.
Coverage (SQUEAC or SLEAC) survey to evaluate coverage in districts with ongoing health and nutrition interventions by the government and different agencies since SMART survey is just indicative as it only determines the immunization status of the entire population.
Intensify health and nutrition education activities on good IYCF practices targeting caregivers with focus on promoting exclusive breastfeeding, appropriate young child feeding, diet diversification, and improvements in household hygiene including health seeking behaviors and practices, through women support groups within the communities who are advocating for optimal IYCF. Continued health education to sensitize the community on domestic treatment of drinking water and proper disposal of human faecal waste to avoid contamination of water sources is encouraged.
Long term Interventions
Put stunting prevention into the forefront of the national nutrition agenda targeting the critical first 1000 days of life to produce greater impacts on health and education in the medium-term and on economic productivity and inclusive growth in the longer term. Support food and agriculture based interventions in complement to national nutrition programmes that focus on

Sierra Leone National Nutrition Survey 2017 SLNNS 2017
70 | P a g e
evidence based (Bhutta, et al. 2015) preventive and treatment layers in the management of acute and chronic malnutrition. Focus should be given to the improvement of nutrition sensitive community and household food production systems that produce diverse nutrient-rich cereal foods, fruits and vegetable.
Review policies relating to nutrition and food security based on the new evidence presented by the SMART survey, more specifically, the survey data should be used in the process of reviewing the National Food and Nutrition Security Implementation Plan to pave the way for integrated multisectoral and multistakeholder coordination to address undernutrition in Sierra Leone. Improve the policy environment to promote and deliver IYCF practices and services by ensuring the availability of legislation on the Regulation on Marketing of the breast milk substitutes.
Increase supply of and access to more nutritious/diverse foods through social and behaviour change communication on consumption of fruits, vegetables and pulses, through home production and/or market purchase. This need to be complemented by recipes preparation and promotion to improve the diversification of the meals.
Support milk production and consumption in collaboration with relevant institutions, ministries and departments to improve dietary diversity from animal source foods.
Strengthen the national nutrition surveillance system in integration with HMIS to better monitor the nutrition trends and implementation of both nutrition sensitive and nutrition specific programmes. Given the recurrent food deficit during hunger gap periods, encourage partners to support periodic annual SMART surveys in specific districts of intervention especially during the lean seasons to provide timely data for monitoring and any early warning signs. Continue the 3-year periodic national nutrition SMART surveys to provide with data on nutrition situation and assess the progress towards global, regional and national commitments to eliminate hunger in the country.
The communities be trained on sanitation and maintenance of the water systems in order to address the issues of limited access to safe water. Provision of sanitary facilities including building of latrines at household level in settled populations or at strategic locations in the bomas/villages for appropriate disposal of human excretal waste. This should be coupled with awareness on the need to use such facilities.
Initiate and maintain programmes for treatment and prevention of the emerging overweight and obesity in adults such as behaviour change communication (BCC) for adoption and maintenance of lifestyle behaviors contributing to both dietary intake and physical activity.
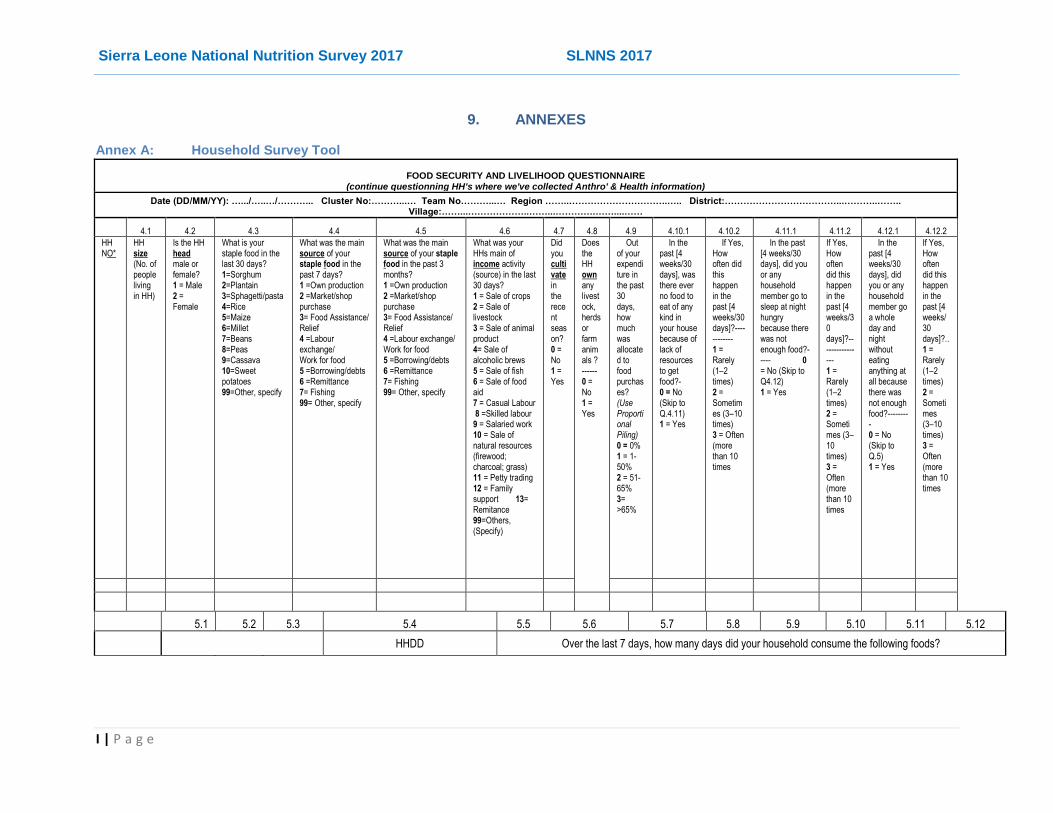
Sierra Leone National Nutrition Survey 2017 SLNNS 2017
I | P a g e
9. ANNEXES
Annex A: Household Survey Tool
FOOD SECURITY AND LIVELIHOOD QUESTIONNAIRE (continue questionning HH's where we've collected Anthro' & Health information)
Date (DD/MM/YY): ….../…..…/………... Cluster No:………...… Team No………...… Region ……..…………………………..….. District:………………………………...………..…….. Village:……...………………..……...………….……....……
4.1 4.2 4.3 4.4 4.5 4.6 4.7 4.8 4.9 4.10.1 4.10.2 4.11.1 4.11.2 4.12.1 4.12.2
HH NO*
HH size (No. of people living in HH)
Is the HH head male or female? 1 = Male 2 = Female
What is your staple food in the last 30 days? 1=Sorghum 2=Plantain 3=Sphagetti/pasta 4=Rice 5=Maize 6=Millet 7=Beans 8=Peas 9=Cassava 10=Sweet potatoes 99=Other, specify
What was the main source of your staple food in the past 7 days? 1 =Own production 2 =Market/shop purchase 3= Food Assistance/ Relief 4 =Labour exchange/ Work for food 5 =Borrowing/debts 6 =Remittance 7= Fishing 99= Other, specify
What was the main source of your staple food in the past 3 months? 1 =Own production 2 =Market/shop purchase 3= Food Assistance/ Relief 4 =Labour exchange/ Work for food 5 =Borrowing/debts 6 =Remittance 7= Fishing 99= Other, specify
What was your HHs main of income activity (source) in the last 30 days? 1 = Sale of crops 2 = Sale of livestock 3 = Sale of animal product 4= Sale of alcoholic brews 5 = Sale of fish 6 = Sale of food aid 7 = Casual Labour 8 =Skilled labour 9 = Salaried work 10 = Sale of natural resources (firewood; charcoal; grass) 11 = Petty trading 12 = Family support 13= Remitance 99=Others, (Specify)
Did you cultivate in the recent season? 0 = No 1 = Yes
Does the HH own any livestock, herds or farm animals ? ------ 0 = No 1 = Yes
Out of your expenditure in the past 30 days, how much was allocated to food purchases? (Use Proportional Piling) 0 = 0% 1 = 1-50% 2 = 51-65% 3= >65%
In the past [4 weeks/30 days], was there ever no food to eat of any kind in your house because of lack of resources to get food?- 0 = No (Skip to Q.4.11) 1 = Yes
If Yes, How often did this happen in the past [4 weeks/30 days]?------------ 1 = Rarely (1–2 times) 2 = Sometimes (3–10 times) 3 = Often (more than 10 times
In the past [4 weeks/30 days], did you or any household member go to sleep at night hungry because there was not enough food?----- 0 = No (Skip to Q4.12) 1 = Yes
If Yes, How often did this happen in the past [4 weeks/30 days]?---------------- 1 = Rarely (1–2 times) 2 = Sometimes (3–10 times) 3 = Often (more than 10 times
In the past [4 weeks/30 days], did you or any household member go a whole day and night without eating anything at all because there was not enough food?--------- 0 = No (Skip to Q.5) 1 = Yes
If Yes, How often did this happen in the past [4 weeks/30 days]?.. 1 = Rarely (1–2 times) 2 = Sometimes (3–10 times) 3 = Often (more than 10 times
5.1 5.2 5.3 5.4 5.5 5.6 5.7 5.8 5.9 5.10 5.11 5.12
HHDD Over the last 7 days, how many days did your household consume the following foods?

Sierra Leone National Nutrition Survey 2017 SLNNS 2017
II | P a g e
HH NO
Yesterday, how many meals were eaten by?
What did your household eat yesterday, day and night? (tick the food groups for all foods mentioned) 1=Cereals; 2=Milk & milk products; 3=Meat and offals; 4=Vegetables dark green; 5=Other vegetables 6=Yellow or orange fleshed fruits 7=Other fruits; 8=Pulses;9=Orange fleshed tubers/roots; 10=White tubers & root crops; 11=Eggs; 12=Fata/Oils 13=Sugar/honey; 14=Fish and sea foods; 15=Condiments/spices
Cereals & tubers (maize, rice, millet, sorghum, cassava, sweet potatoes, bread etc)?
Pulses (beans, lentils, cashew nuts, peas, groundnuts, green grams, etc)?
Vegetables? (e.g. okra, potato/cassava leaves - crain crain, e.t.c)
Fruits? (mango, orange, banana e.t.c)
Animal protein foods (meat, poultry, fish, eggs)?
Milk & dairy
products? (e.g. milk, yoghurt,
etc)
Sugar, sweets
and honey (e.g.
sweetened foods, drinks,
chocolates, sweets, candies,
etc)?
Oils/fats? (e.g. palm oil, fat, butter, margarine added to food or used for cooking)
family?
you (woman)
? U5s?
6.1 6.2 6.3 7.1 7.2 7.3 7.4 7.5 7.6 7.7 7.8
Has your household done any of the listed things, and how frequent were they done in the past 7 days (If not used, mark 0):
HH NO
Has your household experienced any abnormal events/circumstances or challenges (shocks) that have made it difficult to obtain sufficient means of livelihood in the last 12 months? 0=No 1=Yes (if No, skip to Qn 7)
If Yes, What are the main shocks faced by the household in the past one year? 1=Insecurity; 2=High costs of food (expensive) 3=Floods; 4=Mudslide/ landslide 5=Human sickness; 6=Livestock diseases 7=Pests or Crop diseases; 8=Limited access/mobilty 9=Delay of rains; 10=Lack/scarcity of water 11=Bereavement; 12=Crop failure (Tick MAX 3 main shocks, but you can also tick less. DO NOT READ OUT THE OPTIONS)
When (season) in the last one year did you experience these shocks/events? 1=Rainy season 2=Dry season
In the past 7 days were there times when your household did not have enough food or money to buy food? 0= No; 1=yes (If the answer is “No” skip to Qn 8)
a. Rely on less preferred and less expensive foods?
b. Borrow food, or rely on help from a friend or relative?
c. Limit portion sizes at meal times?
d. Restrict consumption by adults so that small children can eat?
e. Reduce the number of meals eaten in a day?
f. Sell more animals than usual?
g. Consume seed stocks
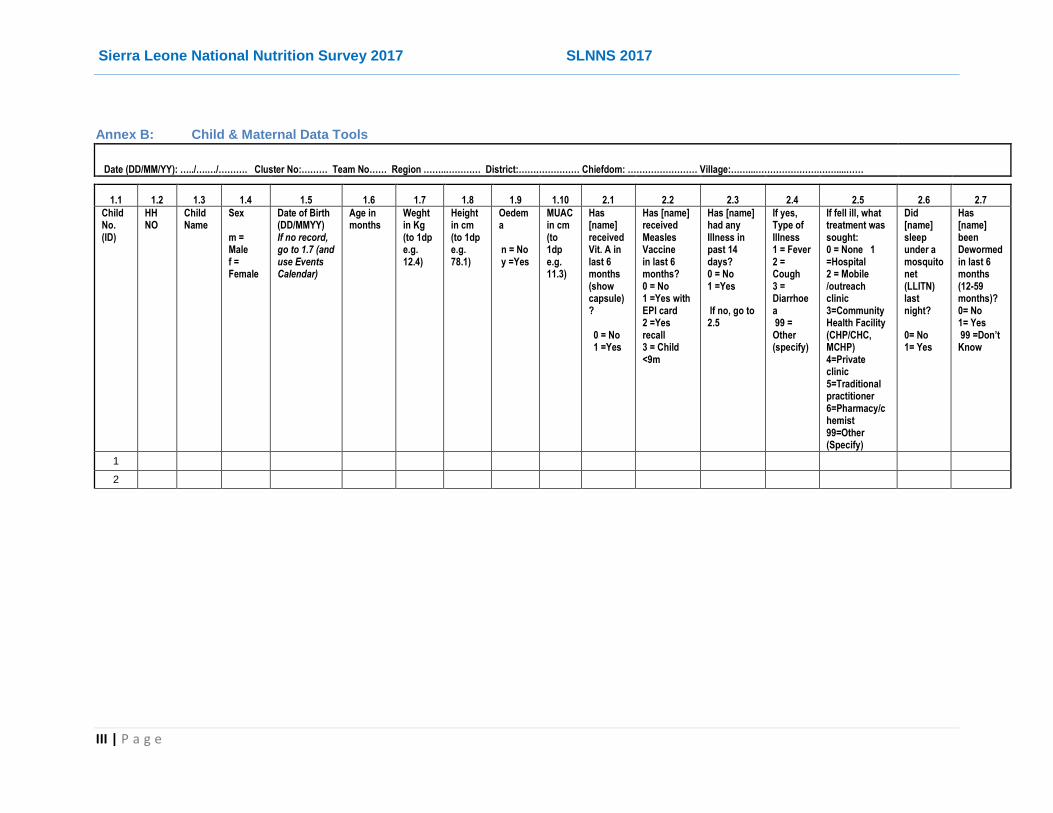
Sierra Leone National Nutrition Survey 2017 SLNNS 2017
III | P a g e
Annex B: Child & Maternal Data Tools
Date (DD/MM/YY): …../….…/………. Cluster No:……… Team No…… Region ……..………… District:………………… Chiefdom: …………………… Village:……...………………….……....……
1.1 1.2 1.3 1.4 1.5 1.6 1.7 1.8 1.9 1.10 2.1 2.2 2.3 2.4 2.5 2.6 2.7
Child No. (ID)
HH NO
Child Name
Sex m = Male f = Female
Date of Birth (DD/MMYY) If no record, go to 1.7 (and use Events Calendar)
Age in months
Weght in Kg (to 1dp e.g. 12.4)
Height in cm (to 1dp e.g. 78.1)
Oedema n = No y =Yes
MUAC in cm (to 1dp e.g. 11.3)
Has [name] received Vit. A in last 6 months (show capsule)? 0 = No 1 =Yes
Has [name] received Measles Vaccine in last 6 months? 0 = No 1 =Yes with EPI card 2 =Yes recall 3 = Child <9m
Has [name] had any Illness in past 14 days? 0 = No 1 =Yes If no, go to 2.5
If yes, Type of Illness 1 = Fever 2 = Cough 3 = Diarrhoea 99 = Other (specify)
If fell ill, what treatment was sought: 0 = None 1 =Hospital 2 = Mobile /outreach clinic 3=Community Health Facility (CHP/CHC, MCHP) 4=Private clinic 5=Traditional practitioner 6=Pharmacy/chemist 99=Other (Specify)
Did [name] sleep under a mosquito net (LLITN) last night? 0= No 1= Yes
Has [name] been Dewormed in last 6 months (12-59 months)? 0= No 1= Yes 99 =Don’t Know
1
2
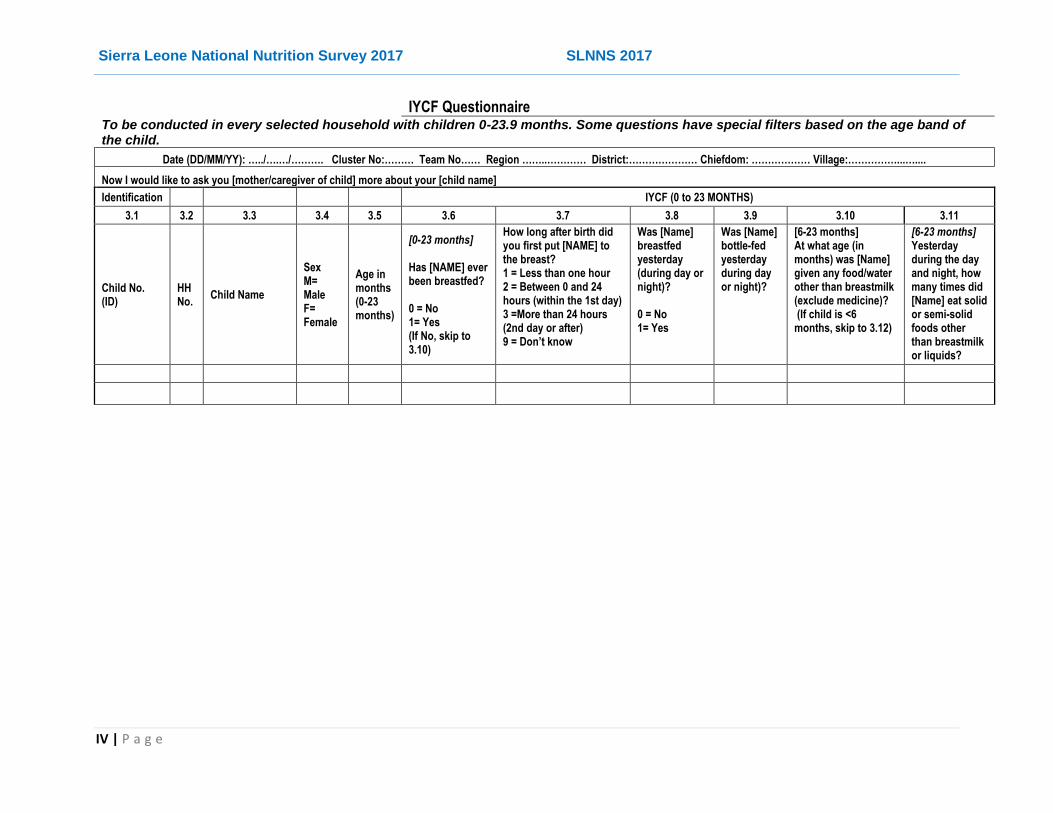
Sierra Leone National Nutrition Survey 2017 SLNNS 2017
IV | P a g e
IYCF Questionnaire To be conducted in every selected household with children 0-23.9 months. Some questions have special filters based on the age band of the child.
Date (DD/MM/YY): …../….…/………. Cluster No:……… Team No…… Region ……..………… District:………………… Chiefdom: ……………… Village:……………...…....
Now I would like to ask you [mother/caregiver of child] more about your [child name]
Identification IYCF (0 to 23 MONTHS)
3.1 3.2 3.3 3.4 3.5 3.6 3.7 3.8 3.9 3.10 3.11
Child No. (ID)
HH No.
Child Name
Sex M= Male F= Female
Age in months (0-23 months)
[0-23 months] Has [NAME] ever been breastfed? 0 = No 1= Yes (If No, skip to 3.10)
How long after birth did you first put [NAME] to the breast? 1 = Less than one hour 2 = Between 0 and 24 hours (within the 1st day) 3 =More than 24 hours (2nd day or after) 9 = Don’t know
Was [Name] breastfed yesterday (during day or night)? 0 = No 1= Yes
Was [Name] bottle-fed yesterday during day or night)?
[6-23 months] At what age (in months) was [Name] given any food/water other than breastmilk (exclude medicine)? (If child is <6 months, skip to 3.12)
[6-23 months] Yesterday during the day and night, how many times did [Name] eat solid or semi-solid foods other than breastmilk or liquids?

Sierra Leone National Nutrition Survey 2017 SLNNS 2017
V | P a g e
IYCF Questionnaire
To be conducted in every selected household with children 0-23.9 months. Some questions have special filters based on the age band of the child.
Date (DD/MM/YY): …../….…/………. Cluster No:……… Team No…… Region ……..………… District:………………… Chiefdom: ……………… Village:……………...…....
Now I would like to ask you [mother/caregiver of child] more about your [child name]
Identification IYCF (0 to 23 MONTHS)
3.1 3.2 3.3 3.4 3.5 3.6 3.7 3.8 3.9 3.10 3.11
Child No. (ID)
HH No.
Child Name
Sex M= Male F= Female
Age in months (0-23 months)
[0-23 months] Has [NAME] ever been breastfed? 0 = No 1= Yes (If No, skip to 3.10)
How long after birth did you first put [NAME] to the breast? 1 = Less than one hour 2 = Between 0 and 24 hours (within the 1st day) 3 =More than 24 hours (2nd day or after) 9 = Don’t know
Was [Name] breastfed yesterday (during day or night)? 0 = No 1= Yes
Was [Name] bottle-fed yesterday during day or night)?
[6-23 months] At what age (in months) was [Name] given any food/water other than breastmilk (exclude medicine)? (If child is <6 months, skip to 3.12)
[6-23 months] Yesterday during the day and night, how many times did [Name] eat solid or semi-solid foods other than breastmilk or liquids?

Sierra Leone National Nutrition Survey 2017 SLNNS 2017
VI | P a g e
3.11.1 3.11.2 3.11.3 3.11.4 3.11.5 3.11.6 3.12 3.13.1 3.13.2 3.13.3 3.13.4 3.13.5 3.13.6
3.11 [If child is 6-23 months]
Yesterday, during the day or at night, did [NAME] eat foods from any of the following food groups?
3.12
3.13 [If child is 0-5 months]
Yesterday, during the day or at night, did [NAME] receive any of the following liquids?
Child No. (ID)
Cereals, roots and tubers (e.g. rice, potatoes, cassava, pasta, plantain, maize, etc)? 0 = No 1= Yes 9 = Don’t know
Legumes, pulses and nuts (such as beans, peas, groundnuts, etc)? 0 = No 1= Yes 9 = Don’t know
Dairy products (such as milk, yoghurt, cheese, etc, excluding breastmilk)? 0 = No 1= Yes 9 = Don’t know
Meat, poultry and fish (e.g. chicken, eggs, fish, and other meats)? 0 = No 1= Yes 9 = Don’t know
Vitamin A-rich fruits and vegetables (e.g. carrots, pumpkin, mangoes, pawpaw, etc)? 0 = No 1= Yes 9 = Don’t know
Other fruits and vegetables? 0 = No 1= Yes 9 = Don’t know
[If child is 0-5 months] Was [Name] fed on colostrum at birth (yellow liquid milk from the first breastmilk) [local name]? 0 = No 1= Yes
Plain water 0 = No 1= Yes 9= Don’t know
Infant formula such as Lactogen, Peak milk or Nido)? No of times? (Put 0 for no/none)
Milk such as tinned, powdered, or fresh animal milk (No of times)? (Put 0 for no/none)
Juice or juice drinks (e.g. rice water, coconut water, palm wine/poyo or other fruit drinks)? 0 = No 1= Yes 9 = Don’t know
Any other liquids such as sugar water, ORS, porridge or soup/broth 0 = No 1= Yes 9 = Don’t know
Any solid or mashed food? 0 = No 1= Yes 9 = Don’t know
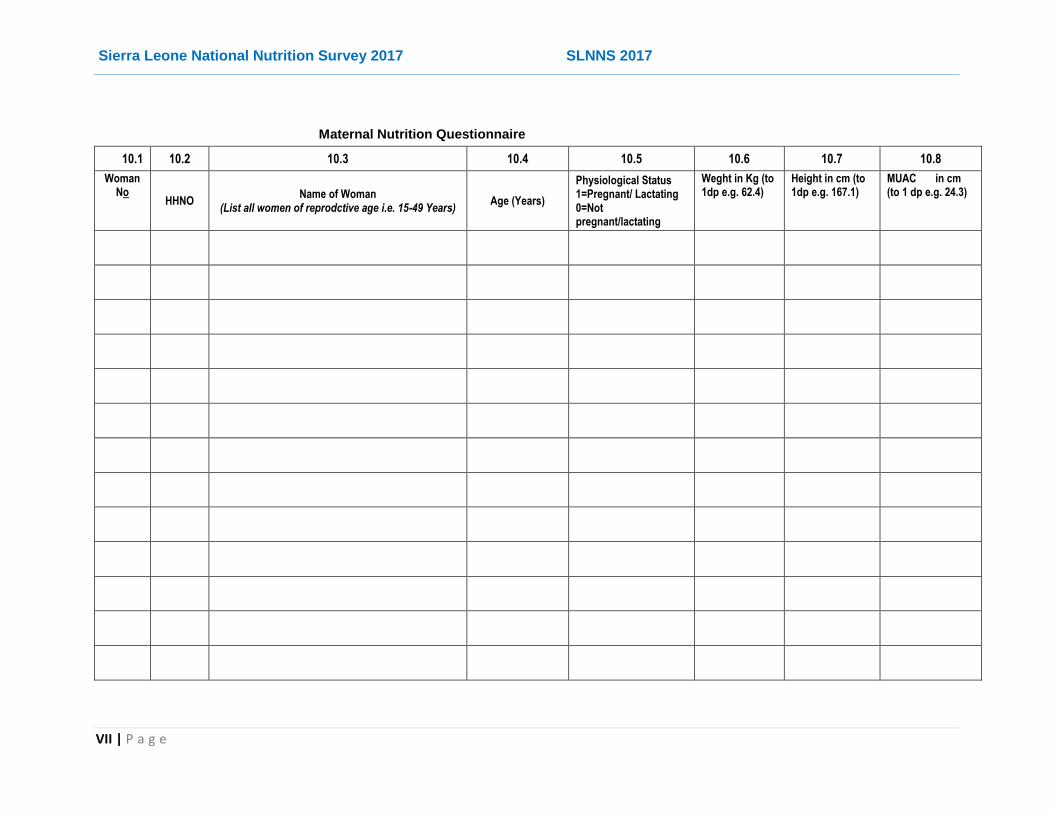
Sierra Leone National Nutrition Survey 2017 SLNNS 2017
VII | P a g e
Maternal Nutrition Questionnaire
10.1 10.2 10.3 10.4 10.5 10.6 10.7 10.8
Woman No
HHNO Name of Woman
(List all women of reprodctive age i.e. 15-49 Years) Age (Years)
Physiological Status 1=Pregnant/ Lactating 0=Not pregnant/lactating
Weght in Kg (to 1dp e.g. 62.4)
Height in cm (to 1dp e.g. 167.1)
MUAC in cm (to 1 dp e.g. 24.3)

Sierra Leone National Nutrition Survey 2017 SLNNS 2017
VIII | P a g e
MDD-W Questionnaire
Yesterday, during the day or at night, did you (woman) eat foods from any of the following food groups? [0=No 1=Yes]
11.1 11.2 11.3 11.4 11.5 11.6 11.7 11.8 11.9 11.10 11.11 11.12 11.13 11.4 11.5 11.16
A B C D E F G H I J K L M N U V
Wo
man
No
.
HH
NO
.
Foods from grains (e.g. Porridge, bread, rice, pasta/noodles, maize, millet, sorghum or other foods made from grains)
White roots/tubers and plantains (e.g. White potatoes, white yams, cassava, arrow roots or any other foods made from white-fleshed roots or tubers, or plantains
Pulses (beans, soybean, peas, lentils, green grams, etc)
Nuts & seeds (groundnut, peanut, cashewnut, sesame, etc)
Milk & milk products (milk, yoghurt, cheese, etc)
Organ meat (liver, kidney, heart, gizzard,etc)
Meat & Poutry (beef, goat, pork, chicken, game meat, etc)
Fish & Sea foods (e.g. baracuda, lobster, crayfish and crabs etc)
Eggs Dark green leafy vegetables (e.g. cassava leaves, pumpkin leaves, potato leaves, amaranth, kales, spinach, etc)
Vitamin A-rich vegetables, roots & tubers (yellow or orange coloured - e.g pumpkin, carrots, sweet potatoes, squash, red pepper, etc)
L=Vitamin A-rich (yellow or orange fleshed) fruits (e.g. papaya, mango, red palm, passion fruit, apricot, etc)
Other vegetables (e.g cucumber, tomatoes, onions, cauliflower, cabbages, green peas mushroom, etc)
Other fruits (e.g. sweet bananas, apple, avocado, black berry, pineaple, orange,
Condiments & seasonings (chillies, spices,herbs, tomato sauce/paste, flavour cubes)
Other beverages (unsweetened tea/coffee, pickles, clear broth, alcohol, etc).

Sierra Leone National Nutrition Survey 2017 SLNNS 2017
IX | P a g e
Annex C: Demography & Mortality Questionnaires
DEMOGRAPHY & MORTALITY QUESTIONNAIRE
(To be conducted in EVERY SELECTED HH in the Cluster)
Region ……..…………………...… District:……………………….…… Chiefdom: ……………………..… Village: …………..………… GPS: ……… …………
Date (DD/MM/YY): …..../…..…/…….……. Cluster No: ………...… Team No: ………
Administer the questions in the following order, filling out the details as required a) List all the persons that slept in this household last night. b) List all the people that slept in this household on the first night of the recall period (FILL IN DATE/EVENT) but did NOT sleep in the household last night. c) List all the people that slept in this household on the first night of the recall period but have since died.
9.1 9.2 9.3 9.4 9.5 9.6 9.7 9.8 9.10 9.11 9.12
HHNO PNO Name of person Sex m = Male f = Female
Age in completed years (e.g. child of 10 months write age as "0", and if 59 months, age is "4")
Joined on or after [Recall Date]? y=yes (if not, skip to next Qn)
Left on or after [Recall Date]? y=yes (if not, skip to next Qn
Born on or after [Recall Date]? y=yes (if not, skip to next Qn
Died on or after [Recall Date]? y=yes (if not, skip to next Qn
If yes in Qn 9.9) What was the cause of death? 1=Uknown 2=Injuries 3=Sickness/illness
If yes in Qn 9.9) What was the location of death? 1=Current location 2=During migration 3=In the place of last residence
1 1
2
3
4

Sierra Leone National Nutrition Survey 2017 SLNNS 2017
X | P a g e
Annex D: Sample of Local Events Calendar
Month Events per month and per year
Season 2012 2013 2014 2015 2016 2017
January NY (1st )
56 NY (1st ) 6th Rebels
44 NY (1st)
32 NY (1st )
20 NY (1st )
8
February Dry Valentine 55 14th 43 14th 31 19 7
March 54 42 30 Easter 18 6
April Independence Day
53 Independence Day
41 Independence Day
29 Independence Day
17 Independence Day (27th) Easter
5
May Bob Marley’s Night (11th)
52 Ebola Outbreak 23rd )
40 Bob Marley’s Night (11th)
28 Bob Marley’s Night (11th)
16 Bob Marley’s Night (11th)
4
June African Child (16th)
51 African Child (16th)
39 African Child (16th)
27 African Child (16th) 15 African Child (16th) Eidul Fitr (25th)
3
July Rainy 50 38 26 14 2
August BF Week (1-7th) 49 BF Week (1-7th) 37 BF Week (1-7th) 25 BF Week (1-7th) 13 BF Week (1-7th) FT landslide (14th)
1
September 48 36 24 1st Flooding in Freetown (16th)
12 0
October 59 47 35 23 11
November Dry 58 MCHWeek 46 MCH Week 34 MCH Week 22 10
December Xmas; Boxing
57 45 33 21 9

Sierra Leone National Nutrition Survey 2017 SLNNS 2017
XI | P a g e
Annex E: List of Survey Team Members
National Nutrition Survey 2017 Coordination Team
Names Sex Designation Email Addresses
Tom J. Oguta M Coordinator [email protected]
Mutiva Kappia F Coordinator [email protected]
Wango Rose Lahai F Coordinator [email protected]
Mumin Kallon M Coordinator [email protected]
Zainab Mansaray F Coordinator [email protected]
Survey Team Members and Roles/Responsibilities
Team 1
Name Sex Role/Responsibility Telephone Number
James Ponga Moriba F Supervisor 076810410
Prince J.S.Walters M Team Leader 076143831
James Abduali Koroma M Measurer 076684132/077677919
Hannah Sessie F Assistant Measurer 079653689
Team 2
Motiva Kappiah F Supervisor 076791969
Hammed B. karbo M Team Leader 076671066
Juliette M. Mansaray F Measurer 076846222
Alimamy R. Wurrie M Assistant Measurer 076604327
Team 3
Kadie Y. Kandeh F Supervisor 078818695
Muctarr Sherif M Team Leader 078336324
Harold Stevens M Measurer 078360456
Maimunata K.Massaquoi F Assistant Measurer 79688644/088127371
Team 4
Mary Kandiatu Koroma F Supervisor 76856556
Paul S. Mansaray M Team Leader 78652609
Marcus B. koroma M Measurer 79268678
Zainab M. Kamara F Assistant Measurer 8466801
Team 5
Foday Abdulai Sesay M Supervisor 78750777
Collins G. Vandy M Team Leader 78510745
Emmanuel M. Tucker M Measurer 078264218/077288761
Bintu Jabbie F Assistant Measurer 076828566/077836998
Team 6
Mariama M.S. Margai F Supervisor 78499945
Max James Yanguba M Team Leader 78258912
Mohamed Sannoh M Measurer 079444848/088385466
John Boima M Assistant Measurer 78963831
Team 7
Wango Rose Lahai F Supervisor 076679043
Alfred S. Walters M Team Leader 076588822
Francis Boima M Measurer 076221594/077791949
Fodie U.K. Dabor M Assistant Measurer 076221594
Team 8
Janeba S. Kamara F Supervisor 076720716
David Suale M Team Leader 076574642
Benjamin Tommy M Measurer 030317650
Michael Thomas M Assistant Measurer 076387401
Team 9
Bernadette Allieu F Supervisor 078331847
Fredrick I. Ngebeh M Team Leader 079953232
Francis Massalaly M Measurer 077565785
Ramatulai Isata Bah F Assistant Measurer 079741124

Sierra Leone National Nutrition Survey 2017 SLNNS 2017
XII | P a g e
Team 10
Mohamed Ahbibu Kamara M Supervisor 076344375
Mohamed I. Kamara M Team Leader 076337018/077292365
Ishmael. F. Kamara M Measurer 076188518
Peter Andrew Momodu M Assistant Measurer 079801380
Team 11
Ansuman Sandy M Supervisor 078281883/ 077818883
Osman momoh Kamara M Team Leader 078871980
Yeanoh Hannah Samura F Measurer 078912779
Samuel S. Brima M Assistant Measurer 078437024
Team 12
Sulaiman Massaquoi M Supervisor 078479131
Julian Suale M Team Leader 079011064
Agnes Veronica Tucker F Measurer 088972836
Harrieta Fatu Alpha F Assistant Measurer 076194664
Team 13
James S. Ngebeh M Supervisor 076137591/030397387
Boima S. Koroma M Team Leader 076735652
Kasia P.B. Massaquoi F Measurer 079991399
Ishmeal A.F.Kamara M Assistant Measurer 078366050
Team 14
Kadiatu Y. Fofanah F Supervisor 076713248
Sia Kema Serah Kaku F Team Leader 076677086
Sorrie Samura M Measurer 078917299
Alfred C. bangura M Assistant Measurer 078039773
Team 15
Alhaji S. Hemoh M Supervisor 078244441
Alhaji Salaam Fofanah M Team Leader 076677024/077594324
Francis Tommy M Measurer 079466126
Nabieu M. Konneh M Assistant Measurer 079058081/077407924
Team 16
Nancy S. Njavombo F Supervisor 076617833
Minkailu M.M. Massaquoi M Team Leader 079100384
Peter Sorie Kamara M Measurer 088365783
Abdulrahim Sherif M Assistant Measurer 079634942
Team 17
Mawonday Marrah M Supervisor 076719610
Leelei Cecilia Taluva F Team Leader 076182024
Sheikh Alhaji Kamara M Measurer 078659165
Aminata Winifred Bah F Assistant Measurer 076932711
LIST OF /NUTRITIONISTS/SUPERVISORS REPLACED BY DFN FOR WESTERN URBAN FOR THE 2017 NNS
# Names Replacements Designation
1 Mariam Margai Feimata Russel Supervisor
2 Mary Koroma Joycelyn Sialeh Supervisor
3 Foday A. Sesay Isata Konteh Supervisor
4 Kadie Y. Kandie Maraima Lahai Supervisor
5 Jeneba S. Kamara Sia Manyeh Supervisor
6 Kadiatu Y. Fofana Mania Lahai Supervisor
7 James Moriba Paul Lahai Supervisor

Sierra Leone National Nutrition Survey 2017 SLNNS 2017
XIII | P a g e
Annex F: Team Members Roles & Responsibilities
1. Enumerators (Usually person/staff involved in nutrition, food security and health):
Ensure that only the legible children and women are surveyed (6-59 months for anthropometry, 0-23 months for IYCF, and 15-49 years for women of reproductive age)
Administer mortality, anthropometry & health, IYCF, and Women nutrition questionnaires
Make accurate anthropometric measurements (including age, weight, height/length, oedema and MUAC)
Record the data and answers/responses in the tablet in specified forms/questionnaires
Ensure that all questions have been asked and answers recorded correctly before leaving each household
Carry and take good care of the anthropometric equipment and tools (including tablets) to each household
Submit the answered/completed questionnaires/forms under them to the supervisor in good order.
Report any problems/difficulties to the supervisor for direction/advise
2. Team Leaders (Usually experienced Agency or Ministry Staff)
If called upon, lead the team to consequent households selected for interview
Help introduce the team to each new household and obtain the necessary consent
Assist the enumerators note the correct household number to be recorded in the household questionnaire and mortality questionnaire for each visit.
Ensure that the household questionnaires (HDD, Shocks & CSI, and WASH) is administered and all questions answered and entered into the tablet before leaving each household and cluster
Help identify, verify and record oedema, measles and death cases
Ensure the safety of survey equipment and tools (especially the tablets) under their care/use
Ensure that good quality and reliable data is collected by their teams
3. Supervisors (Usually experienced Agency or Ministry Staff)
Help the team in demarcating/identifying their cluster boundaries
Explain to the village/ location leaders the purpose of the survey and the methods to be used – that children will be weighed, measured and caregivers interviewed, etc.
Facilitate the second stage of sampling households at each selected cluster/village – segmentation, and listing and selection of the households to be visited/ interviewed
Ensure their teams have all the necessary resources for each day. Ensure availability of survey equipment and tools (including the tablets) to their teams and their return after the survey

Sierra Leone National Nutrition Survey 2017 SLNNS 2017
XIV | P a g e
Ensure that at least the predetermined number of households were surveyed, and all questionnaires completed in each cluster.
Check and ensure that all anthropometric measurements were taken and entered correctly. Submit/send the finalized forms when and as required
Ensure that both household, mortality, child and women data/questionnaires are correctly and completely answered/recorded before leaving each cluster
Help verify, and record oedema, measles and death cases
Help the team in probing and obtaining accurate answers on sensitive matters like income, personal hygiene, etc
Ensure that good quality and reliable data is collected by their teams
Arrange for movement and transport of their teams during the survey
Identify and direct the team on cases that require follow up or revisits
Provides a daily summary and update of progress to the coordinators on the Cluster Control Form
4. Community Guides (should be a respected community member who knows the village)
Guide the survey team to the centre and edge of their clusters/ villages
Welcome and introduce the survey team to the population and households in their clusters (village areas)
Accompany the team and guide them through the right paths to the households visited

Sierra Leone National Nutrition Survey 2017 SLNNS 2017
XV | P a g e
Annex G: Referral Form
Child Name: _____________________________________________________________
Mother Name: __________________________________________________________
Age: _________________________
Sex: Female Male
Height: _______ cm
Weight: _______ kg
MUAC: _________ cm
Edema: Yes No
Village/Locality: _________________________ District: _________________________
Referral Center: _______________________ Opening Days: _________________________
Admission Criteria: __________________________ ________________________________
Supervisor: _____________________________ Sign _________________________________
Referral Form
This slip must be cut and filled by the teams when a child should be referred to a feeding/ health center for acute malnutrition
or any other health problem observed.
Child Name: _____________________________________________________________
Mother Name: __________________________________________________________
Age: _________________________
Sex: Female Male
Height: _______ cm
Weight: _______ kg
MUAC: _________ cm
Edema: Yes No
Village/Locality: _________________________ District: _________________________
Referral Center: _______________________ Opening Days: _________________________
Admission Criteria: __________________________ ________________________________
Supervisor: _____________________________ Sign _________________________________

Sierra Leone National Nutrition Survey 2017 SLNNS 2017
XVI | P a g e
Annex H: List of Selected EAs/Clusters NO EACODE PROVINCE DISTRICT CHIEFDOM SECTION
1 11010102 Eastern Kailahun Dea Baiwalla
2 11010407 Eastern Kailahun Dea Sienga
3 11020306 Eastern Kailahun Jawie Lower Giebu
4 11020606 Eastern Kailahun Jawie Sowa
5 11020629 Eastern Kailahun Jawie Sowa
6 11030104 Eastern Kailahun Kissi Kama Dakaleley
7 11030312 Eastern Kailahun Kissi Kama Kama Toh
8 11040207 Eastern Kailahun Kissi Teng Konio
9 11040415 Eastern Kailahun Kissi Teng Lela
10 11050201 Eastern Kailahun Kissi Tongi Lower Konio
11 11050402 Eastern Kailahun Kissi Tongi Lower Tongi Tingi
12 11050514 Eastern Kailahun Kissi Tongi Upper Konio
13 RC 11060106 Eastern Kailahun Kpeje Bongre Bongre
14 11060512 Eastern Kailahun Kpeje Bongre Manowa
15 RC 11070205 Eastern Kailahun Kpeje West Kimaya
16 11080105 Eastern Kailahun Luawa Baoma
17 11080302 Eastern Kailahun Luawa Gbela
18 RC 11080405 Eastern Kailahun Luawa Giehun
19 11080612 Eastern Kailahun Luawa Luawa Foguiya
20 11080638 Eastern Kailahun Luawa Luawa Foguiya
21 11080659 Eastern Kailahun Luawa Luawa Foguiya
22 11080804 Eastern Kailahun Luawa Mende Buima
23 11081014 Eastern Kailahun Luawa Upper Kpombali
24 11090207 Eastern Kailahun Malema Lower Sami
25 11090409 Eastern Kailahun Malema Pelegbambeima
26 11100107 Eastern Kailahun Mandu Gbongre
27 11100308 Eastern Kailahun Mandu Lower Kuiva
28 11100416 Eastern Kailahun Mandu Upper Kuiva
29 11110503 Eastern Kailahun Njaluahun Gboo
30 11110803 Eastern Kailahun Njaluahun Keimaya
31 11111012 Eastern Kailahun Njaluahun Sei I
32 11111205 Eastern Kailahun Njaluahun Upper Nyawa
33 11120405 Eastern Kailahun Penguia Lombama
34 11130105 Eastern Kailahun Upper Bambara Bambara
35 11130402 Eastern Kailahun Upper Bambara Golu
36 RC 11130616 Eastern Kailahun Upper Bambara Naiahun
37 11140210 Eastern Kailahun Yawei Kuiva Buima
38 12010106 Eastern Kenema Dama Dakowa
39 12010404 Eastern Kenema Dama Fowai
40 12020105 Eastern Kenema Dodo Bambara
41 12020704 Eastern Kenema Dodo Seiwor
42 12030502 Eastern Kenema Gaura Sandaru
43 12040120 Eastern Kenema Gorama Mende Biatong
44 12040307 Eastern Kenema Gorama Mende Kaklawa
45 12040424 Eastern Kenema Gorama Mende Kualley
46 12050404 Eastern Kenema Kandu Leppiama Sonnie
47 12060209 Eastern Kenema Koya Koya Gbundohun
48 12080106 Eastern Kenema Lower Bambara Bonya
49 12080134 Eastern Kenema Lower Bambara Bonya
50 12080220 Eastern Kenema Lower Bambara Fallay
51 12080508 Eastern Kenema Lower Bambara Korjei Ngieya
52 12080628 Eastern Kenema Lower Bambara Nyawa
53 12080712 Eastern Kenema Lower Bambara Sei
54 RC 12090503 Eastern Kenema Malegohun Konjo Yematanga
55 12110103 Eastern Kenema Nomo Faama
56 12120202 Eastern Kenema Nongowa Dakpana
57 12120508 Eastern Kenema Nongowa Kagbado Kamboima

Sierra Leone National Nutrition Survey 2017 SLNNS 2017
XVII | P a g e
58 RC 12120801 Eastern Kenema Nongowa Kona Kpindibu
59 12130105 Eastern Kenema Simbaru Bundoryama
60 RC 12130413 Eastern Kenema Simbaru Yalenga
61 12140303 Eastern Kenema Small Bo Kamboma
62 12140509 Eastern Kenema Small Bo Sowa
63 12150412 Eastern Kenema Tunkia Gorahun
64 12150705 Eastern Kenema Tunkia Taninahun
65 12160505 Eastern Kenema Wandor Songhai
66 12910217 Eastern Kenema Kenema City Gbo Kakajama A-Burma
67 12910406 Eastern Kenema Kenema City Gbo Kakajama A-Kpayama
68 RC 12910512 Eastern Kenema Kenema City Gbo Kakajama A-Lambayama
69 12910703 Eastern Kenema Kenema City Gbo Kakajama A-Njaguema
70 12910803 Eastern Kenema Kenema City Gbo Kakajama A-Shimbeck
71 12910820 Eastern Kenema Kenema City Gbo Kakajama A-Shimbeck
72 12910920 Eastern Kenema Kenema City Gbo Kakajama A-Technical/Gbongbotoh
73 12911006 Eastern Kenema Kenema City Gbo Kakajama A-Tilorma - Gbenderu
74 12911203 Eastern Kenema Kenema City Gbo Lambayama A-Gombu
75 12911319 Eastern Kenema Kenema City Gbo Lambayama A-Kondebotihun
76 RC 12911614 Eastern Kenema Kenema City Gbo Lambayama A-Nyandeyama
77 12911709 Eastern Kenema Kenema City Gbo Lambayama A-Reservation
78 13010204 Eastern Kono Fiama Fiama
79 13020105 Eastern Kono Gbane Gbane Yemao
80 13020504 Eastern Kono Gbane Mongo
81 13030203 Eastern Kono Gbane Kandor Gbane Kour
82 13040303 Eastern Kono Gbense Banyakor
83 RC 13050106 Eastern Kono Gorama Kono Bunabu
84 13060105 Eastern Kono Kamara Dangbaidu
85 13060312 Eastern Kono Kamara Kongofinja
86 13070406 Eastern Kono Lei Koaro
87 RC 13070807 Eastern Kono Lei Tankoro
88 13080304 Eastern Kono Mafindor Mafindor
89 13090213 Eastern Kono Nimikoro Bandafafeh
90 13090231 Eastern Kono Nimikoro Bandafafeh
91 RC 13090316 Eastern Kono Nimikoro Gbogboafeh
92 13090413 Eastern Kono Nimikoro Jaiama
93 13090504 Eastern Kono Nimikoro Masayiefeh
94 RC 13100205 Eastern Kono Nimiyama Njagbakahun
95 13100314 Eastern Kono Nimiyama Njaifeh
96 13110108 Eastern Kono Sandor Bafinfeh
97 13110205 Eastern Kono Sandor Dangbaidu
98 13110301 Eastern Kono Sandor Fakongofeh
99 13110501 Eastern Kono Sandor Njeikor
100 13110607 Eastern Kono Sandor Samgbafeh
101 13110813 Eastern Kono Sandor Sumunjifeh
102 13110921 Eastern Kono Sandor Yawatanda
103 13120210 Eastern Kono Soa Kokongokuma
104 13120505 Eastern Kono Soa Sawa Buma
105 13130103 Eastern Kono Tankoro Njama
106 13910102 Eastern Kono Koidu City Gbense-Moindefeh A
107 13910201 Eastern Kono Koidu City Gbense-Moindefeh B
108 13910314 Eastern Kono Koidu City Gbense-Moindekor
109 13910336 Eastern Kono Koidu City Gbense-Moindekor
110 13910355 Eastern Kono Koidu City Gbense-Moindekor
111 13910509 Eastern Kono Koidu City Gbense-Vaama
112 13910607 Eastern Kono Koidu City Tankoro-Kinsey
113 13910708 Eastern Kono Koidu City Tankoro-Koakoyima
114 13910803 Eastern Kono Koidu City Tankoro-Lebanon
115 13910911 Eastern Kono Koidu City Tankoro-New Sembehun
116 RC 13910923 Eastern Kono Koidu City Tankoro-New Sembehun

Sierra Leone National Nutrition Survey 2017 SLNNS 2017
XVIII | P a g e
117 13910940 Eastern Kono Koidu City Tankoro-New Sembehun
118 21010201 Northern Bombali Biriwa Kabakeh Balandugu
119 RC 21010409 Northern Bombali Biriwa Kamabai
120 21020101 Northern Bombali Bombali Sebora Kafala
121 21020219 Northern Bombali Bombali Sebora Kagbaran Dokom B
122 21020406 Northern Bombali Bombali Sebora Matotoka
123 21030703 Northern Bombali Gbanti Kamaranka Makulon
124 21040102 Northern Bombali Gbendembu Ngowahun Garanganwa
125 21040602 Northern Bombali Gbendembu Ngowahun Lohindie
126 21041502 Northern Bombali Gbendembu Ngowahun Matehun
127 21050901 Northern Bombali Libeisaygahun Masangalie
128 21070102 Northern Bombali Makari Gbanti Gborbana
129 21070215 Northern Bombali Makari Gbanti Mabanta
130 21070506 Northern Bombali Makari Gbanti Mankneh Bana
131 21070704 Northern Bombali Makari Gbanti Masongbo B
132 21070905 Northern Bombali Makari Gbanti Mina Gbanti
133 21071301 Northern Bombali Makari Gbanti Yainkassa
134 21080504 Northern Bombali Paki Masabong Masabong Pil
135 21090112 Northern Bombali Safroko Limba Binkolo
136 21090503 Northern Bombali Safroko Limba Kayassi
137 21100502 Northern Bombali Sanda Loko Kania
138 21101101 Northern Bombali Sanda Loko Makwie Loko
139 21110301 Northern Bombali Sanda Tendaran Marampa
140 21110801 Northern Bombali Sanda Tendaran Rosos
141 21120215 Northern Bombali Sella Limba Kamakwie
142 21120407 Northern Bombali Sella Limba Kayimbor
143 21120804 Northern Bombali Sella Limba Samia
144 21130403 Northern Bombali Tambakha Simibue
145 21910110 Northern Bombali Makeni City Banana Ward
146 21910223 Northern Bombali Makeni City Kagbaran Dokom A
147 RC 21910254 Northern Bombali Makeni City Kagbaran Dokom A
148 21910402 Northern Bombali Makeni City Maslasie Ward
149 21910523 Northern Bombali Makeni City Mayanka I Ward
150 RC 21910716 Northern Bombali Makeni City Rogbaneh Ward
151 21910807 Northern Bombali Makeni City Teko Ward
152 RC 21910912 Northern Bombali Makeni City Wusum Ward
153 22010603 Northern Kambia Bramaia Kabaya
154 22010801 Northern Kambia Bramaia Konta
155 22011008 Northern Kambia Bramaia Kukuna
156 22020404 Northern Kambia Gbinle Dixing Mafaray
157 22020704 Northern Kambia Gbinle Dixing Sanda
158 22030110 Northern Kambia Magbema Bombe
159 22030225 Northern Kambia Magbema Kamba
160 22030306 Northern Kambia Magbema Kambia
161 22030325 Northern Kambia Magbema Kambia
162 22030344 Northern Kambia Magbema Kambia
163 22030409 Northern Kambia Magbema Kargbulor
164 22030519 Northern Kambia Magbema Robat
165 22030541 Northern Kambia Magbema Robat
166 RC 22030622 Northern Kambia Magbema Rokupr
167 22040102 Northern Kambia Mambolo Kalenkay
168 22040302 Northern Kambia Mambolo Matetie
169 22040503 Northern Kambia Mambolo Robis
170 22040702 Northern Kambia Mambolo Rotain Bana
171 RC 22050203 Northern Kambia Masungbala Benna
172 22050601 Northern Kambia Masungbala Maserie
173 22051005 Northern Kambia Masungbala Samu
174 22060202 Northern Kambia Samu Kassiri
175 RC 22060304 Northern Kambia Samu Koya

Sierra Leone National Nutrition Survey 2017 SLNNS 2017
XIX | P a g e
176 22060601 Northern Kambia Samu Mafufuneh
177 22060801 Northern Kambia Samu Mange
178 22061003 Northern Kambia Samu Moribaia
179 22061208 Northern Kambia Samu Rosinor
180 22070113 Northern Kambia Tonko Limba Bubuya
181 22070207 Northern Kambia Tonko Limba Kamassassa
182 22070307 Northern Kambia Tonko Limba Kathanthineh
183 22070407 Northern Kambia Tonko Limba Magbonkoh
184 RC 22070606 Northern Kambia Tonko Limba Yebaya
185 23010501 Northern Koinadugu Dembelia-Sinkunia Mannah
186 RC 23010901 Northern Koinadugu Dembelia-Sinkunia Sinkunia II
187 23020114 Northern Koinadugu Diang Darakuru
188 RC 23020302 Northern Koinadugu Diang Kania
189 23020406 Northern Koinadugu Diang Kondembaia
190 23030203 Northern Koinadugu Folosaba Dembelia Dogoloya
191 23030712 Northern Koinadugu Folosaba Dembelia Kalia
192 23031202 Northern Koinadugu Folosaba Dembelia Sankan II
193 23040405 Northern Koinadugu Kasunko Kakallain
194 23040514 Northern Koinadugu Kasunko Kasunko
195 23041004 Northern Koinadugu Kasunko Tamiso II
196 23050209 Northern Koinadugu Mongo Lower Deldugu
197 23050409 Northern Koinadugu Mongo Mongo I
198 23050610 Northern Koinadugu Mongo Mongo III
199 RC 23050804 Northern Koinadugu Mongo Morifindugu II
200 RC 23060105 Northern Koinadugu Neya Kulor
201 23060401 Northern Koinadugu Neya Neya II
202 23060508 Northern Koinadugu Neya Nyedu
203 23060704 Northern Koinadugu Neya Upper Saradu
205 23070209 Northern Koinadugu Nieni Kalian
206 23070227 Northern Koinadugu Nieni Kalian
207 23070303 Northern Koinadugu Nieni Nieni
208 23070320 Northern Koinadugu Nieni Nieni
209 RC 23070405 Northern Koinadugu Nieni Seradu
210 23070422 Northern Koinadugu Nieni Seradu
211 23080106 Northern Koinadugu Sengbe Bendugu
212 23080406 Northern Koinadugu Sengbe Koinadugu
213 23080607 Northern Koinadugu Sengbe Upper Kamadugu
214 23080809 Northern Koinadugu Sengbe Yogomaia
215 23090401 Northern Koinadugu Sulima Falaba I
216 23090801 Northern Koinadugu Sulima Gberia-Timbako
217 23091101 Northern Koinadugu Sulima Koindu-Kura
218 23091801 Northern Koinadugu Sulima Sonkoya
219 23100201 Northern Koinadugu Wara Wara Bafodia Kadanso
220 23100602 Northern Koinadugu Wara Wara Bafodia Kambalia/Serekudo
221 23101301 Northern Koinadugu Wara Wara Bafodia Taelia
222 23110203 Northern Koinadugu Wara Wara Yagala Zone 2
223 23110318 Northern Koinadugu Wara Wara Yagala Zone 3
224 23110337 Northern Koinadugu Wara Wara Yagala Zone 3
225 23110403 Northern Koinadugu Wara Wara Yagala Zone 4
226 23110704 Northern Koinadugu Wara Wara Yagala Zone 7
227 24010801 Northern Port Loko Bureh Kasseh Makonteh Makana
228 24020102 Northern Port Loko Buya Romende Foredugu
229 24020501 Northern Port Loko Buya Romende Mabureh Mende
230 24030201 Northern Port Loko Dibia Kayembor
231 24040108 Northern Port Loko Kaffu Bullom Foronkoya
232 RC 24040132 Northern Port Loko Kaffu Bullom Foronkoya
233 24040224 Northern Port Loko Kaffu Bullom Kasongha
234 24040404 Northern Port Loko Kaffu Bullom Mahera
235 24040611 Northern Port Loko Kaffu Bullom Mayaya

Sierra Leone National Nutrition Survey 2017 SLNNS 2017
XX | P a g e
236 24040807 Northern Port Loko Kaffu Bullom Yongro
237 24050306 Northern Port Loko Koya Foredugu
238 24050805 Northern Port Loko Koya Mandoma
239 24051210 Northern Port Loko Koya Matheneh
240 24051508 Northern Port Loko Koya Robia
241 24060202 Northern Port Loko Lokomasama Gbainty
242 24060310 Northern Port Loko Lokomasama Kamasondo
243 24060707 Northern Port Loko Lokomasama Konta
244 24061404 Northern Port Loko Lokomasama Yurika
245 24070107 Northern Port Loko Maforki Batpolon
246 24070509 Northern Port Loko Maforki Gberray Morie
247 24071013 Northern Port Loko Maforki Kondato
248 RC 24071902 Northern Port Loko Maforki Mapolie
249 24072605 Northern Port Loko Maforki Romaka
250 24073002 Northern Port Loko Maforki Tauya
251 24080413 Northern Port Loko Marampa Marampa A
252 24080460 Northern Port Loko Marampa Marampa A
253 24080507 Northern Port Loko Marampa Mawullay
254 24090304 Northern Port Loko Masimera Katick
255 24090902 Northern Port Loko Masimera Nonkoba
256 RC 24100304 Northern Port Loko Sanda Magbolont Gbogbodo
257 24110303 Northern Port Loko TMS Kanu
258 RC 24111004 Northern Port Loko TMS Maron
259 25010304 Northern Tonkolili Gbonkolenken Mayeppoh
260 25010407 Northern Tonkolili Gbonkolenken Petifu Bana
261 25010707 Northern Tonkolili Gbonkolenken Upper Massakong
262 25010914 Northern Tonkolili Gbonkolenken Yele Manowo
263 25020101 Northern Tonkolili Kafe Simiria Kabaia
264 25020403 Northern Tonkolili Kafe Simiria Makelfa
265 RC 25020601 Northern Tonkolili Kafe Simiria Mayaso
266 25030211 Northern Tonkolili Kalansogoia Bumbuna
267 25030502 Northern Tonkolili Kalansogoia Kamakathie
268 25040204 Northern Tonkolili Kholifa Mabang Mabang
269 25050104 Northern Tonkolili Kholifa Rowala Bo Road
270 25050204 Northern Tonkolili Kholifa Rowala Lal-Lenken
271 25050233 Northern Tonkolili Kholifa Rowala Lal-Lenken
272 25050406 Northern Tonkolili Kholifa Rowala Mamuntha
273 RC 25050602 Northern Tonkolili Kholifa Rowala Mayossoh
274 25050715 Northern Tonkolili Kholifa Rowala Old Magburaka
275 25060210 Northern Tonkolili Kunike Barina Makong
276 25070103 Northern Tonkolili Kunike Masingbi
277 25070120 Northern Tonkolili Kunike Masingbi
278 25070313 Northern Tonkolili Kunike Sanda
279 25070509 Northern Tonkolili Kunike Thamah
280 25070613 Northern Tonkolili Kunike Thambaya
281 25070809 Northern Tonkolili Kunike Yenkeh
282 25080404 Northern Tonkolili Malal Mara Malal
283 25080806 Northern Tonkolili Malal Mara Rochen
284 RC 25090214 Northern Tonkolili Sambaya Buyan
285 25090413 Northern Tonkolili Sambaya Sambaya
286 25100403 Northern Tonkolili Tane Mapakie
287 25100609 Northern Tonkolili Tane Matotoka
288 25110105 Northern Tonkolili Yoni Foindu
289 25110215 Northern Tonkolili Yoni Gaindema
290 25110237 Northern Tonkolili Yoni Gaindema
291 25110262 Northern Tonkolili Yoni Gaindema
292 25110419 Northern Tonkolili Yoni Makeni Rokefula
293 25110709 Northern Tonkolili Yoni Mamaka
294 25110908 Northern Tonkolili Yoni Mayira

Sierra Leone National Nutrition Survey 2017 SLNNS 2017
XXI | P a g e
295 RC 25111107 Northern Tonkolili Yoni Ronietta
296 25111217 Northern Tonkolili Yoni Yoni
297 31010102 Southern Bo Badjia Damai
298 31020307 Southern Bo Bagbo Jimmi
299 31020706 Southern Bo Bagbo Tissana
300 31030405 Southern Bo Bagbwe(Bagbe) Nyallay
301 31040122 Southern Bo Boama Bambawo
302 31040503 Southern Bo Boama Mawojeh
303 RC 31040806 Southern Bo Boama Upper Pataloo
304 31050401 Southern Bo Bumpe Ngao Kpetema
305 31050709 Southern Bo Bumpe Ngao Sewama
306 31051002 Southern Bo Bumpe Ngao Yengema
307 31070301 Southern Bo Jaiama Bongor Lower Niawa
308 31070704 Southern Bo Jaiama Bongor Upper Kama
309 31080401 Southern Bo Kakua Nyallay
310 31080620 Southern Bo Kakua Samamie
311 RC 31080805 Southern Bo Kakua Sindeh
312 31100104 Southern Bo Lugbu Gao
313 31100401 Southern Bo Lugbu Kemoh
314 RC 31110304 Southern Bo Niawa Lenga Upper Niawa
315 31130401 Southern Bo Tikonko Ngolamajie
316 31130704 Southern Bo Tikonko Seiwa
317 31130727 Southern Bo Tikonko Seiwa
318 31140110 Southern Bo Valunia Deilenga
319 31140317 Southern Bo Valunia Lunia
320 31150203 Southern Bo Wonde Lower Kargoi
321 31910214 Southern Bo Bo Town East Ward-Bumpeh-Wo - Torkpoi Town
322 31910419 Southern Bo Bo Town East Ward-Kindia Town-Yimoh Town
323 31910611 Southern Bo Bo Town East Ward-Manjama – Shellmingo
324 RC 31910906 Southern Bo Bo Town East Ward-Moriba Town-New site
325 31911011 Southern Bo Bo Town North Ward-Bo Number Two-Borborkombo
326 31911211 Southern Bo Bo Town North Ward-Kissy Town-Samamie
327 31911504 Southern Bo Bo Town North Ward-Reservation II
328 31911807 Southern Bo Bo Town West Ward-Moriba Town - Sewa Road
329 31911908 Southern Bo Bo Town West Ward-Nikibu - Bo School
330 32010101 Southern Bonthe Bendu-Cha Gba-Cha
331 32010403 Southern Bonthe Bendu-Cha Yallan-gbokie
332 32020301 Southern Bonthe Bum Gbondubum
333 32020404 Southern Bonthe Bum Koimato
334 RC 32020509 Southern Bonthe Bum Lanje
335 32020707 Southern Bonthe Bum Torma
336 32020904 Southern Bonthe Bum Yawma
337 32030203 Southern Bonthe Dema Dema
338 32040102 Southern Bonthe Imperri Babum
339 32040109 Southern Bonthe Imperri Babum
340 32040119 Southern Bonthe Imperri Babum
341 32040130 Southern Bonthe Imperri Babum
342 32040301 Southern Bonthe Imperri Bigo
343 32040312 Southern Bonthe Imperri Bigo
344 32040507 Southern Bonthe Imperri Moimaligie
345 RC 32050105 Southern Bonthe Jong Basiaka
346 32050209 Southern Bonthe Jong Bayengbe
347 32050220 Southern Bonthe Jong Bayengbe
348 RC 32050307 Southern Bonthe Jong Beyinga
349 32050501 Southern Bonthe Jong Kumabeh-Kwe
350 32050607 Southern Bonthe Jong Landi-Ngere
351 RC 32050707 Southern Bonthe Jong Sopan-Cleveland
352 32060301 Southern Bonthe Kpanda Kemo Gbonge
353 32060601 Southern Bonthe Kpanda Kemo Taokunor

Sierra Leone National Nutrition Survey 2017 SLNNS 2017
XXII | P a g e
354 32070302 Southern Bonthe Kwamebai Krim Massa Settie
355 32070603 Southern Bonthe Kwamebai Krim Tun-Tun Sullay
356 32080202 Southern Bonthe Nongoba Bullom Bohol
357 32080602 Southern Bonthe Nongoba Bullom Gbap
358 32081001 Southern Bonthe Nongoba Bullom Pelewahun
359 32081304 Southern Bonthe Nongoba Bullom Torma Subu
360 32090204 Southern Bonthe Sittia Gonoh
361 32090501 Southern Bonthe Sittia Moh
362 32090806 Southern Bonthe Sittia Sahaya
363 32100202 Southern Bonthe Sogbeni Beyorgboh
364 32100404 Southern Bonthe Sogbeni Pengor
365 32110302 Southern Bonthe Yawbeko Kataway
366 32910105 Southern Bonthe Bonthe Urban Bonthe Town
367 33010106 Southern Moyamba Bagruwa Benduma
368 33010503 Southern Moyamba Bagruwa Mani
369 33010904 Southern Moyamba Bagruwa Sembehun
370 33020302 Southern Moyamba Bumpeh Greema
371 33020506 Southern Moyamba Bumpeh Mamu
372 33020902 Southern Moyamba Bumpeh Motobon
373 RC 33021306 Southern Moyamba Bumpeh Yengessa
374 33030901 Southern Moyamba Dasse Semabu
375 33040302 Southern Moyamba Fakunya Kovella
376 33040705 Southern Moyamba Fakunya Njawa
377 33041005 Southern Moyamba Fakunya To – Ndambalenga
378 33050304 Southern Moyamba Kagboro Bumpetoke
379 33051002 Southern Moyamba Kagboro Mokandor
380 33051804 Southern Moyamba Kagboro Tassor
381 33052105 Southern Moyamba Kagboro Youndu
382 33060205 Southern Moyamba Kaiyamba Koromboya
383 33060304 Southern Moyamba Kaiyamba Kpange
384 33060609 Southern Moyamba Kaiyamba Mosoe
385 33070603 Southern Moyamba Kamajei Tawovehun
386 33080603 Southern Moyamba Kongbora Mosongla/Lawana
387 33090210 Southern Moyamba Kori Zone – 2
388 33090403 Southern Moyamba Kori Zone – 4
389 RC 33090708 Southern Moyamba Kori Zone – 7
390 33100503 Southern Moyamba Kowa Njagbahun
391 33110207 Southern Moyamba Lower Banta Gbangbatoke
392 RC 33110307 Southern Moyamba Lower Banta Largoh
393 33110604 Southern Moyamba Lower Banta Ndendemoya
394 33110903 Southern Moyamba Lower Banta Wulbange
395 RC 33120305 Southern Moyamba Ribbi Masanka
396 33120605 Southern Moyamba Ribbi Masarakulay
397 33120904 Southern Moyamba Ribbi Upper Ribbi
398 33130701 Southern Moyamba Timdale Mando
399 33140303 Southern Moyamba Upper Banta Kepay
400 34010207 Southern Pujehun Barri Fallay
401 34010307 Southern Pujehun Barri Jougba
402 34010702 Southern Pujehun Barri Sonjour I
403 34020101 Southern Pujehun Galliness Perri Bondor
404 34020404 Southern Pujehun Galliness Perri Gendema I
405 34020706 Southern Pujehun Galliness Perri Jakema II
406 34021006 Southern Pujehun Galliness Perri Kortugbu
407 34021304 Southern Pujehun Galliness Perri Pelegbulor
408 RC 34030308 Southern Pujehun Kpaka Jassende Ngoleima I
409 34030811 Southern Pujehun Kpaka Sarbah
410 34040301 Southern Pujehun Panga Kabonde Kabonde
411 34040503 Southern Pujehun Panga Kabonde Lower Kayiemba
412 34040610 Southern Pujehun Panga Kabonde Panga

Sierra Leone National Nutrition Survey 2017 SLNNS 2017
XXIII | P a g e
413 34040701 Southern Pujehun Panga Kabonde Pessekeh
414 RC 34040903 Southern Pujehun Panga Kabonde Setti - Yakanday
415 34050201 Southern Pujehun Makpele Samagbe
416 34050211 Southern Pujehun Makpele Samagbe
417 34050409 Southern Pujehun Makpele Selimeh
418 34060103 Southern Pujehun Malen Bahoin
419 34060302 Southern Pujehun Malen Kakpanda
420 RC 34060506 Southern Pujehun Malen Korwa
421 34060607 Southern Pujehun Malen Lower Pemba
422 34060902 Southern Pujehun Malen Upper Pemba
423 34070503 Southern Pujehun Mono Sakrim Pembaar
424 RC 34080302 Southern Pujehun Panga krim Samba
425 34090301 Southern Pujehun Pejeh(Futa peje Pejeh West
426 34100206 Southern Pujehun Soro Gbema Kemokai
427 34100501 Southern Pujehun Soro Gbema Massaquoi I
428 34100702 Southern Pujehun Soro Gbema Moiwebu
429 34100813 Southern Pujehun Soro Gbema Zoker I
430 34110204 Southern Pujehun Sowa Sabba I
431 34110408 Southern Pujehun Sowa Upper Geoma
432 34121002 Southern Pujehun Yakemu Kpukumu Seiwoh
433 41010101 Western W. A. Rural Koya Rural Fabaina Area
434 41010104 Western W. A. Rural Koya Rural Fabaina Area
435 41010201 Western W. A. Rural Koya Rural Madonkeh
436 41010203 Western W. A. Rural Koya Rural Madonkeh
437 41010302 Western W. A. Rural Koya Rural Magbafti
438 41010305 Western W. A. Rural Koya Rural Magbafti
439 41010308 Western W. A. Rural Koya Rural Magbafti
440 41010311 Western W. A. Rural Koya Rural Magbafti
441 41010466 Western W. A.Rural Koya Rural Malambay
442 41010468 Western W. A. Rural Koya Rural Malambay
443 41010469 Western W. A. Rural Koya Rural Malambay
444 RC 41010502 Western W. A. Rural Koya Rural Newton
445 41010520 Western W. A. Rural Koya Rural Newton
446 41010521 Western W. A. Rural Koya Rural Newton
447 41010601 Western W. A. Rural Koya Rural Songo
448 41010602 Western W. A. Rural Koya Rural Songo
449 41020201 Western W. A. Rural Mountain Rural Charlotte
450 41020531 Western W. A.Rural Mountain Rural Regent
451 41030101 Western W. A. Rural Waterloo Rural Deep Eye Water/Devil Hole
452 41030226 Western W. A. Rural Waterloo Rural Hastings-Yams Farm
453 41030402 Western W. A. Rural Waterloo Rural Rokel
454 41030542 Western W. A. Rural Waterloo Rural Waterloo Benguema
455 41030543 Western W. A. Rural Waterloo Rural Waterloo Benguema
456 41030601 Western W. A. Rural Waterloo Rural Waterlooo Campbell Town
457 41030661 Western W. A. Rural Waterloo Rural Waterlooo Campbell Town
458 41030701 Western W. A. Rural Waterloo Rural Waterloo Lumpa
459 41030760 Western W. A. Rural Waterloo Rural Waterloo Lumpa
460 41040215 Western W. A. Rural York Rural Goderich-Adonkia/Milton Margai
461 41040305 Western W. A. Rural York Rural Goderich-Funkia
462 41040324 Western W. A. Rural York Rural Goderich-Funkia
463 41040412 Western W. A. Rural York Rural Hamilton
464 41040413 Western W. A. Rural York Rural Hamilton
465 41040414 Western W. A. Rural York Rural Hamilton
466 41040415 Western W. A. Rural York Rural Hamilton
467 41040416 Western W. A. Rural York Rural Hamilton
468 41040504 Western W. A. Rural York Rural Kent
469 41040507 Western W. A. Rural York Rural Kent
470 41040508 Western W. A. Rural York Rural Kent
471 41040601 Western W. A. Rural York Rural Sattia/Tombo

Sierra Leone National Nutrition Survey 2017 SLNNS 2017
XXIV | P a g e
472 41040603 Western W. A. Rural York Rural Sattia/Tombo
473 41040604 Western W. A. Rural York Rural Sattia/Tombo
474 41040606 Western W. A. Rural York Rural Sattia/Tombo
475 41040608 Western W. A. Rural York Rural Sattia/Tombo
476 41040648 Western W. A. Rural York Rural Sattia/Tombo
477 41040701 Western W. A. Rural York Rural York
478 41040703 Western W. A. Rural York Rural York
479 42010206 Western W. A. Urban Central I Mountain Regent
480 42010409 Western W. A. Slums Central I Susan' s Bay
481 42010419 Western W. A. Slums Central I Susan' s Bay
482 42010430 Western W. A. Slums Central I Susan' s Bay
483 42010510 Western W. A. Urban Central I Tower Hill
484 42020115 Western W. A. Urban Central II Connaught Hospital
485 42030106 Western W. A. Slums East I Cline Town
486 42030113 Western W. A. Slums East I Cline Town
487 42030121 Western W. A. Slums East I Cline Town
488 42030127 Western W. A. Urban East I Cline Town
489 42030237 Western W. A. Urban East I Fourah Bay
490 42030307 Western W. A. Urban East I Kossoh Town
491 42040220 Western W. A. Urban East II Foulah Town
492 42040409 Western W. A. Urban East II Kissy Brook I
493 42040504 Western W. A. Urban East II Magazine
494 42040523 Western W. A. Urban East II Magazine
495 42050213 Western W. A. Urban East III Allen Town II
496 42050312 Western W. A. Slums East III Bottom Oku
497 42050504 Western W. A. Slums East III Congo Water II
498 42050602 Western W. A. Urban East III Grass Field
499 42050708 Western W. A. Urban East III Industrial Estate
500 42050906 Western W. A. Urban East III Kissy Brook II
501 42051006 Western W. A. Urban East III Kissy Bye Pass(Dock)
502 42051012 Western W. A. Urban East III Kissy Bye Pass(Dock)
503 42051029 Western W. A. Urban East III Kissy Bye Pass(Dock)
504 42051107 Western W. A. Urban East III Kissy Bye Pass(Term)
505 42051116 Western W. A. Urban East III Kissy Bye Pass(Term)
506 42051209 Western W. A. Urban East III Kissy Mental
507 42051510 Western W. A. Urban East III Lowcost Housing
508 42051807 Western W. A. Urban East III Mayenkineh
509 42051909 Western W. A. Urban East III Old Warf
510 42052010 Western W. A. Urban East III Pamuronko
511 42052023 Western W. A. Urban East III Pamuronko
512 42052108 Western W. A. Urban East III Portee
513 42052138 Western W. A. Urban East III Portee
514 42052304 Western W. A. Urban East III Rokupa
515 42052310 Western W. A. Urban East III Rokupa
516 42052421 Western W. A. Urban East III Shell
517 42060102 Western W. A. Urban West I Ascension Town
518 42060215 Western W. A. Urban West I Brookfields
519 42060308 Western W. A. Urban West I Kingtom
520 42060329 Western W. A. Urban West I Kingtom
521 42070128 Western W. A. Urban West II Brookfields-Congo
522 42070303 Western W. A. Urban West II CongoTown
523 42070309 Western W. A. Urban West II CongoTown
524 42070321 Western W. A. Urban West II CongoTown
525 42070427 Western W. A. Urban West II George Brook (Dwor
526 42070701 Western W. A. Urban West II Sumaila Town
527 42080110 Western W. A. Urban West III Aberdeen
528 42080124 Western W. A. Urban West III Aberdeen
529 42080205 Western W. A. Urban West III Cockerill-Aberdeen
530 42080314 Western W. A. Urban West III Cockle-Bay /Collegiate
Sierra Leone National Nutrition Survey 2017 SLNNS 2017
XXV | P a g e
531 42080341 Western W. A. Urban West III Cockle-Bay /Collegiate
532 42080351 Western W. A. Urban West III Cockle-Bay /Collegiate
533 42080430 Western W. A. Urban West III Hill Station
534 42080624 Western W. A. Urban West III Lumley
535 42080823 Western W. A. Urban West III Murray Town
536 42080838 Western W. A. Urban West III Murray Town
537 42081056 Western W. A. Urban West III Wilberforce

Sierra Leone National Nutrition Survey 2017 SLNNS 2017
XXVI | P a g e
10. REFERENCES
AUC/UNECA/WFP (2013), The Cost of Hunger in Africa: Social and Economic Impact of Child Undernutrition
Bhutta, Zulfiqar. A., Jai K Das, Arjumand Rizvi, Michelle FGaff ey, Neff Walker, Susan Horton, Patrick Webb, Anna Lartey, Robert E Black, he Lancet Nutrition Interventions Review Group, and the Maternal and Child Nutrition Study Group. 2013. Evidence-based interventions for improvement of maternal and child nutrition: what can be done and at what cost? Lancet 2013; 382: 452–77 http://www.thelancet.com/pdfs/journals/lancet/PIIS0140-6736 (13)60996-4.pdf (Accessed October 30, 2017).
Black RE, Victora CG, Walker SP et al (2013). ‘Maternal and Child Nutrition: Maternal and Child Undernutrition and Overweight in Low-income and Middle-income Countries’: The Lancet Series 382: 427–51.
Care (2010), Infant and Young Child Feeding Practices, Collecting and Using Data: A Step-by-Step guide.
FAO and FHI 360 (2016). Minimum Dietary Diversity for Women: A Guide for Measurement. Food and Agriculture Organization of the United Nations and USAID’s Food and Nutrition Technical Assistance III Project (FANTA). Rome: FAO.
GoSL/MoHS (2016). Annual Health Sector Performance Report 2016. Government of Sierra Leone Ministry of Health and Sanitation.
Ministry of Health and Sanitation Sierra Leone and UNICEF Sierra Leone ( 2014). Sierra Leone National Nutrition Survey 2014. Freetown, Sierra Leone.
Ministry of Health and Sanitation Sierra Leone and UNICEF Sierra Leone ( 2010). Sierra Leone National Nutrition Survey 2010. Freetown, Sierra Leone.
Onis, Mercedes de, Kathryn G. Dewey, Elaine Borghi, Adelheid W. Onyango, Monika Blössner, Bernadette Daelmans,‡ Ellen Piwoz§ and Francesco Branca. 2013. The World Health Organization’s Global Target for Reducing Childhood Stunting by 2025: Rationale and Proposed Actions Maternal and Child Nutrition (2013), 9 (Suppl. 2), pp. 6–26 http://www.cmamforum.org/pool/resources/who-globaltarget-for-reducing-childhood-stunting-by-2025-2013.pdf
Prendergast, Andrew J. and Jean H. Humphrey. 2014. “The Stunting Syndrome in Developing Countries”, Paediatrics and International Child Health, Vol. 34, No. 4, pp. 250-265. http://europepmc.org/backend/ptpmcrender.fcgi?accid=PMC4232245&blobtype=pdf.
SMART (2006). Measuring Mortality, Nutritional Status, and Food Security in Crisis Situations: SMART Methodology Retrieved from http://smartmethodology.org/survey-planning-tools/smart-methodology/smart-methodology-manual/

Sierra Leone National Nutrition Survey 2017 SLNNS 2017
XXVII | P a g e
SPHERE (2011). The Sphere Project: Humanitarian Charter and Minimum Standards in Humanitarian Response; U.K.
SL CFSVA (2015). The State of Food Security in Sierra Leone 2015. Comprehensive Food Security and Vulnerability Analysis (CFSVA). Ministry of Agriculture, Forestry and Food Security (MAFFS), the Food and Agriculture Organization (FAO) and the World Food Programme (WFP).
SSL (2016). Sierra Leone National Population and Housing Census 2015. Statistics Sierra Leone. A.J. Momoh Street Tower Hill Freetown.
SSL/ICFI (2014). ‘Sierra Leone Demographic and Health Survey 2013’; Statistics Sierra Leone and ICF International: Freetown, Sierra Leone and Rockville, Maryland, USA.
United Nations Children’s Fund (UNICEF). 2013. Improving Child Nutrition: The Achievable Imperative for Global Progress (April) http://www.childinfo.org/files/NutritionReport_April2013_Final.pdf (Accessed November 13, 2017).
Victora, Cesar Gomes, Mercedes de Onis, Pedro Curi Hallal, Monika Blossner, and Roger Shrimpton (2010). Timing of Growth Faltering: Revisiting Implications for Interventions. Pediatrics 125:e473–e480 https://www.researchgate.net/profile/Roger_Shrimpton/publication/41435284_Worldwide_Timing_of_ Growth_Faltering_Revisiting_Implications_for_Interventions/links/54876caa0cf289302e2edb32.pdf (Accessed November 2, 2017).
Victora CG, Adair L, Fall C, et al (2008). Maternal and child undernutrition: Consequences for Adult Health and Human Capital. The Lancet Series; 371: 340–57.
WFP (November 2015). CARI Technical Guidance Note (2nd edition). Consolidated Approach to Reporting Indicators of Food Security (CARI).
World Health Organization (2015). The International Classification of Diseases 11th revision. http://www.who.int/classifications/icd/revision/en/ (accessed December 17, 2017).
WHO (2010). Indicators for assessing infant and young child feeding practices; Part 2: Measurement. Geneva, Switzerland.
WHO/UNICEF (2010). ‘Joint Monitoring Programme for Water Supply and Sanitation and Drinking Water’; World Health Organization/United Nations Children’s Fund: Geneva, Switzerland.
WHO (2014). Comprehensive Implementation Plan on Maternal, Infant and Young Child Nutrition. World Health Organization. http://apps.who.int/iris/bitstream/10665/113048/1/WHO_NMH_NHD_14.1_eng.pdf (Accessed November 13, 2017)