Embed Size (px)
Citation preview
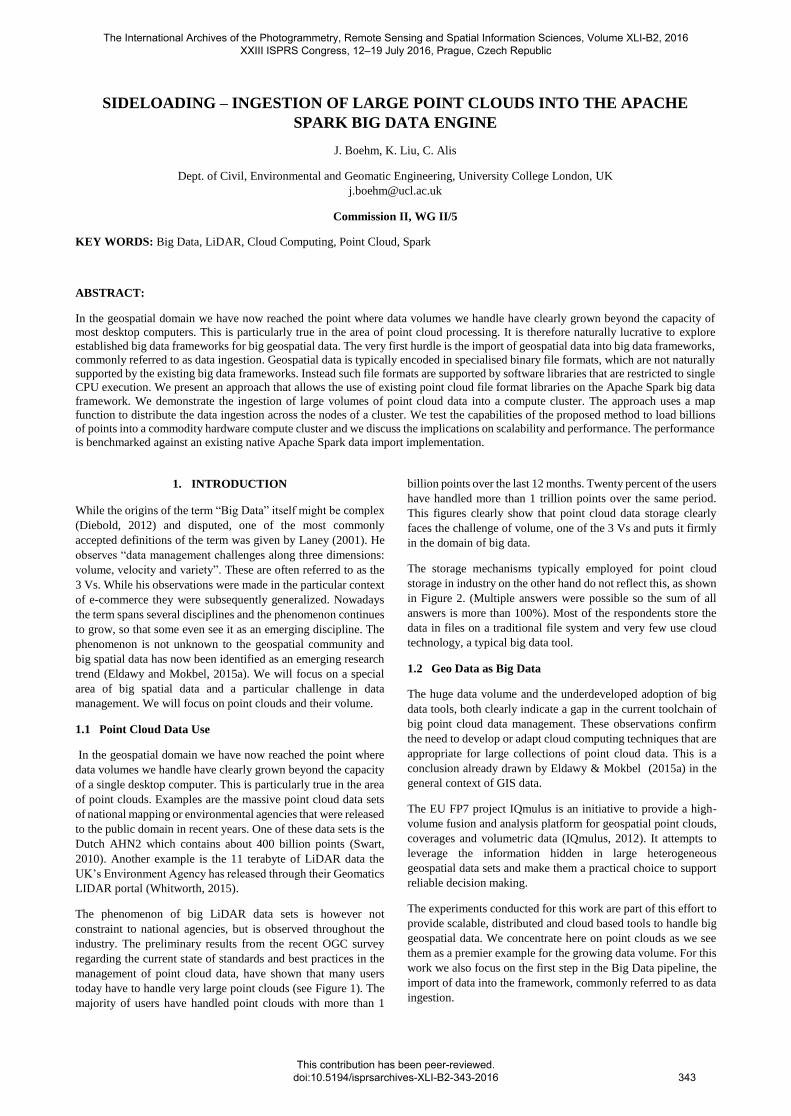
SIDELOADING – INGESTION OF LARGE POINT CLOUDS INTO THE APACHE
SPARK BIG DATA ENGINE
J. Boehm, K. Liu, C. Alis
Dept. of Civil, Environmental and Geomatic Engineering, University College London, UK
Commission II, WG II/5
KEY WORDS: Big Data, LiDAR, Cloud Computing, Point Cloud, Spark
ABSTRACT:
In the geospatial domain we have now reached the point where data volumes we handle have clearly grown beyond the capacity of
most desktop computers. This is particularly true in the area of point cloud processing. It is therefore naturally lucrative to explore
established big data frameworks for big geospatial data. The very first hurdle is the import of geospatial data into big data frameworks,
commonly referred to as data ingestion. Geospatial data is typically encoded in specialised binary file formats, which are not naturally
supported by the existing big data frameworks. Instead such file formats are supported by software libraries that are restricted to single
CPU execution. We present an approach that allows the use of existing point cloud file format libraries on the Apache Spark big data
framework. We demonstrate the ingestion of large volumes of point cloud data into a compute cluster. The approach uses a map
function to distribute the data ingestion across the nodes of a cluster. We test the capabilities of the proposed method to load billions
of points into a commodity hardware compute cluster and we discuss the implications on scalability and performance. The performance
is benchmarked against an existing native Apache Spark data import implementation.
1. INTRODUCTION
While the origins of the term “Big Data” itself might be complex
(Diebold, 2012) and disputed, one of the most commonly
accepted definitions of the term was given by Laney (2001). He
observes “data management challenges along three dimensions:
volume, velocity and variety”. These are often referred to as the
3 Vs. While his observations were made in the particular context
of e-commerce they were subsequently generalized. Nowadays
the term spans several disciplines and the phenomenon continues
to grow, so that some even see it as an emerging discipline. The
phenomenon is not unknown to the geospatial community and
big spatial data has now been identified as an emerging research
trend (Eldawy and Mokbel, 2015a). We will focus on a special
area of big spatial data and a particular challenge in data
management. We will focus on point clouds and their volume.
1.1 Point Cloud Data Use
In the geospatial domain we have now reached the point where
data volumes we handle have clearly grown beyond the capacity
of a single desktop computer. This is particularly true in the area
of point clouds. Examples are the massive point cloud data sets
of national mapping or environmental agencies that were released
to the public domain in recent years. One of these data sets is the
Dutch AHN2 which contains about 400 billion points (Swart,
2010). Another example is the 11 terabyte of LiDAR data the
UK’s Environment Agency has released through their Geomatics
LIDAR portal (Whitworth, 2015).
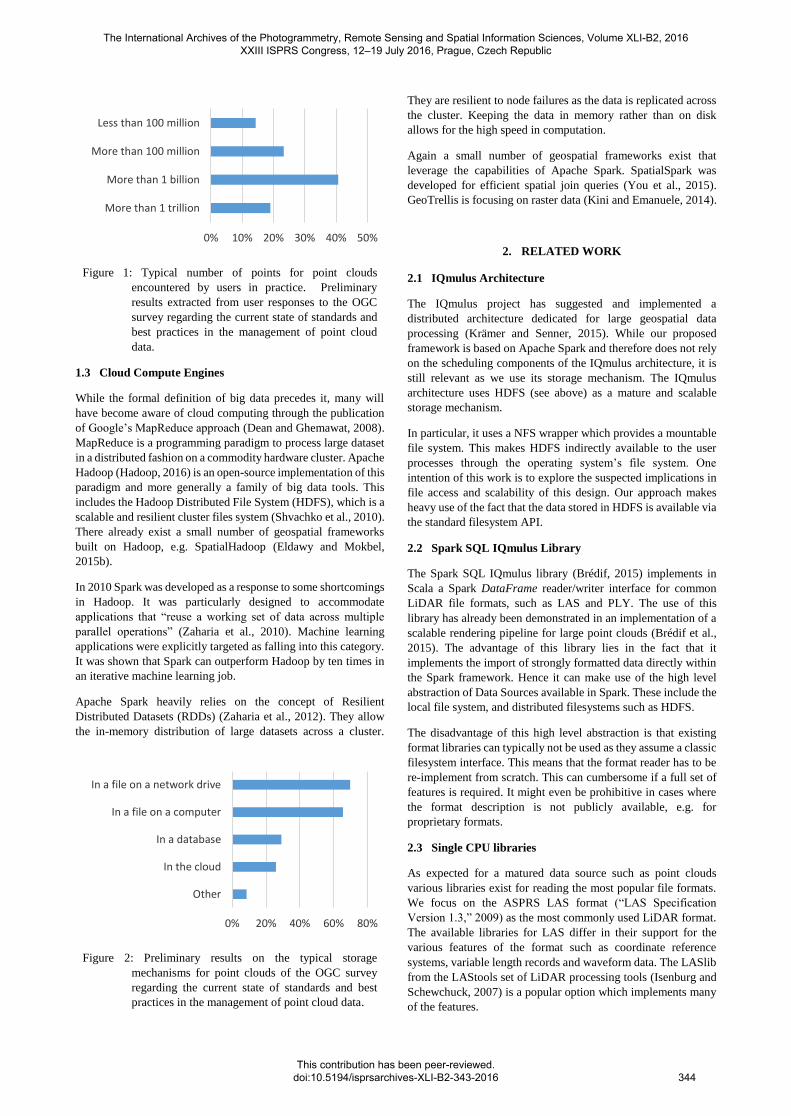
The phenomenon of big LiDAR data sets is however not
constraint to national agencies, but is observed throughout the
industry. The preliminary results from the recent OGC survey
regarding the current state of standards and best practices in the
management of point cloud data, have shown that many users
today have to handle very large point clouds (see Figure 1). The
majority of users have handled point clouds with more than 1
billion points over the last 12 months. Twenty percent of the users
have handled more than 1 trillion points over the same period.
This figures clearly show that point cloud data storage clearly
faces the challenge of volume, one of the 3 Vs and puts it firmly
in the domain of big data.
The storage mechanisms typically employed for point cloud
storage in industry on the other hand do not reflect this, as shown
in Figure 2. (Multiple answers were possible so the sum of all
answers is more than 100%). Most of the respondents store the
data in files on a traditional file system and very few use cloud
technology, a typical big data tool.
1.2 Geo Data as Big Data
The huge data volume and the underdeveloped adoption of big
data tools, both clearly indicate a gap in the current toolchain of
big point cloud data management. These observations confirm
the need to develop or adapt cloud computing techniques that are
appropriate for large collections of point cloud data. This is a
conclusion already drawn by Eldawy & Mokbel (2015a) in the
general context of GIS data.
The EU FP7 project IQmulus is an initiative to provide a high-
volume fusion and analysis platform for geospatial point clouds,
coverages and volumetric data (IQmulus, 2012). It attempts to
leverage the information hidden in large heterogeneous
geospatial data sets and make them a practical choice to support
reliable decision making.
The experiments conducted for this work are part of this effort to
provide scalable, distributed and cloud based tools to handle big
geospatial data. We concentrate here on point clouds as we see
them as a premier example for the growing data volume. For this
work we also focus on the first step in the Big Data pipeline, the
import of data into the framework, commonly referred to as data
ingestion.
The International Archives of the Photogrammetry, Remote Sensing and Spatial Information Sciences, Volume XLI-B2, 2016 XXIII ISPRS Congress, 12–19 July 2016, Prague, Czech Republic
This contribution has been peer-reviewed. doi:10.5194/isprsarchives-XLI-B2-343-2016
343
1.3 Cloud Compute Engines
While the formal definition of big data precedes it, many will
have become aware of cloud computing through the publication
of Google’s MapReduce approach (Dean and Ghemawat, 2008).
MapReduce is a programming paradigm to process large dataset
in a distributed fashion on a commodity hardware cluster. Apache
Hadoop (Hadoop, 2016) is an open-source implementation of this
paradigm and more generally a family of big data tools. This
includes the Hadoop Distributed File System (HDFS), which is a
scalable and resilient cluster files system (Shvachko et al., 2010).
There already exist a small number of geospatial frameworks
built on Hadoop, e.g. SpatialHadoop (Eldawy and Mokbel,
2015b).
In 2010 Spark was developed as a response to some shortcomings
in Hadoop. It was particularly designed to accommodate
applications that “reuse a working set of data across multiple
parallel operations” (Zaharia et al., 2010). Machine learning
applications were explicitly targeted as falling into this category.
It was shown that Spark can outperform Hadoop by ten times in
an iterative machine learning job.
Apache Spark heavily relies on the concept of Resilient
Distributed Datasets (RDDs) (Zaharia et al., 2012). They allow
the in-memory distribution of large datasets across a cluster.
They are resilient to node failures as the data is replicated across
the cluster. Keeping the data in memory rather than on disk
allows for the high speed in computation.
Again a small number of geospatial frameworks exist that
leverage the capabilities of Apache Spark. SpatialSpark was
developed for efficient spatial join queries (You et al., 2015).
GeoTrellis is focusing on raster data (Kini and Emanuele, 2014).
2. RELATED WORK
2.1 IQmulus Architecture
The IQmulus project has suggested and implemented a
distributed architecture dedicated for large geospatial data
processing (Krämer and Senner, 2015). While our proposed
framework is based on Apache Spark and therefore does not rely
on the scheduling components of the IQmulus architecture, it is
still relevant as we use its storage mechanism. The IQmulus
architecture uses HDFS (see above) as a mature and scalable
storage mechanism.
In particular, it uses a NFS wrapper which provides a mountable
file system. This makes HDFS indirectly available to the user
processes through the operating system’s file system. One
intention of this work is to explore the suspected implications in
file access and scalability of this design. Our approach makes
heavy use of the fact that the data stored in HDFS is available via
the standard filesystem API.
2.2 Spark SQL IQmulus Library
The Spark SQL IQmulus library (Brédif, 2015) implements in
Scala a Spark DataFrame reader/writer interface for common
LiDAR file formats, such as LAS and PLY. The use of this
library has already been demonstrated in an implementation of a
scalable rendering pipeline for large point clouds (Brédif et al.,
2015). The advantage of this library lies in the fact that it
implements the import of strongly formatted data directly within
the Spark framework. Hence it can make use of the high level
abstraction of Data Sources available in Spark. These include the
local file system, and distributed filesystems such as HDFS.
The disadvantage of this high level abstraction is that existing
format libraries can typically not be used as they assume a classic
filesystem interface. This means that the format reader has to be
re-implement from scratch. This can cumbersome if a full set of
features is required. It might even be prohibitive in cases where
the format description is not publicly available, e.g. for
proprietary formats.
2.3 Single CPU libraries
As expected for a matured data source such as point clouds
various libraries exist for reading the most popular file formats.
We focus on the ASPRS LAS format (“LAS Specification
Version 1.3,” 2009) as the most commonly used LiDAR format.
The available libraries for LAS differ in their support for the
various features of the format such as coordinate reference
systems, variable length records and waveform data. The LASlib
from the LAStools set of LiDAR processing tools (Isenburg and
Schewchuck, 2007) is a popular option which implements many
of the features.
Figure 1: Typical number of points for point clouds
encountered by users in practice. Preliminary
results extracted from user responses to the OGC
survey regarding the current state of standards and
best practices in the management of point cloud
data.
Figure 2: Preliminary results on the typical storage
mechanisms for point clouds of the OGC survey
regarding the current state of standards and best
practices in the management of point cloud data.
0% 10% 20% 30% 40% 50%
Less than 100 million
More than 100 million
More than 1 billion
More than 1 trillion
0% 20% 40% 60% 80%
In a file on a network drive
In a file on a computer
In a database
In the cloud
Other
The International Archives of the Photogrammetry, Remote Sensing and Spatial Information Sciences, Volume XLI-B2, 2016 XXIII ISPRS Congress, 12–19 July 2016, Prague, Czech Republic
This contribution has been peer-reviewed. doi:10.5194/isprsarchives-XLI-B2-343-2016
344
The liblas library (Butler et al., 2011, 2011) is another C/C++
library for reading and writing LAS files. It also provides a
Python interface. The source code of liblas is available under the
terms of the BSD license. It assumes a local filesystem API for
file access and allows reading a LAS file record by record.
Laspy is a pure Python implementation for the LAS format
(Brown, 2012). It uses memory-mapped files to accelerate
access. While this has significant performance advantages in
some cases we have also experienced problematic behaviour with
this library in a cluster environment.
3. PROPOSED METHOD
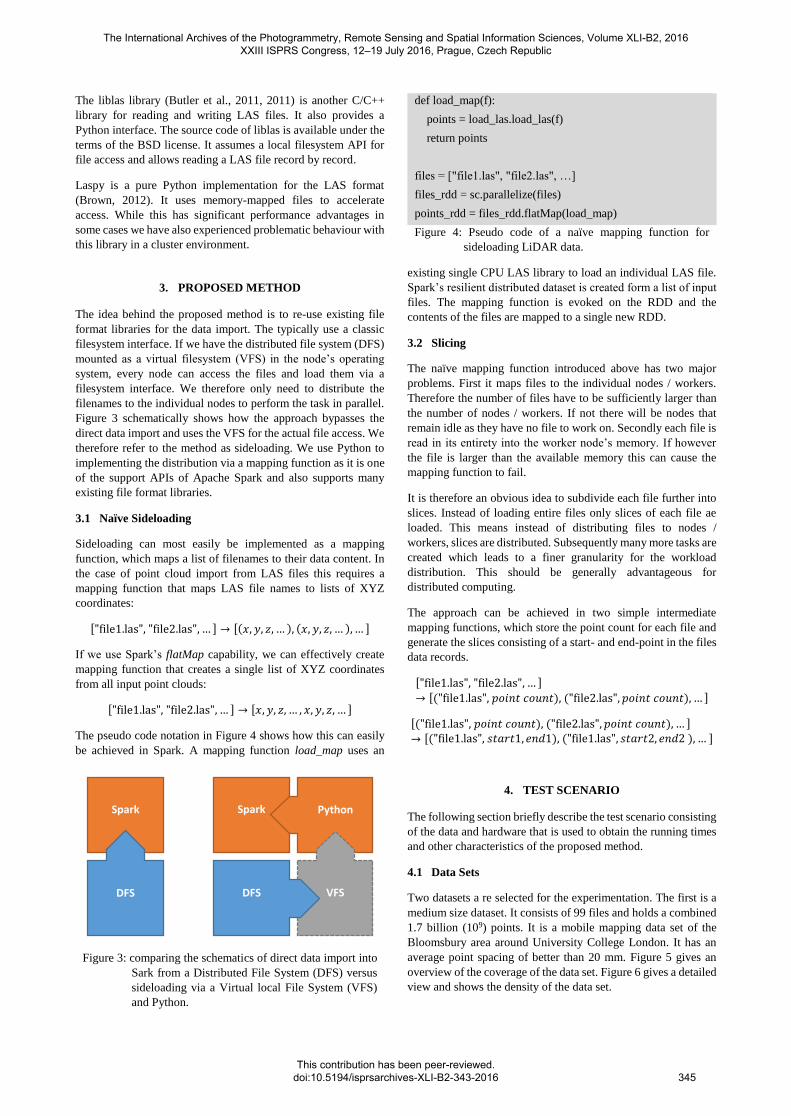
The idea behind the proposed method is to re-use existing file
format libraries for the data import. The typically use a classic
filesystem interface. If we have the distributed file system (DFS)
mounted as a virtual filesystem (VFS) in the node’s operating
system, every node can access the files and load them via a
filesystem interface. We therefore only need to distribute the
filenames to the individual nodes to perform the task in parallel.
Figure 3 schematically shows how the approach bypasses the
direct data import and uses the VFS for the actual file access. We
therefore refer to the method as sideloading. We use Python to
implementing the distribution via a mapping function as it is one
of the support APIs of Apache Spark and also supports many
existing file format libraries.
3.1 Naïve Sideloading
Sideloading can most easily be implemented as a mapping
function, which maps a list of filenames to their data content. In
the case of point cloud import from LAS files this requires a
mapping function that maps LAS file names to lists of XYZ
coordinates:
["file1.las", "file2.las", … ] → [(𝑥, 𝑦, 𝑧, … ), (𝑥, 𝑦, 𝑧, … ), … ]
If we use Spark’s flatMap capability, we can effectively create
mapping function that creates a single list of XYZ coordinates
from all input point clouds:
["file1.las", "file2.las", … ] → [𝑥, 𝑦, 𝑧, … , 𝑥, 𝑦, 𝑧, … ]
The pseudo code notation in Figure 4 shows how this can easily
be achieved in Spark. A mapping function load_map uses an
existing single CPU LAS library to load an individual LAS file.
Spark’s resilient distributed dataset is created form a list of input
files. The mapping function is evoked on the RDD and the
contents of the files are mapped to a single new RDD.
3.2 Slicing
The naïve mapping function introduced above has two major
problems. First it maps files to the individual nodes / workers.
Therefore the number of files have to be sufficiently larger than
the number of nodes / workers. If not there will be nodes that
remain idle as they have no file to work on. Secondly each file is
read in its entirety into the worker node’s memory. If however
the file is larger than the available memory this can cause the
mapping function to fail.
It is therefore an obvious idea to subdivide each file further into
slices. Instead of loading entire files only slices of each file ae
loaded. This means instead of distributing files to nodes /
workers, slices are distributed. Subsequently many more tasks are
created which leads to a finer granularity for the workload
distribution. This should be generally advantageous for
distributed computing.
The approach can be achieved in two simple intermediate
mapping functions, which store the point count for each file and
generate the slices consisting of a start- and end-point in the files
data records.
["file1.las", "file2.las", … ]
→ [("file1.las", 𝑝𝑜𝑖𝑛𝑡 𝑐𝑜𝑢𝑛𝑡), ("file2.las", 𝑝𝑜𝑖𝑛𝑡 𝑐𝑜𝑢𝑛𝑡), … ]
[("file1.las", 𝑝𝑜𝑖𝑛𝑡 𝑐𝑜𝑢𝑛𝑡), ("file2.las", 𝑝𝑜𝑖𝑛𝑡 𝑐𝑜𝑢𝑛𝑡), … ]
→ [("file1.las", 𝑠𝑡𝑎𝑟𝑡1, 𝑒𝑛𝑑1), ("file1.las", 𝑠𝑡𝑎𝑟𝑡2, 𝑒𝑛𝑑2 ), … ]
4. TEST SCENARIO
The following section briefly describe the test scenario consisting
of the data and hardware that is used to obtain the running times
and other characteristics of the proposed method.
4.1 Data Sets
Two datasets a re selected for the experimentation. The first is a
medium size dataset. It consists of 99 files and holds a combined
1.7 billion (109) points. It is a mobile mapping data set of the
Bloomsbury area around University College London. It has an
average point spacing of better than 20 mm. Figure 5 gives an
overview of the coverage of the data set. Figure 6 gives a detailed
view and shows the density of the data set.
Figure 3: comparing the schematics of direct data import into
Sark from a Distributed File System (DFS) versus
sideloading via a Virtual local File System (VFS)
and Python.
def load_map(f):
points = load_las.load_las(f)
return points
files = ["file1.las", "file2.las", …]
files_rdd = sc.parallelize(files)
points_rdd = files_rdd.flatMap(load_map)
Figure 4: Pseudo code of a naïve mapping function for
sideloading LiDAR data.
Spark
DFS
Spark Python
VFS DFS
The International Archives of the Photogrammetry, Remote Sensing and Spatial Information Sciences, Volume XLI-B2, 2016 XXIII ISPRS Congress, 12–19 July 2016, Prague, Czech Republic
This contribution has been peer-reviewed. doi:10.5194/isprsarchives-XLI-B2-343-2016
345
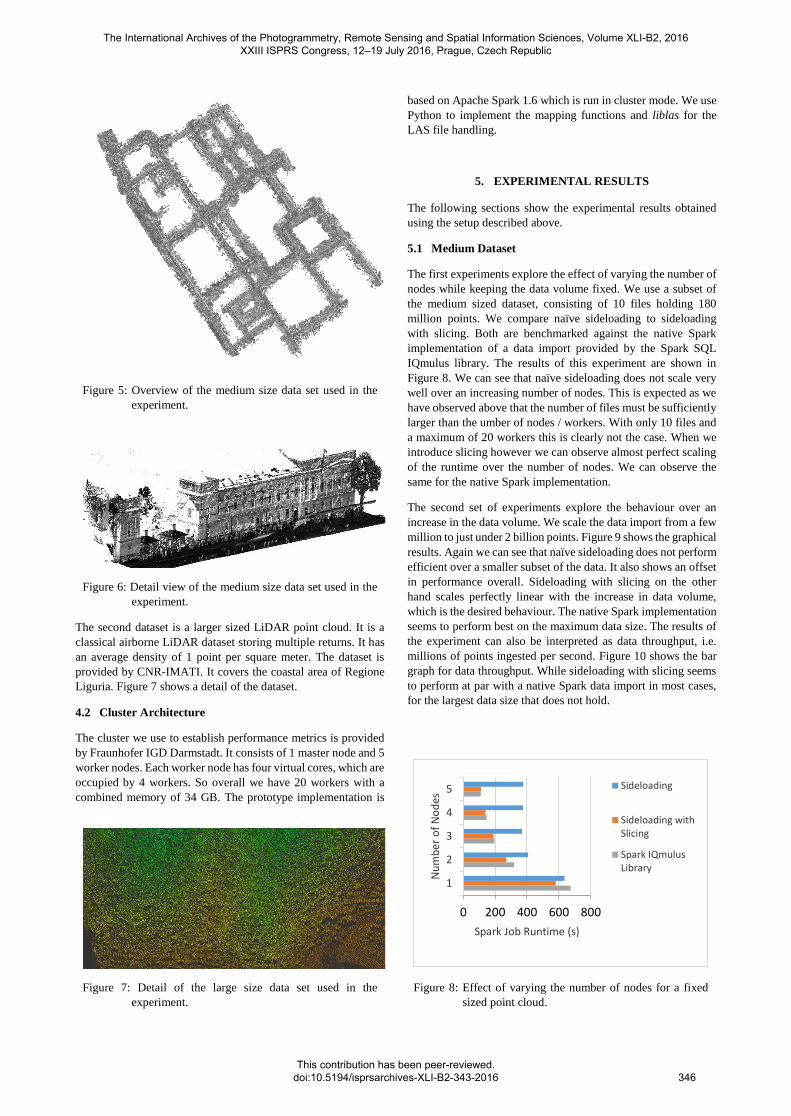
Figure 5: Overview of the medium size data set used in the
experiment.
Figure 6: Detail view of the medium size data set used in the
experiment.
The second dataset is a larger sized LiDAR point cloud. It is a
classical airborne LiDAR dataset storing multiple returns. It has
an average density of 1 point per square meter. The dataset is
provided by CNR-IMATI. It covers the coastal area of Regione
Liguria. Figure 7 shows a detail of the dataset.
4.2 Cluster Architecture
The cluster we use to establish performance metrics is provided
by Fraunhofer IGD Darmstadt. It consists of 1 master node and 5
worker nodes. Each worker node has four virtual cores, which are
occupied by 4 workers. So overall we have 20 workers with a
combined memory of 34 GB. The prototype implementation is
based on Apache Spark 1.6 which is run in cluster mode. We use
Python to implement the mapping functions and liblas for the
LAS file handling.
5. EXPERIMENTAL RESULTS
The following sections show the experimental results obtained
using the setup described above.
5.1 Medium Dataset
The first experiments explore the effect of varying the number of
nodes while keeping the data volume fixed. We use a subset of
the medium sized dataset, consisting of 10 files holding 180
million points. We compare naïve sideloading to sideloading
with slicing. Both are benchmarked against the native Spark
implementation of a data import provided by the Spark SQL
IQmulus library. The results of this experiment are shown in
Figure 8. We can see that naïve sideloading does not scale very
well over an increasing number of nodes. This is expected as we
have observed above that the number of files must be sufficiently
larger than the umber of nodes / workers. With only 10 files and
a maximum of 20 workers this is clearly not the case. When we
introduce slicing however we can observe almost perfect scaling
of the runtime over the number of nodes. We can observe the
same for the native Spark implementation.
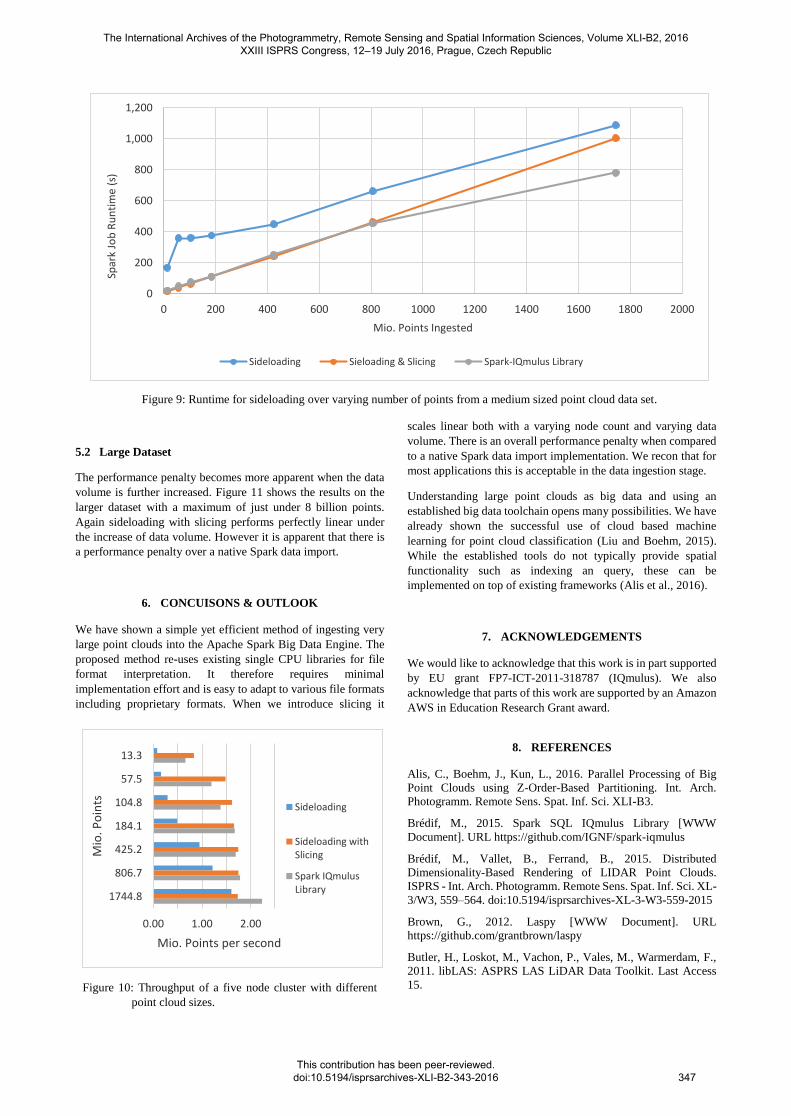
The second set of experiments explore the behaviour over an
increase in the data volume. We scale the data import from a few
million to just under 2 billion points. Figure 9 shows the graphical
results. Again we can see that naïve sideloading does not perform
efficient over a smaller subset of the data. It also shows an offset
in performance overall. Sideloading with slicing on the other
hand scales perfectly linear with the increase in data volume,
which is the desired behaviour. The native Spark implementation
seems to perform best on the maximum data size. The results of
the experiment can also be interpreted as data throughput, i.e.
millions of points ingested per second. Figure 10 shows the bar
graph for data throughput. While sideloading with slicing seems
to perform at par with a native Spark data import in most cases,
for the largest data size that does not hold.
Figure 7: Detail of the large size data set used in the
experiment.
Figure 8: Effect of varying the number of nodes for a fixed
sized point cloud.
0 200 400 600 800
1
2
3
4
5
Spark Job Runtime (s)
Nu
mb
er o
f N
od
es
Sideloading
Sideloading withSlicing
Spark IQmulusLibrary
The International Archives of the Photogrammetry, Remote Sensing and Spatial Information Sciences, Volume XLI-B2, 2016 XXIII ISPRS Congress, 12–19 July 2016, Prague, Czech Republic
This contribution has been peer-reviewed. doi:10.5194/isprsarchives-XLI-B2-343-2016
346
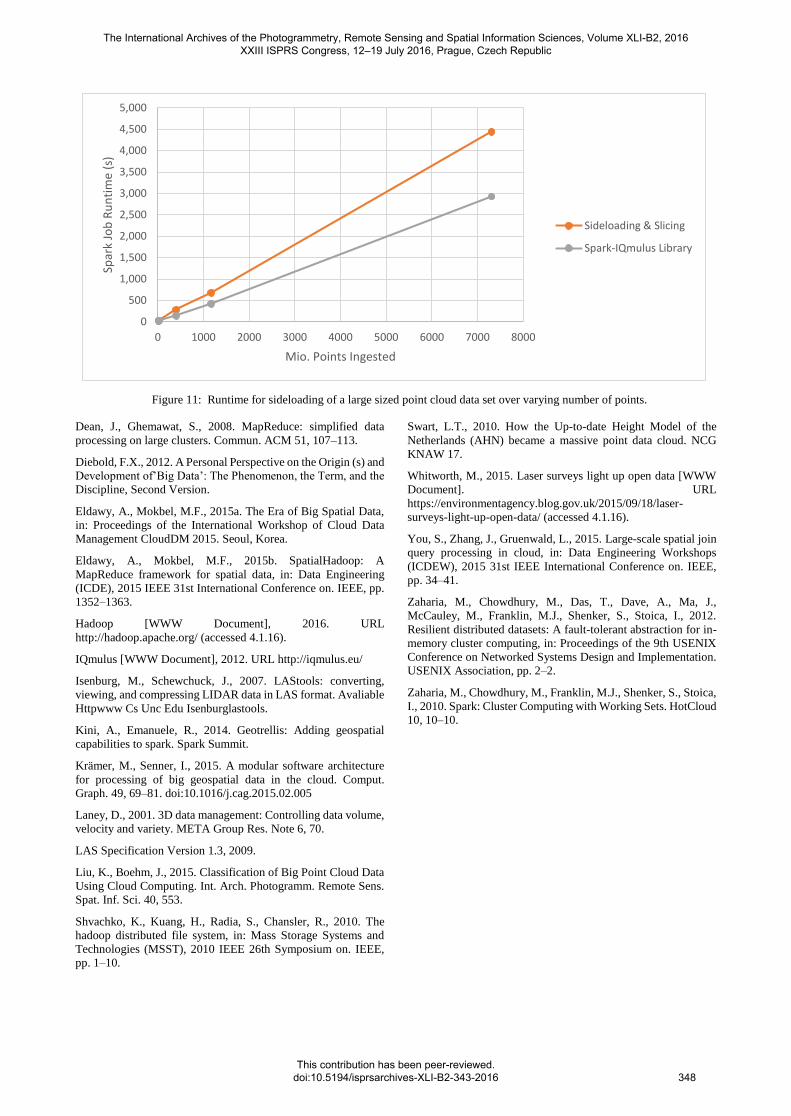
5.2 Large Dataset
The performance penalty becomes more apparent when the data
volume is further increased. Figure 11 shows the results on the
larger dataset with a maximum of just under 8 billion points.
Again sideloading with slicing performs perfectly linear under
the increase of data volume. However it is apparent that there is
a performance penalty over a native Spark data import.
6. CONCUISONS & OUTLOOK
We have shown a simple yet efficient method of ingesting very
large point clouds into the Apache Spark Big Data Engine. The
proposed method re-uses existing single CPU libraries for file
format interpretation. It therefore requires minimal
implementation effort and is easy to adapt to various file formats
including proprietary formats. When we introduce slicing it
scales linear both with a varying node count and varying data
volume. There is an overall performance penalty when compared
to a native Spark data import implementation. We recon that for
most applications this is acceptable in the data ingestion stage.
Understanding large point clouds as big data and using an
established big data toolchain opens many possibilities. We have
already shown the successful use of cloud based machine
learning for point cloud classification (Liu and Boehm, 2015).
While the established tools do not typically provide spatial
functionality such as indexing an query, these can be
implemented on top of existing frameworks (Alis et al., 2016).
7. ACKNOWLEDGEMENTS
We would like to acknowledge that this work is in part supported
by EU grant FP7-ICT-2011-318787 (IQmulus). We also
acknowledge that parts of this work are supported by an Amazon
AWS in Education Research Grant award.
8. REFERENCES
Alis, C., Boehm, J., Kun, L., 2016. Parallel Processing of Big
Point Clouds using Z-Order-Based Partitioning. Int. Arch.
Photogramm. Remote Sens. Spat. Inf. Sci. XLI-B3.
Brédif, M., 2015. Spark SQL IQmulus Library [WWW
Document]. URL https://github.com/IGNF/spark-iqmulus
Brédif, M., Vallet, B., Ferrand, B., 2015. Distributed
Dimensionality-Based Rendering of LIDAR Point Clouds.
ISPRS - Int. Arch. Photogramm. Remote Sens. Spat. Inf. Sci. XL-
3/W3, 559–564. doi:10.5194/isprsarchives-XL-3-W3-559-2015
Brown, G., 2012. Laspy [WWW Document]. URL
https://github.com/grantbrown/laspy
Butler, H., Loskot, M., Vachon, P., Vales, M., Warmerdam, F.,
2011. libLAS: ASPRS LAS LiDAR Data Toolkit. Last Access
15.
Figure 9: Runtime for sideloading over varying number of points from a medium sized point cloud data set.
Figure 10: Throughput of a five node cluster with different
point cloud sizes.
0
200
400
600
800
1,000
1,200
0 200 400 600 800 1000 1200 1400 1600 1800 2000
Spar
k Jo
b R
un
tim
e (s
)
Mio. Points Ingested
Sideloading Sieloading & Slicing Spark-IQmulus Library
0.00 1.00 2.00
13.3
57.5
104.8
184.1
425.2
806.7
1744.8
Mio. Points per second
Mio
. Po
ints Sideloading
Sideloading withSlicing
Spark IQmulusLibrary
The International Archives of the Photogrammetry, Remote Sensing and Spatial Information Sciences, Volume XLI-B2, 2016 XXIII ISPRS Congress, 12–19 July 2016, Prague, Czech Republic
This contribution has been peer-reviewed. doi:10.5194/isprsarchives-XLI-B2-343-2016
347
Dean, J., Ghemawat, S., 2008. MapReduce: simplified data
processing on large clusters. Commun. ACM 51, 107–113.
Diebold, F.X., 2012. A Personal Perspective on the Origin (s) and
Development of’Big Data’: The Phenomenon, the Term, and the
Discipline, Second Version.
Eldawy, A., Mokbel, M.F., 2015a. The Era of Big Spatial Data,
in: Proceedings of the International Workshop of Cloud Data
Management CloudDM 2015. Seoul, Korea.
Eldawy, A., Mokbel, M.F., 2015b. SpatialHadoop: A
MapReduce framework for spatial data, in: Data Engineering
(ICDE), 2015 IEEE 31st International Conference on. IEEE, pp.
1352–1363.
Hadoop [WWW Document], 2016. URL
http://hadoop.apache.org/ (accessed 4.1.16).
IQmulus [WWW Document], 2012. URL http://iqmulus.eu/
Isenburg, M., Schewchuck, J., 2007. LAStools: converting,
viewing, and compressing LIDAR data in LAS format. Avaliable
Httpwww Cs Unc Edu Isenburglastools.
Kini, A., Emanuele, R., 2014. Geotrellis: Adding geospatial
capabilities to spark. Spark Summit.
Krämer, M., Senner, I., 2015. A modular software architecture
for processing of big geospatial data in the cloud. Comput.
Graph. 49, 69–81. doi:10.1016/j.cag.2015.02.005
Laney, D., 2001. 3D data management: Controlling data volume,
velocity and variety. META Group Res. Note 6, 70.
LAS Specification Version 1.3, 2009.
Liu, K., Boehm, J., 2015. Classification of Big Point Cloud Data
Using Cloud Computing. Int. Arch. Photogramm. Remote Sens.
Spat. Inf. Sci. 40, 553.
Shvachko, K., Kuang, H., Radia, S., Chansler, R., 2010. The
hadoop distributed file system, in: Mass Storage Systems and
Technologies (MSST), 2010 IEEE 26th Symposium on. IEEE,
pp. 1–10.
Swart, L.T., 2010. How the Up-to-date Height Model of the
Netherlands (AHN) became a massive point data cloud. NCG
KNAW 17.
Whitworth, M., 2015. Laser surveys light up open data [WWW
Document]. URL
https://environmentagency.blog.gov.uk/2015/09/18/laser-
surveys-light-up-open-data/ (accessed 4.1.16).
You, S., Zhang, J., Gruenwald, L., 2015. Large-scale spatial join
query processing in cloud, in: Data Engineering Workshops
(ICDEW), 2015 31st IEEE International Conference on. IEEE,
pp. 34–41.
Zaharia, M., Chowdhury, M., Das, T., Dave, A., Ma, J.,
McCauley, M., Franklin, M.J., Shenker, S., Stoica, I., 2012.
Resilient distributed datasets: A fault-tolerant abstraction for in-
memory cluster computing, in: Proceedings of the 9th USENIX
Conference on Networked Systems Design and Implementation.
USENIX Association, pp. 2–2.
Zaharia, M., Chowdhury, M., Franklin, M.J., Shenker, S., Stoica,
I., 2010. Spark: Cluster Computing with Working Sets. HotCloud
10, 10–10.
Figure 11: Runtime for sideloading of a large sized point cloud data set over varying number of points.
0
500
1,000
1,500
2,000
2,500
3,000
3,500
4,000
4,500
5,000
0 1000 2000 3000 4000 5000 6000 7000 8000
Spar
k Jo
b R
un
tim
e (s
)
Mio. Points Ingested
Sideloading & Slicing
Spark-IQmulus Library
The International Archives of the Photogrammetry, Remote Sensing and Spatial Information Sciences, Volume XLI-B2, 2016 XXIII ISPRS Congress, 12–19 July 2016, Prague, Czech Republic
This contribution has been peer-reviewed. doi:10.5194/isprsarchives-XLI-B2-343-2016
348