Embed Size (px)
Citation preview

The copyright in this material (other than in respect of information from external sources) is owned by Singapore Airlines Ltd. Singapore Airlines Ltd has not independently verified the information from external sources. This material may not be modified, reproduced, distributed, republished or transmitted in whole or in part in any manner or by any means without prior permission of Singapore Airlines Ltd.
SIA Group
Business Update
Q1 FY21/22(ended 30 June 2021)
30 July 2021
The copyright in this material (other than in respect of information from external sources) is owned by Singapore Airlines Ltd. Singapore Airlines Ltd has not independently verified the information from external sources. This material may not be modified, reproduced, distributed, republished or transmitted in whole or in part in any manner or by any means without prior permission of Singapore Airlines Ltd.
Slide 2
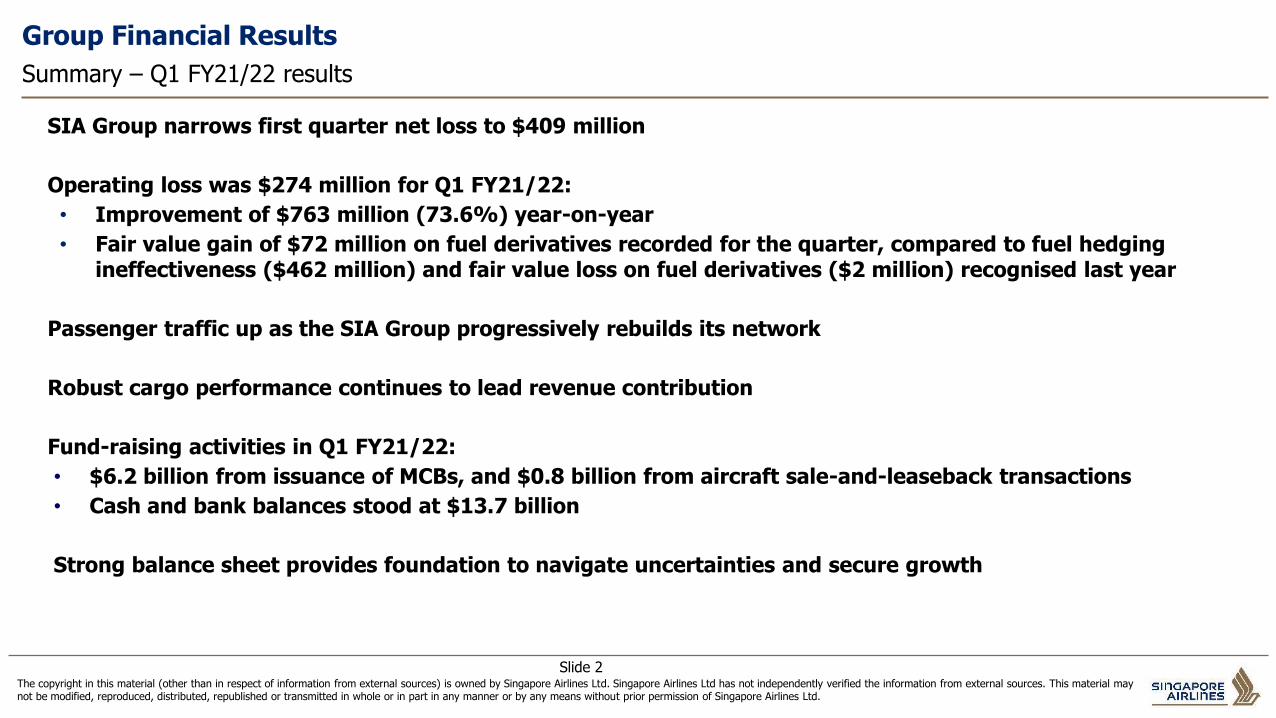
Group Financial Results
Summary – Q1 FY21/22 results
SIA Group narrows first quarter net loss to $409 million
Operating loss was $274 million for Q1 FY21/22:
• Improvement of $763 million (73.6%) year-on-year
• Fair value gain of $72 million on fuel derivatives recorded for the quarter, compared to fuel hedging ineffectiveness ($462 million) and fair value loss on fuel derivatives ($2 million) recognised last year
Passenger traffic up as the SIA Group progressively rebuilds its network
Robust cargo performance continues to lead revenue contribution
Fund-raising activities in Q1 FY21/22:
• $6.2 billion from issuance of MCBs, and $0.8 billion from aircraft sale-and-leaseback transactions
• Cash and bank balances stood at $13.7 billion
Strong balance sheet provides foundation to navigate uncertainties and secure growth
The copyright in this material (other than in respect of information from external sources) is owned by Singapore Airlines Ltd. Singapore Airlines Ltd has not independently verified the information from external sources. This material may not be modified, reproduced, distributed, republished or transmitted in whole or in part in any manner or by any means without prior permission of Singapore Airlines Ltd.
Slide 3
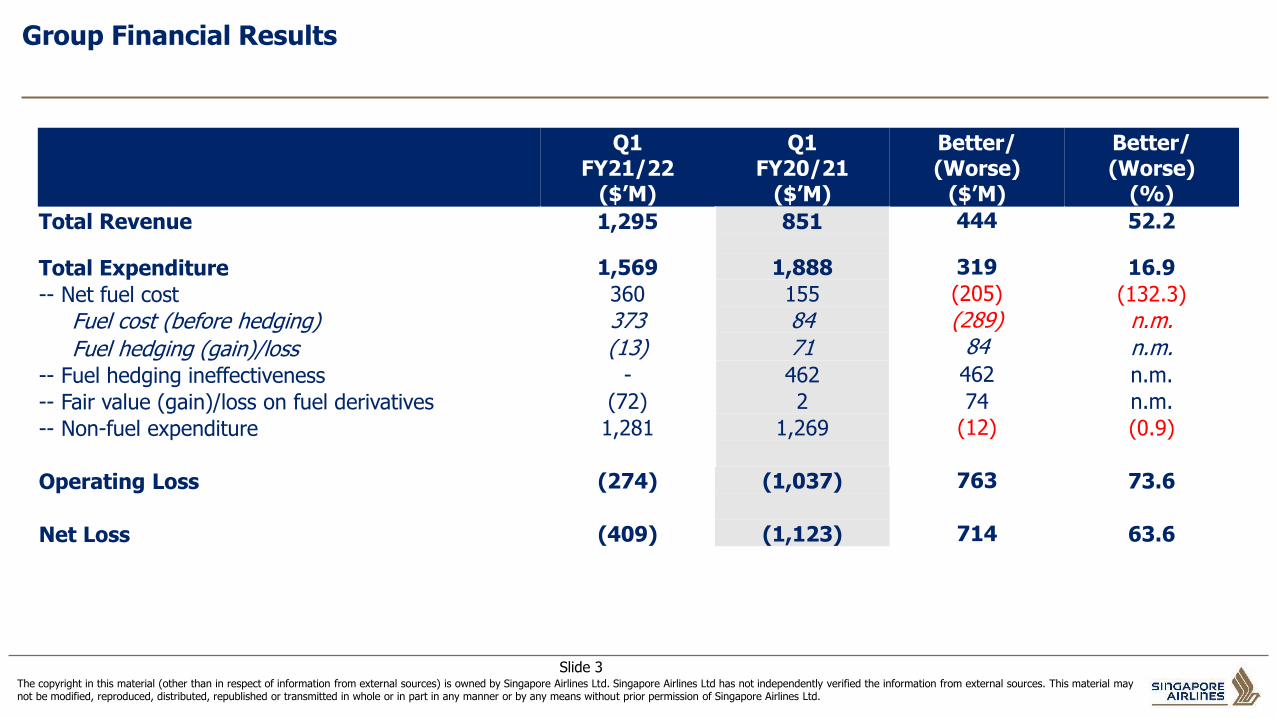
Group Financial Results
Q1FY21/22
($’M)
Q1FY20/21
($’M)
Better/(Worse)
($’M)
Better/(Worse)
(%)
Total Revenue 1,295 851 444 52.2
Total Expenditure 1,569 1,888 319 16.9
-- Net fuel cost 360 155 (205) (132.3)
Fuel cost (before hedging) 373 84 (289) n.m.
Fuel hedging (gain)/loss (13) 71 84 n.m.
-- Fuel hedging ineffectiveness - 462 462 n.m.
-- Fair value (gain)/loss on fuel derivatives (72) 2 74 n.m.
-- Non-fuel expenditure 1,281 1,269 (12) (0.9)
Operating Loss (274) (1,037) 763 73.6
Net Loss (409) (1,123) 714 63.6
The copyright in this material (other than in respect of information from external sources) is owned by Singapore Airlines Ltd. Singapore Airlines Ltd has not independently verified the information from external sources. This material may not be modified, reproduced, distributed, republished or transmitted in whole or in part in any manner or by any means without prior permission of Singapore Airlines Ltd.
Slide 4
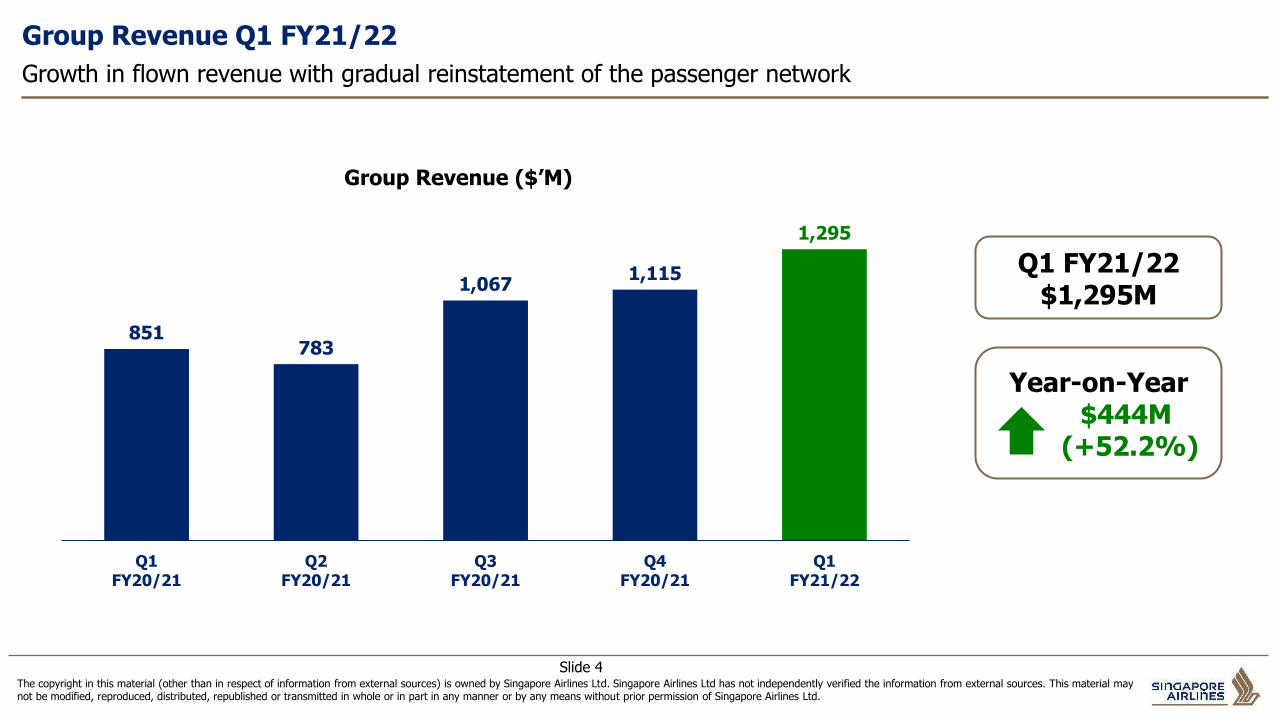
851783
1,0671,115
1,295
Q1FY20/21
Q2FY20/21
Q3FY20/21
Q4FY20/21
Q1FY21/22
Group Revenue ($’M)
Group Revenue Q1 FY21/22
Growth in flown revenue with gradual reinstatement of the passenger network
Year-on-Year$444M
(+52.2%)
Q1 FY21/22$1,295M
The copyright in this material (other than in respect of information from external sources) is owned by Singapore Airlines Ltd. Singapore Airlines Ltd has not independently verified the information from external sources. This material may not be modified, reproduced, distributed, republished or transmitted in whole or in part in any manner or by any means without prior permission of Singapore Airlines Ltd.
Slide 5
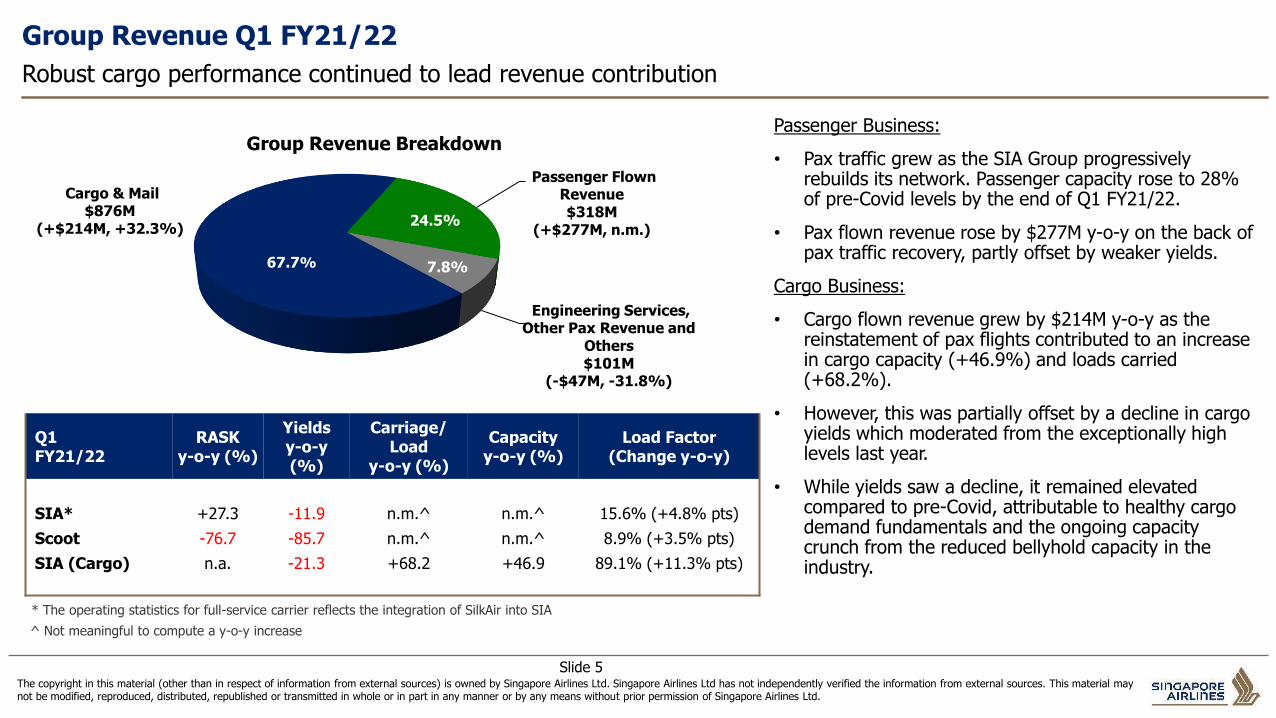
Q1FY21/22
RASKy-o-y (%)
Yieldsy-o-y(%)
Carriage/Load
y-o-y (%)
Capacityy-o-y (%)
Load Factor (Change y-o-y)
SIA*
Scoot
SIA (Cargo)
+27.3
-76.7
n.a.
-11.9
-85.7
-21.3
n.m.^
n.m.^
+68.2
n.m.^
n.m.^
+46.9
15.6% (+4.8% pts)
8.9% (+3.5% pts)
89.1% (+11.3% pts)
^ Not meaningful to compute a y-o-y increase
13.1%
Group Revenue Q1 FY21/22
Robust cargo performance continued to lead revenue contribution
Passenger Business:
• Pax traffic grew as the SIA Group progressively rebuilds its network. Passenger capacity rose to 28% of pre-Covid levels by the end of Q1 FY21/22.
• Pax flown revenue rose by $277M y-o-y on the back of pax traffic recovery, partly offset by weaker yields.
Cargo Business:
• Cargo flown revenue grew by $214M y-o-y as the reinstatement of pax flights contributed to an increase in cargo capacity (+46.9%) and loads carried (+68.2%).
• However, this was partially offset by a decline in cargo yields which moderated from the exceptionally high levels last year.
• While yields saw a decline, it remained elevated compared to pre-Covid, attributable to healthy cargo demand fundamentals and the ongoing capacity crunch from the reduced bellyhold capacity in the industry.
Cargo & Mail$876M
(+$214M, +32.3%)
Passenger Flown Revenue$318M
(+$277M, n.m.)
Engineering Services, Other Pax Revenue and
Others$101M
(-$47M, -31.8%)
Group Revenue Breakdown
* The operating statistics for full-service carrier reflects the integration of SilkAir into SIA
67.7%
24.5%
7.8%
The copyright in this material (other than in respect of information from external sources) is owned by Singapore Airlines Ltd. Singapore Airlines Ltd has not independently verified the information from external sources. This material may not be modified, reproduced, distributed, republished or transmitted in whole or in part in any manner or by any means without prior permission of Singapore Airlines Ltd.
Slide 6
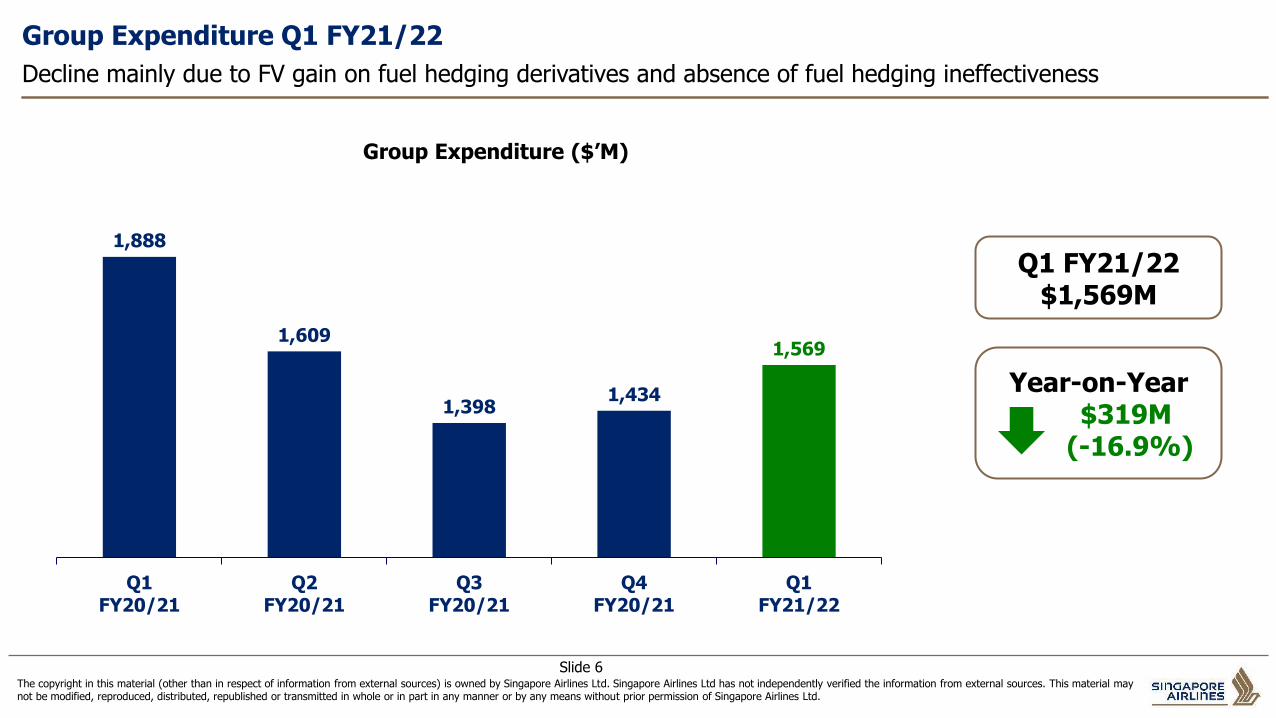
Group Expenditure Q1 FY21/22
Decline mainly due to FV gain on fuel hedging derivatives and absence of fuel hedging ineffectiveness
Year-on-Year$319M
(-16.9%)
Q1 FY21/22$1,569M
1,888
1,609
1,3981,434
1,569
Q1FY20/21
Q2FY20/21
Q3FY20/21
Q4FY20/21
Q1FY21/22
Group Expenditure ($’M)

The copyright in this material (other than in respect of information from external sources) is owned by Singapore Airlines Ltd. Singapore Airlines Ltd has not independently verified the information from external sources. This material may not be modified, reproduced, distributed, republished or transmitted in whole or in part in any manner or by any means without prior permission of Singapore Airlines Ltd.
Slide 7
Group Expenditure Q1 FY21/22 - Adjusted
Increase in adjusted expenditure driven by higher deployment of capacity
Year-on-Year$217M
(+15.2%)
Q1 FY21/22$1,641M
1,424
1,5101,549
1,632 1,641
Q1FY20/21
Q2FY20/21
Q3FY20/21
Q4FY20/21
Q1FY21/22
Group Expenditure ($’M) – Adjusted
(Excluded impact of fuel hedging ineffectiveness and FV gain/loss on fuel derivatives)
The copyright in this material (other than in respect of information from external sources) is owned by Singapore Airlines Ltd. Singapore Airlines Ltd has not independently verified the information from external sources. This material may not be modified, reproduced, distributed, republished or transmitted in whole or in part in any manner or by any means without prior permission of Singapore Airlines Ltd.
Slide 8
69.8%
17.1%
13.1%
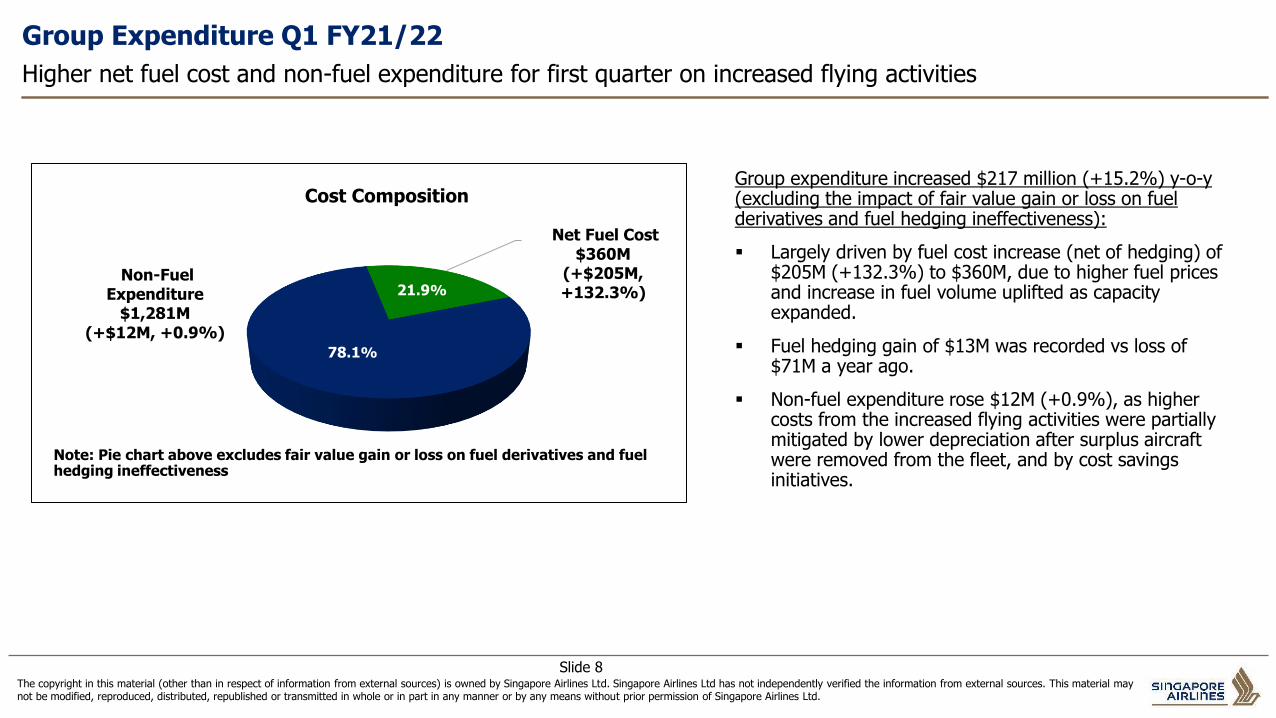
Group Expenditure Q1 FY21/22
Higher net fuel cost and non-fuel expenditure for first quarter on increased flying activities
Group expenditure increased $217 million (+15.2%) y-o-y (excluding the impact of fair value gain or loss on fuel derivatives and fuel hedging ineffectiveness):
▪ Largely driven by fuel cost increase (net of hedging) of $205M (+132.3%) to $360M, due to higher fuel prices and increase in fuel volume uplifted as capacity expanded.
▪ Fuel hedging gain of $13M was recorded vs loss of $71M a year ago.
▪ Non-fuel expenditure rose $12M (+0.9%), as higher costs from the increased flying activities were partially mitigated by lower depreciation after surplus aircraft were removed from the fleet, and by cost savings initiatives.
Net Fuel Cost$360M
(+$205M, +132.3%)
Non-Fuel Expenditure
$1,281M(+$12M, +0.9%)
Cost Composition
78.1%
21.9%
Note: Pie chart above excludes fair value gain or loss on fuel derivatives and fuel hedging ineffectiveness
The copyright in this material (other than in respect of information from external sources) is owned by Singapore Airlines Ltd. Singapore Airlines Ltd has not independently verified the information from external sources. This material may not be modified, reproduced, distributed, republished or transmitted in whole or in part in any manner or by any means without prior permission of Singapore Airlines Ltd.
Slide 9
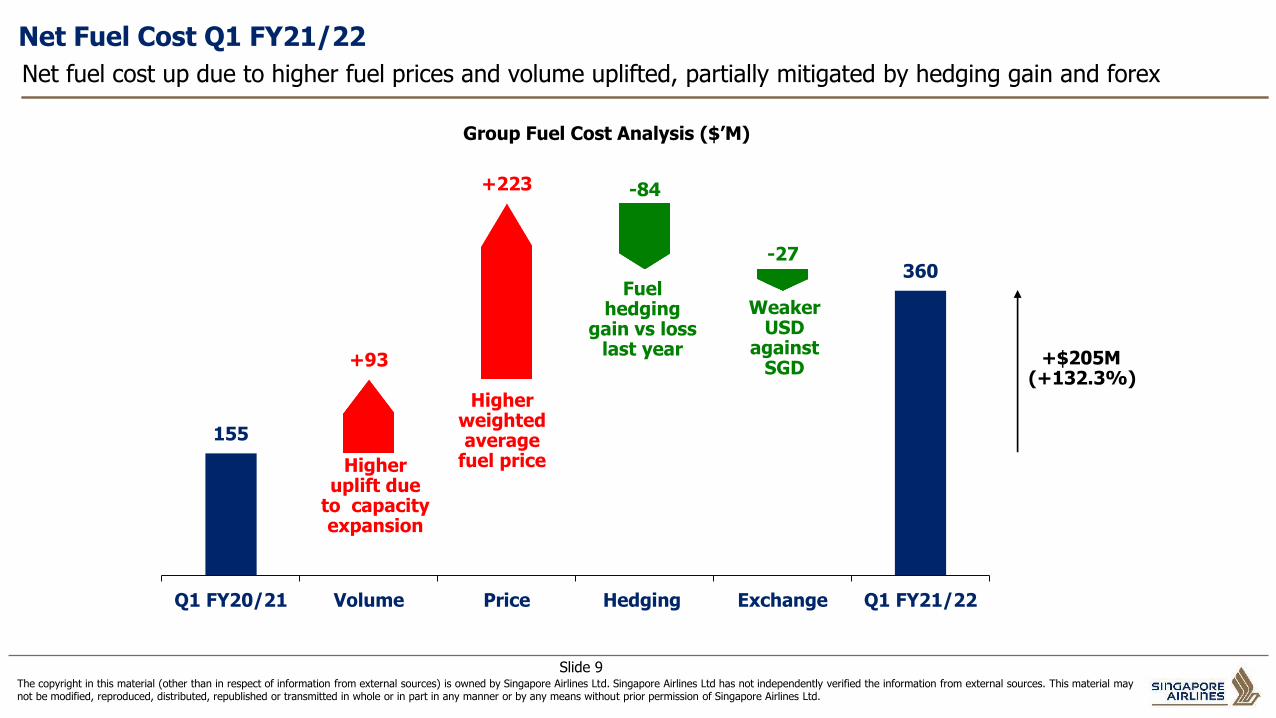
Net Fuel Cost Q1 FY21/22
Net fuel cost up due to higher fuel prices and volume uplifted, partially mitigated by hedging gain and forex
155
+93
+223 -84
-27360
Q1 FY20/21 Volume Price Hedging Exchange Q1 FY21/22
Group Fuel Cost Analysis ($’M)
Higher uplift due
to capacity expansion
Higher weighted average
fuel price
Fuel hedging
gain vs loss last year
Weaker USD
against SGD
+$205M(+132.3%)
The copyright in this material (other than in respect of information from external sources) is owned by Singapore Airlines Ltd. Singapore Airlines Ltd has not independently verified the information from external sources. This material may not be modified, reproduced, distributed, republished or transmitted in whole or in part in any manner or by any means without prior permission of Singapore Airlines Ltd.
Slide 10
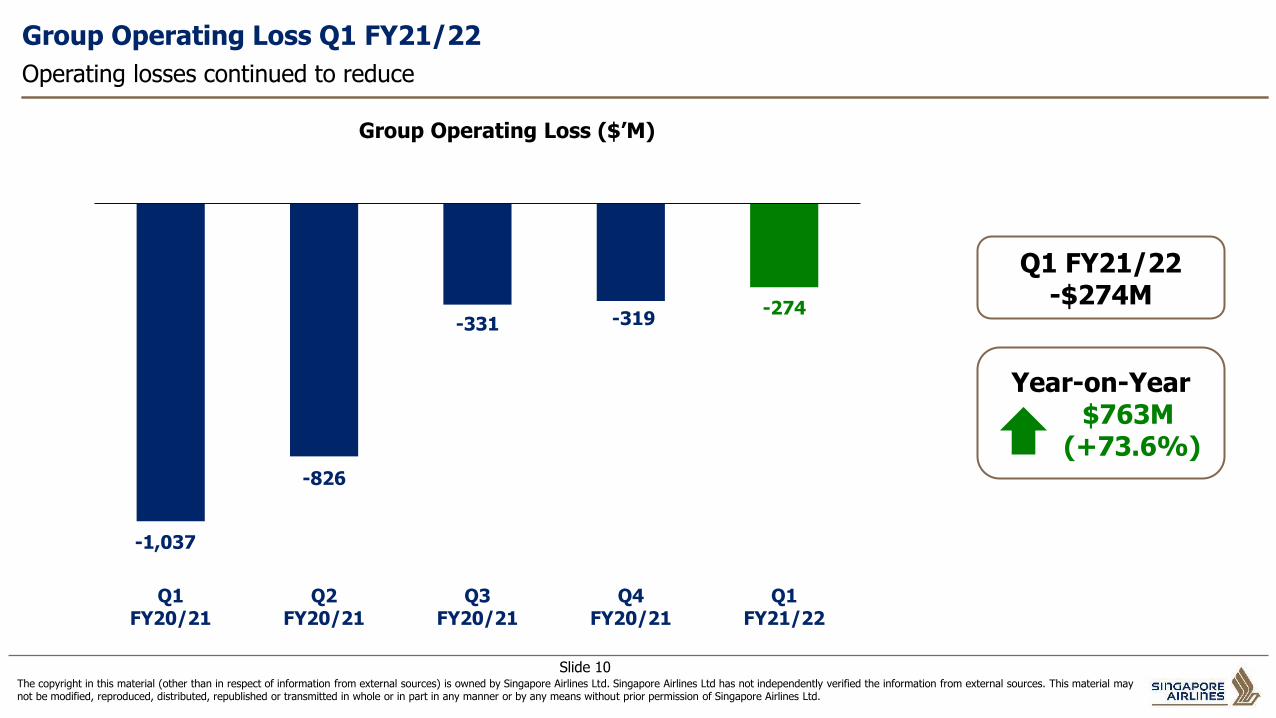
Group Operating Loss Q1 FY21/22
Operating losses continued to reduce
Year-on-Year$763M
(+73.6%)
Q1 FY21/22-$274M
-1,037
-826
-331 -319-274
Q1FY20/21
Q2FY20/21
Q3FY20/21
Q4FY20/21
Q1FY21/22
Group Operating Loss ($’M)
The copyright in this material (other than in respect of information from external sources) is owned by Singapore Airlines Ltd. Singapore Airlines Ltd has not independently verified the information from external sources. This material may not be modified, reproduced, distributed, republished or transmitted in whole or in part in any manner or by any means without prior permission of Singapore Airlines Ltd.
Slide 11
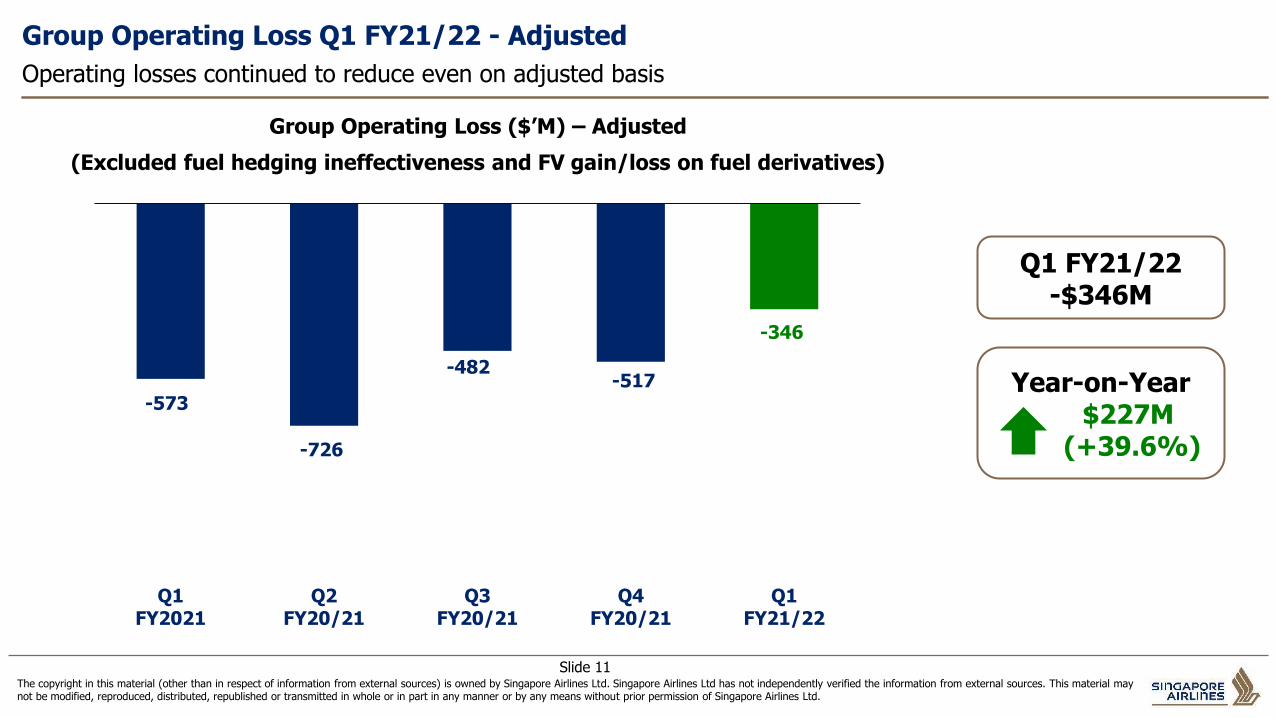
Group Operating Loss Q1 FY21/22 - Adjusted
Operating losses continued to reduce even on adjusted basis
-573
-726
-482-517
-346
Q1FY2021
Q2FY20/21
Q3FY20/21
Q4FY20/21
Q1FY21/22
Group Operating Loss ($’M) – Adjusted
(Excluded fuel hedging ineffectiveness and FV gain/loss on fuel derivatives)
Year-on-Year$227M
(+39.6%)
Q1 FY21/22-$346M
The copyright in this material (other than in respect of information from external sources) is owned by Singapore Airlines Ltd. Singapore Airlines Ltd has not independently verified the information from external sources. This material may not be modified, reproduced, distributed, republished or transmitted in whole or in part in any manner or by any means without prior permission of Singapore Airlines Ltd.
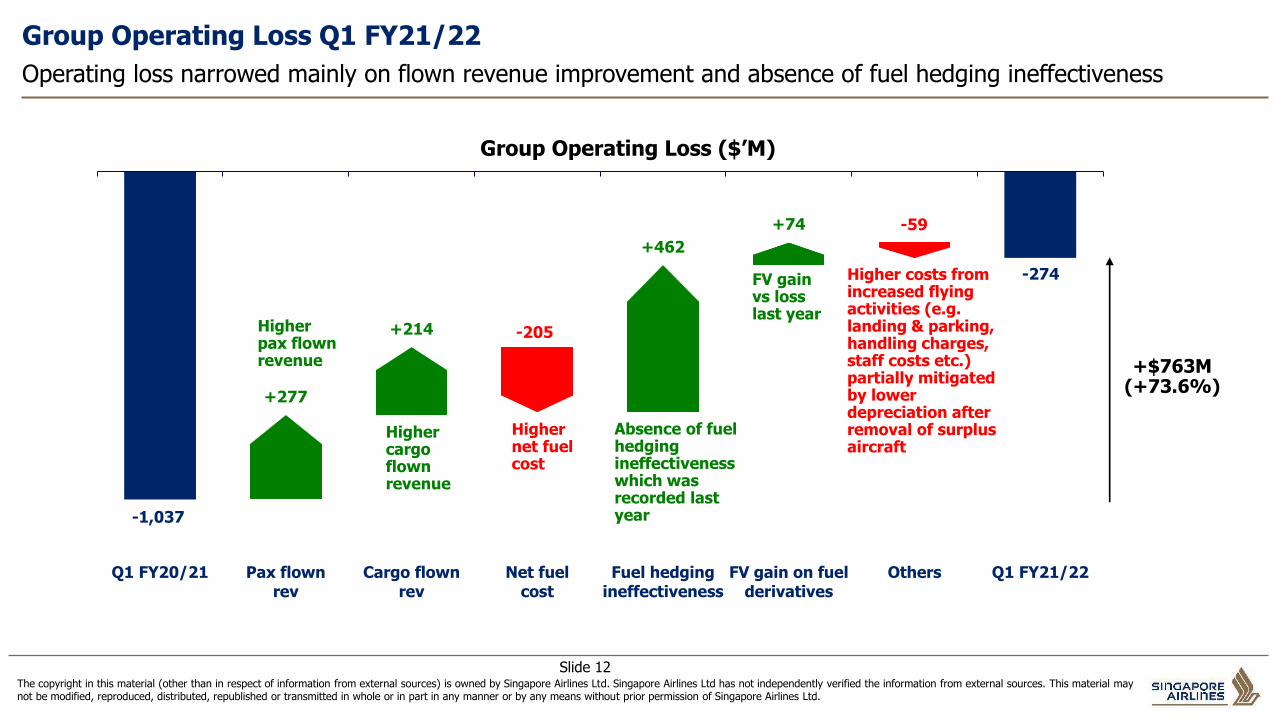
Slide 12
Group Operating Loss Q1 FY21/22
Operating loss narrowed mainly on flown revenue improvement and absence of fuel hedging ineffectiveness
-1,037
+277
+214 -205
+462
+74 -59
-274
Q1 FY20/21 Pax flownrev
Cargo flownrev
Net fuelcost
Fuel hedgingineffectiveness
FV gain on fuelderivatives
Others Q1 FY21/22
Group Operating Loss ($’M)
Higher cargo flown revenue
Higher net fuel cost
Higher pax flown revenue
Absence of fuel hedging ineffectiveness which was recorded last year
+$763M(+73.6%)
Higher costs from increased flying activities (e.g.landing & parking, handling charges, staff costs etc.) partially mitigated by lower depreciation after removal of surplus aircraft
FV gain vs loss last year
The copyright in this material (other than in respect of information from external sources) is owned by Singapore Airlines Ltd. Singapore Airlines Ltd has not independently verified the information from external sources. This material may not be modified, reproduced, distributed, republished or transmitted in whole or in part in any manner or by any means without prior permission of Singapore Airlines Ltd.
Slide 13
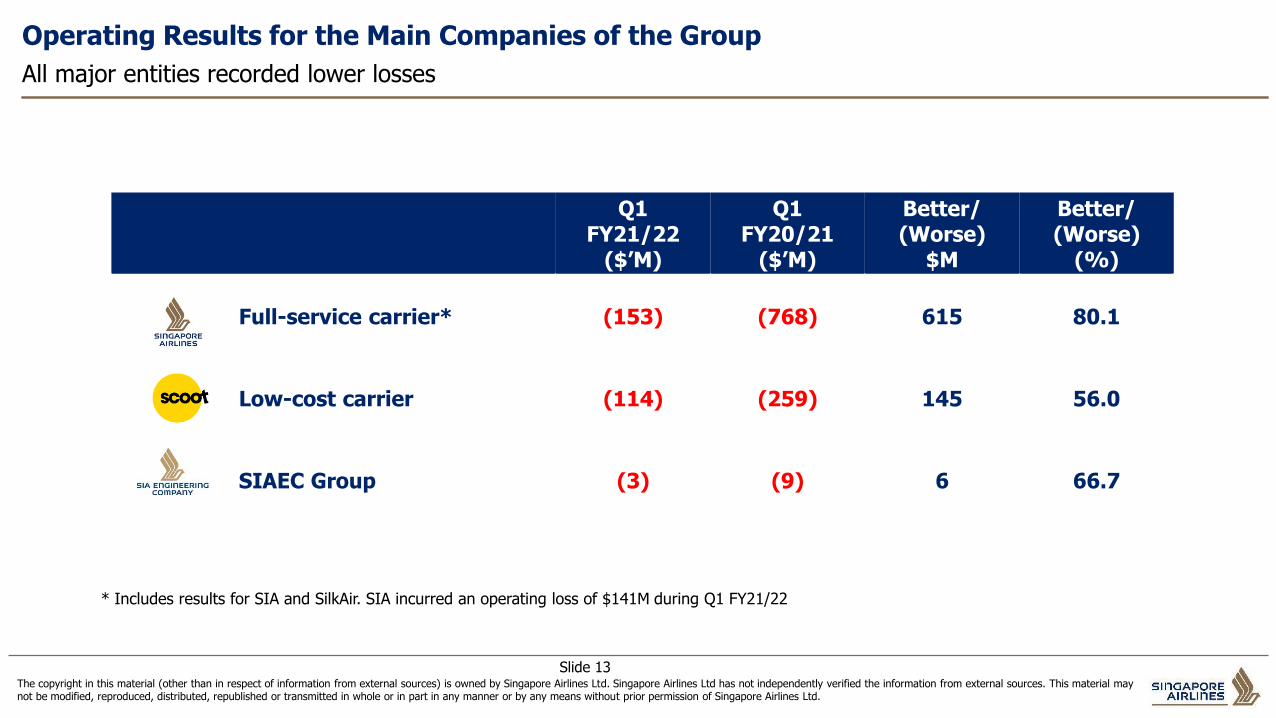
Operating Results for the Main Companies of the Group
All major entities recorded lower losses
Q1FY21/22
($’M)
Q1FY20/21
($’M)
Better/(Worse)
$M
Better/(Worse)
(%)
Full-service carrier* (153) (768) 615 80.1
Low-cost carrier (114) (259) 145 56.0
SIAEC Group (3) (9) 6 66.7
* Includes results for SIA and SilkAir. SIA incurred an operating loss of $141M during Q1 FY21/22
The copyright in this material (other than in respect of information from external sources) is owned by Singapore Airlines Ltd. Singapore Airlines Ltd has not independently verified the information from external sources. This material may not be modified, reproduced, distributed, republished or transmitted in whole or in part in any manner or by any means without prior permission of Singapore Airlines Ltd.
Slide 14
69.8%
17.1%
13.1%
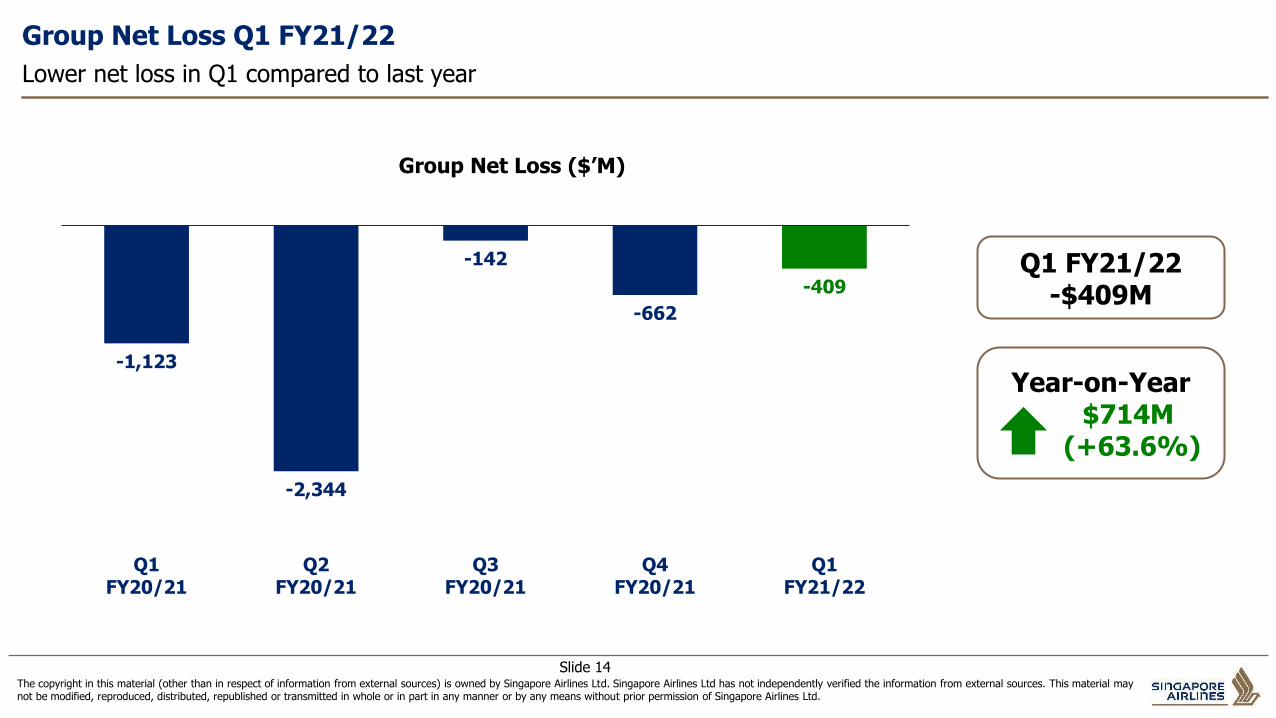
Group Net Loss Q1 FY21/22
Lower net loss in Q1 compared to last year
-1,123
-2,344
-142
-662
-409
Q1FY20/21
Q2FY20/21
Q3FY20/21
Q4FY20/21
Q1FY21/22
Group Net Loss ($’M)
Year-on-Year$714M
(+63.6%)
Q1 FY21/22-$409M
The copyright in this material (other than in respect of information from external sources) is owned by Singapore Airlines Ltd. Singapore Airlines Ltd has not independently verified the information from external sources. This material may not be modified, reproduced, distributed, republished or transmitted in whole or in part in any manner or by any means without prior permission of Singapore Airlines Ltd.
Slide 15
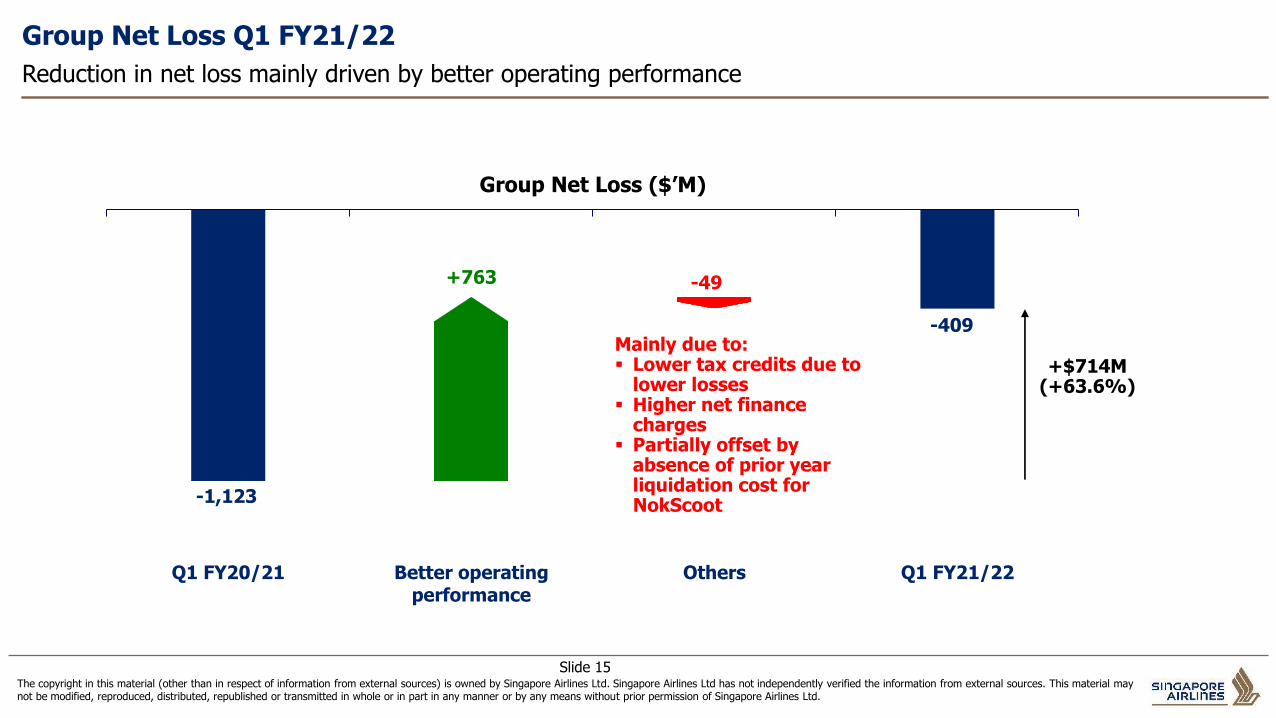
Group Net Loss Q1 FY21/22
Reduction in net loss mainly driven by better operating performance
-1,123
+763 -49
-409
Q1 FY20/21 Better operatingperformance
Others Q1 FY21/22
Group Net Loss ($’M)
Mainly due to: ▪ Lower tax credits due to
lower losses▪ Higher net finance
charges▪ Partially offset by
absence of prior year liquidation cost for NokScoot
+$714M(+63.6%)
The copyright in this material (other than in respect of information from external sources) is owned by Singapore Airlines Ltd. Singapore Airlines Ltd has not independently verified the information from external sources. This material may not be modified, reproduced, distributed, republished or transmitted in whole or in part in any manner or by any means without prior permission of Singapore Airlines Ltd.
Slide 16
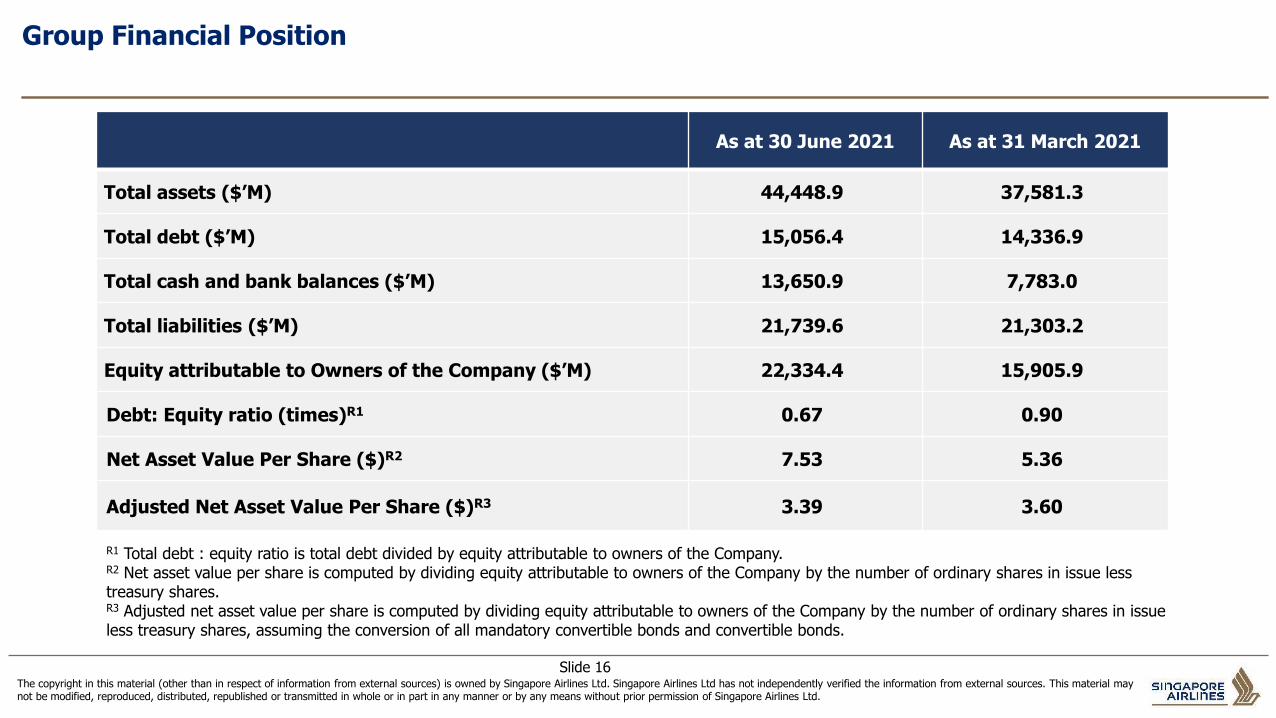
Group Financial Position
As at 30 June 2021 As at 31 March 2021
Total assets ($’M) 44,448.9 37,581.3
Total debt ($’M) 15,056.4 14,336.9
Total cash and bank balances ($’M) 13,650.9 7,783.0
Total liabilities ($’M) 21,739.6 21,303.2
Equity attributable to Owners of the Company ($’M) 22,334.4 15,905.9
Debt: Equity ratio (times)R1 0.67 0.90
Net Asset Value Per Share ($)R2 7.53 5.36
Adjusted Net Asset Value Per Share ($)R3 3.39 3.60
R1 Total debt : equity ratio is total debt divided by equity attributable to owners of the Company.R2 Net asset value per share is computed by dividing equity attributable to owners of the Company by the number of ordinary shares in issue less treasury shares.R3 Adjusted net asset value per share is computed by dividing equity attributable to owners of the Company by the number of ordinary shares in issue less treasury shares, assuming the conversion of all mandatory convertible bonds and convertible bonds.
The copyright in this material (other than in respect of information from external sources) is owned by Singapore Airlines Ltd. Singapore Airlines Ltd has not independently verified the information from external sources. This material may not be modified, reproduced, distributed, republished or transmitted in whole or in part in any manner or by any means without prior permission of Singapore Airlines Ltd.
Thank You