Embed Size (px)
Citation preview

1
Electronic Supplementary Information
Mechanistic studies on lithium intercalation in a lithium-‐excess layered material using
Li2RuO3 epitaxial film electrodes and in situ surface X-‐ray analysis
Sou Taminato,a Masaaki Hirayama,*a Kota Suzuki,a KyungSu Kim,a Kazuhisa Tamura,b
Jun’ichiro Mizukib and Ryoji Kannoa
a Department of Electronic Chemistry, Tokyo Institute of Technology, 4259 Nagatsuta-‐cho,
Midoriku-‐ku, Yokohama 226-‐8502, Japan
b Japan Atomic Energy Agency, Synchrotron Radiation Research Center, Kansai Research
Establishment, 1-‐1-‐1 Kouto, Sayo-‐cho, Sayo-‐gun, Hyogo 679-‐5148, Japan
*Phone: +81459245503
*E-‐mail: [email protected]
Electronic Supplementary Material (ESI) for Journal of Materials Chemistry A.This journal is © The Royal Society of Chemistry 2014

2
X-‐ray reflectivity analysis
Figure S1 presents typical X-‐ray reflectivity (XRR) spectra of the (010) and (001)
films, acquired in air using a thin-‐film X-‐ray diffractometer (ATX-‐G, CuKα1). The spectra are
plotted as a function of the scattering vector, Qz = 4π(sinθ)/λ, where λ is the wavelength of the
X-‐rays (1.541 Å) and θ is the incident angle. The thickness of each film was estimated by
applying the Fourier transform technique to these X-‐ray reflectivity curves. The thickness,
density and roughness of the films were refined using the Parratt32 data analysis program,
with reflectivity values calculated using Parratt’s method.1 A four-‐layer model composed of
the SrTiO3 substrate, an interfacial layer between the SrTiO3 and the Li2RuO3, the Li2RuO3 film
and a surface layer provided the best fits to the reflectivity curves and the fitting parameters
are summarized in Table S1. The surface layer was found to have a density of approximately 2
g cm-‐3, significantly lower than that of the Li2RuO3 layer (ca. 5.1 g cm-‐3). Low density surface
impurity phases such as Li2CO3 (ρ = 2.1 g cm-‐3) and LiOH (ρ = 1.5 g cm-‐3) are often formed on
lithium intercalation materials due to surface reactions with the moisture and carbon dioxide
in the surrounding air.2-‐5 The low density of the surface layer therefore suggests the
formation of one or more of these impurity phases on the bare Li2RuO3 electrode. No
significant differences in density and roughness were observed between the (010) and (001)

3
films. In addition, the results of analyses of films with different thicknesses indicated that
there was no significant correlation between the film thickness and the density or roughness.
Figure S1. XRR spectra and simulated curves for (a) (010) and (b) (001) films. The insets show simulation models.
Table S1. XRR analysis results for (010) and (001) films.
Thickness, t (nm) Density, d (g cm-‐3) Roughness, r (nm)
(a) Li2RuO3(010) film Surface layer 2.3 2.02 0.6 Li2RuO3 23.7 5.19 2.0
Interphase 4.3 4.79 1.8 SrTiO3 substrate -‐ 5.12 2.2 (b) Li2RuO3(001) film
Surface layer 3.0 1.92 0.6 Li2RuO3 24.3 5.10 2.1 Interphase 5.2 4.79 2.1
SrTiO3 substrate -‐ 5.12 2.2
4
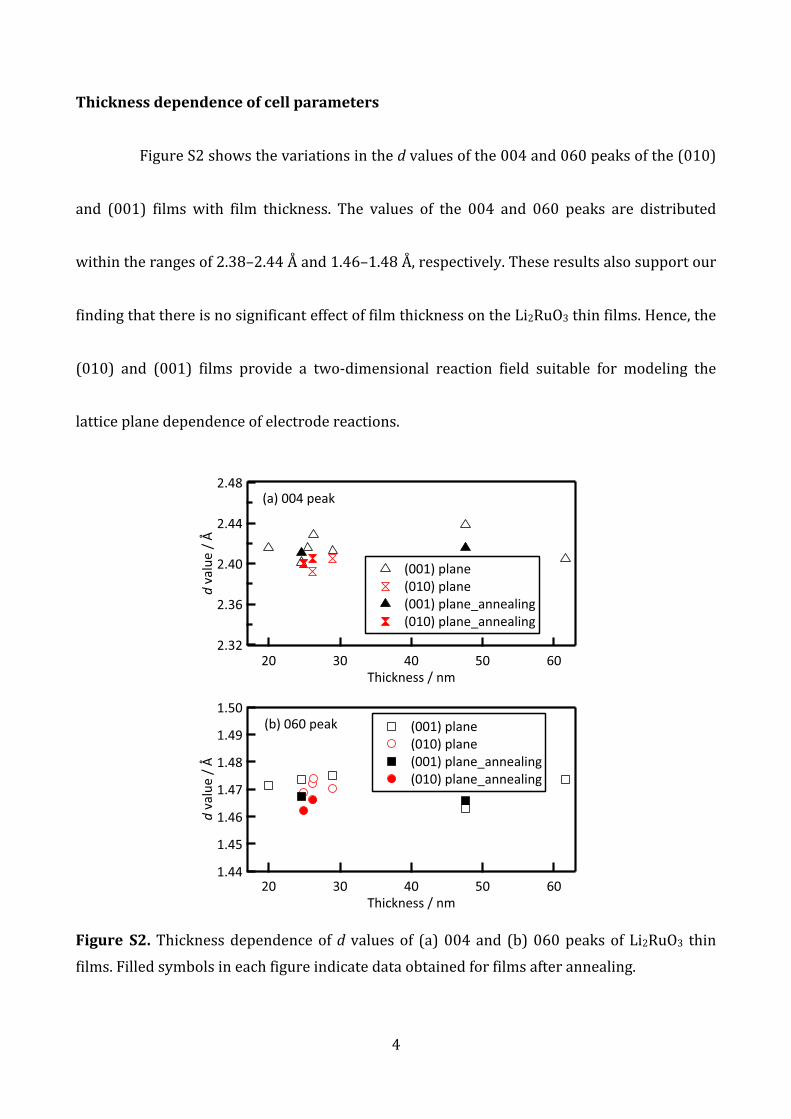
Thickness dependence of cell parameters
Figure S2 shows the variations in the d values of the 004 and 060 peaks of the (010)
and (001) films with film thickness. The values of the 004 and 060 peaks are distributed
within the ranges of 2.38–2.44 Å and 1.46–1.48 Å, respectively. These results also support our
finding that there is no significant effect of film thickness on the Li2RuO3 thin films. Hence, the
(010) and (001) films provide a two-‐dimensional reaction field suitable for modeling the
lattice plane dependence of electrode reactions.
Figure S2. Thickness dependence of d values of (a) 004 and (b) 060 peaks of Li2RuO3 thin films. Filled symbols in each figure indicate data obtained for films after annealing.

5
Bulk structure change of the (010) film along in-‐plane direction
Figure S3 shows the XRD pattern of the in-‐plane 202 diffraction peak for a 61.6
nm-‐thick Li2RuO3(010) film after electrochemical cycling. The charge/discharge test was
performed using a coin-‐type cell, and then the cell was disassembled. The film was washed
in ethanol solution, and the in-‐plane XRD pattern was collected in air using an incident angle
of 0.36° which is higher than the critical angle of Li2RuO3. The penetration depth of X-‐ray
(Cu-‐Kα) was calculated to be 57 nm at the incident angle, which indicates that the in-‐plane
XRD pattern corresponds to the structural change throughout the film. No additional
diffraction peak was observed except for the 202 peak of Li2RuO3. This result confirms that
no irreversible phase transition occurred along the in-‐plane direction at the Li2RuO3(010)
bulk during the electrochemical reactions. This supports that the irreversible phase change
of the (010) film detected by the in situ in-‐plane XRD measurements occurred at the surface
region (Figs. 5 and 6), because the XRD patterns were collected using low incident angles of
X-‐rays below the critical angle of Li2RuO3.

6
Figure S3 XRD pattern of the in-‐plane 202 diffraction peak for a 61.6 nm-‐thick Li2RuO3(010)
film after electrochemical cycling.
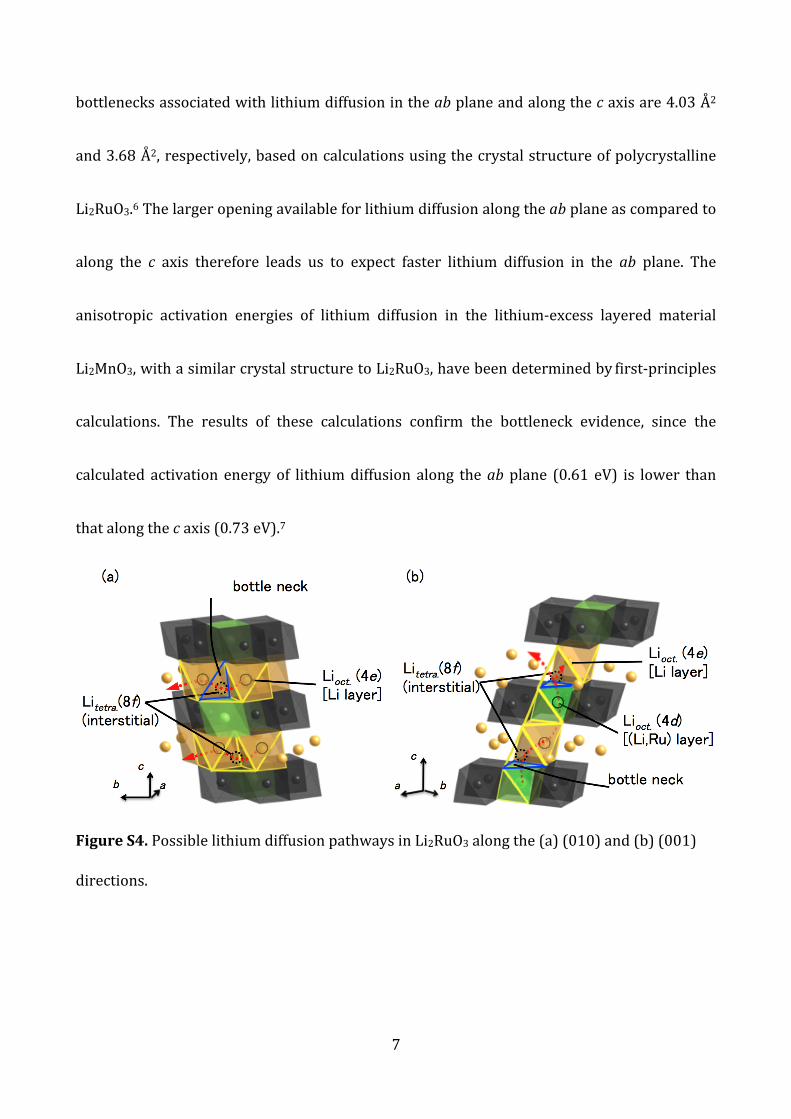
Lithium diffusion pathways in Li2RuO3
Figure S4 shows the possible diffusion pathways of lithium in the ab plane and along
the c axis in Li2RuO3 with the C2/c space group. The (010) film has two-‐dimensional [LiO6]
and [(Li,Ru)O6] layers perpendicular to the electrolyte, which has an interlayer Li diffusion
pathway between the octahedral 4e sites through the interstitial tetragonal 8f site in the ab
plane. In contrast, the (001) film, in which these layers are parallel to the electrolyte, has the
Li diffusion pathway through the [LiO6] and [(Li,Ru)O6] slabs along the c axis. The lithium ions
diffuse from the octahedral 4e sites in the [LiO6] layer to the octahedral 4d sites in the
[(Li,Ru)O6] layer through the interstitial tetragonal 8f site. The interstitial LiO4 tetrahedra and
the LiO6 octahedra share their faces in the ab plane and along the c direction. The sizes of the
7
bottlenecks associated with lithium diffusion in the ab plane and along the c axis are 4.03 Å2
and 3.68 Å2, respectively, based on calculations using the crystal structure of polycrystalline
Li2RuO3.6 The larger opening available for lithium diffusion along the ab plane as compared to
along the c axis therefore leads us to expect faster lithium diffusion in the ab plane. The
anisotropic activation energies of lithium diffusion in the lithium-‐excess layered material
Li2MnO3, with a similar crystal structure to Li2RuO3, have been determined by first-‐principles
calculations. The results of these calculations confirm the bottleneck evidence, since the
calculated activation energy of lithium diffusion along the ab plane (0.61 eV) is lower than
that along the c axis (0.73 eV).7
Figure S4. Possible lithium diffusion pathways in Li2RuO3 along the (a) (010) and (b) (001)
directions.

8
References
1 L. G. Parratt, Physical Review, 1954, 95, 359-‐369. 2 M. Hirayama, N. Sonoyama, M. Ito, M. Minoura, D. Mori, A. Yamada, K. Tamura, J. Mizuki
and R. Kanno, Journal of the Electrochemical Society, 2007, 154, A1065-‐A1072.
3 M. Hirayama, N. Sonoyama, T. Abe, M. Minoura, M. Ito, D. Mori, A. Yamada, R. Kanno, T. Terashima, M. Takano, K. Tamura and J. Mizuki, Journal of Power Sources, 2007, 168, 493-‐500.
4 M. Hirayama, K. Sakamoto, T. Hiraide, D. Mori, A. Yamada, R. Kanno, N. Sonoyama, K. Tamura and J. Mizuki, Electrochimica Acta, 2007, 53, 871-‐881.
5 M. Hirayama, M. Yonemura, K. Suzuki, N. Torikai, H. Smith, E. Watkinsand, J. Majewski
and R. Kanno, Electrochemistry, 2010, 78, 413-‐415. 6 H. Kobayashi, R. Kanno, Y. Kawamoto, M. Tabuchi, O. Nakamura and M. Takano, Solid
State Ionics, 1995, 82, 25-‐31.
7 R. Xiao, H. Li and L. Chen, Chemistry of Materials, 2012, 24, 4242-‐4251.
![RESEARCHARTICLE ZNF804ATranscriptionalNetworksin … · 2017-07-21 · Introduction ZNF804A hasbeenimplicated inSZ andBDinreplicated geneticand molecularstudies[1–2]. Inaddition,](https://img.pdfslide.us/doc/110x75/5fad74873c16985efa44f0d1/researcharticle-znf804atranscriptionalnetworksin-2017-07-21-introduction-znf804a.jpg)