Embed Size (px)
Citation preview
1
Supporting Information Cell-type-specific inhibition of the dendritic plateau potential in striatal spiny
projection neurons Kai Du1,2,8, Yu-Wei Wu3,4,8, Robert Lindroos1,2, Yu Liu3,4, Balázs Rózsa5, Gergely Katona6, Jun B. Ding3,4,9**, and Jeanette Hellgren Kotaleski1,2,7,9**
1Stockholm Brain Institute, 2Department of Neuroscience, Karolinska Institute, Sweden, 3Department of Neurosurgery, 4Department of Neurology and Neurological Sciences, Stanford University School of Medicine, USA 5Laboratory of 3D functional imaging of neuronal networks and dendritic integration, Institute of Experimental Medicine, Hungarian Academy of Sciences, Hungary, 6MTA-PPKE ITK-NAP Two-photon measurement technology research group, Pázmány Péter University, Budapest, Hungary, 7Science for Life Laboratory, School of Computer Science and Communication, KTH Royal Institute of Technology, Sweden, 8Co-first author, 9Co-senior author SI Materials and Methods Detailed SPN Model Summary
We have constructed a biophysically detailed and experimentally grounded SPN model. The
model contains 634 compartments. The SPN morphological data were obtained from the public
database “NeuroMorpho” (cell ID: NMO_04520) (1). The morphology parameters were
compensated for additional spine membrane surface (2). Only a few spines were explicitly
modeled and inserted at the locations of interest. The model was equipped with a large array of
experimentally verified ion channels (3) (Table S1-S3). Ion channel kinetics (Table S3) were
slightly modified from our previous published SPN models(4, 5). Channel parameters were tuned
to fit the present experimental conditions (Fig. S1) and previous published data (4, 6). The
calcium buffer was taken from(4, 5). The model contains GABAA (Table S4), AMPA and NMDA
receptors. The model also uses passive membrane parameters: specific axial resistance at 4
ohm*m, specific membrane resistance at 1.8 ohm*m2, reversal potential of leak channels at -70
mV, and membrane capacitance at 0.01 F/m2. All simulations were performed presumably near
physiology temperature as in our experimental conditions (30-31°C). Details related to synaptic
channels and how to design random synaptic input patterns can be found below.
The model is available on ModelDB (http://modeldb.yale.edu/231416).
Reconstructing Detailed Morphology
The SPN morphological data were obtained from the public database “NeuroMorpho” (cell ID:

2
NMO_04520)(1). The model SPN has 15 primary stems, 59 bifurcations and 133 branches with a
total dendritic length of 2,470 µm. The original SPN model contains 2014 compartments (7). To
reduce the computing costs, we merged short compartments without altering the
three-dimensional structure or dendritic lengths (7). Our current model has 634 compartments.
To account for the additional surface area contributed by dendritic spines, theoretical formulas
were introduced to adjust dendritic length and diameter (2):
L = l * F2/3
D = d * F1/3
where “l” and “d” stand for dendritic length and diameters of the original morphology,
respectively; and “L” and “D” are the adjusted values. “F” is an empirical factor obtained by
performing the following simulation. We designed two purely passive models with identical
morphology and intrinsic properties: one was covered by passive spines distributed from a
distance of 30 µm away from the soma to the tip of the dendrites with the average density of 1
spine/µm, while the second model had no dendritic spines. We then adjusted the morphology of
the model without spines using the F-factor so that the behavior of the two models matched each
other. The F-factor that gave the best result was F = 1.38 and this was thus used for all
simulations.
In addition, the model also contains a few explicitly modeled spines, which were only used for
inducing plateau potentials. The explicitly modeled spines were taken from our previous
published models (4, 5). In brief, the explicitly modeled spines contain two cylindrical
compartments: a spine head and a spine neck. The spine neck is purely passive, while the spine
head contains a calcium buffer, R-type and T-type calcium channels (CaV3.3 and CaV3.2), and
NMDA/AMPA receptors. The maximal permeability of the calcium channels in the spine head can
be found in table S2. For NMDA/AMPA channels, gmaxNMDA = 1880 pS, gmaxAMPA = 340 pS.
Ion Channels and Synaptic Conductance
The model contains a large set of ion channels: fast sodium channels (NAf), fast and slow A-type
potassium channels (KAf and KAs), Inward-Rectified potassium channels (Kir2),
Delayed-rectified potassium channels (Kdr), T-type (Cav3.2,Cav3.3), L-type (Cav1.2, Cav1.3) and
R-type (Cav2.3) calcium channels, and calcium-activated potassium channels (SK and BK). Ion
channel kinetics were slightly modified from our previous published SPN models (4, 5). In
particular, the channel conductances, scaling factors (Q-factor that accounts for temperature

3
effects) and distributions were tuned to fit available experimental data (Fig. S1). The calcium
buffer was taken from our previous models (4, 5).
Details regarding channel parameters can be found in the tables below:
Table S1: Maximal conductance of non-calcium channels in the model (S/m2)
Name soma/axon proximal dendrite distal dendrite
NaF 108000 292.5 97.5
NaP 0.4 0.4 0.4
KaF 5785.2 562.5 375
KaS 554 22.9 22.9
Kir 16.8 12.6 12.6
Kdr 21.75 7.25 7.25
Sk 10 10 10
Bk 500 150 150
Table S2: Maximal permeability of calcium channels in the model (m/s)
Name soma/axon proximal dendrite distal dendrite spine
N-type 5.00E-07
R-type 6.50E-07 6.50E-07 6.50E-07 7.80E-07
Cav3.2, T-type 1.76E-09 9.40E-09
Cav3.3, T-type 1.76E-09 2.35E-08
Cav1.2, L-type 8.38E-08 8.38E-08 8.38E-08
Cav1.3, L-type 1.06E-08 1.06E-08 1.06E-08
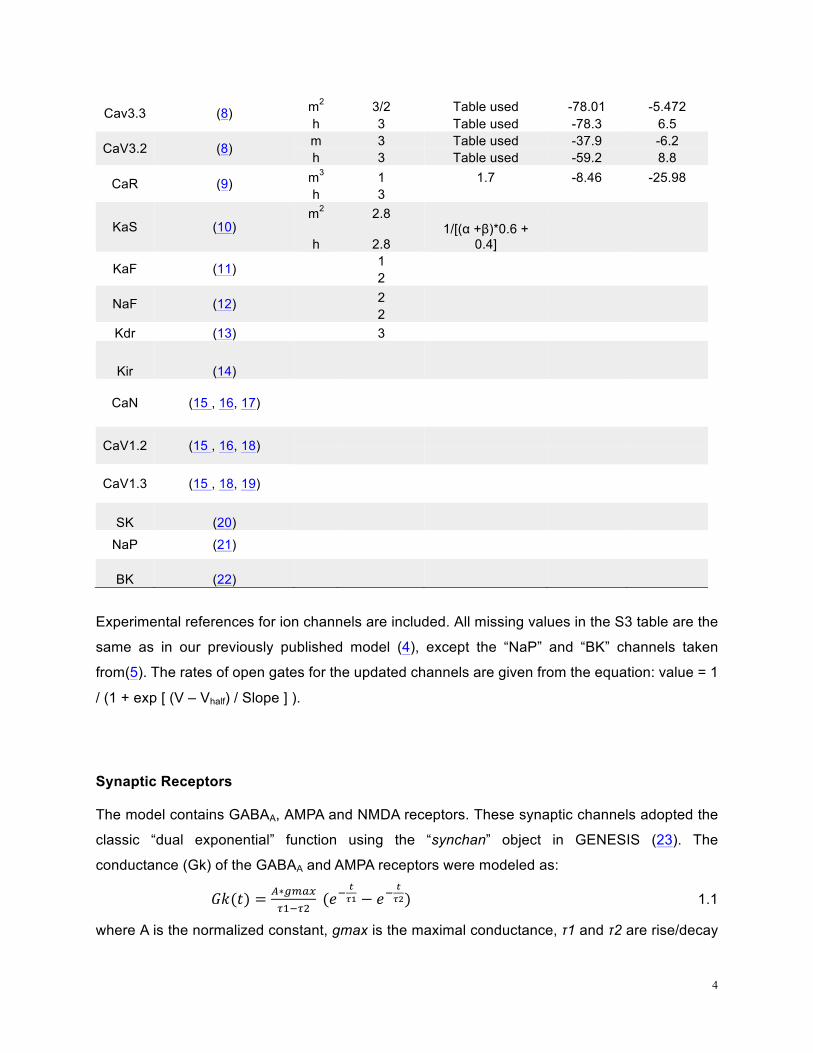
Table S3: Ion channel kinetics summary
Name Reference Gate Scale factor Tau (ms)
Vhalf (mV)
Slope (mV)
4
Cav3.3 (8) m2 3/2 Table used -78.01 -5.472 h 3 Table used -78.3 6.5
CaV3.2 (8) m 3 Table used -37.9 -6.2 h 3 Table used -59.2 8.8
CaR (9) m3 1 1.7 -8.46 -25.98 h 3
KaS (10) m2 2.8
h 2.8 1/[(α +β)*0.6 +
0.4]
KaF (11) 1
2
NaF (12) 2 2
Kdr (13)
3
Kir (14)
CaN (15 , 16, 17)
CaV1.2 (15 , 16, 18)
CaV1.3 (15 , 18, 19)
SK (20)
NaP (21)
BK (22)
Experimental references for ion channels are included. All missing values in the S3 table are the
same as in our previously published model (4), except the “NaP” and “BK” channels taken
from(5). The rates of open gates for the updated channels are given from the equation: value = 1
/ (1 + exp [ (V – Vhalf) / Slope ] ).
Synaptic Receptors
The model contains GABAA, AMPA and NMDA receptors. These synaptic channels adopted the
classic “dual exponential” function using the “synchan” object in GENESIS (23). The
conductance (Gk) of the GABAA and AMPA receptors were modeled as:
!"(!) = !∗!"#$!!!!! (!!
!!! − !!
!!!) 1.1
where A is the normalized constant, gmax is the maximal conductance, τ1 and τ2 are rise/decay

5
time constants, respectively. By varying τ1 and τ2, we were able to model different types of
GABAergic inputs onto SPNs, including collateral inhibitions from neighboring SPNs, somatic
inhibition from fast-spiking interneurons and slow-GABAA inhibition which could originate from
NPY-NGF interneurons, etc.
For the NMDA receptor, the conductance was modeled as the Gk function multiplied by a factor
( fMg_block ) representing a voltage dependent blocking of the core by Magnesium (Mg).
GkNMDA = Gk* fMg_block 1.2
The blocking effect of Mg was implemented using the “Mg_block” object in GENESIS (23), which
follows the equation:
fMg_block = !
!!ŋ[!"!!]!!!" 1.3
[Mg2+] = 1 (mM), ŋ = 2.992, r = 0.01369 (24)
Details for all synaptic receptors can be found in table S4:
Table S4: synaptic receptor kinetics
Synaptic channel type τ 1 (ms) τ 2 (ms) Erev (mV)
Collateral inhibition (25)
1 10 - 60
Somatic FS inhibition (26)
0.25 3.75 - 60
Slow GABAA Receptor (27)
10 80 - 60
NMDA Receptor (28)
5.63/2 231/2 0
AMPA Receptor (29)
1.9 4.8 0
NMDA/AMPA receptors were placed on both spine heads (for those spines we simulated
explicitly) and dendrites. To fit both dendritic plateaus and spontaneous synaptic activity
measured in experiments, maximal conductance of the excitatory synaptic channels on spine
head were gmaxNMDA = 1880 pS, gmaxAMPA = 340 pS, while the maximal conductance on
dendrites were gmaxNMDA = 705 pS, gmaxAMPA = 255 pS, respectively. The maximal
conductances were tuned to match amplitudes of the recorded uEPSPs and sEPSPs in our
experimental conditions (Fig. S1A,B). The NMDA/AMPA ratio of maximal conductance ranged

6
from 2.5 : 1 to 5 : 1, the amplitude of single EPSP recorded in the soma ranged from ~0.5 mV to
~0.8 mV, the maximal conductance of all unitary GABAergic synapses were set to 1,500 pS,
which is in the range of previously reported experimental data (27, 30).
Modeling Spontaneous Synaptic Activities
The spontaneous activities (‘synaptic noise’ in Fig. 2) include 400 excitatory synapses
(gmaxNMDA = 705 pS, gmaxAMPA = 255 pS) and 100 GABAergic synapses (gmaxGABA = 1,500
pS). The number of excitatory and inhibitory synapses was set at a 4:1 ratio, which is consistent
with published data (31). The input patterns follow a Poisson distribution at 1 Hz for excitatory
synapses and 0.5 Hz for inhibitory synapses. All spontaneous active synapses were randomly
distributed during all simulations. Such spontaneous activities could induce a small
depolarization from the resting membrane potential (-86 mV) of the model. The SPN membrane
potential fluctuated to around -82 to -78 mV. In this case, the model was always pre-run for 500
ms before inducing any plateau potentials.
Modeling High Frequency Excitatory Inputs
In addition to the spontaneous activity, a group of 20 excitatory synapses (gmaxNMDA = 705 pS,
gmaxAMPA = 255 pS) receiving high-frequency random activation were added to the model
(independent Poisson trains, 10 Hz for 200 ms). The high frequency inputs should resemble
specific cortical inputs to SPNs. To avoid the situation that the locations of these excitatory
synapses may significantly bias our conclusions, we generated 1,000 groups of spatial patterns
with the following procedure: We first generated a large sample pool consisting of 100,000
spatial patterns. In each pattern, all synapses were randomly distributed throughout the whole
dendritic tree except for the branch containing the clustered inputs. In this “pool”, the averaged
distance to soma (along the dendritic path) of the 20 synapses for each pattern was calculated
and plotted as histogram of the mean distance. Then we randomly picked 1,000 patterns from
the pool based on the histogram. The “mean distance to soma” of these selected patterns
followed a uniform distribution in their distribution histogram (100 samples per bin, 10 bins). The
selected 1,000 spatial patterns were used for all simulations with high-frequency excitatory
inputs. During each trial, we used distinct spatial and temporal patterns for the excitatory inputs.
Modeling Dendritic and Somatic Inhibitory Inputs

7
When simulating dendritic inhibitory inputs, a group of 20 GABAergic synapses receiving random
input were inserted to the model (independent Poisson trains, 5 Hz for 200 ms) to mimic
inhibitory input patterns. We designed three different types of spatial distributions for these
GABAergic synapses: (1) GABA proximal, (2) GABA distal, and (3) GABA inside input branch
(Fig. S3). In order to generate unbiased distribution patterns, we followed a similar procedure as
when generating high-frequency excitatory inputs: we first generated large pools for each of the
four types of distributions, respectively. The mean distance-to-soma was less than 60 µm for all
samples in the proximal pool, and larger than 60 µm for the distal pool. Then we randomly
picked 1,000 patterns from each pool in the same way as mentioned above. The somatic
inhibitory trains were used to mimic inhibition from FS interneurons (independent Poisson trains
at 30 Hz for 200 ms). They were set to exclusively target perisomatic regions. To capture realistic
synaptic dynamics, short-term depression was also added to the somatic GABAergic synapses
since striatal FS interneurons show this characteristics (30) .
Random Pattern Generation in the Simulations
All Poisson trains were generated using the timetable object in GENESIS. We first exported them
to files, which were later imported by the simulator using the timetable object. Thus, in total, we
created millions of files containing the timing of Poisson trains, in which each Poisson train used
in our simulations was documented and could be back-tracked.
Simulation Platform and Numerical Accuracy
We used GENESIS (version 2.3) (23) as the main simulation platform. We ran GENESIS on a
HP Z820 work station (CPU, Xeon 5675, 3G Hz; RAM, 8 GB) or Parallel GENESIS (23) on a
super-computer (Clay X30, ~4,000 CPUs) at PDC, KTH Royal Institute of Technology for all
simulations. To balance the computational cost and numerical accuracy, we used
“Crank-Nicolson” (second order) method (23) throughout our simulations and checked the
numerical accuracy in our simulation. We found that the precision of running simulations with a
time step of 20-50 µs was almost identical to those of 1 µs. Therefore, we used 20 µs (for
simulation without random inputs) and 50 µs (for simulations with random synaptic inputs) as
“time-step” in our simulations.
Animals and Brain Slice Preparation

8
Adult mice (5-9 weeks, male and female) were used for this study. PV-Cre mice (Jackson
Laboratory, JAX # 008069) and A2A-Cre mice (B6.FVB(Cg)-Tg(Adora2acre)KG139Gsat/Mmucd,
MMRRC stock number 036158-UCD) were used for viral injections and optogenetics
experiments. The mice were bred and maintained according to Stanford University School of
Medicine Animal Research Requirements, and all procedures were approved by Stanford
University's Administrative Panel on Laboratory Animal Care. Oblique horizontal brain slices (300
µm) containing the dorsal striatum were obtained from mice of both gender using standard
techniques (6). Briefly, animals were anesthetized with isoflurane and decapitated. The brain was
exposed, chilled with ice-cold artificial CSF (ACSF) containing 125 mM NaCl, 2.5 mM KCl, 2 mM
CaCl2, 1.25 mM NaH2PO4, 1 mM MgCl2, 25 mM NaHCO3, and 15 mM D-glucose (300-305
mOsm). Then brain slices were prepared with a vibrating microtome (Leica VT1200 S, Germany)
and left to recover in ACSF at 34°C for 30 min and then at room temperature (20–22 °C) for at
least additional 30 min before transferring to recording chamber. The slices were recorded within
5 hours after recovery. All solutions were saturated with 95% O2 and 5% CO2.
Viral Expression of Channelrhodopsin-2 (ChR2)
Stereotaxic injections were performed on P18-P21 PV-Cre or A2a-Cre mice under isoflurane
anesthesia. A total volume of 600-700 nl of concentrated (titer: 1.3e13 GC/ml) virus
(AAV5.EF1.dflox.hChR2(H134R)-mCherry.WPRE.hGH, UPenn Vector Core #AV-5-20297P) (32)
solution was injected unilaterally (right hemisphere) into the dorsolateral striatum (at AP 1.2 mm,
ML 2.0 mm, and DV 3.2 mm from bregma, Fig. S5). Injection was performed using a micropipette
(VWR) pulled with a long narrow tip (size ~10-20 µm) using a micropipette puller (Sutter
Instrument). The glass micropipette was inserted into the brain and left for 6 min before virus was
injected at an infusion rate of 100 nl/min. The pipette was gently withdrawn 6 min after the end of
infusion. Following surgery, the scalp was sutured. Animals were used at 4-6 weeks after AAV
injections. Injection sites were verified in slices fixed after each recording session (Fig. S5A-C).
Electrophysiological Recording
Individual slices were transferred to a recording chamber mounted to an upright microscope
(Olympus BX-51) and was continuously superfused with ACSF at a rate of 2-4 ml/min (30 -
31°C). Striatal SPNs were visually identified under infrared differential interference contrast (DIC)
optics with a water-immersion objective lens (60×, NA = 1.0; Olympus, Japan). SPNs were then

9
further confirmed by their spiny morphological signature with two-photon imaging. Whole-cell
voltage- and current-clamp recordings were obtained with a patch pipette (3–5 MΩ) filled with a
solution containing 135 mM KCH3SO3, 5 mM KCl, 10 mM HEPES, 8 mM Na2-Phosphocreatine,
0.3 mM Na2GTP, 4 mM MgATP, 0.1 mM CaCl2, 1 mM EGTA (pH 7.2-7.3, 285-290 mOsm, pH was
adjusted with KOH). For voltage clamp recording of IPSCs, 2 mM QX-314 Cl was added to the
internal solution to prevent spiking. Series resistance of the cells was measured by injection of
hyperpolarizing pulses (−5 mV, 100 ms). The series resistances were < 20 MΩ. In current clamp
recording mode, bridge balance was applied to compensate series resistance. Resting
membrane potential was adjusted to –75 mV via somatic current injection to facilitate dendritic
plateau induction for all current clamp recordings. Recordings were obtained with a Multiclamp
700B (Molecular Devices, USA). Signal were filtered at 2.2 kHz and digitized at 10 kHz with NI
PCIe-6259 card (National Instruments). The data were recorded with custom-made software
written in Matlab (Mathworks) described previously (33).
Two-Photon Imaging
SPNs were filled with Alexa Fluor 594 (50 µM; Invitrogen, USA) or Alexa Fluor 488 (100 µM) to
reveal the dendritic morphology via whole-cell patch-clamp pipettes for at least 10 min before
imaging. Two-photon imaging was performed with a custom built 2-photon laser-scanning
microscope as described previously (34) equipped with a mode-locked tunable (690–1040 nm)
Ti:sapphire laser Mai Tai eHP DS (Spectra-Physics, USA) tuned to 830, 925, and 760 nm for
imaging Alexa Fluor 594, Alexa Fluor 488, and mCherry, respectively.
Local Electrical Stimulation
Local bipolar stimulation for synaptic release was achieved with an extracellular theta glass
pipette (O.D./I.D. = 1.50/1.17 mm; Sutter, USA) placed adjacent to the dendrites. The pipette had
a tip diameter 2–3 µm and was filled with ACSF containing Alexa Fluor 594 (5 µM) for identifying
the pipette position. Constant voltage (5 to 40 V) stimulation was delivered via an isolated
stimulator (Iso-Flex, AMPI, Israel). Two pulses (0.1 ms) with 10 ms interval were used to induce
dendritic plateau potentials. A successful plateau was defined by peak amplitude of EPSP
reaching supra-linear range with the half-duration greater than 50 ms with 35 V or lower
stimulation intensity (Fig. S1E-G).

10
Optogenetic Stimulation
To stimulate local GABA release from ChR2-expressing axon terminals, 450 nm blue laser light
(0.1-0.5 ms pulse, OptoEngine, UT, USA) was collimated, combined and aligned with lasers for
2-photon imaging and 2PLU before entering scanning mirrors, creating a scannable focal spot
with ~19 µm lateral diameter under the objective. The intensities of the laser powers used for
2PLU (730 nm, 20 - 50 mW) and optogenetic stimulation (450 nm, ~0.2 – 1.4 mW under the
objective) were tuned to make sure the amplitude and waveforms of uEPSPs were comparable
to spontaneous EPSPs (Fig. S1B), and ratios between oIPSCs and uEPSCs amplitudes
resembled those obtained with local electrical stimulation (Fig. 4A and S5F). Typically, oIPSC
amplitudes under this condition were between 100 to 200 pA. Interval between each trial was at
least 30 seconds. Each recording was performed in an individual brain slice.
Two-Photon Glutamate Uncaging and Single-Photon GABA Uncaging
4-methoxy-5,7-dinitroindolinyl-L-glutamate trifluoroacetate (DNI-caged glutamate, 0.7 mM or 5
mM) or 4-methoxy-7-nitroindolinyl-caged L-glutamate trifluoroacetate (MNI-caged glutamate, 5
mM) was freshly dissolved in dark environment in bath solution (ACSF or Mg2+-free ACSF) with
mini-circulated perfusion system (heated to 30 - 31°C). The 95% O2 and 5% CO2 was humidified
before bubbling the recording solution. Two-photon uncaging was carried out using a second
mode-locked tunable (690–1040 nm) Ti:sapphire laser Mai Tai eHP (Spectra-Physics, USA)
tuned to 730 nm. The uncaging power was typically ~20–50 mW under objective and adjusted
for each dendrite to obtain uEPSCs with near physiological amplitudes (Fig. S1A).
Ruthenium-bipyridine-triphenylphosphine-caged GABA (Rubi-GABA, 20 µM) was freshly
dissolved from 5 mM stock solution into the bath solution. A 450 nm blue laser light (5-10 ms
pulse, Opto Engine, UT, USA) was collimated and combined with two-photon laser light path with
a 680 nm long-pass dichroic mirror (Chroma, Bellows Falls, USA) before entering scanning
mirrors. The diameter of the focal spot of the blue laser was measured with a thin fluorescent
filament and was 19 µm. The 830, 730, and 450 nm lasers were aligned on a daily basis before
recording using 0.2 µm fluorescent microspheres (FluoSpheres, Invitrogen, USA). 450 nm laser
power (0.7 – 1.2 mW under the objective) was adjusted in each recording to evoke a uIPSC with
peak amplitude ~80% of the uEPSC evoked by two-photon uncaging of glutamate (Fig. S5F and
S9E). No EPSC was observed by blue light illumination.

11
Dual-color uncaging experiments were performed under 25× objective (NA = 0.95; Olympus,
Japan) to obtain a wider imaging field. To induce plateau potential, 20 spines were selected and
assigned with the 730 nm laser glutamate uncaging locations at their spine heads in a
pseudo-random order with a 0.8 ms pulse duration and 1 ms inter-stimulation interval (ISI). In
Mg2+-free condition, only 10 spines were selected for plateau induction. GABA uncaging was
delivered after the last spine activated by glutamate uncaging with 10 - 20 ms delay from the last
720 nm laser pulse). For testing the GABA effect on the plateau potential, dendritic plateau
potentials were induced by two trials of glutamate uncaging without and with GABA uncaging,
respectively, with a 30 s inter-trial interval.
Data Analysis and Statistical Methods
Data analysis was performed in Matlab (MathWorks, USA), Clampfit (Molecular Devices, USA)
and ImageJ. Statistical analyses were performed using Origin 8.1 (OriginLab, USA) and Prism 7
(GraphPad Software, USA). Summary data are reported as mean ± SEM. Non-matched samples
were analyzed with the nonparametric Mann-Whitney U test. Matched samples were analyzed
with Wilcoxon signed ranks test. Multiple comparisons with repeated measurement was
analyzed with Friedman test followed by post-hoc Dunn's multiple comparisons test. For
comparing the probability of plateau induction across conditions, Fisher's exact test was used. P
< 0.05 was considered statistically significant.
Reagents and Chemicals
All reagents were purchased from Sigma-Aldrich (St. Louis, USA), except Picrotoxin, (+)-MK 801
maleate (MK-801), CGP 55845, Rubi-GABA, and QX-314 Cl (Tocris, Bristol, UK). Alexa Fluor
488 and Alexa Fluor 594 were purchased from Thermo Fisher (USA). MNI-caged glutamate TFA
and DNI-caged glutamate TFA were provided by Femtonics (Budapest, Hungary).

12
SI References 1. Ascoli GA, Donohue DE, & Halavi M (2007) NeuroMorpho.Org: A central resource for
neuronal morphologies. J Neurosci 27(35):9247-9251.
2. Segev I & RE B (1998) Compartmental models of complex neurons. . Methods in neuronal modeling: from ions to networks, eds Koch C & I SCambridge, MA: MIT), 2 Ed, pp 93-136.
3. Gerfen CR & Surmeier DJ (2011) Modulation of Striatal Projection Systems by Dopamine. Annu Rev Neurosci 34:441-466.
4. Evans RC, et al. (2012) The effects of NMDA subunit composition on calcium influx and spike timing-dependent plasticity in striatal medium spiny neurons. Plos Comput Biol 8(4):e1002493.
5. Paille V, et al. (2013) GABAergic Circuits Control Spike-Timing-Dependent Plasticity. J Neurosci 33(22):9353-9363.
6. Wu YW, et al. (2015) Input- and Cell-Type-Specific Endocannabinoid-Dependent LTD in the Striatum. Cell Rep 10(1):75-87.
7. Lindroos R, Pieczkowski J, Du K, & Kotaleski JH (2013) Evaluating dendritic impact using complex and reduced models of medium spiny neurons. INCF Neuroinformatics Congress.
8. Iftinca M, et al. (2006) Temperature dependence of T-type calcium channel gating. Neuroscience 142(4):1031-1042.
9. Foehring RC, Mermelstein PG, Song W-J, Ulrich S, & Surmeier DJ (2000) Unique properties of R-type calcium currents in neocortical and neostriatal neurons. Journal of Neurophysiology 84(5):2225-2236.
10. Shen W, Hernandez-Lopez S, Tkatch T, Held JE, & Surmeier DJ (2004) Kv1. 2-containing K+ channels regulate subthreshold excitability of striatal medium spiny neurons. Journal of neurophysiology 91(3):1337-1349.
11. Tkatch T, Baranauskas G, & Surmeier DJ (2000) Kv4. 2 mRNA abundance and A-type K+ current amplitude are linearly related in basal ganglia and basal forebrain neurons. J Neurosci 20(2):579-588.
12. Ogata N & Tatebayashi H (1990) Sodium current kinetics in freshly isolated neostriatal neurones of the adult guinea pig. Pflügers Archiv European Journal of Physiology 416(5):594-603.
13. Migliore M, Hoffman DA, Magee JC, & Johnston D (1999) Role of an A-type K+ conductance in the back-propagation of action potentials in the dendrites of hippocampal pyramidal neurons. Journal of computational neuroscience 7(1):5-15.
14. Steephen JE & Manchanda R (2009) Differences in biophysical properties of nucleus accumbens medium spiny neurons emerging from inactivation of inward rectifying

13
potassium currents. Journal of computational neuroscience 27(3):453-470.
15. Kasai H & Neher E (1992) Dihydropyridine-sensitive and omega-conotoxin-sensitive calcium channels in a mammalian neuroblastoma-glioma cell line. The Journal of physiology 448:161.
16. Churchill D & Macvicar BA (1998) Biophysical and pharmacological characterization of voltage-dependent Ca2+ channels in neurons isolated from rat nucleus accumbens. Journal of neurophysiology 79(2):635-647.
17. McNaughton N & Randall A (1997) Electrophysiological properties of the human N-type Ca 2+ channel: I. Channel gating in Ca 2+, Ba 2+ and Sr 2+ containing solutions. Neuropharmacology 36(7):895-915.
18. Bell D, et al. (2001) Biophysical properties, pharmacology, and modulation of human, neuronal L-type (α1D, CaV1. 3) voltage-dependent calcium currents. Journal of Neurophysiology 85(2):816-827.
19. Xu W & Lipscombe D (2001) Neuronal CaV1. 3α1 L-type channels activate at relatively hyperpolarized membrane potentials and are incompletely inhibited by dihydropyridines. J Neurosci 21(16):5944-5951.
20. Maylie J, Bond CT, Herson PS, Lee WS, & Adelman JP (2004) Small conductance Ca2+�activated K+ channels and calmodulin. The Journal of physiology 554(2):255-261.
21. Magistretti J & Alonso A (1999) Biophysical properties and slow voltage-dependent inactivation of a sustained sodium current in entorhinal cortex layer-II principal neurons. The Journal of general physiology 114(4):491-509.
22. Moczydlowski E & Latorre R (1983) Gating kinetics of Ca2+-activated K+ channels from rat muscle incorporated into planar lipid bilayers. Evidence for two voltage-dependent Ca2+ binding reactions. The Journal of General Physiology 82(4):511-542.
23. Bower JM & Beeman D (1998) The Book of GENESIS�Exploring Realistic Neural Models with the GEneral NEural SImulation System (Springer Science & Business Media) 2 Ed.
24. Vargas-Caballero M & Robinson HPC (2003) A slow fraction of Mg2+ unblock of NMDA receptors limits their contribution to spike generation in cortical pyramidal neurons. Journal of Neurophysiology 89(5):2778-2783.
25. Taverna S, Ilijic E, & Surmeier DJ (2008) Recurrent collateral connections of striatal medium spiny neurons are disrupted in models of Parkinson's disease. J Neurosci 28(21):5504-5512.
26. Galarreta M & Hestrin S (1997) Properties of GABA(A) receptors underlying inhibitory synaptic currents in neocortical pyramidal neurons. J Neurosci 17(19):7220-7227.
27. Ibanez-Sandoval O, et al. (2011) A Novel Functionally Distinct Subtype of Striatal Neuropeptide Y Interneuron. J Neurosci 31(46):16757-16769.

14
28. Chapman DE, Keefe KA, & Wilcox KS (2003) Evidence for functionally distinct synaptic NMDA receptors in ventromedial versus dorsolateral striatum. Journal of Neurophysiology 89(1):69-80.
29. Ding J, Peterson JD, & Surmeier DJ (2008) Corticostriatal and thalamostriatal synapses have distinctive properties. J Neurosci 28(25):6483-6492.
30. Planert H, Szydlowski SN, Hjorth JJJ, Grillner S, & Silberberg G (2010) Dynamics of Synaptic Transmission between Fast-Spiking Interneurons and Striatal Projection Neurons of the Direct and Indirect Pathways. J Neurosci 30(9):3499-3507.
31. Wilson CJ (2007) GABAergic inhibition in the neostriatum. Prog Brain Res 160:91-110.
32. Boyden ES, Zhang F, Bamberg E, Nagel G, & Deisseroth K (2005) Millisecond-timescale, genetically targeted optical control of neural activity. Nat Neurosci 8(9):1263-1268.
33. Pologruto TA, Sabatini BL, & Svoboda K (2003) ScanImage: flexible software for operating laser scanning microscopes. Biomed Eng Online 2:13.
34. Carter AG & Sabatini BL (2004) State-dependent calcium signaling in dendritic spines of striatal medium spiny neurons. Neuron 44(3):483-493.

Fig. S1. Validation of the SPN model and 2-photon glutamate uncaging, and demonstrationng that local GABAergic inhibition dampensed the generation of dendritic plateaus. (A) Representative single and averaged 2-photon glutamate uncaging-evoked EPSCs (uEPSCs) and spontaneous EPSC (sEPSC). Shaded areas indicate mean value ± SEM The properties of uEPSCs and model EPSCs are comparable with sEPSCs (uEPSC: amplitude = 24.7 ± 2.1 pA, 10-90 rise time = 2.7 ± 0.3 ms, decay tau = 7.3 ± 1.0 ms, n = 19 events/3 cells; sEPSC: amplitude = 23.4 ± 1.8 pA, 10-90 rise time = 2.9 ± 0.3 ms, decay tau = 9.8 ± 1.3 ms, n = 31 events/3 cells). (B) Representative single and averaged traces of 2-photon glutamate uncaging induced EPSP (uEPSP) and spontaneous EPSP (sEPSP). Shaded areas indicate mean value ± SEM The properties of uEPSPs and model EPSPs are comparable with sEPSPs (uEPSP: amplitude = 0.93 ± 0.10 mV, 10-90 rise time = 6.4 ± 0.9 ms, decay tau = 29.0 ± 5.7 ms, n = 11 events/3 cells; sEPSP: ampli-tude = 0.60 ± 0.07 pA, 10-90 rise time = 6.3 ± 0.7 ms, decay tau = 26.2 ± 4.2 ms, n = 31 events/3 cells). (C) Representative traces of current-clamp recordings from SPNs (black: experiment; red: model) in response to current injections (700 ms, 50-pA steps). (D) Summary of F-I curves generated by experiments (n = 11, gray dashed lines) and by a detailed SPN model (red line). (E and F) Examples illustrating success (E) and failure (F) in generation of dendritic plateau potentials when GABAARs were unblocked in brain slices. Upper, representative traces of the depolarization induced by increasing the intensity of local electri-cal stimulation at distal dendrites of SPNs. Lower, the peak amplitude (black) and duration (blue) of EPSPs were plotted against stimulation intensity. The amplitude of the depolarization became supra-linear at certain stimulation intensities (red dashed squares). The duration of EPSPs was increased when a plateau potential was successfully evoked (E), whereas the duration was shortened when failure occurred (F). (G) The success rate for plateau generation is significantly higher when GABAAR was blocked by PTX (50 µM) (upper, control (Ctrl) in ACSF: successful rate = 6.3 %, 1 out of 16 cells; in PTX: successful rate = 58.3 %, 7 out of 12 cells, Fisher Exact test, p = 0.0042). Summary statistics of the mean duration of plateau (lower, ACSF 36.8 ± 1.9 ms, n = 16 cells; in PTX: 55.0 ± 4.0 ms, n = 12 cells, Mann-Whitney, p = 0.0028).
-86 mV
20 mV
200 ms
C ModelExperiment
Num
ber o
f spi
kes
Current Injection (pA)
Model
D
0 100 200 300 400 5000
10
20
30
40
Experiment
A sEPSCsuEPSCs Model sEPSPsuEPSPsEPSC
ModelEPSP
10 ms
10 pA
B
20 ms
0.5 mV
10 V
15 V
20 V
25 V30 V
50 ms
5 mV
E F
100 Hz 100 Hz
30 V
25 V20 V15 V
10 V
35 V
Success Failure
50 ms
5 mV
10 20 300
5
10
15
20
25
Amplitude Duration
Stimulation intensity (V)
EPSP
am
plitu
de (m
V)
0
20
40
60
80
100
Duration (m
s)
Successful
10 20 300
5
10
15
20
25 Amplitude Duration
Stimulation intensity (V)
EPSP
am
plitu
de (m
V)
0
20
40
60
80
100
Duration (m
s)
Failure
ACSF PTX0
20
40
60
80
100
(16) (12)
*
Succ
ess r
ate
(%)
ACSF PTX(16) (12)
0
20
40
60
80
100
Dur
atio
n (m
s)
*
G
(16) (12)

8
0 20 40 60 80 1000
50
100
Mean distance-to-soma (µm)
Sim
uatio
n tr
ial
num
ber
B
20
40
60
80
Firin
g pr
obab
ility
(%)
100 ms1 mV
iii
iii
0
0.2
0.4
0.6
0.8
1
Avg
spik
e nu
mbe
r
0 20 40 60 80 100
A
Clustered input
0
i iiiiiScaled iiScaled iii
0
1st bin 5th bin 10th bin
EPSP triggered by high frequency input
Single trial
Averaged
Spike timing (ms)0 25050 100 150 200
0
10
20
Spik
e nu
mbe
r
∆text = 60 ms
0
10
20
Spike timing (ms)
Spik
e nu
mbe
r
0 25050 100 150 200
∆text = 0 ms
∆text (ms)
∆text (ms)
E∆t = 0 ms∆t = 20 ms∆t = 40 ms∆t = 60 ms∆t = 80 ms∆t = 100 ms
0
20
40
60
80
Mean distance (µm)20 40 60 80 100
100
Firin
g pr
obab
ility
(%)
F
∆t = 0∆t =
10
∆t = 20
∆t = 30
∆t = 40
∆t = 50
∆t = 60
∆t = 70
∆t = 80
∆t = 90
∆t = 100
-0.5
0.0
0.5
Fitt
ing
slope
/µ
m)
(ms)
Clustered inputHigh freq. Input
∆t Ext
0 20 40 60 80 100
-
20
40
60
80
Firin
g pr
obab
ility
(%)
Clustered inputDynamic I-clampScaled dynamic I-clamp
0
∆tExt (ms)0 20 40 60 80 100
100 ms60 pA
5 mV
Clustered input + NoiseDynamic I-clamp
Dynamic I-clamp
High freq. inputNoise
C
High freq. inputNoise
100 ms
I inj.
20 mV
w/o high freq. input
with high freq. input
D
Fig. S2. Dendritic plateau potentials broadens theed spatiotemporal integration windows for excitatory inputs (A) Left, clustered inputs were activated at different locations within the same dendritic branch (i, ii, and iii). Temporal window for integrating excitatory inputs was broadened only when a dendritic plateau potential was generated at a distal dendrite (iii). Right, summary of simulated firing probability (upper) and averaged spike number (lower) (n = 1,000 trials). (B) Representative histograms of spike number and spike timing with ∆tEXT= 0 ms (upper) and 60 ms (lower). The spiking timing was defined as delay to the activation of the last spine onset timing of spikes relative to the clustered inputs. (C) Left, dynamic current clamp (I-clamp) was placed at the soma and coupled to high frequency inputs. The I-clamp was designed to reproduce an identical somatic depolarization mimicking a plateau potential induced by clustered synaptic inputs. Right, representative traces of somatic depolarization induced by dynamic I-clamp (blue) and clustered inputs (red) without (upper) and with (lower) coupling to high frequency inputs. (D) Summary of firing probability induced by dynamic I-clamp and clustered synaptic inputs coupled with high frequency inputs (n=1,000 trials ). The data suggests somatic depolarization is not sufficient to induce cell-wide integration of excitation. (E) Upper, representative traces of single trials and averaged EPSPs during activation of high frequency excitatory inputs (5 Hz independent Poisson trains for 200 ms). Lower, simulation trial numbers for each mean distance-to-soma bin. Each bin consists of 100 trials, and there are 10 total bins from 30 to 100 µm. (F) Linear regression of the input distance-to-soma vs firing probabilities for different ΔtExt (0 to 100 ms). Upper, represen-tative examples of fitting. Lower, the slopes of the linear regression fit (the spatial profile of integration for excitation) were close to zero for all ΔtExt, suggesting a spatially unbiased integration for excitation.

GABAoutside input branch
A GABA distal
GABA proximal
GABA within input branch
Clustered input
High freq. inputGABA trains
Somatic IPSCs triggered by GABA train
Single trial
Averaged
0 20 40 60 80 100
No GABAInside input branchOutside input branch
20
40
60
80
Firin
g pr
obab
ility
(%)
0
∆t Ext (ms)
Sim
uatio
n tr
ial
num
ber
Mean 0 50 100
0
50
100
0 50 1000
50
100
Mean 0 50 100
0
50
100
Mean distance-to-soma (µm)
B
E
200 40 60 80 100
Single trial
Averaged
1200
50
100
Mean distance-to-soma (µm)
Sim
uatio
n tr
ial
num
ber
F
100 ms 20 pA
100 ms 20 pA
distance-to-soma (µm) distance-to-soma (µm)
20 GABA “In Branch”
No GABA2 GABA “On-site”
20 GABA Proximal20 GABA Distal
∆t Ext
Clustered inputHigh freq. inputInhibitory train
0 20 40 60 80 100
Firin
g pr
obab
ility
(%)
0
20
40
60
80
100
Δt (ms)Ext
0
20
40
60
80
100
Δt (ms)Ext
0 20 40 60 80 100
C D
∆t Inh= 45 ms
Unitary inh. inputor
Redu
ced
ring
(% o
f No
GAB
A)
Fig. S3. SPN firing inhibited by different spatial distributions of GABA trains (A) Examples of three different inhibitory input patterns: proximal (left), distal (middle) and within the same branch (defined as all branches which share the same primary dendrites as the clustered input; “within input branch”) (right). Note that the total inhibition remains the same, i.e. 20 independent GABAergic synapses are activated using a Poisson distribution at 5 Hz for 200 ms. (B) Upper, representative traces of somatic IPSCs (single trial and averaged trace of 100 trials) driven by inhibitory inputs at different locations (5Hz independent Poisson trains for 200 ms). Lower, the simulation trial numbers for each mean distance-to-soma bin for all 3 distribution patterns. Each bin of the histogram consists of 100 trials, while the total simulation contains 10 bins of different mean distance-to-soma. (C and D) Comparison of the effect of inhibition on spiking output by local unitary or distributed GABAergic inputs. Firing probability (C) and reduction in firing (D) were plotted as functions of ∆tExt. (E) Simulation of the inhibitory effect on spiking when the GABA synapses were distributed strictly outside the input branch (“GABA outside input branch”). Upper, represented traces for individual trial or averaged IPSCs driven by inhibitory inputs (5Hz independent Poisson trains for 200 ms). Lower, distribution patterns of “GABA outside input branch” were plotted in histogram (10 bins, 100 trials per bin) as a function of mean distance-to-soma. (F) Summary of firing probabilities for GABA synapses located in the input branch (GABA in branch, blue) or outside the input branch (GABA out branch, green). When GABA synapses were located exclusively outside of the input branch, only a small reduction in spiking was achieved.

BClustered inputHigh freq. inputInhibitory input 20 mV
On-site GABA
100 ms
20 mV
plateau site
No GABA
soma
100 ms
A
High freq. inputNoiseInhibitory input
On-site
Soma
No GABA
D
On-path
∆tInh
C
Clustered inputHigh freq. inputInhibitory input 20 mV
On-site GABA
100 ms
20 mV
No GABA
20 mV
A
High freq. inputNoiseInhibitory input
On-site
0 10 20 30 40 50 60Δt (ms)Inh
0 10 20 30 40 50 60Δt (ms)Inh
No GABA
On-path
∆tInh
ECl = − 60 mVECl = − 65 mVECl = − 70 mVECl = − 75 mV
0 10 20 30 40 50 60∆t (ms)Inh
0
20
40
60
80
100
Firin
g pr
obab
ility
(%)
irt
On-site
Firin
g pr
obab
ility
(%)
Fr
r
Δt Inh
Clustered inputHigh freq. inputGABA
E F
On-path
Soma
On-site
Off-path
Off-path
0
20
40
60
80
100
0 10 20 30 40 50 60
∆tExt = 0 ms
∆t (ms)Inh
Clustered inputHigh freq. input
Δt Ext
∆t Inh
GABA
∆tI-inj
Clustered inputHigh freq. inputCurrent injection
No current injection
High freq. inputNoise
20 pA40 ms
Current injection
On-path
Soma
On-site
t
Current injection
0 10 20 30 40 50 60ΔtI-inj (ms)
H r q
20 pA40 ms
Current injection
On-path
On-site
On-siteOn-path
SomaOff-path
Off-path
On-site
∆tExt = 30 ms
∆tExt = 60 ms
0
20
40
60
80
100
0
20
40
60
80
100
Firin
g pr
obab
ility
(%)
irt
Firin
g pr
obab
ility
(%)
irt
Fig. S4. Branch-specific inhibition of spiking(A) The simulation scheme for timing of clustered, high frequency, and inhibitory inputs. In addition to background noise and high frequency inputs, the model SPN was loaded with additional unitary inhibitory inputs. Inhibitory synapses (2 GABAergic synapses, gmaxGABA = 1,500 pS, ECl- = - 60mV) were placed at selected locations: plateau site (on-site), on the same dendrite proximal to plateau site (on-path), off the dendrite that contains the plateau site (off-path), and the soma. For each location, inhibitory synapses were activated with a time delay, ∆tInh. Lower inserts: example voltage traces (n = 20 trials) recorded at the “plateau site” (blue curves) or soma (red curves) when 2 GABAergic synapses were activated. Grey traces represent the plateau potentials that failed to trigger spike. (B) Upper: example simulated somatic voltage traces (20 trials, the arrow indicates GABAAR activation). Lower: Firing probabili-ties (n = 1,000 trials per condition) were plotted as functions of ∆tInh. (C) Firing probabilities for ‘on-site’ inhibition were plotted as functions of ∆tInh at ∆tExt = 0, 30, and 60 ms. (D) Firing probabilities for ‘on-site’ inhibition were plotted as functions of ∆tInh under different ECl-. (E) The simulation procedure was the same as in (A), but GABAergic synapses were replaced with IPSC-like current injections (inset) at selected locations (on-path, on-site, off-path, and soma). (F) Firing probabilities were plotted as a function of current injection timing (∆tI-inj).

(6)
H
J
K
20 ms
0.5 mV
730 nm450 nm
2 mV
ΔVm
(mV)
4
2
3
1
*
0-10 ms 10 ms 30 ms 50 ms
730 nm450 nm
-10 ms
730 nm450 nm
10 ms
730 nm450 nm
30 ms
40 ms
4 mV
730 nm450 nm
50 ms
Δt (ms) Inh
ΔVm
A
B
Ctx
DLS
LGPic
Oblique horizontal slice
AAV5 DIO-ChR2-mCherry
P28 PV-Cre mouse
20 µm
A2a-Cre; AAV5 DIO-ChR2-mCherry
P28 PV-Cre mouse
20 µm
PV-Cre; AAV5 DIO-ChR2-mCherry
SPN
PV-Cre;ChR2
730 nm450 nm
450 nm730 nm
50 ms50 pA
oIPSC
uEPSC
100 ms
200 pAiii
ii
ii ii iii
D
20 µm
E
1p 450 nm
mCherryAlexa 488
A2a-Cre; AAV5 DIO-ChR2-mCherry
0
40
80
120
Peak
cur
rent
(%)
(5)100 ms
200 pA
CtrlDNI-Glu (0.7 mM)
450 nm
F
DNI-Glu (0.7 mM)
GGlu uncaging
ChR2
Δt Inh= Δt Inh
IDendritic inhibitionby PV interneuron
1p 450 nm
PV-Cre;ChR2-mCherryAlexa 488
2p 730 nm
20 µm
PV-Cre; AAV5 DIO-ChR2-mCherry
100 ms100 pA
Local eStim
2 stim @100 Hz
I/E ra
tio
0
0.5
1
1.5
(4)
-70 mV
eEPSC
+10 mV
eIPSC
Local eStim
C
Ctx
DLS
A2a-Cre;mCherry
500 µm
CCtx
DLS
PV-Cre;mCherry
500 µm
oIPSC
Glu Glu + GABA
*
Fig. S5. Combining optogenetics and 2-photon glutamate uncaging(A) Illustration of the virus injection sites. AAV5 DIO-ChR2-mCherry was injected to dorsolateral striatum (DLS) of A2a-Cre and PV-Cre mice. (B-C) Left, epi-fluorescent images of mCherry signal in AAV5 DIO-ChR2-mCherry injected A2a-Cre (B) and PV-Cre (C) mice. Right, confocal images of DLS in A2a-Cre (B) and PV-Cre (C) mice of boxed areas. (D) Spatial profile of optogenetic activation of GABAergic axon terminals (450 nm blue laser, focal spot diameter = ~ 19 μm). Left, 2-photon image of a SPN filled with green fluorescence, Alexa 488 (green) from a brain slice with ChR2-mCherry (red) expression. 450 nm laser locations for optogenetic stimulation are marked with blue circles. Right, IPSCs evoked by blue laser (oIPSCs) at corresponding locations shown in left (blue shaded area i - iii). (E) DNI-caged glutamate (DNI-Glu) at a low working concentration (0.7 mM) preserved 36.4 ± 9 % of oIPSC (n = 5 cells). (F) The ratio of eIPSCs and eEPSCs (I/E ratio) evoked by local electrical stimulation is ~0.8 ± 0.2 (n = 4 cells). (G) Dendritic inhibition of plateau potentials by PV interneurons. Experimental scheme of dendritic inhibition on plateau potential in SPNs by dendritic targeted axon terminals of PV interneurons. 2PLU of DNI-Glu was achieved by 730 nm laser, and the locations of uncaging are indicated with the red circles. Optogenetic activation of GABA release from dendritic targeted axon terminals of PV interneurons was achieved by focal illumination of 450 nm blue laser, and location is indicated with the blue circle. Inset, the representative traces of oIPSCs (blue) of inhibition by PV interneurons and uEPSC (red) for plateau poten-tial induction. (H) 2-photon image of a SPN filled with Alexa Fluor 488 (green), in a brain slice with ChR2-mCherry (red) expression from PV-Cre mice. 720 nm and 450 nm laser locations for 2PLU (arrow head) and optogenetic stimulation (arrow) are marked as red spots and blue circle, respectively. (I) Inhibition induced by optogenetic stimulation was timed to the last 2PLU spot (∆tInh). Representative traces of plateau potential without (black) and with (red) dendritic inhibition by PV interneurons at four different ∆tInh (-10, 10, 30, and 50 ms). (J) Representative traces for ∆Vm aligned with the trace of plateau potential. (K) Summary result of dendritic inhibition of plateau potential by PV interneurons. ∆Vm was significant larger at ∆tInh = 30 ms (∆Vm (∆tInh) = -0.7 ± 0.2 mV (-10 ms), -0.7 ± 0.1 mV (10 ms), -2.2 ± 0.4 mV (30 ms), -0.7 ± 0.2 mV (50 ms); n = 6, P = 0.004, Friedman test followed by Dunn's multiple comparisons). Values are shown as mean ± SEM. *P < 0.05.

0
1
2
A1
A3A2A1B
C
B
soma
A2
A3
C
20 mV
40 mV
ratioE /I
soma
20 40 60 80 100 120Time (ms)
4
8
12
16
20
4
8
12
16
20
4
8
12
16
20
4
8
12
16
20
4
8
12
16
20
4
8
12
16
20
20 40 60 80 100 120
20 40 60 80 100 120
20 40 60 80 100 120
20 40 60 80 100 120
20 40 60 80 100 120
Pulse
dur
atio
n (m
s)
∆tClustered input
+ test pulse
- test pulseor
.
Fig. S6. Bi-phasic E/I ratio of membrane potential perturbation is location sensitive Spatial distribution of E/I ratio of membrane potential perturbation at selected locations along the whole input branch. To probe E/I ratios at these locations, a test pulse (4 - 20 ms, ± 20 pA) was injected and the membrane potential was measured at the indicated locations using simulated patch-clamp recording electrodes. Representative traces of membrane potential perturbations and their corresponding E/I ratio are shown on the right. Bi-phasic E/I ratio is more prominent for locations near the clustered excitatory inputs in the same distal branch.

Passive branch
V-clamp cmd
A
D
20 ms10 mV
No K channels
+
KAf
KAs
KIR
20 mV
Voltage cmd in V-ClampB
50 ms20 pA
0 50 100
20 mV
AMPAR
NMDAR
AMPAR+NMDAR
Voltage cmd in V-ClampC
50 pA50 ms
No Ca channels
2+
∆t (ms) ∆t (ms) ∆t (ms)Pulse
dur
atio
n (m
s)
4
12
20
0 50 100
4
12
20
0 50 100
4
12
20
all Ca channels2+
2
1
0
all Na channels+
Pulse
dur
atio
n (m
s)
Pulse
dur
atio
n (m
s)
CtrlManipulation
Fig. S7. Intrinsic and synaptic conductances activated during the dendritic plateau potential (A) Simulated dendritic voltage-clamp (V-clamp) on the distal branch in the active SPN model. V-clamp was applied to the input branch, where plateau potentials were generated. The waveform of the voltage command is identical to the dendritic plateau shown in Fig. 5B inset. (B and C) Voltage-gated ion channels (B) and synaptic AMPAR and NMDAR currents (C) underlying the plateau potential gener-ated by activating 15 spines. Upper, the voltage command. Lower, representative traces of currents activated during simulated dendritic V-clamp simulations. For each type of ion channel, its current was obtained by measuring the change of holding current in V-clamp before and after removing this ion channel conductance from the input branch. The synaptic currents were summed from NMDAR and AMPAR on all 15 spines. (D) Impact of removing calcium channels (left), all potassium channels (middle), or all voltage-gated ion channels (right; “Passive branch”) of the input branch on the shape of plateau potential and E/I ratio of |∆V|. The bi-phasic E/I ratio persisted even when all voltage-gated ion channels were removed in the dendritic branch.

30 µm
A
-75 mV
CtrlPTXPTX + MK-801
50 ms5 mV
B
Ctrl PTX
Ampl
itude
(%)
Hal
f-wid
th (%
)
C
PTXPTX
+MK-8010
50
100
150
0
50
100
150
0
100
200
300
0
50
100
150
200
Ampl
itude
(%)
Hal
f-wid
th (%
)
Ctrl PTXPTX
PTX
+MK-801
D
(9) (9) (6) (6)
* ** *
Fig. S8. Local GABAergic inhibition and NMDAR control generation of dendritic plateau potentials (A) Experimental configuration: local stimulation was applied at distal dendrites (> 90 μm from soma, average distance-to-so-ma is 119 ± 5 µm, n = 19). (B) Representative traces of somatic EPSPs evoked by local eStim in Ctrl, PTX (50 µM), and PTX + MK-801 (10 µM). (C) Amplitude and duration of EPSPs was increased in the presence of PTX (amplitude: 134.4 ± 7.8% of Ctrl, n = 9 cells, Wilcoxon Signed Rank, p = 0.0005; half-duration: 157.4 ± 15.8% of Ctrl, n = 9 cells, Wilcoxon Signed Rank, P = 0.0039). (D) Amplitude and duration of dendritic plateaus recorded in PTX were significantly attenuated by NMDAR blocker: MK-801 (amplitude: 71.5 ± 6.8% of PTX, n = 6 cells, Wilcoxon Signed Rank, P = 0.0313; half-duration: 65.3 ± 5.3% of PTX, n = 6 cells, Wilcoxon Signed Rank, p = 0.0313). Values are shown as mean ± SEM. *P < 0.05.

No GABAWith GABAOn branch
Modeled slow GABA
100 ms10 pA
450 nm
uIPSC
0
40
80
120
Peak
cur
rent
(%)
(7)100 ms
50 pA
CtrlMNI-Glu (5 mM)
450 nm
100 ms
50 pA
CtrlDNI-Glu (5 mM)
450 nm
100 ms50 pA
CtrlDNI-Glu (0.7 mM)
450 nm
C
F G100 ms
50 pA
450 nm730 nm
Dual-color uncaging
-70 mV +10 mV
E
clustered input
On branch
Model
ranch
100 ms50 pA
CtrlCGP (5 µM)
B
450 nm20 µm iii
ii
i
200 ms20 pA
iii
iii
0 10 20 300
20
40
60
80
100
120
λ = 16 μm
Peak
IPSC
(pA)
distance to dendrite (μm)
A
D
100 ms10 pA
DNI-Glu (0.7 mM)
Mg -free2+
50 ms 5mV
On branch
50 ms 5mV
H
uIPSC
uEPSC
No GABAWith GABA
1p 450 nm
2p 730 nm
2 µm
PTX (50 µM)
0
50
100
150
Peak
cur
rren
t (%
)
CGP PTX Ctrl
*
(5)
Off branch Off branch
Fig. S9. Dual-color 2-photon glutamate uncaging and 1-photon GABA uncaging(A) Spatial profile of 1-photon Rubi-GABA uncaging (focal spot diameter = ~19 µm; 450 nm; Rubi-GABA 20 µM). Left, image of a dendrite illustrating 1-photon uncaging locations. Middle, uIPSCs evoked by GABA uncaging at corresponding locations shown in left (blue shaded area). Right, peak amplitude of IPSCs plotted against distance of the uncaging spot to the dendrite. The length constant (λ) is ~ 16 µm. (B) Peak amplitude of uIPSC was not affected by GABAB receptor antagonist, CGP 55845 (CGP, 5 µM) and was abolished by picrotoxin (PTX, 50 µM) (Ctrl vs CGP: P > 0.9999; Ctrl vs PTX: P = 0.0099; N = 5, Friedman test followed by Dunn’s multiple comparisons test). (C) MNI- (left) and DNI- (right) caged glutamate at high concentrations (5 mM) strongly attenuated uIPSC evoked by Rubi-GABA uncaging.(D) DNI-Glu at a low working concentration (0.7 mM) caused ~ 34% inhibition in peak uIPSC (66.0 ± 5.4 %, n = 7 cells). (E) The laser powers used for GABA uncaging were set to mimic the local I/E ratio recorded in (Fig. S5E). The locations for 2-pho-ton glutamate uncaging were indicated as red dots (730 nm; DNI-caged glutamate 0.7 mM) and the location for GABA uncag-ing was indicted as the blue area. (F) Simulation of the effect of GABAAR activation on dendritic plateau potential: plateau potential was induced at a distal dendrite and recorded at the soma. Input location of slow GABA was placed either on the same dendritic branch where the plateau potential was induced (on branch) or on the neighboring dendritic branch (off branch). Right, the amplitude and time courses of uIPSCs were comparable with simulated IPSCs. (G and H) Averaged simulated traces of dendritic plateau potentials induced by clustered inputs with (red) or without (black) dendritic slow GABA inhibition at “on branch” and “off branch” locations in control (G) and in Mg2+-free conditions (H). Values are shown as mean ± SEM. *P < 0.05.