Embed Size (px)
Citation preview
1
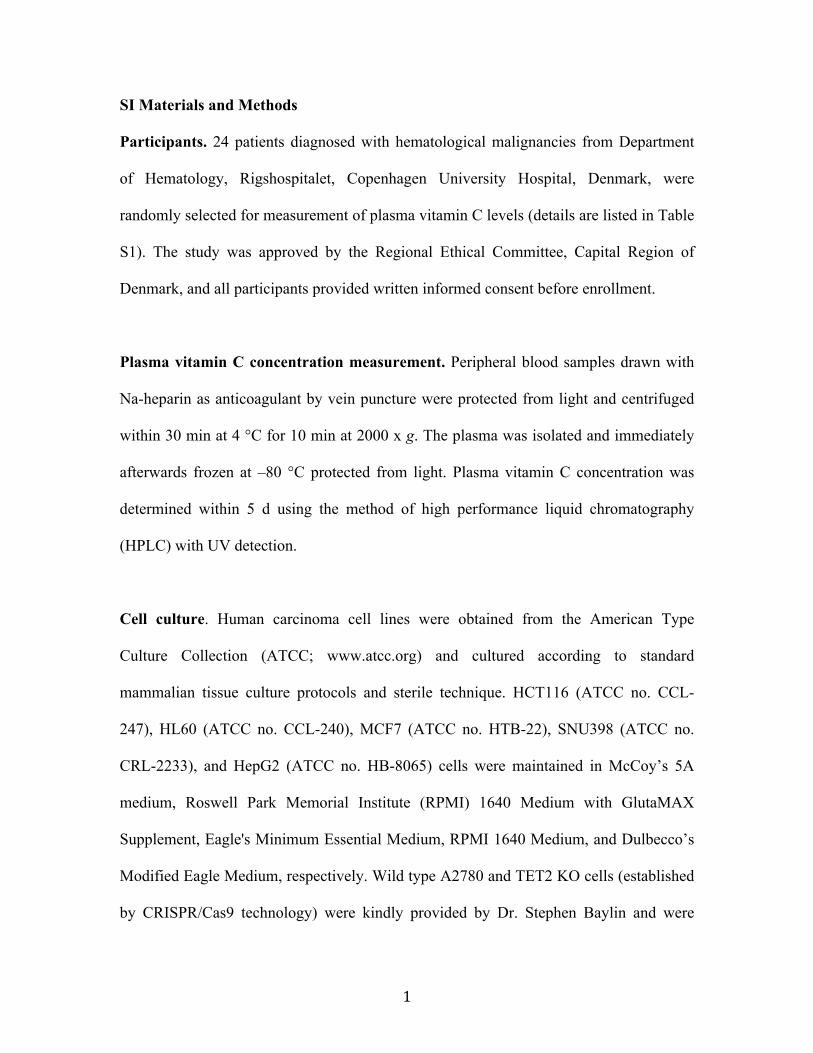
SI Materials and Methods
Participants. 24 patients diagnosed with hematological malignancies from Department
of Hematology, Rigshospitalet, Copenhagen University Hospital, Denmark, were
randomly selected for measurement of plasma vitamin C levels (details are listed in Table
S1). The study was approved by the Regional Ethical Committee, Capital Region of
Denmark, and all participants provided written informed consent before enrollment.
Plasma vitamin C concentration measurement. Peripheral blood samples drawn with
Na-heparin as anticoagulant by vein puncture were protected from light and centrifuged
within 30 min at 4 °C for 10 min at 2000 x g. The plasma was isolated and immediately
afterwards frozen at –80 °C protected from light. Plasma vitamin C concentration was
determined within 5 d using the method of high performance liquid chromatography
(HPLC) with UV detection.
Cell culture. Human carcinoma cell lines were obtained from the American Type
Culture Collection (ATCC; www.atcc.org) and cultured according to standard
mammalian tissue culture protocols and sterile technique. HCT116 (ATCC no. CCL-
247), HL60 (ATCC no. CCL-240), MCF7 (ATCC no. HTB-22), SNU398 (ATCC no.
CRL-2233), and HepG2 (ATCC no. HB-8065) cells were maintained in McCoy’s 5A
medium, Roswell Park Memorial Institute (RPMI) 1640 Medium with GlutaMAX
Supplement, Eagle's Minimum Essential Medium, RPMI 1640 Medium, and Dulbecco’s
Modified Eagle Medium, respectively. Wild type A2780 and TET2 KO cells (established
by CRISPR/Cas9 technology) were kindly provided by Dr. Stephen Baylin and were
2
maintained in McCoy’s 5A medium. All media (from GIBCO) were supplemented with
10% fetal bovine serum (Sigma-Aldrich) and 1% penicillin/streptomycin (GIBCO). 5-
Aza-CdR and vitamin C (L-ascorbic acid) were purchased from Sigma-Aldrich.
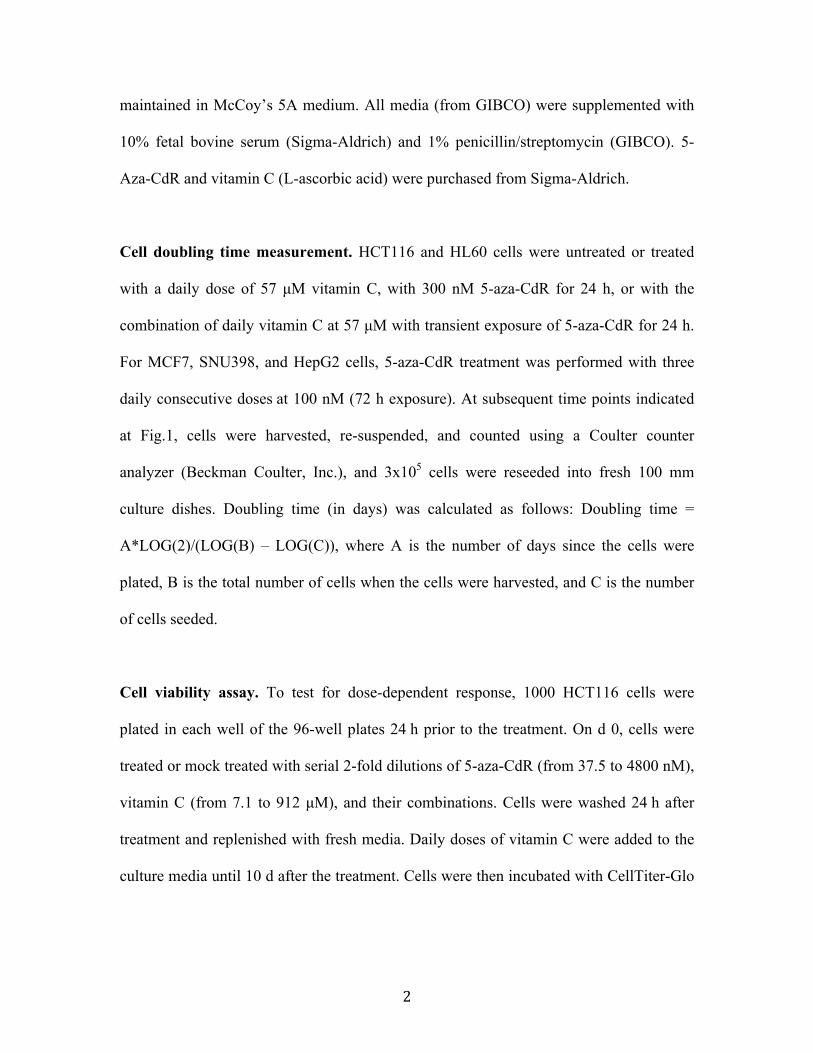
Cell doubling time measurement. HCT116 and HL60 cells were untreated or treated
with a daily dose of 57 µM vitamin C, with 300 nM 5-aza-CdR for 24 h, or with the
combination of daily vitamin C at 57 µM with transient exposure of 5-aza-CdR for 24 h.
For MCF7, SNU398, and HepG2 cells, 5-aza-CdR treatment was performed with three
daily consecutive doses at 100 nM (72 h exposure). At subsequent time points indicated
at Fig.1, cells were harvested, re-suspended, and counted using a Coulter counter
analyzer (Beckman Coulter, Inc.), and 3x10⁵ cells were reseeded into fresh 100 mm
culture dishes. Doubling time (in days) was calculated as follows: Doubling time =
A*LOG(2)/(LOG(B) – LOG(C)), where A is the number of days since the cells were
plated, B is the total number of cells when the cells were harvested, and C is the number
of cells seeded.
Cell viability assay. To test for dose-dependent response, 1000 HCT116 cells were
plated in each well of the 96-well plates 24 h prior to the treatment. On d 0, cells were
treated or mock treated with serial 2-fold dilutions of 5-aza-CdR (from 37.5 to 4800 nM),
vitamin C (from 7.1 to 912 µM), and their combinations. Cells were washed 24 h after
treatment and replenished with fresh media. Daily doses of vitamin C were added to the
culture media until 10 d after the treatment. Cells were then incubated with CellTiter-Glo
3
assay reagent (Promega) for 10 min and luminescence was measured using a Synergy HT
multi-mode microplate reader (BioTek).
Evaluation of combination effect. Cell viability data were normalized to their
corresponding untreated controls for each treatment condition and were expressed as
percentage fractional affect (Fa). CompuSyn software (ComboSyn, Inc.) was use to
calculate combination index (CI) values of Fa under different conditions using the Chou-
Talalay equation: CI = (D)Vc/((Dm)Vc (Fa/(1-Fa))1/m1) + (D)Aza/((Dm)Aza (Fa/(1-Fa))1/m2),
where D is the concentration of vitamin C and 5-aza-CdR either alone or in combination
to achieve a given Fa (1). The median effect dose (Dm), m1 (vitamin C), and m2 (5-aza-
CdR) values were determined using the median-effect equation: (Fa)/(1-Fa) =
((D)/(Dm))m (2) for vitamin C and 5-aza-CdR treatment alone. The CI values define
synergistic effect when CI < 1, additive effect when CI = 1, and antagonism when CI > 1
(3).
Protein Extraction and Western Blot Analysis. HCT116 cells (3 x 10⁵) were untreated
or treated with 57 µM vitamin C, 300 nM 5-aza-CdR, or a combination of 57 µM vitamin
C and 300 nM 5-aza-CdR for 24 h. Cells treated with higher concentration of vitamin C
(570 µM) and 5-aza-CdR (3 µM) were used as positive controls. Cells were then
trypsinized, washed with PBS and resuspend in RIPA buffer (50 mM Tris-HCl, ph 8.0,
150 mM NaCl, 1% NP-40, 0.5% sodium deoxycholate and 0.1% SDS) with protease
inhibitors. The cells were then sonicated on ice and cellular debris was removed by
centrifugation. Ten microgram of protein was mixed with SDS/β-mercaptoethanol
4
loading buffer and resolved on a Biorad 4-15% gradient SDS/PAGE gel. Antibodies
against the γ-H2AX (Cell Signaling, #9718), H2AX (Cell Signaling, #2595), p53 (Santa
Cruz Biotechnology, sc-126), and β-actin (Sigma-Aldrich, A2228) were used. For TET1
and TET2 western blots, 30 microgram of cell extract was prepared from SNU398,
A2780 and TET2KO cells. Antibodies against TET1 (GeneTex, GTX124207) and TET2
(Sigma-Aldrich, HPA043135) were used. Proteins were visualized using the ECL
detection system (Thermo Scientific) and ChemiDoc™ system (BioRad).
Microarray gene expression analysis. 5-Aza-CdR and combination treatment for
HCT116, HL60, and SNU398 cells was performed as described for cell doubling time
measurement. At day 5 after the treatment, all cells were harvested and RNA was
extracted with Trizol reagent (Invitrogen), followed by clean-up and DNase I treatment
with Zymo Direct-Zol RNA mini prep kit (Zymo Research) according to the
manufacturer's protocol. RNA quality was assessed using Agilent 2100 bioanalyzer with
RNA Nano chips (Agilent Technologies, Inc.). Expression analysis was performed at
Sanford-Burnham Medical Institution (La Jolla, CA) using the Illumina genome-wide
expression BeadChip (HumanHT-12_V4.0_R1) (Illumina). Gene expression data were
normalized using quantile normalization method with lumi package (4), and differential
expression analysis were performed using limma package (5) in R.
Pathway enrichment analysis. For each cell line, the differentially expressed genes
between combination and 5-aza-CdR treatment were searched in the MsigDB v5.1
against gene sets compiled from published biomedical literature, including the Kyoto
5
Encyclopedia of Genes and Genomes (KEGG, http://www.genome.jp/kegg), Reactome
(http://www.reactome.org), and Gene Ontology (GO, www.geneontology.org) (6, 7).
Pathways with extreme numbers of genes (i.e., 10th percentile of pathway size
distribution, less than 10 or more than 380) were removed from analysis to avoid
stochastic bias or testing overly general biological processes.
RNA sequencing. HCT116 cells were untreated or treated with vitamin C, 5-aza-CdR, or
the combination, as described for cell doubling time measurement in two replicates. RNA
was prepared as described for microarray gene expression analysis. For total RNA-seq
with ribosomal RNA (rRNA) reduction, libraries were prepared and sequenced as single-
end 75 bases on a NextSeq 500 instrument (Illumina) at the Van Andel Research Institute
Genomics Core. For directional RNA-seq with rRNA reduction and strand specificity
retained, libraries were prepared and sequenced as paired-end 50 bases on a HiSeq 2500
instrument (Illumina) at HudsonAlpha Institute for Biotechnology Genomic Services
Lab. The RNA-seq reads were mapped to the human transcriptome using TopHat version
2.1.0 with NCBI RefSeq as the reference annotation of transcripts (8). The transcripts
were assembled and quantified using Cufflinks version 2.2.1.(9). Differential expression
is measured using Cuffdiff program from the Cufflinks package (9).
Identification of bidirectionally transcribed ERVs. To quantify the transcription of
repetitive element at a specific locus, we used Repeatmasker (10)
(http://www.repeatmasker.org) annotation as our input and considered only uniquely
mapped reads (with mapping quality threshold 10). To quantify transcription of a
6
repetitive element category, we combined all the repeats from the same family. Previous
study showed that such approach accurately quantifies the transcription for most LTR
repetitive elements (11). For each transcript, we separated reads mapped to the two
strands. We considered a transcript as bidirectionally transcribed if the smaller read count
divided by the greater reads count is over 0.5. We quantified the number of
bidirectionally transcribed loci in each category for each repeat family to characterize
whether the repeat family forms double-stranded RNA. The most upregulated
transposable elements were selected based on FPKM greater than 100 in any of the
treatment conditions.
J2 antibody pulldown followed by RNA-seq to identify dsRNA. After treatment,
HCT116 cells were lysed with lysis buffer [30 mM HEPES-KOH at pH 7.4, 20 mM
MgOAc, 5 mM DTT, 150 mM KOAc, 0.1% NP-40, and protease inhibitors (Roche)].
The cell lysates were next used for dsRNA pull-down with 3 µg of J2 antibody (Scicons)
on Dynabeads Protein G (Invitrogen) for 2 h at 4 °C. The beads were washed with wash
buffer [30 mM HEPES-KOH at pH 7.4, 20 mM MgOAc, 5 mM DTT, 150 mM KOAc,
0.1% NP-40, and protease inhibitors (Roche)] and digested again with RNase T1 (Roche)
and TURBO DNase (Thermo Fisher) to further eliminate single-stranded RNA and DNA.
dsRNA was purified and fragmented into 1200 bp by sonication using a Covaris E220
focused ultrasonicator (Covaris Inc.). Sequencing libraries were prepared using NEBNext
multiplex small RNA library prep Kit (New England BioLabs Inc.) and sequenced as
single-end 75 bases on a NextSeq 500 instrument (Illumina) at the Van Andel Research
7
Institute Genomics Core. Analysis of repeated elements were performed as described
above.
Poly(I:C) transfection. HCT116 cells (5 × 10⁵) were seeded in a 6-well plate and
transiently transfected with 1 µg of poly(I:C) (Invitrogen) or mock-transfected using
Lipofectamine LTX with Plus reagents (Invitrogen) according to the manufacturer's
instructions. After 24 h, the medium was replaced and cells were maintained in fresh
medium until the fourth day after transfection, when total RNA was extracted using
Trizol reagent (Invitrogen). The expression of TBP and viral defense genes were
measured by real-time quantitative reverse transcription polymerase chain reaction (qRT-
PCR) using KAPA SYBR FAST universal 2× qPCR master mix (KAPA) with primers
listed in the Table S2.
Illumina Infinium HM450 DNA methylation assay. Genomic DNA from HCT116
cells was extracted using phenol–chloroform and ethanol precipitation after the treatment,
and bisulfite treatment was performed using EZ DNA methylation kit (Zymo Research).
The Infinium HM450 DNA methylation assay was performed at the University of
Southern California Epigenome Center according to the manufacturer’s specifications
(Illumina). The DNA methylation level for each interrogated CpG site was reported as a
beta value, ranging from 0 (not methylated) to 1 (fully methylated). Downstream
processing and beta value calculations were performed as previously described (12).
8
Antioxidant and dehydroascorbic acid treatment. HCT116 (3 × 10⁵) cells were
seeded, untreated or treated with daily doses of vitamin C or L-dehydroascorbic acid
(DHA, Sigma-Aldrich, 261556) at 57 µM, daily doses of L-Glutathione reduced (GSH,
Sigma-Aldrich, G6529) at 4.9 mM or dithiothreitol (DTT, Sigma-Aldrich, 43815) at 500
µM. Combinations with 5-aza-CdR treatment were exposed to 300 nM 5-aza-CdR for 24
h together with daily doses of vitamin C, DHA, GSH and DTT indicated above. At day 5
after the treatment, cells were harvested, and genomic DNA and RNA were extracted for
Dot blot analysis or qRT-PCR analysis with primers listed in the Table S2.
Dot blot analysis of 5hmC. HCT116, HL60, MCF7, SNU398, HepG2, A2780 and TET2
KO cells were untreated or treated with vitamin C, 5-aza-CdR, or the combination as
described for cell doubling time measurement. Cells were harvested at day 5 after the
treatment and genomic DNA was extracted using phenol–chloroform and ethanol
precipitation. 5hmC dot blot analysis was performed as described previously (13).
Briefly, 1 µg of genomic DNA was denatured, spotted on a nitrocellulose membrane,
which was then baked, blocked, and incubated with 5hmC antibody (1:10,000, Active
Motif, A39769) and secondary antibodies. The same blot was stained with 0.02%
methylene blue in 0.3 M sodium acetate (pH 5.3) as DNA loading controls.
Bisulfite sequencing. On day 5 after treatment, HCT116 cells were harvested and
genomic DNA was purified by phenol–chloroform extraction and ethanol precipitation.
PCRs were performed using bisulfite-converted DNA with primers listed in Table S2,
9
and the products were cloned using the TOPO TA Cloning Kit (Invitrogen). Individual
colonies were sequenced and analyzed as previously described (12).
Chemical pulldown of 5hmC. On days 1, 3, and 5 after treatment, HCT116 cells were
harvested and genomic DNA was purified by phenol–chloroform extraction and ethanol
precipitation. Chemical capture of 5hmC were performed using Hydroxymethyl
Collector-seq Kit (Active Motif, # 55013) according to the manufacturers’ protocol with
minor modifications. Genomic DNA was sonicated to a mean size of 300 bp, and 500 pg
of “spiked” 5hmC fragments (supplied in the Hydroxymethyl Collector-seq Kit) was
added per 10 µg of genomic DNA. After setting aside 100 ng DNA for input, 10 µg of
fragmented DNA containing the spike-in 5hmC control was then glucosylated through
incubation with modified dUTP containing an azide glucose group with 100 units of T4
phage β-glucosyltransferase enzyme (New England BioLabs Inc. Cat# M0357L) at 37 °C
overnight. Following glucosylation, the modified glucose group was then biotinylated
through incorporation of biotin conjugation solution for 4 h further at 37 °C. Fragments
of DNA containing modified biotin-azide-glucose-5hmC were then purified through
binding to magnetic streptavidin beads following five washes with a wash buffer and a
final wash in elution buffer for 30 min at room temperature. The enriched DNA was then
eluted in elution buffer and passed through purification columns prior to qPCR analysis
using primers listed in Table S2, or used for library preparation.
5hmC-seq and data analysis. Sequencing libraries were prepared using TruSeq ChIP
Library Prep Kit (Illumina) and sequenced as single-end 75 bases on a NextSeq 500

10
instrument (Illumina) at the Van Andel Research Institute Genomics Core. We used
bedtools (14) to count numbers of reads mapped to ERVs annotated in the Repeatmasker
(10) as assayed in RNA-seq experiment. We selected the top 100 ERVs upregulated in
combination treatment compared to untreated cells. To compare the expression levels of
these ERVs across the treated samples, we used the natural logarithm (ln) for the read
counts of each ERV loci and plotted in a heatmap shown in the top panel of Fig. 4B. To
compare 5hmC levels on these ERVs after treatment, we studied each ERV loci and its
+/- 3kb flanking region as shown in the lower panel of Fig. 4B. We first evenly sampled
100 positions inside each ERV loci and within +/- 3kb of its flanking regions, and
counted the number of bases from 50bp bins using the raw read counts from the 5hmC-
seq experiments. All the base counts were then normalized by the read counts of the
spike-in control. Next, the normalized base counts were averaged across all the
upregulated ERVs as the average 5hmC level, and plotted against the scaled genomic loci
as shown in the lower panel of Fig. 4B.
Statistical analysis. Results were expressed as means ± standard deviation (SD) for
quantitative variables. Statistical analyses were performed using two-tailed Student’s t-
test or paired Student’s t-test for comparing the means of two groups as specified in
Figure Legends. For expression microarray and RNA-seq data, the Pearson product-
moment correlation coefficient of log2 fold change between two biological replicates and
p-values were calculated using R program.
11
Accession codes and reviewer access links. All data have been deposited at the Gene
Expression Omnibus (GEO) (http://www.ncbi.nlm.nih.gov/geo/) with accession codes
GSE77031 (http://www.ncbi.nlm.nih.gov/geo/query/acc.cgi?token=elelmqsqrhijfyl
&acc=GSE77031) for dsRNA sequencing data, GSE77032 (http://www.ncbi.nlm.nih.gov
/geo/query/acc.cgi?token=ejipkqegnrkttyr&acc=GSE77032) for directional total RNA
sequencing data, GSE77034 (http://www.ncbi.nlm.nih.gov/geo/query/acc.cgi?token=
mbadogggndkjzmh&acc=GSE77034) for total RNA sequencing data, GSE77035
(http://www.ncbi.nlm.nih.gov/geo/query/acc.cgi?token=mbonkewobzilnmb&acc=GSE77
035) for gene expression microarray data, and GSE77036 (http://www.ncbi.nlm.nih.gov
/geo/query/acc.cgi?token=ibsfckkkxbgzlkt&acc=GSE77036) for HM450 DNA
methylation data.
SI References
1. Chou TC & Talalay P (1983) Analysis of combined drug effects - a new look at a very old problem. Trends Pharmacol. Sci. 4(11):450-454.
2. Chou TC (1976) Derivation and properties of Michaelis-Menten type and Hill type equations for reference ligands. J. Theor. Biol. 59(2):253-276.
3. Chou TC (2006) Theoretical basis, experimental design, and computerized simulation of synergism and antagonism in drug combination studies. Pharmacol. Rev. 58(3):621-681.
4. Du P, Kibbe WA, & Lin SM (2008) lumi: a pipeline for processing Illumina microarray. Bioinformatics 24(13):1547-1548.
5. Smyth GK (2004) Linear models and empirical bayes methods for assessing differential expression in microarray experiments. Stat. Appl. Genet. Mol. Biol. 3:Article3.
6. Ashburner M, et al. (2000) Gene ontology: tool for the unification of biology. . Nat. Genet. 25(1):25-29.
7. Subramanian A, et al. (2005) Gene set enrichment analysis: a knowledge-based approach for interpreting genome-wide expression profiles. Proc. Natl. Acad. Sci. U S A 102(43):15545-15550.
8. Kim D, et al. (2013) TopHat2: accurate alignment of transcriptomes in the presence of insertions, deletions and gene fusions. Genome Biol. 14(4):R36.
12
9. Trapnell C, et al. (2012) Differential gene and transcript expression analysis of RNA-seq experiments with TopHat and Cufflinks. Nat. Protoc. 7(3):562-578.
10. A. Smit RH, and P. Green (1996) RepeatMasker Open-3.0. 11. Criscione SW, Zhang Y, Thompson W, Sedivy JM, & Neretti N (2014)
Transcriptional landscape of repetitive elements in normal and cancer human cells. BMC genomics 15:583.
12. De Carvalho DD, et al. (2012) DNA methylation screening identifies driver epigenetic events of cancer cell survival. Cancer cell 21(5):655-667.
13. Blaschke K, et al. (2013) Vitamin C induces Tet-dependent DNA demethylation and a blastocyst-like state in ES cells. Nature 500(7461):222-226.
14. Quinlan AR & Hall IM (2010) BEDTools: a flexible suite of utilities for comparing genomic features. Bioinformatics 26(6):841-842.
13
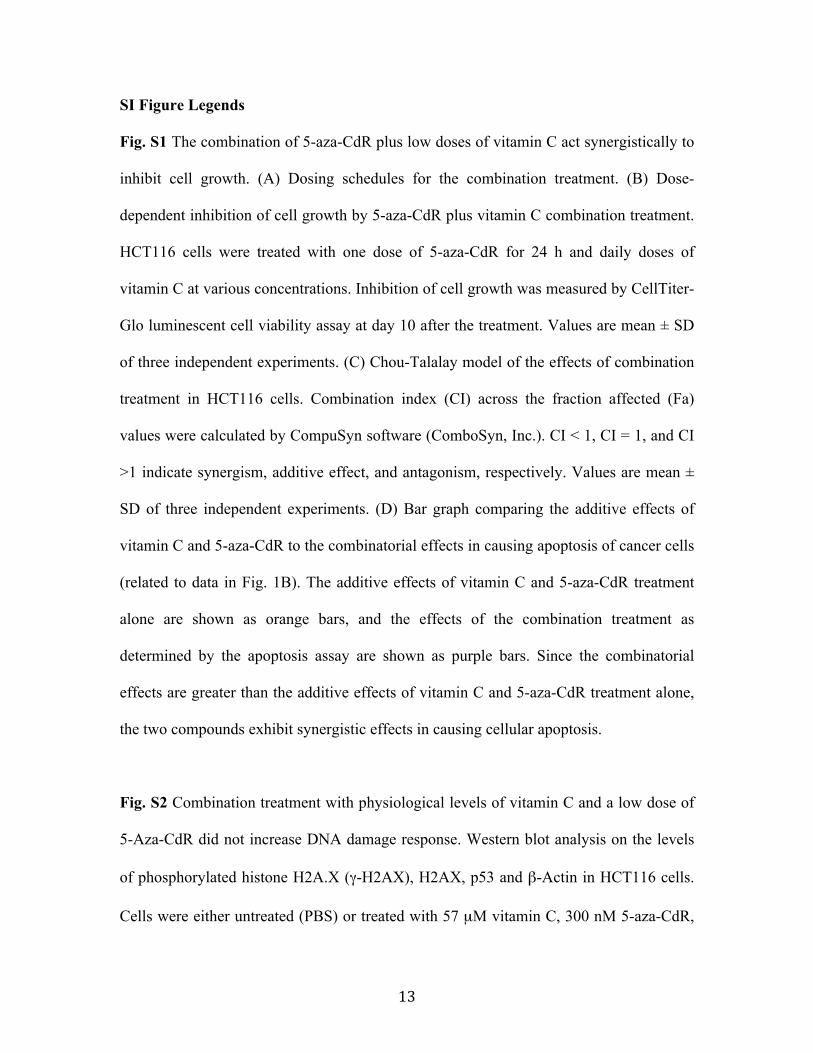
SI Figure Legends Fig. S1 The combination of 5-aza-CdR plus low doses of vitamin C act synergistically to
inhibit cell growth. (A) Dosing schedules for the combination treatment. (B) Dose-
dependent inhibition of cell growth by 5-aza-CdR plus vitamin C combination treatment.
HCT116 cells were treated with one dose of 5-aza-CdR for 24 h and daily doses of
vitamin C at various concentrations. Inhibition of cell growth was measured by CellTiter-
Glo luminescent cell viability assay at day 10 after the treatment. Values are mean ± SD
of three independent experiments. (C) Chou-Talalay model of the effects of combination
treatment in HCT116 cells. Combination index (CI) across the fraction affected (Fa)
values were calculated by CompuSyn software (ComboSyn, Inc.). CI < 1, CI = 1, and CI
>1 indicate synergism, additive effect, and antagonism, respectively. Values are mean ±
SD of three independent experiments. (D) Bar graph comparing the additive effects of
vitamin C and 5-aza-CdR to the combinatorial effects in causing apoptosis of cancer cells
(related to data in Fig. 1B). The additive effects of vitamin C and 5-aza-CdR treatment
alone are shown as orange bars, and the effects of the combination treatment as
determined by the apoptosis assay are shown as purple bars. Since the combinatorial
effects are greater than the additive effects of vitamin C and 5-aza-CdR treatment alone,
the two compounds exhibit synergistic effects in causing cellular apoptosis.
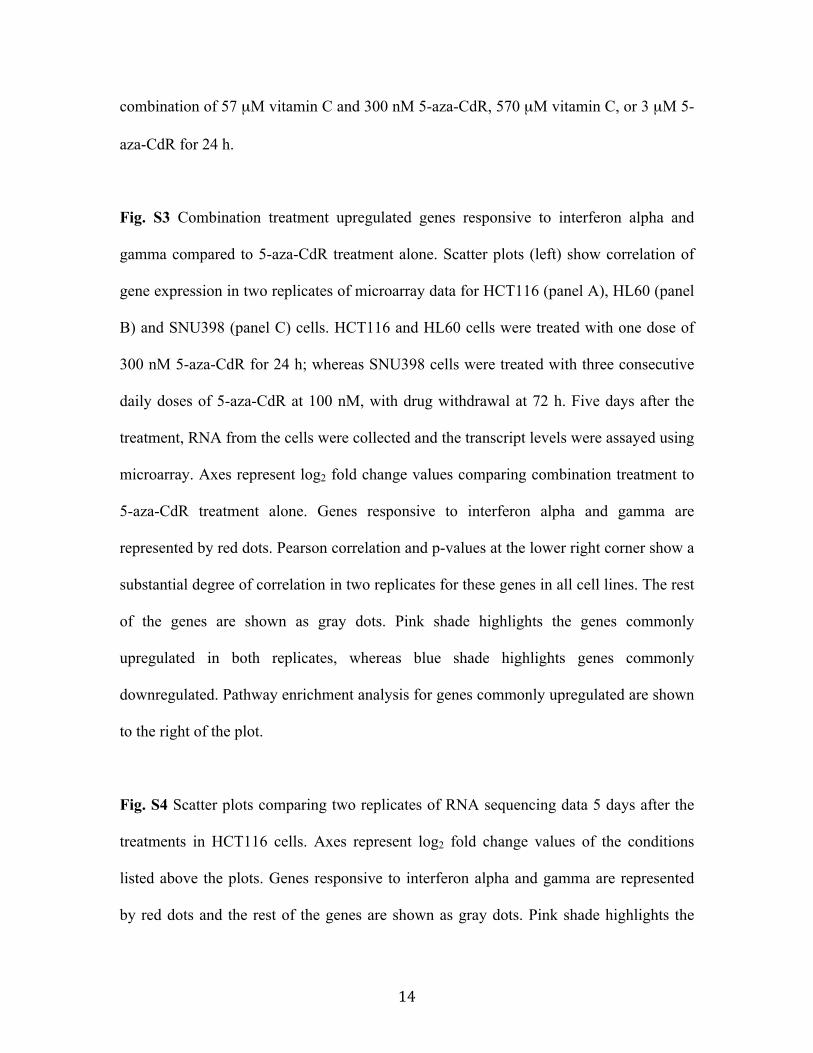
Fig. S2 Combination treatment with physiological levels of vitamin C and a low dose of
5-Aza-CdR did not increase DNA damage response. Western blot analysis on the levels
of phosphorylated histone H2A.X (γ-H2AX), H2AX, p53 and β-Actin in HCT116 cells.
Cells were either untreated (PBS) or treated with 57 µM vitamin C, 300 nM 5-aza-CdR,
14
combination of 57 µM vitamin C and 300 nM 5-aza-CdR, 570 µM vitamin C, or 3 µM 5-
aza-CdR for 24 h.
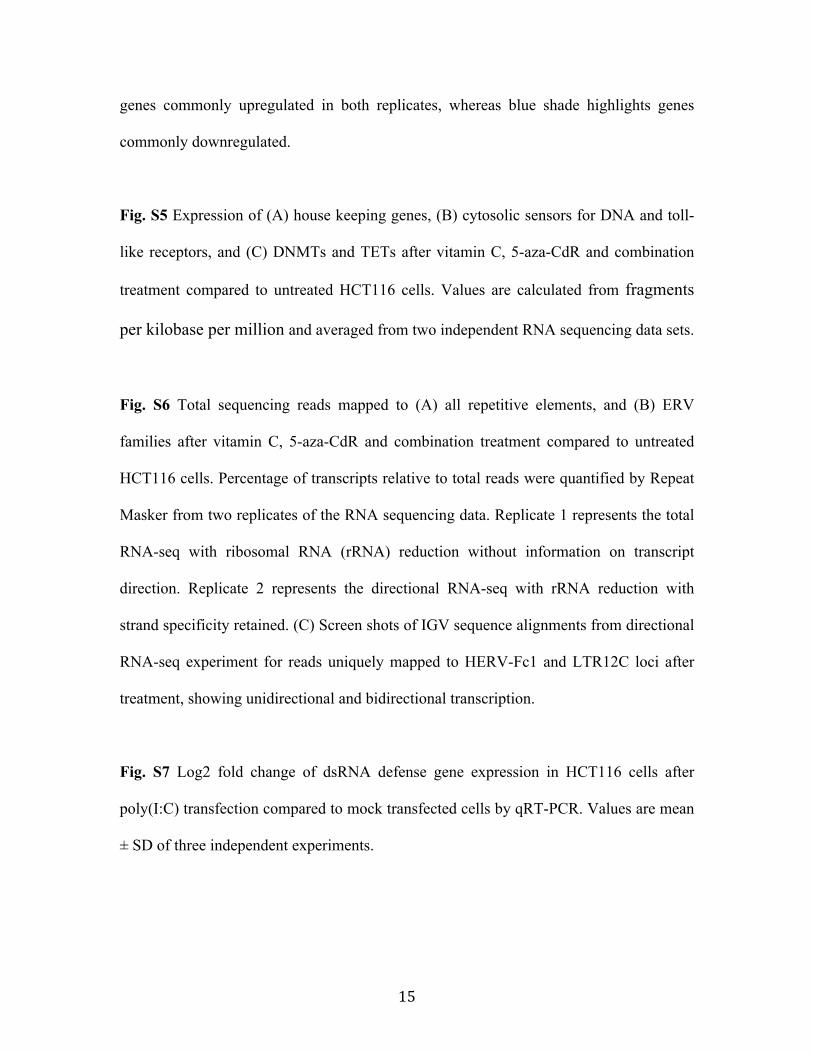
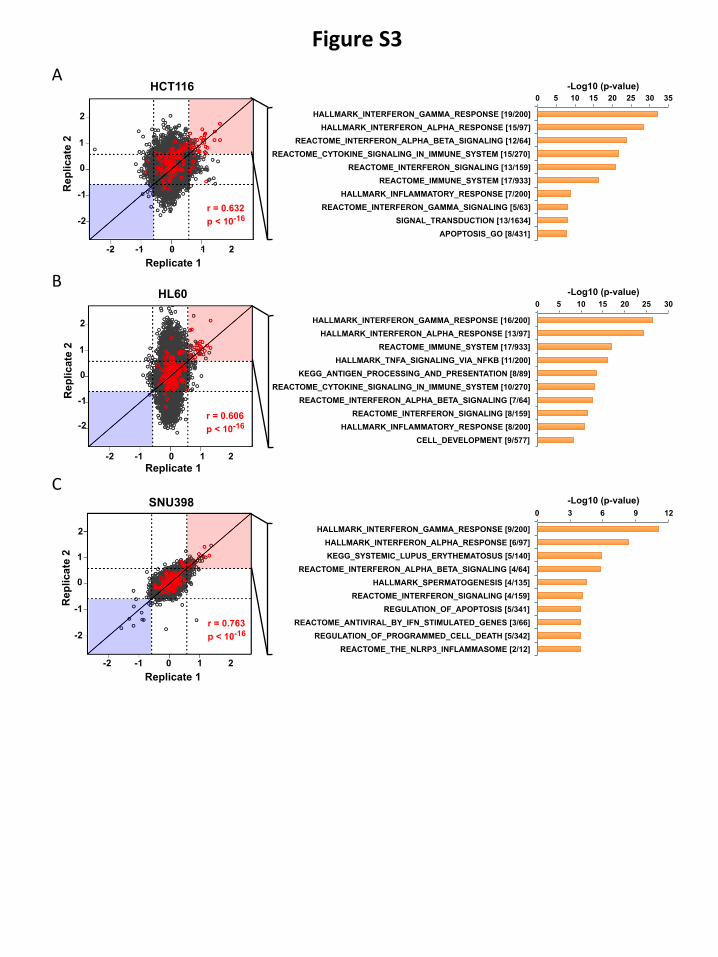
Fig. S3 Combination treatment upregulated genes responsive to interferon alpha and
gamma compared to 5-aza-CdR treatment alone. Scatter plots (left) show correlation of
gene expression in two replicates of microarray data for HCT116 (panel A), HL60 (panel
B) and SNU398 (panel C) cells. HCT116 and HL60 cells were treated with one dose of
300 nM 5-aza-CdR for 24 h; whereas SNU398 cells were treated with three consecutive
daily doses of 5-aza-CdR at 100 nM, with drug withdrawal at 72 h. Five days after the
treatment, RNA from the cells were collected and the transcript levels were assayed using
microarray. Axes represent log2 fold change values comparing combination treatment to
5-aza-CdR treatment alone. Genes responsive to interferon alpha and gamma are
represented by red dots. Pearson correlation and p-values at the lower right corner show a
substantial degree of correlation in two replicates for these genes in all cell lines. The rest
of the genes are shown as gray dots. Pink shade highlights the genes commonly
upregulated in both replicates, whereas blue shade highlights genes commonly
downregulated. Pathway enrichment analysis for genes commonly upregulated are shown
to the right of the plot.
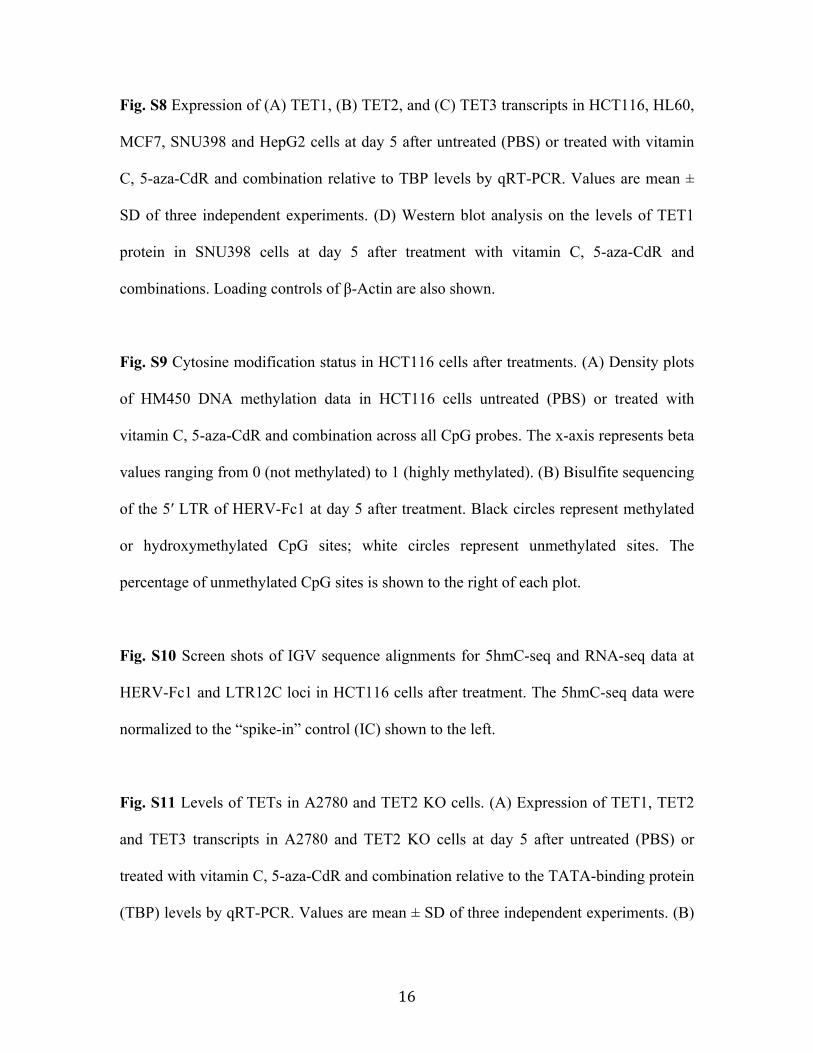
Fig. S4 Scatter plots comparing two replicates of RNA sequencing data 5 days after the
treatments in HCT116 cells. Axes represent log2 fold change values of the conditions
listed above the plots. Genes responsive to interferon alpha and gamma are represented
by red dots and the rest of the genes are shown as gray dots. Pink shade highlights the
15
genes commonly upregulated in both replicates, whereas blue shade highlights genes
commonly downregulated.
Fig. S5 Expression of (A) house keeping genes, (B) cytosolic sensors for DNA and toll-
like receptors, and (C) DNMTs and TETs after vitamin C, 5-aza-CdR and combination
treatment compared to untreated HCT116 cells. Values are calculated from fragments
per kilobase per million and averaged from two independent RNA sequencing data sets.
Fig. S6 Total sequencing reads mapped to (A) all repetitive elements, and (B) ERV
families after vitamin C, 5-aza-CdR and combination treatment compared to untreated
HCT116 cells. Percentage of transcripts relative to total reads were quantified by Repeat
Masker from two replicates of the RNA sequencing data. Replicate 1 represents the total
RNA-seq with ribosomal RNA (rRNA) reduction without information on transcript
direction. Replicate 2 represents the directional RNA-seq with rRNA reduction with
strand specificity retained. (C) Screen shots of IGV sequence alignments from directional
RNA-seq experiment for reads uniquely mapped to HERV-Fc1 and LTR12C loci after
treatment, showing unidirectional and bidirectional transcription.
Fig. S7 Log2 fold change of dsRNA defense gene expression in HCT116 cells after
poly(I:C) transfection compared to mock transfected cells by qRT-PCR. Values are mean
± SD of three independent experiments.
16
Fig. S8 Expression of (A) TET1, (B) TET2, and (C) TET3 transcripts in HCT116, HL60,
MCF7, SNU398 and HepG2 cells at day 5 after untreated (PBS) or treated with vitamin
C, 5-aza-CdR and combination relative to TBP levels by qRT-PCR. Values are mean ±
SD of three independent experiments. (D) Western blot analysis on the levels of TET1
protein in SNU398 cells at day 5 after treatment with vitamin C, 5-aza-CdR and
combinations. Loading controls of β-Actin are also shown.
Fig. S9 Cytosine modification status in HCT116 cells after treatments. (A) Density plots
of HM450 DNA methylation data in HCT116 cells untreated (PBS) or treated with
vitamin C, 5-aza-CdR and combination across all CpG probes. The x-axis represents beta
values ranging from 0 (not methylated) to 1 (highly methylated). (B) Bisulfite sequencing
of the 5′ LTR of HERV-Fc1 at day 5 after treatment. Black circles represent methylated
or hydroxymethylated CpG sites; white circles represent unmethylated sites. The
percentage of unmethylated CpG sites is shown to the right of each plot.
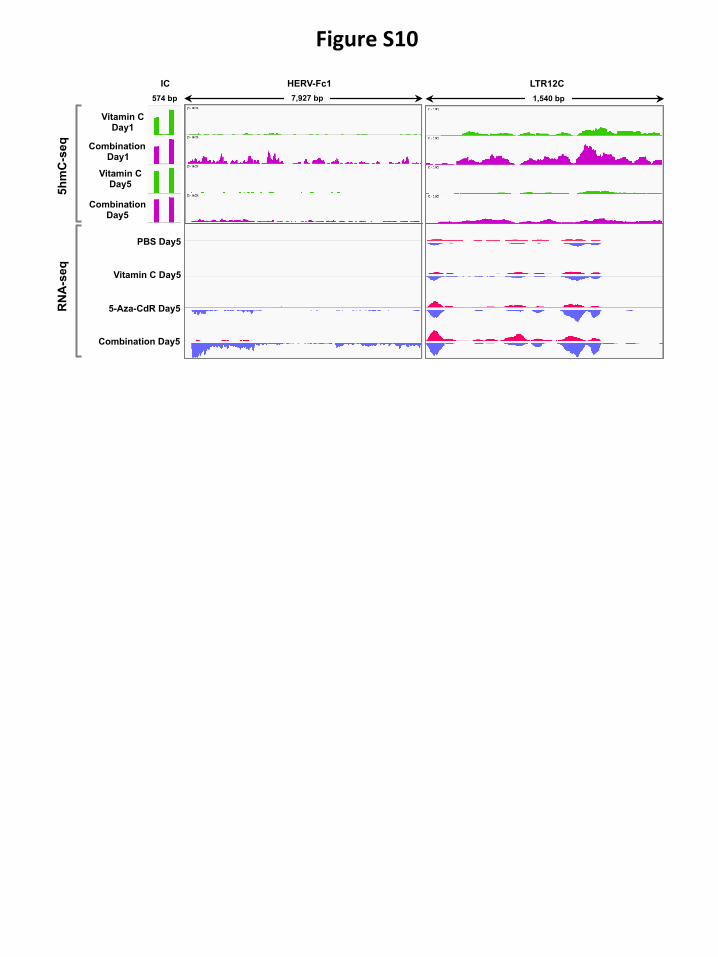
Fig. S10 Screen shots of IGV sequence alignments for 5hmC-seq and RNA-seq data at
HERV-Fc1 and LTR12C loci in HCT116 cells after treatment. The 5hmC-seq data were
normalized to the “spike-in” control (IC) shown to the left.
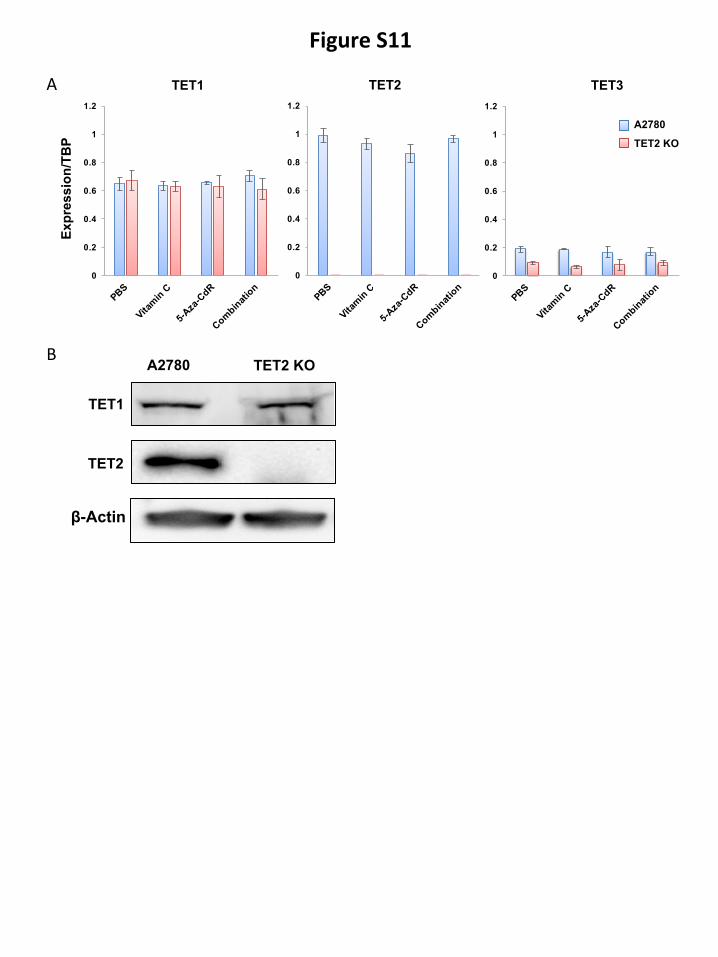
Fig. S11 Levels of TETs in A2780 and TET2 KO cells. (A) Expression of TET1, TET2
and TET3 transcripts in A2780 and TET2 KO cells at day 5 after untreated (PBS) or
treated with vitamin C, 5-aza-CdR and combination relative to the TATA-binding protein
(TBP) levels by qRT-PCR. Values are mean ± SD of three independent experiments. (B)

17
Western blot analysis on the levels of TET1 and TET2 proteins in A2780 and TET2 KO
cells. Loading controls of β-Actin are also shown.
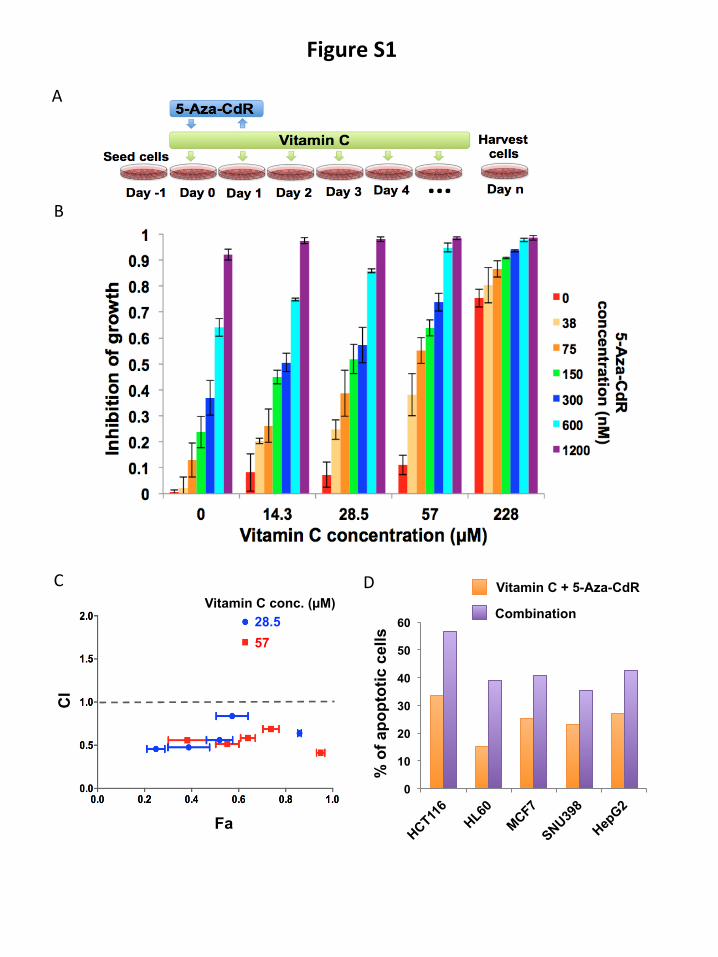
Figure S1
B
A
C
Fa
CI
Vitamin C conc. (µM) 28.5 57
D
0
10
20
30
40
50
60
% o
f apo
ptot
ic c
ells
Vitamin C + 5-Aza-CdR
Combination
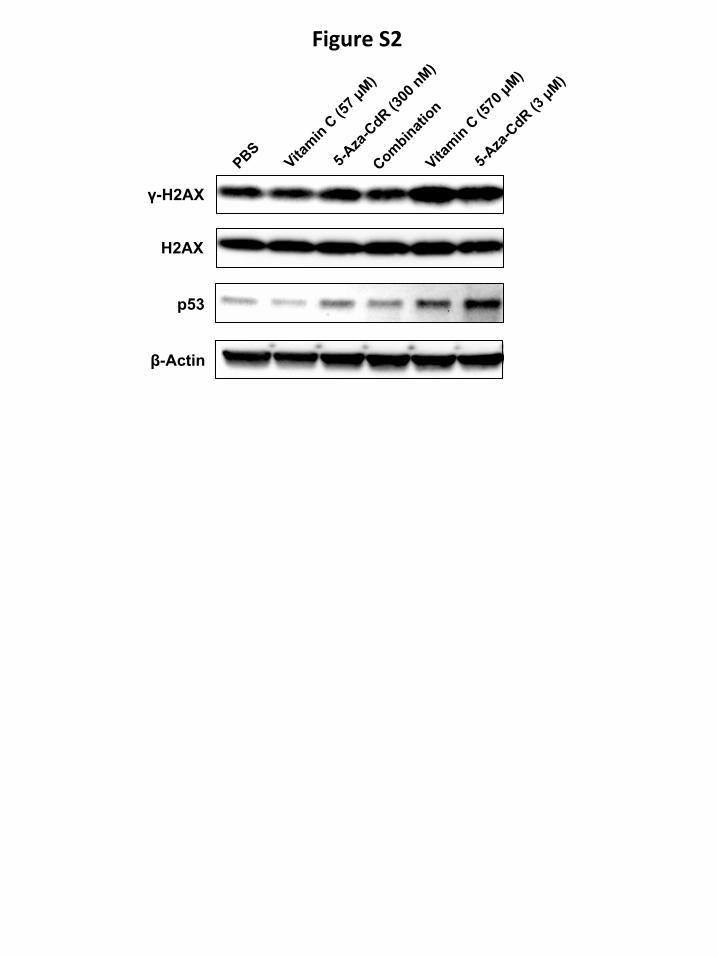
Figure S2
γ-H2AX
H2AX
p53
β-Actin
0 5 10 15 20 25 30 35
HALLMARK_INTERFERON_GAMMA_RESPONSE [19/200] HALLMARK_INTERFERON_ALPHA_RESPONSE [15/97]
REACTOME_INTERFERON_ALPHA_BETA_SIGNALING [12/64] REACTOME_CYTOKINE_SIGNALING_IN_IMMUNE_SYSTEM [15/270]
REACTOME_INTERFERON_SIGNALING [13/159] REACTOME_IMMUNE_SYSTEM [17/933]
HALLMARK_INFLAMMATORY_RESPONSE [7/200] REACTOME_INTERFERON_GAMMA_SIGNALING [5/63]
SIGNAL_TRANSDUCTION [13/1634] APOPTOSIS_GO [8/431]
Figure S3 A
Rep
licat
e 2
HCT116
0
1
2
-2
-1
-2 -1 0 1 2
r = 0.632 p < 10-16
Replicate 1
HL60
0
1
2
-2
-1
-2 -1 0 1 2
r = 0.606 p < 10-16
Replicate 1
Rep
licat
e 2
SNU398
0
1
2
-2
-1
-2 -1 0 1 2
r = 0.763 p < 10-16
Replicate 1
Rep
licat
e 2
B
C
-Log10 (p-value)
0 5 10 15 20 25 30
HALLMARK_INTERFERON_GAMMA_RESPONSE [16/200] HALLMARK_INTERFERON_ALPHA_RESPONSE [13/97]
REACTOME_IMMUNE_SYSTEM [17/933] HALLMARK_TNFA_SIGNALING_VIA_NFKB [11/200]
KEGG_ANTIGEN_PROCESSING_AND_PRESENTATION [8/89] REACTOME_CYTOKINE_SIGNALING_IN_IMMUNE_SYSTEM [10/270]
REACTOME_INTERFERON_ALPHA_BETA_SIGNALING [7/64] REACTOME_INTERFERON_SIGNALING [8/159]
HALLMARK_INFLAMMATORY_RESPONSE [8/200] CELL_DEVELOPMENT [9/577]
-Log10 (p-value)
0 3 6 9 12
HALLMARK_INTERFERON_GAMMA_RESPONSE [9/200] HALLMARK_INTERFERON_ALPHA_RESPONSE [6/97] KEGG_SYSTEMIC_LUPUS_ERYTHEMATOSUS [5/140]
REACTOME_INTERFERON_ALPHA_BETA_SIGNALING [4/64] HALLMARK_SPERMATOGENESIS [4/135]
REACTOME_INTERFERON_SIGNALING [4/159] REGULATION_OF_APOPTOSIS [5/341]
REACTOME_ANTIVIRAL_BY_IFN_STIMULATED_GENES [3/66] REGULATION_OF_PROGRAMMED_CELL_DEATH [5/342]
REACTOME_THE_NLRP3_INFLAMMASOME [2/12]
-Log10 (p-value)
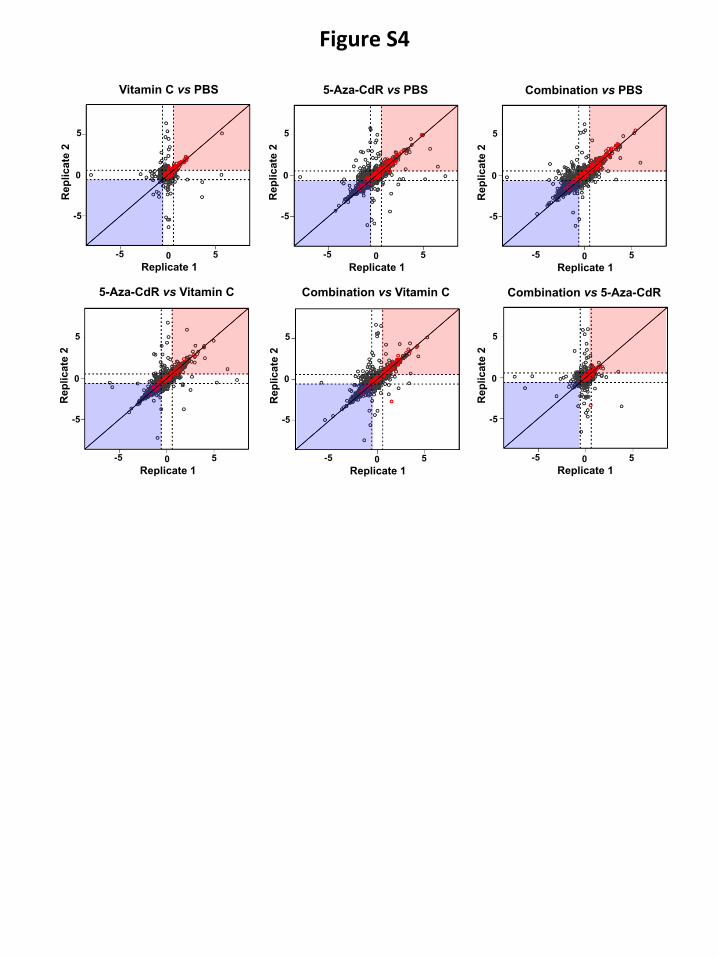
Figure S4
0
0
5
-5
-5 5
Rep
licat
e 2
Replicate 1
Vitamin C vs PBS 5-Aza-CdR vs PBS Combination vs PBS
5-Aza-CdR vs Vitamin C Combination vs Vitamin C Combination vs 5-Aza-CdR
0
0
5
-5
-5 5
Rep
licat
e 2
Replicate 1
0
0
5
-5
-5 5
Rep
licat
e 2
Replicate 1
0
0
5
-5
-5 5
Rep
licat
e 2
Replicate 1
0
0
5
-5
-5 5
Rep
licat
e 2
Replicate 1
0
0
5
-5
-5 5
Rep
licat
e 2
Replicate 1
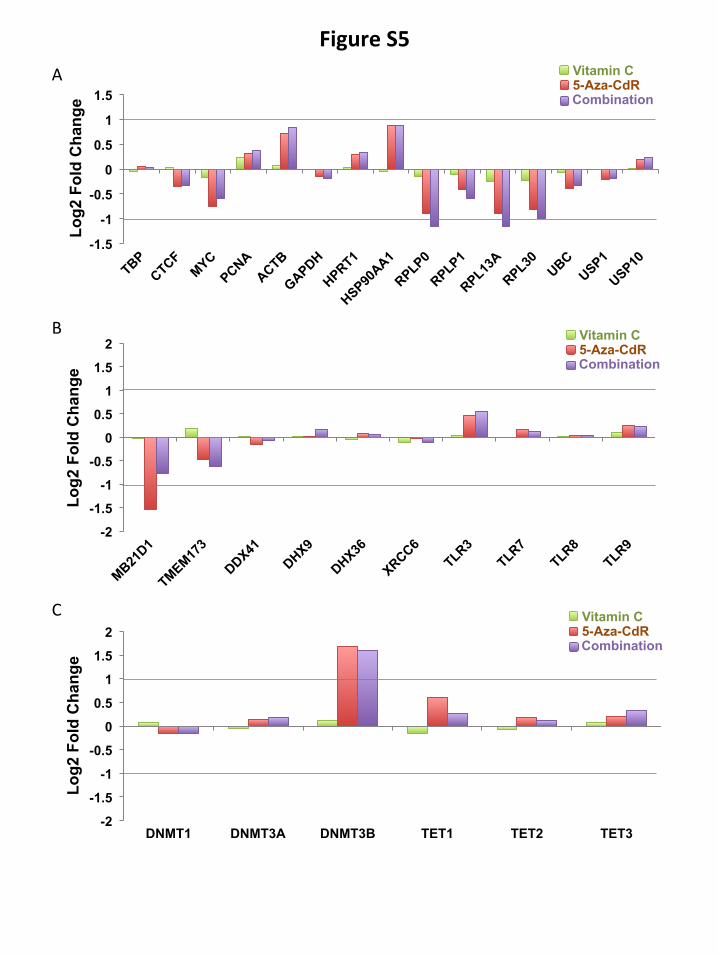
Figure S5
-2
-1.5
-1
-0.5
0
0.5
1
1.5
2
Log2
Fol
d C
hang
e Combination 5-Aza-CdR Vitamin C A
B
C
-1.5
-1
-0.5
0
0.5
1
1.5
Combination 5-Aza-CdR Vitamin C
-2
-1.5
-1
-0.5
0
0.5
1
1.5
2
DNMT1 DNMT3A DNMT3B TET1 TET2 TET3
Log2
Fol
d C
hang
e
Combination 5-Aza-CdR Vitamin C
Log2
Fol
d C
hang
e
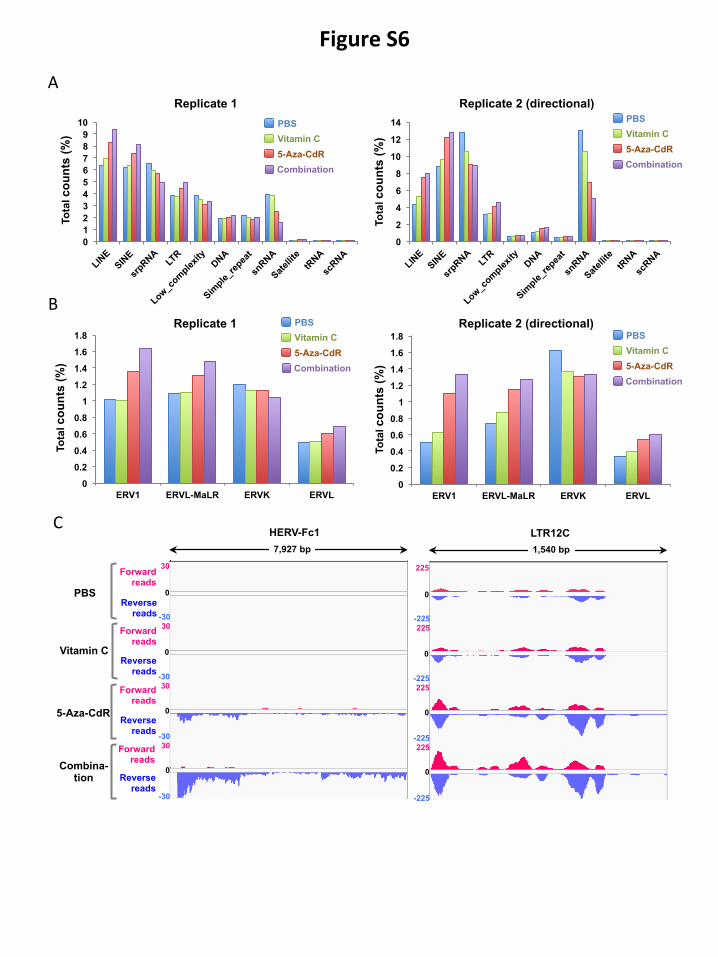
Figure S6
A
0 1 2 3 4 5 6 7 8 9
10
Tota
l cou
nts
(%)
Replicate 1
0
2
4
6
8
10
12
14 Vitamin C
Combination 5-Aza-CdR
PBS
Replicate 2 (directional)
Replicate 1 Replicate 2 (directional)
0
0.2
0.4
0.6
0.8
1
1.2
1.4
1.6
1.8
ERV1 ERVL-MaLR ERVK ERVL
B
0
0.2
0.4
0.6
0.8
1
1.2
1.4
1.6
1.8
ERV1 ERVL-MaLR ERVK ERVL
Vitamin C
Combination 5-Aza-CdR
PBS
Vitamin C
Combination 5-Aza-CdR
PBS
Vitamin C
Combination 5-Aza-CdR
PBS
Tota
l cou
nts
(%)
Tota
l cou
nts
(%)
Tota
l cou
nts
(%)
HERV-Fc1
Reverse reads
Reverse reads
Reverse reads
Reverse reads
Forward reads
Forward reads
Forward reads
Forward reads
0
30
-30 30
0
0
0
-30 30
-30 30
-30
LTR12C
0
225
-225 225
0
0
0
-225 225
-225 225
-225
5-Aza-CdR
Vitamin C
Combina- tion
PBS
7,927 bp 1,540 bp
C
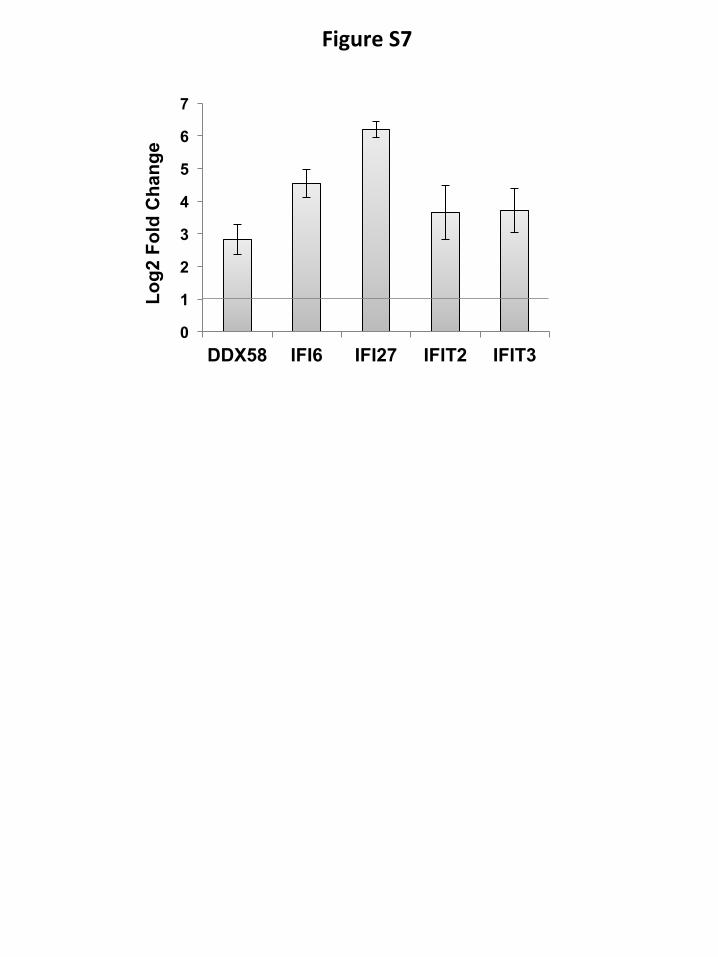
Figure S7
0
1
2
3
4
5
6
7
DDX58 IFI6 IFI27 IFIT2 IFIT3
Log2
Fol
d C
hang
e
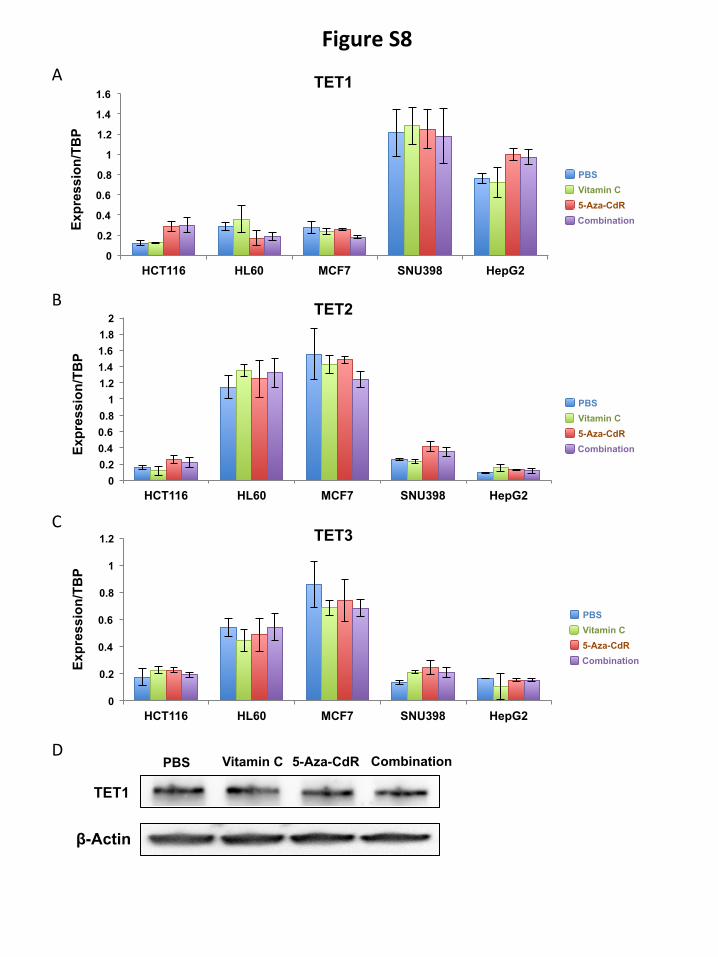
Figure S8 A
B
C
0
0.2
0.4
0.6
0.8
1
1.2
1.4
1.6
HCT116 HL60 MCF7 SNU398 HepG2
Vitamin C
Combination 5-Aza-CdR
PBS
Expr
essi
on/T
BP
TET1 Ex
pres
sion
/TB
P
0 0.2 0.4 0.6 0.8
1 1.2 1.4 1.6 1.8
2
HCT116 HL60 MCF7 SNU398 HepG2
TET2
Expr
essi
on/T
BP
TET3
0
0.2
0.4
0.6
0.8
1
1.2
HCT116 HL60 MCF7 SNU398 HepG2
Vitamin C
Combination 5-Aza-CdR
PBS
Vitamin C
Combination 5-Aza-CdR
PBS
D PBS Vitamin C 5-Aza-CdR Combination
β-Actin
TET1
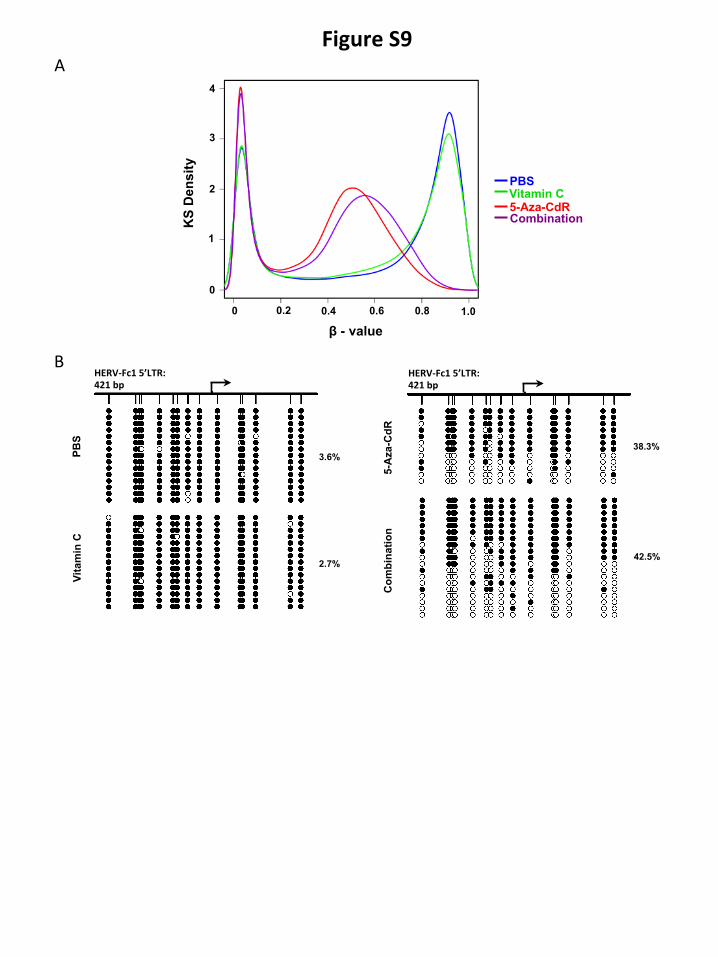
Figure S9
2
4
3
1
0
KS
Den
sity
0 0.2 0.4 0.6 0.8 1.0
PBS Vitamin C 5-Aza-CdR Combination
β - value
B HERV-‐Fc1 5’LTR: 421 bp
PBS
Vita
min
C
HERV-‐Fc1 5’LTR: 421 bp
5-A
za-C
dR
Com
bina
tion
3.6%
2.7%
38.3%
42.5%
A
Vitamin C Day1
7,927 bp 1,540 bp 574 bp IC
Vitamin C Day5
Combination Day1
Combination Day5
5-Aza-CdR Day5
Vitamin C Day5
Combination Day5
PBS Day5
HERV-Fc1 LTR12C
5hm
C-s
eq
RN
A-s
eq
Figure S10
Expr
essi
on/T
BP
Figure S11
A
0
0.2
0.4
0.6
0.8
1
1.2
TET1 TET2 TET3
0
0.2
0.4
0.6
0.8
1
1.2
0
0.2
0.4
0.6
0.8
1
1.2
A2780
TET2 KO
B A2780 TET2 KO
β-Actin
TET1
TET2
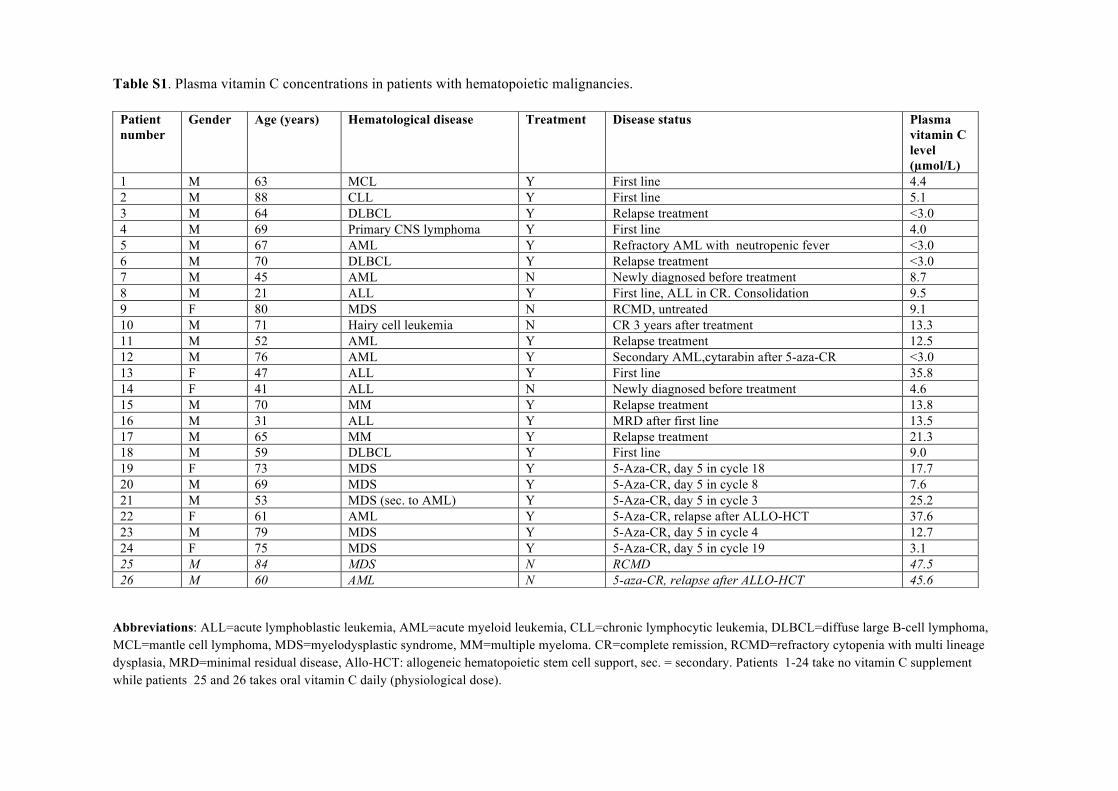
Table S1. Plasma vitamin C concentrations in patients with hematopoietic malignancies.
Abbreviations: ALL=acute lymphoblastic leukemia, AML=acute myeloid leukemia, CLL=chronic lymphocytic leukemia, DLBCL=diffuse large B-cell lymphoma, MCL=mantle cell lymphoma, MDS=myelodysplastic syndrome, MM=multiple myeloma. CR=complete remission, RCMD=refractory cytopenia with multi lineage dysplasia, MRD=minimal residual disease, Allo-HCT: allogeneic hematopoietic stem cell support, sec. = secondary. Patients 1-24 take no vitamin C supplement while patients 25 and 26 takes oral vitamin C daily (physiological dose).
Patient number
Gender Age (years) Hematological disease Treatment Disease status Plasma vitamin C level (µmol/L)
1 M 63 MCL Y First line 4.4 2 M 88 CLL Y First line 5.1 3 M 64 DLBCL Y Relapse treatment <3.0 4 M 69 Primary CNS lymphoma Y First line 4.0 5 M 67 AML Y Refractory AML with neutropenic fever <3.0 6 M 70 DLBCL Y Relapse treatment <3.0 7 M 45 AML N Newly diagnosed before treatment 8.7 8 M 21 ALL Y First line, ALL in CR. Consolidation 9.5 9 F 80 MDS N RCMD, untreated 9.1 10 M 71 Hairy cell leukemia N CR 3 years after treatment 13.3 11 M 52 AML Y Relapse treatment 12.5 12 M 76 AML Y Secondary AML,cytarabin after 5-aza-CR <3.0 13 F 47 ALL Y First line 35.8 14 F 41 ALL N Newly diagnosed before treatment 4.6 15 M 70 MM Y Relapse treatment 13.8 16 M 31 ALL Y MRD after first line 13.5 17 M 65 MM Y Relapse treatment 21.3 18 M 59 DLBCL Y First line 9.0 19 F 73 MDS Y 5-Aza-CR, day 5 in cycle 18 17.7 20 M 69 MDS Y 5-Aza-CR, day 5 in cycle 8 7.6 21 M 53 MDS (sec. to AML) Y 5-Aza-CR, day 5 in cycle 3 25.2 22 F 61 AML Y 5-Aza-CR, relapse after ALLO-HCT 37.6 23 M 79 MDS Y 5-Aza-CR, day 5 in cycle 4 12.7 24 F 75 MDS Y 5-Aza-CR, day 5 in cycle 19 3.1 25 M 84 MDS N RCMD 47.5 26 M 60 AML N 5-aza-CR, relapse after ALLO-HCT 45.6
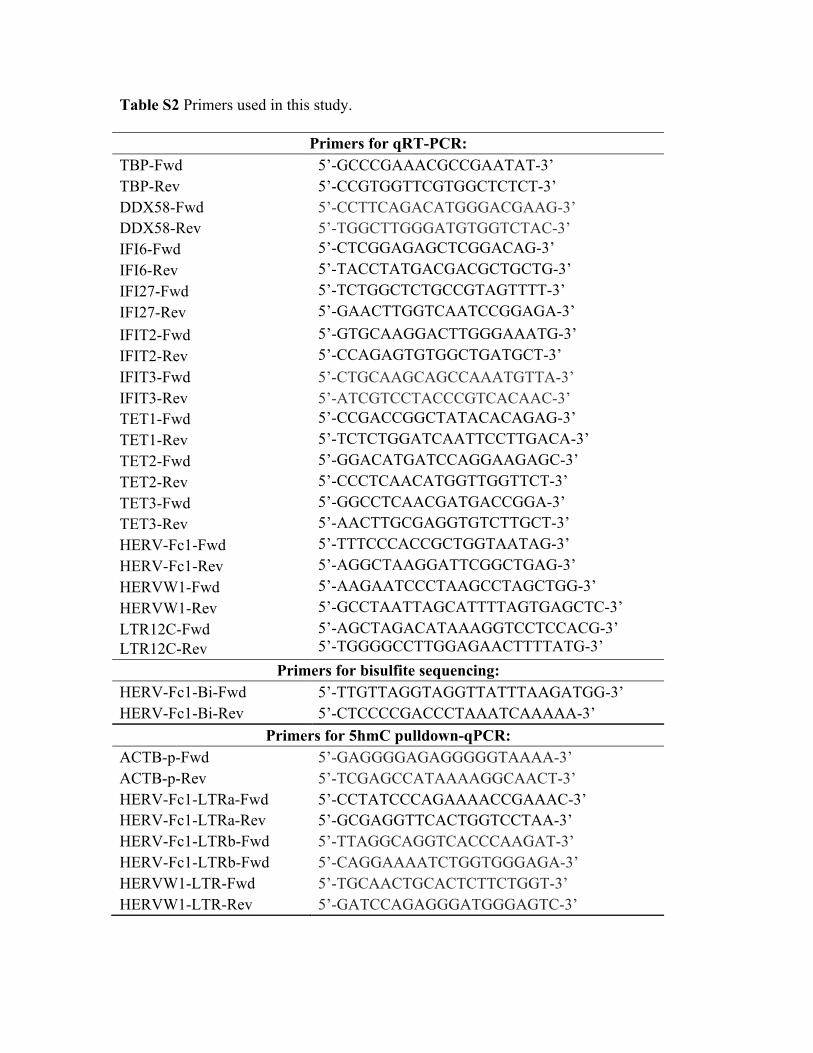
Table S2 Primers used in this study.
Primers for qRT-PCR: TBP-Fwd 5’-GCCCGAAACGCCGAATAT-3’ TBP-Rev 5’-CCGTGGTTCGTGGCTCTCT-3’ DDX58-Fwd 5’-CCTTCAGACATGGGACGAAG-3’ DDX58-Rev 5’-TGGCTTGGGATGTGGTCTAC-3’ IFI6-Fwd 5’-CTCGGAGAGCTCGGACAG-3’ IFI6-Rev 5’-TACCTATGACGACGCTGCTG-3’ IFI27-Fwd 5’-TCTGGCTCTGCCGTAGTTTT-3’ IFI27-Rev 5’-GAACTTGGTCAATCCGGAGA-3’ IFIT2-Fwd 5’-GTGCAAGGACTTGGGAAATG-3’ IFIT2-Rev 5’-CCAGAGTGTGGCTGATGCT-3’ IFIT3-Fwd 5’-CTGCAAGCAGCCAAATGTTA-3’ IFIT3-Rev 5’-ATCGTCCTACCCGTCACAAC-3’ TET1-Fwd 5’-CCGACCGGCTATACACAGAG-3’ TET1-Rev 5’-TCTCTGGATCAATTCCTTGACA-3’ TET2-Fwd 5’-GGACATGATCCAGGAAGAGC-3’ TET2-Rev 5’-CCCTCAACATGGTTGGTTCT-3’ TET3-Fwd 5’-GGCCTCAACGATGACCGGA-3’ TET3-Rev 5’-AACTTGCGAGGTGTCTTGCT-3’ HERV-Fc1-Fwd 5’-TTTCCCACCGCTGGTAATAG-3’ HERV-Fc1-Rev 5’-AGGCTAAGGATTCGGCTGAG-3’ HERVW1-Fwd 5’-AAGAATCCCTAAGCCTAGCTGG-3’ HERVW1-Rev 5’-GCCTAATTAGCATTTTAGTGAGCTC-3’ LTR12C-Fwd LTR12C-Rev
5’-AGCTAGACATAAAGGTCCTCCACG-3’ 5’-TGGGGCCTTGGAGAACTTTTATG-3’
Primers for bisulfite sequencing: HERV-Fc1-Bi-Fwd 5’-TTGTTAGGTAGGTTATTTAAGATGG-3’ HERV-Fc1-Bi-Rev 5’-CTCCCCGACCCTAAATCAAAAA-3’
Primers for 5hmC pulldown-qPCR: ACTB-p-Fwd 5’-GAGGGGAGAGGGGGTAAAA-3’ ACTB-p-Rev 5’-TCGAGCCATAAAAGGCAACT-3’ HERV-Fc1-LTRa-Fwd 5’-CCTATCCCAGAAAACCGAAAC-3’ HERV-Fc1-LTRa-Rev 5’-GCGAGGTTCACTGGTCCTAA-3’ HERV-Fc1-LTRb-Fwd 5’-TTAGGCAGGTCACCCAAGAT-3’ HERV-Fc1-LTRb-Fwd 5’-CAGGAAAATCTGGTGGGAGA-3’ HERVW1-LTR-Fwd 5’-TGCAACTGCACTCTTCTGGT-3’ HERVW1-LTR-Rev 5’-GATCCAGAGGGATGGGAGTC-3’


![RESEARCH ARTICLE Open Access High prevalence of ......the study protocol [CMO 2007/22]. Study Participants Study participants were recruited from patients partici-pating in a controlled](https://img.pdfslide.us/doc/110x75/6088afe278c30657ce5fcf0a/research-article-open-access-high-prevalence-of-the-study-protocol-cmo.jpg)