Embed Size (px)
Citation preview
SI Appendix
10.1073/pnas.1513488112
Round-the-clock power supply and a sustainable economy via synergistic integration of solar thermal power and hydrogen processes
Authors: Emre Gençera, Dharik S. Mallapragadaa, François Maréchalb, Mohit Tawarmalanic, Rakesh Agrawala,1
Affiliations: aSchool of Chemical Engineering, Purdue University, West Lafayette, IN 47907 bIndustrial Process and Energy Systems Engineering Group, École Polytechnique Fédérale de Lausanne, CH-1951 Sion, Switzerland cKrannert School of Management, Purdue University, West Lafayette, IN 47907 1To whom correspondence should be addressed. Email: [email protected]
Gençer et al. www.pnas.org/cgi/doi/10.1073/pnas.1513488112 S2
1. Maximum Solar Thermal Energy Collection Temperature
Maximum solar thermal energy collection temperature is determined by Eq. S1 where σ is the
Stefan-Boltzman’s constant, I is the solar intensity and C is the solar concentration ratio. For
calculation, we assume a solar intensity of 1000W/m2 (AM1.5 solar intensity). To achieve high
temperatures the solar concentration must be above certain value e.g. C should be greater than
372 and 1587 for collecting heat at 1600K and 2300K, respectively.
0.25
maxI CTσ⋅⎛ ⎞= ⎜ ⎟⎝ ⎠
(S1)
2. Sun-to-Electricity (STE) Efficiency
STE efficiency refers to the fraction of incident solar energy recovered as the electricity output.
In Eq. S2, Wnet is the net electricity output, Qin is the heat used in the process, Qsolar is the total
solar energy supplied to the solar collector, Ωopt is the optical efficiency that accounts for optical
losses associated with solar concentration system and is defined as the fraction of total incident
solar radiation received by the blackbody absorber (or solar receiver), σ is the Stefan-Boltzmann
constant, T is the solar heat collection temperature, I is the solar intensity and C is the solar
concentration ratio. Note that Eq. S2 doesn’t account for the intermittency and variability
associated with solar energy. As a reference, the equation for the maximum achievable STE
efficiency for a specified concentration ratio and optical efficiency is given by Eq. S3 where Ta is
the ambient temperature (1).
STE efficiency4
100, where 1
net insolar
solaropt
W QQQ T
I Cσ
= × =⎛ ⎞
Ω −⎜ ⎟⋅⎝ ⎠
(S2)
Gençer et al. www.pnas.org/cgi/doi/10.1073/pnas.1513488112 S3
Maximum achievable STE efficiency4
1 1 100aopt
TTI C Tσ⎛ ⎞⎛ ⎞=Ω − − ×⎜ ⎟⎜ ⎟⋅ ⎝ ⎠⎝ ⎠
(S3)
3. Overall Sun-to-Electricity (OSTE) Efficiency
OSTE efficiency refers to the net STE efficiency averaged over a period of time such as a
twenty-four hour day, electricity is supplied over this time period on as needed basis. OSTE
efficiency accounts for energy storage, delivery of the stored energy while solar energy is not
available, and the corresponding losses associated with these activities. In Eq. S4, Wnet,total is
the total net electrical energy output over the entire electricity supply period, ξsolar,total is the
total solar energy required by the process for Wnet, total electricity supply. Note that ξsolar,total
accounts for the solar intensity, and solar concentration ratio. It is measured before losses due
to reradiations and optical efficiency of the solar collectors as described in section 2.
OSTE efficiency ,
,
100net total
solar total
Wξ
= × (S4)
4. Heat-to-Electricity Efficiency (QTE)
QTE efficiency refers to the fraction of heat (thermal energy) absorbed by the blackbody
absorber that is converted to electricity. In Eq. S5, Wnet is the net electricity output, Qin is the
heat input to the process and is measured after reradiation and optical efficiency losses.
QTE efficiency 100net
in
WQ
= × (S5)
5. General Modeling Assumptions
The Predictive Redlich-Kwong-Soave equation of state, NBS/NRC steam tables, and HSC
Chemistry database (2) are used to retrieve the relevant thermodynamic properties for the
Gençer et al. www.pnas.org/cgi/doi/10.1073/pnas.1513488112 S4
calculations. Process simulations are carried out in ASPEN Plus v.8.0 (3). For streams of
steam/water, the NBS/NRC steam tables are used as the thermodynamic model for the
calculations of chemical equilibrium, heat of reaction, and heat capacity.
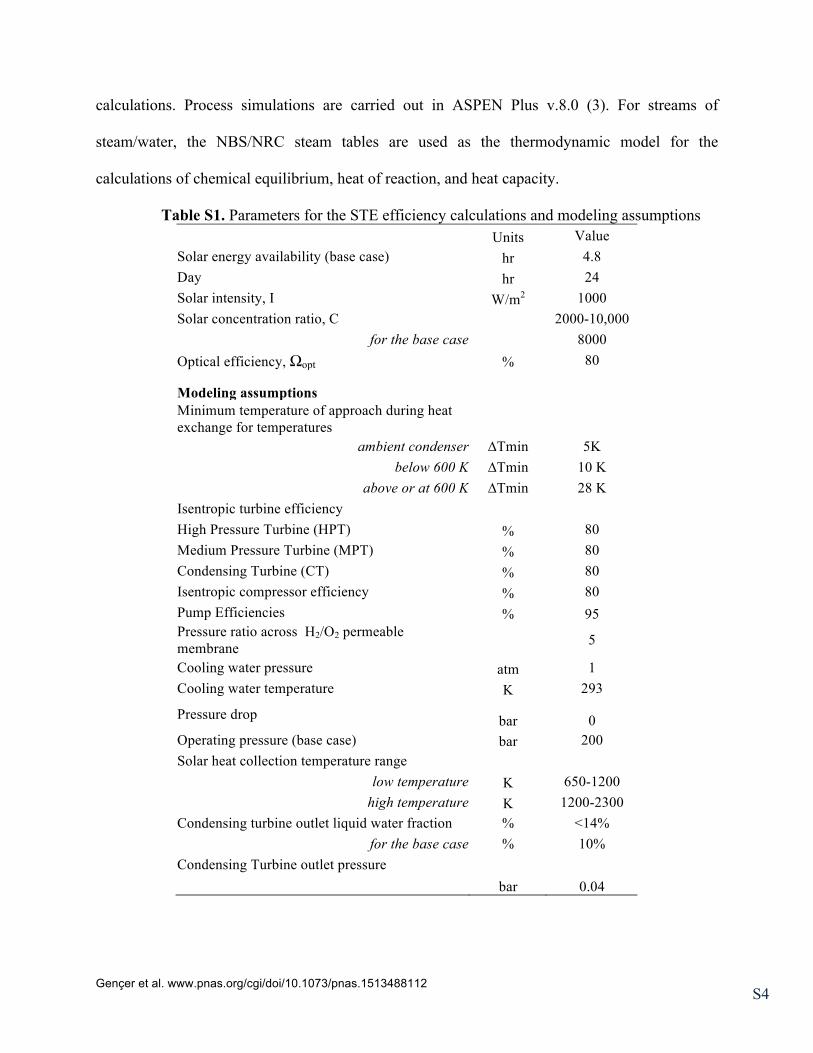
Table S1. Parameters for the STE efficiency calculations and modeling assumptions Units Value Solar energy availability (base case) hr 4.8 Day hr 24 Solar intensity, I W/m2 1000 Solar concentration ratio, C 2000-10,000
for the base case 8000 Optical efficiency, Ωopt % 80
Modeling assumptions Minimum temperature of approach during heat exchange for temperatures
ambient condenser ∆Tmin 5K below 600 K ∆Tmin 10 K
above or at 600 K ∆Tmin 28 K Isentropic turbine efficiency High Pressure Turbine (HPT) % 80 Medium Pressure Turbine (MPT) % 80 Condensing Turbine (CT) % 80 Isentropic compressor efficiency % 80 Pump Efficiencies % 95 Pressure ratio across H2/O2 permeable membrane 5
Cooling water pressure atm 1 Cooling water temperature K 293
Pressure drop bar 0 Operating pressure (base case) bar 200 Solar heat collection temperature range
low temperature K 650-1200 high temperature K 1200-2300
Condensing turbine outlet liquid water fraction % <14% for the base case % 10%
Condensing Turbine outlet pressure
bar 0.04
Gençer et al. www.pnas.org/cgi/doi/10.1073/pnas.1513488112 S5
Predictive Redlich-Kwong-Soave equation of state is primarily used for streams that do not
contain water (e.g. hydrogen and oxygen streams). Calculations for hydrogen production via
FeO/Fe3O4 based thermochemical cycle are carried out in MATLAB using HSC Chemistry
thermodynamic data. The power cycle part of the process is prepared in ASPEN Plus similar to
other scenarios and the results are integrated with MATLAB results. Single-stage membrane
water-splitting reactor for hydrogen production is modeled in an integrated ASPEN and
MATLAB modeling environment. In all cases, the material flows are calculated in ASPEN and
the minimum solar heat requirement for the process is calculated from the overall process heat
balance using heat cascade principle of the pinch analysis method (4).
5.1. Pressure ratio calculation for turbines
The Pressure Ratio (PR) is assumed to be equal for all turbines and calculated using Eq. S6,
where Pmax is the maximum pressure in the system, PCT,in is the condensing turbine inlet pressure
and n is the number of reheating stages.
1n+2
max
CT,in
PPR = P
⎛ ⎞⎜ ⎟⎜ ⎟⎝ ⎠
(S6)
Equal pressure ratio for each turbine provides the opportunity to utilize the high temperature heat
equally for different pressure levels. However, superior STE efficiency is achievable by a power
cycle optimization that alters pressure ratio across each turbine.
6. Utilization of High Temperature
The study includes a range of temperatures to demonstrate the effect of solar heat collection
temperature on the efficiency of the proposed processes. The efficiency reaches a maximum at
an intermediate temperature due to two competing effects: (i) a higher temperature imparts a
Gençer et al. www.pnas.org/cgi/doi/10.1073/pnas.1513488112 S6
higher value of exergy to a unit quantity of heat, (ii) the blackbody absorber irradiates a greater
fraction of the incident solar radiation at a higher temperature. Hence, the preferred operation
temperature for SWP-n cycle (1800 K – 1900 K) is less than or equal to the temperature at which
the process efficiency is maximum. The preferred temperature for SWH2P cycle with two step
hydrogen production integrated with H2WP cycle can be as low as 1600 K, since OSTE
efficiency of the integrated system is almost the same as the operation at 1800K. The
implementation of the processes at the preferred temperature level depends on the availability of
materials for equipment construction. Commercially available One Atmosphere Boiler (5) can
generate steam up to 1573 K. Current advanced gas turbine engines are operated at turbine inlet
temperature of 1473 K – 1773 K and with recently developed cooling techniques the allowable
inlet temperature of turbines are expected to reach above ~2000 K (6). Hence, the integrated
system that operates at solar heat collection temperature of 1600 K seems promising for
continuous solar thermal electricity production solution because currently available technology
can handle this temperature.
7. Water Power Cycles
Steam cycles are generally operated with maximum steam temperatures of 650-900 K and
pressures in the range of 30-140 bar (7). In addition, high temperature water cycles with CO2
recovery that operate at temperatures of ~1625 K using fossil-fired derived heat have been
discussed in the literature (Graz-cycle, Matiant-cycle, water cycle, etc.) (8-12).
8. Water Dissociation
The equilibrium water dissociation at the highest temperature considered in our calculations of
2300 K is less than 0.4%. In our simulations, we allowed for equilibrium water dissociation
assuming the following species to be present: H2O, OH, H2, H and O2, O (13). All the stated
Gençer et al. www.pnas.org/cgi/doi/10.1073/pnas.1513488112 S7
species are defined in the ASPEN simulation and the equilibrium composition is determined by a
Gibbs free energy minimization approach. A phase and chemical equilibrium calculation is
carried out for every temperature change in the flowsheet, assuming zero net heat duty. This
approach also takes into account possible temperature variations due to the water dissociation
(association) of molecular (atomic) hydrogen or oxygen species.
9. Catalytic Combustion of Unreacted Hydrogen
In all cycles presented in this study, a catalytic combustion step (at temperature of 385.9 K for
the base case) is included prior to the condensing turbine inlet, to ensure the complete conversion
of any unconverted H2, OH, and O2 species to steam. Hence, the discharge stream of the
condensing turbine does not contain any noncondensible species and is composed of 100% H2O
(partially condensed water vapor). The catalytic combustion process is modeled as a Gibbs
reactor.
10. Solar Thermal Power Cycles
Solar thermal power cycles are extensively studied in the literature for various concentrators, i.e.
parabolic dish (14), linear Fresnel (15), central tower (16, 17) and parabolic trough (18), for
various power generation cycles, i.e. pressurized air cycles (19), molten salt cycles (20) and
direct steam cycles (21), and for various operating regimes (22). This study focuses on two main
categories of solar thermal cycles: (1) solar thermal water power generation via Direct Solar
Thermal Power (DSTP), Solar Water Power (SWP), and Solar Water Power with n-Reheat
(SWP-n), and (2) solar thermal power and hydrogen co-generation via the Solar Water Hydrogen
Power (SWH2P) cycle. Water is the working fluid in all the power cycles investigated in this
study.
Gençer et al. www.pnas.org/cgi/doi/10.1073/pnas.1513488112 S8
10.1. Direct Solar Thermal Power (DSTP) Cycle
DSTP cycle can be categorized as Rankine type power cycle and closely resembles the process
layout of existing solar thermal power plants. Accordingly, the DSTP cycle is the base case for
this study. The working fluid, water, is pumped to high pressures and superheated using solar
energy. Superheated pressurized steam is expanded in single or multiple turbines to generate
electricity. Concentrated solar energy provides the heat requirement for evaporation to produce
saturated steam and subsequent superheating.
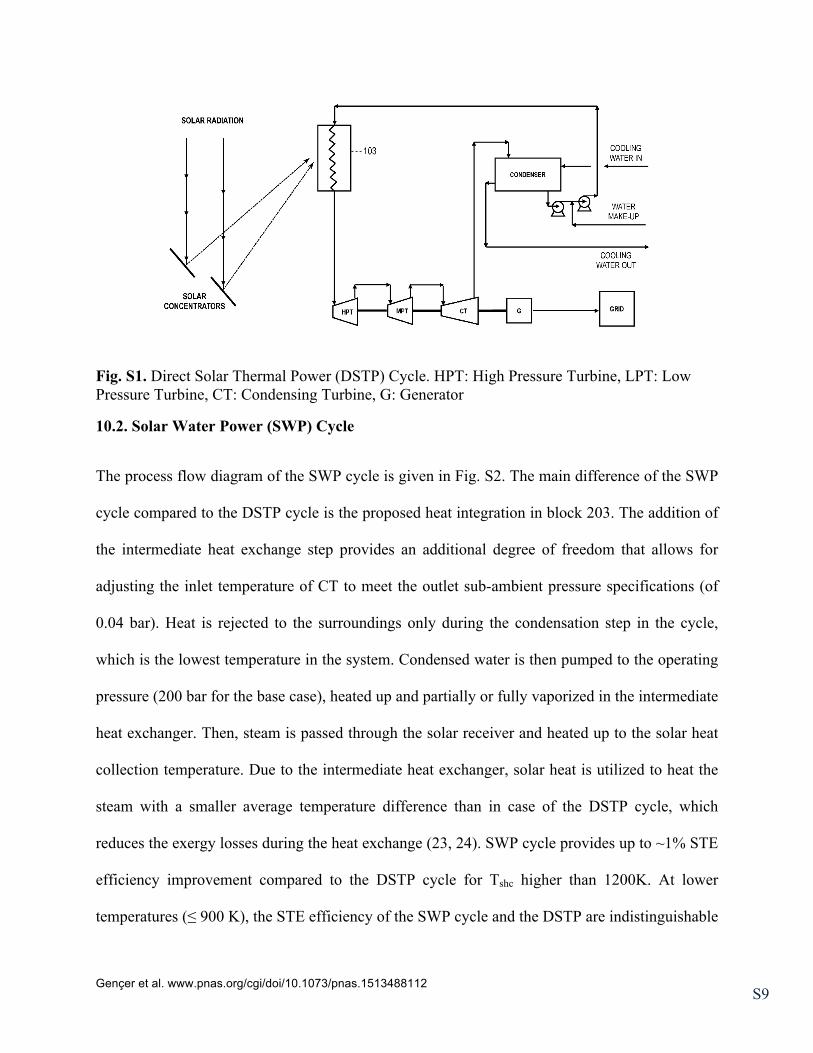
The flow diagram of the DSTP cycle is shown in Fig. S1. Liquid water at low pressure (0.04 bar
for base case) is pumped to a high pressure (200 bar for base case) and then heated up to the
solar heat collection temperature (Tshc) in block 103. Superheated steam is expanded in high
pressure turbine (HPT), medium pressure turbine (MPT), and finally the condensing turbine
(CT). For temperatures lower than 950 K, the outlet pressure of the condensing turbine cannot be
kept fixed at 0.04 bar since otherwise the temperature of discharge stream of the condensing
turbine would be below the approach temperature to cooling water temperature. Therefore, for
temperatures lower than 950 K, the CT outlet pressure was calculated using the allowable liquid
fraction and the available cooling water temperature as constraints. For temperatures higher than
950 K, the condensing turbine outlet pressure was fixed at 0.04 bar. For a solar concentration of
8000 and Tshc in the range of 650K to 2300K, the calculated STE efficiencies for DSTP cycle are
in the range of 20.1% to 38.5% with the maximum value at 1800K.
Gençer et al. www.pnas.org/cgi/doi/10.1073/pnas.1513488112 S9
Fig. S1. Direct Solar Thermal Power (DSTP) Cycle. HPT: High Pressure Turbine, LPT: Low Pressure Turbine, CT: Condensing Turbine, G: Generator
10.2. Solar Water Power (SWP) Cycle
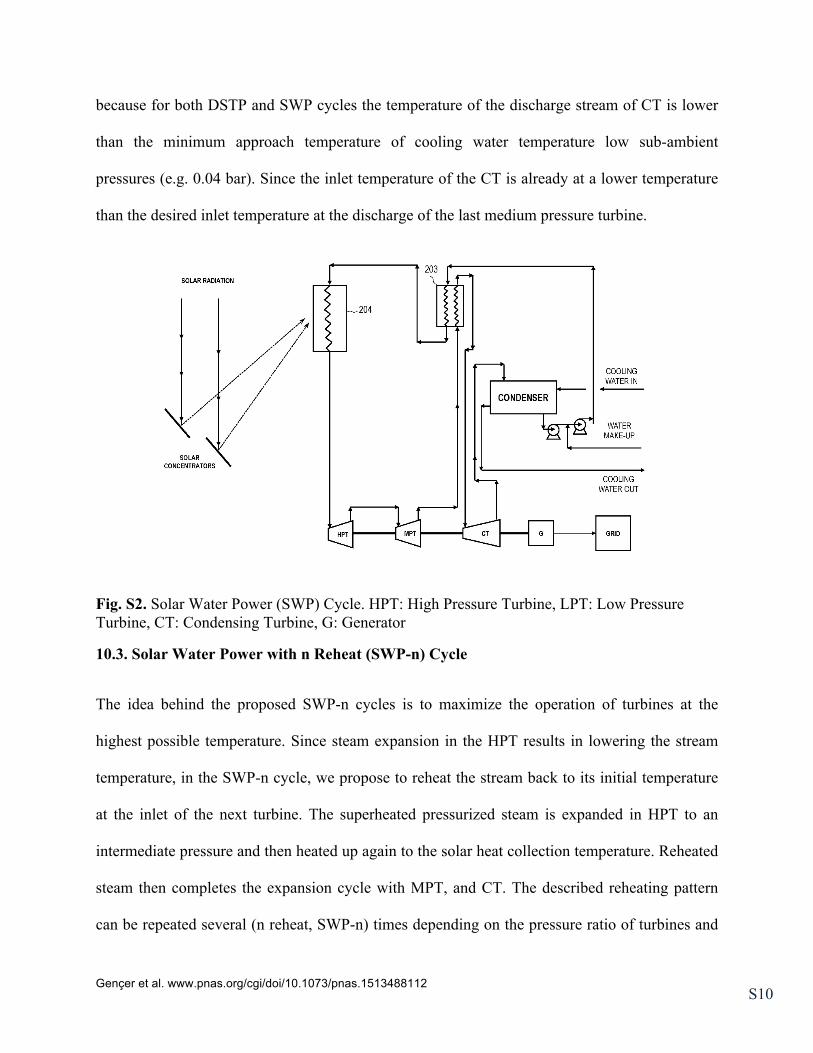
The process flow diagram of the SWP cycle is given in Fig. S2. The main difference of the SWP
cycle compared to the DSTP cycle is the proposed heat integration in block 203. The addition of
the intermediate heat exchange step provides an additional degree of freedom that allows for
adjusting the inlet temperature of CT to meet the outlet sub-ambient pressure specifications (of
0.04 bar). Heat is rejected to the surroundings only during the condensation step in the cycle,
which is the lowest temperature in the system. Condensed water is then pumped to the operating
pressure (200 bar for the base case), heated up and partially or fully vaporized in the intermediate
heat exchanger. Then, steam is passed through the solar receiver and heated up to the solar heat
collection temperature. Due to the intermediate heat exchanger, solar heat is utilized to heat the
steam with a smaller average temperature difference than in case of the DSTP cycle, which
reduces the exergy losses during the heat exchange (23, 24). SWP cycle provides up to ~1% STE
efficiency improvement compared to the DSTP cycle for Tshc higher than 1200K. At lower
temperatures (≤ 900 K), the STE efficiency of the SWP cycle and the DSTP are indistinguishable
Gençer et al. www.pnas.org/cgi/doi/10.1073/pnas.1513488112 S10
because for both DSTP and SWP cycles the temperature of the discharge stream of CT is lower
than the minimum approach temperature of cooling water temperature low sub-ambient
pressures (e.g. 0.04 bar). Since the inlet temperature of the CT is already at a lower temperature
than the desired inlet temperature at the discharge of the last medium pressure turbine.
Fig. S2. Solar Water Power (SWP) Cycle. HPT: High Pressure Turbine, LPT: Low Pressure Turbine, CT: Condensing Turbine, G: Generator
10.3. Solar Water Power with n Reheat (SWP-n) Cycle
The idea behind the proposed SWP-n cycles is to maximize the operation of turbines at the
highest possible temperature. Since steam expansion in the HPT results in lowering the stream
temperature, in the SWP-n cycle, we propose to reheat the stream back to its initial temperature
at the inlet of the next turbine. The superheated pressurized steam is expanded in HPT to an
intermediate pressure and then heated up again to the solar heat collection temperature. Reheated
steam then completes the expansion cycle with MPT, and CT. The described reheating pattern
can be repeated several (n reheat, SWP-n) times depending on the pressure ratio of turbines and
Gençer et al. www.pnas.org/cgi/doi/10.1073/pnas.1513488112 S11
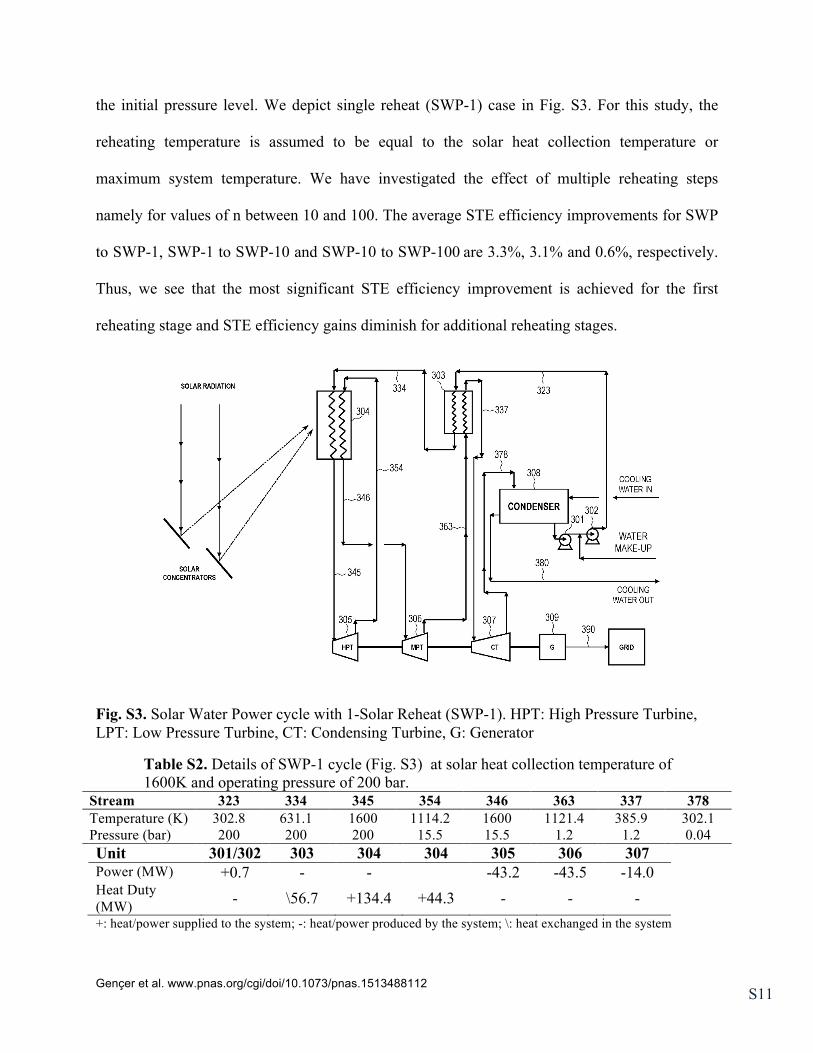
the initial pressure level. We depict single reheat (SWP-1) case in Fig. S3. For this study, the
reheating temperature is assumed to be equal to the solar heat collection temperature or
maximum system temperature. We have investigated the effect of multiple reheating steps
namely for values of n between 10 and 100. The average STE efficiency improvements for SWP
to SWP-1, SWP-1 to SWP-10 and SWP-10 to SWP-100 are 3.3%, 3.1% and 0.6%, respectively.
Thus, we see that the most significant STE efficiency improvement is achieved for the first
reheating stage and STE efficiency gains diminish for additional reheating stages.
Fig. S3. Solar Water Power cycle with 1-Solar Reheat (SWP-1). HPT: High Pressure Turbine, LPT: Low Pressure Turbine, CT: Condensing Turbine, G: Generator
Table S2. Details of SWP-1 cycle (Fig. S3) at solar heat collection temperature of 1600K and operating pressure of 200 bar.
Stream 323 334 345 354 346 363 337 378 Temperature (K) 302.8 631.1 1600 1114.2 1600 1121.4 385.9 302.1 Pressure (bar) 200 200 200 15.5 15.5 1.2 1.2 0.04 Unit 301/302 303 304 304 305 306 307 Power (MW) +0.7 - - -43.2 -43.5 -14.0 Heat Duty (MW) - \56.7 +134.4 +44.3 - - - +: heat/power supplied to the system; -: heat/power produced by the system; \: heat exchanged in the system
Gençer et al. www.pnas.org/cgi/doi/10.1073/pnas.1513488112 S12
10.3.1. Effect of operating conditions
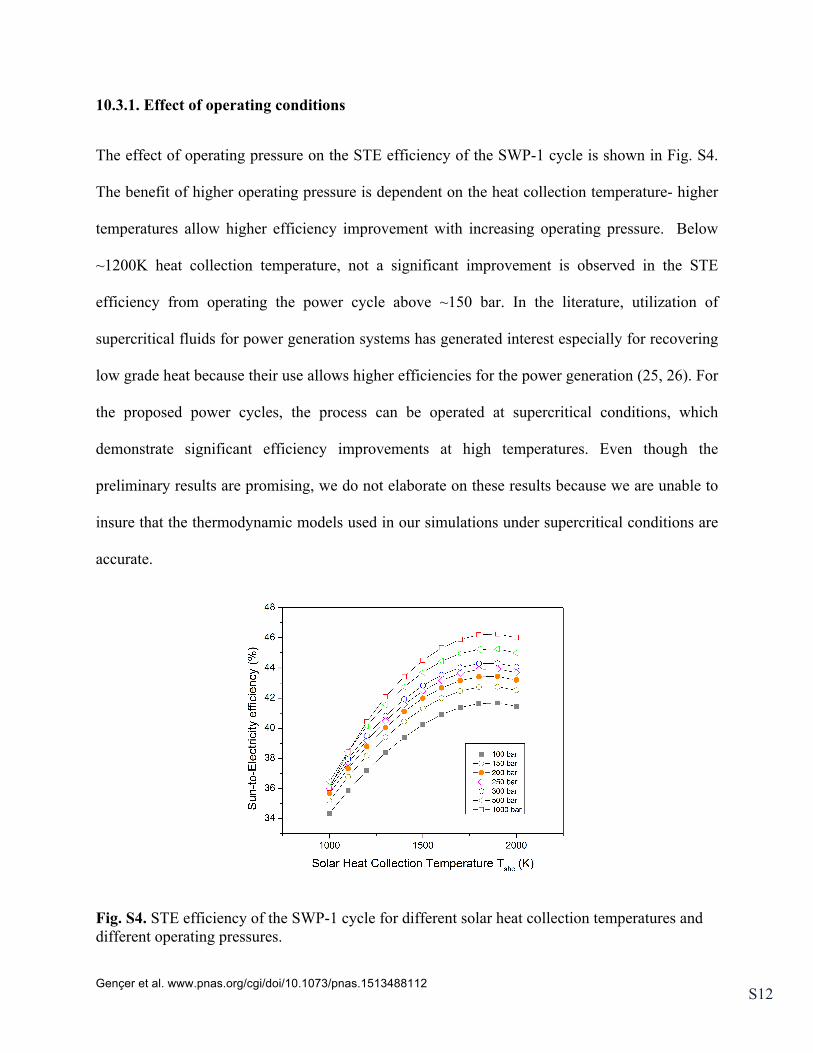
The effect of operating pressure on the STE efficiency of the SWP-1 cycle is shown in Fig. S4.
The benefit of higher operating pressure is dependent on the heat collection temperature- higher
temperatures allow higher efficiency improvement with increasing operating pressure. Below
~1200K heat collection temperature, not a significant improvement is observed in the STE
efficiency from operating the power cycle above ~150 bar. In the literature, utilization of
supercritical fluids for power generation systems has generated interest especially for recovering
low grade heat because their use allows higher efficiencies for the power generation (25, 26). For
the proposed power cycles, the process can be operated at supercritical conditions, which
demonstrate significant efficiency improvements at high temperatures. Even though the
preliminary results are promising, we do not elaborate on these results because we are unable to
insure that the thermodynamic models used in our simulations under supercritical conditions are
accurate.
Fig. S4. STE efficiency of the SWP-1 cycle for different solar heat collection temperatures and different operating pressures.
Gençer et al. www.pnas.org/cgi/doi/10.1073/pnas.1513488112 S13
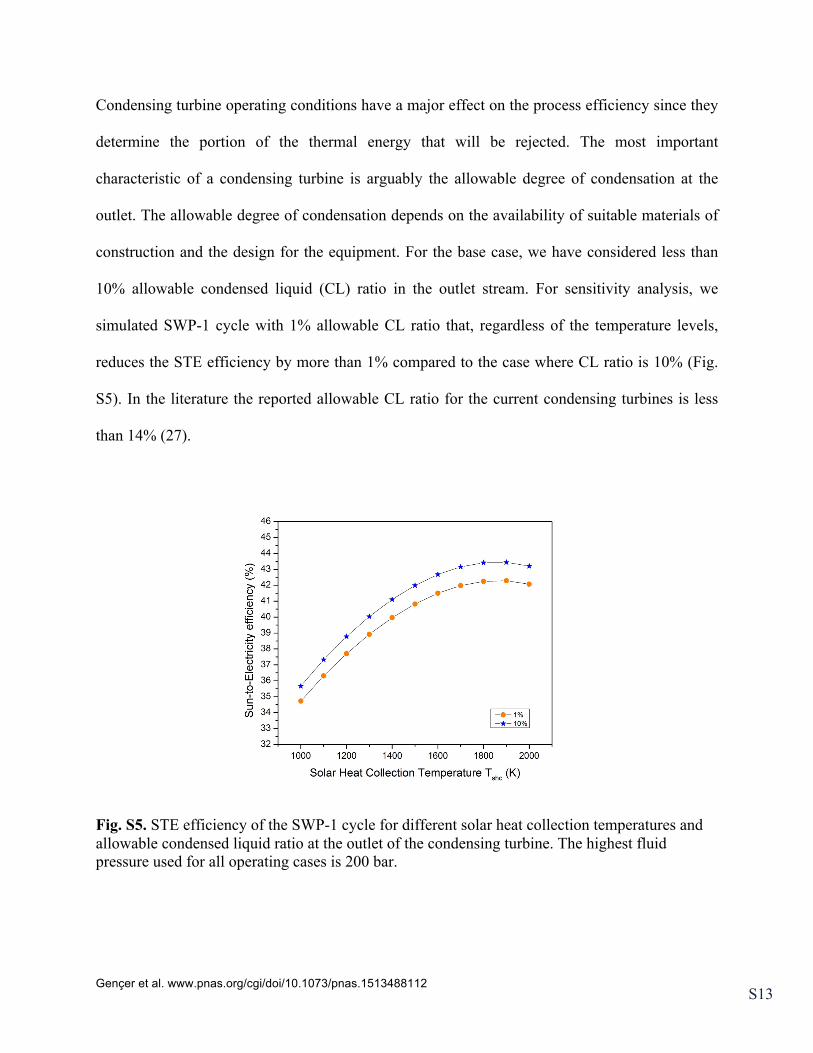
Condensing turbine operating conditions have a major effect on the process efficiency since they
determine the portion of the thermal energy that will be rejected. The most important
characteristic of a condensing turbine is arguably the allowable degree of condensation at the
outlet. The allowable degree of condensation depends on the availability of suitable materials of
construction and the design for the equipment. For the base case, we have considered less than
10% allowable condensed liquid (CL) ratio in the outlet stream. For sensitivity analysis, we
simulated SWP-1 cycle with 1% allowable CL ratio that, regardless of the temperature levels,
reduces the STE efficiency by more than 1% compared to the case where CL ratio is 10% (Fig.
S5). In the literature the reported allowable CL ratio for the current condensing turbines is less
than 14% (27).
Fig. S5. STE efficiency of the SWP-1 cycle for different solar heat collection temperatures and allowable condensed liquid ratio at the outlet of the condensing turbine. The highest fluid pressure used for all operating cases is 200 bar.
Gençer et al. www.pnas.org/cgi/doi/10.1073/pnas.1513488112 S14
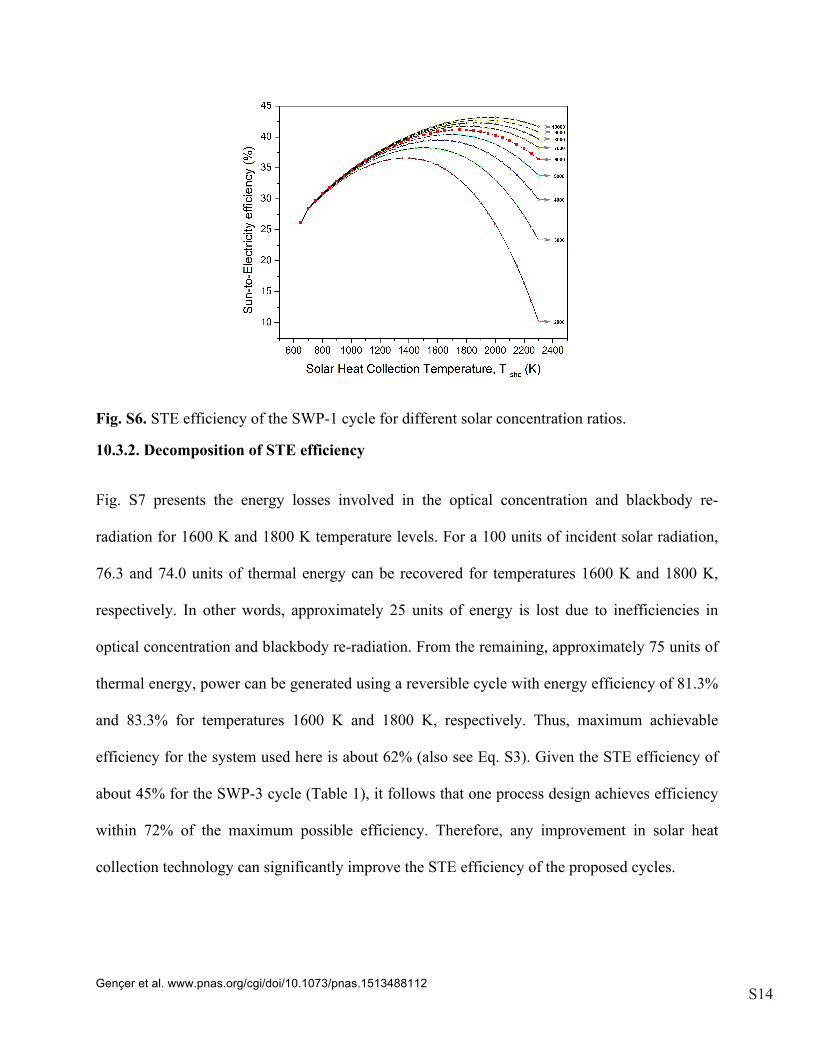
Fig. S6. STE efficiency of the SWP-1 cycle for different solar concentration ratios.
10.3.2. Decomposition of STE efficiency
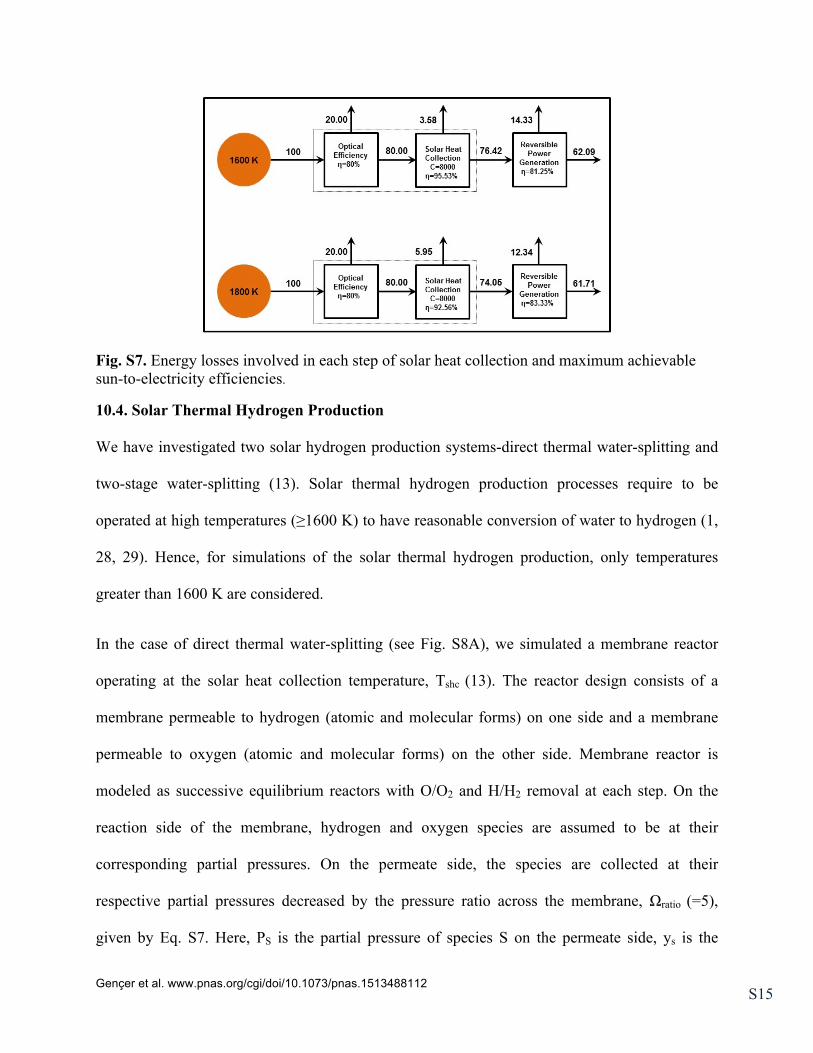
Fig. S7 presents the energy losses involved in the optical concentration and blackbody re-
radiation for 1600 K and 1800 K temperature levels. For a 100 units of incident solar radiation,
76.3 and 74.0 units of thermal energy can be recovered for temperatures 1600 K and 1800 K,
respectively. In other words, approximately 25 units of energy is lost due to inefficiencies in
optical concentration and blackbody re-radiation. From the remaining, approximately 75 units of
thermal energy, power can be generated using a reversible cycle with energy efficiency of 81.3%
and 83.3% for temperatures 1600 K and 1800 K, respectively. Thus, maximum achievable
efficiency for the system used here is about 62% (also see Eq. S3). Given the STE efficiency of
about 45% for the SWP-3 cycle (Table 1), it follows that one process design achieves efficiency
within 72% of the maximum possible efficiency. Therefore, any improvement in solar heat
collection technology can significantly improve the STE efficiency of the proposed cycles.
Gençer et al. www.pnas.org/cgi/doi/10.1073/pnas.1513488112 S15
Fig. S7. Energy losses involved in each step of solar heat collection and maximum achievable sun-to-electricity efficiencies.
10.4. Solar Thermal Hydrogen Production
We have investigated two solar hydrogen production systems-direct thermal water-splitting and
two-stage water-splitting (13). Solar thermal hydrogen production processes require to be
operated at high temperatures (≥1600 K) to have reasonable conversion of water to hydrogen (1,
28, 29). Hence, for simulations of the solar thermal hydrogen production, only temperatures
greater than 1600 K are considered.
In the case of direct thermal water-splitting (see Fig. S8A), we simulated a membrane reactor
operating at the solar heat collection temperature, Tshc (13). The reactor design consists of a
membrane permeable to hydrogen (atomic and molecular forms) on one side and a membrane
permeable to oxygen (atomic and molecular forms) on the other side. Membrane reactor is
modeled as successive equilibrium reactors with O/O2 and H/H2 removal at each step. On the
reaction side of the membrane, hydrogen and oxygen species are assumed to be at their
corresponding partial pressures. On the permeate side, the species are collected at their
respective partial pressures decreased by the pressure ratio across the membrane, Ωratio (=5),
given by Eq. S7. Here, PS is the partial pressure of species S on the permeate side, ys is the
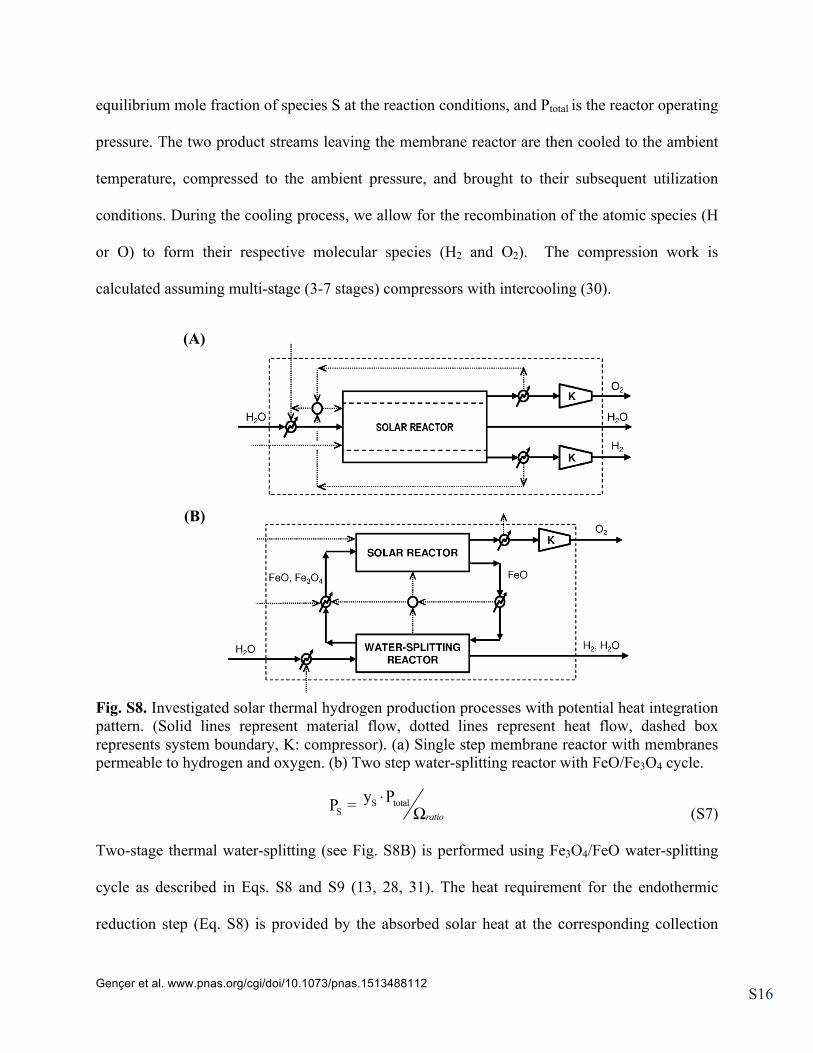
Gençer et al. www.pnas.org/cgi/doi/10.1073/pnas.1513488112 S16
equilibrium mole fraction of species S at the reaction conditions, and Ptotal is the reactor operating
pressure. The two product streams leaving the membrane reactor are then cooled to the ambient
temperature, compressed to the ambient pressure, and brought to their subsequent utilization
conditions. During the cooling process, we allow for the recombination of the atomic species (H
or O) to form their respective molecular species (H2 and O2). The compression work is
calculated assuming multi-stage (3-7 stages) compressors with intercooling (30).
(A)
(B)
Fig. S8. Investigated solar thermal hydrogen production processes with potential heat integration pattern. (Solid lines represent material flow, dotted lines represent heat flow, dashed box represents system boundary, K: compressor). (a) Single step membrane reactor with membranes permeable to hydrogen and oxygen. (b) Two step water-splitting reactor with FeO/Fe3O4 cycle.
S totalS
y PP = ratio
⋅Ω (S7)
Two-stage thermal water-splitting (see Fig. S8B) is performed using Fe3O4/FeO water-splitting
cycle as described in Eqs. S8 and S9 (13, 28, 31). The heat requirement for the endothermic
reduction step (Eq. S8) is provided by the absorbed solar heat at the corresponding collection
Gençer et al. www.pnas.org/cgi/doi/10.1073/pnas.1513488112 S17
temperature (≥1600 K). The reaction pressure is governed by the partial pressure of oxygen,
which is kept below 1 atm (equal to 0.2 bar for the base case). The produced oxygen is
continuously withdrawn to achieve the desired conversion and then compressed to the ambient
pressure. The exothermic oxidation step (Eq. S9) is operated below 1200 K to ensure reasonable
conversion. The equilibrium conversion of the oxidation reaction is independent of the reaction
pressure. Therefore, we allowed the model to run the reaction at high pressures, which in some
cases increases the STE efficiency because the subsequent work of compressing H2 is reduced.
3 4 2 red redFe O 3FeO + 0.5O at T , P→ (S8)
2 3 4 2 ox ox3FeO + H O Fe O + H at T , P→ (S9)
10.4.Alternative uses of Solar Water Hydrogen Power (SWH2P) Cycle
In the SWH2P cycles co-producing hydrogen, oxygen, and electricity, the unconverted steam
entering the water-splitting reactor is expanded to a medium pressure level or depending on the
operation conditions the high pressure steam is direct fed to the water-splitting reactor. The
produced hydrogen can be used for one of the following purposes
i. Energy storage,
ii. Power generation,
iii. Production of fuel and chemicals,
iv. Providing heat when solar heat is unavailable.
Depending on the case, the coproduced hydrogen and oxygen are cooled and then either
compressed to the medium pressure level or brought to the specified conditions of the end use
Gençer et al. www.pnas.org/cgi/doi/10.1073/pnas.1513488112 S18
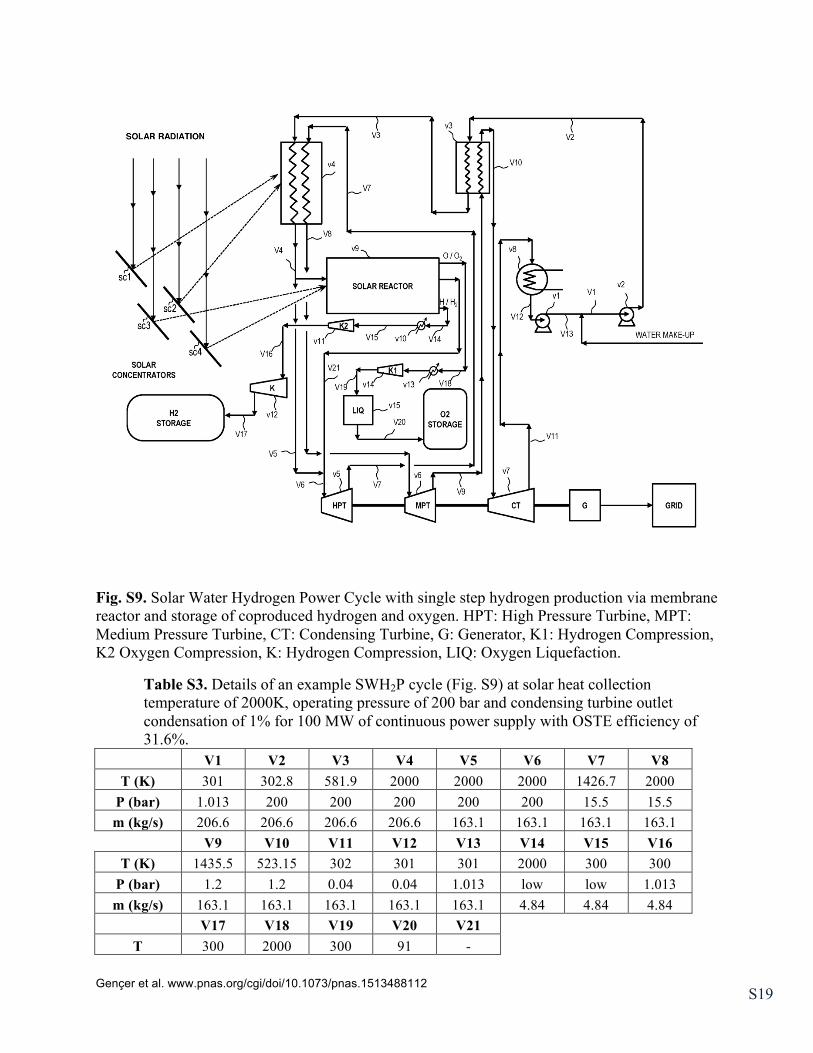
(e.g. storage conditions). Two detailed flowsheets of SWH2P cycle are shown in Fig. S9 and S10.
Hydrogen is stored at 350 bar as compressed hydrogen.
10.4.1. Solar Water Hydrogen Power (SWH2P) with single step hydrogen production
The SWH2P cycle of Fig. S9 consists of two main process zones: [I] power production, [II]
hydrogen production and storage. Process units are represented by lower case v and streams are
represented by capital V. Process units of zone I include; (i) Solar concentrators (sc1 & sc2), (ii)
Solar receiver/heat exchanger (v4), (iii) High pressure and medium pressure turbines (v5 & v6),
(iv) Heat exchanger (v3), (v) Condensing turbine (v7), condenser (v8), and water pumps (v1 &
v2), (vi) Generator (G). Process units of zone II include; (i) Solar concentrators (sc1, sc2, sc3 &
sc4), (ii) Solar receiver/heat exchanger (v4, v9), (vii) Water-splitting reactor (v9), (viii) hydrogen
and oxygen compressors (v11, v12, & v14), (ix) heat exchangers (v3, v10 & v13), (x) Oxygen
liquefaction (v15), (xi) hydrogen and oxygen storage facilities.
The process mass and energy flows for solar heat collection temperature of 2000 K are presented
in Table S3. Subsequently, the stored hydrogen and oxygen are used for power generation via
the H2WP cycle during times of solar energy unavailability. The maximum OSTE efficiency of
the combined SWH2P – H2WP cycle of 31.6% is achieved for solar heat collection temperature
of 2000 K, as shown in Table S4.
Gençer et al. www.pnas.org/cgi/doi/10.1073/pnas.1513488112 S19
Fig. S9. Solar Water Hydrogen Power Cycle with single step hydrogen production via membrane reactor and storage of coproduced hydrogen and oxygen. HPT: High Pressure Turbine, MPT: Medium Pressure Turbine, CT: Condensing Turbine, G: Generator, K1: Hydrogen Compression, K2 Oxygen Compression, K: Hydrogen Compression, LIQ: Oxygen Liquefaction.
Table S3. Details of an example SWH2P cycle (Fig. S9) at solar heat collection temperature of 2000K, operating pressure of 200 bar and condensing turbine outlet condensation of 1% for 100 MW of continuous power supply with OSTE efficiency of 31.6%.
V1 V2 V3 V4 V5 V6 V7 V8 T (K) 301 302.8 581.9 2000 2000 2000 1426.7 2000
P (bar) 1.013 200 200 200 200 200 15.5 15.5 m (kg/s) 206.6 206.6 206.6 206.6 163.1 163.1 163.1 163.1
V9 V10 V11 V12 V13 V14 V15 V16
T (K) 1435.5 523.15 302 301 301 2000 300 300 P (bar) 1.2 1.2 0.04 0.04 1.013 low low 1.013 m (kg/s) 163.1 163.1 163.1 163.1 163.1 4.84 4.84 4.84
V17 V18 V19 V20 V21 T 300 2000 300 91 -
Gençer et al. www.pnas.org/cgi/doi/10.1073/pnas.1513488112 S20
P 350 low 1.1 1.1 - m (kg/s) 4.84 38.7 38.7 38.7 0 v1/v2 v3 v4 v5 v6 v7 v11 v12
Heat (MW) - 700 458.7 - - - - - Power (MW) 1.78 - - 0 0 0 36 67.1
v14 v15
Heat (MW) - - Power (MW) 20 49.5
+: heat/power supplied to the system; -: heat/power produced by the system; \: heat exchanged in the system
Table S4. Summary of simulation results for 100 MW constant power supply during 24 hour period using SWH2P cycle with single step hydrogen production and H2WP cycle operated at 200 bar pressure and various temperatures.
SWH2P cycle operating
conditions (Fig. S9)
H2WP cycle operating conditions (Fig. S11)
Results
Solar heat collection
temperature [K]
Solar Reactor (v9) Temperature
[K]
Highest temperature
[K]
Hydrogen-to-
electricity efficiency
[%]
Overall Heat-to-
Electricity Efficiency
[%]
Overall Sun-to-
Electricity Efficiency
[%] 1600 1600 1600 64.7 38.1 29.0 1800 1800 1800 67.5 40.8 30.2 2000 2000 2000 69.8 44.6 31.6
10.4.2. Solar Water Hydrogen Power (SWH2P) with two step hydrogen production
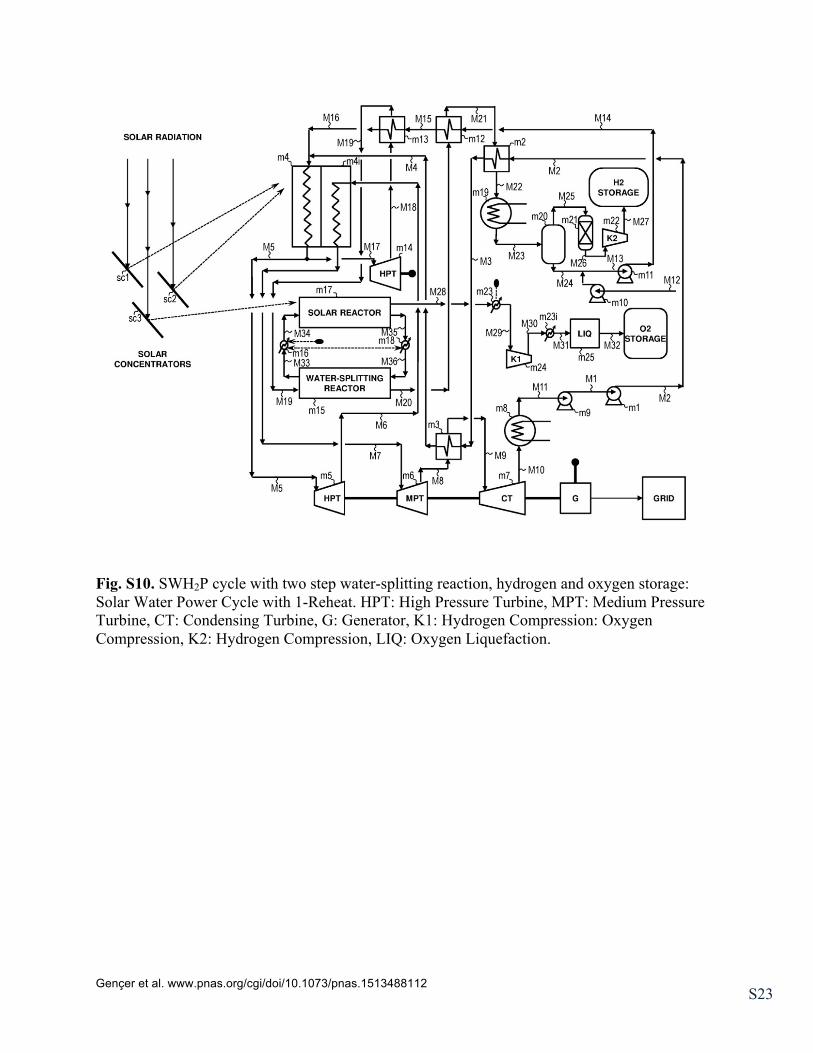
Solar Water Hydrogen Power (SWH2P) Cycle shown in Fig. S10 is an integrated solar thermal
power and hydrogen co-production process with high pressure two-step hydrogen production,
reheating and high pressure hydrogen production. SWH2P cycle consists of two main process
zones: [I] power production, [II] hydrogen production. Process units of zone I include; (i) Solar
concentrators (sc1 & sc2), (ii) Solar receiver/heat exchanger (m4 & m4i), (iii) High pressure and
medium pressure turbines (m5 & m6), (iv) Heat exchangers (m2 & m3), (v) Condensing turbine
(m7), condenser (m8) and water pump (m9 & m1), (vi) Generator (G). Process units of zone II
Gençer et al. www.pnas.org/cgi/doi/10.1073/pnas.1513488112 S21
include; (i) Solar concentrators (sc1, sc2 & sc3), (ii) Solar receiver/heat exchanger (m4 & m17),
(iii) Water-splitting reactor (m15), (iv) Hydrogen and Oxygen Compressor (m22 & m24) and
oxygen liquefaction unit (m25), (v) Partial condenser (m19), (vi) Heat exchangers (m12, m13,
m2, m16, m18, m23 & m23i), (vii) Turbine (m14), (viii) Partial condenser (m20), (ix) dryer
(m21), and water pump (m10 & m11).
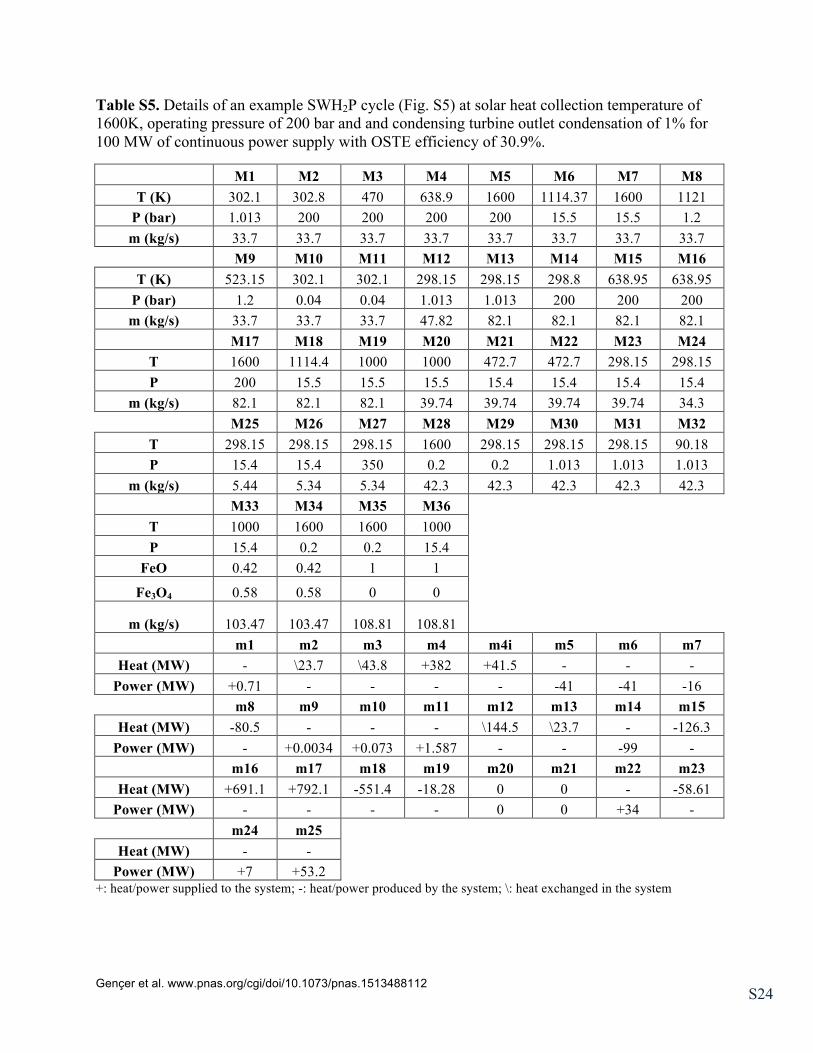
The process mass and energy flows for solar heat collection temperature of 1600 K are presented
in Table S5. Similar to the process of Fig. S9, the maximum OSTE efficiency of 34.4% is
achieved for solar heat collection temperature of 1800 K and water-splitting reactor (unit m15 in
Fig. S10) temperature of 800K, as shown in Table S6. The overall heat-to-electricity efficiency
listed in Table S6 are calculated based on the total heat requirement of the integrated process to
supply electricity round the clock, i.e. SWH2P cycle during periods of solar energy availability
and H2WP cycle during periods of solar energy unavailability, the total heat requirement refers to
the solar heat supplied to the process to coproduce electric power, hydrogen and oxygen. The
exergy efficiency of SWH2P cycle for solar heat collection temperature 1600K and sum of
standalone solar thermal hydrogen production with two-step metal oxide cycle at 1600K
reduction and 1000K oxidation temperature and SWP-1 cycle operated at 1600K solar heat
collection temperature are calculated and the details are given in Table S7. Exergy values are
calculated using AVAILMX property set in ASPEN Plus v8.0. The net output of both systems
are the same (9196.6 kmol/hr of hydrogen storage, 4598.3kmol/hr of O2 storage and 100MW net
electricity output). To obtain the exact same output, sum of standalone processes requires
995.5MW of exergy input while the integrated SWH2P cycle requires 922.4 MW of exergy
output. Hence, for the same total output of electricity, H2 and O2, SWH2P cycle uses 8% less
exergy. For further illustration, for standalone process case, we have also done calculations using
Gençer et al. www.pnas.org/cgi/doi/10.1073/pnas.1513488112 S22
known direct solar thermal power cycle (DSTP) shown in Figure S1 (details in Table S7). DSTP
cycle is also operated at solar heat collection temperature of 1600K. In this case, the required
exergy input is 1024.1 MW and the exergy efficieny is 73.0%. Thus, our proposed integrated
concept requires 11% less exergy for the same output.
Note that in the continuous integrated power cycle scheme, net water utilization can be nearly
zero, since the water used for the hydrogen production during solar energy availability is
recovered after the hydrogen oxy-combustion. The produced water can be stored and the solar
power cycle can be operated in a closed loop water circulation with little water make up. If water
cooling towers are replaced with air coolers, the overall water consumption will be nearly zero.
This is a powerful flexibility of the developed process considering the fact that potential
locations for construction of solar thermal power plants are often arid areas. However, air based
cooling would lead to operation with a higher pressure at the condenser in Fig. 1A and will
therefore impact the power cycle efficiency.
Gençer et al. www.pnas.org/cgi/doi/10.1073/pnas.1513488112 S23
Fig. S10. SWH2P cycle with two step water-splitting reaction, hydrogen and oxygen storage: Solar Water Power Cycle with 1-Reheat. HPT: High Pressure Turbine, MPT: Medium Pressure Turbine, CT: Condensing Turbine, G: Generator, K1: Hydrogen Compression: Oxygen Compression, K2: Hydrogen Compression, LIQ: Oxygen Liquefaction.
Gençer et al. www.pnas.org/cgi/doi/10.1073/pnas.1513488112 S24
Table S5. Details of an example SWH2P cycle (Fig. S5) at solar heat collection temperature of 1600K, operating pressure of 200 bar and and condensing turbine outlet condensation of 1% for 100 MW of continuous power supply with OSTE efficiency of 30.9%.
M1 M2 M3 M4 M5 M6 M7 M8 T (K) 302.1 302.8 470 638.9 1600 1114.37 1600 1121
P (bar) 1.013 200 200 200 200 15.5 15.5 1.2 m (kg/s) 33.7 33.7 33.7 33.7 33.7 33.7 33.7 33.7
M9 M10 M11 M12 M13 M14 M15 M16
T (K) 523.15 302.1 302.1 298.15 298.15 298.8 638.95 638.95 P (bar) 1.2 0.04 0.04 1.013 1.013 200 200 200 m (kg/s) 33.7 33.7 33.7 47.82 82.1 82.1 82.1 82.1
M17 M18 M19 M20 M21 M22 M23 M24 T 1600 1114.4 1000 1000 472.7 472.7 298.15 298.15 P 200 15.5 15.5 15.5 15.4 15.4 15.4 15.4
m (kg/s) 82.1 82.1 82.1 39.74 39.74 39.74 39.74 34.3
M25 M26 M27 M28 M29 M30 M31 M32
T 298.15 298.15 298.15 1600 298.15 298.15 298.15 90.18 P 15.4 15.4 350 0.2 0.2 1.013 1.013 1.013
m (kg/s) 5.44 5.34 5.34 42.3 42.3 42.3 42.3 42.3 M33 M34 M35 M36
T 1000 1600 1600 1000 P 15.4 0.2 0.2 15.4 FeO 0.42 0.42 1 1 Fe3O4 0.58 0.58 0 0
m (kg/s) 103.47 103.47 108.81 108.81 m1 m2 m3 m4 m4i m5 m6 m7
Heat (MW) - \23.7 \43.8 +382 +41.5 - - - Power (MW) +0.71 - - - - -41 -41 -16
m8 m9 m10 m11 m12 m13 m14 m15
Heat (MW) -80.5 - - - \144.5 \23.7 - -126.3 Power (MW) - +0.0034 +0.073 +1.587 - - -99 -
m16 m17 m18 m19 m20 m21 m22 m23 Heat (MW) +691.1 +792.1 -551.4 -18.28 0 0 - -58.61
Power (MW) - - - - 0 0 +34 -
m24 m25
Heat (MW) - - Power (MW) +7 +53.2 +: heat/power supplied to the system; -: heat/power produced by the system; \: heat exchanged in the system

Gençer et al. www.pnas.org/cgi/doi/10.1073/pnas.1513488112 S25
Table S6. Summary of simulation results for 100 MW constant power supply during 24 hour period using SWH2P cycle with two step hydrogen production and H2WP cycle operated at 200 bar pressure and various temperatures.
SWH2P cycle operating conditions (Fig. S10)
H2WP cycle operating conditions (Fig. S11) Results
Solar heat collection
temperature [K]
Water-splitting Reactor (m15)
Temperature [K]
Solar Reactor (m17)
Temperature [K]
Highest temperature
[K]
Hydrogen-to-
electricity efficiency
[%]
Overall Heat-to-
Electricity Efficiency
[%]
Overall Sun-to-
Electricity Efficiency
[%]
1600
600
1600 1600 64.7
39.5 30.1 800 42.9 32.7 1000 44.0 33.6 1200 44.9 34.3
1800
600
1800 1800 67.5
44.1 32.7 800 46.4 34.4 1000 44.0 32.6 1200 41.6 30.8
Table S7 Details of exergy calculation of SWH2P cycle and standalone solar thermal H2 and SWP-1 cycle with the same total output
Integrated coproduction
process
Solar Thermal
H2 + SWP-1 cycle
Solar Thermal H2 + DSTP cycle
Unit
Net H2 Stored at 350 bar and 298.1 K kmol/hr 9196.6 9196.6 9196.6 Net O2 Stored at 1.1 bar and 91.1 K kmol/hr 4598.3 4598.3 4598.3 Net Electricity Output MW 100.0 100.0 100.0 Total Electricity Produced MW 191.6 257.1 257.1 Heat Requirement for H2 Production MW - 764.0 764.0 Heat Requirement for Electricity Production MW - 459.5 494.6 Total Heat Requirement MW 1133.6 1223.5 1258.6 Solar heat collection temperature K 1600.0 1600.0 1600.0 Total Exergy In MW 922.4 995.5 1024.1 Total Exergy Out MW 748.0 748.0 748.0 Exergy Efficiency 81.1% 75.1% 73.0%
Gençer et al. www.pnas.org/cgi/doi/10.1073/pnas.1513488112 S26
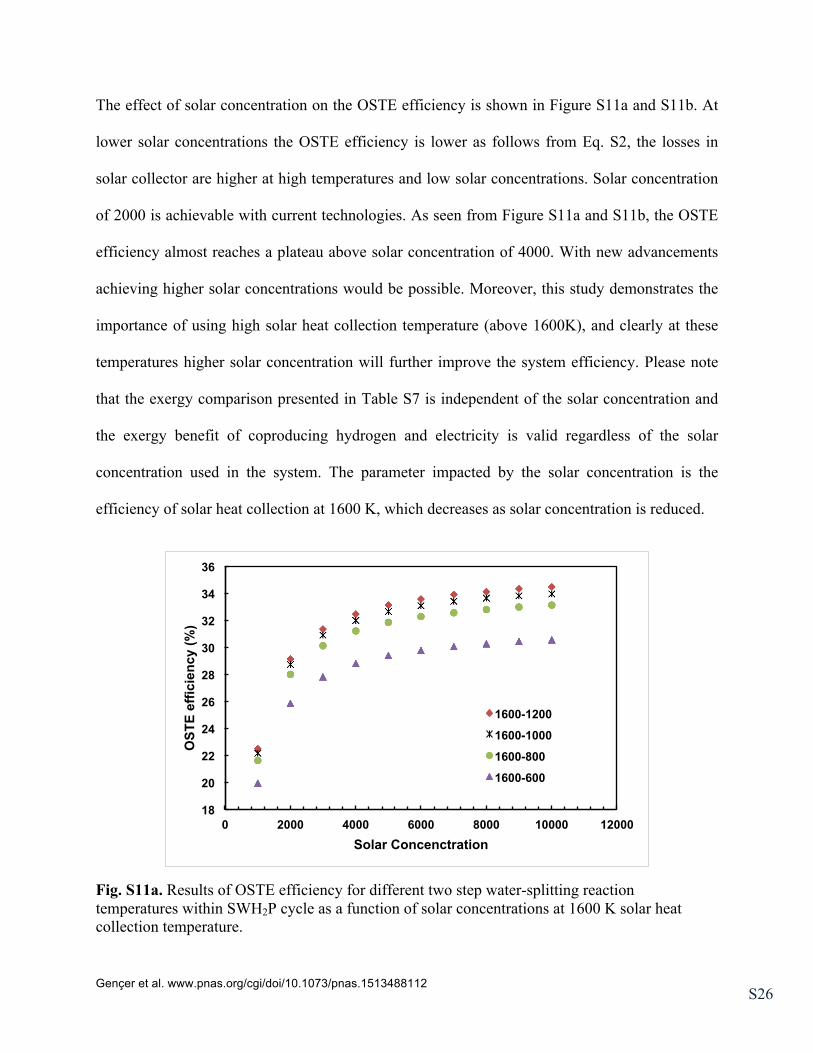
The effect of solar concentration on the OSTE efficiency is shown in Figure S11a and S11b. At
lower solar concentrations the OSTE efficiency is lower as follows from Eq. S2, the losses in
solar collector are higher at high temperatures and low solar concentrations. Solar concentration
of 2000 is achievable with current technologies. As seen from Figure S11a and S11b, the OSTE
efficiency almost reaches a plateau above solar concentration of 4000. With new advancements
achieving higher solar concentrations would be possible. Moreover, this study demonstrates the
importance of using high solar heat collection temperature (above 1600K), and clearly at these
temperatures higher solar concentration will further improve the system efficiency. Please note
that the exergy comparison presented in Table S7 is independent of the solar concentration and
the exergy benefit of coproducing hydrogen and electricity is valid regardless of the solar
concentration used in the system. The parameter impacted by the solar concentration is the
efficiency of solar heat collection at 1600 K, which decreases as solar concentration is reduced.
Fig. S11a. Results of OSTE efficiency for different two step water-splitting reaction temperatures within SWH2P cycle as a function of solar concentrations at 1600 K solar heat collection temperature.
18
20
22
24
26
28
30
32
34
36
0 2000 4000 6000 8000 10000 12000
OST
E ef
ficie
ncy
(%)
Solar Concenctration
1600-1200
1600-1000
1600-800
1600-600
Gençer et al. www.pnas.org/cgi/doi/10.1073/pnas.1513488112 S27
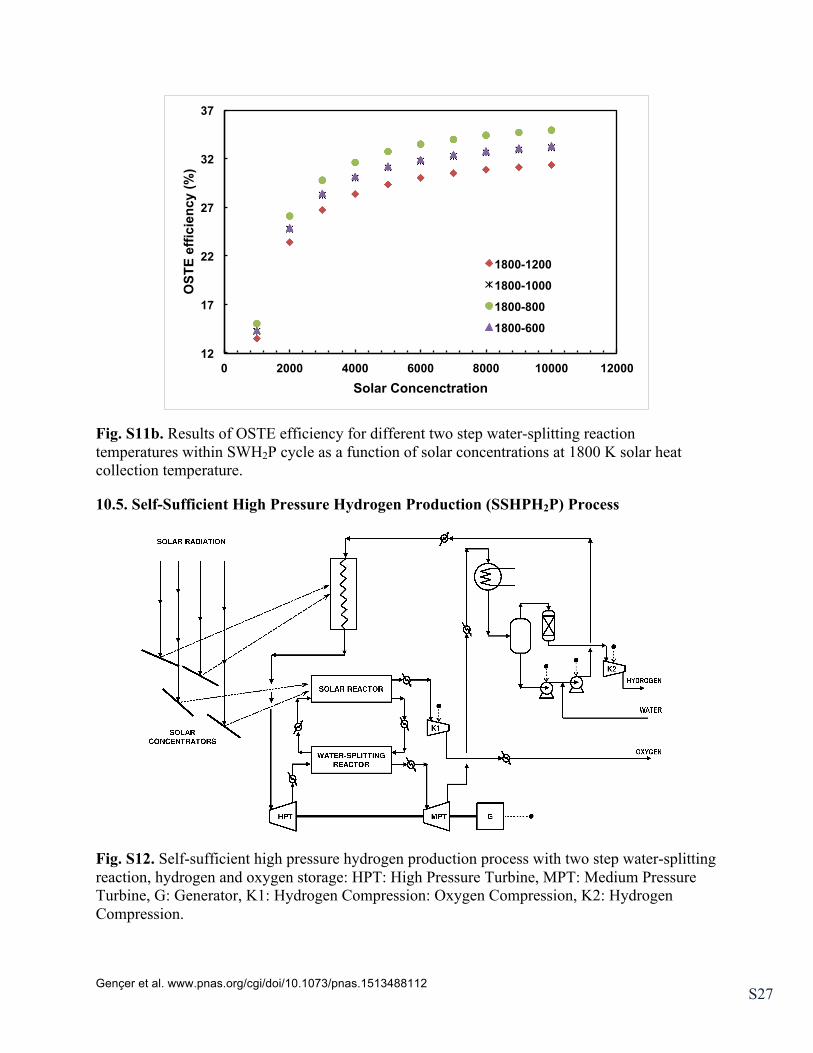
Fig. S11b. Results of OSTE efficiency for different two step water-splitting reaction temperatures within SWH2P cycle as a function of solar concentrations at 1800 K solar heat collection temperature.
10.5. Self-Sufficient High Pressure Hydrogen Production (SSHPH2P) Process
Fig. S12. Self-sufficient high pressure hydrogen production process with two step water-splitting reaction, hydrogen and oxygen storage: HPT: High Pressure Turbine, MPT: Medium Pressure Turbine, G: Generator, K1: Hydrogen Compression: Oxygen Compression, K2: Hydrogen Compression.
12
17
22
27
32
37
0 2000 4000 6000 8000 10000 12000
OST
E ef
ficie
ncy
(%)
Solar Concenctration
1800-1200
1800-1000
1800-800
1800-600
Gençer et al. www.pnas.org/cgi/doi/10.1073/pnas.1513488112 S28
SSHPH2P process shown in Figure S12, is a modified SWH2P cycle to produce high pressure
hydrogen from solar thermal energy shown. The process is designed as a self-sufficient hydrogen
production process, i.e. the net electricity output of the process is zero, via two step water-
splitting reaction. The significant compression power required is supplied from the electricity co-
produced using the process. SSHPH2P process consists of nine main process units: (i) Solar
receiver/heat exchanger, (ii) Water-splitting reactor, (iii) High pressure turbine (HPT) and
medium pressure turbine (MPT), (iv) Oxygen and hydrogen compressors (K1 and K2,
respectively), (v) Heat exchangers, (vi) Partial condenser, (vii) separator, (viii) dryer, and (ix)
water pumps. The solar receiver/heat exchanger and the solar reactor can be operated at different
temperatures. We performed simulations to produce 2967 MWh of hydrogen based on lower
heating value at 350 bar and 298.15 K, and oxygen is vented our at 1.1 bar and 298.15K. To
achieve the zero net electricity output, the discharge pressure of the pump is modified depending
on the operating temperatures. Details of one case is presented in Table S8. For the comparison
with conventional operation mode of solar thermal water splitting reactors, only the hydrogen
production portion of the process has been simulated using exactly the same operating conditions
with the SSHPH2P process. However, for standalone operation of solar thermal hydrogen
production, the water is pumped to the pressure level of reactor and not being expanded before or
after the hydrogen production reactor. Hence, the process is using electricity from an external
source. For this study, we are interested in solar processes, thus we have listed various potential
solar thermal power cycles to supply the electricity requirement of the process.
Performance of SSHPH2P process is evaluated by sun-to-hydrogen (STH2) efficiency, which
refers to the fraction of incident solar energy recovered as the hydrogen. While calculating the
STH2 efficiency, the total solar energy input required to produce high pressure hydrogen output
Gençer et al. www.pnas.org/cgi/doi/10.1073/pnas.1513488112 S29
is taken into account. In Eq. S10, LHVH2 is the lower heating value of the hydrogen output, Qin,i
is the heat used in Process i. Here, Process i refers either to solar thermal water splitting process
or to solar thermal power production process if hydrogen is produced from two separate
standalone processes. In case of SSHPH2P process, n equals 1, since the only solar heat input is
to the process itself. Qsolar, i is the total solar energy supplied to the solar collector for process i,
Ωopt is the optical efficiency that accounts for optical losses associated with solar concentration
system and is defined as the fraction of total incident solar radiation received by the blackbody
absorber (or solar receiver), σ is the Stefan-Boltzmann constant, Ti is the solar heat collection
temperature for process i, I is the solar intensity and C is the solar concentration ratio. Note that
Eq. S10 doesn’t account for the intermittency and variability associated with solar energy. As a
reference, the equation for the maximum achievable STE efficiency for a specified concentration
ratio and optical efficiency is given by Eq. S3 where Ta is the ambient temperature (1).
STH2 efficiency ,2, 4
,
100, where 1
in iHsolar in
isolar i opt
i i
QLHV QTQI Cσ
= × =⎛ ⎞
Ω −⎜ ⎟⋅⎝ ⎠∑
(S10)
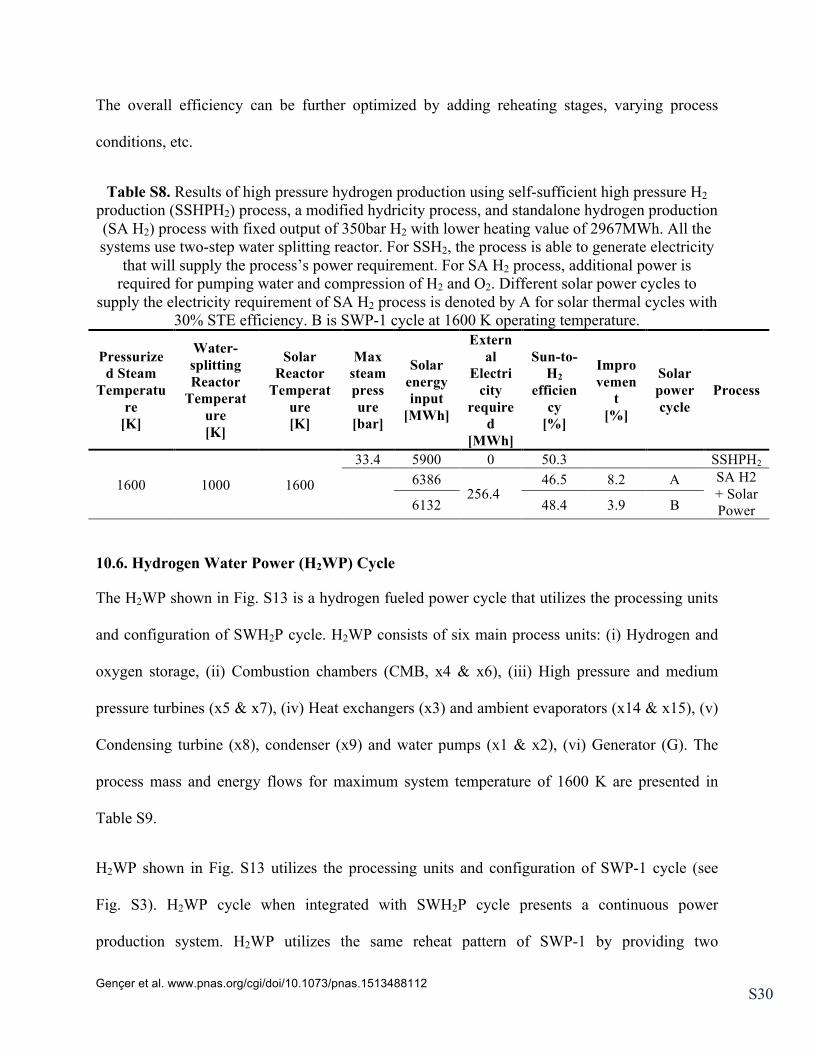
From Table S8, STH2 efficiency of SSHPH2P process is 50.3%. Depending on the operating
conditions STH2 can vary and the operating conditions should be optimized to identify the
maximum efficiency. STH2 efficiency achieved with sum of standalone hydrogen production
process and solar thermal power cycle is 46.5% for a current solar thermal power cycle with 30%
STE efficiency and 48.4% if the new SWP-1 cycle operating at 1600K (same highest
temperature as for SSHPH2P process) is used. Hence, depending on the case, the solar energy
savings are ~8.2% for current solar thermal power cycle (DSTP) and, ~3.9% for SWP-1 cycle.
Gençer et al. www.pnas.org/cgi/doi/10.1073/pnas.1513488112 S30
The overall efficiency can be further optimized by adding reheating stages, varying process
conditions, etc.
Table S8. Results of high pressure hydrogen production using self-sufficient high pressure H2 production (SSHPH2) process, a modified hydricity process, and standalone hydrogen production (SA H2) process with fixed output of 350bar H2 with lower heating value of 2967MWh. All the systems use two-step water splitting reactor. For SSH2, the process is able to generate electricity
that will supply the process’s power requirement. For SA H2 process, additional power is required for pumping water and compression of H2 and O2. Different solar power cycles to
supply the electricity requirement of SA H2 process is denoted by A for solar thermal cycles with 30% STE efficiency. B is SWP-1 cycle at 1600 K operating temperature.
Pressurized Steam
Temperature
[K]
Water-splitting Reactor
Temperature [K]
Solar Reactor
Temperature [K]
Max steam pressure
[bar]
Solar energy input
[MWh]
External
Electricity
required
[MWh]
Sun-to-H2
efficiency
[%]
Improvemen
t [%]
Solar power cycle
Process
1600 1000 1600
33.4 5900 0 50.3 SSHPH2
6386
256.4 46.5 8.2 A SA H2
+ Solar Power 6132 48.4 3.9 B
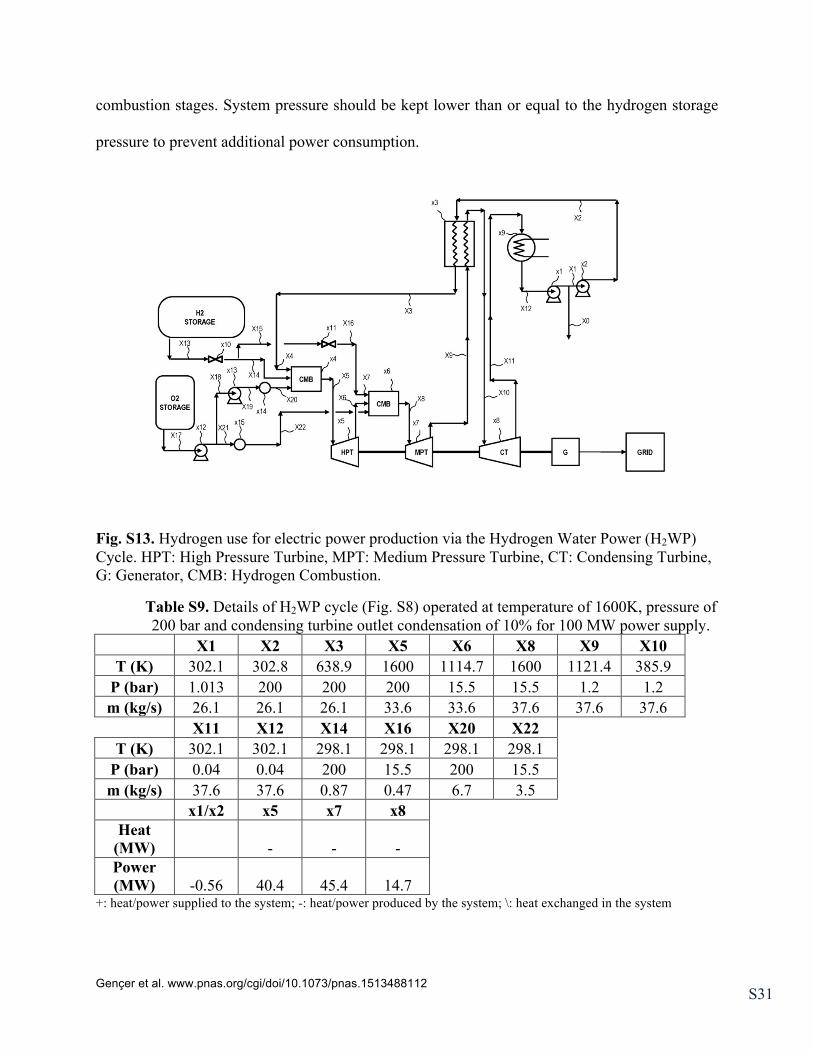
10.6. Hydrogen Water Power (H2WP) Cycle
The H2WP shown in Fig. S13 is a hydrogen fueled power cycle that utilizes the processing units
and configuration of SWH2P cycle. H2WP consists of six main process units: (i) Hydrogen and
oxygen storage, (ii) Combustion chambers (CMB, x4 & x6), (iii) High pressure and medium
pressure turbines (x5 & x7), (iv) Heat exchangers (x3) and ambient evaporators (x14 & x15), (v)
Condensing turbine (x8), condenser (x9) and water pumps (x1 & x2), (vi) Generator (G). The
process mass and energy flows for maximum system temperature of 1600 K are presented in
Table S9.
H2WP shown in Fig. S13 utilizes the processing units and configuration of SWP-1 cycle (see
Fig. S3). H2WP cycle when integrated with SWH2P cycle presents a continuous power
production system. H2WP utilizes the same reheat pattern of SWP-1 by providing two
Gençer et al. www.pnas.org/cgi/doi/10.1073/pnas.1513488112 S31
combustion stages. System pressure should be kept lower than or equal to the hydrogen storage
pressure to prevent additional power consumption.
Fig. S13. Hydrogen use for electric power production via the Hydrogen Water Power (H2WP) Cycle. HPT: High Pressure Turbine, MPT: Medium Pressure Turbine, CT: Condensing Turbine, G: Generator, CMB: Hydrogen Combustion.
Table S9. Details of H2WP cycle (Fig. S8) operated at temperature of 1600K, pressure of 200 bar and condensing turbine outlet condensation of 10% for 100 MW power supply.
X1 X2 X3 X5 X6 X8 X9 X10 T (K) 302.1 302.8 638.9 1600 1114.7 1600 1121.4 385.9
P (bar) 1.013 200 200 200 15.5 15.5 1.2 1.2 m (kg/s) 26.1 26.1 26.1 33.6 33.6 37.6 37.6 37.6
X11 X12 X14 X16 X20 X22
T (K) 302.1 302.1 298.1 298.1 298.1 298.1 P (bar) 0.04 0.04 200 15.5 200 15.5 m (kg/s) 37.6 37.6 0.87 0.47 6.7 3.5
x1/x2 x5 x7 x8 Heat
(MW)
- - - Power (MW) -0.56 40.4 45.4 14.7
+: heat/power supplied to the system; -: heat/power produced by the system; \: heat exchanged in the system
Gençer et al. www.pnas.org/cgi/doi/10.1073/pnas.1513488112 S32
References for SI Appendix
1. Ihara S (1980) On the study of hydrogen production from water using solar thermal energy. International Journal of Hydrogen Energy 5(5):527-534.
2. Roine A (2002) HSC Chemistry® for Windows, Chemical reaction and equilibrium software with extensive thermochemical database. Version 5.1, Outokumpu Research Oy, Pori, Finland, ISBN 952-9507-08-9.
3. Aspen Technology (2006) ASPEN Plus users guide. (Aspen Technology Inc., Burlington, Massachusetts).
4. Linnhoff B & Flower JR (1978) Synthesis of heat exchanger networks: I. Systematic generation of energy optimal networks. AIChE Journal 24(4):633-642.
5. Vissa R, Jainagesh S, & Burada V (2014) One atmosphere boiler instant superheated steam apparatus and method. in Patent Application WO2014039296 A1.
6. Sunden B & Xie G (2010) Gas Turbine Blade Tip Heat Transfer and Cooling: A Literature Survey. Heat Transfer Engineering 31(7):527-554.
7. Estabrook JE & Leger RH (Steam Turbines for Industrial Applications. (General Electric (GE) Power Systems, Marlborough, MA).
8. Heitmeir F & Jericha H (2005) Turbomachinery design for the Graz cycle: an optimized power plant concept for CO2 retention. Proceedings of the Institution of Mechanical Engineers Part a-Journal of Power and Energy 219(A2):147-155.
9. Kvamsdal HM, Jordal K, & Bolland O (2007) A quantitative comparison of gas turbine cycles with CO2 capture. Energy 32(1):10-24.
10. Sanz W, Hustad CW, & Jericha H (2012) First Generation Graz Cycle Power Plant for near-Term Deployment. Proceedings of the Asme Turbo Expo 2011, Vol 4:969-979.
11. Zhang N & Lior N (2008) Two novel oxy-fuel power cycles integrated with natural gas reforming and CO2 capture. Energy 33(2):340-351.
12. Mathieu P & Nihart R (1999) Zero-emission MATIANT cycle. J Eng Gas Turb Power 121(1):116-120.
13. Mallapragada DS & Agrawal R (2014) Limiting and Avhievable Efficiencies for Solar Thermal Hydrogen Production. International Journal of Hydrogen Energy 39(1):62-75.
14. Lovegrove K, Burgess G, & Pye J (2011) A new 500 m(2) paraboloidal dish solar concentrator. Solar Energy 85(4):620-626.
15. Xie W, Dai Y, Wang R, & Sumathy K (2011) Concentrated solar energy applications using Fresnel lenses: A review. Renewable & Sustainable Energy Reviews 15(6):2588-2606.
16. Behar O, Khellaf A, & Mohammedi K (2013) A review of studies on central receiver solar thermal power plants. Renewable & Sustainable Energy Reviews 23:12-39.
17. Ho C & Iverson B (2014) Review of high-temperature central receiver designs for concentrating solar power. Renewable & Sustainable Energy Reviews 29:835-846.
18. Behar O, Khellaf A, Mohammedi K, & Ait-Kaci S (2014) A review of integrated solar combined cycle system (ISCCS) with a parabolic trough technology. Renewable & Sustainable Energy Reviews 39:223-250.
19. Pozivil P, Ettlin N, Stucker F, & Steinfeld A (2015) Modular Design and Experimental Testing of a 50 kWth Pressurized-Air Solar Receiver for Gas Turbines. Journal of Solar Energy Engineering-Transactions of the Asme 137(3).
20. Dunn R, Hearps P, & Wright M (2012) Molten-Salt Power Towers: Newly Commercial Concentrating Solar Storage. Proceedings of the Ieee 100(2):504-515.
21. Spelling J, Favrat D, Martin A, & Augsburger G (2012) Thermoeconomic optimization of a combined-cycle solar tower power plant. Energy 41(1):113-120.
22. Augsburger G (2013) Thermo-economic optimisation of large scale solar tower power plants. PhD. (École Polytechnique Fédérale de Lausanne).
Gençer et al. www.pnas.org/cgi/doi/10.1073/pnas.1513488112 S33
23. Girardin L, Bolliger R, Marechal F, & Klemes J (2009) On the use of process integration techniques to generate optimal steam cycle configurations for the power plant industry. Pres'09: 12th International Conference on Process Integration, Modelling and Optimisation For Energy Saving and Pollution Reduction, Pts 1 and 2 18:171-176.
24. Marechal F, et al. (2005) Combined exergy and pinch analysis for optimal energy conversion technologies integration. Proceedings of ECOS 2005, Vols 1-3:177-184.
25. Yamaguchi H, Zhang XR, Fujima K, Enomoto M, & Sawada N (2006) Solar energy powered Rankine cycle using supercritical CO2. Applied Thermal Engineering 26(17–18):2345-2354.
26. Yang Y, et al. (2013) Comprehensive exergy-based evaluation and parametric study of a coal-fired ultra-supercritical power plant. Applied Energy 112(0):1087-1099.
27. Leyzerovich A (2005) Wet-Steam Turbines for Nuclear Power Plants (PennWell Corporation, US) p 456.
28. Muhich CL, et al. (2013) Efficient Generation of H2 by Splitting Water with an Isothermal Redox Cycle. Science 341(6145):540-542.
29. Nakamura T (1977) Hydrogen production from water utilizing solar heat at high temperatures. Solar Energy 19(5):467-475.
30. Seider WD, Seader JD, Lewin DR, & Widagdo S (2009) Product and Process Design Principles (John Wiley & Sons, Inc.).
31. Diver RB, Miller JE, Allendorf MD, Siegel NP, & Hogan RE (2008) Solar Thermochemical Water-Splitting Ferrite-Cycle Heat Engines. Journal of Solar Energy Engineering 130(4):041001.


![The macro forces that prevail [final edit] - Round the clock trader 21.1.16](https://img.pdfslide.us/doc/110x75/58ecba321a28abc34c8b46c9/the-macro-forces-that-prevail-final-edit-round-the-clock-trader-21116.jpg)