Embed Size (px)
Citation preview
SHRM Survey Findings: 2014 Economic Conditions—Recruiting and Skills Gaps
October 30, 2014
Economic Conditions—Recruiting Skills Gaps ©SHRM 2014 2
• This is Part 2 of a series of SHRM survey results about the state of jobs and skills in the current economic condition, which relates to a SHRM survey series about the ongoing impact of the U.S. and global recession from 2007 to 2012. Overall results will be reported separately in three different topic areas:
» Overall financial health and hiring.» Recruiting and skills gaps.» Global competition and hiring strategies.
• Overall results for 2013 will also be reported separately for California.
• Industry-specific results for the nine industries that were included in the sample will also be reported for each question throughout the report. The nine industries are:
» Accommodation and food services, retail/wholesale trade.» Construction, mining, quarrying, and oil and gas extraction.» Educational services.» Finance, insurance, real estate and rental and leasing.» Government agencies. » Health care and social assistance.» High-tech.» Manufacturing.» Professional, scientific, and technical services.
Introduction
Economic Conditions—Recruiting Skills Gaps ©SHRM 2014 3
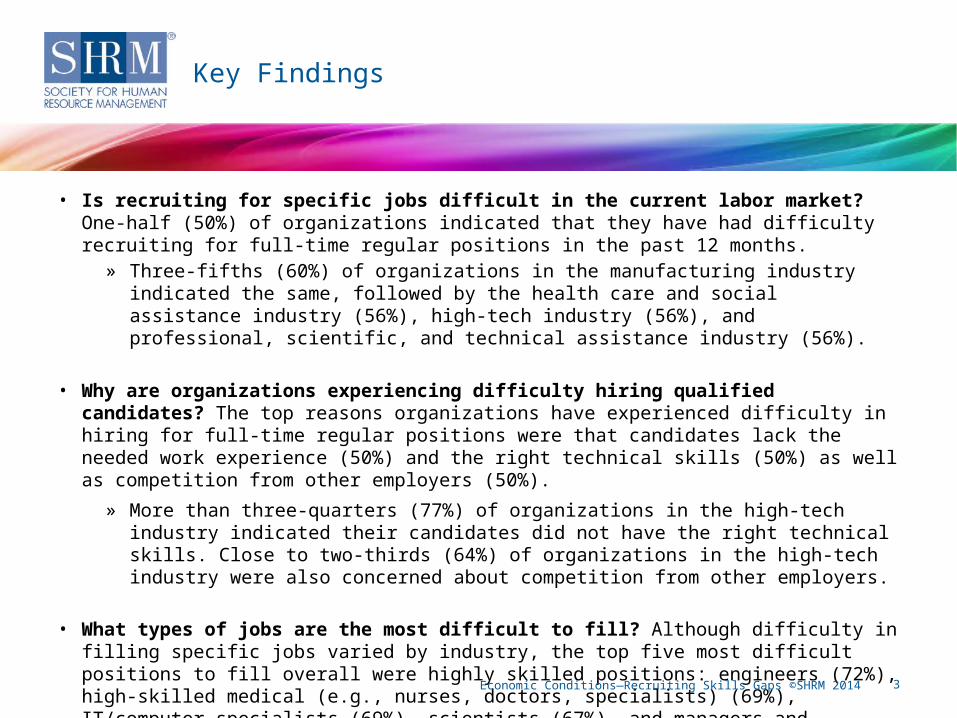
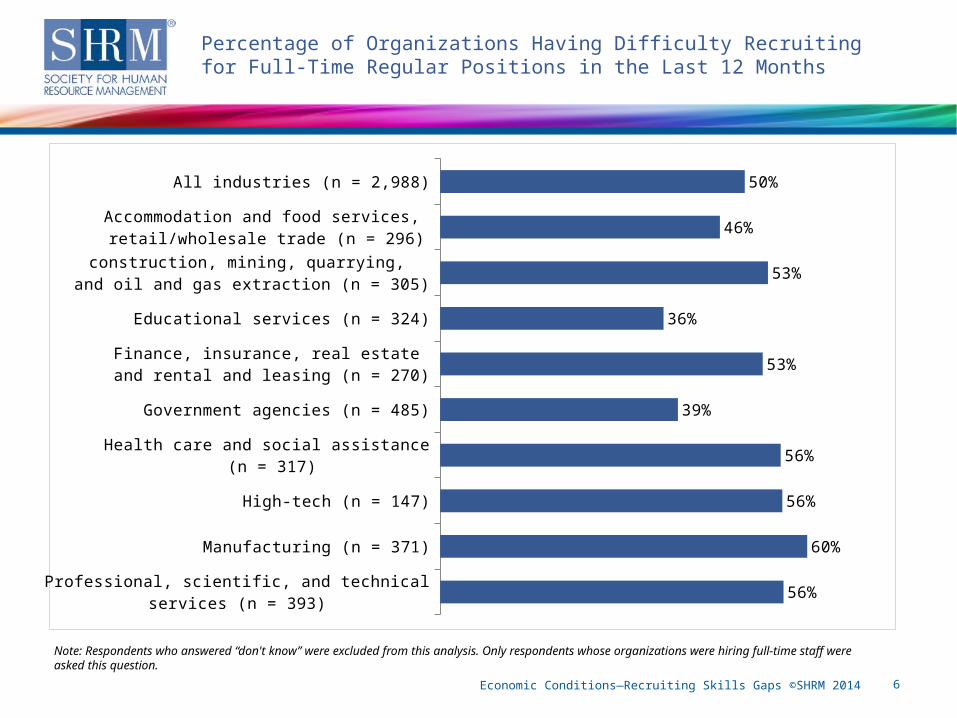
• Is recruiting for specific jobs difficult in the current labor market? One-half (50%) of organizations indicated that they have had difficulty recruiting for full-time regular positions in the past 12 months.
» Three-fifths (60%) of organizations in the manufacturing industry indicated the same, followed by the health care and social assistance industry (56%), high-tech industry (56%), and professional, scientific, and technical assistance industry (56%).
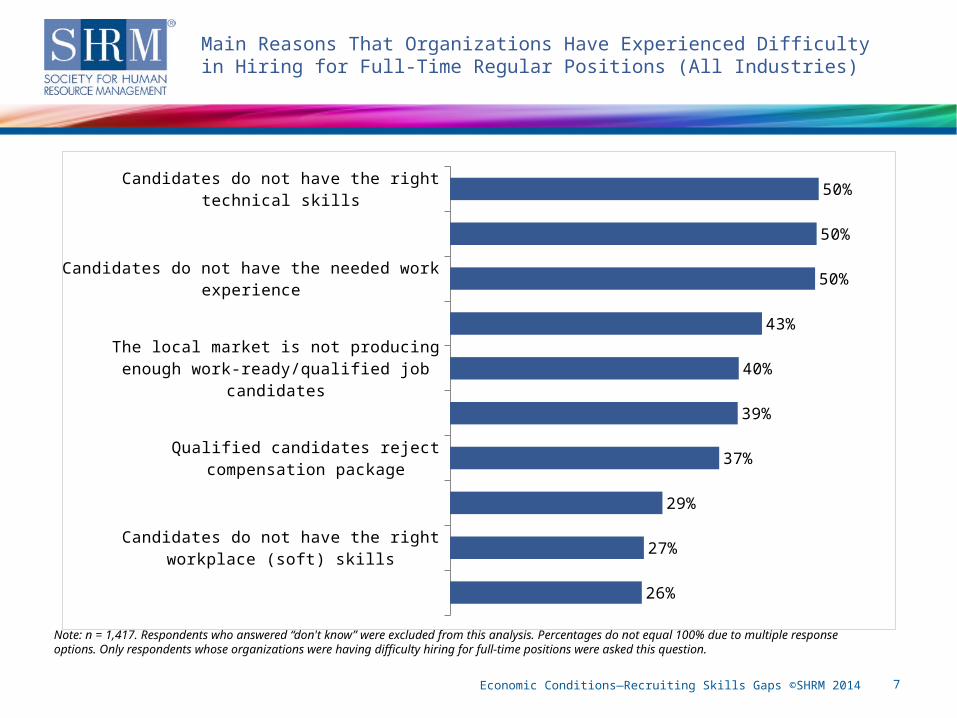
• Why are organizations experiencing difficulty hiring qualified candidates? The top reasons organizations have experienced difficulty in hiring for full-time regular positions were that candidates lack the needed work experience (50%) and the right technical skills (50%) as well as competition from other employers (50%).
» More than three-quarters (77%) of organizations in the high-tech industry indicated their candidates did not have the right technical skills. Close to two-thirds (64%) of organizations in the high-tech industry were also concerned about competition from other employers.
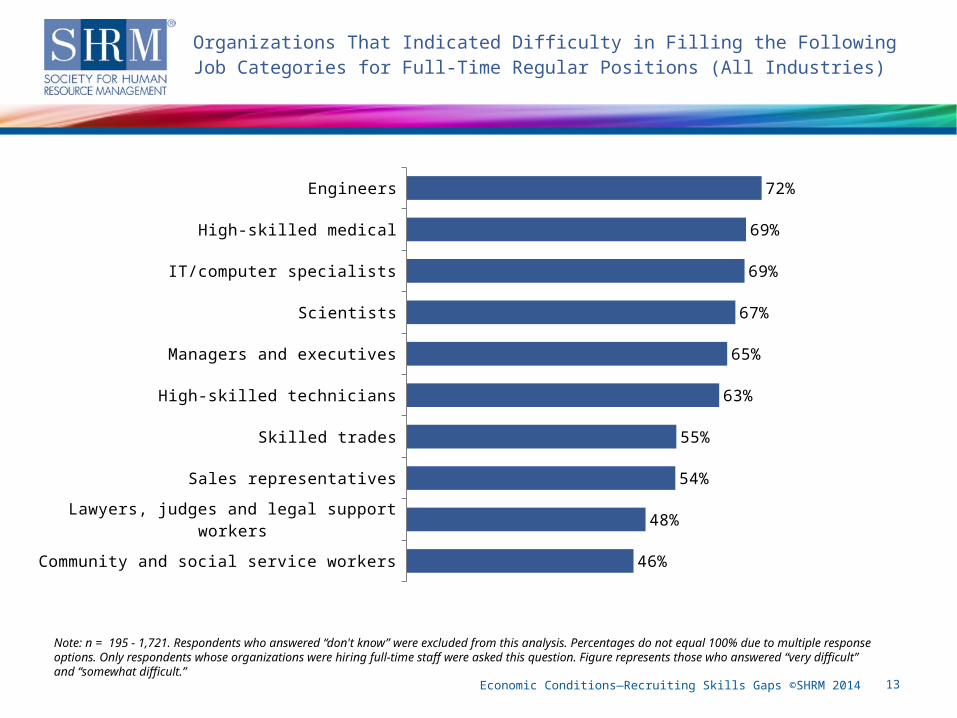
• What types of jobs are the most difficult to fill? Although difficulty in filling specific jobs varied by industry, the top five most difficult positions to fill overall were highly skilled positions: engineers (72%), high-skilled medical (e.g., nurses, doctors, specialists) (69%), IT/computer specialists (69%), scientists (67%), and managers and executives (65%)—similar to results in 2012 and 2011.
Key Findings
Economic Conditions—Recruiting Skills Gaps ©SHRM 2014 4
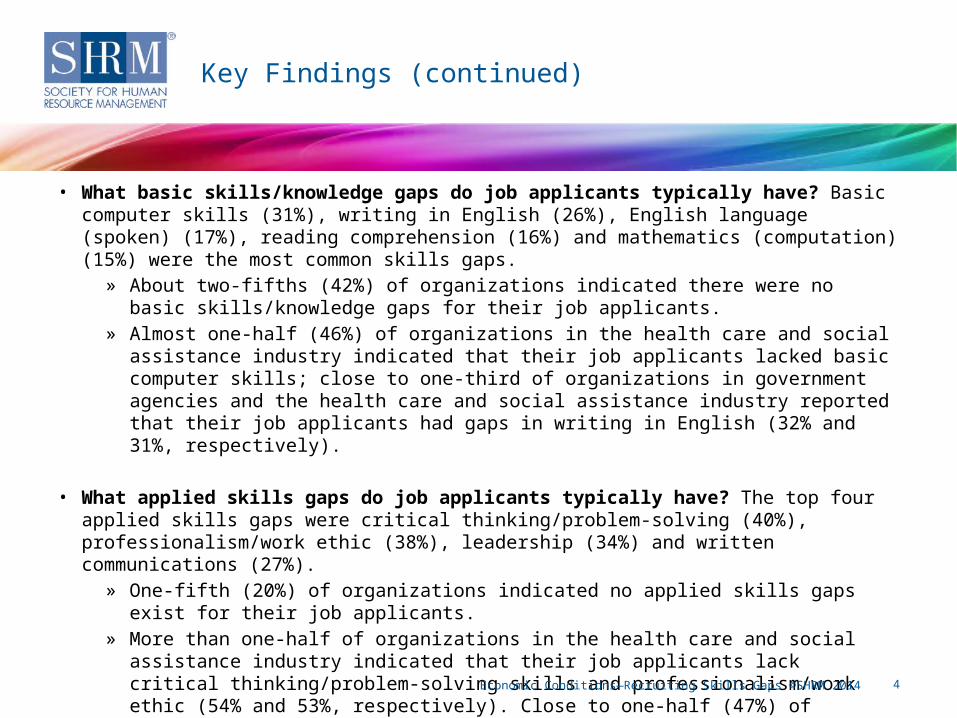
• What basic skills/knowledge gaps do job applicants typically have? Basic computer skills (31%), writing in English (26%), English language (spoken) (17%), reading comprehension (16%) and mathematics (computation) (15%) were the most common skills gaps.
» About two-fifths (42%) of organizations indicated there were no basic skills/knowledge gaps for their job applicants.
» Almost one-half (46%) of organizations in the health care and social assistance industry indicated that their job applicants lacked basic computer skills; close to one-third of organizations in government agencies and the health care and social assistance industry reported that their job applicants had gaps in writing in English (32% and 31%, respectively).
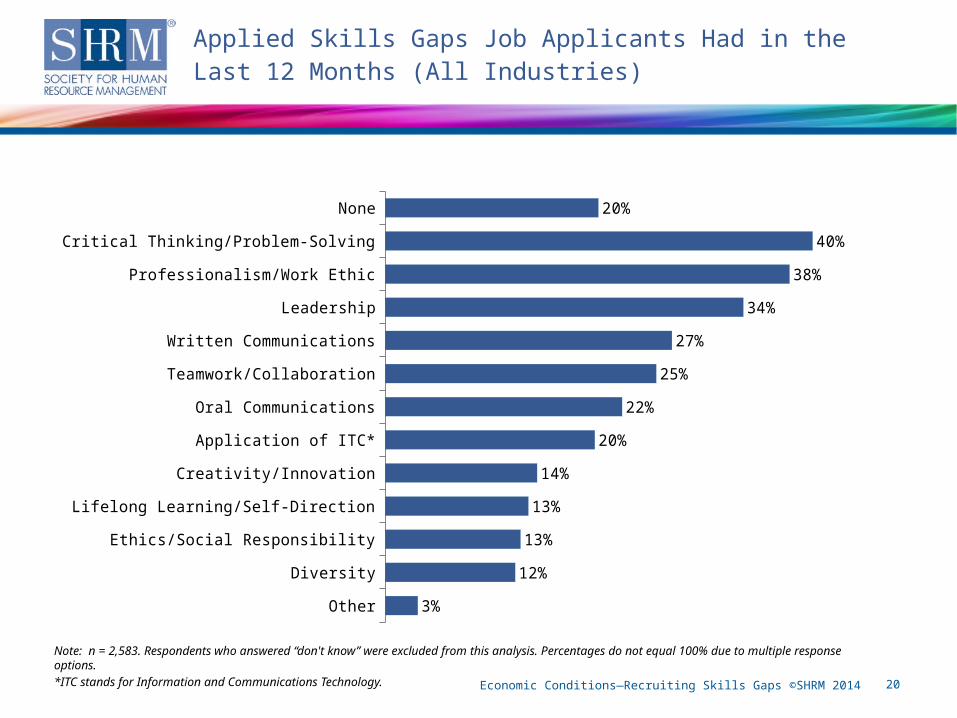
• What applied skills gaps do job applicants typically have? The top four applied skills gaps were critical thinking/problem-solving (40%), professionalism/work ethic (38%), leadership (34%) and written communications (27%).
» One-fifth (20%) of organizations indicated no applied skills gaps exist for their job applicants.
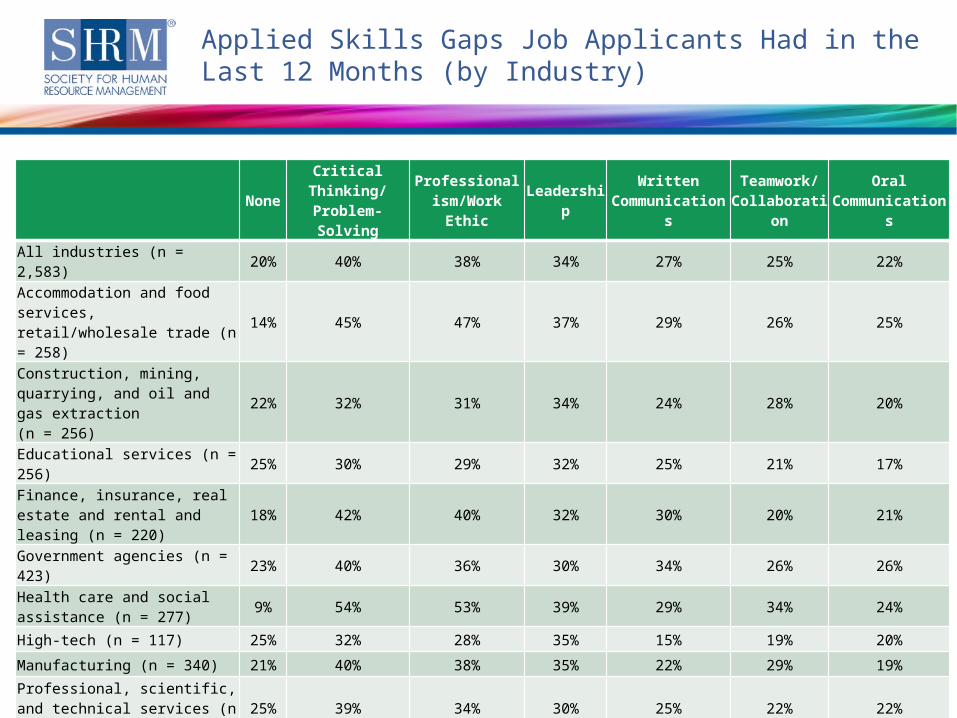
» More than one-half of organizations in the health care and social assistance industry indicated that their job applicants lack critical thinking/problem-solving skills and professionalism/work ethic (54% and 53%, respectively). Close to one-half (47%) of organizations in the accommodation and food services, retail/wholesale trade industry also indicated that their job applicants lack professionalism/work ethic.
Key Findings (continued)
Economic Conditions—Recruiting Skills Gaps ©SHRM 2014 5
• Despite recent gains in the U.S. labor market, millions of positions are still going unfilled and, consequently, impeding the growth of some employers. In July 2014, there were 4.7 million job openings in the United States, up nearly 800,000 from the beginning of 2014, according to federal data. Many economists and labor market observers cite weak economic demand as the cause of limited job creation in some sectors. But with millions of people seeking work and so many jobs going unfilled, it is clear that a skills mismatch exists between some job seekers and open positions, and this is also inhibiting widespread job growth in the U.S. economy.
• Knowing that a skills mismatch may prevent jobs from being filled, a multipronged approach is needed to close this gap. HR professionals should explore training opportunities for their employees and potential partnerships with local educational institutions, which can involve creating curricula in line with the skills needed at their organizations. Government job training programs are also active in many communities, and HR professionals should be aware of these as a means of supporting their recruiting efforts.
• Even though many organizations are pursuing partnerships with educational bodies to develop training programs, on-the-job training led mainly by the employers themselves is still a vital part of employee and organizational development.
• HR professionals and their employers should not blame recruiting difficulty solely on this skills mismatch. There are other reasons why jobs are going unfilled; half of respondents in this survey cited competition from other employers, and more than one-third said their candidates turned down the compensation offer. That suggests that hiring is becoming more competitive in some sectors, and HR professionals should consider creative compensation packages that include market-rate salaries and perhaps some form of flexible benefits, which are considered attractive by many workers.
What Do These Findings Mean for the HR Profession?
Economic Conditions—Recruiting Skills Gaps ©SHRM 2014 6
Percentage of Organizations Having Difficulty Recruiting for Full-Time Regular Positions in the Last 12 Months
Note: Respondents who answered “don't know” were excluded from this analysis. Only respondents whose organizations were hiring full-time staff were asked this question.
All industries (n = 2,988)
Accommodation and food services, retail/wholesale trade (n = 296)
construction, mining, quarrying, and oil and gas extraction (n = 305)
Educational services (n = 324)
Finance, insurance, real estate and rental and leasing (n = 270)
Government agencies (n = 485)
Health care and social assistance (n = 317)
High-tech (n = 147)
Manufacturing (n = 371)
Professional, scientific, and technical services (n = 393)
50%
46%
53%
36%
53%
39%
56%
56%
60%
56%
Economic Conditions—Recruiting Skills Gaps ©SHRM 2014 7
Main Reasons That Organizations Have Experienced Difficulty in Hiring for Full-Time Regular Positions (All Industries)
Note: n = 1,417. Respondents who answered “don't know” were excluded from this analysis. Percentages do not equal 100% due to multiple response options. Only respondents whose organizations were having difficulty hiring for full-time positions were asked this question.
Candidates do not have the right technical skills
Competition from other employers
Candidates do not have the needed work experience
Low number of applicants
The local market is not producing enough work-ready/qualified job candidates
Candidates do not have the right professional skills
Qualified candidates reject compensation package
Candidates do not have the needed credentials/certifications
Candidates do not have the right workplace (soft) skills
Qualified candidates are not interested in moving to our local area
50%
50%
50%
43%
40%
39%
37%
29%
27%
26%
Economic Conditions—Recruiting Skills Gaps ©SHRM 2014 8
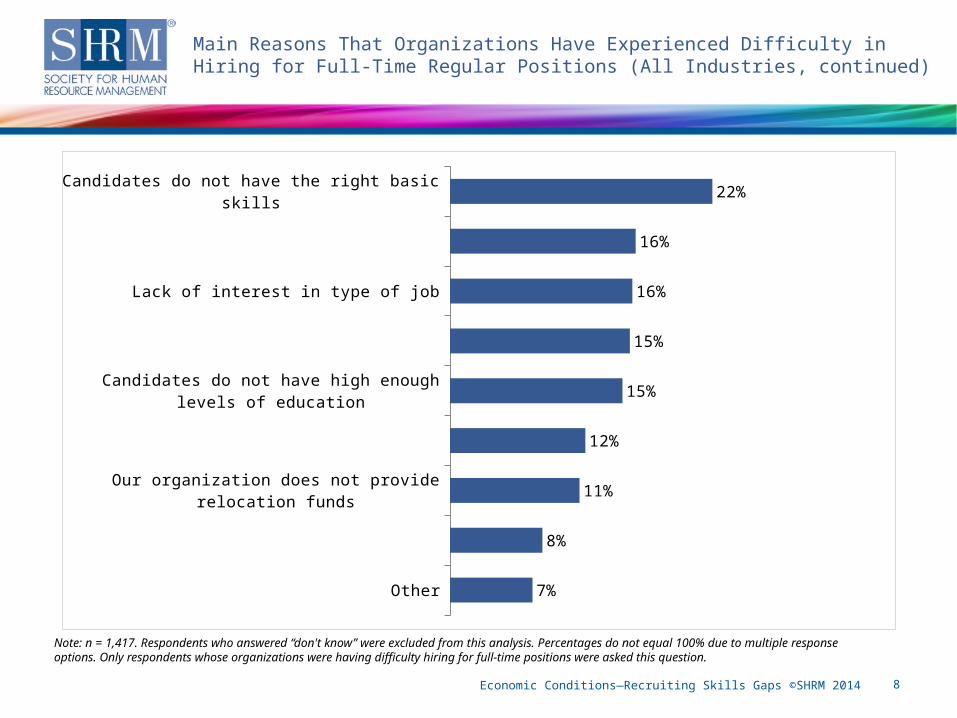
Main Reasons That Organizations Have Experienced Difficulty in Hiring for Full-Time Regular Positions (All Industries, continued)
Note: n = 1,417. Respondents who answered “don't know” were excluded from this analysis. Percentages do not equal 100% due to multiple response options. Only respondents whose organizations were having difficulty hiring for full-time positions were asked this question.
Candidates do not have the right basic skills
Candidates do not have the needed training
Lack of interest in type of job
Candidates are overqualified
Candidates do not have high enough levels of education
Qualified candidates are not able to move to our local area (due to mortgage or other issues)
Our organization does not provide relocation funds
Qualified candidates reject benefits package
Other
22%
16%
16%
15%
15%
12%
11%
8%
7%
Economic Conditions—Recruiting Skills Gaps ©SHRM 2014 9
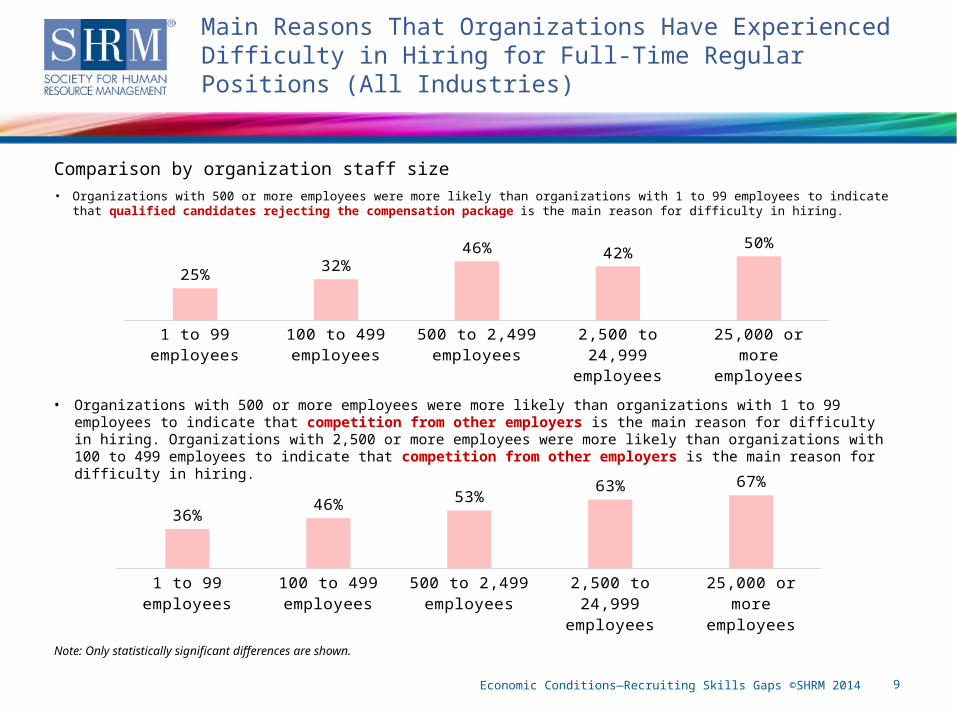
Main Reasons That Organizations Have Experienced Difficulty in Hiring for Full-Time Regular Positions (All Industries)
Note: Only statistically significant differences are shown.
Comparison by organization staff size• Organizations with 500 or more employees were more likely than organizations with 1 to 99 employees to indicate
that qualified candidates rejecting the compensation package is the main reason for difficulty in hiring.
1 to 99 em-ployees
100 to 499 employees
500 to 2,499 employees
2,500 to 24,999 employees
25,000 or more employees
25%32%
46% 42%50%
• Organizations with 500 or more employees were more likely than organizations with 1 to 99 employees to indicate that competition from other employers is the main reason for difficulty in hiring. Organizations with 2,500 or more employees were more likely than organizations with 100 to 499 employees to indicate that competition from other employers is the main reason for difficulty in hiring.
1 to 99 em-ployees
100 to 499 employees
500 to 2,499 employees
2,500 to 24,999 employees
25,000 or more employees
36%46%
53%63% 67%
Economic Conditions—Recruiting Skills Gaps ©SHRM 2014 10
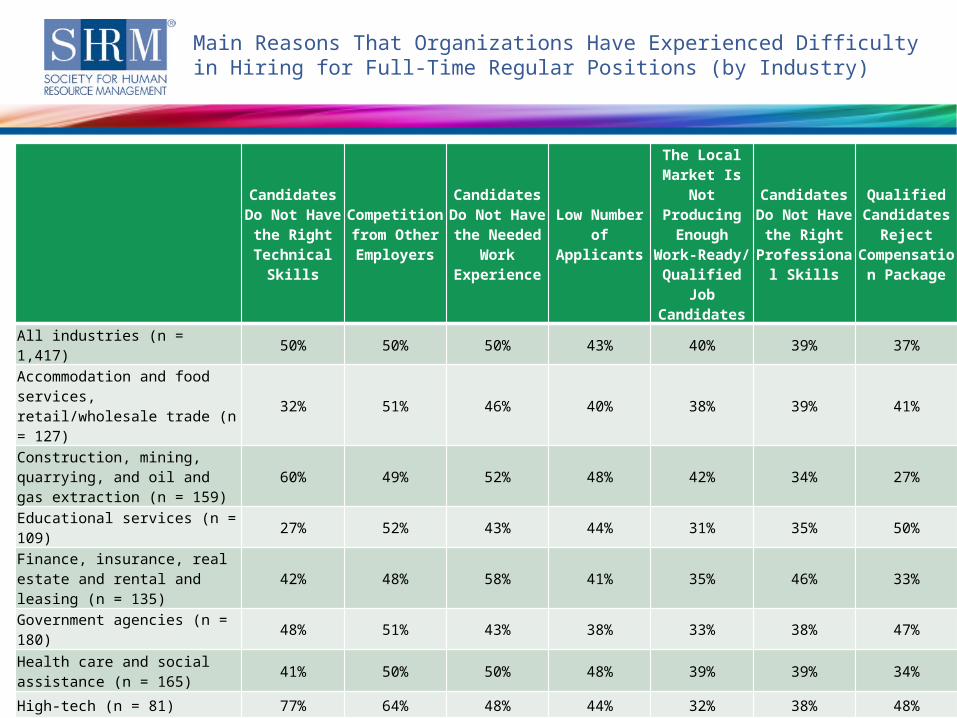
Main Reasons That Organizations Have Experienced Difficulty in Hiring for Full-Time Regular Positions (by Industry)
Note: Respondents who answered “don't know” were excluded from this analysis. Percentages do not equal 100% due to multiple response options. Only respondents whose organizations were hiring full-time staff were asked this question.
Candidates Do Not
Have the Right
Technical Skills
Competition from Other
Employers
Candidates Do Not
Have the Needed
Work Experience
Low Number of Applicants
The Local Market Is
Not Producing
Enough Work-Ready/
Qualified Job
Candidates
Candidates Do Not
Have the Right
Professional Skills
Qualified Candidates
Reject Compensation Package
All industries (n = 1,417) 50% 50% 50% 43% 40% 39% 37%
Accommodation and food services, retail/wholesale trade (n = 127)
32% 51% 46% 40% 38% 39% 41%
Construction, mining, quarrying, and oil and gas extraction (n = 159)
60% 49% 52% 48% 42% 34% 27%
Educational services (n = 109)
27% 52% 43% 44% 31% 35% 50%
Finance, insurance, real estate and rental and leasing (n = 135)
42% 48% 58% 41% 35% 46% 33%
Government agencies (n = 180)
48% 51% 43% 38% 33% 38% 47%
Health care and social assistance (n = 165)
41% 50% 50% 48% 39% 39% 34%
High-tech (n = 81) 77% 64% 48% 44% 32% 38% 48%
Manufacturing (n = 213) 61% 43% 50% 41% 51% 37% 29%
Professional, scientific, and technical services (n = 210)
63% 52% 55% 43% 42% 46% 37%
Economic Conditions—Recruiting Skills Gaps ©SHRM 2014 11
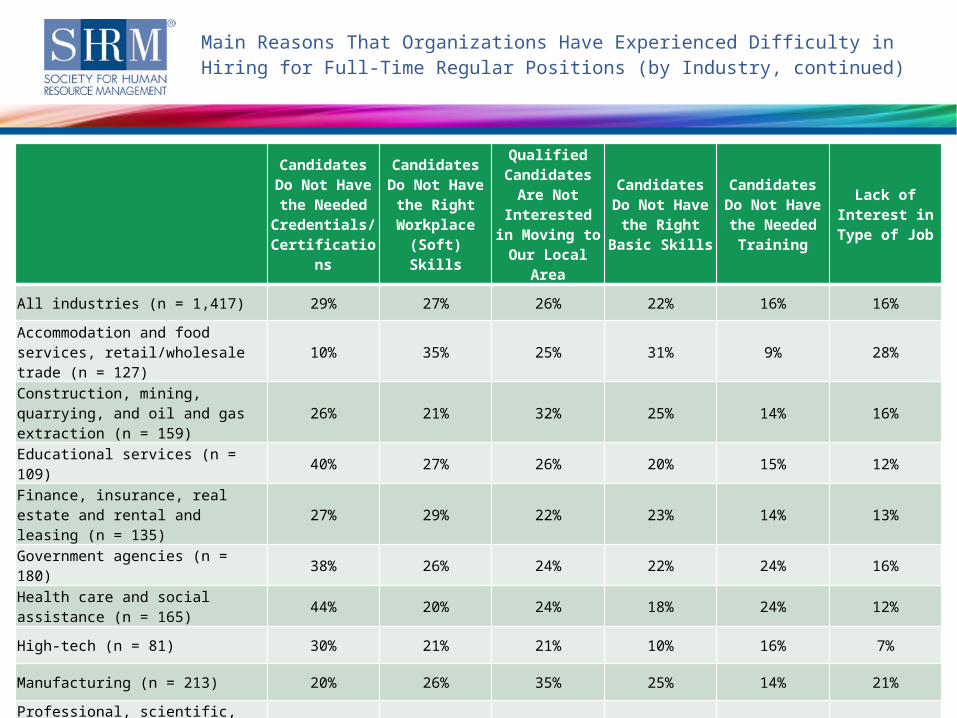
Main Reasons That Organizations Have Experienced Difficulty in Hiring for Full-Time Regular Positions (by Industry, continued)
Note: Respondents who answered “don't know” were excluded from this analysis. Percentages do not equal 100% due to multiple response options. Only respondents whose organizations were hiring full-time staff were asked this question.
Candidates Do Not Have the Needed Credentials/Certification
s
Candidates Do Not Have
the Right Workplace (Soft) Skills
Qualified Candidates
Are Not Interested in
Moving to Our Local
Area
Candidates Do Not Have
the Right Basic Skills
Candidates Do Not Have the Needed
Training
Lack of Interest in Type of Job
All industries (n = 1,417) 29% 27% 26% 22% 16% 16%
Accommodation and food services, retail/wholesale trade (n = 127)
10% 35% 25% 31% 9% 28%
Construction, mining, quarrying, and oil and gas extraction (n = 159)
26% 21% 32% 25% 14% 16%
Educational services (n = 109) 40% 27% 26% 20% 15% 12%
Finance, insurance, real estate and rental and leasing (n = 135)
27% 29% 22% 23% 14% 13%
Government agencies (n = 180) 38% 26% 24% 22% 24% 16%
Health care and social assistance (n = 165)
44% 20% 24% 18% 24% 12%
High-tech (n = 81) 30% 21% 21% 10% 16% 7%
Manufacturing (n = 213) 20% 26% 35% 25% 14% 21%
Professional, scientific, and technical services (n = 210)
29% 33% 23% 22% 12% 10%
Economic Conditions—Recruiting Skills Gaps ©SHRM 2014 12
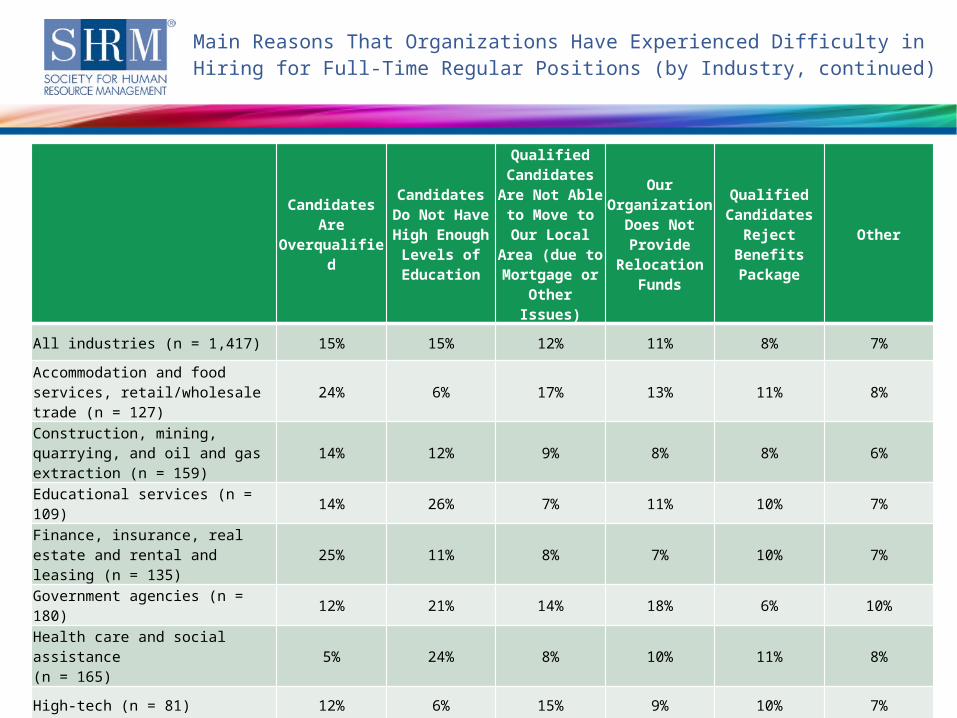
Main Reasons That Organizations Have Experienced Difficulty in Hiring for Full-Time Regular Positions (by Industry, continued)
Note: Respondents who answered “don't know” were excluded from this analysis. Percentages do not equal 100% due to multiple response options. Only respondents whose organizations were hiring full-time staff were asked this question.
Candidates Are
Overqualified
Candidates Do Not Have High Enough
Levels of Education
Qualified Candidates
Are Not Able to Move to Our Local
Area (due to Mortgage or
Other Issues)
Our Organization
Does Not Provide
Relocation Funds
Qualified Candidates
Reject Benefits Package
Other
All industries (n = 1,417) 15% 15% 12% 11% 8% 7%
Accommodation and food services, retail/wholesale trade (n = 127)
24% 6% 17% 13% 11% 8%
Construction, mining, quarrying, and oil and gas extraction (n = 159)
14% 12% 9% 8% 8% 6%
Educational services (n = 109) 14% 26% 7% 11% 10% 7%
Finance, insurance, real estate and rental and leasing (n = 135)
25% 11% 8% 7% 10% 7%
Government agencies (n = 180) 12% 21% 14% 18% 6% 10%
Health care and social assistance(n = 165)
5% 24% 8% 10% 11% 8%
High-tech (n = 81) 12% 6% 15% 9% 10% 7%
Manufacturing (n = 213) 15% 14% 14% 9% 5% 5%
Professional, scientific, and technical services (n = 210)
15% 10% 12% 11% 5% 7%
Economic Conditions—Recruiting Skills Gaps ©SHRM 2014 13
Organizations That Indicated Difficulty in Filling the Following Job Categories for Full-Time Regular Positions (All Industries)
Note: n = 195 - 1,721. Respondents who answered “don't know” were excluded from this analysis. Percentages do not equal 100% due to multiple response options. Only respondents whose organizations were hiring full-time staff were asked this question. Figure represents those who answered “very difficult” and “somewhat difficult.”
Engineers
High-skilled medical
IT/computer specialists
Scientists
Managers and executives
High-skilled technicians
Skilled trades
Sales representatives
Lawyers, judges and legal support workers
Community and social service workers
72%
69%
69%
67%
65%
63%
55%
54%
48%
46%
Economic Conditions—Recruiting Skills Gaps ©SHRM 2014 14
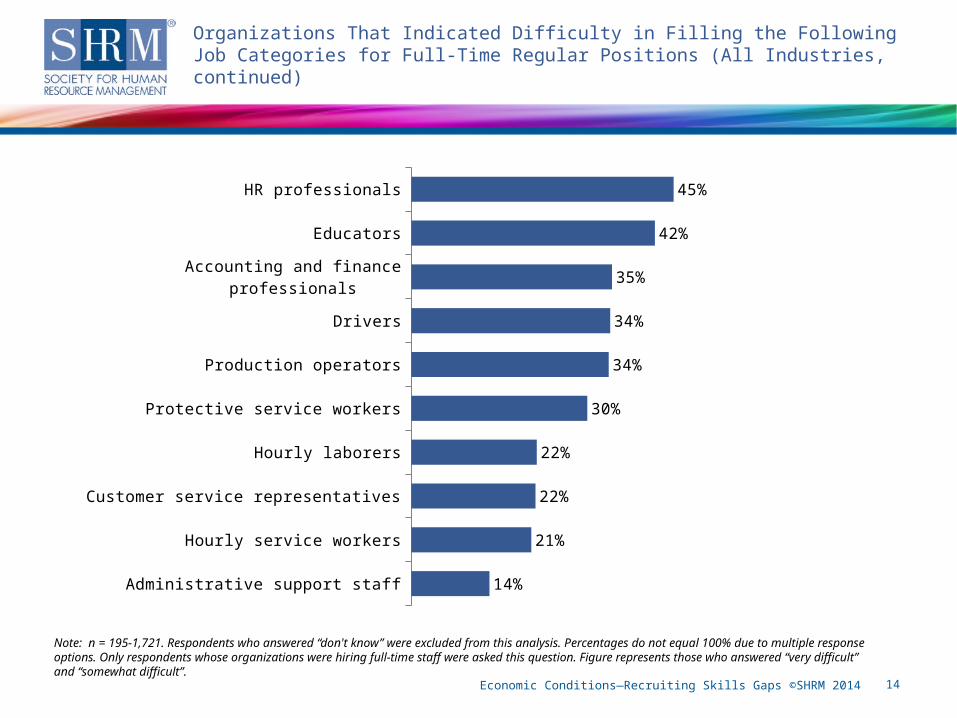
Organizations That Indicated Difficulty in Filling the Following Job Categories for Full-Time Regular Positions (All Industries, continued)
Note: n = 195-1,721. Respondents who answered “don't know” were excluded from this analysis. Percentages do not equal 100% due to multiple response options. Only respondents whose organizations were hiring full-time staff were asked this question. Figure represents those who answered “very difficult” and “somewhat difficult”.
HR professionals
Educators
Accounting and finance professionals
Drivers
Production operators
Protective service workers
Hourly laborers
Customer service representatives
Hourly service workers
Administrative support staff
45%
42%
35%
34%
34%
30%
22%
22%
21%
14%
Economic Conditions—Recruiting Skills Gaps ©SHRM 2014 15
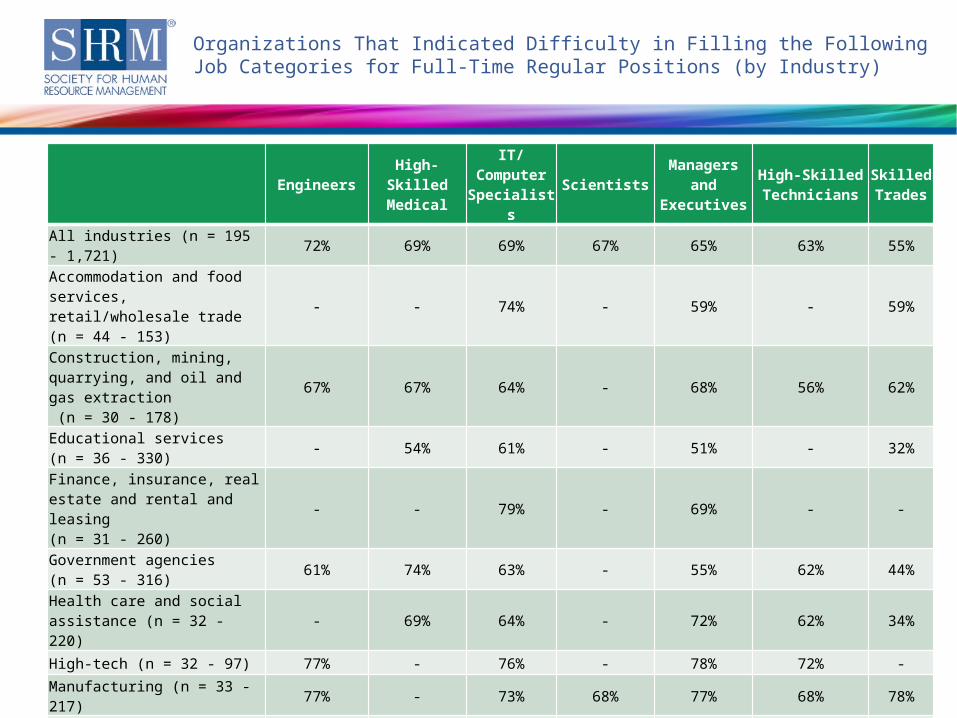
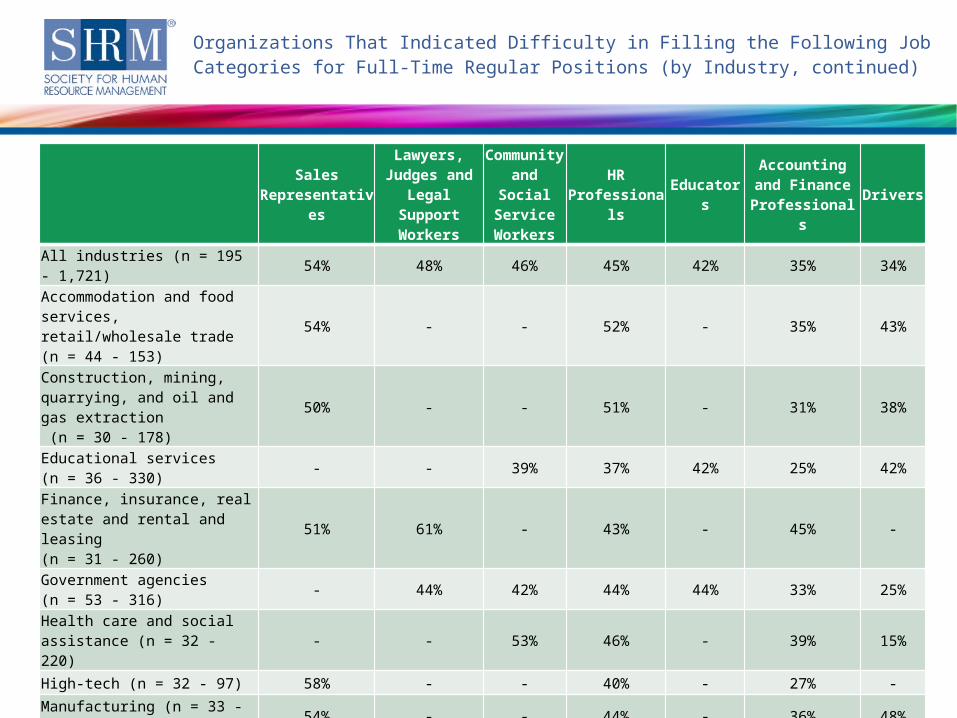
Organizations That Indicated Difficulty in Filling the Following Job Categories for Full-Time Regular Positions (by Industry)
Note: Respondents who answered “don't know” were excluded from this analysis. Only respondents whose organizations were hiring full-time staff for the particular job category were asked this question. Percentages represent those who answered “very difficult” and “somewhat difficult.” Percentages do not equal 100% due to multiple response options. “-” percentage cannot be reported due to small sample size (n < 30).
EngineersHigh-
Skilled Medical
IT/Computer Specialist
s
ScientistsManagers
and Executives
High-Skilled Technicians
Skilled Trades
All industries (n = 195 - 1,721)
72% 69% 69% 67% 65% 63% 55%
Accommodation and food services, retail/wholesale trade (n = 44 - 153)
- - 74% - 59% - 59%
Construction, mining, quarrying, and oil and gas extraction (n = 30 - 178)
67% 67% 64% - 68% 56% 62%
Educational services (n = 36 - 330)
- 54% 61% - 51% - 32%
Finance, insurance, real estate and rental and leasing
(n = 31 - 260)
- - 79% - 69% - -
Government agencies (n = 53 - 316)
61% 74% 63% - 55% 62% 44%
Health care and social assistance (n = 32 - 220)
- 69% 64% - 72% 62% 34%
High-tech (n = 32 - 97) 77% - 76% - 78% 72% -
Manufacturing (n = 33 - 217) 77% - 73% 68% 77% 68% 78%
Professional, scientific, and technical services (n = 45 - 212)
75% - 71% 63% 67% 64% -
Economic Conditions—Recruiting Skills Gaps ©SHRM 2014 16
Organizations That Indicated Difficulty in Filling the Following Job Categories for Full-Time Regular Positions (by Industry, continued)
Note: Respondents who answered “don't know” were excluded from this analysis. Only respondents whose organizations were hiring full-time staff for the particular job category were asked this question. Percentages represent those who answered “very difficult” and “somewhat difficult.” Percentages do not equal 100% due to multiple response options. “-” percentage cannot be reported due to small sample size (n < 30).
Sales
Representatives
Lawyers, Judges and
Legal Support Workers
Community and Social
Service Workers
HR Professiona
ls
Educators
Accounting and Finance
ProfessionalsDrivers
All industries (n = 195 - 1,721)
54% 48% 46% 45% 42% 35% 34%
Accommodation and food services, retail/wholesale trade (n = 44 - 153)
54% - - 52% - 35% 43%
Construction, mining, quarrying, and oil and gas extraction (n = 30 - 178)
50% - - 51% - 31% 38%
Educational services (n = 36 - 330)
- - 39% 37% 42% 25% 42%
Finance, insurance, real estate and rental and leasing
(n = 31 - 260)
51% 61% - 43% - 45% -
Government agencies (n = 53 - 316)
- 44% 42% 44% 44% 33% 25%
Health care and social assistance (n = 32 - 220)
- - 53% 46% - 39% 15%
High-tech (n = 32 - 97) 58% - - 40% - 27% -
Manufacturing (n = 33 - 217) 54% - - 44% - 36% 48%
Professional, scientific, and technical services (n = 45 - 212)
63% 56% - 47% - 40% -
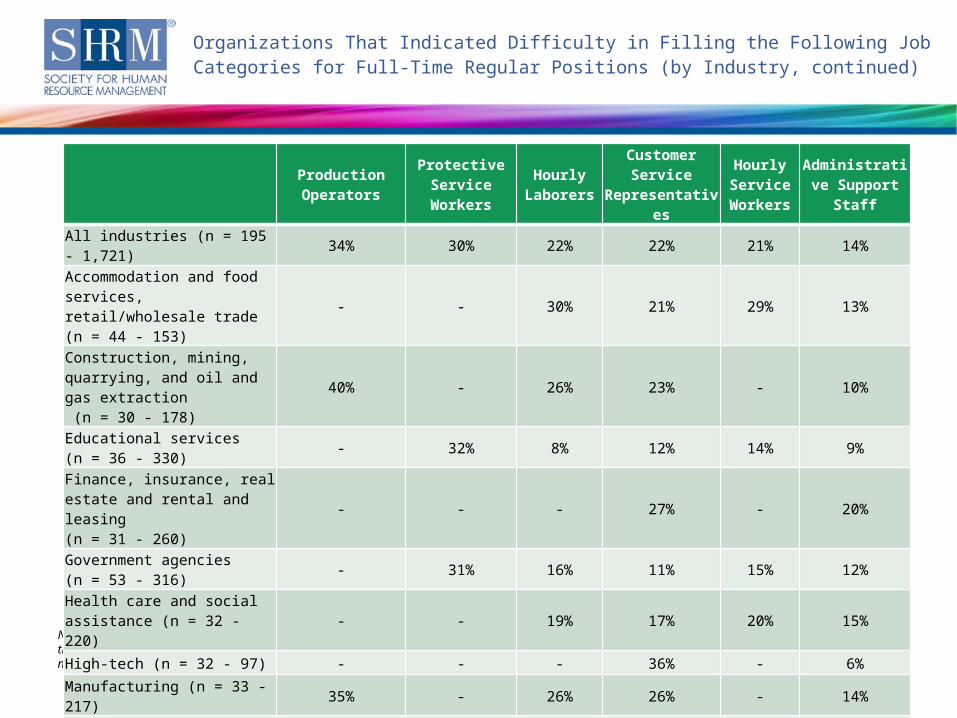
Economic Conditions—Recruiting Skills Gaps ©SHRM 2014 17
Organizations That Indicated Difficulty in Filling the Following Job Categories for Full-Time Regular Positions (by Industry, continued)
Note: Respondents who answered “don't know” were excluded from this analysis. Only respondents whose organizations were hiring full-time staff for the particular job category were asked this question. Percentages represent those who answered “very difficult” and “somewhat difficult.” Percentages do not equal 100% due to multiple response options. “-” percentage cannot be reported due to small sample size (n < 30).
Production Operators
Protective Service Workers
Hourly Laborers
Customer Service
Representatives
Hourly Service Workers
Administrative Support
Staff
All industries (n = 195 - 1,721)
34% 30% 22% 22% 21% 14%
Accommodation and food services, retail/wholesale trade (n = 44 - 153)
- - 30% 21% 29% 13%
Construction, mining, quarrying, and oil and gas extraction (n = 30 - 178)
40% - 26% 23% - 10%
Educational services (n = 36 - 330)
- 32% 8% 12% 14% 9%
Finance, insurance, real estate and rental and leasing (n = 31 - 260)
- - - 27% - 20%
Government agencies (n = 53 - 316)
- 31% 16% 11% 15% 12%
Health care and social assistance (n = 32 - 220)
- - 19% 17% 20% 15%
High-tech (n = 32 - 97) - - - 36% - 6%
Manufacturing (n = 33 - 217)
35% - 26% 26% - 14%
Professional, scientific, and technical services (n = 45 - 212)
- - - 30% - 20%
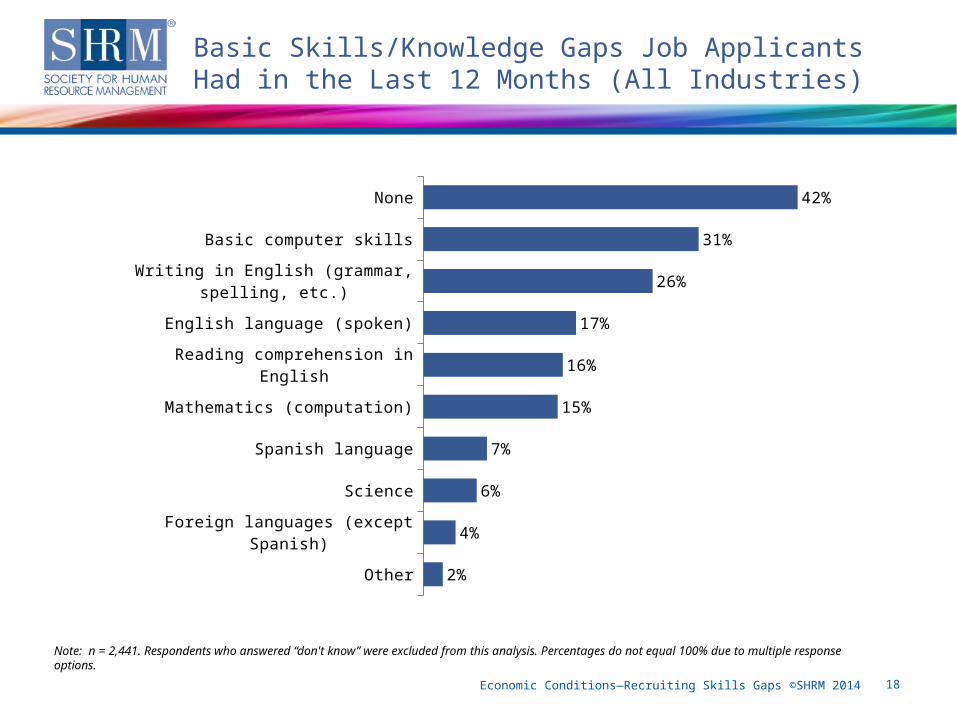
Economic Conditions—Recruiting Skills Gaps ©SHRM 2014 18
Basic Skills/Knowledge Gaps Job Applicants Had in the Last 12 Months (All Industries)
Note: n = 2,441. Respondents who answered “don't know” were excluded from this analysis. Percentages do not equal 100% due to multiple response options.
None
Basic computer skills
Writing in English (grammar, spelling, etc.)
English language (spoken)
Reading comprehension in English
Mathematics (computation)
Spanish language
Science
Foreign languages (except Spanish)
Other
42%
31%
26%
17%
16%
15%
7%
6%
4%
2%
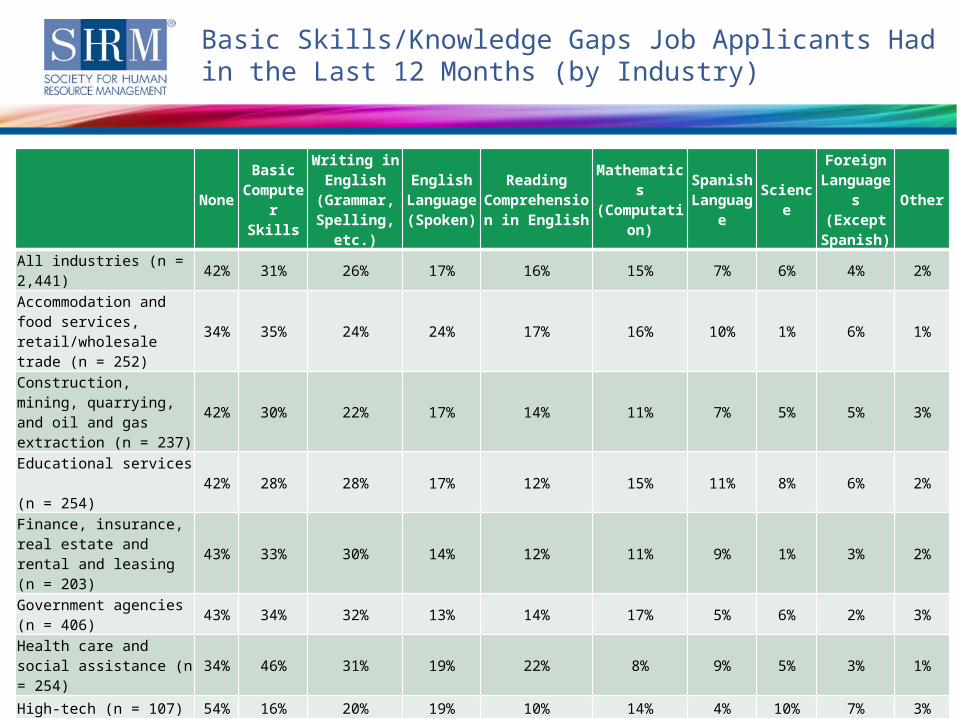
Economic Conditions—Recruiting Skills Gaps ©SHRM 2014 19
Basic Skills/Knowledge Gaps Job Applicants Had in the Last 12 Months (by Industry)
Note: Respondents who answered "don't know" were excluded from this analysis. Percentages may not equal 100% due to multiple response options.
NoneBasic
Computer Skills
Writing in English
(Grammar, Spelling,
etc.)
English Languag
e (Spoken)
Reading Comprehension in English
Mathematics
(Computation)
Spanish Langua
ge
Science
Foreign Languag
es (Except Spanish)
Other
All industries (n = 2,441)
42% 31% 26% 17% 16% 15% 7% 6% 4% 2%
Accommodation and food services, retail/wholesale trade (n = 252)
34% 35% 24% 24% 17% 16% 10% 1% 6% 1%
Construction, mining, quarrying, and oil and gas extraction (n = 237)
42% 30% 22% 17% 14% 11% 7% 5% 5% 3%
Educational services (n = 254)
42% 28% 28% 17% 12% 15% 11% 8% 6% 2%
Finance, insurance, real estate and rental and leasing (n = 203)
43% 33% 30% 14% 12% 11% 9% 1% 3% 2%
Government agencies (n = 406)
43% 34% 32% 13% 14% 17% 5% 6% 2% 3%
Health care and social assistance (n = 254)
34% 46% 31% 19% 22% 8% 9% 5% 3% 1%
High-tech (n = 107) 54% 16% 20% 19% 10% 14% 4% 10% 7% 3%
Manufacturing (n = 326)
41% 28% 17% 17% 21% 29% 4% 8% 1% 3%
Professional, scientific, and technical services (n = 329)
51% 20% 23% 16% 12% 9% 6% 10% 3% 3%
Economic Conditions—Recruiting Skills Gaps ©SHRM 2014 20
Applied Skills Gaps Job Applicants Had in the Last 12 Months (All Industries)
Note: n = 2,583. Respondents who answered “don't know” were excluded from this analysis. Percentages do not equal 100% due to multiple response options.*ITC stands for Information and Communications Technology.
None
Critical Thinking/Problem-Solving
Professionalism/Work Ethic
Leadership
Written Communications
Teamwork/Collaboration
Oral Communications
Application of ITC*
Creativity/Innovation
Lifelong Learning/Self-Direction
Ethics/Social Responsibility
Diversity
Other
20%
40%
38%
34%
27%
25%
22%
20%
14%
13%
13%
12%
3%
Economic Conditions—Recruiting Skills Gaps ©SHRM 2014 21
Applied Skills Gaps Job Applicants Had in the Last 12 Months (by Industry)
Note: Respondents who answered "don't know" were excluded from this analysis. Percentages do not equal 100% due to multiple response options.
None
Critical Thinking/Problem-Solving
Professionalism/Work
Ethic
Leadership
Written Communicatio
ns
Teamwork/Collaborati
on
Oral Communicatio
ns
All industries (n = 2,583) 20% 40% 38% 34% 27% 25% 22%Accommodation and food services, retail/wholesale trade (n = 258)
14% 45% 47% 37% 29% 26% 25%
Construction, mining, quarrying, and oil and gas extraction (n = 256)
22% 32% 31% 34% 24% 28% 20%
Educational services (n = 256)
25% 30% 29% 32% 25% 21% 17%
Finance, insurance, real estate and rental and leasing (n = 220)
18% 42% 40% 32% 30% 20% 21%
Government agencies (n = 423)
23% 40% 36% 30% 34% 26% 26%
Health care and social assistance (n = 277)
9% 54% 53% 39% 29% 34% 24%
High-tech (n = 117) 25% 32% 28% 35% 15% 19% 20%
Manufacturing (n = 340) 21% 40% 38% 35% 22% 29% 19%
Professional, scientific, and technical services (n = 361)
25% 39% 34% 30% 25% 22% 22%
Economic Conditions—Recruiting Skills Gaps ©SHRM 2014 22
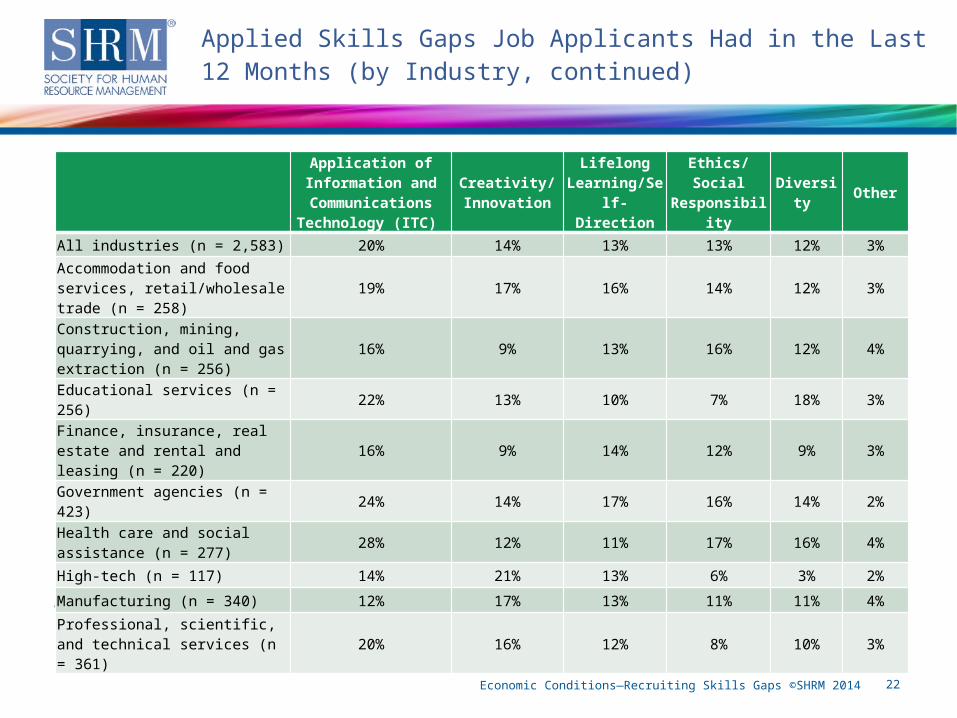
Applied Skills Gaps Job Applicants Had in the Last 12 Months (by Industry, continued)
Note: Respondents who answered "don't know" were excluded from this analysis. Percentages do not equal 100% due to multiple response options.
Application of Information and Communications Technology (ITC)
Creativity/Innovation
Lifelong Learning/Self-Direction
Ethics/Social
Responsibility
Diversity
Other
All industries (n = 2,583) 20% 14% 13% 13% 12% 3%Accommodation and food services, retail/wholesale trade (n = 258)
19% 17% 16% 14% 12% 3%
Construction, mining, quarrying, and oil and gas extraction (n = 256)
16% 9% 13% 16% 12% 4%
Educational services (n = 256) 22% 13% 10% 7% 18% 3%
Finance, insurance, real estate and rental and leasing (n = 220)
16% 9% 14% 12% 9% 3%
Government agencies (n = 423)
24% 14% 17% 16% 14% 2%
Health care and social assistance (n = 277)
28% 12% 11% 17% 16% 4%
High-tech (n = 117) 14% 21% 13% 6% 3% 2%
Manufacturing (n = 340) 12% 17% 13% 11% 11% 4%
Professional, scientific, and technical services (n = 361)
20% 16% 12% 8% 10% 3%
Economic Conditions—Recruiting Skills Gaps ©SHRM 2014 23
Demographics
Economic Conditions—Recruiting Skills Gaps ©SHRM 2014 24
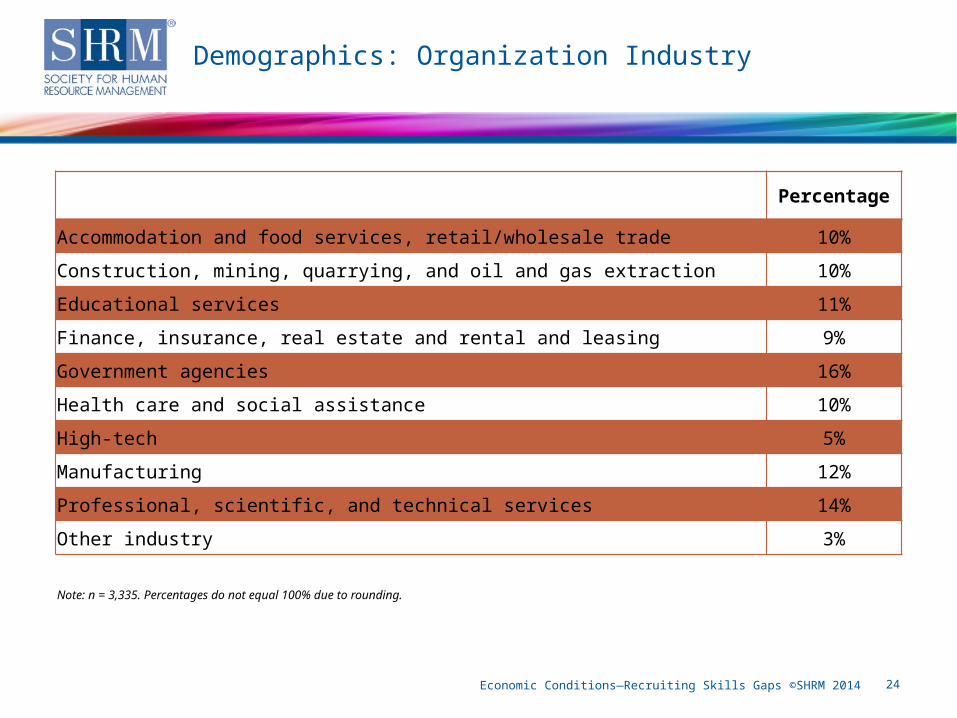
Demographics: Organization Industry
Note: n = 3,335. Percentages do not equal 100% due to rounding.
Percentage
Accommodation and food services, retail/wholesale trade 10%
Construction, mining, quarrying, and oil and gas extraction 10%
Educational services 11%
Finance, insurance, real estate and rental and leasing 9%
Government agencies 16%
Health care and social assistance 10%
High-tech 5%
Manufacturing 12%
Professional, scientific, and technical services 14%
Other industry 3%
Economic Conditions—Recruiting Skills Gaps ©SHRM 2014 25
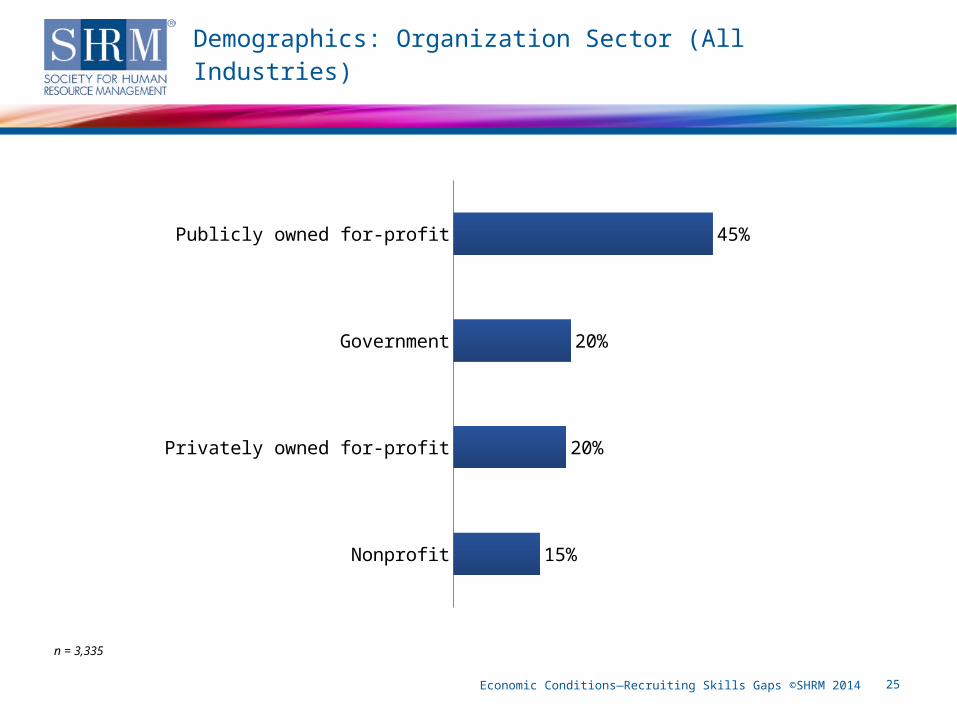
Demographics: Organization Sector (All Industries)
n = 3,335
Publicly owned for-profit
Government
Privately owned for-profit
Nonprofit
45%
20%
20%
15%
Economic Conditions—Recruiting Skills Gaps ©SHRM 2014 26
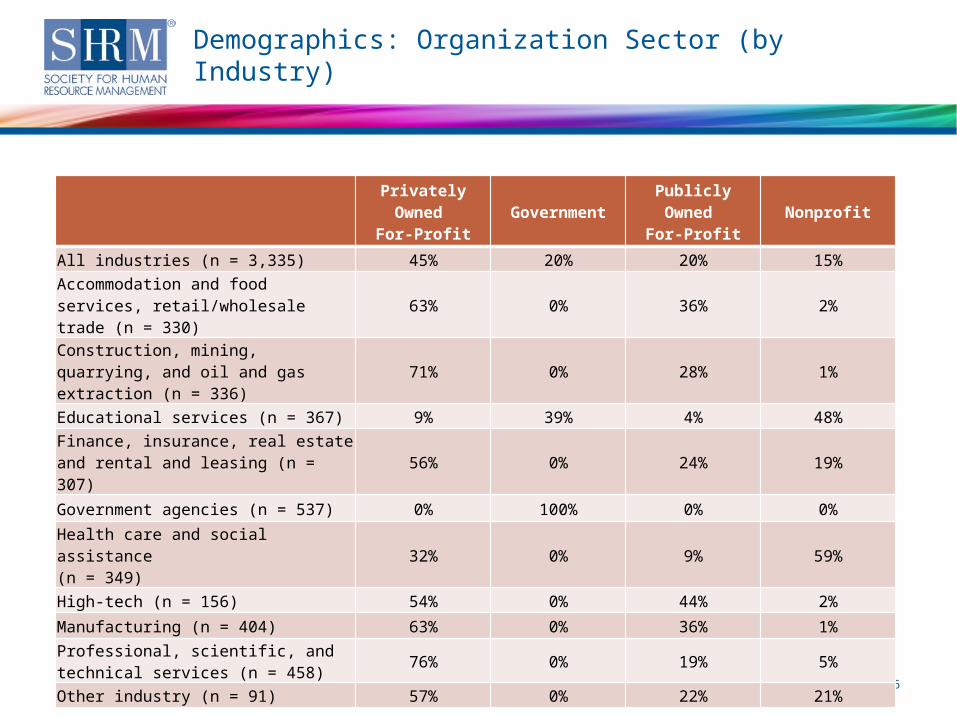
Demographics: Organization Sector (by Industry)
Note: Percentages may not equal 100% due to rounding.
Privately Owned
For-ProfitGovernment
Publicly Owned
For-ProfitNonprofit
All industries (n = 3,335) 45% 20% 20% 15%
Accommodation and food services, retail/wholesale trade (n = 330)
63% 0% 36% 2%
Construction, mining, quarrying, and oil and gas extraction (n = 336)
71% 0% 28% 1%
Educational services (n = 367) 9% 39% 4% 48%
Finance, insurance, real estate and rental and leasing (n = 307)
56% 0% 24% 19%
Government agencies (n = 537) 0% 100% 0% 0%
Health care and social assistance (n = 349)
32% 0% 9% 59%
High-tech (n = 156) 54% 0% 44% 2%
Manufacturing (n = 404) 63% 0% 36% 1%
Professional, scientific, and technical services (n = 458)
76% 0% 19% 5%
Other industry (n = 91) 57% 0% 22% 21%
Economic Conditions—Recruiting Skills Gaps ©SHRM 2014 27
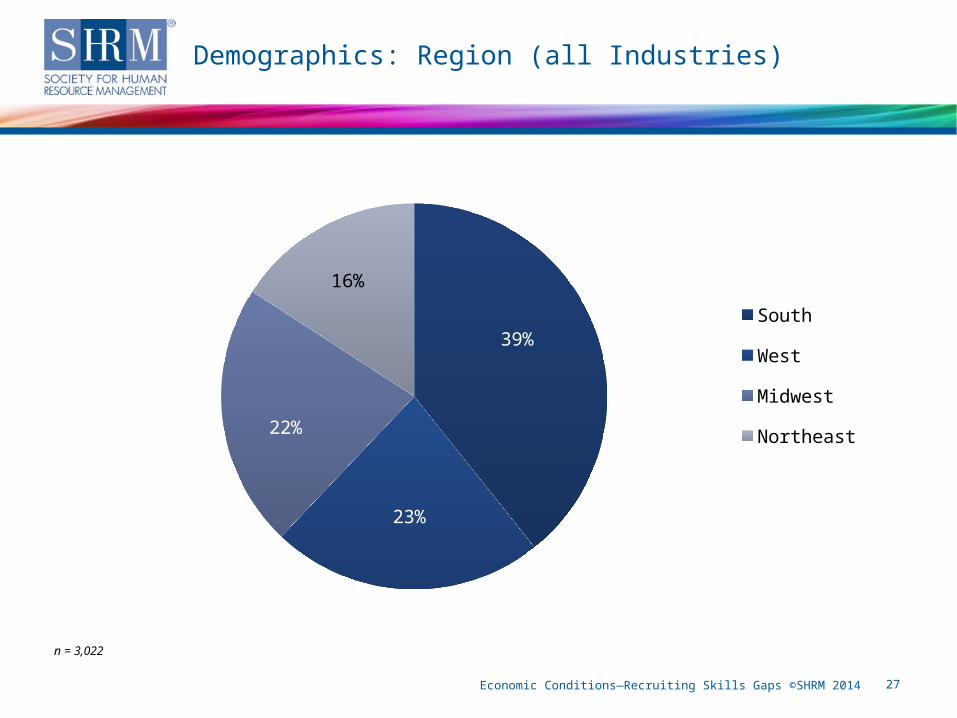
Demographics: Region (all Industries)
n = 3,022
39%
23%
22%
16%
South
West
Midwest
Northeast
Economic Conditions—Recruiting Skills Gaps ©SHRM 2014 28
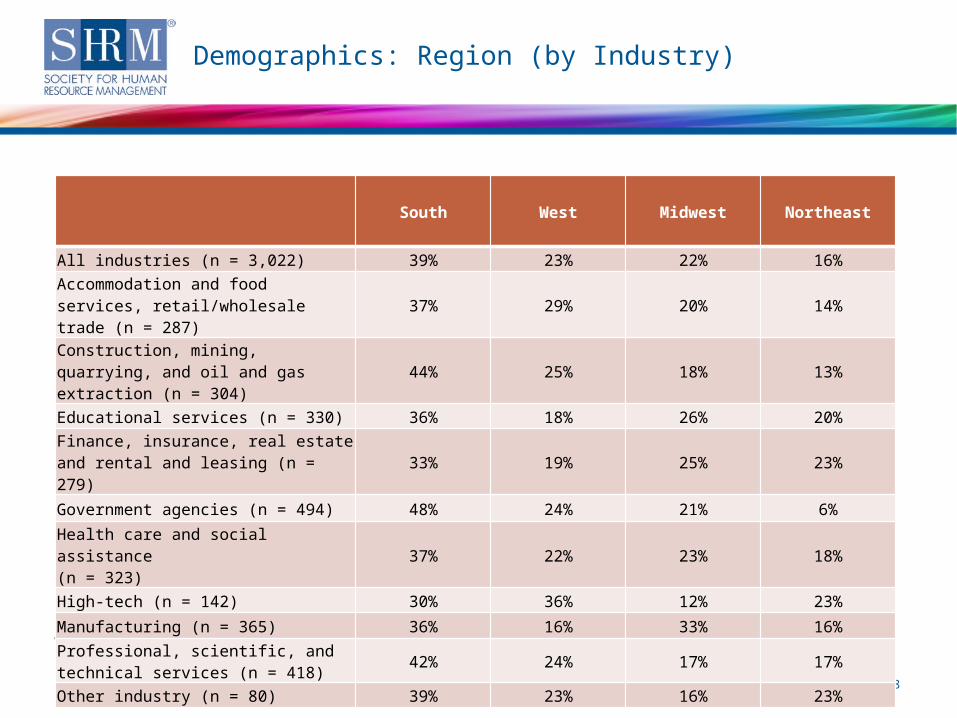
Demographics: Region (by Industry)
Note: Percentages may not equal 100% due to rounding.
South West Midwest Northeast
All industries (n = 3,022) 39% 23% 22% 16%
Accommodation and food services, retail/wholesale trade (n = 287)
37% 29% 20% 14%
Construction, mining, quarrying, and oil and gas extraction (n = 304)
44% 25% 18% 13%
Educational services (n = 330) 36% 18% 26% 20%
Finance, insurance, real estate and rental and leasing (n = 279)
33% 19% 25% 23%
Government agencies (n = 494) 48% 24% 21% 6%
Health care and social assistance (n = 323)
37% 22% 23% 18%
High-tech (n = 142) 30% 36% 12% 23%
Manufacturing (n = 365) 36% 16% 33% 16%
Professional, scientific, and technical services (n = 418)
42% 24% 17% 17%
Other industry (n = 80) 39% 23% 16% 23%
Economic Conditions—Recruiting Skills Gaps ©SHRM 2014 29
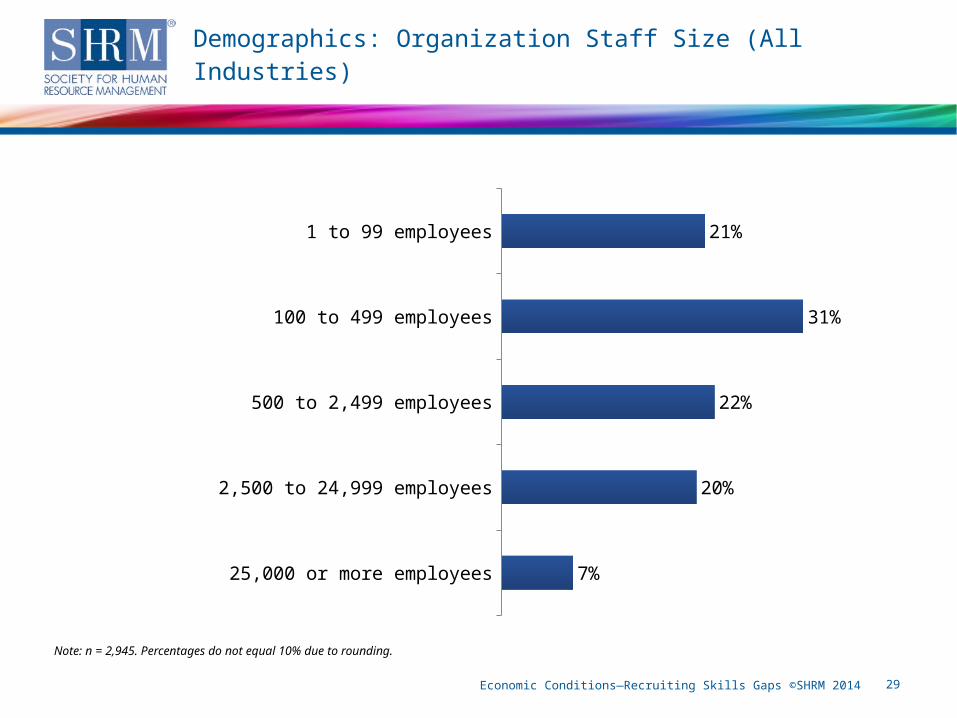
Demographics: Organization Staff Size (All Industries)
Note: n = 2,945. Percentages do not equal 10% due to rounding.
1 to 99 employees
100 to 499 employees
500 to 2,499 employees
2,500 to 24,999 employees
25,000 or more employees
21%
31%
22%
20%
7%
Economic Conditions—Recruiting Skills Gaps ©SHRM 2014 30
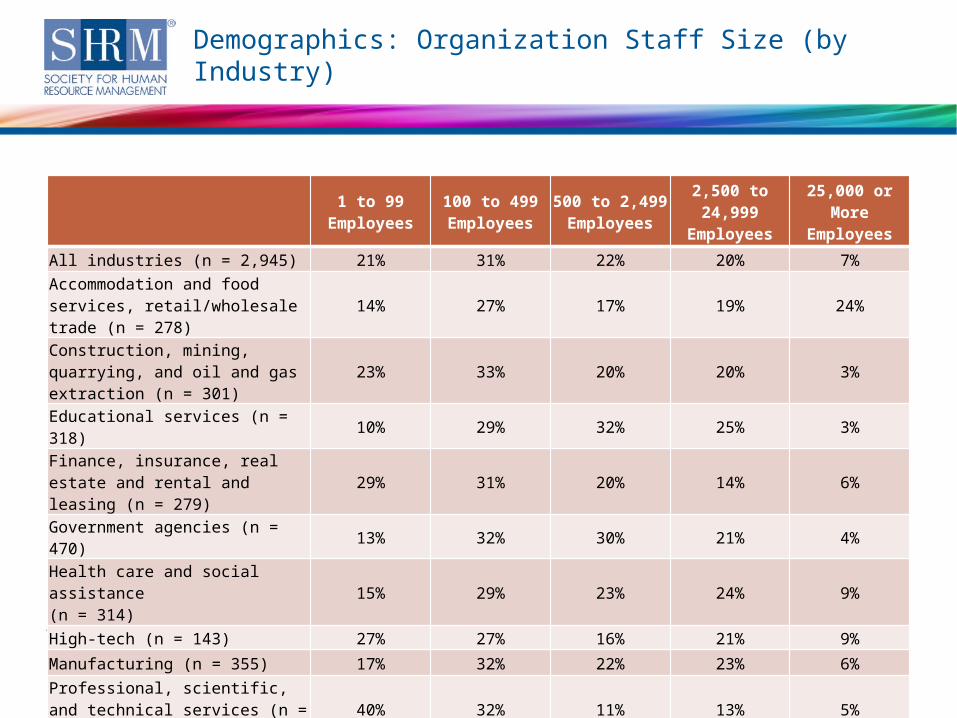
Demographics: Organization Staff Size (by Industry)
Note: Percentages may not equal 100% due to rounding.
1 to 99
Employees100 to 499 Employees
500 to 2,499 Employees
2,500 to 24,999
Employees
25,000 or More
Employees
All industries (n = 2,945) 21% 31% 22% 20% 7%Accommodation and food services, retail/wholesale trade (n = 278)
14% 27% 17% 19% 24%
Construction, mining, quarrying, and oil and gas extraction (n = 301)
23% 33% 20% 20% 3%
Educational services (n = 318) 10% 29% 32% 25% 3%
Finance, insurance, real estate and rental and leasing (n = 279)
29% 31% 20% 14% 6%
Government agencies (n = 470) 13% 32% 30% 21% 4%
Health care and social assistance (n = 314)
15% 29% 23% 24% 9%
High-tech (n = 143) 27% 27% 16% 21% 9%
Manufacturing (n = 355) 17% 32% 22% 23% 6%
Professional, scientific, and technical services (n = 409)
40% 32% 11% 13% 5%
Other industry (n = 78) 23% 36% 17% 17% 8%
Economic Conditions—Recruiting Skills Gaps ©SHRM 2014 31
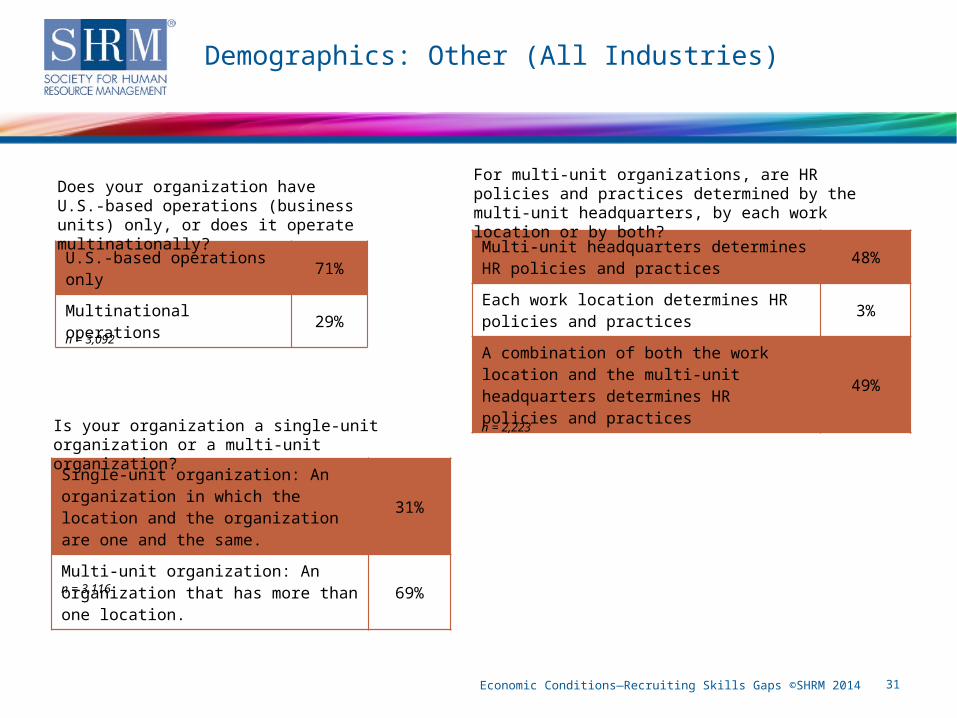
n = 3,092
Demographics: Other (All Industries)
U.S.-based operations only 71%
Multinational operations 29%
Single-unit organization: An organization in which the location and the organization are one and the same.
31%
Multi-unit organization: An organization that has more than one location.
69%
Multi-unit headquarters determines HR policies and practices
48%
Each work location determines HR policies and practices
3%
A combination of both the work location and the multi-unit headquarters determines HR policies and practices
49%
Is your organization a single-unit organization or a multi-unit organization?
For multi-unit organizations, are HR policies and practices determined by the multi-unit headquarters, by each work location or by both?
Does your organization have U.S.-based operations (business units) only, or does it operate multinationally?
n = 3,116
n = 2,223
Economic Conditions—Recruiting Skills Gaps ©SHRM 2014 32
SHRM Survey Findings
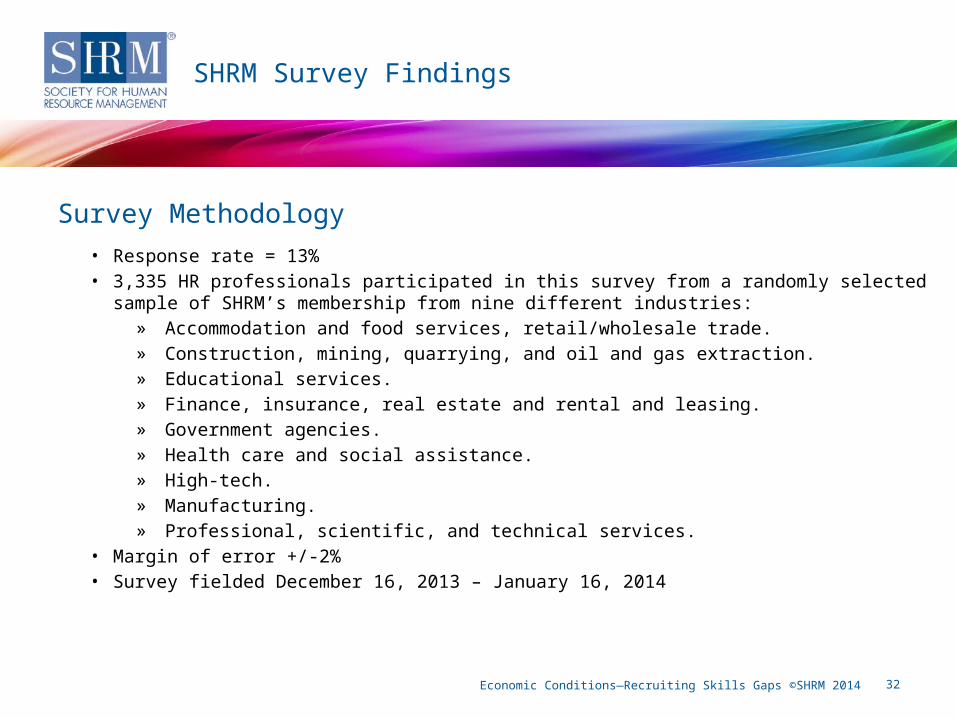
• Response rate = 13%• 3,335 HR professionals participated in this survey from a randomly selected sample of
SHRM’s membership from nine different industries:» Accommodation and food services, retail/wholesale trade.» Construction, mining, quarrying, and oil and gas extraction.» Educational services.» Finance, insurance, real estate and rental and leasing.» Government agencies.» Health care and social assistance.» High-tech.» Manufacturing.» Professional, scientific, and technical services.
• Margin of error +/-2%• Survey fielded December 16, 2013 – January 16, 2014
Survey Methodology
Economic Conditions—Recruiting Skills Gaps ©SHRM 2014 33
• SHRM Leading Indicators of National Employment (LINE)» http://www.shrm.org/research/monthlyemploymentindices/line/pages/default.aspx
• SHRM Jobs Outlook Survey (JOS)» http://www.shrm.org/research/monthlyemploymentindices/lmo/pages/default.aspx
• SHRM Metro Economic Outlooks» http://www.shrm.org/research/monthlyemploymentindices/pages/metroeconomicout
looks.aspx
• SHRM’s Workforce Readiness Resource Page» http://www.shrm.org/hrdisciplines/staffingmanagement/articles/pages/workforceread
iness.aspx
• SHRM Foundation: What’s Next: Future Global Trends Affecting Your Organization, Evolution of Work and the Worker
» http://www.shrm.org/about/foundation/shapingthefuture/documents/2-14%20theme%201%20paper-final%20for%20web.pdf
Additional SHRM Resources
Economic Conditions—Recruiting Skills Gaps ©SHRM 2014 34
For more survey/poll findings, visit shrm.org/surveys
For more information about SHRM’s Customized Research Services, visit shrm.org/customizedresearch
Follow us on Twitter @SHRM_Research
About SHRM Research
Project lead:Tanya Mulvey, researcher, SHRM Research
Project contributors:Alexander Alonso, Ph.D., SPHR, vice president, SHRM ResearchEvren Esen, director, Survey Programs, SHRM ResearchYan Dong, Survey Research Center, SHRM ResearchChristina Lee, researcher, SHRM ResearchQikun Niu, intern, SHRM ResearchJennifer Schramm, manager, Workplace Trends and Forecasting, SHRM ResearchJoseph Coombs, senior analyst, Workforce Trends, SHRM Research
Copy editor:Katya Scanlan, SHRM Knowledge Center
Economic Conditions—Recruiting Skills Gaps ©SHRM 2014 35
Founded in 1948, the Society for Human Resource Management (SHRM) is the world’s largest HR membership organization devoted to human resource management. Representing more than 275,000 members in over 160 countries, the Society is the leading provider of resources to serve the needs of HR professionals and advance the professional practice of human resource management. SHRM has more than 575 affiliated chapters within the United States and subsidiary offices in China, India and United Arab Emirates. Visit us at shrm.org.
About SHRM