Embed Size (px)
Citation preview

Shriram Transport Finance Company Limited32nd Annual Report 2010-11
Forward looking statementsIn this Annual Report, we have disclosed forward looking information to enable investors to comprehend our prospects and take informed investment decisions. This report and other statements – written and oral – that we periodically make, contain forward looking statements that set out anticipated results based on the management’s plans and assumptions. We have tried wherever possible to identify such statements by using words such as ‘anticipate’, ‘estimate’, ‘expects’, ‘projects’, ‘intends’, ‘plans’, ‘believes’, and words of similar substance in connection with any discussion of future performance.
We cannot guarantee that these forward looking statements will be realised, although we believe we have been prudent in assumptions. The achievement of results is subject to risks, uncertainties and even inaccurate assumptions. Should known or unknown risks or uncertainties materialise or should underlying assumptions prove inaccurate, actual results could vary materially from those anticipated, estimated or projected. Readers should bear this in mind.
We undertake no obligation to publicly update any forward looking statements, whether as a result of new information, future events or otherwise.
What’s Inside?
Corporate information 1
Our profi le 2
Key milestones 3
Performance highlights & trends 4
Our reach 6
Management Discussion and Analysis 8
Directors’ Report 16
Report on Corporate Governance 24
Financial Section 40
Corporate Information
BOARD OF DIRECTORS
Chairman
Arun Duggal (Non-Independent)
Managing Director
R. Sridhar
Directors
Maya Shanker Verma (Independent)
Sumatiprasad M. Bafna (Independent)
Mukund Manohar Chitale (Independent)
Adit Jain (Independent)
S. Lakshminarayanan (Independent)
Puneet Bhatia
Ranvir Dewan
S. Venkatakrishnan
VICE PRESIDENT (CORPORATE AFFAIRS)
& COMPANY SECRETARY
K. Prakash
AUDITORS
M/s. S. R. Batliboi & Co., Chartered Accountants
M/s. G. D. Apte & Co., Chartered Accountants
SHARE TRANSFER AGENTS
Integrated Enterprises (India) Limited
2nd Floor, ‘Kences Towers’, No. 1,
Ramakrishna Street, North Usman Road,
T. Nagar, Chennai - 600 017.
Tel: 044 2814 0801/02/03, Fax: 044 2814 2479
REGISTERED OFFICE
Mookambika Complex, 3rd Floor, No. 4
Lady Desika Road, Mylapore, Chennai – 600 004
HEAD OFFICE
Wockhardt Towers
West Wing, Level-3, C-2, G-Block,
Bandra-Kurla Complex, Bandra (East),
Mumbai - 400 051, Maharashtra.
Tel: 022 4095 9595, Fax: 022 4095 9597
LISTED ATBombay Stock Exchange Ltd.
National Stock Exchange of India Ltd.
Madras Stock Exchange Ltd.
INSTITUTIONSCiticorp Finance (India) Ltd
GE Capital Services Ltd
Life Insurance Corporation of India (LIC)
L & T Finance Ltd.
SICOM Ltd.
Small Industries Development Bank of
India (SIDBI)
BANKERS
Abu Dhabi Commercial Bank
Allahabad Bank
Andhra Bank
Axis Bank
Barclays Bank PLC
Bank of America N.A.
Bank of Bahrain & Kuwait B.S.C.
Bank of Baroda
Bank of Ceylon
Bank of India
Bank of Maharashtra
Bank of Tokyo - Mitsubishi UFJ
Calyon Bank
Canara Bank
Central Bank of India
Chinatrust Commercial Bank
Citibank N.A.
City Union Bank
Corporation Bank
DBS Bank
Dena Bank
Deutsche Bank AG
Dhanalakshmi Bank
Federal Bank
HDFC Bank
Hongkong and Shanghai
Banking Corporation
ICICI Bank
IDBI Bank
Indian Bank
Indian Overseas Bank
IndusInd Bank
ING Vysya Bank
JPMorgan Chase Bank N.A.
Karnataka Bank
Karur Vysya Bank
Kotak Mahindra Bank
Lakshmi Vilas Bank
Mizuho Corporate Bank
Oriental Bank of Commerce
Punjab & Sindh Bank
Punjab National Bank
Ratnakar Bank
Royal Bank of Scotland N.V.
Shinhan Bank
Societe Generale Corporate &
Investment Banking
Standard Chartered Bank
State Bank of Bikaner & Jaipur
State Bank of Hyderabad
State Bank of India
State Bank of Mauritius
State Bank of Mysore
State Bank of Patiala
State Bank of Travancore
Syndicate Bank
Tamilnad Mercantile Bank
The South Indian Bank
UBS AG
UCO Bank
Union Bank of India
United Bank of India
Vijaya Bank
Yes Bank
Finance Company LimitedShriram Transport
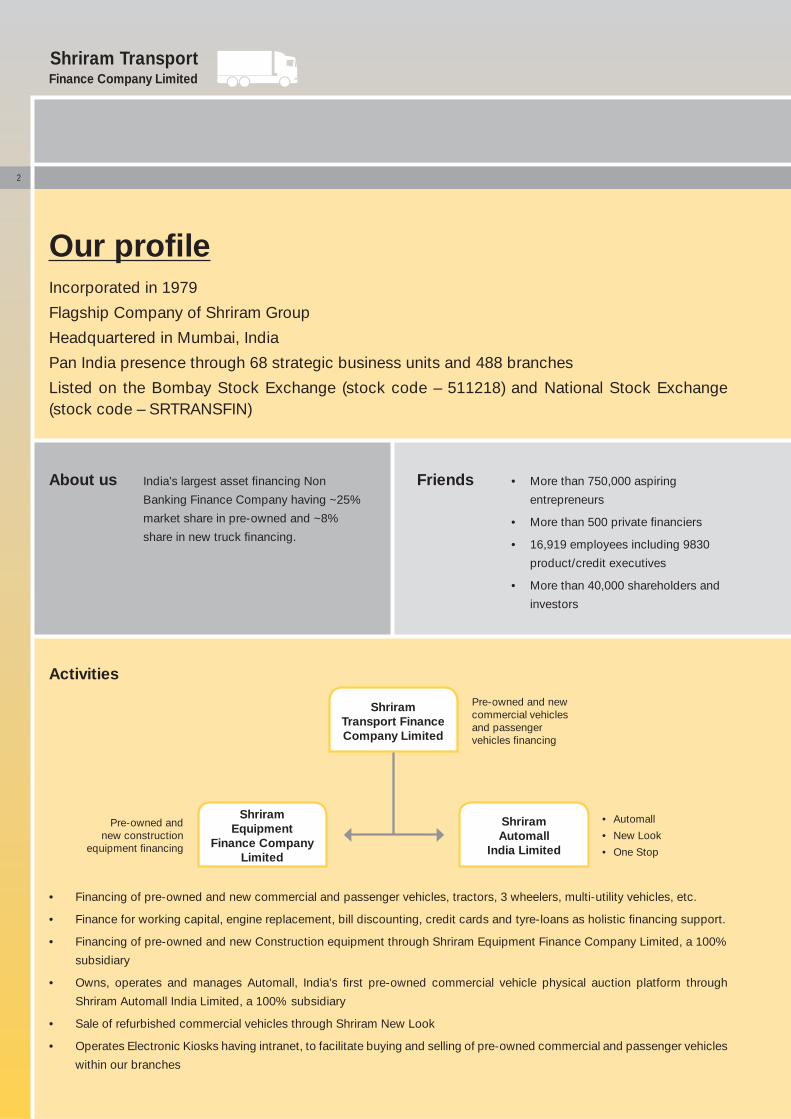
Our profi leIncorporated in 1979
Flagship Company of Shriram Group
Headquartered in Mumbai, India
Pan India presence through 68 strategic business units and 488 branches
Listed on the Bombay Stock Exchange (stock code – 511218) and National Stock Exchange (stock code – SRTRANSFIN)
About us India’s largest asset fi nancing Non
Banking Finance Company having ~25%
market share in pre-owned and ~8%
share in new truck fi nancing.
Friends • More than 750,000 aspiring
entrepreneurs
• More than 500 private fi nanciers
• 16,919 employees including 9830
product/credit executives
• More than 40,000 shareholders and
investors
Activities
• Financing of pre-owned and new commercial and passenger vehicles, tractors, 3 wheelers, multi-utility vehicles, etc.
• Finance for working capital, engine replacement, bill discounting, credit cards and tyre-loans as holistic fi nancing support.
• Financing of pre-owned and new Construction equipment through Shriram Equipment Finance Company Limited, a 100%
subsidiary
• Owns, operates and manages Automall, India’s fi rst pre-owned commercial vehicle physical auction platform through
Shriram Automall India Limited, a 100% subsidiary
• Sale of refurbished commercial vehicles through Shriram New Look
• Operates Electronic Kiosks having intranet, to facilitate buying and selling of pre-owned commercial and passenger vehicles
within our branches
Pre-owned and new commercial vehicles and passenger vehicles fi nancing
• Automall
• New Look
• One Stop
Pre-owned and new construction
equipment fi nancing
Shriram Automall
India Limited
Shriram Equipment
Finance Company Limited
Shriram Transport Finance Company Limited
2
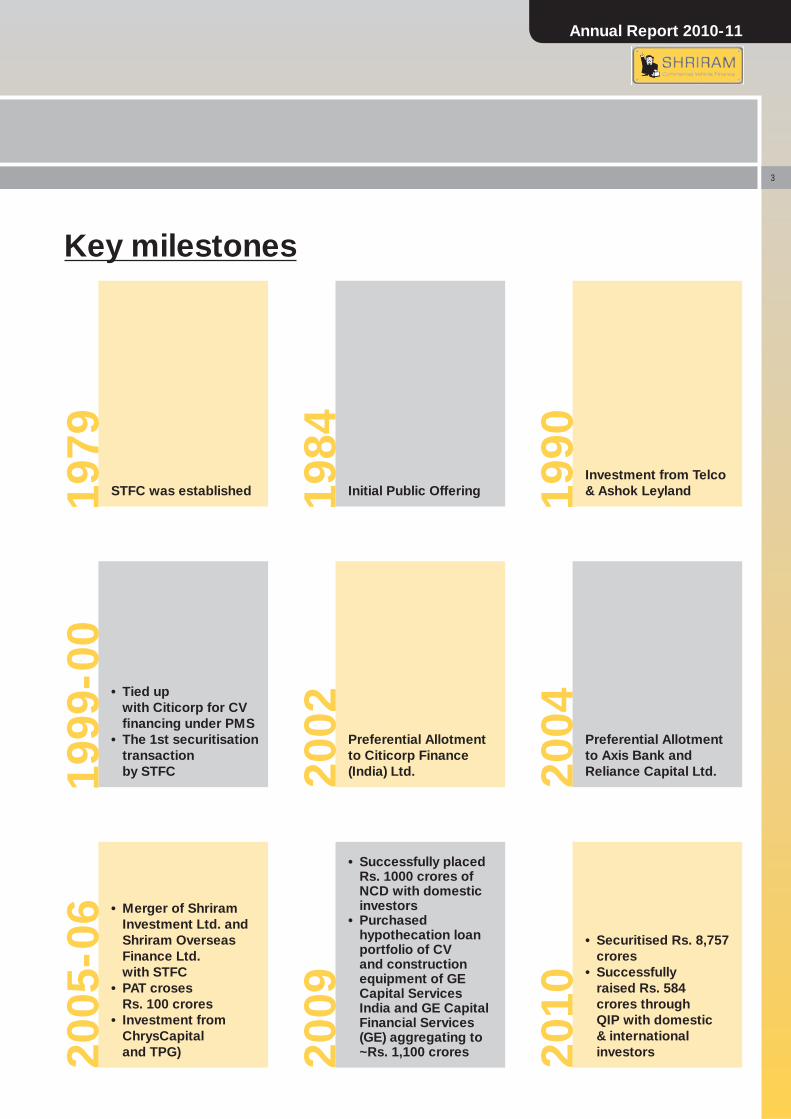
Key milestones
1984
Initial Public Offering1979
STFC was established 1990
Investment from Telco & Ashok Leyland
2002 Preferential Allotment
to Citicorp Finance (India) Ltd.19
99-0
0
• Tied up with Citicorp for CV fi nancing under PMS
• The 1st securitisation transaction by STFC 20
04 Preferential Allotment to Axis Bank and Reliance Capital Ltd.
2009
• Successfully placed Rs. 1000 crores of NCD with domestic investors
• Purchased hypothecation loan portfolio of CV and construction equipment of GE Capital Services India and GE Capital Financial Services (GE) aggregating to ~Rs. 1,100 crores20
05-0
6 • Merger of Shriram Investment Ltd. and Shriram Overseas Finance Ltd. with STFC
• PAT croses Rs. 100 crores
• Investment from ChrysCapital and TPG) 20
10
• Securitised Rs. 8,757 crores
• Successfully raised Rs. 584 crores through QIP with domestic & international investors
3
Annual Report 2010-11
Finance Company Limited
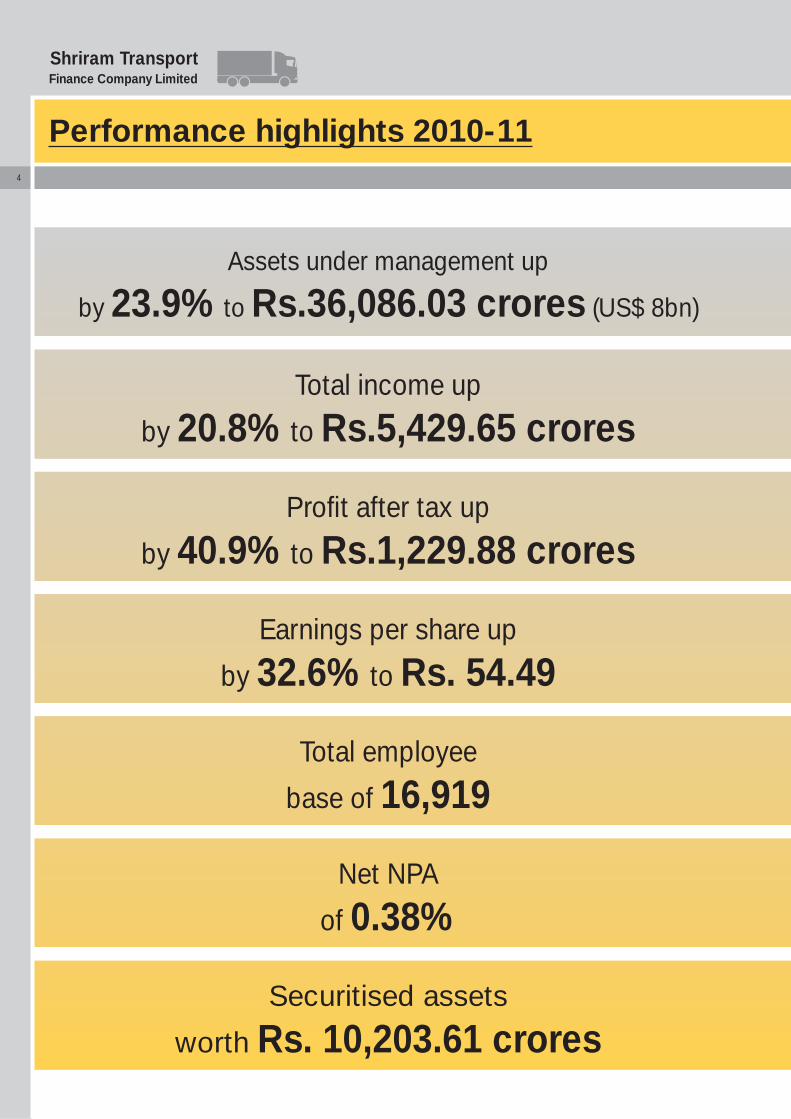
Performance highlights 2010-11
Shriram Transport
Assets under management up
by 23.9% to Rs.36,086.03 crores (US$ 8bn)
Total income up
by 20.8% to Rs.5,429.65 crores
Profi t after tax up
by 40.9% to Rs.1,229.88 crores
Earnings per share up
by 32.6% to Rs. 54.49
Total employee
base of 16,919
Net NPA
of 0.38%
Securitised assets
worth Rs. 10,203.61 crores
4
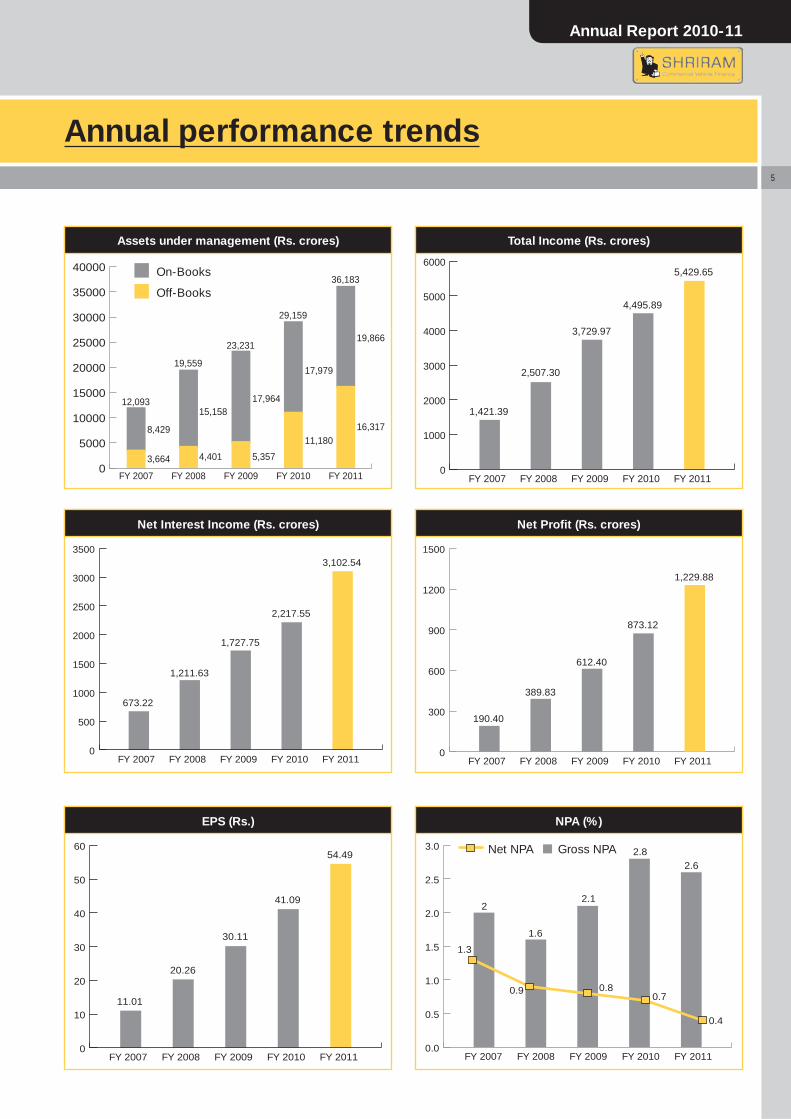
Annual performance trends
Net Interest Income (Rs. crores)
0
500
1000
1500
2000
2500
3000
3500
FY 2007
673.22
1,211.63
1,727.75
2,217.55
3,102.54
FY 2008 FY 2009 FY 2010 FY 2011
EPS (Rs.)
0
10
20
30
40
50
60
FY 2007
11.01
20.26
30.11
41.09
54.49
FY 2008 FY 2009 FY 2010 FY 2011
Total Income (Rs. crores)
0
1000
2000
3000
4000
5000
6000
FY 2007
1,421.39
2,507.30
3,729.97
4,495.89
5,429.65
FY 2008 FY 2009 FY 2010 FY 2011
Assets under management (Rs. crores)
On-Books
Off-Books
0
5000
10000
15000
20000
25000
30000
35000
40000
8,429
15,158
4,401 5,357
17,964
17,979
11,18016,317
19,866
3,664
FY 2007
12,093
FY 2009
23,231
FY 2010
29,159
FY 2011
36,183
FY 2008
19,559
Net Profi t (Rs. crores)
0
300
600
900
1200
1500
FY 2007
190.40
389.83
612.40
873.12
1,229.88
FY 2008 FY 2009 FY 2010 FY 2011
NPA (%)
Gross NPANet NPA
0.0
0.5
1.0
1.5
2.0
2.5
3.0
FY 2007 FY 2008 FY 2009 FY 2010 FY 2011
1.3
2
1.6
2.1
2.82.6
0.9 0.80.7
0.4
5
Annual Report 2010-11
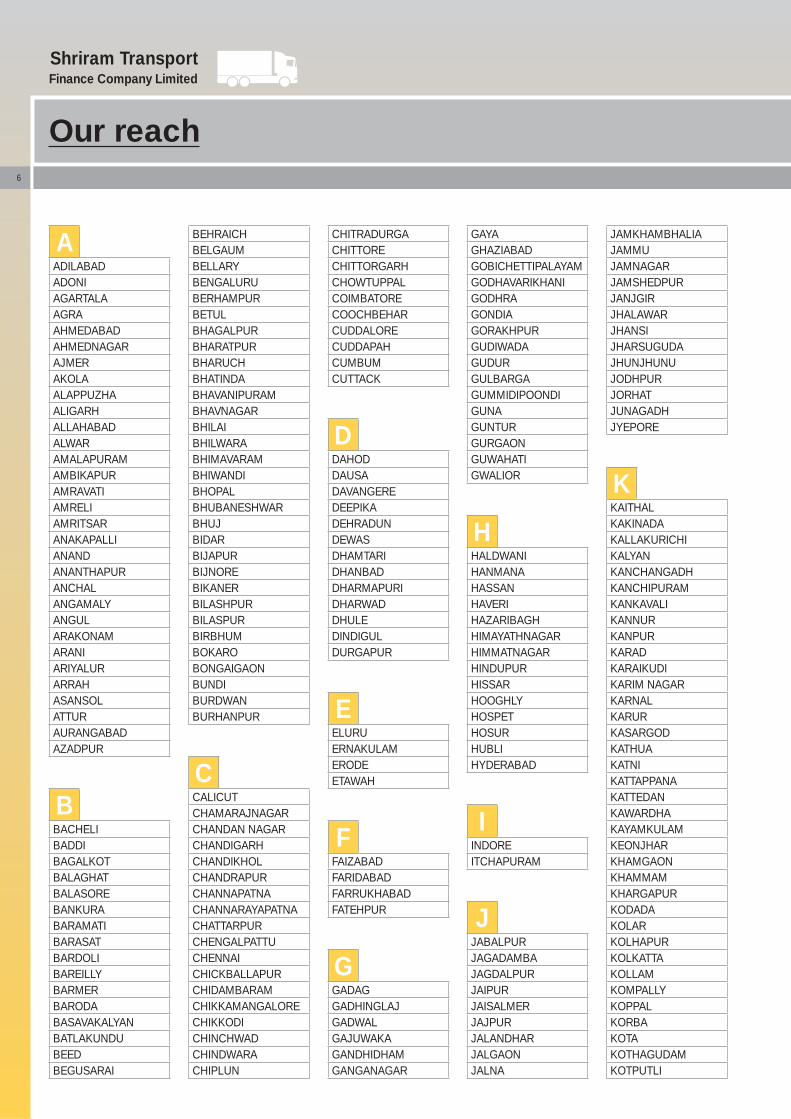
AADILABADADONIAGARTALAAGRAAHMEDABADAHMEDNAGARAJMERAKOLAALAPPUZHAALIGARHALLAHABADALWARAMALAPURAMAMBIKAPURAMRAVATIAMRELIAMRITSARANAKAPALLIANANDANANTHAPURANCHALANGAMALYANGULARAKONAMARANIARIYALURARRAHASANSOLATTURAURANGABADAZADPUR
BBACHELIBADDIBAGALKOTBALAGHATBALASOREBANKURABARAMATIBARASATBARDOLIBAREILLYBARMERBARODABASAVAKALYANBATLAKUNDUBEEDBEGUSARAI
Finance Company Limited
Our reach
BEHRAICHBELGAUMBELLARYBENGALURUBERHAMPURBETULBHAGALPURBHARATPURBHARUCHBHATINDABHAVANIPURAMBHAVNAGARBHILAIBHILWARABHIMAVARAMBHIWANDIBHOPALBHUBANESHWARBHUJBIDARBIJAPURBIJNOREBIKANERBILASHPURBILASPURBIRBHUMBOKAROBONGAIGAONBUNDIBURDWANBURHANPUR
CCALICUTCHAMARAJNAGARCHANDAN NAGARCHANDIGARHCHANDIKHOLCHANDRAPURCHANNAPATNACHANNARAYAPATNACHATTARPURCHENGALPATTUCHENNAICHICKBALLAPURCHIDAMBARAMCHIKKAMANGALORECHIKKODICHINCHWADCHINDWARACHIPLUN
CHITRADURGACHITTORECHITTORGARHCHOWTUPPALCOIMBATORECOOCHBEHARCUDDALORECUDDAPAHCUMBUMCUTTACK
DDAHODDAUSADAVANGEREDEEPIKADEHRADUNDEWASDHAMTARIDHANBADDHARMAPURIDHARWADDHULEDINDIGULDURGAPUR
EELURUERNAKULAMERODEETAWAH
FFAIZABADFARIDABADFARRUKHABADFATEHPUR
GGADAGGADHINGLAJGADWALGAJUWAKAGANDHIDHAMGANGANAGAR
GAYAGHAZIABADGOBICHETTIPALAYAMGODHAVARIKHANIGODHRAGONDIAGORAKHPURGUDIWADAGUDURGULBARGAGUMMIDIPOONDIGUNAGUNTURGURGAONGUWAHATIGWALIOR
HHALDWANIHANMANAHASSANHAVERIHAZARIBAGHHIMAYATHNAGARHIMMATNAGARHINDUPURHISSARHOOGHLYHOSPETHOSURHUBLIHYDERABAD
IINDOREITCHAPURAM
JJABALPURJAGADAMBAJAGDALPURJAIPURJAISALMERJAJPURJALANDHARJALGAONJALNA
JAMKHAMBHALIAJAMMUJAMNAGARJAMSHEDPURJANJGIRJHALAWARJHANSIJHARSUGUDAJHUNJHUNUJODHPURJORHATJUNAGADHJYEPORE
KKAITHALKAKINADAKALLAKURICHIKALYANKANCHANGADHKANCHIPURAMKANKAVALIKANNURKANPURKARADKARAIKUDIKARIM NAGARKARNALKARURKASARGODKATHUAKATNIKATTAPPANAKATTEDANKAWARDHAKAYAMKULAMKEONJHARKHAMGAONKHAMMAMKHARGAPURKODADAKOLARKOLHAPURKOLKATTAKOLLAMKOMPALLYKOPPALKORBAKOTAKOTHAGUDAMKOTPUTLI
Shriram Transport
6
KOTTAYAMKOVILPATTIKRISHNAGIRIKRISHNANAGARKUKATPALLYKULLUKUMBAKONAMKUMTAKUNDAPURKUNNAMKULAMKURNOOL
LL B NAGARLAKHIMPURLATURLLKALLUCKNOWLUDHIANA
MMACHILIPATNAMMADANAPALLIMADGAONMADHURAWADAMADIKERIMADIWALAMADURAIMALDAMALEGAONMANCHERIALMANDAPETAMANDIMANGALOREMANJERIMARKAPURAMMARTHALLIMARTHANDAMMAYILADITHURAIMEHBOOB NAGARMEHSANAMELURMETTUPALAYAMMETTURMIRYALAGUDAMOGAMORADABADMORBIMORENA
MOTIHARIMUDBIDIRIMUMBAIMURSHIDABAD MUZAFFARPURMYSORE
NNADIADNAGERCOILNAGOLENAGOURNAGPURNAMAKKALNANDEDNANDIGAMANANDURBARNANDYALNARSIPATNAMNASHIKNAVI MUMBAINAVSARINEEMUCHNELLORENEW DELHINEYYATINKARANIRMALNIZAMABAD
OONGOLEOOTYOSMANABADOTTANCHATRAM
PPADIPALAKKADPALANIPALANPURPALAYAMKOTTAIPANDARPURPANJIMPARAMAKUDIPARBHANIPARVATHIPURAMPATAN
PATHANAMTHITTAPATHANKOTPATNAPENDURTHIPIDUGURALLAPOLLACHIPONDICHERRYPORBANDERPRODDATURPUDUKOTTAIPUNEPURIPURNEAPUSADPUTTUR
RRAI BAREILLYRAICHURRAIGARHRAIPURRAJAMUNDRYRAJAPALAYAMRAJKOTRAJNANDGAONRAJPIBLARAJSAMAND RANCHIRANIPETRATLAMRATNAGIRIRAYGADARENUKOOTREWAROHAROHTAKROURKELA
SSADULPURSAGARSAGARASAHIBABADSALEMSALURSAMBALPURSANDURSANGAGIRISANGAMNER
SANGAREDDYSANGLISANGRURSARAIPALLISATARASATNASAWAI MADHOPURSECUNDERABADSENDHWASHAHAPURSHAHDOLSHAHJAHANPURSHIMLASHIMOGASHIVPURISHRIRAMPURSIKARSILCHAR SILIGURISINDHANURSINGARAYAKONDASIRMOUR SIROHISIVAKASISOLAPURSRIGANGANAGARSRIKAKULAMSRINAGARSULTANPURSULTHAN BATHERYSULURSURATSURENDRANAGAR
TTADEPALLIGUDEMTADIPATRITAMBARAMTANJAVURT DASARAHALLITENALITENKASITEZPURTHALASSERYTHANETHENITHIRUCHENGODETHIRUPPATHURTHIRUVALLURTINDIVANAMTINSUKHIA
TIPTURTIRUCHENDURTIRUNELVELITIRUPATHITIRUPURTIRURTIRUVANNAMALAITIRUVARURTIRUVOTRIYURTRICHURTRICHYTRIVANDRUMTUMKURTUTICORIN
UUDAIPURUDHAMPURUDUPIUJJAINUNA
VVAPIVARANASIVATAKARAVELLOREVIJAYAWADAVILLUPURAMVIRUDHACHALAMVIRUDHUNAGERVISAKAPATNAMVIZIANAGARAM
WWADIWADKHALWAIDHANWARANGALWARDHAWARDHAMAN NAGARWASHIM
YYAMUNANAGARYAVATMAL
7
Annual Report 2010-11
Finance Company LimitedShriram Transport
Management Discussion & Analysis
ECONOMIC OVERVIEW
2010-11 was a year of revival for most of the developed
economies. Global gross domestic product recovered
signifi cantly during 2010 to 3.9 percent on account of dynamic
economic development in emerging markets ofAsia and South
America, the positive effects of government economic stimulus
programs and the restocking of industrial inventories. Other
growth impetus resulted from the worldwide rise in demand
for capital goods and the marked revival of international trade,
which particularly allowed export-oriented economies such as
Germany and Japan to recover quickly.
However, developed economies in Europe continued to
grapple with higher debts, even as the emerging nations
continued to improve their economic clout. In the wake of the
crisis, power has shifted from the once-unshakable developed
world to rapidly growing nations such as India and China,
whoseconsumption power is leading the global recovery.
INDIAN ECONOMY OVERVIEW
According to the Economic Survey 2010-11, India’s economy
was likely to grow by 8.6 percent during 2010-11 on the back
of robust agricultural growth, rising output in services sector
and stable industrial production. Robust growth and steady
fi scal consolidation have been the hallmark of the Indian
economy in the year 2010-11 so far. However food infl ation,
higher commodity prices and volatility in global commodity
markets have been a cause of concern underscoring the need
for fi scal consolidation and stronger reserves.
COMMERCIAL VEHICLE INDUSTRY OVERVIEW
The total commercial vehicle (CV) segment accounts for about
only 5 percent of total automobile sales in India. The Indian
Commercial Vehicle (CV) Industry is the lifeline of the economy.
Approximately 66 percent of the goods and 87 percent of the
passenger traffi c in the country moves via road. The trends
have clearly indicated that the CV demand is closely correlated
with GDP growth rate (more strongly with the Index of Industrial
Production, IIP) of the country and therefore, it is believed
that a growth or slowdown in CV demand is a harbinger of
an upturn or down turn in the economy respectively. The CVs
can be classifi ed on the basis of their Gross Vehicular Weight
(GVW) as Light Commercial Vehicles (LCV) or Medium & Heavy
Commercial Vehicles (M&HCV), with M&HCVs accounting for
approximately 58 percent of the total domestic CV sales.
The CV industry has evolved tremendously over the years.
From the days of traditional allpurpose 9 tonner trucks; the
industry has moved towards more usage specifi c vehicles.
The developing road infrastructure is giving a push to a
modern Hub & Spoke model of distribution of goods, which in
turn is changing the kind of vehicles being deployed for goods
transportation.
The Industry is now witnessing a clear segmentation in demand,
with vehicles >16.2 tonnes (M&HCVs & Multi Axle vehicles)
being used for transportation on the highways and <= 3.5
tonnes being used for intra-city or last mile transport. Similarly
in case of passenger vehicles there is an increasing demand
for luxury buses from the private players unlike earlier when
the demand used to be largely driven by the State Transport
Undertakings.The CV industry draws its demand from the
economy and hence is prone to cyclicality. However,due to
greater versatility of usage, the LCV demand is less cyclical
than the M&HCV demand.
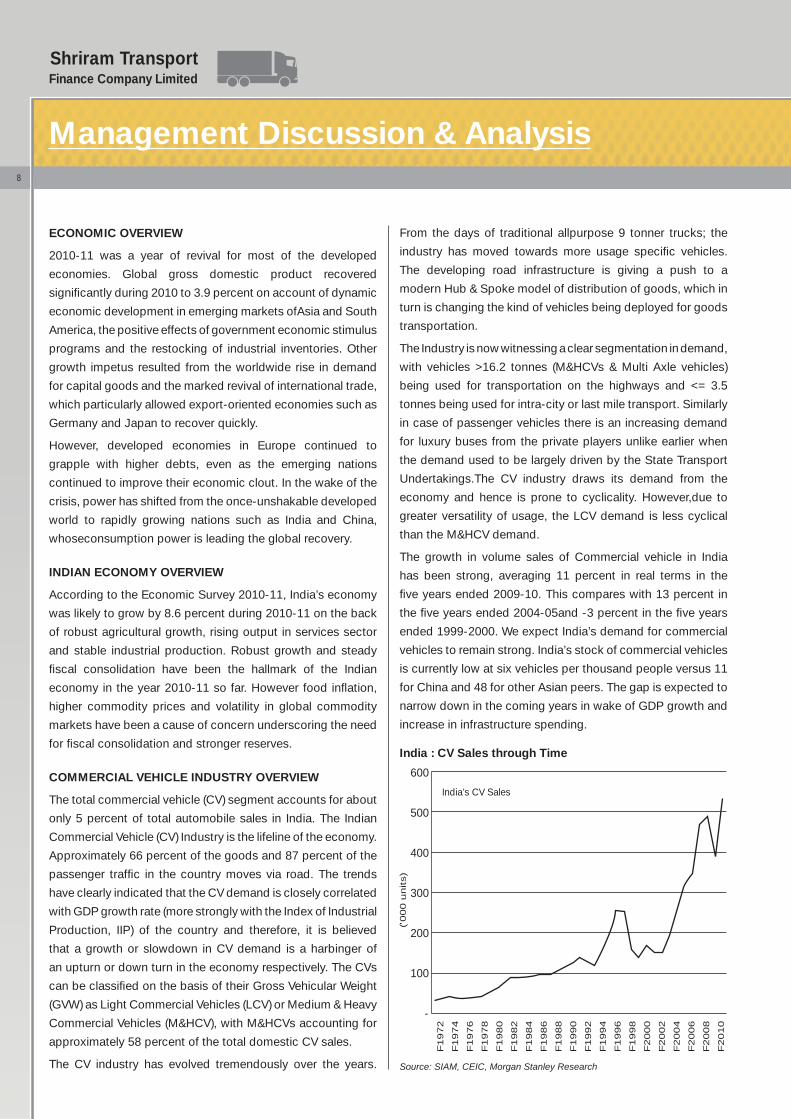
The growth in volume sales of Commercial vehicle in India
has been strong, averaging 11 percent in real terms in the
fi ve years ended 2009-10. This compares with 13 percent in
the fi ve years ended 2004-05and -3 percent in the fi ve years
ended 1999-2000. We expect India’s demand for commercial
vehicles to remain strong. India’s stock of commercial vehicles
is currently low at six vehicles per thousand people versus 11
for China and 48 for other Asian peers. The gap is expected to
narrow down in the coming years in wake of GDP growth and
increase in infrastructure spending.
India : CV Sales through Time
Source: SIAM, CEIC, Morgan Stanley Research
-
100
F1972
India’s CV Sales
(’000 u
nits)
F1974
F1976
F1978
F1980
F1982
F1984
F1986
F1988
F1990
F1992
F1994
F1996
F1998
F2000
F2002
F2004
F2006
F2008
F2010
200
500
400
300
600
8
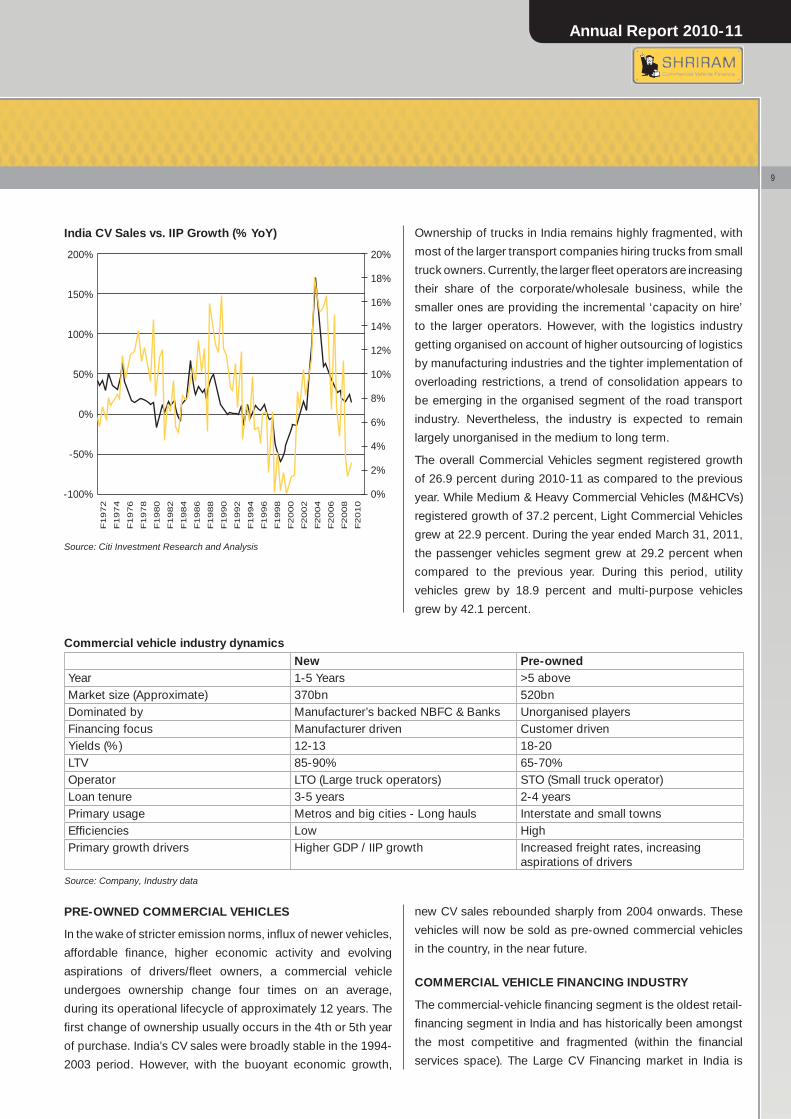
Ownership of trucks in India remains highly fragmented, with
most of the larger transport companies hiring trucks from small
truck owners. Currently, the larger fl eet operators are increasing
their share of the corporate/wholesale business, while the
smaller ones are providing the incremental ‘capacity on hire’
to the larger operators. However, with the logistics industry
getting organised on account of higher outsourcing of logistics
by manufacturing industries and the tighter implementation of
overloading restrictions, a trend of consolidation appears to
be emerging in the organised segment of the road transport
industry. Nevertheless, the industry is expected to remain
largely unorganised in the medium to long term.
The overall Commercial Vehicles segment registered growth
of 26.9 percent during 2010-11 as compared to the previous
year. While Medium & Heavy Commercial Vehicles (M&HCVs)
registered growth of 37.2 percent, Light Commercial Vehicles
grew at 22.9 percent. During the year ended March 31, 2011,
the passenger vehicles segment grew at 29.2 percent when
compared to the previous year. During this period, utility
vehicles grew by 18.9 percent and multi-purpose vehicles
grew by 42.1 percent.
PRE-OWNED COMMERCIAL VEHICLES
In the wake of stricter emission norms, infl ux of newer vehicles,
affordable fi nance, higher economic activity and evolving
aspirations of drivers/fl eet owners, a commercial vehicle
undergoes ownership change four times on an average,
during its operational lifecycle of approximately 12 years. The
fi rst change of ownership usually occurs in the 4th or 5th year
of purchase. India’s CV sales were broadly stable in the 1994-
2003 period. However, with the buoyant economic growth,
Commercial vehicle industry dynamics
New Pre-ownedYear 1-5 Years >5 aboveMarket size (Approximate) 370bn 520bnDominated by Manufacturer’s backed NBFC & Banks Unorganised playersFinancing focus Manufacturer driven Customer drivenYields (%) 12-13 18-20LTV 85-90% 65-70%Operator LTO (Large truck operators) STO (Small truck operator)Loan tenure 3-5 years 2-4 yearsPrimary usage Metros and big cities - Long hauls Interstate and small townsEffi ciencies Low HighPrimary growth drivers Higher GDP / IIP growth Increased freight rates, increasing
aspirations of drivers
Source: Company, Industry data
new CV sales rebounded sharply from 2004 onwards. These
vehicles will now be sold as pre-owned commercial vehicles
in the country, in the near future.
COMMERCIAL VEHICLE FINANCING INDUSTRY
The commercial-vehicle fi nancing segment is the oldest retail-
fi nancing segment in India and has historically been amongst
the most competitive and fragmented (within the fi nancial
services space). The Large CV Financing market in India is
India CV Sales vs. IIP Growth (% YoY)
Source: Citi Investment Research and Analysis
F1972
F1974
F1976
F1978
F1980
F1982
F1984
F1986
F1988
F1990
F1992
F1994
F1996
F1998
F2000
F2002
F2004
F2006
F2008
F2010
200% 20%
18%
16%
14%
12%
10%
8%
6%
4%
2%
0%
150%
100%
50%
0%
-50%
-100%
9
Annual Report 2010-11
Finance Company LimitedShriram Transport
estimated to be Rs. 77,000 crores, of which more than 5-year-
old CV segment accounts for 61 percent. Potential fi nancing
market for Large CVs aged 5-12 years in India is pegged at Rs.
40,000 crores, which also accounts for 35 percent of the total
existing CV population in India. The pre-owned CV segment
accounts for almost 70 percent of the total CV sales as the
industry consists largely of small truck owners/operators that
typically own fewer than fi ve trucks. The fi nancing to these
pre-owned commercial vehicle segments is largely catered to
by unorganised sector.
Traditionally, On account of higher affordability, the pre-
owned commercial vehicle serves as a fi rst step towards
entrepreneurship for the aspiring drivers turned truck-owners.
Private fi nanciers on account of the following factors have
dominated the fi nancing to this asset class:
1. The customer profi le comprising of small road truck
operators and fi rst time users is perceived to be risky
on account of their being highly mobile and having poor
banking habits. Most of the SRTOs and FTUs use the
fi nanced commercial vehicles as their only means of
sustenance and earnings. The nature of engagement
makes them highly mobile along with the asset, creating
a challenge to ensure track of the customer and/or the
asset fi nanced. Adding to this is the fact, that since these
vehicle owners always get paid for their services in cash,
they have a deep-rooted culture of transacting in cash. As
a result of the aforementioned challenges, the customer
segment doesn’t meet any of the traditionally followed
credit criteria.
2. Absence of recognised platform for trading of pre-owned
commercial vehicles have resulted in lack of established
asset valuation norms, and vice-versa. This has lead to
perceived asset-liability mismatch risk for the organised
fi nanciers.
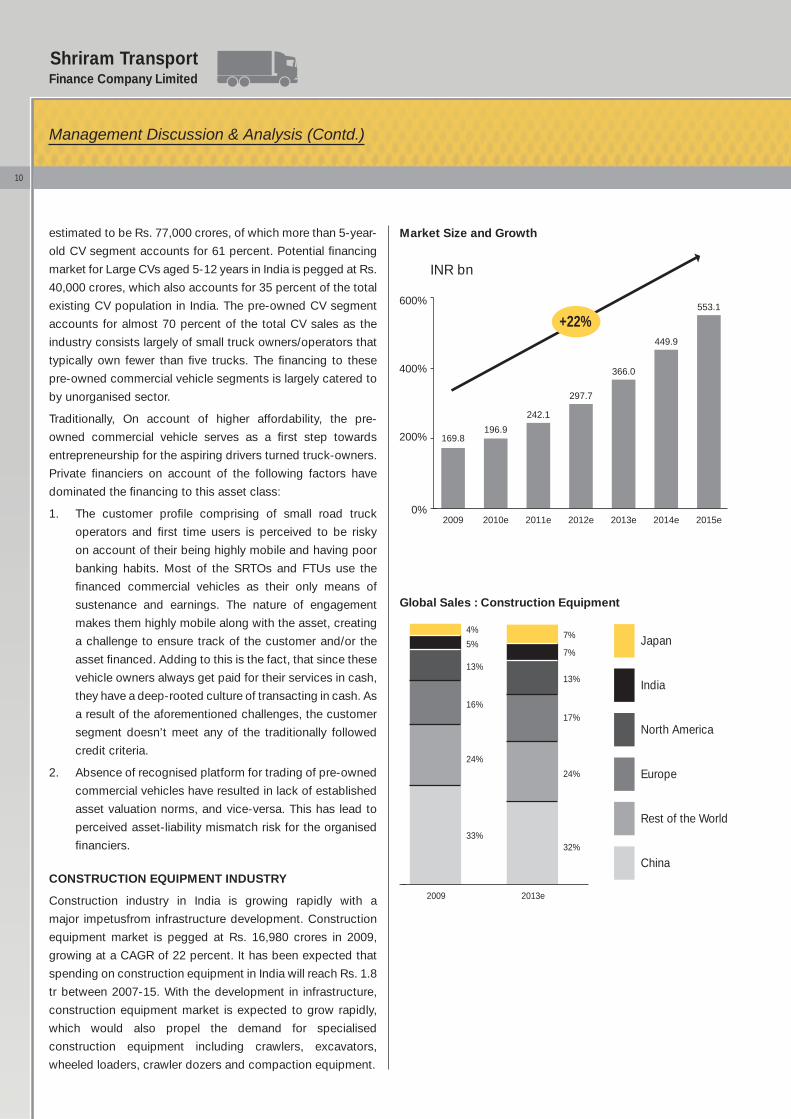
CONSTRUCTION EQUIPMENT INDUSTRY
Construction industry in India is growing rapidly with a
major impetusfrom infrastructure development. Construction
equipment market is pegged at Rs. 16,980 crores in 2009,
growing at a CAGR of 22 percent. It has been expected that
spending on construction equipment in India will reach Rs. 1.8
tr between 2007-15. With the development in infrastructure,
construction equipment market is expected to grow rapidly,
which would also propel the demand for specialised
construction equipment including crawlers, excavators,
wheeled loaders, crawler dozers and compaction equipment.
Management Discussion & Analysis (Contd.)
Market Size and Growth
2009
169.8196.9
2010e
242.1
2011e
297.7
2012e
366.0
2013e
449.9
2014e
553.1
2015e
600%
INR bn
400%
200%
0%
+22%
Global Sales : Construction Equipment
2013e
32%
24%
17%
13%
7%
7% Japan
India
North America
Europe
Rest of the World
China
2009
33%
24%
16%
13%
5%
4%
10
Government of India has allocated INR 1.66 tr (2010-11)
to infrastructure growth indicating strong commitment to
the development of infrastructure in India. Construction
expenditure will increase by Rs. 1,218,900 crores from 2008-
09 to 2012-13 on account of government expenditure.
EQUIPMENT RENTALS
• Large construction projects require deployment of heavy
equipment, so purchase of such equipment will only
addcost to the company
• Equipment rental or leasing contributes towards
signifi cant cost savings
• Rental business in India is considered to be at a very
nascent stage
• Estimated share of equipment sold to rental companies
is 10 percent in India as compared to 50 percent in
developed countries
• With growing infrastructure development specially from
road, power and port equipment rental will also witness
strong growthin the near future
• Equipment rental industry in India is highly fragmented
with an estimated 10,000 unorganised small players
• Top 10 players together have an estimated market size of
around 30-40 percent of equipment rental in India
The fragmented marketplace coupled with huge potential
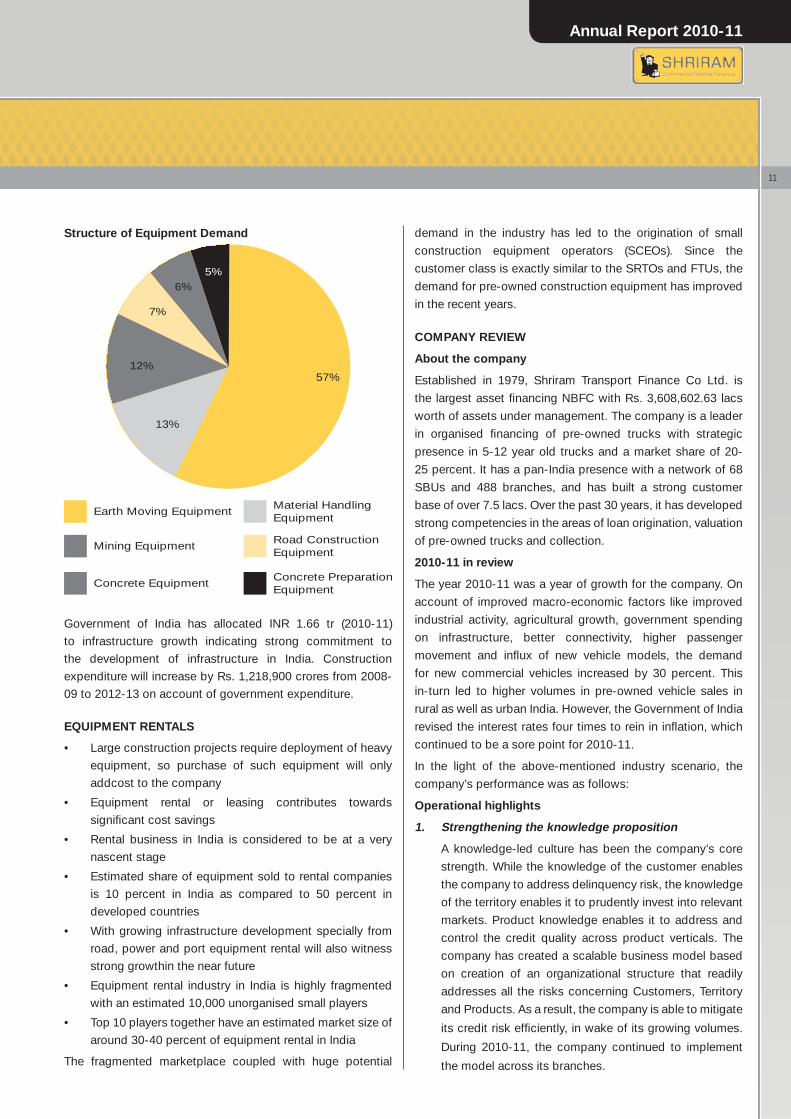
Structure of Equipment Demand demand in the industry has led to the origination of small
construction equipment operators (SCEOs). Since the
customer class is exactly similar to the SRTOs and FTUs, the
demand for pre-owned construction equipment has improved
in the recent years.
COMPANY REVIEW
About the company
Established in 1979, Shriram Transport Finance Co Ltd. is
the largest asset fi nancing NBFC with Rs. 3,608,602.63 lacs
worth of assets under management. The company is a leader
in organised fi nancing of pre-owned trucks with strategic
presence in 5-12 year old trucks and a market share of 20-
25 percent. It has a pan-India presence with a network of 68
SBUs and 488 branches, and has built a strong customer
base of over 7.5 lacs. Over the past 30 years, it has developed
strong competencies in the areas of loan origination, valuation
of pre-owned trucks and collection.
2010-11 in review
The year 2010-11 was a year of growth for the company. On
account of improved macro-economic factors like improved
industrial activity, agricultural growth, government spending
on infrastructure, better connectivity, higher passenger
movement and infl ux of new vehicle models, the demand
for new commercial vehicles increased by 30 percent. This
in-turn led to higher volumes in pre-owned vehicle sales in
rural as well as urban India. However, the Government of India
revised the interest rates four times to rein in infl ation, which
continued to be a sore point for 2010-11.
In the light of the above-mentioned industry scenario, the
company’s performance was as follows:
Operational highlights
1. Strengthening the knowledge proposition
A knowledge-led culture has been the company’s core
strength. While the knowledge of the customer enables
the company to address delinquency risk, the knowledge
of the territory enables it to prudently invest into relevant
markets. Product knowledge enables it to address and
control the credit quality across product verticals. The
company has created a scalable business model based
on creation of an organizational structure that readily
addresses all the risks concerning Customers, Territory
and Products. As a result, the company is able to mitigate
its credit risk effi ciently, in wake of its growing volumes.
During 2010-11, the company continued to implement
the model across its branches.
57%
13%
12%
7%
6%5%
Earth Moving EquipmentMaterial Handling Equipment
Mining EquipmentRoad ConstructionEquipment
Concrete EquipmentConcrete PreparationEquipment
11
Annual Report 2010-11
Finance Company LimitedShriram Transport
2. Expanding the product verticals
The company, being the largest NBFC catering to
the pre-owned commercial vehicle segment, decided
to expand its product offering to cater to its existing
customer profi le comprising of fi rst time users (FTUs) and
small road transport operators (SRTOs). As a result, the
company focused to expand its product profi le to cater to
construction equipment segment and passenger vehicle
segment through its dedicated subsidiaries – Shriram
Equipment Finance Company Limited and Shriram
Automall India Limited.
Construction equipment business
In order to maintain its growth rate, it is imperative for
India to invest into infrastructure creation. In the last
decade, infrastructure has emerged as the single biggest
thrust area for the Indian government since it doesn’t only
ensure smoother movement of people and goods but also
instigates higher consumption in the connected areas. As
a result, the demand for new construction equipment has
been on a rise, further fueling the latent demand for pre-
owned construction equipment. Being a segment having
a common customer profi le, the company forayed into
fi nancing pre-owned construction equipment during 2009-
10. Since the product knowledge required for the segment
is comprehensive, a 100 percent subsidiary Shriram
Equipment Finance Company Limited was incorporated.
The subsidiary company fi nances commercial
construction equipment like forklifts, cranes, loaders etc.
and is managed by an independent team of dedicated
professionals having intensive product expertise. During
its fi rst year of operations (2010-11), Shriram Equipment
Finance Company Limited had made total disbursements
of Rs. 65,643.40 lacs and earned a net profi t of Rs. 115.70
lacs. The company had Assets under Finance of Rs.
63,416.10 lacs as on March 31, 2011.
Passenger vehicles
The company has been providing asset fi nance for the
last three decades. It has enabled more than a million
aspiring individuals to emerge as entrepreneurs. Some of
the customers of the company, graduated to fl eet-owners
– fi rst moving from pre-owned to new commercial vehicles
and then from trucks to other commercial vehicles, such
as passenger buses. As a result, the company continued
to fi nance its established customers across related asset
class. With the advent of superior roads and highways,
the quality of passenger vehicles has improved and the
sector witnessed increased demand for luxury buses
and coaches. To capitalize on the opportunity, the
company created a dedicated product vertical headed
by experienced team of professionals, thereby not only
scaling up the vertical but also protecting the asset
quality in the process.
Auto Malls
During the year under review, the company inaugurated
its fi rst Automall in Chennai, Tamil Nadu. The Automall is
spread across 5 acres (0.2m sqft) of area, about 50km
from the city of Chennai on NH-45. It is the fi rst-of-its-
kind mall that offers a platform for the potential buyers
and sellers to meet and decide the value of the vehicle
based on a public auction. During the inaugural auction,
120 vehicles successfully changed ownership. The
auction process not only makes the valuation of assets
a transparent exercise but also results in assurance for
buyer of the vehicle relating to the vehicle’s title, quality
and performance. The Automalls are owned and managed
by company’s 100 percent owned subsidiary – Shriram
Automall India Limited. The Automalls would hold periodic
auctions of pre-owned CVs that have been repossessed
by Shriram Transport and other fi nancing companies.
While the company would earn a fee-based income
from each vehicle auctioned, it will also gain access to
a ready consumer base for vehicle fi nancing. Above all,
the initiative would enable the company to institutionalize
the valuation practices and create a valuation benchmark
for pre-owned commercial vehicles. The company would
open 50-60 Automalls within next twelve months, each
with a parking capacity of 250 vehicles across India.
Shriram New Look
Average age of a commercial vehicle is about 15 years.
Normally, a commercial vehicle fi rst changes ownership
in the 4th or 5th year of its fi rst purchase. In few cases,
some commercial vehicles can fetch better valuation for
the seller when a few maintenance issues are tackled.
In other words, the incremental value of a refurbished
vehicle can exceed the cost of refurbishment. To address
such segment, the company has introduced Shriram New
Look, owned and managed by company’s subsidiary –
Shriram Automall India Limited. This facility is available
within the Automalls and is managed by a dedicated
team. It enables the company to bid for an asset in the
auction process. Once the company wins the bid for
the asset, it would invest on refurbishing the asset and
ultimately sell the same under its own brand name.
Management Discussion & Analysis (Contd.)
12
Electronic kiosks
The company has successfully installed electronic kiosks
across all its branches during the year under review.
These electronic kiosks enable the intended sellers to
register their vehicle details though an intranet portal.
The details alongwith the photographs of the vehicles are
made available on the electronic kiosks to the potential
buyers seeking the vehicle. This also acts as a point
of origination for fi nancing proposals and also offers
confi dence to the buyers and sellers of the asset.
3. Securing low cost funds to propel future growth
The company’s main raw material is funds at competitive
rates. The ability of the company to access funds and
competitive rates and lend it at better rates drives its
profi tability. During 2010-11 the company initiated a fund
raising programme resulting in infusion of Rs. 500 crores
into the company. Further, owing to its ability to securitise
its receivables, the company continued to reduce its
average cost of funds, despite increase in interest rates
throughout the year.
4. Expanding reach
The company continued to expand its reach and as
on March 31, 2011 had 488 branches pan-India. The
company continued to strengthen its network also
through private fi nanciers through fi duciary relationship.
As on March 31, 2010, the company hadtie-ups with
more than 500 private fi nanciers.
SWOT ANALYSIS
Strengths
• The pioneer in the pre-owned commercial vehicles
fi nancing sector
• Knowledge-driven (products as well as local customers)
and relationship-based business model
ADVANTAGES OF AUTOMALLS
1. Results in fee-based income
2. Offers origination opportunity as it can fund the sale while brokering the deal
3. Ease of liquidation of re-processed stock
4. Helps realise better value
• Signifi cant expertise and experience in valuation of pre-
owned CVs as well as in recovery/collection of monthly
payments from customers
• Pan-India presence with 488 branch offi ces all over the
country.
• A well-defi ned and scalable organization structure,
capable of supporting surging growth
• Low delinquency as assets are backed with adequate
cover and are easy to repossess with immediate
liquidity.
• Strong fi nancial track record driven by fast growth in
AUM with low Non Performing Assets (NPAs)
• Experienced and stable management team
• Strong relationships with public, private as well as foreign
banks, institutions and investors.
Weaknesses
• The Company’s business and its growth are directly linked
to the GDP growth of the country. Any slowdown in GDP
growth may have a negative impact on the business.
Opportunities
• Growth in the CV market driven by the economic growth
and the infrastructure development in the country
• Strong demand for construction equipment
• Strong demand for passenger CVs
• Strong demand for pre-owned tractors
• Loans for working capital requirements of CV users
• Partnerships with private fi nanciers will enable the
Company to enhance its reach without signifi cant
investments in building infrastructure
Threats
• Maintaining relationships with customers who are mobile
and have no proper documentation
• Maintaining asset quality
• Regulatory changes in the NBFC and transportation
sectors
FINANCIAL PERFORMANCE
During the year 2010-11, the Company’s total income
increased by 20.8 percent to Rs. 542,965.40 lacs as compared
to Rs. 449,588.96 lacs in 2009-10. The Company’s PAT also
increased by 40.9 percent to Rs. 122,988.00 in 2010-11, from
Rs. 87,311.74 lacs in 2009-10. The Gross NPAs and net NPAs
for the year 2010-11 were 2.64 percent and 0.38 percent
respectively. The Company’s net spread for the year under
review stood at 6.3 percent.
13
Annual Report 2010-11
Finance Company LimitedShriram Transport
Capital Adequacy Ratio (CAR)
The Company maintained a CAR of 24.85 percent during 2010-
11, as against a minimum 12 percent as required by RBI norms.
Borrowing profi le
The Company’s total external borrowings increased from Rs.
1,845,990.96 lacs as of March 31, 2010to Rs. 1,988,171.30
lacs as of March 31, 2011. The company has a strategic mix
of retail deposits and institutional funding with retail liabilities
constituting 22.4 percent of the total external borrowings
(against 17.7 percent as of March 31, 2010) and loans from
banks and institutions accounting for 77.6 percent (against
82.3 percent as of March 31, 2010).
Assets Under Management (AUM)
The total Assets Under Management (AUM) for 2010-11stood
at Rs. 3,608,602.63 lacs, as compared to Rs. 2,912,229.73
lacs; registering a growth of 23.9 percent over 2009-10. 75.5
percent of the total AUM was related to the pre-owned CV
category and the remaining 24.5 percent accounted for the
new CV vehicle category.
Securitisation
During 2010-11, the company surpassed Rs. 10,000 crores
mark by securitizing assets worth Rs. 10,203.61 crores as
compared to Rs. 875,681.03 lacs in 2009-10. As a percentage
of total AUM, the securitised assets accounted for 45.2 percent.
The securitization of assets enables the company to mitigate
the interest risk by converting its fl oating liability to fi xed price
liability. The outstanding securitised assets portfolio stood at
Rs. 1,631,702.24 lacs as on March 31, 2011.
Internal control systems and their adequacy
In any industry, the processes and internal control systems
play a critical role in the health of the Company. The Company’s
well-defi ned organisational structure, documented policy
guidelines, defi ned authority matrix and internal controls ensure
effi ciency of operations, compliance with internal policies
and applicable laws and regulations as well as protection of
resources. Moreover, the Company continuously upgrades
these systems in line with the best available practices. The
internal control system is supplemented by extensive internal
audits, regular reviews by management and standard policies
and guidelines to ensure reliability of fi nancial and all other
records to prepare fi nancial statements and other data.
The Audit Committee of the Board reviews internal audit
reports given along with management comments. The Audit
Committee also monitors the implemented suggestions.
Material developments in human resources
Human resources are an integral and important part of any
organisation and for the Company whose business model is
relationship-based, its people are the key to its success and
growth. Thus, the Company has put in place sound policies
for the growth and progress of its employees. These include
defi nite performance-based incentive plans and an Employee
Stock Option Plan (ESOP) for eligible employees. The
Company also recognises the importance of providing training
and development opportunities to its people to enhance their
skills and experience, which in turn enables the Company to
achieve its business objectives. As of March 31, 2011, the
Company had 16,919 employees on its payrolls including
9,830 product/credit executives.
RISKS AND CONCERNS
Economy risk
A slowdown in the economy has a direct impact on the sale
of CVs.
Risk mitigation
• An economic slowdown generally affects the new CV
industry.
• The pre-owned CV market remains largely unaffected
because of the unique customers as well as lower deal
size
• Close to 76 percent of the Company’s total portfolio
consists of pre-owned CVs
• Further, the Company has also initiated measures to
diversify its portfolio by entering construction equipment,
tractors, passenger CVs, working capital requirements of
CV owners, etc.
HUMAN RESOURCE RISK
In a relationship-based business, any attrition at the key
managerial level or at the fi eld staff level poses a risk of losing
business.
Risk mitigation
• The company has created a successful and scalable
business model by putting people fi rst
• The company ensures a progressive career path for each
of its employees
• High levels of inter-departmental and intra-departmental
transparency allows speedy resolution of the employees’
concerns
Management Discussion & Analysis (Contd.)
14
• Performance linked remuneration coupled with ESOPs
help in retaining talent
• Continuous efforts for training and development of all
personnel across departments
• The attrition rate in the Company is amongst the lowest
in the industry
INTEREST RATE RISK
While the Company borrows at both fi xed and fl oating rates,
it lends at a fi xed rate. If the Company has a large proportion
of borrowings at a fl oating rate, a sharp fl uctuation in interest
rate may lead to a reduction in the Company’s net interest
margin. Higher interest cost would also lead to a higher cost of
lending which may reduce the attractiveness of the Company
for borrowers and affect the Company’s ability to grow its
business.
Risk mitigation
• The company’s insights on product valuation enable it to
lend judiciously
• Majority of the Company’s loan portfolio qualify as Priority
Sector assets for banks, which enables the Company to
raise funds at lower costs.
• The Company also enjoys high credit ratings for its long
term (AA+ from CARE and AA from CRISIL) as well as
short term (F1+ from Fitch and P1+ from CRISIL) credit
requirements
• Given its long standing relationship with banks and
institutions and an impeccable track record of servicing
its debts in a timely manner, the Company is a preferred
partner for all banks and institutions
ASSET-LIABILITY MISMATCH RISK
If the Company uses short-term liabilities to fund long term
assets, it could result in a liquidity crunch affecting the
Company’s ability to service loans and fund overheads.
Risk mitigation
• The Company never employs short term borrowings into
long term lending
• The Company is also increasing its proportion of long-
term loans by borrowing from the retail sector and raises
funds through the securitisation route.
• A prudent borrowing strategy enabled the Company to
service all its debts on time during the year
CASH MANAGEMENT RISK
Almost two-thirds of the Company’s total monthly collections
are in the form of cash, due to the underdeveloped banking
habits of SRTOs. Lack of proper cash management can lead
to a loss for the Company.
Risk mitigation
• The Company has connected nearly all its branches to
the cash management network.
• Novel cash management checks are employed at every
level and regular audits are conducted to ensure the
highest levels of compliance.
• A strong cross referral system is employed across levels
and profi t centres.
• Disbursed loans are continuously monitored to avoid a
default.
• The Company also ensures that its fi eld offi cers make
compulsory monthly visits to borrowers, which help in
managing large cash collections.
CAUTIONARY STATEMENT
This report contains forward looking statements that involve
risks and uncertainties including, but not limited to, risks
inherent in the Company’s growth strategy, dependence on
certain businesses, dependence on the availability of qualifi ed
and trained manpower, economic conditions, government
policies and other factors. Actual results, performances or
achievements could differ materially from those expressed or
implied in such forward-looking statements. This report should
be read in conjunction with the fi nancial statements included
herein and the notes thereto.
15
Annual Report 2010-11
Finance Company LimitedShriram TransportShriram Transport
Directors’ Report
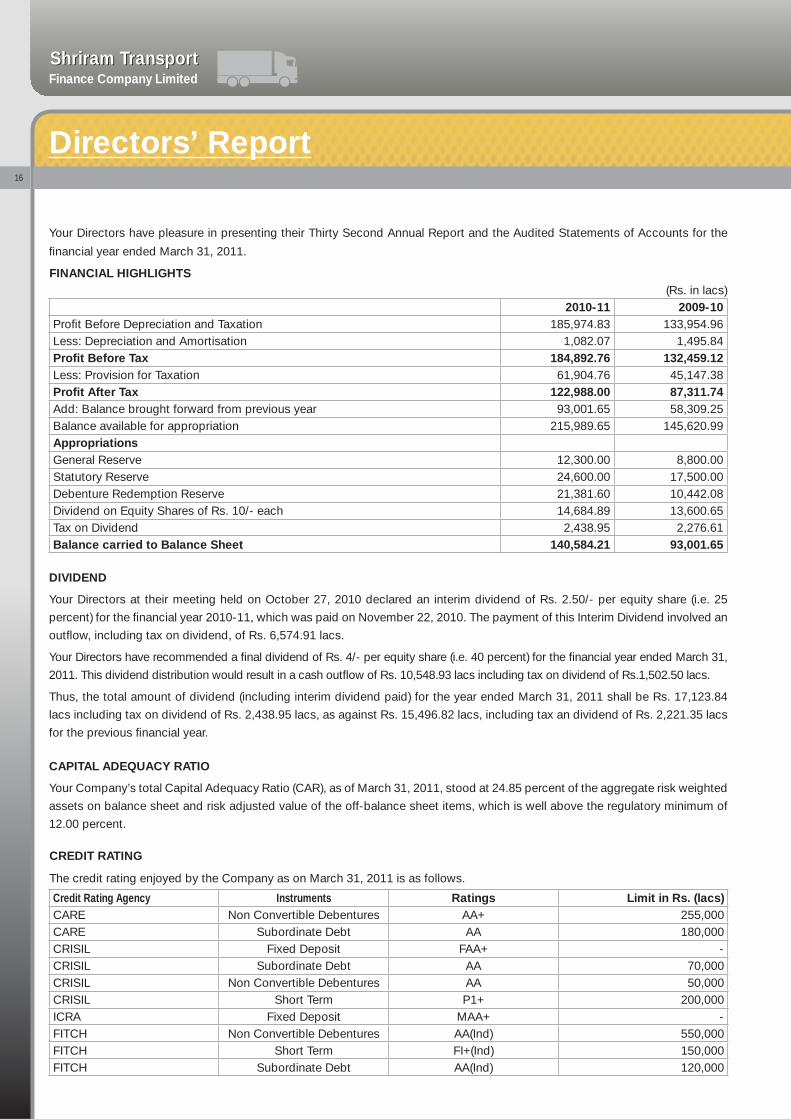
Your Directors have pleasure in presenting their Thirty Second Annual Report and the Audited Statements of Accounts for the
fi nancial year ended March 31, 2011.
FINANCIAL HIGHLIGHTS(Rs. in lacs)
2010-11 2009-10Profi t Before Depreciation and Taxation 185,974.83 133,954.96Less: Depreciation and Amortisation 1,082.07 1,495.84Profi t Before Tax 184,892.76 132,459.12Less: Provision for Taxation 61,904.76 45,147.38Profi t After Tax 122,988.00 87,311.74Add: Balance brought forward from previous year 93,001.65 58,309.25Balance available for appropriation 215,989.65 145,620.99AppropriationsGeneral Reserve 12,300.00 8,800.00Statutory Reserve 24,600.00 17,500.00Debenture Redemption Reserve 21,381.60 10,442.08Dividend on Equity Shares of Rs. 10/- each 14,684.89 13,600.65Tax on Dividend 2,438.95 2,276.61Balance carried to Balance Sheet 140,584.21 93,001.65
DIVIDEND
Your Directors at their meeting held on October 27, 2010 declared an interim dividend of Rs. 2.50/- per equity share (i.e. 25
percent) for the fi nancial year 2010-11, which was paid on November 22, 2010. The payment of this Interim Dividend involved an
outfl ow, including tax on dividend, of Rs. 6,574.91 lacs.
Your Directors have recommended a fi nal dividend of Rs. 4/- per equity share (i.e. 40 percent) for the fi nancial year ended March 31,
2011. This dividend distribution would result in a cash outfl ow of Rs. 10,548.93 lacs including tax on dividend of Rs.1,502.50 lacs.
Thus, the total amount of dividend (including interim dividend paid) for the year ended March 31, 2011 shall be Rs. 17,123.84
lacs including tax on dividend of Rs. 2,438.95 lacs, as against Rs. 15,496.82 lacs, including tax an dividend of Rs. 2,221.35 lacs
for the previous fi nancial year.
CAPITAL ADEQUACY RATIO
Your Company’s total Capital Adequacy Ratio (CAR), as of March 31, 2011, stood at 24.85 percent of the aggregate risk weighted
assets on balance sheet and risk adjusted value of the off-balance sheet items, which is well above the regulatory minimum of
12.00 percent.
CREDIT RATING
The credit rating enjoyed by the Company as on March 31, 2011 is as follows.
Credit Rating Agency Instruments Ratings Limit in Rs. (lacs)CARE Non Convertible Debentures AA+ 255,000CARE Subordinate Debt AA 180,000CRISIL Fixed Deposit FAA+ -CRISIL Subordinate Debt AA 70,000CRISIL Non Convertible Debentures AA 50,000CRISIL Short Term P1+ 200,000ICRA Fixed Deposit MAA+ -FITCH Non Convertible Debentures AA(Ind) 550,000FITCH Short Term FI+(Ind) 150,000FITCH Subordinate Debt AA(Ind) 120,000
16
OPERATIONS
For the fi nancial year ended March 31, 2011, your Company
earned Profi t Before Tax of Rs. 184,892.76 lacs as against
Rs. 132,459.12 lacs of the earlier year, posting an increase
of 39.58 percent year-on-year. The Profi t After Tax of
Rs. 122,988.00 lacs also is 40.86 percent more when compared
to the previous year, which was Rs. 87,311.74 lacs. The total
income for the year under consideration was Rs. 542,965.40
lacs and total expenditure was Rs. 358,072.64 lacs.
The total disbursements made for fi nancing of commercial
vehicles during the year under review were Rs. 1,988,368.64
lacs. As on March 31, 2011, the outstanding hypothecation
loans were Rs. 1,946,414.11 lacs.
During the fi nancial year ended March 31, 2011, the Company
mobilised Rs.119,920.93 lacs through non-convertible
debentures, Rs. 17,981.66 lacs through subordinated debts,
Rs. 61,869.26 lacs through term loans, Rs. 10,650.00 lacs
through working capital loans, Rs. 1,000.00 lacs through
commercial paper and Rs. 1,020,361.35 lacs through
assignment of loan receivables from the customers.
ECONOMIC SCENERIO
The economic meltdown originated in the United States of
America in the year 2008 seems to have enforced a major
shift in the global economic power hierarchy. The timely
support through a series of economic measures and by
active governmental monitoring of the fi nancial health, the
Indian economy registered speedy recovery. Weathering the
turbulent global slowdown, the Indian economy managed
commendable expansion of 8.00 percent in 2009-10 and 6.80
percent in 2008-09. During the fi nancial year ended March
31, 2011, the growth has been reported as over 8.60 percent.
It is now widely believed that India could well be on course
to be the third largest economy in the world in a couple of
years, overtaking Japan. Besides, it is expected that, after
2020, India’s growth would be faster than that of even China.
The Indian economy has benefi ted immensely from robust
domestic demand and a revival in investor and consumer
sentiment. This has resulted in stronger capital infl ows into
the country. The agricultural sector, which was lagging behind,
has also performed well assisted by favourable monsoon,
which in turn, gave a major thrust to the rural demand.
The Indian economy is projected to grow 8.50 percent - 9.00
percent in 2011-12. A good south-west monsoon season is
forecasted for the year, which in turn, would give a fi llip to
our growth dynamics. A 9.00 percent GDP growth, then could
be well within the reach. The Twelfth Five Year Plan could
probably set a target growth of 9.00 percent to 9.50 percent.
However, managing the infl ationary pressures and the balance
of payment situation would be a challenge. Besides, the
volatile interest rates could also prove to be a dampener.
The growth of the commercial vehicle segment, which is
closely linked to the country’s GDP growth, has also been
good during these years. During the year ended March 31,
2011, the passenger vehicles segment grew at 29.16 percent
when compared to the previous year. During this period, utility
vehicles grew by 18.87 percent and multi-purpose vehicles
grew by 42.10 percent. The overall commercial vehicles
segment registered growth of 26.97 percent during April-
March 2011 as compared to the same period last year. While
medium & heavy commercial vehicles registered growth of
31.78 percent, light commercial vehicles grew at 22.88 percent.
Three wheelers sales recorded a growth rate of 19.44 percent
in April-March 2011. While passenger carriers grew by 22.03
percent during April-March 2011, goods carriers registered
growth of 9.45 percent. In the export front, during April-March
2011, the passenger vehicles segment registered marginal
growth at 1.64 percent, while the commercial vehicles and
three wheelers segments recorded growth of 69.51 percent
and 55.86 percent respectively.
The enhanced industrial activity, expected agricultural
growth and huge governmental expenditure on infrastructure
development are some of the major factors, which are
expected to propel the demand for new commercial vehicles.
Besides, increased passenger movement through the roads
and introduction of new and improved vehicles in the market
The Indian economy is projected to grow 8.50 percent - 9.00 percent in 2011-12. A good south-west monsoon season is forecasted for the year, which in turn, would give a fi llip to our growth dynamics. A 9.00 percent GDP growth, then could be well within the reach. The Twelfth Five Year Plan could probably set a target growth of 9.00 percent to 9.50 percent. However, managing the infl ationary pressures and the balance of payment situation would be a challenge.
17
Annual Report 2010-11
Finance Company LimitedShriram TransportShriram Transport
are also expected to push up the demand. It is projected that
during the fi nancial year 2011-12, the light commercial vehicle
and the medium & heavy commercial vehicle segments
would grow 18-21 percent and 10-12 percent respectively.
The passenger bus segment would be recording a growth of
8-10 percent. The three wheelers (cargo) and three wheelers
(passenger) would grow 4-6 percent and 10-12 percent
respectively.
The sale of commercial vehicle has averaged about 11.00
percent in the fi ve years ended 2010. Considering the typical
life cycle of the commercial vehicles, most of the vehicles that
have been sold in the last four to fi ve years would be due
for resale shortly. The market for large commercial vehicle in
India alone is estimated to be about Rs. 70,000 crores and
the market for fi nancing the pre-owned vehicles of 5-12 years
is expected to be around Rs. 40,000 crores. Your Company,
therefore, expects that the demand for commercial vehicles
fi nancing would continue to remain strong.
FIXED DEPOSITS
As on March 31, 2011, there were 635 fi xed deposits
aggregating to Rs. 278.50 lacs that have matured but remained
unclaimed. There were no deposits, which were claimed but
not paid by the Company. The unclaimed deposits have since
fallen down to 569 deposits amounting to Rs. 221.22 lacs.
Appropriate steps are being taken continuously to obtain the
depositors’ instructions so as to ensure renewal/ repayment of
the deposits in time.
SUBSIDIARIES
The Company has two wholly owned subsidiaries viz.
Shriram Equipment Finance Company Limited (SEFCL) and
Shriram Automall India Limited (SAIL). These subsidiary
companies are non-material Indian unlisted subsidiaries of
the Company.
Shriram Equipment Finance Company Limited (SEFCL):
SEFCL is engaged in the business of hire purchase/loan
fi nancing of equipment, especially construction equipment
and has been registered under Section 45-IA of the Reserve
Bank of India Act, 1934 as Non-Banking Finance Company
(Non-Deposit Accepting) vide Certifi cate No. N-07-00786
dated October 8, 2010 issued by Reserve Bank of India.
For the fi nancial year ended March 31, 2011, which is the fi rst
full fi nancial year of operation, SEFCL has reported income
from operations of Rs. 2,002.83 lacs as against none for the
previous year and Profi t after tax of Rs. 115.70 lacs as against
loss of Rs. 1.19 lacs for the earlier year.
During the year under review, your Company subscribed to
15,000,000, 0.01 percent compulsorily convertible preference
shares of Rs. 100/- each issued by SEFCL.
Shriram Automall India Limited (SAIL):
SAIL plans to set up ‘Automalls’, which would be a trading
platform for the sale of pre-owned commercial vehicles. In these
‘Automalls’ to be set up by SAIL, it intends to provide showrooms
for new commercial vehicles, a platform for sale of refurbished
pre-owned commercial vehicles and will also facilitate sale of
commercial vehicles repossessed by fi nancing companies and
for this purpose would set up touch-screen kiosks across the
country, through which customers will be able to access real-
time information on pre-owned vehicles available for sale. SAIL
proposes that the ‘Automalls’ would ultimately become a one-
stop shop catering to the various needs of commercial vehicle
owners. SAIL opened its fi rst ‘Automall’ in Chennai in the month
of March 2011 and has a target of opening 50 to 60 ‘Automalls’in
the current fi nancial year.
For the fi nancial year ended March 31, 2011, SAIL has reported
income from operations of Rs. 6,216.27 lacs as against none
for the previous year. Being the initial stages of its operations
the company has incurred a loss of Rs. 1,391.51 lacs as
compared to the loss of Rs. 0.55 lacs for the period ended on
March 31, 2010.
During the year under review, your Company subscribed to
9,950,000 equity shares of Rs. 10/- each issued by SAIL.
In terms of the Circular No: 51/12/2007-CL-III dated February
08, 2011 of the Ministry of Corporate Affairs, Government of
India, the Board of Directors of the Company at their meeting
held on April 29, 2011 has, by resolution passed thereat,
given their consent for not attaching the Annual Reports of
the subsidiaries to the Balance Sheet of the Company. A
statement on consolidated fi nancial position of the Company
The enhanced industrial activity, expected agricultural growth and huge governmental expenditure on infrastructure development are some of the major factors, which are expected to propel the demand for new commercial vehicles.
Directors’ Report (Contd.)
18
with that of the subsidiaries is attached to the Annual Report.
The consolidated fi nancial statements attached to this Annual
Report are prepared in compliance with the applicable
Accounting Standards and Listing Agreement.
The annual reports and the annual accounts of the subsidiaries
and the related detailed information shall be made available to
Shareholders of the Company and the subsidiaries seeking
such information at any point of time. The annual accounts
of the subsidiaries shall also be kept for inspection by
shareholders at the Registered Offi ce of the Company and
of the respective subsidiaries. The Company shall furnish
hard copy of details of accounts of the subsidiaries to any
Shareholder on demand.
The annual accounts of the subsidiaries shall be available on
the website of the Company viz. www.stfc.in and shall also be
provided to the Shareholders on their written request to the
Company.
SHARE CAPITAL
During the year under review, the Company allotted 642,850
fully paid up equity shares of the face value of Rs. 10/- each to
its employees on exercise of stock options by them.
Details of the shares issued and allotted under the Employees
Stock Option Scheme of the Company, as well as the
disclosures in compliance with Clause 12 of the Securities and
Exchange Board of India (Employee Stock Option Scheme
and Employee Stock Purchase Scheme) Guidelines, 1999 are
set out in Annexure to this Report.
PUBLIC ISSUE OF NCDs
With a view to develop an additional channel for raising
monies to fund the business operations, your Company,
pursuant to the Securities and Exchange Board of India (Issue
and Listing of Debt Securities) Regulations, 2008 and subject
to the necessary approvals, consents and permissions,
issued and allotted Secured and Unsecured Non Convertible
Debentures (NCDs), through a public issue and raised a sum of
Rs. 49,999.99 lacs in May 2010.
Considering the potential in raising funds through public
issuance of NCDs and the extra ordinary support received
from the investing public for its previous NCDs offerings, your
Board, at its meeting held on April 29, 2011, has decided to offer
and allot to public, subject to the aforementioned Regulations
and such approvals as may be necessary, secured NCDs not
exceeding Rs. 200,000 lacs.
CORPORATE SOCIAL RESPONSILITY INITIATIVES
Your Company is fully aware of the fact that as a corporate
citizen, it is also entrusted with the responsibility to contribute
for the betterment of the community at large and has the
necessary resources at its disposal to do so. Hence, your
Company endeavours to empower the under privileged and the
weaker sections of the community. Your Company has been
supporting several NGOs involved in educational, vocational
and other charitable programmes and has continued to engage
itself in social welfare activities by contributing to charitable
institutions.
During the fi nancial year ended March 31, 2011, your Company
supported a variety of charitable projects and has contributed
a sum of Rs. 272.06 lacs to several charitable organizations.
HUMAN CAPITAL
Your Company fi rmly believes that the human capital built up
by it over the years is its most valuable asset and all efforts are
made to empower them continuously. The broader employee
ownership of its share capital has contributed to a large extent
on retaining its employees and has also impacted positively
on the Company’s performance. Imparting of training through
internal as well as external training programmes is being done
continuously so as to equip them to face the new challenges
in the market place.
As of March 31, 2011, the Company has 16,919 employees.
DIRECTORATE
As per Section 256 of the Companies Act, 1956, Mr. Arun
Duggal, Mr. Ranvir Dewan and Mr. S. Venkatakrishnan would
retire by rotation at the ensuing Annual General Meeting, and
being eligible, offer themselves for re-appointment.
DIRECTORS’ RESPONSIBILITY STATEMENT
Pursuant to the provisions of Section 217(2AA) of the
Companies Act, 1956, the Directors confi rm that, to the best
of their knowledge and belief:
a. In the preparation of the Annual Accounts, the applicable
Accounting Standards have been followed along with
proper explanation relating to material departures;
b. That such accounting policies as mentioned in Schedule
21.1 of the Accounts have been selected and applied
consistently, and judgments and estimates have been
made that are reasonable and prudent so as to give a
true and fair view of the state of affairs of the Company
as at March 31, 2011 and of the profi t of the Company for
the year ended on that date;
19
Annual Report 2010-11
Finance Company LimitedShriram TransportShriram Transport
c. That proper and suffi cient care has been taken for
the maintenance of adequate accounting records in
accordance with the provisions of the Companies Act,
1956, for safeguarding the assets of the Company and for
preventing and detecting fraud and other irregularities;
d. The Annual Accounts have been prepared on a going
concern basis.
RBI GUIDELINES
The Company continues to comply with all the requirements
prescribed by the Reserve Bank of India, from time to time, as
applicable to it.
CORPORATE GOVERNANCE
The Report on Corporate Governance forms part of the
Directors’ Report, and is annexed herewith.
As required by the Listing Agreement, Auditors’ Report on
Corporate Governance and a declaration by the Managing
Director with regard to Code of Conduct are attached to the
said Report.
The Management Discussion & Analysis is given as a separate
statement forming part of the Annual Report.
Further, as required under Clause 49 of the Listing Agreement,
a certifi cate, duly signed by the Managing Director and
Chief Financial Offi cer on the Financial Statements of the
Company for the year ended March 31, 2011, was submitted
to the Board of Directors at their meeting held on April 29,
2011. The certifi cate is attached to the Report on Corporate
Governance.
Corporate Governance - Voluntary Guidelines: The Board
of Directors have taken note of the ‘Corporate Governance
Voluntary Guidelines 2009’ issued by the Ministry of Corporate
Affairs (MCA) in December 2009. Though these guidelines are
recommendatory in nature, the Board is aware of its importance
and would consider adopting the relevant provisions of these
Guidelines as and when deemed appropriate.
AUDITORS
M/s. S. R. BATLIBOI & Co., Chartered Accountants, Mumbai
and M/s. G. D. Apte & Co., Chartered Accountants, Mumbai,
Auditors of the Company, retire at the conclusion of the ensuing
Annual General Meeting and are eligible for re-appointment.
Certifi cates have been received from them to the effect that
their re-appointment as Auditors of the Company, if made,
would be within the limits prescribed under Section 224(1B)
of the Companies Act, 1956. They have also confi rmed that
they hold a valid peer review certifi cate as prescribed under
Clause 41(1)(h) of Listing Agreement. Members are requested
to consider their re-appointment.
CONSERVATION OF ENERGY, TECHNOLOGY ABSORPTION & FOREIGN EXCHANGE EARNINGS & OUTGO
Pursuant to the requirement under Section 217(1)(e) of the
Companies Act, 1956, read with Companies (Disclosure of
Particulars in the Report of the Board of Directors) Rules, 1988:
a. The Company has no activity involving conservation of
energy or technology absorption.
b. The Company does not have any Foreign Exchange
Earnings.
c. Outgo under Foreign Exchange - Rs. 0.76 lacs.
PARTICULARS OF EMPLOYEES
Information in accordance with the provisions of Section
217(2A) of the Companies Act, 1956 read with Companies
(Particulars of Employees) Rules, 1975, as amended, forms
part of the Directors’ Report. However, as per the provisions
of Section 219(1)(b)(iv) of the Companies Act, 1956, this
Report and Accounts are being sent to all the Shareholders
of the Company, excluding the statement of particulars of
employees under Section 217(2A) of the Companies Act, 1956.
Any Shareholder interested in obtaining a copy of the said
statement may write to the Vice President (Corporate Affairs)
& Company Secretary at the Head Offi ce of the Company, and
the same will be sent by post.
ACKNOWLEDGEMENT
The Board of Directors would like to place on record their
gratitude for the guidance and cooperation extended by
Reserve Bank of India and the other regulatory authorities.
The Board takes this opportunity to express their sincere
appreciation for the excellent patronage received from
the Banks and Financial Institutions and for the continued
enthusiasm, total commitment, dedicated efforts of the
executives and employees of the Company at all levels. We
are also deeply grateful for the continued confi dence and faith
reposed on us by the Shareholders, Depositors, Debenture
holders and Debt holders.
For and on behalf of the Board of Directors
Arun Duggal Chairman
Mumbai
April 29, 2011
Directors’ Report (Contd.)
20
GROUP COMING WITHIN THE DEFINITION OF GROUP
AS DEFINED IN THE MONOPOLIES AND RESTRICTIVE
TRADE PRACTICES ACT, 1969 (54 OF 1969)
The following persons constitute the Group coming within the
defi nition of group as defi ned in the Monopolies and Restrictive
Trade Practices Act, 1969 (54 of 1969).
Mr. R. Thyagarajan, Shriram Ownership Trust, Shriram City
Union Finance Limited, Shriram Housing Finance Limited,
Shriram Asset Management Company Limited, Shriram
Automall India Limited, Shriram Equipment Finance Company
Limited, Shriram Motor Finance, S R Real Estate Finance,
Shriram Chits (Karnataka) Private Limited, Shriram Chits Private
Limited, Shriram Chits Tamilnadu Private Limited, Shriram Chits
(Maharashtra) Limited, Shriram Enterprise Holdings Private
Limited, Shriram Automall Land Holdings Private Limited
(formerly Shriram Projects Development Private Limited),
Shriram Retail and Franchisees Private Limited (formerly DNM
Consultancy Private Limited), Shriram Insight Share Brokers
Limited, Shriram Wealth Advisors Limited, Insight Commodities
& Futures Private Limited, Shriram Fortune Solutions Limited,
Shriram Value Services Private Limited, Shriram Marketing
Agencies (Chennai) Private Limited, Shriram Capital Limited,
Shriram Holdings (Madras) Private Limited, Shriram Credit
Company Limited, Shriram Retail Holdings Private Limited,
Shriram Life Insurance Company Limited, Shriram General
Insurance Company Limited, Shriram Investment Holdings
Limited, Bharat Re-Insurance Brokers Private Limited, Shriram
Infrastructure Holdings Private Limited, Shriram Enterprises
Trust, Shriram Entrepreneurial Ventures Limited, Shriram
Overseas Investments Private Limited (formerly Dhanashri
Investments Private Limited), Shriram Financial Ventures
(Chennai) Private Limited, Shriram Financial Products
Solutions (Chennai) Private Limited and any other Company,
fi rm or trust promoted or controlled by the above.
The above disclosure has been made; inter alia, for the purpose
of Regulation 3(1)(e) of the Securities and Exchange Board
of India (Substantial Acquisition of Shares and Takeovers)
Regulations, 1997.
21
Annual Report 2010-11
Finance Company LimitedShriram TransportShriram Transport
SHRIRAM TRANSPORT FINANCE COMPANY LIMITED
DISCLOSURE PURSUANT TO THE PROVISIONS OF SECURITIES AND EXCHANGE BOARD OF INDIA
(Employee stock option scheme and employee stock purchase scheme) guidelines, 1999
ANNEXURE TO THE DIRECTORS’ REPORT, 2010-11
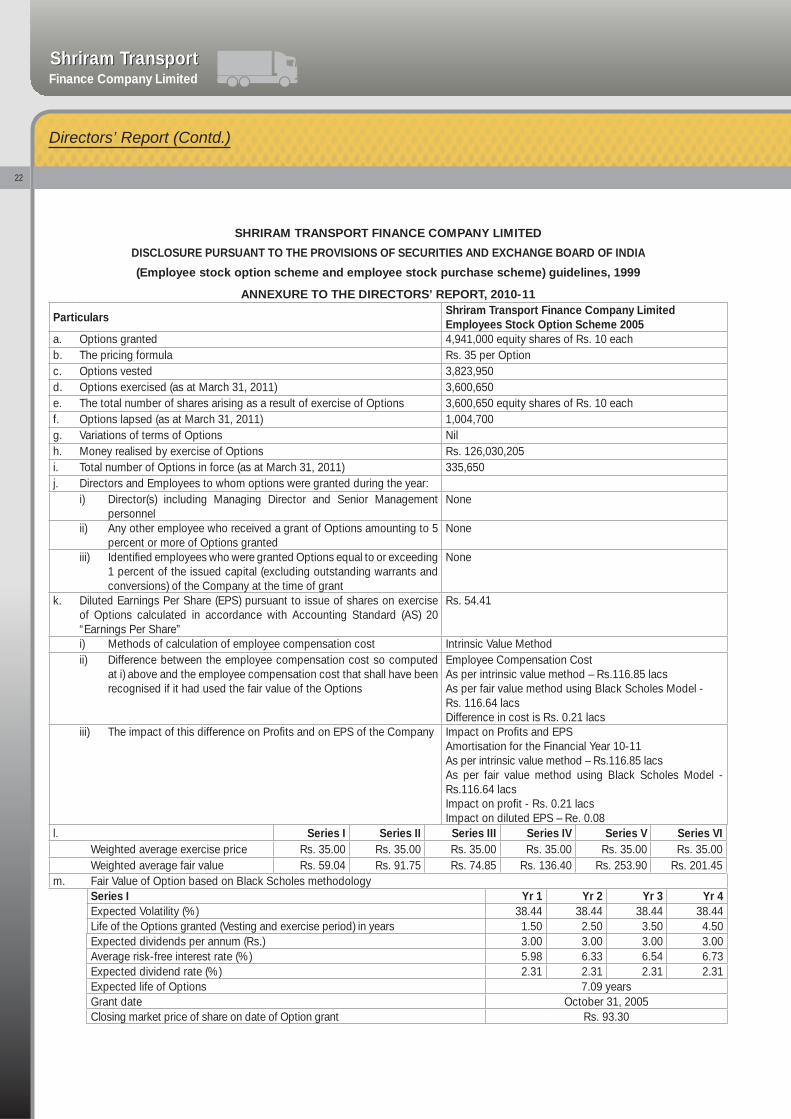
ParticularsShriram Transport Finance Company Limited Employees Stock Option Scheme 2005
a. Options granted 4,941,000 equity shares of Rs. 10 eachb. The pricing formula Rs. 35 per Optionc. Options vested 3,823,950d. Options exercised (as at March 31, 2011) 3,600,650e. The total number of shares arising as a result of exercise of Options 3,600,650 equity shares of Rs. 10 eachf. Options lapsed (as at March 31, 2011) 1,004,700g. Variations of terms of Options Nilh. Money realised by exercise of Options Rs. 126,030,205i. Total number of Options in force (as at March 31, 2011) 335,650j. Directors and Employees to whom options were granted during the year:
i) Director(s) including Managing Director and Senior Management personnel
None
ii) Any other employee who received a grant of Options amounting to 5 percent or more of Options granted
None
iii) Identifi ed employees who were granted Options equal to or exceeding 1 percent of the issued capital (excluding outstanding warrants and conversions) of the Company at the time of grant
None
k. Diluted Earnings Per Share (EPS) pursuant to issue of shares on exercise of Options calculated in accordance with Accounting Standard (AS) 20 “Earnings Per Share”
Rs. 54.41
i) Methods of calculation of employee compensation cost Intrinsic Value Methodii) Difference between the employee compensation cost so computed
at i) above and the employee compensation cost that shall have been recognised if it had used the fair value of the Options
Employee Compensation CostAs per intrinsic value method – Rs.116.85 lacsAs per fair value method using Black Scholes Model - Rs. 116.64 lacsDifference in cost is Rs. 0.21 lacs
iii) The impact of this difference on Profi ts and on EPS of the Company Impact on Profi ts and EPSAmortisation for the Financial Year 10-11As per intrinsic value method – Rs.116.85 lacsAs per fair value method using Black Scholes Model - Rs.116.64 lacsImpact on profi t - Rs. 0.21 lacsImpact on diluted EPS – Re. 0.08
l. Series I Series II Series III Series IV Series V Series VIWeighted average exercise price Rs. 35.00 Rs. 35.00 Rs. 35.00 Rs. 35.00 Rs. 35.00 Rs. 35.00Weighted average fair value Rs. 59.04 Rs. 91.75 Rs. 74.85 Rs. 136.40 Rs. 253.90 Rs. 201.45
m. Fair Value of Option based on Black Scholes methodologySeries I Yr 1 Yr 2 Yr 3 Yr 4Expected Volatility (%) 38.44 38.44 38.44 38.44Life of the Options granted (Vesting and exercise period) in years 1.50 2.50 3.50 4.50Expected dividends per annum (Rs.) 3.00 3.00 3.00 3.00Average risk-free interest rate (%) 5.98 6.33 6.54 6.73Expected dividend rate (%) 2.31 2.31 2.31 2.31Expected life of Options 7.09 yearsGrant date October 31, 2005Closing market price of share on date of Option grant Rs. 93.30
Directors’ Report (Contd.)
22
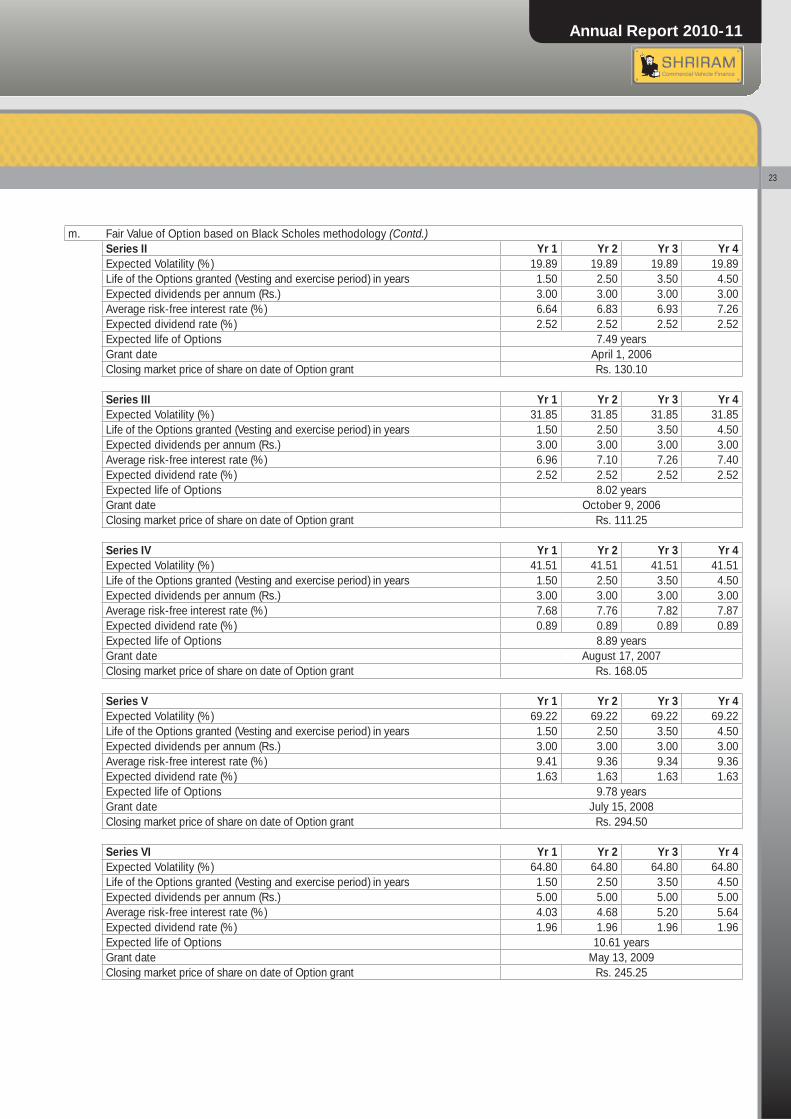
m. Fair Value of Option based on Black Scholes methodology (Contd.)Series II Yr 1 Yr 2 Yr 3 Yr 4Expected Volatility (%) 19.89 19.89 19.89 19.89Life of the Options granted (Vesting and exercise period) in years 1.50 2.50 3.50 4.50Expected dividends per annum (Rs.) 3.00 3.00 3.00 3.00Average risk-free interest rate (%) 6.64 6.83 6.93 7.26Expected dividend rate (%) 2.52 2.52 2.52 2.52Expected life of Options 7.49 years Grant date April 1, 2006Closing market price of share on date of Option grant Rs. 130.10
Series III Yr 1 Yr 2 Yr 3 Yr 4Expected Volatility (%) 31.85 31.85 31.85 31.85Life of the Options granted (Vesting and exercise period) in years 1.50 2.50 3.50 4.50Expected dividends per annum (Rs.) 3.00 3.00 3.00 3.00Average risk-free interest rate (%) 6.96 7.10 7.26 7.40Expected dividend rate (%) 2.52 2.52 2.52 2.52Expected life of Options 8.02 yearsGrant date October 9, 2006Closing market price of share on date of Option grant Rs. 111.25
Series IV Yr 1 Yr 2 Yr 3 Yr 4Expected Volatility (%) 41.51 41.51 41.51 41.51Life of the Options granted (Vesting and exercise period) in years 1.50 2.50 3.50 4.50Expected dividends per annum (Rs.) 3.00 3.00 3.00 3.00Average risk-free interest rate (%) 7.68 7.76 7.82 7.87Expected dividend rate (%) 0.89 0.89 0.89 0.89Expected life of Options 8.89 yearsGrant date August 17, 2007Closing market price of share on date of Option grant Rs. 168.05
Series V Yr 1 Yr 2 Yr 3 Yr 4Expected Volatility (%) 69.22 69.22 69.22 69.22Life of the Options granted (Vesting and exercise period) in years 1.50 2.50 3.50 4.50Expected dividends per annum (Rs.) 3.00 3.00 3.00 3.00Average risk-free interest rate (%) 9.41 9.36 9.34 9.36Expected dividend rate (%) 1.63 1.63 1.63 1.63Expected life of Options 9.78 years Grant date July 15, 2008Closing market price of share on date of Option grant Rs. 294.50
Series VI Yr 1 Yr 2 Yr 3 Yr 4Expected Volatility (%) 64.80 64.80 64.80 64.80Life of the Options granted (Vesting and exercise period) in years 1.50 2.50 3.50 4.50Expected dividends per annum (Rs.) 5.00 5.00 5.00 5.00Average risk-free interest rate (%) 4.03 4.68 5.20 5.64Expected dividend rate (%) 1.96 1.96 1.96 1.96Expected life of Options 10.61 years Grant date May 13, 2009Closing market price of share on date of Option grant Rs. 245.25
23
Annual Report 2010-11
Finance Company LimitedShriram Transport
COMPANY’S PHILOSOPHY ON CORPORATE
GOVERNANCE
The Company’s philosophy on Corporate Governance is
aimed at:
a. Enhancing long term Shareholder value through
• Assisting the top management in taking sound
business decisions; and
• Prudent fi nancial management.
b. Achieving transparency and professionalism in all
decisions and activities of the Company.
c. Achieving excellence in Corporate Governance by
• Conforming to the prevalent guidelines on Corporate
Governance, and excelling in, wherever possible.
• Reviewing periodically the existing systems and
controls for further improvements.
BOARD OF DIRECTORS
Composition
The Board of Directors of the Company consists of
professionals from varied disciplines. The day to day
management of the affairs of the Company is entrusted with
the senior management personnel, headed by the Managing
Director, who functions under the overall supervision, direction
and control of the Board of Directors of the Company. The
Board meets regularly to discuss, review and decide upon
the matters such as policy formulation, setting up of goals,
appraisal of performances with the goals and control functions,
etc. Some of the powers of the Board have also been delegated
to Committee/s, who monitors the day-to-day affairs relating
to operational matters. The Board thus exercises close control
over the overall functioning of the Company with a view to
enhance the Shareholder value.
The Independent Directors have made disclosures confi rming
that there are no material, fi nancial and/or commercial
transactions between Independent Directors and the
Company which could have potential confl ict of interest with
the Company at large.
During the year under review, fi ve meetings of the Board of
Directors were held on April 29, 2010, June 15, 2010, July 22,
2010, October 27, 2010, and January 31, 2011. The maximum
gap between any two meetings was not more than four
months. The Thirty First Annual General Meeting was held on
June 15, 2010.
As mandated by Clause 49, as of March 31, 2011, none
of the Directors is a member of more than ten Board level
Committees and no such Director is a Chairman of more than
fi ve Committees of the Companies in which he is a Director.
The necessary disclosures regarding Committee positions
have been made by the Directors.
As of March 31, 2011, the Company’s Board comprised of
ten members. The Chairman of the Board is non-executive
Director. The Managing Director is an Executive of the
Company.
The agenda papers along with the explanatory notes for
Board Meetings are sent in advance to the Directors. In
some instances, documents are tabled at the meetings and
presentations are also made by the respective executives
on the matters related to them at the Board or Committee
Meetings.
The names and categories of Directors, their attendance at
Board Meetings held during the year and at the last Annual
General Meeting (AGM) and number of memberships/
chairmanships of Directors in other Boards and Board
Committees are as follows:
Report on Corporate Governance24
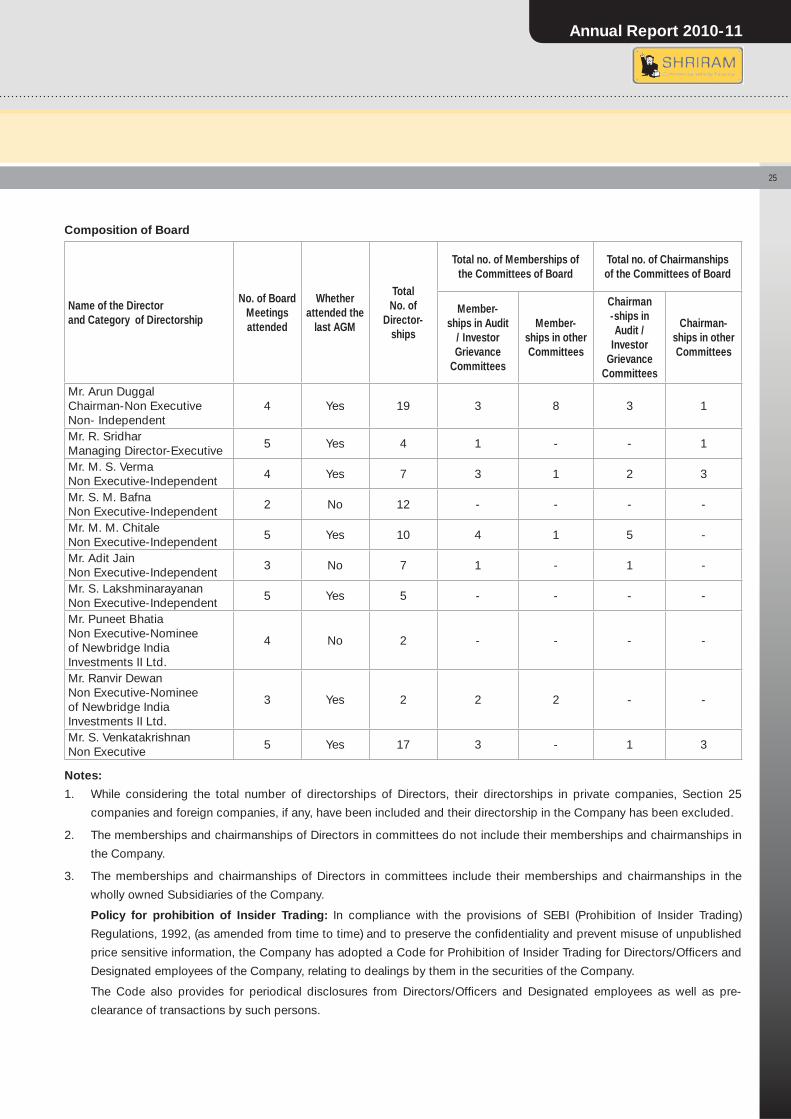
Composition of Board
Name of the Director and Category of Directorship
No. of Board Meetings attended
Whether attended the
last AGM
Total No. of
Director-ships
Total no. of Memberships of the Committees of Board
Total no. of Chairmanships of the Committees of Board
Member-ships in Audit
/ Investor Grievance
Committees
Member-ships in other Committees
Chairman -ships in Audit /
Investor Grievance
Committees
Chairman-ships in other Committees
Mr. Arun Duggal Chairman-Non Executive Non- Independent
4 Yes 19 3 8 3 1
Mr. R. Sridhar Managing Director-Executive
5 Yes 4 1 - - 1
Mr. M. S. Verma Non Executive-Independent
4 Yes 7 3 1 2 3
Mr. S. M. Bafna Non Executive-Independent
2 No 12 - - - -
Mr. M. M. Chitale Non Executive-Independent
5 Yes 10 4 1 5 -
Mr. Adit Jain Non Executive-Independent
3 No 7 1 - 1 -
Mr. S. Lakshminarayanan Non Executive-Independent
5 Yes 5 - - - -
Mr. Puneet Bhatia Non Executive-Nominee of Newbridge India Investments II Ltd.
4 No 2 - - - -
Mr. Ranvir Dewan Non Executive-Nominee of Newbridge India Investments II Ltd.
3 Yes 2 2 2 - -
Mr. S. Venkatakrishnan Non Executive
5 Yes 17 3 - 1 3
Notes:
1. While considering the total number of directorships of Directors, their directorships in private companies, Section 25
companies and foreign companies, if any, have been included and their directorship in the Company has been excluded.
2. The memberships and chairmanships of Directors in committees do not include their memberships and chairmanships in
the Company.
3. The memberships and chairmanships of Directors in committees include their memberships and chairmanships in the
wholly owned Subsidiaries of the Company.
Policy for prohibition of Insider Trading: In compliance with the provisions of SEBI (Prohibition of Insider Trading)
Regulations, 1992, (as amended from time to time) and to preserve the confi dentiality and prevent misuse of unpublished
price sensitive information, the Company has adopted a Code for Prohibition of Insider Trading for Directors/Offi cers and
Designated employees of the Company, relating to dealings by them in the securities of the Company.
The Code also provides for periodical disclosures from Directors/Offi cers and Designated employees as well as pre-
clearance of transactions by such persons.
25
Annual Report 2010-11
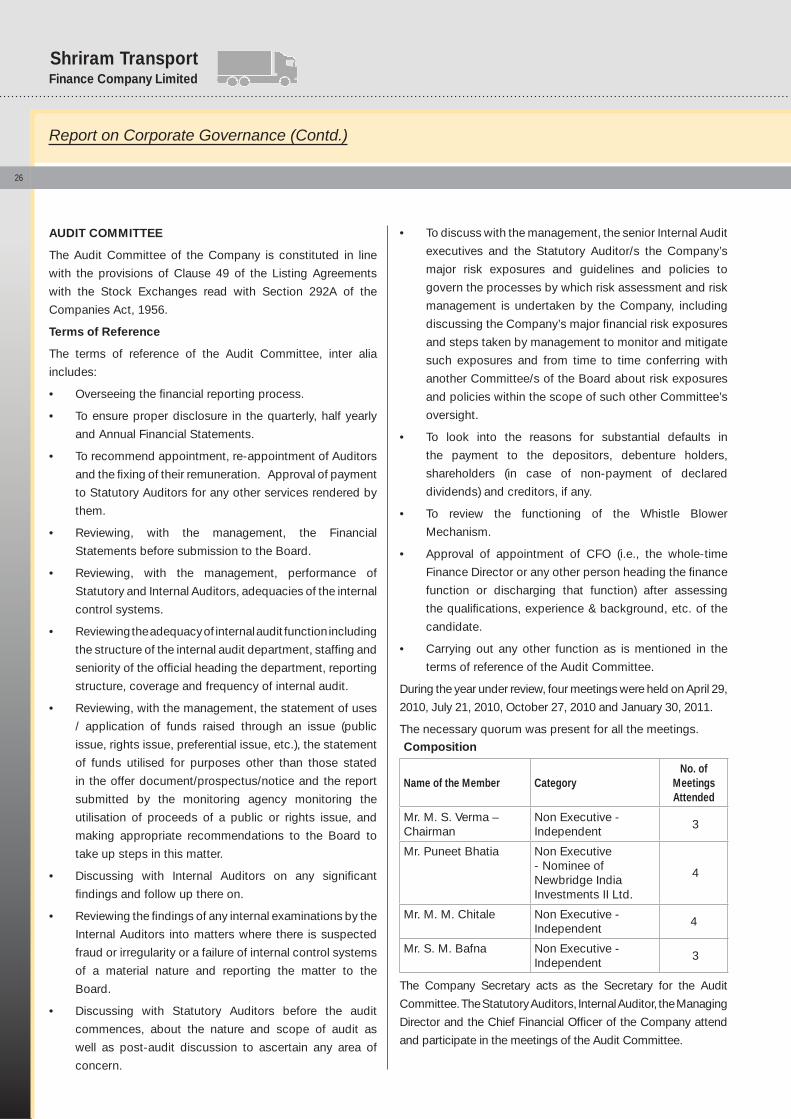
Finance Company LimitedShriram Transport
AUDIT COMMITTEE
The Audit Committee of the Company is constituted in line
with the provisions of Clause 49 of the Listing Agreements
with the Stock Exchanges read with Section 292A of the
Companies Act, 1956.
Terms of Reference
The terms of reference of the Audit Committee, inter alia
includes:
• Overseeing the fi nancial reporting process.
• To ensure proper disclosure in the quarterly, half yearly
and Annual Financial Statements.
• To recommend appointment, re-appointment of Auditors
and the fi xing of their remuneration. Approval of payment
to Statutory Auditors for any other services rendered by
them.
• Reviewing, with the management, the Financial
Statements before submission to the Board.
• Reviewing, with the management, performance of
Statutory and Internal Auditors, adequacies of the internal
control systems.
• Reviewing the adequacy of internal audit function including
the structure of the internal audit department, staffi ng and
seniority of the offi cial heading the department, reporting
structure, coverage and frequency of internal audit.
• Reviewing, with the management, the statement of uses
/ application of funds raised through an issue (public
issue, rights issue, preferential issue, etc.), the statement
of funds utilised for purposes other than those stated
in the offer document/prospectus/notice and the report
submitted by the monitoring agency monitoring the
utilisation of proceeds of a public or rights issue, and
making appropriate recommendations to the Board to
take up steps in this matter.
• Discussing with Internal Auditors on any signifi cant
fi ndings and follow up there on.
• Reviewing the fi ndings of any internal examinations by the
Internal Auditors into matters where there is suspected
fraud or irregularity or a failure of internal control systems
of a material nature and reporting the matter to the
Board.
• Discussing with Statutory Auditors before the audit
commences, about the nature and scope of audit as
well as post-audit discussion to ascertain any area of
concern.
• To discuss with the management, the senior Internal Audit
executives and the Statutory Auditor/s the Company’s
major risk exposures and guidelines and policies to
govern the processes by which risk assessment and risk
management is undertaken by the Company, including
discussing the Company’s major fi nancial risk exposures
and steps taken by management to monitor and mitigate
such exposures and from time to time conferring with
another Committee/s of the Board about risk exposures
and policies within the scope of such other Committee’s
oversight.
• To look into the reasons for substantial defaults in
the payment to the depositors, debenture holders,
shareholders (in case of non-payment of declared
dividends) and creditors, if any.
• To review the functioning of the Whistle Blower
Mechanism.
• Approval of appointment of CFO (i.e., the whole-time
Finance Director or any other person heading the fi nance
function or discharging that function) after assessing
the qualifi cations, experience & background, etc. of the
candidate.
• Carrying out any other function as is mentioned in the
terms of reference of the Audit Committee.
During the year under review, four meetings were held on April 29,
2010, July 21, 2010, October 27, 2010 and January 30, 2011.
The necessary quorum was present for all the meetings.
Composition
Name of the Member CategoryNo. of
Meetings Attended
Mr. M. S. Verma – Chairman
Non Executive - Independent
3
Mr. Puneet Bhatia Non Executive - Nominee of Newbridge India Investments II Ltd.
4
Mr. M. M. Chitale Non Executive - Independent
4
Mr. S. M. Bafna Non Executive - Independent
3
The Company Secretary acts as the Secretary for the Audit
Committee. The Statutory Auditors, Internal Auditor, the Managing
Director and the Chief Financial Offi cer of the Company attend
and participate in the meetings of the Audit Committee.
Report on Corporate Governance (Contd.)
26
REMUNERATION AND COMPENSATION COMMITTEE
The Remuneration Committee comprising of non-executive Independent Director’s, constitution of which is a non-mandatory requirement, was constituted by the Board.
Terms of Reference
The terms of reference of the Remuneration and Compensation Committee, inter alia includes:
Executive Remuneration
The Committee is responsible for assisting the Board of Directors in the Board’s overall responsibilities relating to determination on their behalf and on behalf of the Shareholders with agreed terms of reference, the Company’s policy on specifi c remuneration packages and any compensation payment for the Managing Director/ Whole-time Directors and Executive Directors. The role of the Committee includes:
• To provide independent oversight of and to consult with management regarding the Company’s compensation, bonus, pension and other benefi t plans, policies and practices applicable to the Company’s executive management.
• To develop guidelines for and annually review and approve (a) the annual basic salary, (b) the annual incentive and bonus, including the specifi c goals and amount and (c) equity compensation for the Managing Director and the other executive offi cers of the Company.
• To review and approve (a) employment agreements, severance arrangements and change in control agreements/ provisions and (b) any other benefi ts, compensation or arrangements for the Managing Director and the other executive offi cers of the Company.
Employees Stock Option Scheme (ESOS)
The Committee is responsible for assisting the Board of Directors in the Board’s overall responsibilities relating to ESOS including, administration of the Company’s stock incentive plans, and other similar incentive plans, and interpret and adopt rules for the operation thereof.
The Committee’s responsibility also covers establishment of guidelines for and approval of the grant of stock options to Key Employees, Offi cers and Directors of the Company, including determination of the number of shares to be covered by each option, whether the option will be an incentive stock option or otherwise, and the vesting schedule for such Options.
During the year under review, three meetings of the Committee were held on April 29, 2010, July 22, 2010 and October 27, 2010.
The necessary quorum was present for all the meetings.
Composition
Name of the Member CategoryNo. of
Meetings Attended
Mr. Adit Jain - Chairman
Non Executive - Independent
2
Mr. Puneet Bhatia Non Executive - Nominee of Newbridge India Investments II Ltd.
3
Mr. M. M. Chitale Non Executive - Independent
3
Mr. S. M. Bafna Non Executive - Independent
2
Remuneration policy of the Company
For Managing Director
The Managing Director is paid a fi xed quantum of salary and perquisites. He is also eligible for such percentage of commission/incentive as may be recommended by the Remuneration and Compensation Committee based on the overall performance of the Company, which shall be within the overall limits permissible under the Companies Act, 1956 and as approved by the Shareholders.
The Shareholders at their 31st Annual General Meeting held on June 15, 2010 appointed Mr. R. Sridhar as the Managing Director of the Company for a period of 5 years commencing from September 15, 2010 to September 14, 2015.
Remuneration paid to the Managing Director for the fi nancial year 2010 - 2011 is given elsewhere in this Report.
For Non Executive Independent Directors
Non Executive Directors get sitting fees for attending each meeting of the Board of Directors/Committees thereof and reimbursement of out-of-pocket expenses incurred, wherever applicable, for attending such meetings. The sitting fee is payable only to Independent Directors. The sitting fee payable per meeting is as under: a. Board meeting - Rs. 20,000/-b. Committee meeting - Rs. 15,000/-
27
Annual Report 2010-11
Finance Company LimitedShriram Transport
Details of Shares / Warrants held by the Directors as on
March 31, 2011, are as below:
Name of the DirectorShare / Warrant
holdingsMr. Arun Duggal, Chairman -Mr. R. Sridhar, Managing Director 108,280 sharesMr. M. S. Verma -Mr. S. M. Bafna 1,200 sharesMr. M. M. Chitale -Mr. Adit Jain -Mr. S. Lakshminarayanan -Mr. Puneet Bhatia -Mr. Ranvir Dewan -Mr. S. Venkatakrishnan 4,448 shares
The Stock Options granted to the Managing Director is given in the Annexure to the Directors’ Report.
SHAREHOLDERS’/INVESTORS’ GRIEVANCE COMMITTEE
Terms of reference
The Committee is responsible for assisting the Board of Directors in the Board’s overall responsibilities relating to attending to and redressal of the grievances of the Shareholders and the investors of the Company.
The Committee in particular looks into:
• The listing of securities on stock exchanges.
• The Shareholders’ and investors’ complaints on matters relating to transfer of shares, non-receipt of annual report, non-receipt of dividends and matters related thereto.
• The matters that can facilitate better investor services and relations.
• Attending to investors’ queries and complaints regarding transfer, dividend, annual reports, etc.
• Attending to complaints of investors routed by SEBI/Stock Exchanges/RBI.
• The amounts transferable to Investor Education and Protection Fund.
• The profi le of investors.• Taking decisions in connection with issue of global
depository receipts, and• The secretarial audits.
During the year, the Committee met four times on. April 29, 2010, July 22, 2010, October 27, 2010 and January 31, 2011. The necessary quorum was present for all the meetings.
Composition
Name of the Member CategoryNo. of
Meetings Attended
Mr. S. Lakshminarayanan - Chairman @
Non Executive - Independent
1
Mr. R. Sridhar Managing Director - Executive
4
Mr. M. M. Chitale # Non Executive - Independent
3
Notes:
@ Mr. S. Lakshminarayanan was inducted as a member and the Chairman of the Committee by the Board of Directors at its meeting held on January 31, 2011.
# Mr. M. M. Chitale resigned as Chairman and member of the committee w.e.f. January 31, 2011.
Report on Corporate Governance (Contd.)
The details of sitting fees/remuneration paid to the Directors during the year 2010 - 11 are as under:
Name of the DirectorSitting Fees for
attending Meetings (Rs.)Salary, Perquisites
& ESOS (Rs.)Commission
(Rs.)Total(Rs.)
Mr. Arun Duggal, Chairman - - - -Mr. R. Sridhar - Managing Director - 6,790,134 - 6,790,134Mr. M. S. Verma 125,000 - - 125,000Mr. S. M. Bafna 310,000 - - 310,000Mr. M. M. Chitale 250,000 - - 250,000Mr. Adit Jain 90,000 - - 90,000Mr. S. Lakshminarayanan 115,000 - - 115,000Mr. Puneet Bhatia - - - -Mr. Ranvir Dewan - - - -Mr. S. Venkatakrishnan - - - -
Notes: Mr. R. Sridhar was appointed as the Managing Director of the Company for a period of 5 years with effect from September 15, 2010 by the Shareholders at their 31st Annual General Meeting held on June 15, 2010. His remuneration includes salary and incentive of Rs. 4,700,000/- p.a, Perquisites of Rs. 710,958/- contribution to Provident Fund of Rs. 9,360/- and applicable discount of Rs. 1,369,816 on Stock Options. The appointment may be terminated by giving three months notice in writing or salary in lieu thereof. No severance fees are payable on termination of employment.
28
The status of investor grievances is monitored by the Committee periodically and the minutes of the Committee are made available to the Board. The complaints received from the Shareholders, SEBI, Stock Exchanges and others are reviewed and they are replied to by the Company/ Share Transfer Agents regularly. The status of the pending complaints as well as the system of redressal mechanism is reviewed by the Committee periodically.
Shareholder/Investor Complaints:
Status of Complaints on equity shares No. of ComplaintsComplaints pending as on April 01, 2010
NIL
Complaints received during the period April 01, 2010 to March 31, 2011
10
Complaints identifi ed and reported under Clause 41 of the Listing Agreement
10
Complaints disposed off during the year ended March 31, 2011
10
Complaints unresolved as of March 31, 2011
NIL
These complaints have been attended on time and none of the complaints were pending for a period exceeding 30 days. Mr. K. Prakash, Vice President (Corporate Affairs) & Company Secretary, is the Compliance Offi cer.
BANKING AND FINANCE COMMITTEE
Terms of Reference
The Banking and Finance Committee has been formed to monitor resources mobilisation and to ensure effi cient and timely decisions on the matters relating to banking and fi nance activities of the Company. The Committee meets regularly to discharge its functions.
During the year under review, the Committee met 22 times.
The necessary quorum was present for all the meetings.
Composition
Name of the Member CategoryNo. of Meetings
AttendedMr. R. Sridhar - Chairman
Managing Director- Executive
21
Mr. Parag Sharma Member 22Mr. Vinay Kelkar Member 22
ASSET LIABILITY MANAGEMENT COMMITTEE
Terms of reference
The Committee is responsible for assisting the Board of Directors in Balance Sheet planning from risk-return perspective including the strategic management of interest and liquidity risk. Its function includes -
• Liquidity risk management
• Management of market risks
• Funding and capital planning
• Profi t planning and growth projection
• Forecasting and analysing future business environment and preparation of contingency plans.
During the year under review, the Committee met four times on May 18, 2010, August 19, 2010, October 27, 2010 and February 3, 2011.
The necessary quorum was present for all the meetings.
Composition
Name of the Member CategoryNo. of Meetings
AttendedMr. R. Sridhar - Chairman
Managing Director - Executive
4
Mr. Ranvir Dewan Non Executive - Nominee of Newbridge India Investments II Ltd.
2
Mr. Parag Sharma Member 4
GENERAL BODY MEETINGS
Details of location and time of holding the last three AGMs:
Year AGM Location Date & Time2007-08 29th
AGMSri Krishna Gana Sabha,No.20, Maharajapuram, Santhanam Salai (Griffi th Road), T Nagar, Chennai – 600 017.
July 31, 20083:00 P.M.
2008-09 30th AGM
Narada Gana Sabha (Main Hall), No.314, TTK Road, Alwarpet, Chennai - 600 018
July 24, 20094:00 P.M.
2009-10 31st AGM
Narada Gana Sabha (Main Hall), No.314, TTK Road, Alwarpet, Chennai - 600 018
June 15, 2010.11.00 A.M.
a. At the 29th AGM held on July 31, 2008, a special
resolution was passed for obtaining the approval of
Shareholders for alteration of the Articles of Association
of the Company for bringing therein the rights, privileges
and obligations of Private Equity Investors, consequent
to the preferential allotment made on December 14,
2007. The resolution was put to vote by show of hands
and it was passed unanimously.
b. At the 30th AGM held on July 24, 2009, special resolution
was passed whereby Article 36 of the Articles of
Association of the Company relating to use of Common
Seal was modifi ed.
29
Annual Report 2010-11
Finance Company LimitedShriram Transport
c. At the 31st AGM held on June 15, 2010, no special resolution was passed.
d. Postal Ballot - During the year 2010-11 no resolution was passed through Postal Ballot.
e. At the ensuing Annual General Meeting to be held on June 24, 2011, no special resolution is proposed for passing through Postal Ballot. However, a special resolution altering the Articles of Association is proposed for consideration of the Shareholders at the ensuing Annual General Meeting. The special resolution is proposed so as to delete from the Articles of Association of the Company, the Articles relating to the rights, privileges and obligations of Private Equity Investors who have disposed of their holdings in the Company, and hence, do not enjoy any rights under their respective shareholders’ agreement executed by them with the Company.
SUBSIDIARY COMPANIES
The Company has two wholly owned subsidiaries by name Shriram Equipment Finance Company Limited (SEFCL) and Shriram Automall India Limited (SAIL). These subsidiary companies are non-material unlisted Indian subsidiaries of the Company.
Mr. M. S. Verma and Mr. S. Lakshminarayanan, Independent Directors of the Company, are Directors on the Board of Directors of SEFCL and SAIL respectively.
Capital Structure of SEFCL
The Capital Structure of SEFCL as on March 31, 2011 is as follows:
Particulars As at 31/03/2011 As at 31/03/2010 Rs. Rs.Authorised Capital100,000,000 (March 31, 2010 : 3,000,000) Equity Shares of Rs. 10/- each 1,000,000,000 30,000,000 15,000,000 (March 31, 2010 : NIL) Compulsorily Convertible Preference Shares of Rs. 100/- each
1,500,000,000 -
2,500,000,000 30,000,000 Issued, Subscribed and Fully Paid up Capital 10,000,000 (March 31, 2010 : 2,100,000) Equity Shares of Rs. 10/- each 100,000,000 21,000,000 15,000,000 (March 31, 2010 : Nil) Compulsorily Convertible Preference Shares of Rs. 100/- each
1,500,000,000 -
1,600,000,000 21,000,000
SAIL
SAIL intends to provide a trading platform for the sale of pre-owned commercial vehicles, showrooms for branded new and refurbished pre-owned commercial vehicles, as well as commercial vehicles repossessed by fi nancing companies. It also intends to provide electronic advertising and trading infrastructure in these “Automalls”.
The Audit Committee of the Company regularly reviews the fi nancial statements, in particular, the investments, if any, made by the subsidiary companies. Besides, the minutes of the board meetings of the subsidiaries are placed at the Board meeting of the Company periodically. There are no signifi cant transactions and arrangements entered into by the subsidiary companies during the fi nancial year ended March 31, 2011 requiring it to be brought to the attention of the Board of Directors of the Company.
The disclosures in terms of Clause 32 of the Listing Agreement relating to Loans and advances in the nature of loans to subsidiaries are given in the Annual Report of the Company.
SEFCL
SEFCL is engaged in equipment fi nancing business and was incorporated on December 15, 2009. It has been registered as a Non-Deposit Taking NBFC vide certifi cate dated October 08, 2010 issued by Reserve Bank of India under Section 45 IA (4) of Reserve Bank of India Act, 1934.
Board of Directors of SEFCL:
The composition of the Board of Directors of SEFCL is as follows.1. Mr. M. S. Verma - Chairman2. Mr. R. Sridhar3. Mr. G. S. Sundararajan, and4. Mr. Amol Jain
Report on Corporate Governance (Contd.)
30
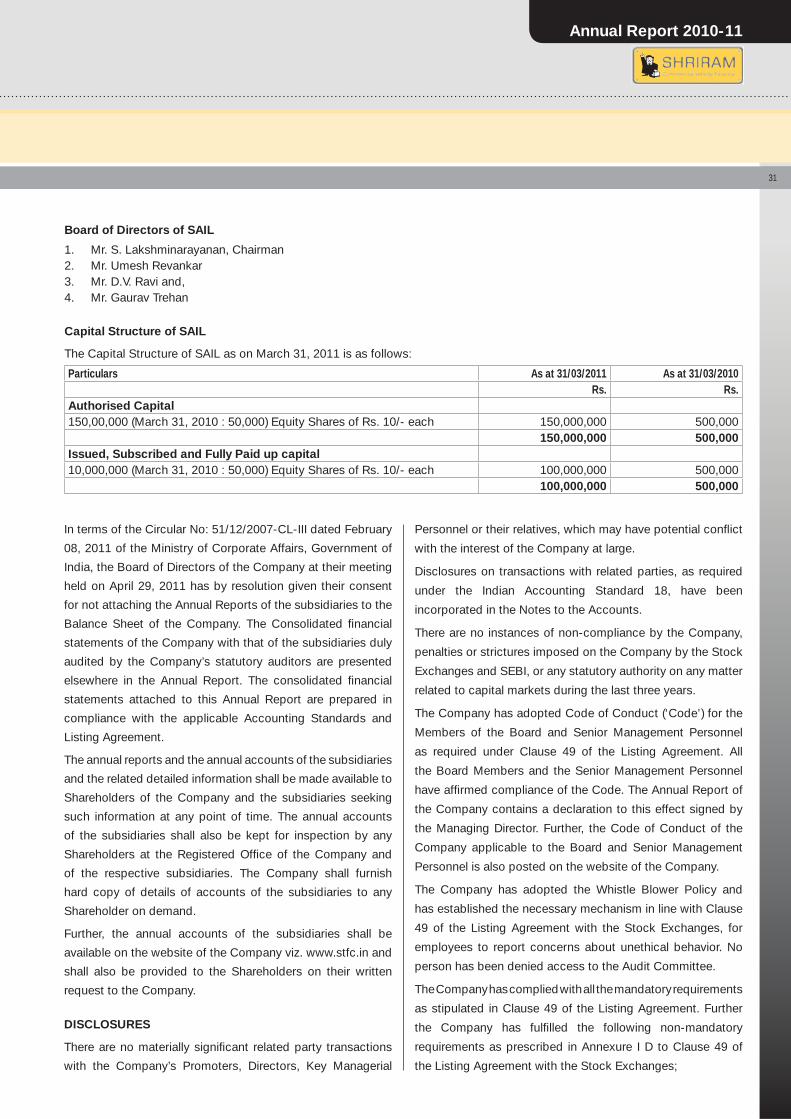
In terms of the Circular No: 51/12/2007-CL-III dated February
08, 2011 of the Ministry of Corporate Affairs, Government of
India, the Board of Directors of the Company at their meeting
held on April 29, 2011 has by resolution given their consent
for not attaching the Annual Reports of the subsidiaries to the
Balance Sheet of the Company. The Consolidated fi nancial
statements of the Company with that of the subsidiaries duly
audited by the Company’s statutory auditors are presented
elsewhere in the Annual Report. The consolidated fi nancial
statements attached to this Annual Report are prepared in
compliance with the applicable Accounting Standards and
Listing Agreement.
The annual reports and the annual accounts of the subsidiaries
and the related detailed information shall be made available to
Shareholders of the Company and the subsidiaries seeking
such information at any point of time. The annual accounts
of the subsidiaries shall also be kept for inspection by any
Shareholders at the Registered Offi ce of the Company and
of the respective subsidiaries. The Company shall furnish
hard copy of details of accounts of the subsidiaries to any
Shareholder on demand.
Further, the annual accounts of the subsidiaries shall be
available on the website of the Company viz. www.stfc.in and
shall also be provided to the Shareholders on their written
request to the Company.
DISCLOSURES
There are no materially signifi cant related party transactions
with the Company’s Promoters, Directors, Key Managerial
Personnel or their relatives, which may have potential confl ict
with the interest of the Company at large.
Disclosures on transactions with related parties, as required
under the Indian Accounting Standard 18, have been
incorporated in the Notes to the Accounts.
There are no instances of non-compliance by the Company,
penalties or strictures imposed on the Company by the Stock
Exchanges and SEBI, or any statutory authority on any matter
related to capital markets during the last three years.
The Company has adopted Code of Conduct (‘Code’) for the
Members of the Board and Senior Management Personnel
as required under Clause 49 of the Listing Agreement. All
the Board Members and the Senior Management Personnel
have affi rmed compliance of the Code. The Annual Report of
the Company contains a declaration to this effect signed by
the Managing Director. Further, the Code of Conduct of the
Company applicable to the Board and Senior Management
Personnel is also posted on the website of the Company.
The Company has adopted the Whistle Blower Policy and
has established the necessary mechanism in line with Clause
49 of the Listing Agreement with the Stock Exchanges, for
employees to report concerns about unethical behavior. No
person has been denied access to the Audit Committee.
The Company has complied with all the mandatory requirements
as stipulated in Clause 49 of the Listing Agreement. Further
the Company has fulfi lled the following non-mandatory
requirements as prescribed in Annexure I D to Clause 49 of
the Listing Agreement with the Stock Exchanges;
Board of Directors of SAIL
1. Mr. S. Lakshminarayanan, Chairman2. Mr. Umesh Revankar3. Mr. D.V. Ravi and,4. Mr. Gaurav Trehan
Capital Structure of SAIL
The Capital Structure of SAIL as on March 31, 2011 is as follows:
Particulars As at 31/03/2011 As at 31/03/2010 Rs. Rs.Authorised Capital150,00,000 (March 31, 2010 : 50,000) Equity Shares of Rs. 10/- each 150,000,000 500,000
150,000,000 500,000Issued, Subscribed and Fully Paid up capital 10,000,000 (March 31, 2010 : 50,000) Equity Shares of Rs. 10/- each 100,000,000 500,000
100,000,000 500,000
31
Annual Report 2010-11
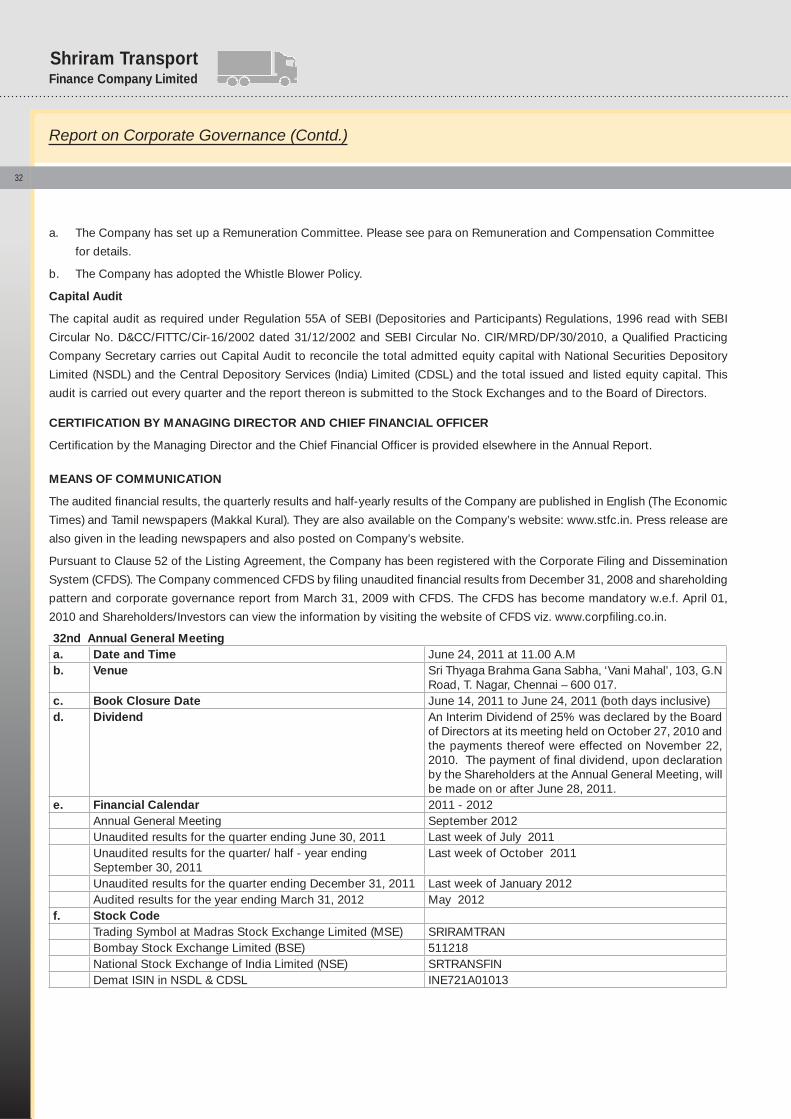
Finance Company LimitedShriram Transport
CERTIFICATION BY MANAGING DIRECTOR AND CHIEF FINANCIAL OFFICER
Certifi cation by the Managing Director and the Chief Financial Offi cer is provided elsewhere in the Annual Report.
MEANS OF COMMUNICATION
The audited fi nancial results, the quarterly results and half-yearly results of the Company are published in English (The Economic
Times) and Tamil newspapers (Makkal Kural). They are also available on the Company’s website: www.stfc.in. Press release are
also given in the leading newspapers and also posted on Company’s website.
Pursuant to Clause 52 of the Listing Agreement, the Company has been registered with the Corporate Filing and Dissemination
System (CFDS). The Company commenced CFDS by fi ling unaudited fi nancial results from December 31, 2008 and shareholding
pattern and corporate governance report from March 31, 2009 with CFDS. The CFDS has become mandatory w.e.f. April 01,
2010 and Shareholders/Investors can view the information by visiting the website of CFDS viz. www.corpfi ling.co.in.
32nd Annual General Meetinga. Date and Time June 24, 2011 at 11.00 A.Mb. Venue Sri Thyaga Brahma Gana Sabha, ‘Vani Mahal’, 103, G.N
Road, T. Nagar, Chennai – 600 017.c. Book Closure Date June 14, 2011 to June 24, 2011 (both days inclusive)d. Dividend An Interim Dividend of 25% was declared by the Board
of Directors at its meeting held on October 27, 2010 and the payments thereof were effected on November 22, 2010. The payment of fi nal dividend, upon declaration by the Shareholders at the Annual General Meeting, will be made on or after June 28, 2011.
e. Financial Calendar 2011 - 2012Annual General Meeting September 2012Unaudited results for the quarter ending June 30, 2011 Last week of July 2011Unaudited results for the quarter/ half - year ending September 30, 2011
Last week of October 2011
Unaudited results for the quarter ending December 31, 2011 Last week of January 2012Audited results for the year ending March 31, 2012 May 2012
f. Stock CodeTrading Symbol at Madras Stock Exchange Limited (MSE) SRIRAMTRANBombay Stock Exchange Limited (BSE) 511218National Stock Exchange of India Limited (NSE) SRTRANSFINDemat ISIN in NSDL & CDSL INE721A01013
Report on Corporate Governance (Contd.)
a. The Company has set up a Remuneration Committee. Please see para on Remuneration and Compensation Committee
for details.
b. The Company has adopted the Whistle Blower Policy.
Capital Audit
The capital audit as required under Regulation 55A of SEBI (Depositories and Participants) Regulations, 1996 read with SEBI
Circular No. D&CC/FITTC/Cir-16/2002 dated 31/12/2002 and SEBI Circular No. CIR/MRD/DP/30/2010, a Qualifi ed Practicing
Company Secretary carries out Capital Audit to reconcile the total admitted equity capital with National Securities Depository
Limited (NSDL) and the Central Depository Services (India) Limited (CDSL) and the total issued and listed equity capital. This
audit is carried out every quarter and the report thereon is submitted to the Stock Exchanges and to the Board of Directors.
32
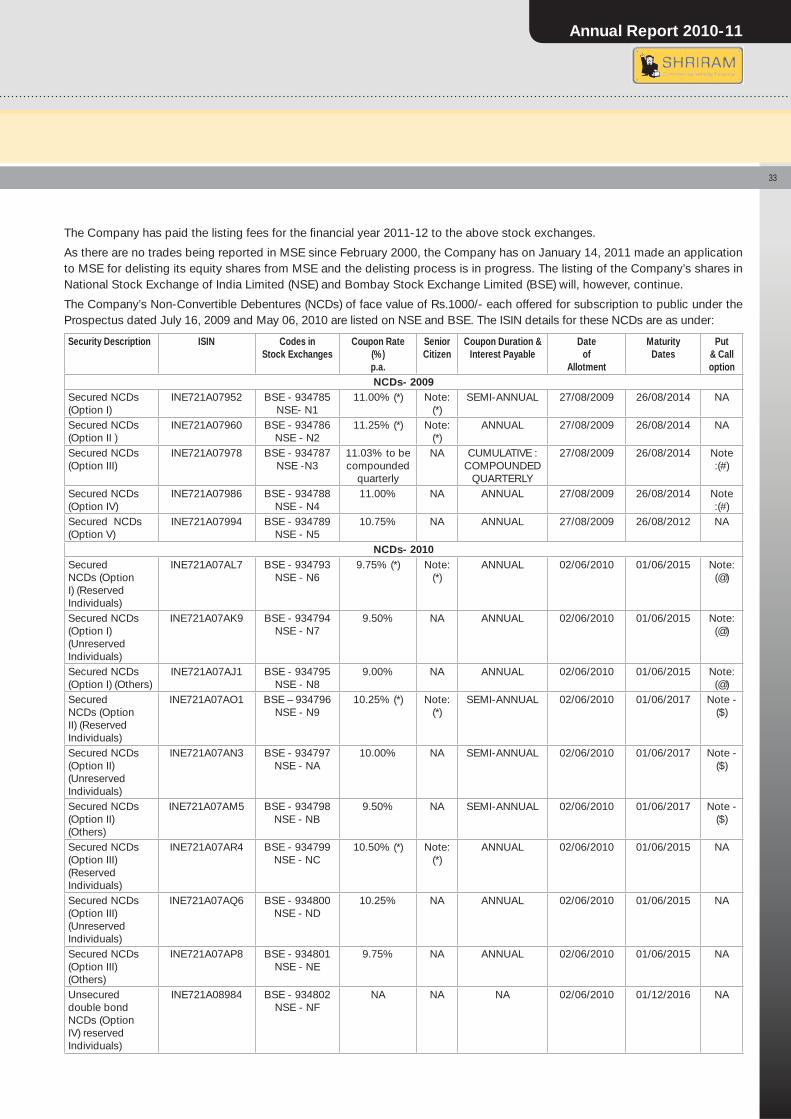
The Company has paid the listing fees for the fi nancial year 2011-12 to the above stock exchanges.
As there are no trades being reported in MSE since February 2000, the Company has on January 14, 2011 made an application to MSE for delisting its equity shares from MSE and the delisting process is in progress. The listing of the Company’s shares in National Stock Exchange of India Limited (NSE) and Bombay Stock Exchange Limited (BSE) will, however, continue.
The Company’s Non-Convertible Debentures (NCDs) of face value of Rs.1000/- each offered for subscription to public under the Prospectus dated July 16, 2009 and May 06, 2010 are listed on NSE and BSE. The ISIN details for these NCDs are as under:
Security Description ISIN Codes in Stock Exchanges
Coupon Rate(%) p.a.
Senior Citizen
Coupon Duration & Interest Payable
Date of
Allotment
Maturity Dates
Put & Call option
NCDs- 2009Secured NCDs (Option I)
INE721A07952 BSE - 934785 NSE- N1
11.00% (*) Note: (*)
SEMI-ANNUAL 27/08/2009 26/08/2014 NA
Secured NCDs (Option II )
INE721A07960 BSE - 934786 NSE - N2
11.25% (*) Note: (*)
ANNUAL 27/08/2009 26/08/2014 NA
Secured NCDs (Option III)
INE721A07978 BSE - 934787 NSE -N3
11.03% to be compounded
quarterly
NA CUMULATIVE : COMPOUNDED
QUARTERLY
27/08/2009 26/08/2014 Note :(#)
Secured NCDs (Option IV)
INE721A07986 BSE - 934788 NSE - N4
11.00% NA ANNUAL 27/08/2009 26/08/2014 Note :(#)
Secured NCDs (Option V)
INE721A07994 BSE - 934789 NSE - N5
10.75% NA ANNUAL 27/08/2009 26/08/2012 NA
NCDs- 2010Secured NCDs (Option I) (Reserved Individuals)
INE721A07AL7 BSE - 934793NSE - N6
9.75% (*) Note: (*)
ANNUAL 02/06/2010 01/06/2015 Note: (@)
Secured NCDs (Option I) (Unreserved Individuals)
INE721A07AK9 BSE - 934794 NSE - N7
9.50% NA ANNUAL 02/06/2010 01/06/2015 Note: (@)
Secured NCDs (Option I) (Others)
INE721A07AJ1 BSE - 934795 NSE - N8
9.00% NA ANNUAL 02/06/2010 01/06/2015 Note: (@)
Secured NCDs (Option II) (Reserved Individuals)
INE721A07AO1 BSE – 934796 NSE - N9
10.25% (*) Note: (*)
SEMI-ANNUAL 02/06/2010 01/06/2017 Note - ($)
Secured NCDs (Option II) (Unreserved Individuals)
INE721A07AN3 BSE - 934797 NSE - NA
10.00% NA SEMI-ANNUAL 02/06/2010 01/06/2017 Note - ($)
Secured NCDs (Option II) (Others)
INE721A07AM5 BSE - 934798 NSE - NB
9.50% NA SEMI-ANNUAL 02/06/2010 01/06/2017 Note - ($)
Secured NCDs (Option III) (Reserved Individuals)
INE721A07AR4 BSE - 934799 NSE - NC
10.50% (*) Note: (*)
ANNUAL 02/06/2010 01/06/2015 NA
Secured NCDs (Option III) (Unreserved Individuals)
INE721A07AQ6 BSE - 934800 NSE - ND
10.25% NA ANNUAL 02/06/2010 01/06/2015 NA
Secured NCDs (Option III) (Others)
INE721A07AP8 BSE - 934801 NSE - NE
9.75% NA ANNUAL 02/06/2010 01/06/2015 NA
Unsecured double bond NCDs (Option IV) reserved Individuals)
INE721A08984 BSE - 934802 NSE - NF
NA NA NA 02/06/2010 01/12/2016 NA
33
Annual Report 2010-11
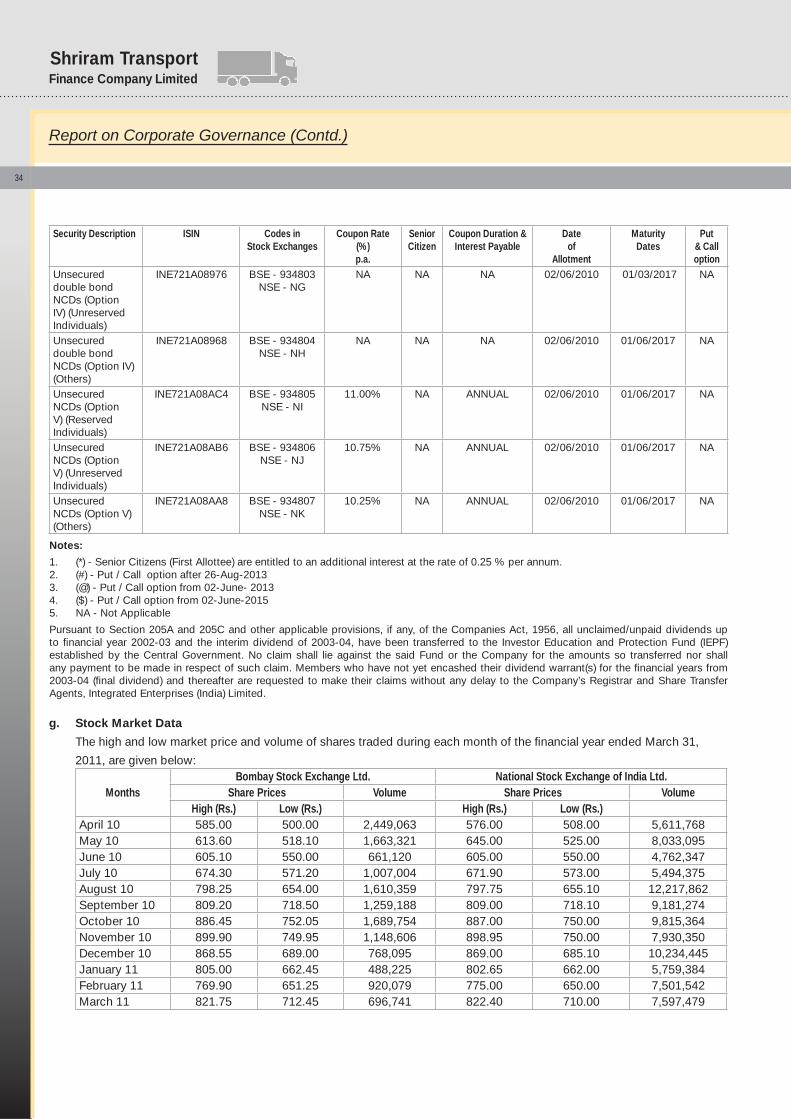
Finance Company LimitedShriram Transport
Security Description ISIN Codes in Stock Exchanges
Coupon Rate(%) p.a.
Senior Citizen
Coupon Duration & Interest Payable
Date of
Allotment
Maturity Dates
Put & Call option
Unsecured double bond NCDs (Option IV) (Unreserved Individuals)
INE721A08976 BSE - 934803 NSE - NG
NA NA NA 02/06/2010 01/03/2017 NA
Unsecured double bond NCDs (Option IV) (Others)
INE721A08968 BSE - 934804 NSE - NH
NA NA NA 02/06/2010 01/06/2017 NA
Unsecured NCDs (Option V) (Reserved Individuals)
INE721A08AC4 BSE - 934805 NSE - NI
11.00% NA ANNUAL 02/06/2010 01/06/2017 NA
Unsecured NCDs (Option V) (Unreserved Individuals)
INE721A08AB6 BSE - 934806 NSE - NJ
10.75% NA ANNUAL 02/06/2010 01/06/2017 NA
Unsecured NCDs (Option V) (Others)
INE721A08AA8 BSE - 934807 NSE - NK
10.25% NA ANNUAL 02/06/2010 01/06/2017 NA
Notes:
1. (*) - Senior Citizens (First Allottee) are entitled to an additional interest at the rate of 0.25 % per annum.2. (#) - Put / Call option after 26-Aug-20133. (@) - Put / Call option from 02-June- 20134. ($) - Put / Call option from 02-June-20155. NA - Not Applicable
Pursuant to Section 205A and 205C and other applicable provisions, if any, of the Companies Act, 1956, all unclaimed/unpaid dividends up to fi nancial year 2002-03 and the interim dividend of 2003-04, have been transferred to the Investor Education and Protection Fund (IEPF) established by the Central Government. No claim shall lie against the said Fund or the Company for the amounts so transferred nor shall any payment to be made in respect of such claim. Members who have not yet encashed their dividend warrant(s) for the fi nancial years from 2003-04 (fi nal dividend) and thereafter are requested to make their claims without any delay to the Company’s Registrar and Share Transfer Agents, Integrated Enterprises (India) Limited.
g. Stock Market Data
The high and low market price and volume of shares traded during each month of the fi nancial year ended March 31,
2011, are given below:
MonthsBombay Stock Exchange Ltd. National Stock Exchange of India Ltd.
Share Prices Volume Share Prices VolumeHigh (Rs.) Low (Rs.) High (Rs.) Low (Rs.)
April 10 585.00 500.00 2,449,063 576.00 508.00 5,611,768May 10 613.60 518.10 1,663,321 645.00 525.00 8,033,095June 10 605.10 550.00 661,120 605.00 550.00 4,762,347July 10 674.30 571.20 1,007,004 671.90 573.00 5,494,375August 10 798.25 654.00 1,610,359 797.75 655.10 12,217,862September 10 809.20 718.50 1,259,188 809.00 718.10 9,181,274October 10 886.45 752.05 1,689,754 887.00 750.00 9,815,364November 10 899.90 749.95 1,148,606 898.95 750.00 7,930,350December 10 868.55 689.00 768,095 869.00 685.10 10,234,445January 11 805.00 662.45 488,225 802.65 662.00 5,759,384February 11 769.90 651.25 920,079 775.00 650.00 7,501,542March 11 821.75 712.45 696,741 822.40 710.00 7,597,479
Report on Corporate Governance (Contd.)
34
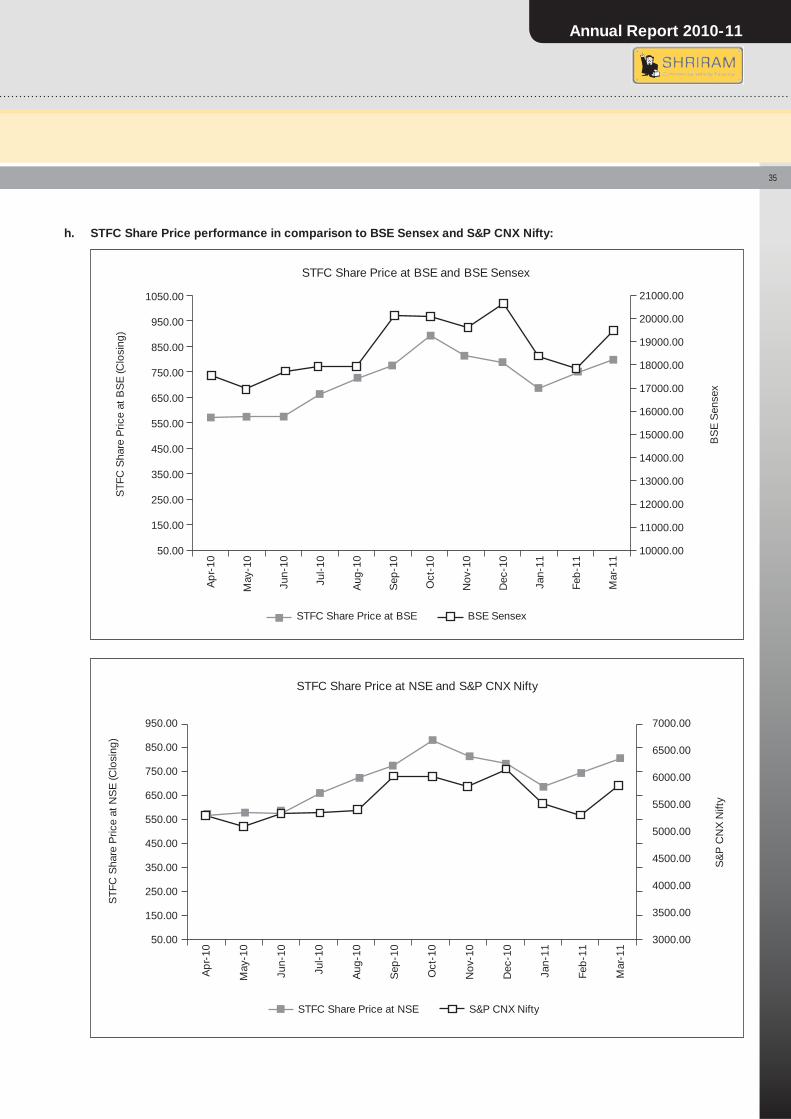
h. STFC Share Price performance in comparison to BSE Sensex and S&P CNX Nifty:
BS
E S
ense
x
STF
C S
hare
Pric
e at
BS
E (C
losi
ng)
BSE SensexSTFC Share Price at BSE
950.00
1050.00
Ap
r-10
May
-10
Jun-
10
Jul-
10
Aug
-10
Sep
-10
Oct
-10
Nov
-10
Dec
-10
Jan-
11
Feb
-11
Mar
-11
850.00
750.00
650.00
550.00
450.00
350.00
250.00
150.00
50.00
19000.00
20000.00
21000.00
17000.00
18000.00
16000.00
15000.00
14000.00
13000.00
12000.00
11000.00
10000.00
STFC Share Price at BSE and BSE Sensex
STFC Share Price at NSE and S&P CNX Nifty
S&
P C
NX
Nift
y
STF
C S
hare
Pric
e at
NS
E (C
losi
ng)
950.00
Ap
r-10
May
-10
Jun-
10
Jul-
10
Aug
-10
Sep
-10
Oct
-10
Nov
-10
Dec
-10
Jan-
11
Feb
-11
Mar
-11
850.00
750.00
650.00
550.00
450.00
350.00
250.00
150.00
50.00
7000.00
6500.00
6000.00
5500.00
5000.00
4500.00
4000.00
3500.00
3000.00
S&P CNX NiftySTFC Share Price at NSE
35
Annual Report 2010-11
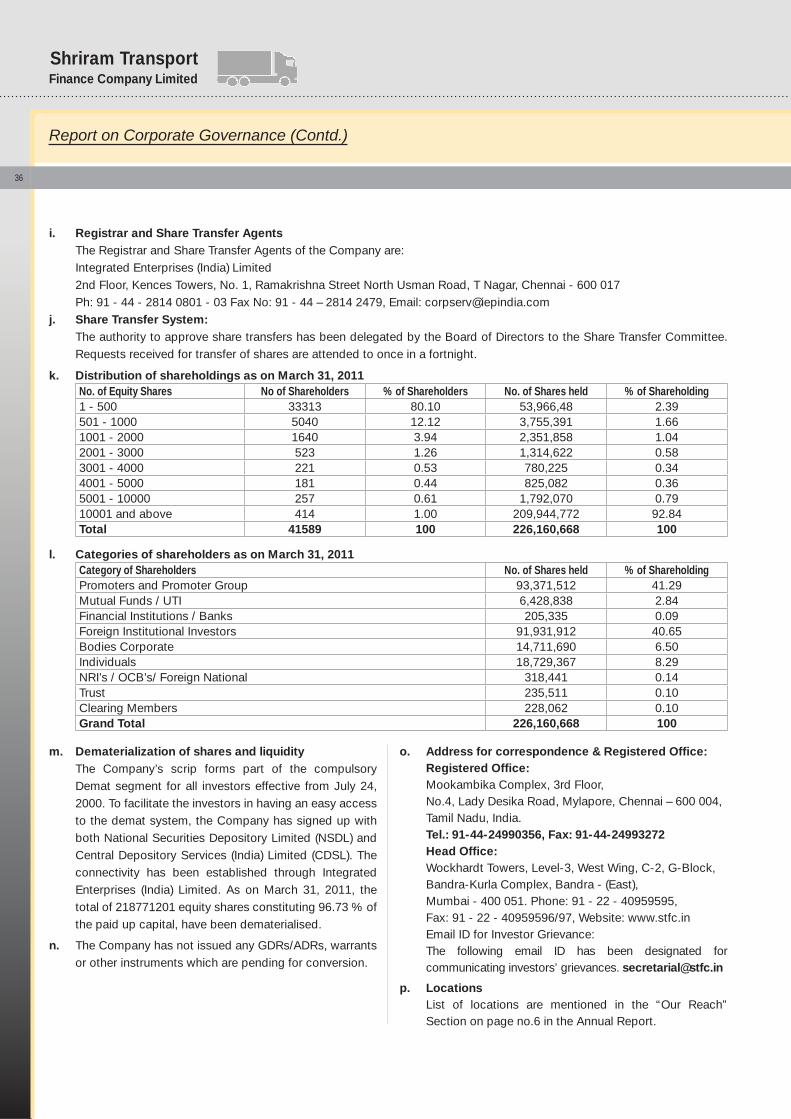
Finance Company LimitedShriram Transport
i. Registrar and Share Transfer Agents The Registrar and Share Transfer Agents of the Company are: Integrated Enterprises (India) Limited 2nd Floor, Kences Towers, No. 1, Ramakrishna Street North Usman Road, T Nagar, Chennai - 600 017 Ph: 91 - 44 - 2814 0801 - 03 Fax No: 91 - 44 – 2814 2479, Email: [email protected]. Share Transfer System: The authority to approve share transfers has been delegated by the Board of Directors to the Share Transfer Committee.
Requests received for transfer of shares are attended to once in a fortnight.
k. Distribution of shareholdings as on March 31, 2011No. of Equity Shares No of Shareholders % of Shareholders No. of Shares held % of Shareholding1 - 500 33313 80.10 53,966,48 2.39501 - 1000 5040 12.12 3,755,391 1.661001 - 2000 1640 3.94 2,351,858 1.042001 - 3000 523 1.26 1,314,622 0.583001 - 4000 221 0.53 780,225 0.344001 - 5000 181 0.44 825,082 0.365001 - 10000 257 0.61 1,792,070 0.7910001 and above 414 1.00 209,944,772 92.84Total 41589 100 226,160,668 100
l. Categories of shareholders as on March 31, 2011Category of Shareholders No. of Shares held % of ShareholdingPromoters and Promoter Group 93,371,512 41.29Mutual Funds / UTI 6,428,838 2.84Financial Institutions / Banks 205,335 0.09Foreign Institutional Investors 91,931,912 40.65Bodies Corporate 14,711,690 6.50Individuals 18,729,367 8.29NRI’s / OCB’s/ Foreign National 318,441 0.14Trust 235,511 0.10Clearing Members 228,062 0.10Grand Total 226,160,668 100
m. Dematerialization of shares and liquidity The Company’s scrip forms part of the compulsory
Demat segment for all investors effective from July 24, 2000. To facilitate the investors in having an easy access to the demat system, the Company has signed up with both National Securities Depository Limited (NSDL) and Central Depository Services (India) Limited (CDSL). The connectivity has been established through Integrated Enterprises (India) Limited. As on March 31, 2011, the total of 218771201 equity shares constituting 96.73 % of the paid up capital, have been dematerialised.
n. The Company has not issued any GDRs/ADRs, warrants or other instruments which are pending for conversion.
o. Address for correspondence & Registered Offi ce: Registered Offi ce: Mookambika Complex, 3rd Floor,
No.4, Lady Desika Road, Mylapore, Chennai – 600 004, Tamil Nadu, India.
Tel.: 91-44-24990356, Fax: 91-44-24993272 Head Offi ce: Wockhardt Towers, Level-3, West Wing, C-2, G-Block,
Bandra-Kurla Complex, Bandra - (East), Mumbai - 400 051. Phone: 91 - 22 - 40959595,
Fax: 91 - 22 - 40959596/97, Website: www.stfc.in Email ID for Investor Grievance: The following email ID has been designated for
communicating investors’ grievances. [email protected]
p. Locations List of locations are mentioned in the “Our Reach”
Section on page no.6 in the Annual Report.
Report on Corporate Governance (Contd.)
36
DETAILS PURSUANT TO CLAUSE 49 IV (G) (I) OF THE LISTING AGREEMENT IN RESPECT OF DIRECTORS SEEKING
REAPPOINTMENT
Mr. Arun Duggal
Mr. Arun Duggal is the non-executive Chairman of our Board. Mr. Duggal holds a bachelor’s degree in mechanical engineering
from the Indian Institute of Technology, Delhi and a master’s degree in business administration from the Indian Institute of
Management, Ahmedabad. Mr. Duggal is an experienced international banker and has an experience of approximately 33 years
in the banking and fi nance industry. He has advised companies on fi nancial strategy, mergers and acquisitions and on various
means of capital raising.
He is on the Board of Directors of Jubilant Energy, Netherlands (Chairman Audit Committee), Patni Computers, Fidelity Fund
Management, Ecron Acunova, Zuari Industries, Info Edge (Chairman Audit Committee), Dish TV, Mundra Port, Mortice Limited
(Singapore) (Chairman of Audit Committee), Shriram City Union Finance Limited, Shriram Capital Limited and others. He is also
a member of the Investment Committee of Axis Private Equity. He had a distinguished career with Bank of America for 26 years
in the US, Hong Kong, Japan, Philippines, etc. He was the Chief Executive of Bank of America in India from 1998 to 2001.
Currently, he is a visiting faculty at the Indian Institute of Management, Ahmedabad teaching Venture Capital.
Mr. Ranvir Dewan
Mr. Ranvir Dewan is a non-executive Director on our Board. Mr. Dewan holds a B.Com (Hons) degree from Shriram College of
Commerce, Delhi University, India. He is a fellow member of the Institute of Chartered Accountants in England & Wales (FCA) and
a member of the Canadian Institute of Chartered Accountants (CA). Mr. Dewan represents Newbridge India Investments II Limited
on our Board. He has over 30 years of experience in the fi nance and investment sector. Mr. Dewan joined TPG-Newbridge Capital
in July 2006 and is currently the Head of Financial Institutions Group Operations. Previously he was Executive Vice President
and Chief Financial Offi cer of Standard Chartered First Bank in Seoul, Korea. He has also spent over thirteen years at Citibank in
various senior positions in its international businesses. In his previous assignment, he was Vice President and Regional Financial
Controller of Citibank’s Global Consumer Bank with responsibilities covering 11 countries in the Asia Pacifi c region. He has also
held senior positions with KPMG in Canada and England where he specialised in the audits of fi nancial institutions.
Mr. Dewan serves on the Boards of Shriram City Union Finance in Chennai, India and PT Bank Tabunean Pensiunan Nasional
Tbp (“BTPN”) in Jakarta, Indonesia and is a member of the Audit and Risk Committees of Bank BTPN. Mr. Dewan is an advisor
of Taishin Financial Holdings (the 9th largest fi nancial holding company in Taiwan).
Mr. S. Venkatakrishnan
Mr. S. Venkatakrishnan is a non-executive Director on our Board. Mr. Venkatakrishnan is a post graduate in Mathematics from
Madras University. Mr. Venkatakrishnan is a member of the Indian Audit and Accounts Service, Government of India, where he
has held senior positions in the Finance, Audit & Accounts department of the Government and other Public Undertakings. He
also functioned as BIFR Director in several companies for a period of fi ve years. He has been an advisor to the Company for
over ten years.
37
Annual Report 2010-11
Finance Company LimitedShriram Transport
CEO/CFO CERTIFICATION
We, to the best of our knowledge and belief, certify that-
a. We have reviewed fi nancial statements and the cash fl ow statements for the year ended March 31, 2011 and that to the best
of our knowledge and belief;
i. These statements do not contain any materially untrue statement or omit any material fact or contain statements that
might be misleading.
ii. These statements together present a true and fair view of the Company’s affairs and are in compliance with existing
accounting standards, applicable laws and regulations.
b. There are, to the best of our knowledge and belief, no transactions entered into by the Company during the year which are
fraudulent, illegal or violative of the Company’s code of conduct.
c. We accept responsibility for establishing and maintaining internal controls for fi nancial reporting and that we have evaluated
the effectiveness of internal control systems of the Company pertaining to fi nancial reporting and we have disclosed to the
Auditors and the Audit Committee, defi ciencies in the design or operation of such internal controls, if any, of which we are
aware and the steps we have taken or propose to take to rectify these defi ciencies.
d. We have disclosed, based on our evaluation wherever applicable, to the Auditors and the Audit Committee that;
i. There were no material defi ciencies in internal controls over fi nancial reporting during the year;
ii. All the signifi cant changes in accounting policies during the year, if any, have been disclosed in the notes to the
fi nancial statements; and
iii. There were no instances of signifi cant fraud of which we are aware and the involvement therein, of the management or
an employee having a signifi cant role in the Company’s internal control system over fi nancial reporting.
R. SRIDHAR
Managing Director
Mumbai PARAG SHARMA
April 29, 2011 Chief Financial Offi cer
Report on Corporate Governance (Contd.)
DECLARATION REGARDING COMPLIANCE BY BOARD MEMBERS AND
SENIOR MANAGEMENT PERSONNEL WITH THE COMPANY’S CODE OF CONDUCT
The Board of Directors of Shriram Transport Finance Company Limited at its Meeting held on January 5, 2005 adopted Code of
Conduct as amended on October 27, 2010 to be followed by all Members of the Board and Senior Management Personnel of
the Company respectively in compliance with the revised Clause 49 of the Listing Agreement with the Stock Exchanges where
the shares of the Company are listed.
As provided under Clause 49 of the Listing Agreement executed with the Stock Exchanges, all Board Members and Senior
Management Personnel have affi rmed Compliance with the Code of Conduct for the year ended March 31, 2011.
Mumbai R. SRIDHAR
April 29, 2011 Managing Director
38
To
The Members of Shriram Transport Finance Company Limited,
We S. R. Batliboi & Co. (“SRB”) and G. D. Apte & Co. (“GDA”) have jointly examined the compliance of conditions of Corporate
Governance by Shriram Transport Finance Company Limited (‘the Company’), for the year ended on March 31, 2011, as stipulated
in Clause 49 of the Listing Agreement of the said Company with stock exchanges.
The Compliance of conditions of Corporate Governance is the responsibility of the management. Our examination was limited
to procedures and implementation thereof, adopted by the Company for ensuring the compliance of the conditions of Corporate
Governance. It is neither an audit nor an expression of opinion on the fi nancial statements of the Company.
In our opinion and to the best of our information and according to the explanations given to us, we certify that the Company has
complied with the conditions of Corporate Governance as stipulated in the above mentioned Listing Agreement.
We further state that such compliance is neither an assurance as to the future viability of the Company nor the effi ciency or
effectiveness with which the management has conducted the affairs of the Company.
For S.R. BATLIBOI & CO. For G. D. APTE & CO.
Firm Registration No: 301003E Firm Registration No: 100515W
Chartered Accountants Chartered Accountants
per Shrawan Jalan C. M. Dixit
Partner Partner
Membership No.:102102 Membership No.: 17532
Mumbai Mumbai
April 29, 2011 April 29, 2011
Certifi cate on Corporate Governance39
Annual Report 2010-11

Financial Section
Annual Report 2010-11
41
Auditors’ Report
To,
The Members of
Shriram Transport Finance Company Limited
1. We S. R. Batliboi & Co. (“SRB”) and G. D. Apte & Co.
(“GDA”) have jointly audited the attached Balance Sheet
of Shriram Transport Finance Company Limited (‘the
Company’) as at March 31, 2011 and also the Profi t and
Loss Account and the Cash Flow Statement for the year
ended on that date annexed thereto. These fi nancial
statements are the responsibility of the Company’s
management. Our responsibility is to express an opinion
on these fi nancial statements based on our audit.
2. We conducted our audit in accordance with auditing
standards generally accepted in India. Those Standards
require that we plan and perform the audit to obtain
reasonable assurance about whether the fi nancial
statements are free of material misstatement. An audit
includes examining, on a test basis, evidence supporting
the amounts and disclosures in the fi nancial statements.
An audit also includes assessing the accounting principles
used and signifi cant estimates made by management,
as well as evaluating the overall fi nancial statements
presentation. We believe that our audit provides a
reasonable basis for our opinion.
3. As required by the Companies (Auditor’s Report) Order,
2003 (as amended) (‘the Order’) issued by the Central
Government of India in terms of sub-section (4A) of
Section 227 of the Companies Act, 1956 (‘the Act’), we
enclose in the Annexure a statement on the matters
specifi ed in paragraphs 4 and 5 of the said Order.
4. Further to our comments in the Annexure referred to
above, we report that:
i. We have obtained all the information and explanations,
which to the best of our knowledge and belief were
necessary for the purposes of our audit;
ii. In our opinion, proper books of account as required
by law have been kept by the Company so far as it
appears from our examination of those books;
iii. The Balance Sheet, Profi t and Loss Account and
Cash Flow Statement dealt with by this report are in
agreement with the books of account;
iv. In our opinion, the Balance Sheet, Profi t and Loss
Account and Cash Flow Statement dealt with by this
report comply with the accounting standards referred
to in sub-section (3C) of section 211 of the Act.
v. On the basis of the written representations received
from the directors, as on March 31, 2011, and taken
on record by the Board of Directors, we report that
none of the directors is disqualifi ed as on March 31,
2011 from being appointed as director in terms of
clause (g) of sub-section (1) of section 274 of the Act.
vi. In our opinion and to the best of our information
and according to the explanations given to us, the
said accounts give the information required by the
Companies Act, 1956, in the manner so required
and give a true and fair view in conformity with the
accounting principles generally accepted in India;
a) in the case of the Balance Sheet, of the state of
affairs of the Company as at March 31, 2011;
b) in the case of the Profi t and Loss Account, of
the profi t for the year ended on that date; and
c) in the case of the Cash Flow Statement, of the
cash fl ows for the year ended on that date.
For S.R. BATLIBOI & Co. For G. D. Apte & Co.
Firm Registration No:- 301003E Firm Registration No:- 100515W
Chartered Accountants Chartered Accountants
per Shrawan Jalan C. M. Dixit
Partner Partner
Membership No.:102102 Membership No.: 17532
Mumbai Mumbai
April 29, 2011 April 29, 2011
Finance Company LimitedShriram TransportShriram Transport
Standalone Accounts
42
Annexure referred to in paragraph 3 of our report of even date
Re: Shriram Transport Finance Company Limited (‘the Company’)
(i) (a) The Company has maintained proper records showing full particulars including quantitative details and situation of fi xed assets.
(b) All fi xed assets have not been physically verifi ed by the management during the year but there is a regular programme of verifi cation which, in our opinion, is reasonable having regard to the size of the Company and the nature of its assets. No material discrepancies were noticed on such verifi cation.
(c) There was no substantial disposal of fi xed assets during the year.
(ii) The Company is a Non-Banking Financial Company (‘NBFC’) engaged in the business of giving loans and does not maintain any inventory. Therefore the provisions of clause 4(ii) of the Order are not applicable to the Company.
(iii) (a) The Company has granted loan to one party covered in the register maintained under section 301 of the Companies Act, 1956. The maximum amount involved during the year was Rs. 334.26 lacs and the year- end balance of loans granted to such parties was Rs. 111.99 lacs.
(b) In our opinion and according to the information and explanations given to us, the rate of interest and other terms and conditions for such loans are not prima facie prejudicial to the interest of the Company.
(c) In respect of loans granted, repayment of the principal amount is as stipulated and payment of interest have been regular.
(d) There is no overdue amount of loans granted to companies, fi rms or other parties listed in the register maintained under section 301 of the Companies Act, 1956.
(e) As informed, the Company has not taken any loans, secured or unsecured from companies, fi rms or other parties covered in the register maintained under section 301 of the Companies Act, 1956 and therefore provision of clause iii(f) and iii(g) are not applicable to the Company.
(iv) In our opinion and according to the information and explanations given to us, there is an adequate internal control system commensurate with the size of the Company and the nature of its business, for the purchase of fi xed assets and for rendering of services. The activities of the Company do not involve purchase of inventory and the sale of goods. During the course of our audit, no major weakness has been noticed in the internal control system in respect of these areas and accordingly the question on commenting on whether there is a continuing failure to
correct major weakness in the internal control system of the company does not arise.
(v) (a) According to the information and explanations provided by the management, we are of the opinion that the particulars of contracts or arrangements referred to in section 301 of the Act that need to be entered into the register maintained under section 301 have been so entered.
(b) In our opinion and according to the information and explanations given to us, the transactions made in pursuance of such contracts or arrangements exceeding value of Rupees fi ve lakhs have been entered into during the fi nancial year at prices which are reasonable having regard to the prevailing market prices at the relevant time.
(vi) In respect of deposits accepted, in our opinion and according to the information and explanations given to us, directives issued by the Reserve Bank of India and the provisions of sections 58A, 58AA or any other relevant provisions of the Act and the rules framed there under, to the extent applicable, have been complied with. We are informed by the management that no order has been passed by the Company Law Board, National Company Law Tribunal or Reserve Bank of India or any Court or any other Tribunal.
(vii) In our opinion, the Company has an internal audit system commensurate with the size and nature of its business.
(viii) To the best of our knowledge and as explained, the Central Government has not prescribed maintenance of cost records under clause (d) of sub-section (1) of section 209 of the Companies Act, 1956 for the products of the Company.
(ix) (a) The Company is regular in depositing with appropriate authorities undisputed statutory dues including provident fund, investor education and protection fund, employees’ state insurance, income-tax, sales-tax, wealth-tax, service tax, cess and other material statutory dues applicable to it. The provisions relating to customs duty and excise duty are not applicable to the Company
Further, Section 441A of the Act has not been notifi ed by the Central Government of India upto the reporting date, and accordingly, as at the reporting date there is no statutory due payable under section 441A of the Act.
(b) According to the information and explanations given to us, no undisputed amounts payable in respect of provident fund, investor education and protection fund, employees’ state insurance, income-tax, wealth-tax, service tax, sales-tax, cess and other material undisputed statutory dues were outstanding, at the year end, for a period of
Annual Report 2010-11
43
(x) The Company has no accumulated losses at the end of the fi nancial year and it has not incurred cash losses in the current and immediately preceding fi nancial year.
(xi) Based on our audit procedures and as per the information and explanations given by the management, we are of the opinion that the Company has not defaulted in repayment of dues to a fi nancial institution, bank or debenture holders.
(xii) Based on our examination of documents and records, we are of the opinion that the Company has maintained adequate records where the Company has granted loans and advances on the basis of security by way of pledge of shares, debentures and other securities.
(xiii) In our opinion, the Company is not a chit fund or a nidhi / mutual benefi t fund / society. Therefore, the provisions of clause 4(xiii) of the Order, are not applicable to the Company.
(xiv) In respect of dealing/trading in shares, securities, debentures and other investments, in our opinion and according to the information and explanations given to us, proper records have been maintained of the transactions and contracts and timely entries have been made therein. The shares, securities, debentures and other investments have been held by the Company, in its own name.
(xv) According to the information and explanations given to us, the Company has given guarantee for loans taken by others from bank or fi nancial institutions, the terms and conditions whereof in our opinion are not prima-facie prejudicial to the interest of the Company.
(xvi) To the best of our knowledge and belief and according to the information and explanations given to us, in our opinion, term loans availed by the Company were applied by the Company during the year for the purposes for which the loans were obtained other than funds
temporarily invested pending utilization of the funds for the intended use.
(xvii) According to the information and explanations given to us and on an overall examination of the balance sheet of the Company, we report that no funds raised on short-term basis have been used for long-term investment.
(xviii) The Company has not made any preferential allotment of shares to parties or companies covered in the register maintained under section 301 of the Act.
(xix) According to the information and explanations given to us, during the period covered by our audit report, the Company had issued 11,700 and 1,37,47,441 secured non convertible debentures of Rs 10,00,000 and Rs.1,000 each respectively. The Company has created security or charge in respect of debentures issued.
(xx) We have verifi ed that the end use of money raised by public issues is as disclosed in the notes to the fi nancial statements.
(xxi) Based upon the audit procedures performed for the purpose of reporting the true and fair view of the fi nancial statements and as per the information and explanations given by the management, we report that no fraud on or by the Company has been noticed or reported during the course of our audit.
For S.R. BATLIBOI & Co. For G. D. Apte & Co.
Firm Registration No:- 301003E Firm Registration No:- 100515W
Chartered Accountants Chartered Accountants
per Shrawan Jalan C. M. Dixit
Partner Partner
Membership No.:102102 Membership No.: 17532
Mumbai Mumbai
April 29, 2011 April 29, 2011
more than six months from the date they became payable. The provisions relating to customs duty and excise duty are not applicable to the Company
(c) According to the records of the Company, the dues outstanding of income-tax, sales-tax, wealth-tax, service tax, customs duty, excise duty and cess on account of any dispute, are as follows:
Name of the statute Nature of duesAmount
(Rs in lacs)Years to which the
amount relatesForum where
dispute is pendingIncome Tax Act, 1961 Income Tax demands 48.31 A.Y. 2003-04 CIT (Appeals)Income Tax Act, 1961 Income Tax demands 7,746.60 A.Y. 2008-09 CIT (Appeals)Finance Act, 1994 (Service Tax)
Service tax on hire purchase and lease transactions
8,406.10 2003-04 to 2009-10 Commissioner of Service Tax. (Refer note 11, in Schedule 21, Signifi cant Accounting Policies and Notes to Accounts)
Finance Act, 1994 (Service Tax)
Service Tax demands 315.00 2003-04 & 2004-05 Commissioner of Central Excise and Customs
Andhra Pradesh Value Added Tax
Value Added Tax 348.41 2004-05 to 2008-09 Andhra Pradesh High Court.
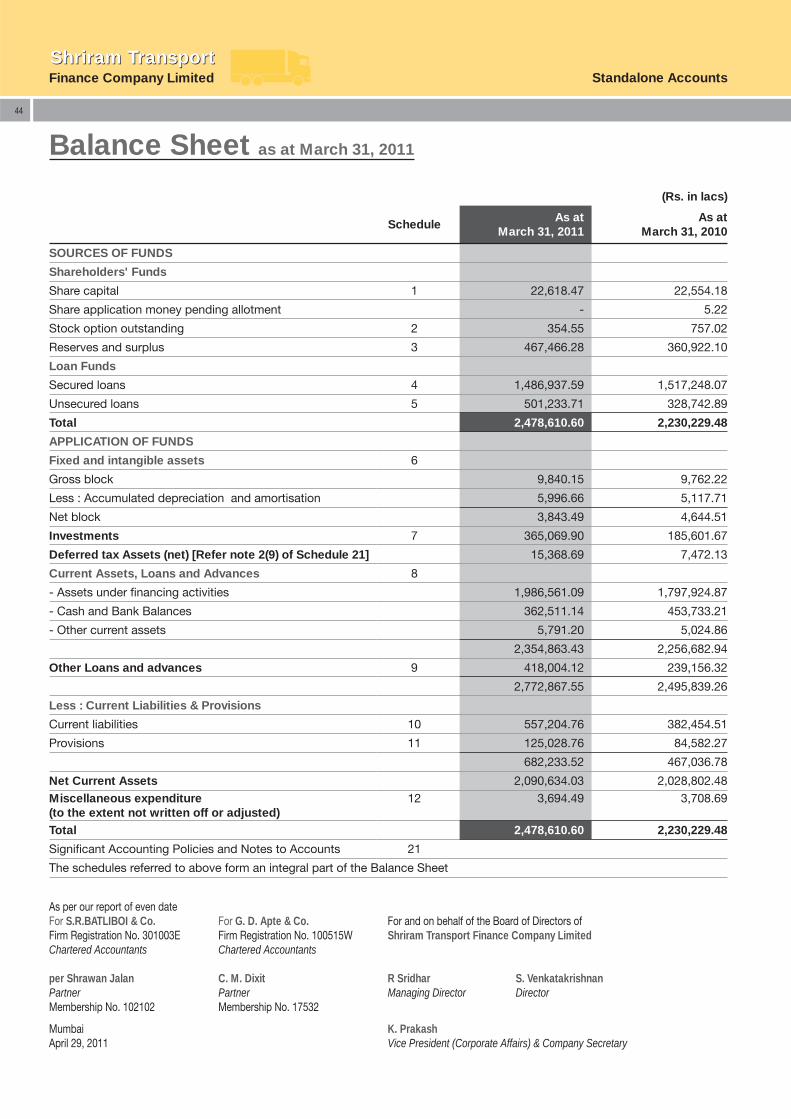
Finance Company LimitedShriram TransportShriram Transport
Standalone Accounts
44
Balance Sheet as at March 31, 2011
(Rs. in lacs)
Schedule As at
March 31, 2011 As at
March 31, 2010
SOURCES OF FUNDS
Shareholders' Funds
Share capital 1 22,618.47 22,554.18
Share application money pending allotment - 5.22
Stock option outstanding 2 354.55 757.02
Reserves and surplus 3 467,466.28 360,922.10
Loan Funds
Secured loans 4 1,486,937.59 1,517,248.07
Unsecured loans 5 501,233.71 328,742.89
Total 2,478,610.60 2,230,229.48
APPLICATION OF FUNDS
Fixed and intangible assets 6
Gross block 9,840.15 9,762.22
Less : Accumulated depreciation and amortisation 5,996.66 5,117.71
Net block 3,843.49 4,644.51
Investments 7 365,069.90 185,601.67
Deferred tax Assets (net) [Refer note 2(9) of Schedule 21] 15,368.69 7,472.13
Current Assets, Loans and Advances 8
- Assets under fi nancing activities 1,986,561.09 1,797,924.87
- Cash and Bank Balances 362,511.14 453,733.21
- Other current assets 5,791.20 5,024.86
2,354,863.43 2,256,682.94
Other Loans and advances 9 418,004.12 239,156.32
2,772,867.55 2,495,839.26
Less : Current Liabilities & Provisions
Current liabilities 10 557,204.76 382,454.51
Provisions 11 125,028.76 84,582.27
682,233.52 467,036.78
Net Current Assets 2,090,634.03 2,028,802.48
Miscellaneous expenditure (to the extent not written off or adjusted)
12 3,694.49 3,708.69
Total 2,478,610.60 2,230,229.48
Signifi cant Accounting Policies and Notes to Accounts 21
The schedules referred to above form an integral part of the Balance Sheet
As per our report of even dateFor S.R.BATLIBOI & Co. For G. D. Apte & Co. For and on behalf of the Board of Directors ofFirm Registration No. 301003E Firm Registration No. 100515W Shriram Transport Finance Company LimitedChartered Accountants Chartered Accountants
per Shrawan Jalan C. M. Dixit R Sridhar S. VenkatakrishnanPartner Partner Managing Director DirectorMembership No. 102102 Membership No. 17532
Mumbai K. PrakashApril 29, 2011 Vice President (Corporate Affairs) & Company Secretary
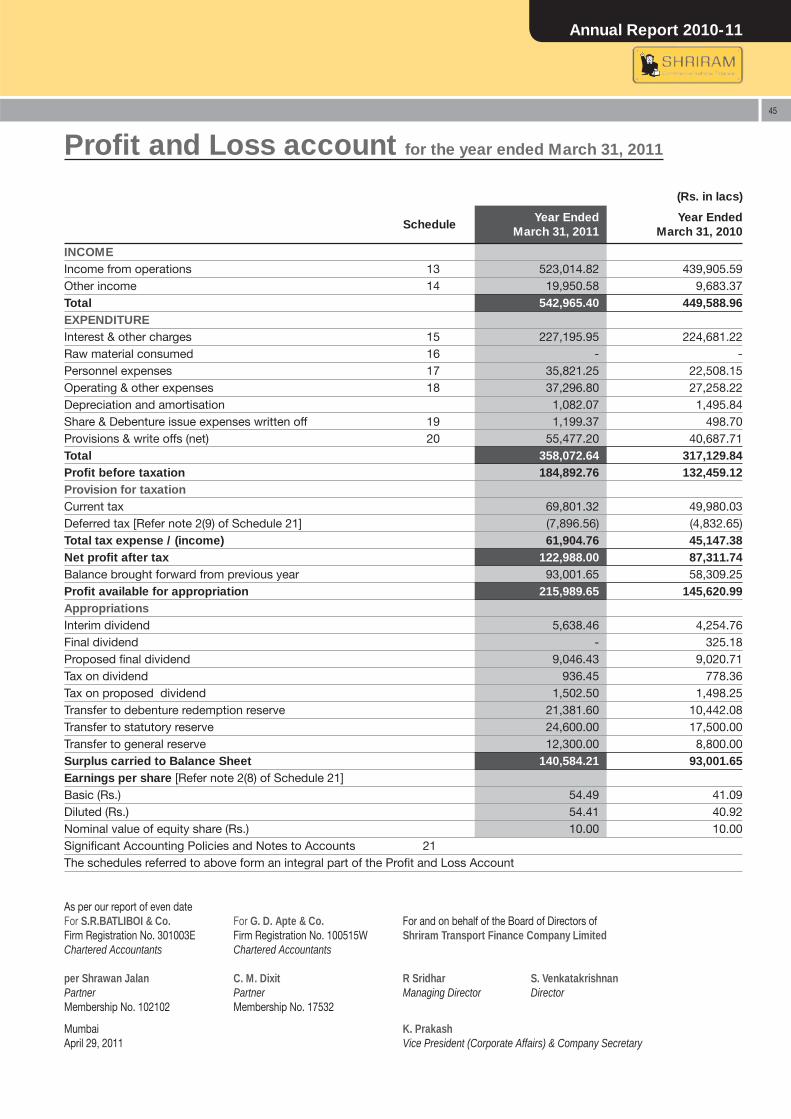
Annual Report 2010-11
45
Profi t and Loss account for the year ended March 31, 2011
(Rs. in lacs)
Schedule Year Ended
March 31, 2011 Year Ended
March 31, 2010
INCOME Income from operations 13 523,014.82 439,905.59 Other income 14 19,950.58 9,683.37 Total 542,965.40 449,588.96EXPENDITUREInterest & other charges 15 227,195.95 224,681.22 Raw material consumed 16 - - Personnel expenses 17 35,821.25 22,508.15 Operating & other expenses 18 37,296.80 27,258.22 Depreciation and amortisation 1,082.07 1,495.84Share & Debenture issue expenses written off 19 1,199.37 498.70 Provisions & write offs (net) 20 55,477.20 40,687.71 Total 358,072.64 317,129.84Profi t before taxation 184,892.76 132,459.12 Provision for taxationCurrent tax 69,801.32 49,980.03 Deferred tax [Refer note 2(9) of Schedule 21] (7,896.56) (4,832.65)Total tax expense / (income) 61,904.76 45,147.38 Net profi t after tax 122,988.00 87,311.74 Balance brought forward from previous year 93,001.65 58,309.25 Profi t available for appropriation 215,989.65 145,620.99 AppropriationsInterim dividend 5,638.46 4,254.76 Final dividend - 325.18 Proposed fi nal dividend 9,046.43 9,020.71 Tax on dividend 936.45 778.36 Tax on proposed dividend 1,502.50 1,498.25 Transfer to debenture redemption reserve 21,381.60 10,442.08 Transfer to statutory reserve 24,600.00 17,500.00 Transfer to general reserve 12,300.00 8,800.00 Surplus carried to Balance Sheet 140,584.21 93,001.65 Earnings per share [Refer note 2(8) of Schedule 21]Basic (Rs.) 54.49 41.09 Diluted (Rs.) 54.41 40.92 Nominal value of equity share (Rs.) 10.00 10.00 Signifi cant Accounting Policies and Notes to Accounts 21The schedules referred to above form an integral part of the Profi t and Loss Account
As per our report of even dateFor S.R.BATLIBOI & Co. For G. D. Apte & Co. For and on behalf of the Board of Directors ofFirm Registration No. 301003E Firm Registration No. 100515W Shriram Transport Finance Company LimitedChartered Accountants Chartered Accountants
per Shrawan Jalan C. M. Dixit R Sridhar S. VenkatakrishnanPartner Partner Managing Director DirectorMembership No. 102102 Membership No. 17532
Mumbai K. PrakashApril 29, 2011 Vice President (Corporate Affairs) & Company Secretary
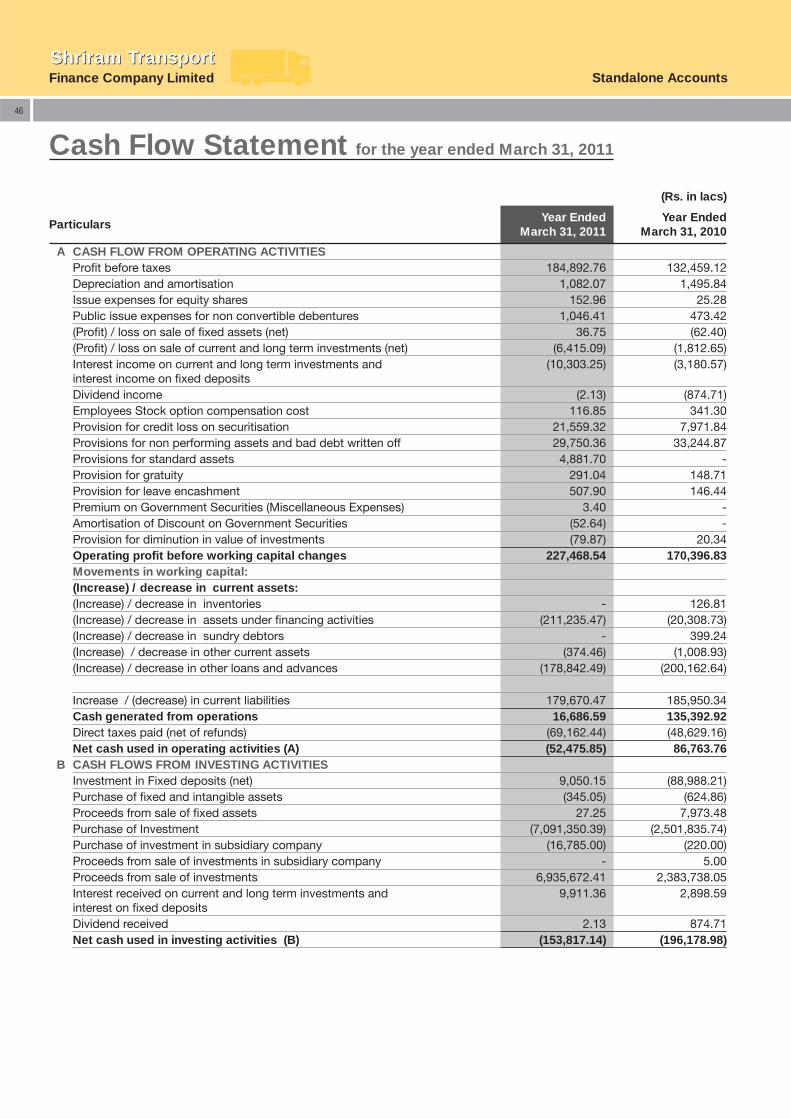
Finance Company LimitedShriram TransportShriram Transport
Standalone Accounts
46
Cash Flow Statement for the year ended March 31, 2011
(Rs. in lacs)
Particulars Year Ended
March 31, 2011 Year Ended
March 31, 2010
A CASH FLOW FROM OPERATING ACTIVITIESProfi t before taxes 184,892.76 132,459.12 Depreciation and amortisation 1,082.07 1,495.84 Issue expenses for equity shares 152.96 25.28 Public issue expenses for non convertible debentures 1,046.41 473.42 (Profi t) / loss on sale of fi xed assets (net) 36.75 (62.40)(Profi t) / loss on sale of current and long term investments (net) (6,415.09) (1,812.65)Interest income on current and long term investments and interest income on fi xed deposits
(10,303.25) (3,180.57)
Dividend income (2.13) (874.71)Employees Stock option compensation cost 116.85 341.30 Provision for credit loss on securitisation 21,559.32 7,971.84 Provisions for non performing assets and bad debt written off 29,750.36 33,244.87 Provisions for standard assets 4,881.70 - Provision for gratuity 291.04 148.71 Provision for leave encashment 507.90 146.44 Premium on Government Securities (Miscellaneous Expenses) 3.40 - Amortisation of Discount on Government Securities (52.64) - Provision for diminution in value of investments (79.87) 20.34 Operating profi t before working capital changes 227,468.54 170,396.83 Movements in working capital: (Increase) / decrease in current assets:(Increase) / decrease in inventories - 126.81 (Increase) / decrease in assets under fi nancing activities (211,235.47) (20,308.73)(Increase) / decrease in sundry debtors - 399.24 (Increase) / decrease in other current assets (374.46) (1,008.93)(Increase) / decrease in other loans and advances (178,842.49) (200,162.64)
Increase / (decrease) in current liabilities 179,670.47 185,950.34 Cash generated from operations 16,686.59 135,392.92 Direct taxes paid (net of refunds) (69,162.44) (48,629.16)Net cash used in operating activities (A) (52,475.85) 86,763.76
B CASH FLOWS FROM INVESTING ACTIVITIESInvestment in Fixed deposits (net) 9,050.15 (88,988.21)Purchase of fi xed and intangible assets (345.05) (624.86)Proceeds from sale of fi xed assets 27.25 7,973.48 Purchase of Investment (7,091,350.39) (2,501,835.74)Purchase of investment in subsidiary company (16,785.00) (220.00)Proceeds from sale of investments in subsidiary company - 5.00 Proceeds from sale of investments 6,935,672.41 2,383,738.05 Interest received on current and long term investments and interest on fi xed deposits
9,911.36 2,898.59
Dividend received 2.13 874.71 Net cash used in investing activities (B) (153,817.14) (196,178.98)
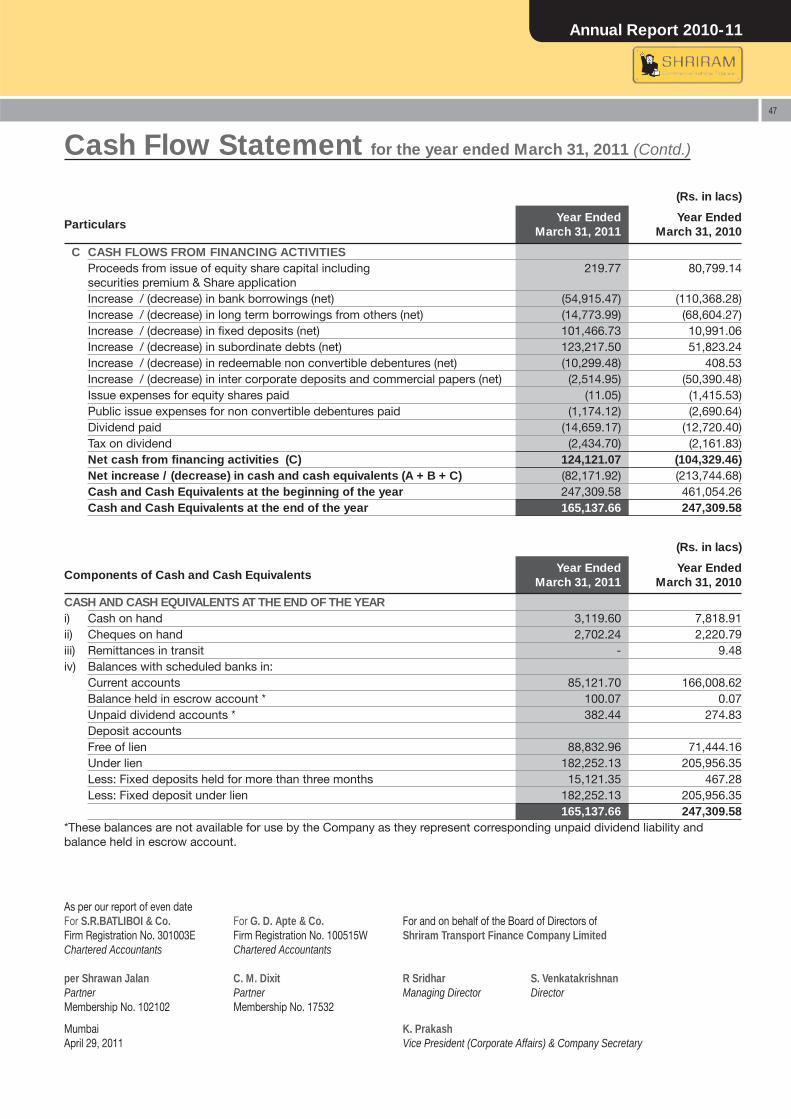
Annual Report 2010-11
47
C CASH FLOWS FROM FINANCING ACTIVITIESProceeds from issue of equity share capital including securities premium & Share application
219.77 80,799.14
Increase / (decrease) in bank borrowings (net) (54,915.47) (110,368.28)Increase / (decrease) in long term borrowings from others (net) (14,773.99) (68,604.27)Increase / (decrease) in fi xed deposits (net) 101,466.73 10,991.06 Increase / (decrease) in subordinate debts (net) 123,217.50 51,823.24 Increase / (decrease) in redeemable non convertible debentures (net) (10,299.48) 408.53 Increase / (decrease) in inter corporate deposits and commercial papers (net) (2,514.95) (50,390.48)Issue expenses for equity shares paid (11.05) (1,415.53)Public issue expenses for non convertible debentures paid (1,174.12) (2,690.64)Dividend paid (14,659.17) (12,720.40)Tax on dividend (2,434.70) (2,161.83)Net cash from fi nancing activities (C) 124,121.07 (104,329.46)Net increase / (decrease) in cash and cash equivalents (A + B + C) (82,171.92) (213,744.68)Cash and Cash Equivalents at the beginning of the year 247,309.58 461,054.26 Cash and Cash Equivalents at the end of the year 165,137.66 247,309.58
Cash Flow Statement for the year ended March 31, 2011 (Contd.)
(Rs. in lacs)
Components of Cash and Cash Equivalents Year Ended
March 31, 2011 Year Ended
March 31, 2010
CASH AND CASH EQUIVALENTS AT THE END OF THE YEARi) Cash on hand 3,119.60 7,818.91 ii) Cheques on hand 2,702.24 2,220.79 iii) Remittances in transit - 9.48 iv) Balances with scheduled banks in:
Current accounts 85,121.70 166,008.62 Balance held in escrow account * 100.07 0.07 Unpaid dividend accounts * 382.44 274.83 Deposit accountsFree of lien 88,832.96 71,444.16 Under lien 182,252.13 205,956.35 Less: Fixed deposits held for more than three months 15,121.35 467.28 Less: Fixed deposit under lien 182,252.13 205,956.35
165,137.66 247,309.58 *These balances are not available for use by the Company as they represent corresponding unpaid dividend liability and balance held in escrow account.
(Rs. in lacs)
Particulars Year Ended
March 31, 2011 Year Ended
March 31, 2010
As per our report of even dateFor S.R.BATLIBOI & Co. For G. D. Apte & Co. For and on behalf of the Board of Directors ofFirm Registration No. 301003E Firm Registration No. 100515W Shriram Transport Finance Company LimitedChartered Accountants Chartered Accountants
per Shrawan Jalan C. M. Dixit R Sridhar S. VenkatakrishnanPartner Partner Managing Director DirectorMembership No. 102102 Membership No. 17532
Mumbai K. PrakashApril 29, 2011 Vice President (Corporate Affairs) & Company Secretary
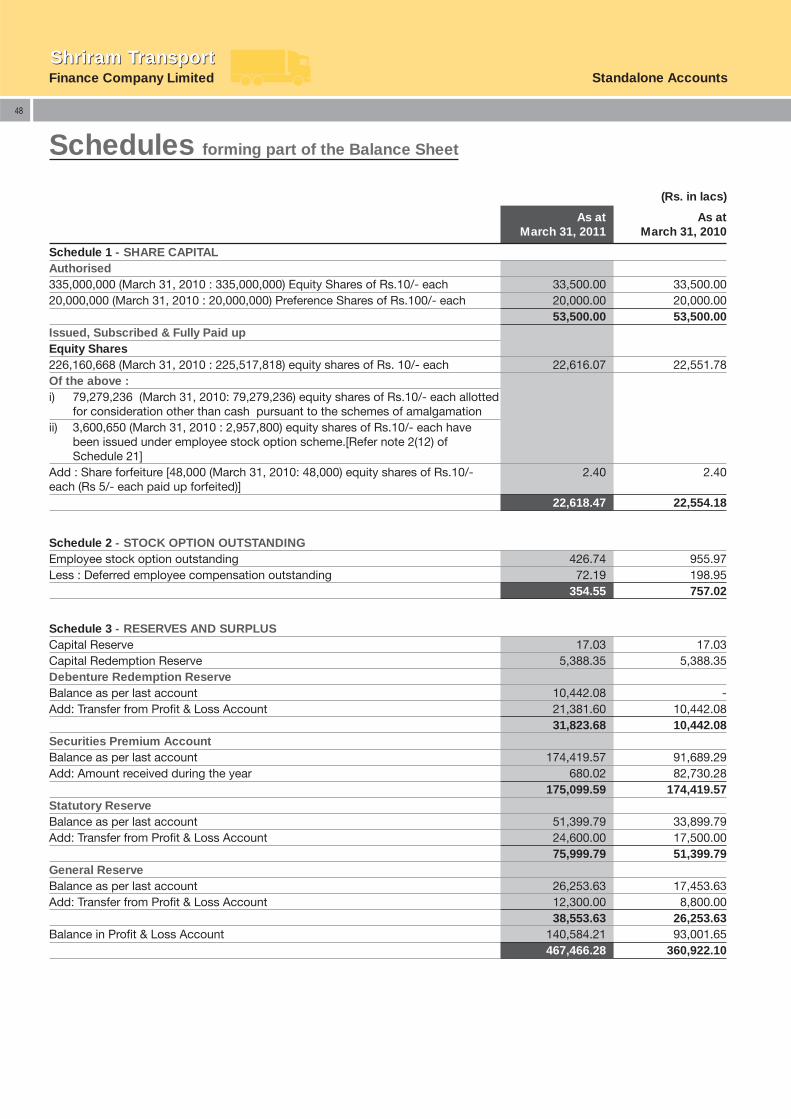
Finance Company LimitedShriram TransportShriram Transport
Standalone Accounts
48
Schedules forming part of the Balance Sheet
(Rs. in lacs)
As atMarch 31, 2011
As atMarch 31, 2010
Schedule 1 - SHARE CAPITALAuthorised335,000,000 (March 31, 2010 : 335,000,000) Equity Shares of Rs.10/- each 33,500.00 33,500.00 20,000,000 (March 31, 2010 : 20,000,000) Preference Shares of Rs.100/- each 20,000.00 20,000.00 53,500.00 53,500.00 Issued, Subscribed & Fully Paid up Equity Shares226,160,668 (March 31, 2010 : 225,517,818) equity shares of Rs. 10/- each 22,616.07 22,551.78 Of the above :i) 79,279,236 (March 31, 2010: 79,279,236) equity shares of Rs.10/- each allotted
for consideration other than cash pursuant to the schemes of amalgamationii) 3,600,650 (March 31, 2010 : 2,957,800) equity shares of Rs.10/- each have
been issued under employee stock option scheme.[Refer note 2(12) of Schedule 21]
Add : Share forfeiture [48,000 (March 31, 2010: 48,000) equity shares of Rs.10/- each (Rs 5/- each paid up forfeited)]
2.40 2.40
22,618.47 22,554.18
Schedule 3 - RESERVES AND SURPLUSCapital Reserve 17.03 17.03 Capital Redemption Reserve 5,388.35 5,388.35 Debenture Redemption ReserveBalance as per last account 10,442.08 - Add: Transfer from Profi t & Loss Account 21,381.60 10,442.08
31,823.68 10,442.08 Securities Premium AccountBalance as per last account 174,419.57 91,689.29 Add: Amount received during the year 680.02 82,730.28
175,099.59 174,419.57 Statutory ReserveBalance as per last account 51,399.79 33,899.79 Add: Transfer from Profi t & Loss Account 24,600.00 17,500.00
75,999.79 51,399.79 General ReserveBalance as per last account 26,253.63 17,453.63 Add: Transfer from Profi t & Loss Account 12,300.00 8,800.00
38,553.63 26,253.63 Balance in Profi t & Loss Account 140,584.21 93,001.65
467,466.28 360,922.10
Schedule 2 - STOCK OPTION OUTSTANDINGEmployee stock option outstanding 426.74 955.97 Less : Deferred employee compensation outstanding 72.19 198.95
354.55 757.02
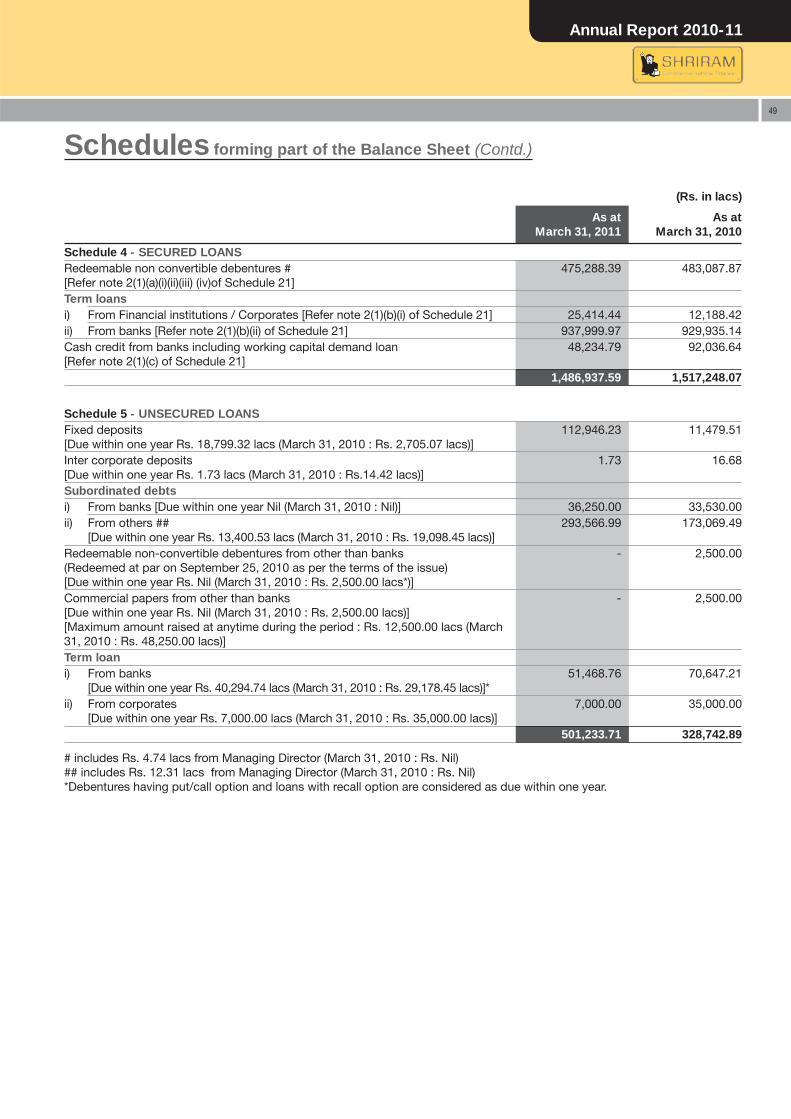
Annual Report 2010-11
49
Schedules forming part of the Balance Sheet (Contd.)
(Rs. in lacs)
As atMarch 31, 2011
As atMarch 31, 2010
Schedule 4 - SECURED LOANSRedeemable non convertible debentures # [Refer note 2(1)(a)(i)(ii)(iii) (iv)of Schedule 21]
475,288.39 483,087.87
Term loansi) From Financial institutions / Corporates [Refer note 2(1)(b)(i) of Schedule 21] 25,414.44 12,188.42 ii) From banks [Refer note 2(1)(b)(ii) of Schedule 21] 937,999.97 929,935.14 Cash credit from banks including working capital demand loan [Refer note 2(1)(c) of Schedule 21]
48,234.79 92,036.64
1,486,937.59 1,517,248.07
Schedule 5 - UNSECURED LOANSFixed deposits[Due within one year Rs. 18,799.32 lacs (March 31, 2010 : Rs. 2,705.07 lacs)]
112,946.23 11,479.51
Inter corporate deposits[Due within one year Rs. 1.73 lacs (March 31, 2010 : Rs.14.42 lacs)]
1.73 16.68
Subordinated debtsi) From banks [Due within one year Nil (March 31, 2010 : Nil)] 36,250.00 33,530.00 ii) From others ##
[Due within one year Rs. 13,400.53 lacs (March 31, 2010 : Rs. 19,098.45 lacs)] 293,566.99 173,069.49
Redeemable non-convertible debentures from other than banks(Redeemed at par on September 25, 2010 as per the terms of the issue)[Due within one year Rs. Nil (March 31, 2010 : Rs. 2,500.00 lacs*)]
- 2,500.00
Commercial papers from other than banks[Due within one year Rs. Nil (March 31, 2010 : Rs. 2,500.00 lacs)][Maximum amount raised at anytime during the period : Rs. 12,500.00 lacs (March 31, 2010 : Rs. 48,250.00 lacs)]
- 2,500.00
Term loani) From banks
[Due within one year Rs. 40,294.74 lacs (March 31, 2010 : Rs. 29,178.45 lacs)]* 51,468.76 70,647.21
ii) From corporates[Due within one year Rs. 7,000.00 lacs (March 31, 2010 : Rs. 35,000.00 lacs)]
7,000.00 35,000.00
501,233.71 328,742.89
# includes Rs. 4.74 lacs from Managing Director (March 31, 2010 : Rs. Nil) ## includes Rs. 12.31 lacs from Managing Director (March 31, 2010 : Rs. Nil)*Debentures having put/call option and loans with recall option are considered as due within one year.
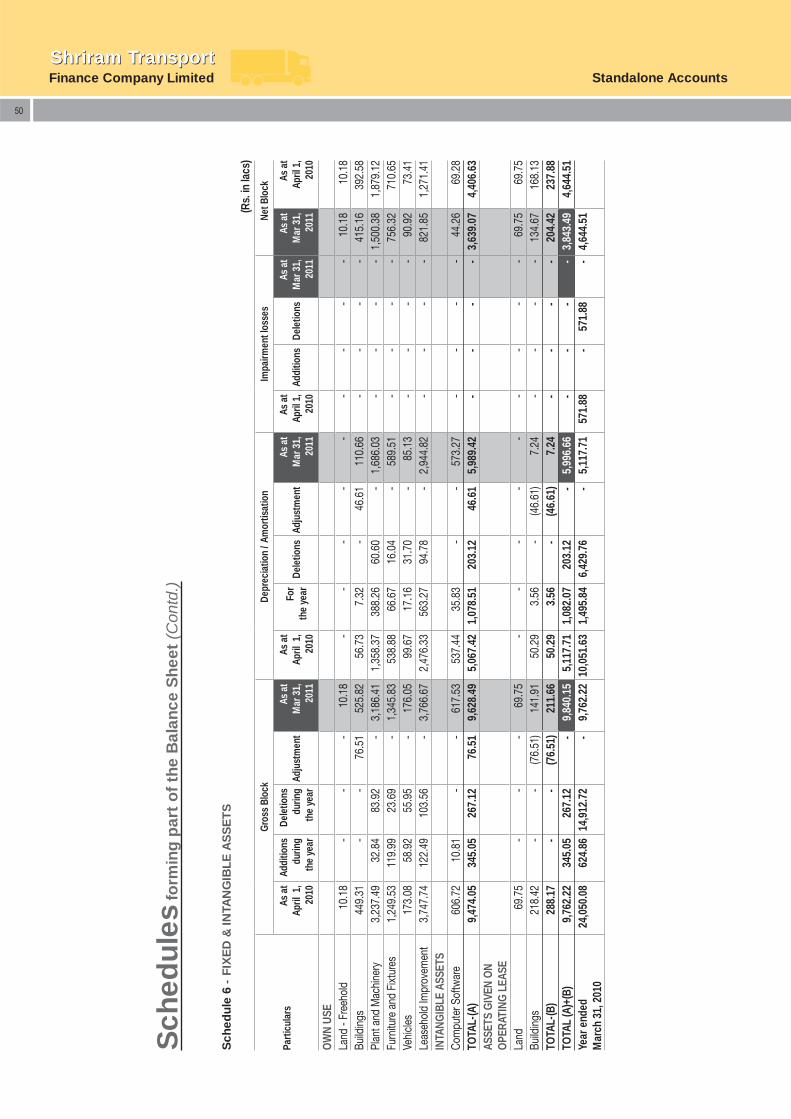
Finance Company LimitedShriram TransportShriram Transport
Standalone Accounts
50
Sch
edul
es f
orm
ing
par
t o
f th
e B
alan
ce S
heet
(C
ontd
.)
Sch
edul
e 6
- FI
XE
D &
INTA
NG
IBLE
AS
SE
TS
(Rs.
in la
cs)
Parti
cula
rs
Gro
ss B
lock
Dep
reci
atio
n / A
mor
tisat
ion
Impa
irmen
t los
ses
Net B
lock
As
at
April
1,
2010
Add
ition
s du
ring
the
year
Del
etio
ns
durin
g th
e ye
ar A
djus
tmen
t A
s at
M
ar 3
1,
2011
As
at
April
1,
2010
For
th
e ye
ar
Del
etio
ns
Adju
stm
ent
As
at
Mar
31,
20
11
As
at
April
1,
2010
Add
ition
s D
elet
ions
A
s at
M
ar 3
1,
2011
As
at
Mar
31,
20
11
As
at
April
1,
2010
OW
N US
ELa
nd -
Free
hold
10.
18
-
-
-
10.
18
-
-
-
-
-
-
-
-
-
10.
18
10.
18
Build
ings
449
.31
-
-
76.
51
525
.82
56.
73
7.3
2 -
4
6.61
1
10.6
6 -
-
-
-
415
.16
392
.58
Plan
t and
Mac
hine
ry 3
,237
.49
32.
84
83.
92
-
3,1
86.4
1 1
,358
.37
388
.26
60.
60
-
1,6
86.0
3 -
-
-
-
1,
500.
38
1,8
79.1
2 Fu
rnitu
re a
nd F
ixtu
res
1,2
49.5
3 1
19.9
9 2
3.69
-
1
,345
.83
538
.88
66.
67
16.
04
-
589
.51
-
-
-
-
756
.32
710
.65
Vehi
cles
173
.08
58.
92
55.
95
-
176
.05
99.
67
17.
16
31.
70
-
85.
13
-
-
-
-
90.
92
73.
41
Leas
ehol
d Im
prov
emen
t 3
,747
.74
122
.49
103
.56
-
3,7
66.6
7 2
,476
.33
563
.27
94.
78
-
2,9
44.8
2 -
-
-
-
8
21.8
5 1
,271
.41
INTA
NGIB
LE A
SSET
SCo
mpu
ter S
oftw
are
606
.72
10.
81
-
-
617
.53
537
.44
35.
83
-
-
573
.27
-
-
-
-
44.
26
69.
28
TOTA
L-(A
) 9
,474
.05
345
.05
267
.12
76.
51
9,6
28.4
9 5
,067
.42
1,0
78.5
1 2
03.1
2 4
6.61
5
,989
.42
-
-
-
-
3,63
9.07
4
,406
.63
ASSE
TS G
IVEN
ON
OPE
RATI
NG L
EASE
Land
69.
75
-
- -
6
9.75
-
-
-
-
-
-
-
-
-
6
9.75
6
9.75
Bu
ildin
gs 2
18.4
2 -
-
(7
6.51
) 1
41.9
1 5
0.29
3
.56
-
(46.
61)
7.2
4 -
-
-
-
1
34.6
7 1
68.1
3 TO
TAL-
(B)
288
.17
-
-
(76.
51)
211
.66
50.
29
3.5
6 -
(4
6.61
) 7
.24
-
-
-
-
204
.42
237
.88
TOTA
L (A
)+(B
) 9
,762
.22
345
.05
267
.12
- 9
,840
.15
5,1
17.7
1 1
,082
.07
203
.12
-
5,9
96.6
6 -
-
-
-
3,
843.
49
4,6
44.5
1 Ye
ar e
nded
M
arch
31,
201
0 2
4,05
0.08
6
24.8
6 14
,912
.72
- 9
,762
.22
10,0
51.6
3 1
,495
.84
6,4
29.7
6 -
5
,117
.71
571
.88
-
571
.88
-
4,64
4.51
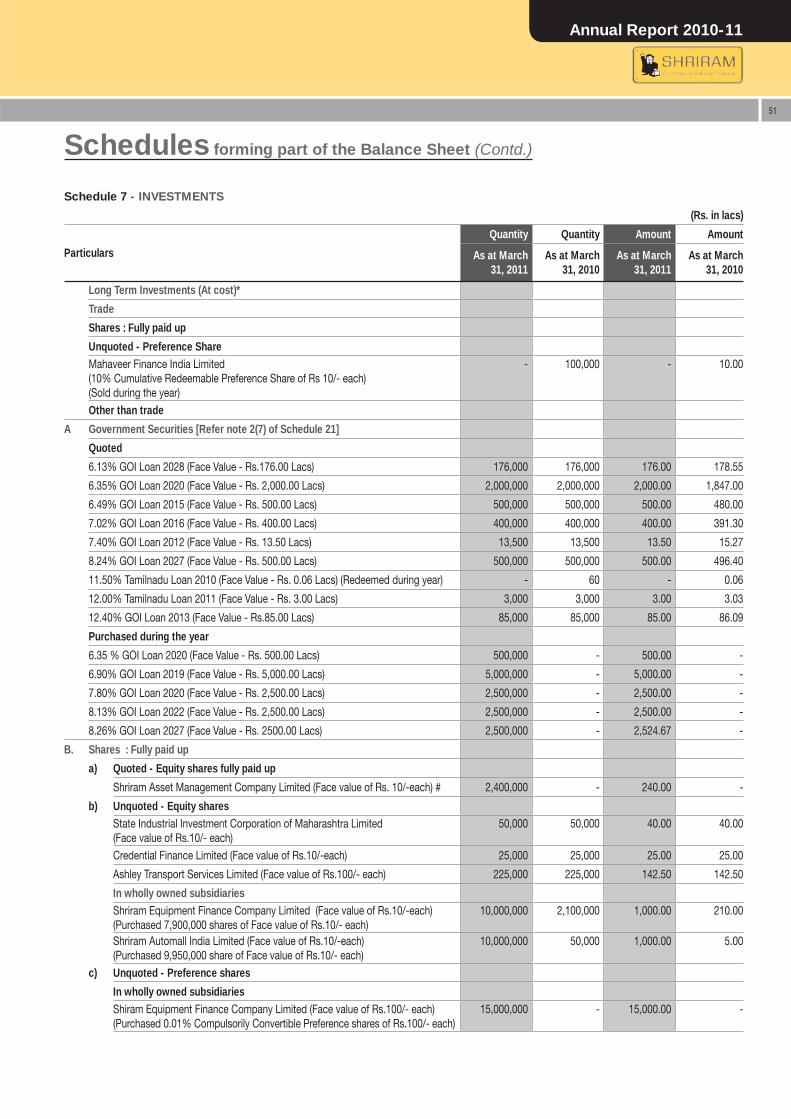
Annual Report 2010-11
51
Schedules forming part of the Balance Sheet (Contd.)
Long Term Investments (At cost)*
Trade
Shares : Fully paid up
Unquoted - Preference ShareMahaveer Finance India Limited(10% Cumulative Redeemable Preference Share of Rs 10/- each) (Sold during the year)
- 100,000 - 10.00
Other than trade
A Government Securities [Refer note 2(7) of Schedule 21]
Quoted
6.13% GOI Loan 2028 (Face Value - Rs.176.00 Lacs) 176,000 176,000 176.00 178.55
6.35% GOI Loan 2020 (Face Value - Rs. 2,000.00 Lacs) 2,000,000 2,000,000 2,000.00 1,847.00
6.49% GOI Loan 2015 (Face Value - Rs. 500.00 Lacs) 500,000 500,000 500.00 480.00
7.02% GOI Loan 2016 (Face Value - Rs. 400.00 Lacs) 400,000 400,000 400.00 391.30
7.40% GOI Loan 2012 (Face Value - Rs. 13.50 Lacs) 13,500 13,500 13.50 15.27
8.24% GOI Loan 2027 (Face Value - Rs. 500.00 Lacs) 500,000 500,000 500.00 496.40
11.50% Tamilnadu Loan 2010 (Face Value - Rs. 0.06 Lacs) (Redeemed during year) - 60 - 0.06
12.00% Tamilnadu Loan 2011 (Face Value - Rs. 3.00 Lacs) 3,000 3,000 3.00 3.03
12.40% GOI Loan 2013 (Face Value - Rs.85.00 Lacs) 85,000 85,000 85.00 86.09
Purchased during the year
6.35 % GOI Loan 2020 (Face Value - Rs. 500.00 Lacs) 500,000 - 500.00 -
6.90% GOI Loan 2019 (Face Value - Rs. 5,000.00 Lacs) 5,000,000 - 5,000.00 -
7.80% GOI Loan 2020 (Face Value - Rs. 2,500.00 Lacs) 2,500,000 - 2,500.00 -
8.13% GOI Loan 2022 (Face Value - Rs. 2,500.00 Lacs) 2,500,000 - 2,500.00 -
8.26% GOI Loan 2027 (Face Value - Rs. 2500.00 Lacs) 2,500,000 - 2,524.67 -
B. Shares : Fully paid up
a) Quoted - Equity shares fully paid up
Shriram Asset Management Company Limited (Face value of Rs. 10/-each) # 2,400,000 - 240.00 -
b) Unquoted - Equity sharesState Industrial Investment Corporation of Maharashtra Limited (Face value of Rs.10/- each)
50,000 50,000 40.00 40.00
Credential Finance Limited (Face value of Rs.10/-each) 25,000 25,000 25.00 25.00
Ashley Transport Services Limited (Face value of Rs.100/- each) 225,000 225,000 142.50 142.50
In wholly owned subsidiariesShriram Equipment Finance Company Limited (Face value of Rs.10/-each) (Purchased 7,900,000 shares of Face value of Rs.10/- each)
10,000,000 2,100,000 1,000.00 210.00
Shriram Automall India Limited (Face value of Rs.10/-each)(Purchased 9,950,000 share of Face value of Rs.10/- each)
10,000,000 50,000 1,000.00 5.00
c) Unquoted - Preference shares
In wholly owned subsidiariesShiram Equipment Finance Company Limited (Face value of Rs.100/- each) (Purchased 0.01% Compulsorily Convertible Preference shares of Rs.100/- each)
15,000,000 - 15,000.00 -
Schedule 7 - INVESTMENTS
(Rs. in lacs)
Particulars
Quantity Quantity Amount Amount
As at March 31, 2011
As at March 31, 2010
As at March 31, 2011
As at March 31, 2010
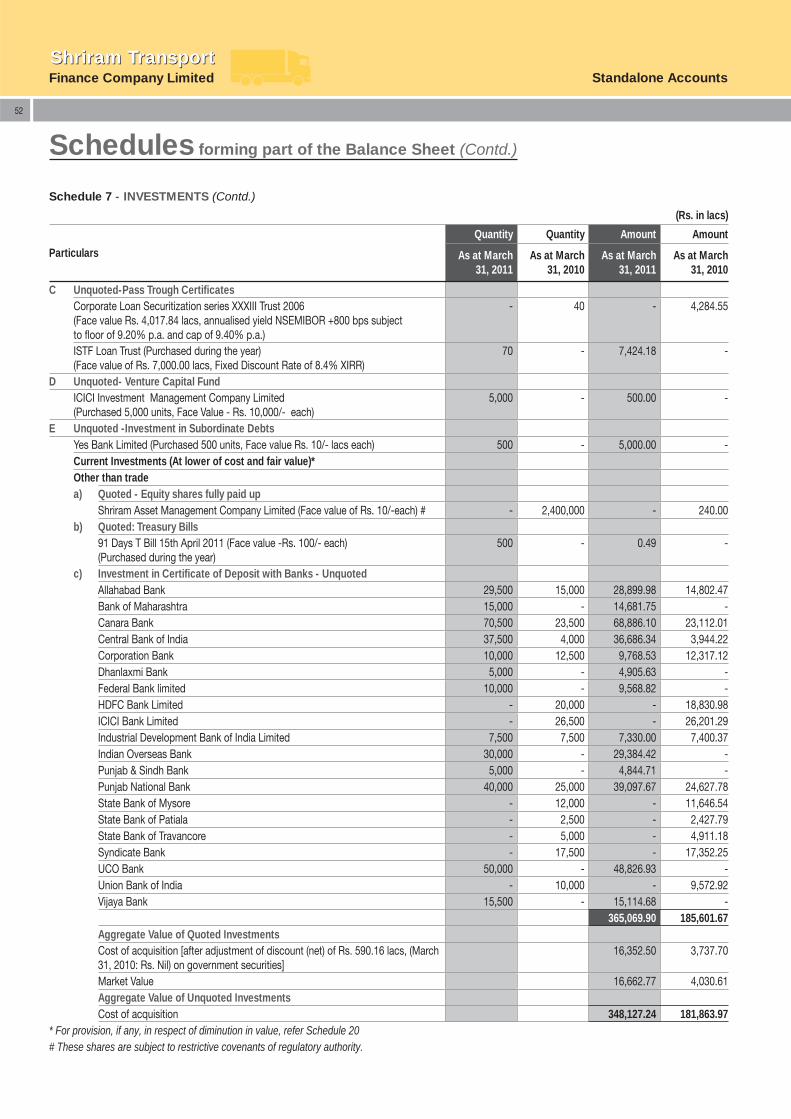
Finance Company LimitedShriram TransportShriram Transport
Standalone Accounts
52
C Unquoted-Pass Trough Certifi catesCorporate Loan Securitization series XXXIII Trust 2006(Face value Rs. 4,017.84 lacs, annualised yield NSEMIBOR +800 bps subject to fl oor of 9.20% p.a. and cap of 9.40% p.a.)
- 40 - 4,284.55
ISTF Loan Trust (Purchased during the year)(Face value of Rs. 7,000.00 lacs, Fixed Discount Rate of 8.4% XIRR)
70 - 7,424.18 -
D Unquoted- Venture Capital FundICICI Investment Management Company Limited (Purchased 5,000 units, Face Value - Rs. 10,000/- each)
5,000 - 500.00 -
E Unquoted -Investment in Subordinate Debts Yes Bank Limited (Purchased 500 units, Face value Rs. 10/- lacs each) 500 - 5,000.00 -Current Investments (At lower of cost and fair value)*Other than tradea) Quoted - Equity shares fully paid up
Shriram Asset Management Company Limited (Face value of Rs. 10/-each) # - 2,400,000 - 240.00 b) Quoted: Treasury Bills
91 Days T Bill 15th April 2011 (Face value -Rs. 100/- each)(Purchased during the year)
500 - 0.49 -
c) Investment in Certifi cate of Deposit with Banks - UnquotedAllahabad Bank 29,500 15,000 28,899.98 14,802.47 Bank of Maharashtra 15,000 - 14,681.75 - Canara Bank 70,500 23,500 68,886.10 23,112.01 Central Bank of India 37,500 4,000 36,686.34 3,944.22 Corporation Bank 10,000 12,500 9,768.53 12,317.12 Dhanlaxmi Bank 5,000 - 4,905.63 - Federal Bank limited 10,000 - 9,568.82 - HDFC Bank Limited - 20,000 - 18,830.98 ICICI Bank Limited - 26,500 - 26,201.29 Industrial Development Bank of India Limited 7,500 7,500 7,330.00 7,400.37 Indian Overseas Bank 30,000 - 29,384.42 - Punjab & Sindh Bank 5,000 - 4,844.71 - Punjab National Bank 40,000 25,000 39,097.67 24,627.78 State Bank of Mysore - 12,000 - 11,646.54 State Bank of Patiala - 2,500 - 2,427.79 State Bank of Travancore - 5,000 - 4,911.18 Syndicate Bank - 17,500 - 17,352.25 UCO Bank 50,000 - 48,826.93 - Union Bank of India - 10,000 - 9,572.92 Vijaya Bank 15,500 - 15,114.68 -
365,069.90 185,601.67 Aggregate Value of Quoted Investments Cost of acquisition [after adjustment of discount (net) of Rs. 590.16 lacs, (March 31, 2010: Rs. Nil) on government securities]
16,352.50 3,737.70
Market Value 16,662.77 4,030.61 Aggregate Value of Unquoted Investments Cost of acquisition 348,127.24 181,863.97
* For provision, if any, in respect of diminution in value, refer Schedule 20# These shares are subject to restrictive covenants of regulatory authority.
Schedules forming part of the Balance Sheet (Contd.)
Schedule 7 - INVESTMENTS (Contd.)
(Rs. in lacs)
Particulars
Quantity Quantity Amount Amount
As at March 31, 2011
As at March 31, 2010
As at March 31, 2011
As at March 31, 2010
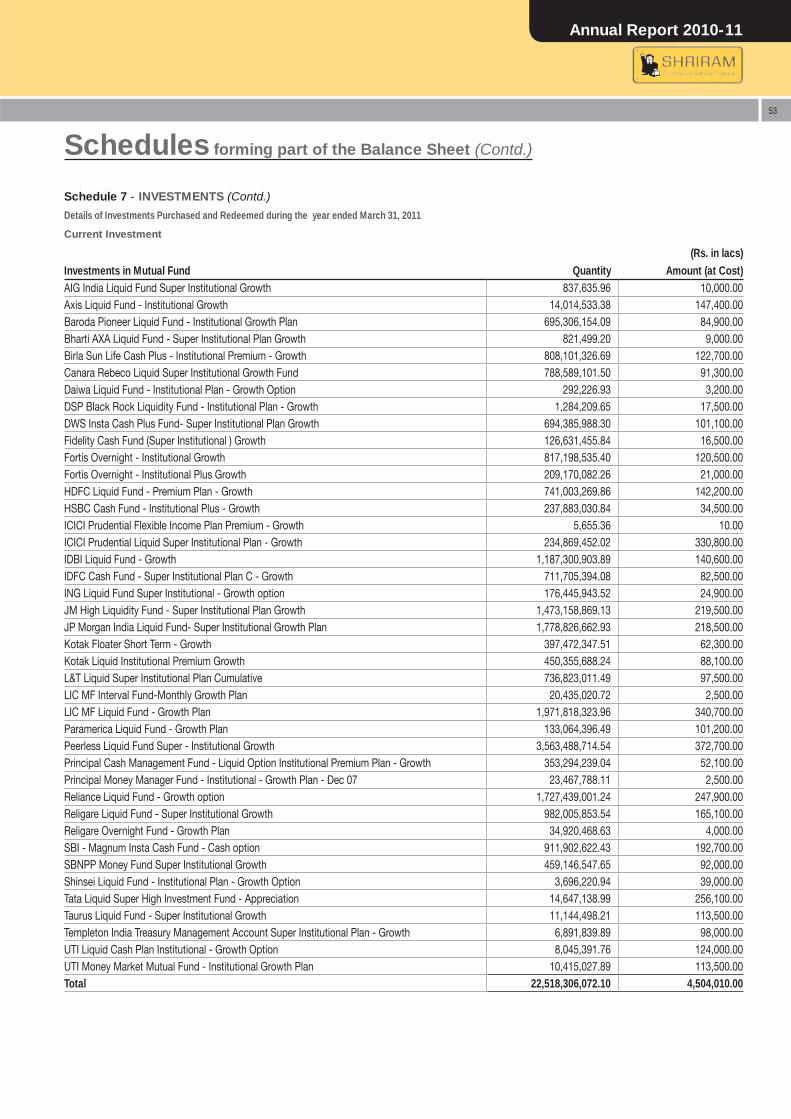
Annual Report 2010-11
53
Schedules forming part of the Balance Sheet (Contd.)
(Rs. in lacs) Investments in Mutual Fund Quantity Amount (at Cost) AIG India Liquid Fund Super Institutional Growth 837,635.96 10,000.00 Axis Liquid Fund - Institutional Growth 14,014,533.38 147,400.00 Baroda Pioneer Liquid Fund - Institutional Growth Plan 695,306,154.09 84,900.00 Bharti AXA Liquid Fund - Super Institutional Plan Growth 821,499.20 9,000.00 Birla Sun Life Cash Plus - Institutional Premium - Growth 808,101,326.69 122,700.00 Canara Rebeco Liquid Super Institutional Growth Fund 788,589,101.50 91,300.00 Daiwa Liquid Fund - Institutional Plan - Growth Option 292,226.93 3,200.00 DSP Black Rock Liquidity Fund - Institutional Plan - Growth 1,284,209.65 17,500.00 DWS Insta Cash Plus Fund- Super Institutional Plan Growth 694,385,988.30 101,100.00 Fidelity Cash Fund (Super Institutional ) Growth 126,631,455.84 16,500.00 Fortis Overnight - Institutional Growth 817,198,535.40 120,500.00 Fortis Overnight - Institutional Plus Growth 209,170,082.26 21,000.00 HDFC Liquid Fund - Premium Plan - Growth 741,003,269.86 142,200.00 HSBC Cash Fund - Institutional Plus - Growth 237,883,030.84 34,500.00 ICICI Prudential Flexible Income Plan Premium - Growth 5,655.36 10.00 ICICI Prudential Liquid Super Institutional Plan - Growth 234,869,452.02 330,800.00 IDBI Liquid Fund - Growth 1,187,300,903.89 140,600.00 IDFC Cash Fund - Super Institutional Plan C - Growth 711,705,394.08 82,500.00 ING Liquid Fund Super Institutional - Growth option 176,445,943.52 24,900.00 JM High Liquidity Fund - Super Institutional Plan Growth 1,473,158,869.13 219,500.00 JP Morgan India Liquid Fund- Super Institutional Growth Plan 1,778,826,662.93 218,500.00 Kotak Floater Short Term - Growth 397,472,347.51 62,300.00 Kotak Liquid Institutional Premium Growth 450,355,688.24 88,100.00 L&T Liquid Super Institutional Plan Cumulative 736,823,011.49 97,500.00 LIC MF Interval Fund-Monthly Growth Plan 20,435,020.72 2,500.00 LIC MF Liquid Fund - Growth Plan 1,971,818,323.96 340,700.00 Paramerica Liquid Fund - Growth Plan 133,064,396.49 101,200.00 Peerless Liquid Fund Super - Institutional Growth 3,563,488,714.54 372,700.00 Principal Cash Management Fund - Liquid Option Institutional Premium Plan - Growth 353,294,239.04 52,100.00 Principal Money Manager Fund - Institutional - Growth Plan - Dec 07 23,467,788.11 2,500.00 Reliance Liquid Fund - Growth option 1,727,439,001.24 247,900.00 Religare Liquid Fund - Super Institutional Growth 982,005,853.54 165,100.00 Religare Overnight Fund - Growth Plan 34,920,468.63 4,000.00 SBI - Magnum Insta Cash Fund - Cash option 911,902,622.43 192,700.00 SBNPP Money Fund Super Institutional Growth 459,146,547.65 92,000.00 Shinsei Liquid Fund - Institutional Plan - Growth Option 3,696,220.94 39,000.00 Tata Liquid Super High Investment Fund - Appreciation 14,647,138.99 256,100.00 Taurus Liquid Fund - Super Institutional Growth 11,144,498.21 113,500.00 Templeton India Treasury Management Account Super Institutional Plan - Growth 6,891,839.89 98,000.00 UTI Liquid Cash Plan Institutional - Growth Option 8,045,391.76 124,000.00 UTI Money Market Mutual Fund - Institutional Growth Plan 10,415,027.89 113,500.00 Total 22,518,306,072.10 4,504,010.00
Schedule 7 - INVESTMENTS (Contd.)
Details of Investments Purchased and Redeemed during the year ended March 31, 2011
Current Investment
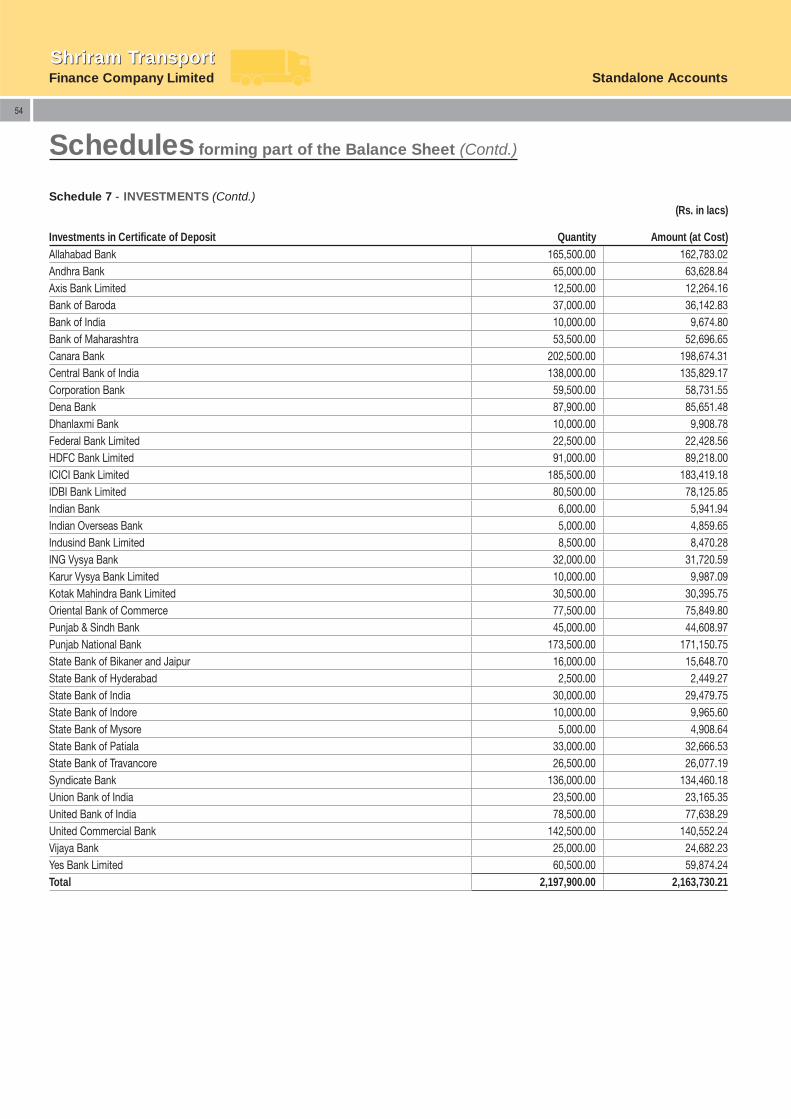
Finance Company LimitedShriram TransportShriram Transport
Standalone Accounts
54
Schedules forming part of the Balance Sheet (Contd.)
(Rs. in lacs)
Investments in Certifi cate of Deposit Quantity Amount (at Cost) Allahabad Bank 165,500.00 162,783.02 Andhra Bank 65,000.00 63,628.84 Axis Bank Limited 12,500.00 12,264.16 Bank of Baroda 37,000.00 36,142.83 Bank of India 10,000.00 9,674.80 Bank of Maharashtra 53,500.00 52,696.65 Canara Bank 202,500.00 198,674.31 Central Bank of India 138,000.00 135,829.17 Corporation Bank 59,500.00 58,731.55 Dena Bank 87,900.00 85,651.48 Dhanlaxmi Bank 10,000.00 9,908.78 Federal Bank Limited 22,500.00 22,428.56 HDFC Bank Limited 91,000.00 89,218.00 ICICI Bank Limited 185,500.00 183,419.18 IDBI Bank Limited 80,500.00 78,125.85 Indian Bank 6,000.00 5,941.94 Indian Overseas Bank 5,000.00 4,859.65 Indusind Bank Limited 8,500.00 8,470.28 ING Vysya Bank 32,000.00 31,720.59 Karur Vysya Bank Limited 10,000.00 9,987.09 Kotak Mahindra Bank Limited 30,500.00 30,395.75 Oriental Bank of Commerce 77,500.00 75,849.80 Punjab & Sindh Bank 45,000.00 44,608.97 Punjab National Bank 173,500.00 171,150.75 State Bank of Bikaner and Jaipur 16,000.00 15,648.70 State Bank of Hyderabad 2,500.00 2,449.27 State Bank of India 30,000.00 29,479.75 State Bank of Indore 10,000.00 9,965.60 State Bank of Mysore 5,000.00 4,908.64 State Bank of Patiala 33,000.00 32,666.53 State Bank of Travancore 26,500.00 26,077.19 Syndicate Bank 136,000.00 134,460.18 Union Bank of India 23,500.00 23,165.35 United Bank of India 78,500.00 77,638.29 United Commercial Bank 142,500.00 140,552.24 Vijaya Bank 25,000.00 24,682.23 Yes Bank Limited 60,500.00 59,874.24 Total 2,197,900.00 2,163,730.21
Schedule 7 - INVESTMENTS (Contd.)
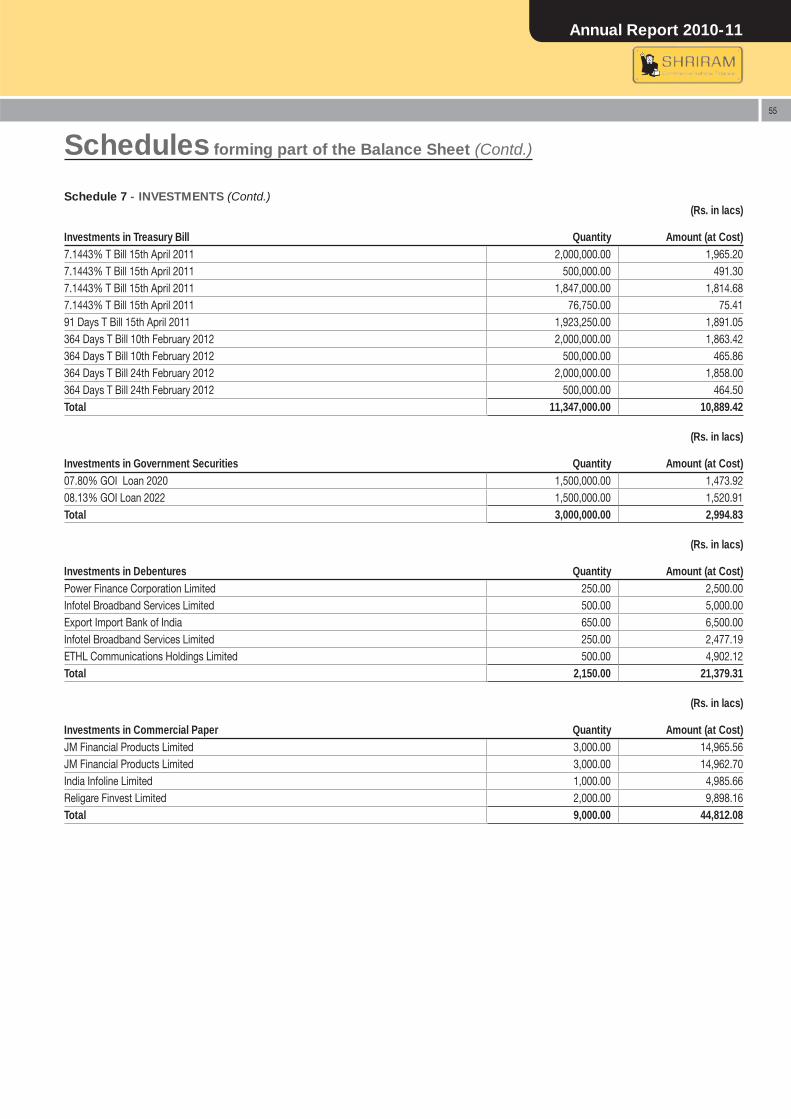
Annual Report 2010-11
55
Schedules forming part of the Balance Sheet (Contd.)
(Rs. in lacs)
Investments in Treasury Bill Quantity Amount (at Cost) 7.1443% T Bill 15th April 2011 2,000,000.00 1,965.20 7.1443% T Bill 15th April 2011 500,000.00 491.30 7.1443% T Bill 15th April 2011 1,847,000.00 1,814.68 7.1443% T Bill 15th April 2011 76,750.00 75.41 91 Days T Bill 15th April 2011 1,923,250.00 1,891.05 364 Days T Bill 10th February 2012 2,000,000.00 1,863.42 364 Days T Bill 10th February 2012 500,000.00 465.86 364 Days T Bill 24th February 2012 2,000,000.00 1,858.00 364 Days T Bill 24th February 2012 500,000.00 464.50 Total 11,347,000.00 10,889.42
(Rs. in lacs)
Investments in Government Securities Quantity Amount (at Cost) 07.80% GOI Loan 2020 1,500,000.00 1,473.92 08.13% GOI Loan 2022 1,500,000.00 1,520.91 Total 3,000,000.00 2,994.83
(Rs. in lacs)
Investments in Debentures Quantity Amount (at Cost) Power Finance Corporation Limited 250.00 2,500.00 Infotel Broadband Services Limited 500.00 5,000.00 Export Import Bank of India 650.00 6,500.00 Infotel Broadband Services Limited 250.00 2,477.19 ETHL Communications Holdings Limited 500.00 4,902.12 Total 2,150.00 21,379.31
(Rs. in lacs)
Investments in Commercial Paper Quantity Amount (at Cost) JM Financial Products Limited 3,000.00 14,965.56 JM Financial Products Limited 3,000.00 14,962.70 India Infoline Limited 1,000.00 4,985.66 Religare Finvest Limited 2,000.00 9,898.16 Total 9,000.00 44,812.08
Schedule 7 - INVESTMENTS (Contd.)
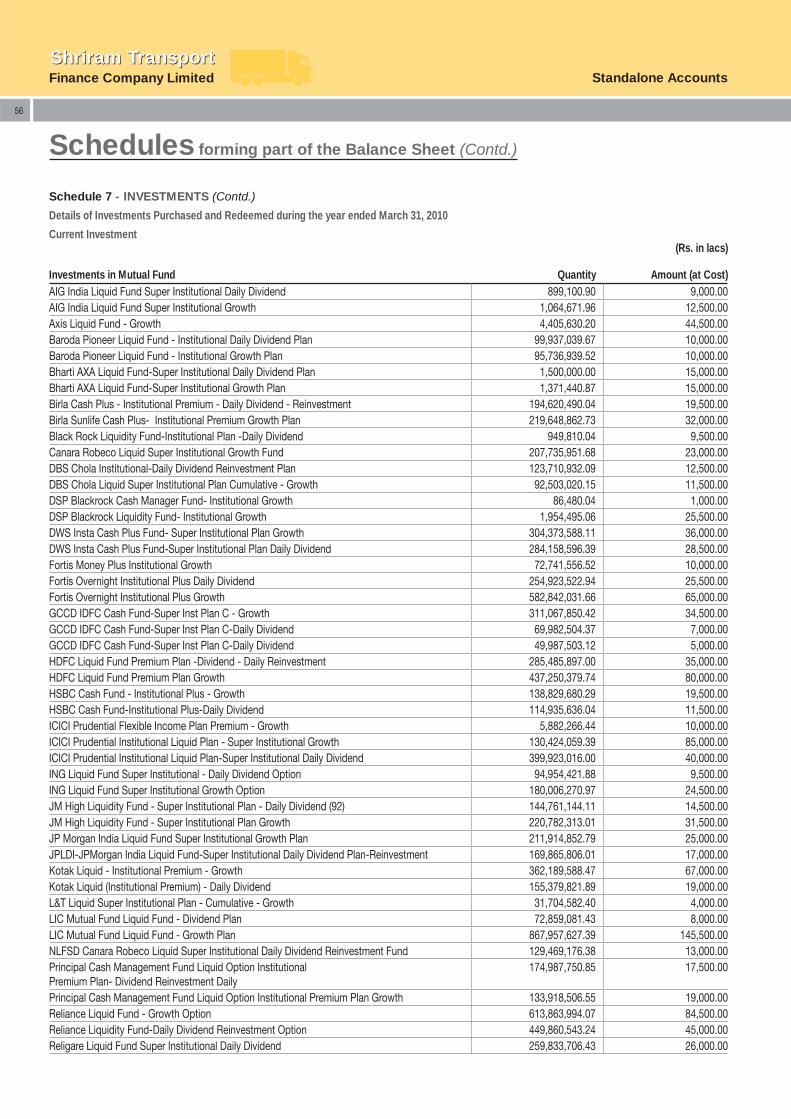
Finance Company LimitedShriram TransportShriram Transport
Standalone Accounts
56
Schedules forming part of the Balance Sheet (Contd.)
(Rs. in lacs)
Investments in Mutual Fund Quantity Amount (at Cost) AIG India Liquid Fund Super Institutional Daily Dividend 899,100.90 9,000.00 AIG India Liquid Fund Super Institutional Growth 1,064,671.96 12,500.00 Axis Liquid Fund - Growth 4,405,630.20 44,500.00 Baroda Pioneer Liquid Fund - Institutional Daily Dividend Plan 99,937,039.67 10,000.00 Baroda Pioneer Liquid Fund - Institutional Growth Plan 95,736,939.52 10,000.00 Bharti AXA Liquid Fund-Super Institutional Daily Dividend Plan 1,500,000.00 15,000.00 Bharti AXA Liquid Fund-Super Institutional Growth Plan 1,371,440.87 15,000.00 Birla Cash Plus - Institutional Premium - Daily Dividend - Reinvestment 194,620,490.04 19,500.00 Birla Sunlife Cash Plus- Institutional Premium Growth Plan 219,648,862.73 32,000.00 Black Rock Liquidity Fund-Institutional Plan -Daily Dividend 949,810.04 9,500.00 Canara Robeco Liquid Super Institutional Growth Fund 207,735,951.68 23,000.00 DBS Chola Institutional-Daily Dividend Reinvestment Plan 123,710,932.09 12,500.00 DBS Chola Liquid Super Institutional Plan Cumulative - Growth 92,503,020.15 11,500.00 DSP Blackrock Cash Manager Fund- Institutional Growth 86,480.04 1,000.00 DSP Blackrock Liquidity Fund- Institutional Growth 1,954,495.06 25,500.00 DWS Insta Cash Plus Fund- Super Institutional Plan Growth 304,373,588.11 36,000.00 DWS Insta Cash Plus Fund-Super Institutional Plan Daily Dividend 284,158,596.39 28,500.00 Fortis Money Plus Institutional Growth 72,741,556.52 10,000.00 Fortis Overnight Institutional Plus Daily Dividend 254,923,522.94 25,500.00 Fortis Overnight Institutional Plus Growth 582,842,031.66 65,000.00 GCCD IDFC Cash Fund-Super Inst Plan C - Growth 311,067,850.42 34,500.00 GCCD IDFC Cash Fund-Super Inst Plan C-Daily Dividend 69,982,504.37 7,000.00 GCCD IDFC Cash Fund-Super Inst Plan C-Daily Dividend 49,987,503.12 5,000.00 HDFC Liquid Fund Premium Plan -Dividend - Daily Reinvestment 285,485,897.00 35,000.00 HDFC Liquid Fund Premium Plan Growth 437,250,379.74 80,000.00 HSBC Cash Fund - Institutional Plus - Growth 138,829,680.29 19,500.00 HSBC Cash Fund-Institutional Plus-Daily Dividend 114,935,636.04 11,500.00 ICICI Prudential Flexible Income Plan Premium - Growth 5,882,266.44 10,000.00 ICICI Prudential Institutional Liquid Plan - Super Institutional Growth 130,424,059.39 85,000.00 ICICI Prudential Institutional Liquid Plan-Super Institutional Daily Dividend 399,923,016.00 40,000.00 ING Liquid Fund Super Institutional - Daily Dividend Option 94,954,421.88 9,500.00 ING Liquid Fund Super Institutional Growth Option 180,006,270.97 24,500.00 JM High Liquidity Fund - Super Institutional Plan - Daily Dividend (92) 144,761,144.11 14,500.00 JM High Liquidity Fund - Super Institutional Plan Growth 220,782,313.01 31,500.00 JP Morgan India Liquid Fund Super Institutional Growth Plan 211,914,852.79 25,000.00 JPLDI-JPMorgan India Liquid Fund-Super Institutional Daily Dividend Plan-Reinvestment 169,865,806.01 17,000.00 Kotak Liquid - Institutional Premium - Growth 362,189,588.47 67,000.00 Kotak Liquid (Institutional Premium) - Daily Dividend 155,379,821.89 19,000.00 L&T Liquid Super Institutional Plan - Cumulative - Growth 31,704,582.40 4,000.00 LIC Mutual Fund Liquid Fund - Dividend Plan 72,859,081.43 8,000.00 LIC Mutual Fund Liquid Fund - Growth Plan 867,957,627.39 145,500.00 NLFSD Canara Robeco Liquid Super Institutional Daily Dividend Reinvestment Fund 129,469,176.38 13,000.00 Principal Cash Management Fund Liquid Option Institutional Premium Plan- Dividend Reinvestment Daily
174,987,750.85 17,500.00
Principal Cash Management Fund Liquid Option Institutional Premium Plan Growth 133,918,506.55 19,000.00 Reliance Liquid Fund - Growth Option 613,863,994.07 84,500.00 Reliance Liquidity Fund-Daily Dividend Reinvestment Option 449,860,543.24 45,000.00 Religare Liquid Fund Super Institutional Daily Dividend 259,833,706.43 26,000.00
Schedule 7 - INVESTMENTS (Contd.)
Details of Investments Purchased and Redeemed during the year ended March 31, 2010
Current Investment
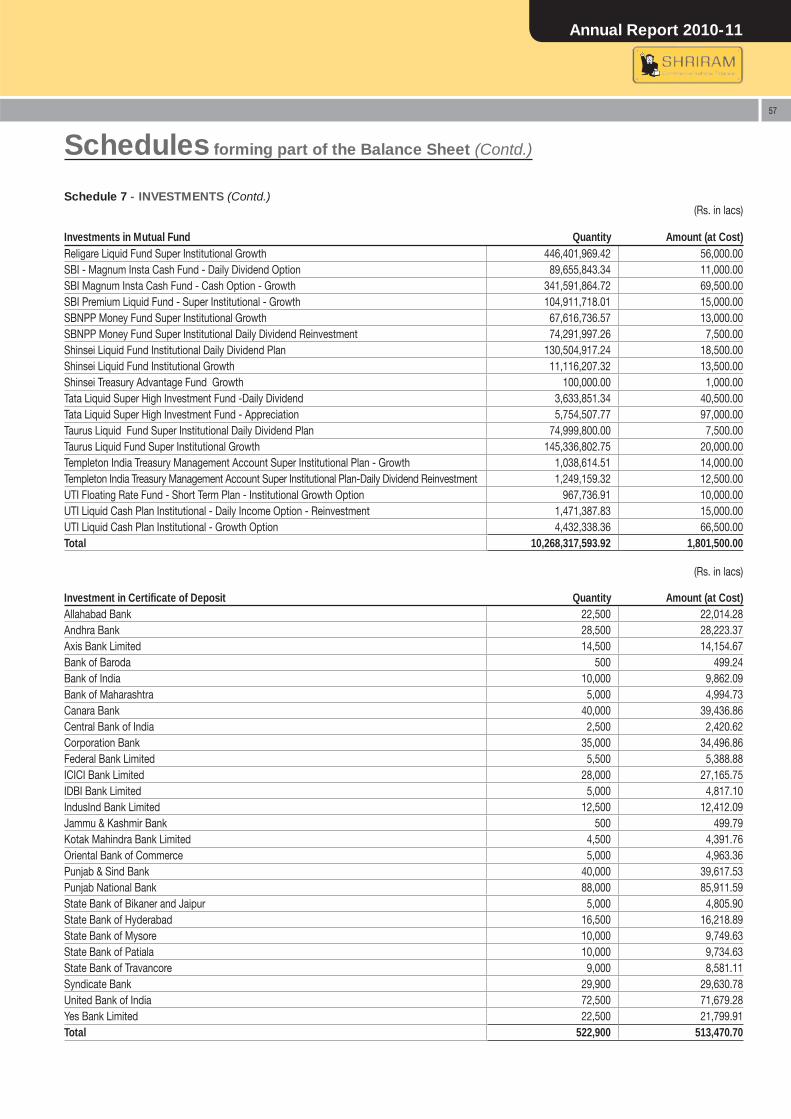
Annual Report 2010-11
57
Religare Liquid Fund Super Institutional Growth 446,401,969.42 56,000.00 SBI - Magnum Insta Cash Fund - Daily Dividend Option 89,655,843.34 11,000.00 SBI Magnum Insta Cash Fund - Cash Option - Growth 341,591,864.72 69,500.00 SBI Premium Liquid Fund - Super Institutional - Growth 104,911,718.01 15,000.00 SBNPP Money Fund Super Institutional Growth 67,616,736.57 13,000.00 SBNPP Money Fund Super Institutional Daily Dividend Reinvestment 74,291,997.26 7,500.00 Shinsei Liquid Fund Institutional Daily Dividend Plan 130,504,917.24 18,500.00 Shinsei Liquid Fund Institutional Growth 11,116,207.32 13,500.00 Shinsei Treasury Advantage Fund Growth 100,000.00 1,000.00 Tata Liquid Super High Investment Fund -Daily Dividend 3,633,851.34 40,500.00 Tata Liquid Super High Investment Fund - Appreciation 5,754,507.77 97,000.00 Taurus Liquid Fund Super Institutional Daily Dividend Plan 74,999,800.00 7,500.00 Taurus Liquid Fund Super Institutional Growth 145,336,802.75 20,000.00 Templeton India Treasury Management Account Super Institutional Plan - Growth 1,038,614.51 14,000.00 Templeton India Treasury Management Account Super Institutional Plan-Daily Dividend Reinvestment 1,249,159.32 12,500.00 UTI Floating Rate Fund - Short Term Plan - Institutional Growth Option 967,736.91 10,000.00 UTI Liquid Cash Plan Institutional - Daily Income Option - Reinvestment 1,471,387.83 15,000.00 UTI Liquid Cash Plan Institutional - Growth Option 4,432,338.36 66,500.00 Total 10,268,317,593.92 1,801,500.00
(Rs. in lacs)
Investment in Certifi cate of Deposit Quantity Amount (at Cost) Allahabad Bank 22,500 22,014.28 Andhra Bank 28,500 28,223.37 Axis Bank Limited 14,500 14,154.67 Bank of Baroda 500 499.24 Bank of India 10,000 9,862.09 Bank of Maharashtra 5,000 4,994.73 Canara Bank 40,000 39,436.86 Central Bank of India 2,500 2,420.62 Corporation Bank 35,000 34,496.86 Federal Bank Limited 5,500 5,388.88 ICICI Bank Limited 28,000 27,165.75 IDBI Bank Limited 5,000 4,817.10 IndusInd Bank Limited 12,500 12,412.09 Jammu & Kashmir Bank 500 499.79 Kotak Mahindra Bank Limited 4,500 4,391.76 Oriental Bank of Commerce 5,000 4,963.36 Punjab & Sind Bank 40,000 39,617.53 Punjab National Bank 88,000 85,911.59 State Bank of Bikaner and Jaipur 5,000 4,805.90 State Bank of Hyderabad 16,500 16,218.89 State Bank of Mysore 10,000 9,749.63 State Bank of Patiala 10,000 9,734.63 State Bank of Travancore 9,000 8,581.11 Syndicate Bank 29,900 29,630.78 United Bank of India 72,500 71,679.28 Yes Bank Limited 22,500 21,799.91 Total 522,900 513,470.70
Schedules forming part of the Balance Sheet (Contd.)
(Rs. in lacs)
Investments in Mutual Fund Quantity Amount (at Cost)
Schedule 7 - INVESTMENTS (Contd.)
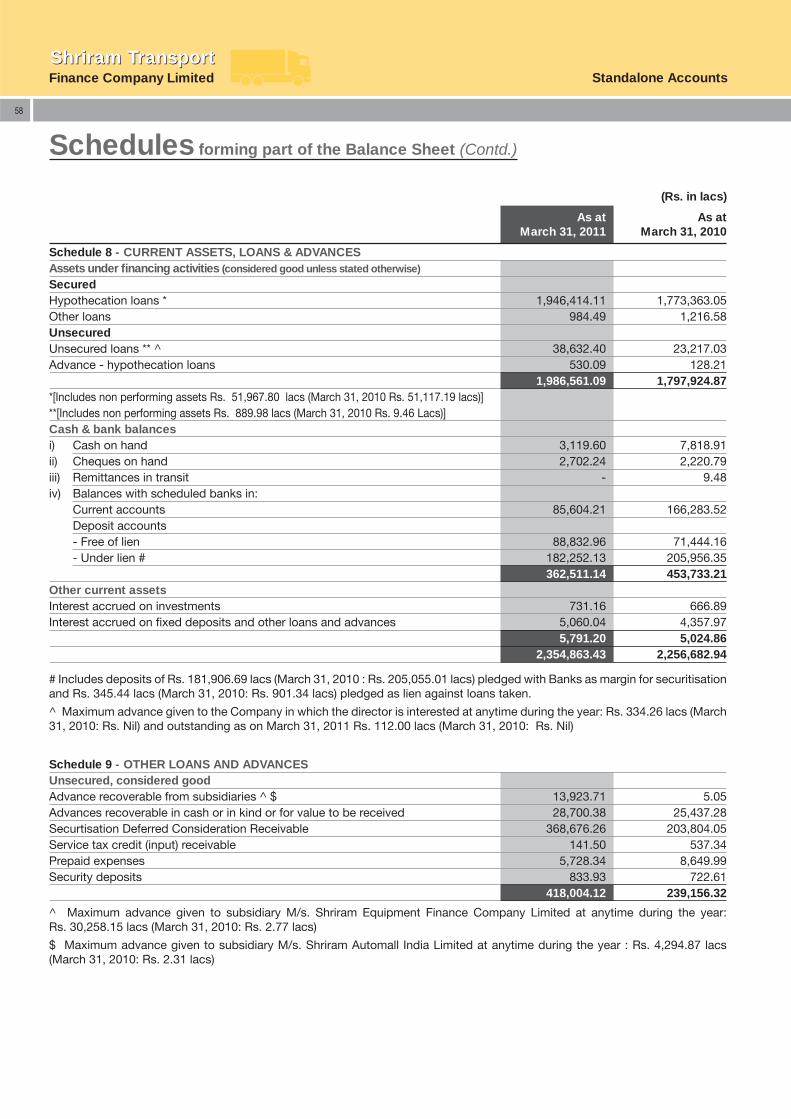
Finance Company LimitedShriram TransportShriram Transport
Standalone Accounts
58
(Rs. in lacs)
As atMarch 31, 2011
As atMarch 31, 2010
Schedule 8 - CURRENT ASSETS, LOANS & ADVANCESAssets under fi nancing activities (considered good unless stated otherwise)
SecuredHypothecation loans * 1,946,414.11 1,773,363.05 Other loans 984.49 1,216.58 UnsecuredUnsecured loans ** ^ 38,632.40 23,217.03 Advance - hypothecation loans 530.09 128.21
1,986,561.09 1,797,924.87 *[Includes non performing assets Rs. 51,967.80 lacs (March 31, 2010 Rs. 51,117.19 lacs)]**[Includes non performing assets Rs. 889.98 lacs (March 31, 2010 Rs. 9.46 Lacs)]Cash & bank balancesi) Cash on hand 3,119.60 7,818.91 ii) Cheques on hand 2,702.24 2,220.79 iii) Remittances in transit - 9.48 iv) Balances with scheduled banks in:
Current accounts 85,604.21 166,283.52 Deposit accounts- Free of lien 88,832.96 71,444.16 - Under lien # 182,252.13 205,956.35
362,511.14 453,733.21 Other current assetsInterest accrued on investments 731.16 666.89 Interest accrued on fi xed deposits and other loans and advances 5,060.04 4,357.97
5,791.20 5,024.86 2,354,863.43 2,256,682.94
# Includes deposits of Rs. 181,906.69 lacs (March 31, 2010 : Rs. 205,055.01 lacs) pledged with Banks as margin for securitisation and Rs. 345.44 lacs (March 31, 2010: Rs. 901.34 lacs) pledged as lien against loans taken.
^ Maximum advance given to the Company in which the director is interested at anytime during the year: Rs. 334.26 lacs (March 31, 2010: Rs. Nil) and outstanding as on March 31, 2011 Rs. 112.00 lacs (March 31, 2010: Rs. Nil)
Schedule 9 - OTHER LOANS AND ADVANCESUnsecured, considered goodAdvance recoverable from subsidiaries ^ $ 13,923.71 5.05 Advances recoverable in cash or in kind or for value to be received 28,700.38 25,437.28 Securtisation Deferred Consideration Receivable 368,676.26 203,804.05 Service tax credit (input) receivable 141.50 537.34 Prepaid expenses 5,728.34 8,649.99 Security deposits 833.93 722.61
418,004.12 239,156.32
^ Maximum advance given to subsidiary M/s. Shriram Equipment Finance Company Limited at anytime during the year: Rs. 30,258.15 lacs (March 31, 2010: Rs. 2.77 lacs)
$ Maximum advance given to subsidiary M/s. Shriram Automall India Limited at anytime during the year : Rs. 4,294.87 lacs (March 31, 2010: Rs. 2.31 lacs)
Schedules forming part of the Balance Sheet (Contd.)
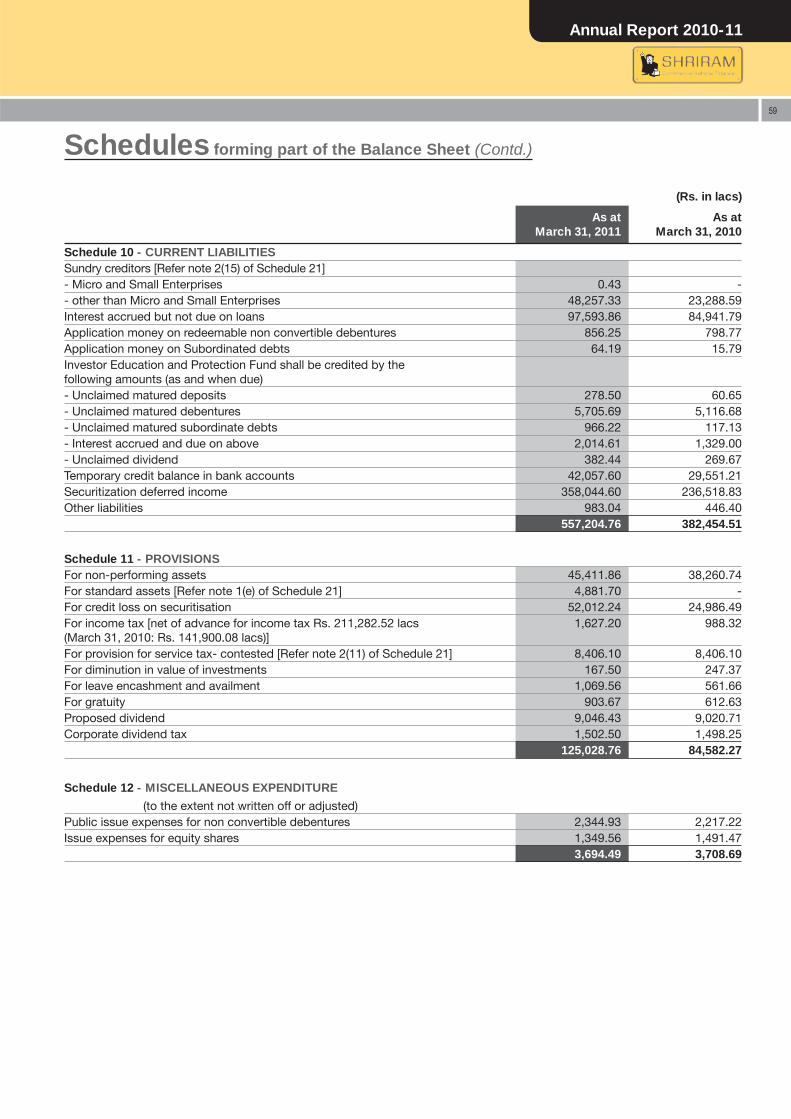
Annual Report 2010-11
59
(Rs. in lacs)
As atMarch 31, 2011
As atMarch 31, 2010
Schedule 10 - CURRENT LIABILITIESSundry creditors [Refer note 2(15) of Schedule 21]- Micro and Small Enterprises 0.43 - - other than Micro and Small Enterprises 48,257.33 23,288.59 Interest accrued but not due on loans 97,593.86 84,941.79 Application money on redeemable non convertible debentures 856.25 798.77 Application money on Subordinated debts 64.19 15.79 Investor Education and Protection Fund shall be credited by the following amounts (as and when due)- Unclaimed matured deposits 278.50 60.65 - Unclaimed matured debentures 5,705.69 5,116.68 - Unclaimed matured subordinate debts 966.22 117.13 - Interest accrued and due on above 2,014.61 1,329.00 - Unclaimed dividend 382.44 269.67 Temporary credit balance in bank accounts 42,057.60 29,551.21 Securitization deferred income 358,044.60 236,518.83 Other liabilities 983.04 446.40
557,204.76 382,454.51
Schedule 11 - PROVISIONSFor non-performing assets 45,411.86 38,260.74 For standard assets [Refer note 1(e) of Schedule 21] 4,881.70 - For credit loss on securitisation 52,012.24 24,986.49 For income tax [net of advance for income tax Rs. 211,282.52 lacs (March 31, 2010: Rs. 141,900.08 lacs)]
1,627.20 988.32
For provision for service tax- contested [Refer note 2(11) of Schedule 21] 8,406.10 8,406.10 For diminution in value of investments 167.50 247.37 For leave encashment and availment 1,069.56 561.66 For gratuity 903.67 612.63 Proposed dividend 9,046.43 9,020.71 Corporate dividend tax 1,502.50 1,498.25
125,028.76 84,582.27
Schedule 12 - MISCELLANEOUS EXPENDITURE
(to the extent not written off or adjusted)Public issue expenses for non convertible debentures 2,344.93 2,217.22 Issue expenses for equity shares 1,349.56 1,491.47
3,694.49 3,708.69
Schedules forming part of the Balance Sheet (Contd.)
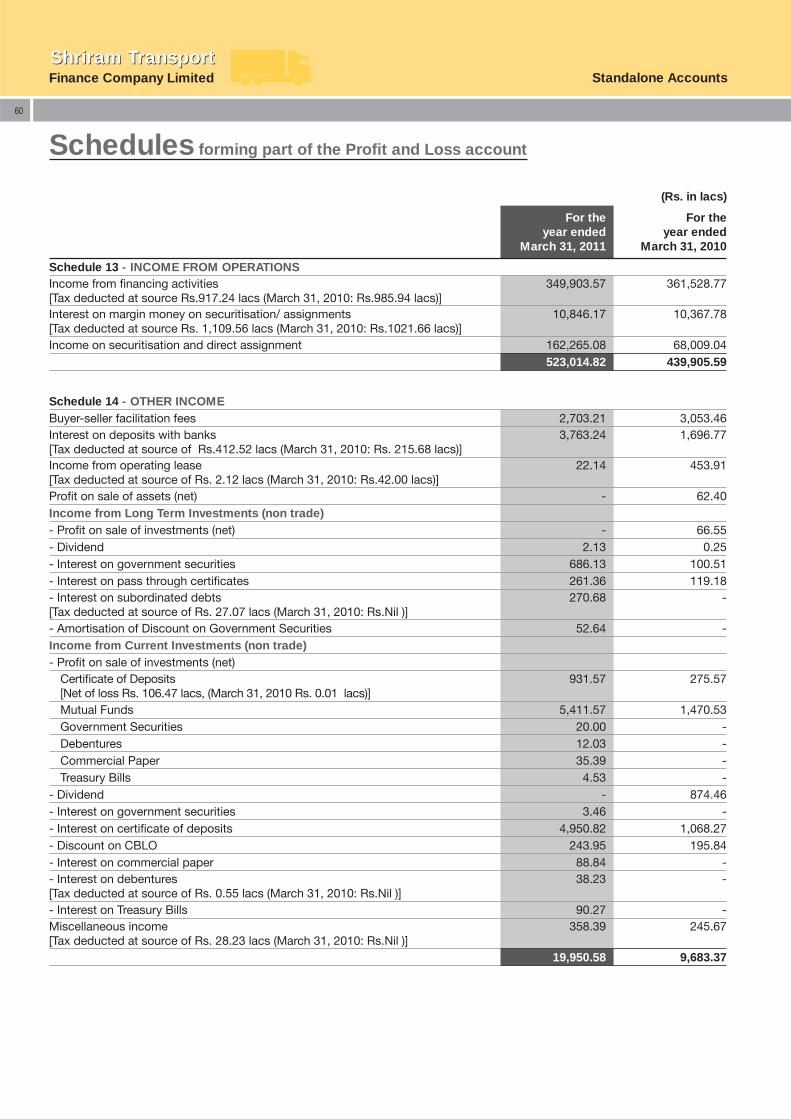
Finance Company LimitedShriram TransportShriram Transport
Standalone Accounts
60
(Rs. in lacs)
For theyear ended
March 31, 2011
For theyear ended
March 31, 2010
Schedule 13 - INCOME FROM OPERATIONSIncome from fi nancing activities[Tax deducted at source Rs.917.24 lacs (March 31, 2010: Rs.985.94 lacs)]
349,903.57 361,528.77
Interest on margin money on securitisation/ assignments[Tax deducted at source Rs. 1,109.56 lacs (March 31, 2010: Rs.1021.66 lacs)]
10,846.17 10,367.78
Income on securitisation and direct assignment 162,265.08 68,009.04 523,014.82 439,905.59
Schedule 14 - OTHER INCOMEBuyer-seller facilitation fees 2,703.21 3,053.46 Interest on deposits with banks[Tax deducted at source of Rs.412.52 lacs (March 31, 2010: Rs. 215.68 lacs)]
3,763.24 1,696.77
Income from operating lease [Tax deducted at source of Rs. 2.12 lacs (March 31, 2010: Rs.42.00 lacs)]
22.14 453.91
Profi t on sale of assets (net) - 62.40 Income from Long Term Investments (non trade)- Profi t on sale of investments (net) - 66.55 - Dividend 2.13 0.25 - Interest on government securities 686.13 100.51 - Interest on pass through certifi cates 261.36 119.18 - Interest on subordinated debts[Tax deducted at source of Rs. 27.07 lacs (March 31, 2010: Rs.Nil )]
270.68 -
- Amortisation of Discount on Government Securities 52.64 - Income from Current Investments (non trade)- Profi t on sale of investments (net)
Certifi cate of Deposits [Net of loss Rs. 106.47 lacs, (March 31, 2010 Rs. 0.01 lacs)]
931.57 275.57
Mutual Funds 5,411.57 1,470.53 Government Securities 20.00 - Debentures 12.03 - Commercial Paper 35.39 - Treasury Bills 4.53 -
- Dividend - 874.46 - Interest on government securities 3.46 - - Interest on certifi cate of deposits 4,950.82 1,068.27 - Discount on CBLO 243.95 195.84 - Interest on commercial paper 88.84 - - Interest on debentures [Tax deducted at source of Rs. 0.55 lacs (March 31, 2010: Rs.Nil )]
38.23 -
- Interest on Treasury Bills 90.27 - Miscellaneous income[Tax deducted at source of Rs. 28.23 lacs (March 31, 2010: Rs.Nil )]
358.39 245.67
19,950.58 9,683.37
Schedules forming part of the Profi t and Loss account
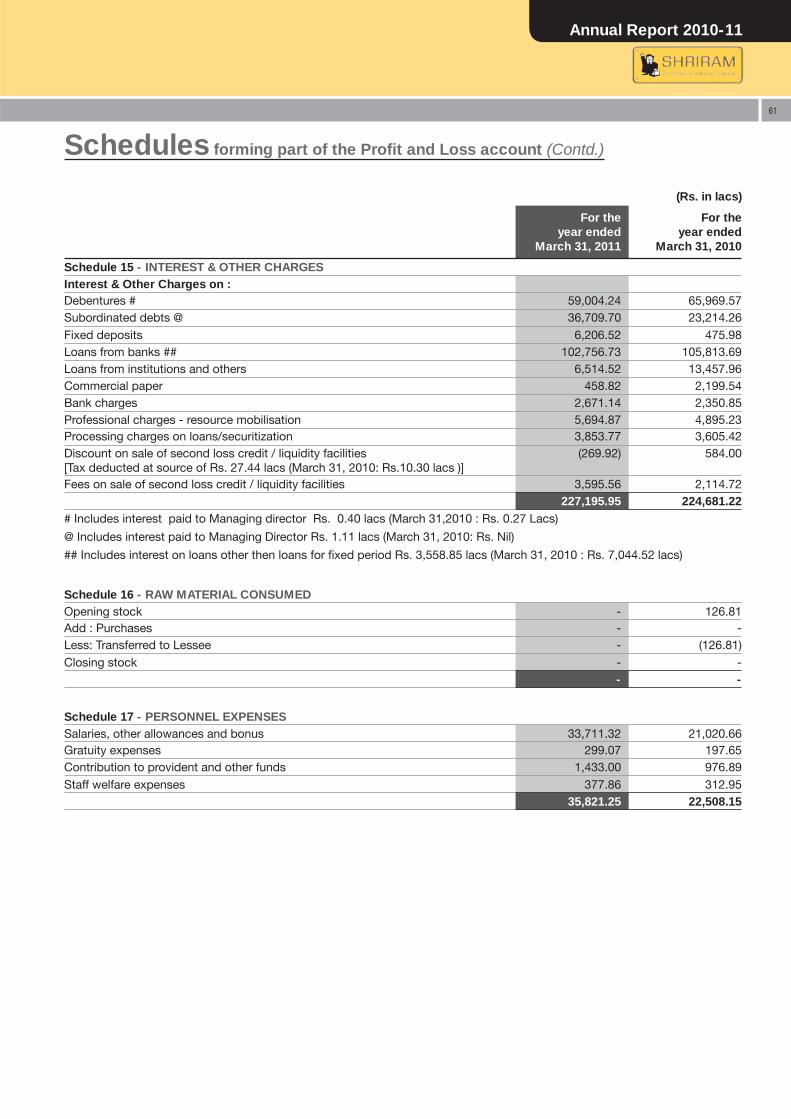
Annual Report 2010-11
61
(Rs. in lacs)
For theyear ended
March 31, 2011
For theyear ended
March 31, 2010
Schedule 15 - INTEREST & OTHER CHARGESInterest & Other Charges on :Debentures # 59,004.24 65,969.57 Subordinated debts @ 36,709.70 23,214.26 Fixed deposits 6,206.52 475.98 Loans from banks ## 102,756.73 105,813.69 Loans from institutions and others 6,514.52 13,457.96 Commercial paper 458.82 2,199.54 Bank charges 2,671.14 2,350.85 Professional charges - resource mobilisation 5,694.87 4,895.23 Processing charges on loans/securitization 3,853.77 3,605.42 Discount on sale of second loss credit / liquidity facilities[Tax deducted at source of Rs. 27.44 lacs (March 31, 2010: Rs.10.30 lacs )]
(269.92) 584.00
Fees on sale of second loss credit / liquidity facilities 3,595.56 2,114.72 227,195.95 224,681.22
# Includes interest paid to Managing director Rs. 0.40 lacs (March 31,2010 : Rs. 0.27 Lacs)
@ Includes interest paid to Managing Director Rs. 1.11 lacs (March 31, 2010: Rs. Nil)
## Includes interest on loans other then loans for fi xed period Rs. 3,558.85 lacs (March 31, 2010 : Rs. 7,044.52 lacs)
Schedule 16 - RAW MATERIAL CONSUMEDOpening stock - 126.81 Add : Purchases - - Less: Transferred to Lessee - (126.81)Closing stock - -
- -
Schedule 17 - PERSONNEL EXPENSESSalaries, other allowances and bonus 33,711.32 21,020.66 Gratuity expenses 299.07 197.65 Contribution to provident and other funds 1,433.00 976.89 Staff welfare expenses 377.86 312.95
35,821.25 22,508.15
Schedules forming part of the Profi t and Loss account (Contd.)
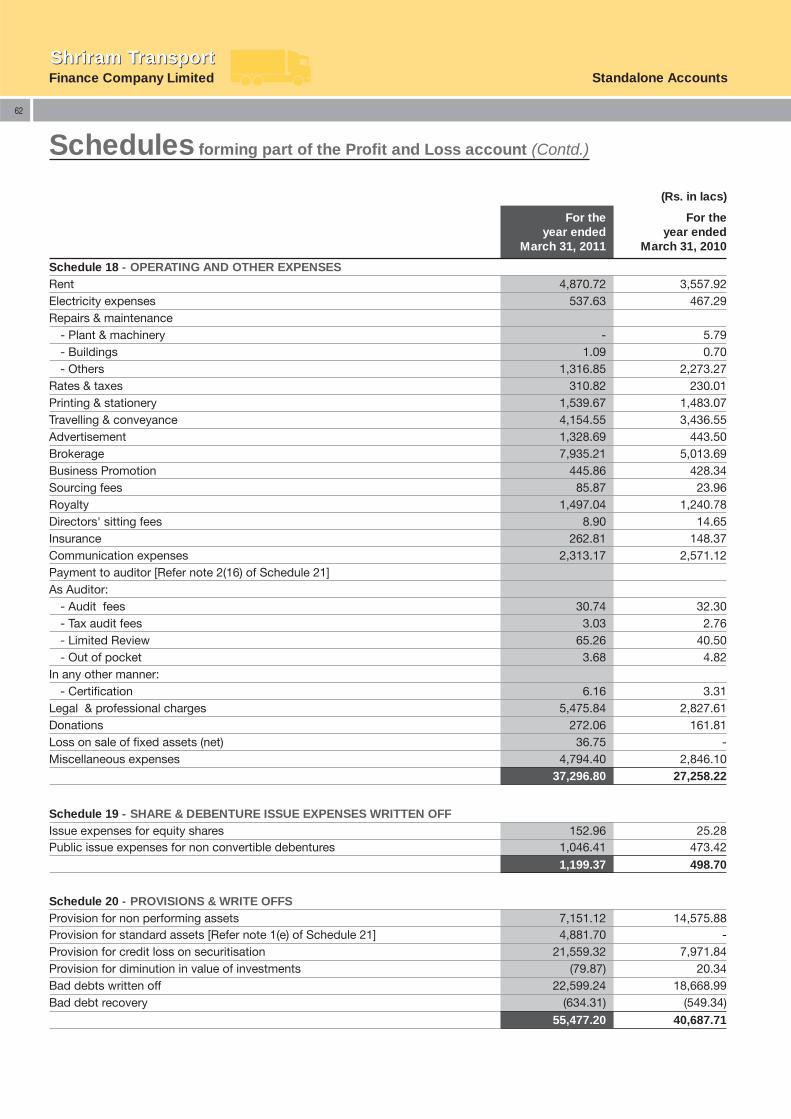
Finance Company LimitedShriram TransportShriram Transport
Standalone Accounts
62
(Rs. in lacs)
For theyear ended
March 31, 2011
For theyear ended
March 31, 2010
Schedule 18 - OPERATING AND OTHER EXPENSESRent 4,870.72 3,557.92 Electricity expenses 537.63 467.29 Repairs & maintenance
- Plant & machinery - 5.79 - Buildings 1.09 0.70 - Others 1,316.85 2,273.27
Rates & taxes 310.82 230.01 Printing & stationery 1,539.67 1,483.07 Travelling & conveyance 4,154.55 3,436.55 Advertisement 1,328.69 443.50 Brokerage 7,935.21 5,013.69 Business Promotion 445.86 428.34 Sourcing fees 85.87 23.96 Royalty 1,497.04 1,240.78 Directors' sitting fees 8.90 14.65 Insurance 262.81 148.37 Communication expenses 2,313.17 2,571.12 Payment to auditor [Refer note 2(16) of Schedule 21]As Auditor:
- Audit fees 30.74 32.30 - Tax audit fees 3.03 2.76 - Limited Review 65.26 40.50 - Out of pocket 3.68 4.82
In any other manner:- Certifi cation 6.16 3.31
Legal & professional charges 5,475.84 2,827.61 Donations 272.06 161.81 Loss on sale of fi xed assets (net) 36.75 - Miscellaneous expenses 4,794.40 2,846.10
37,296.80 27,258.22
Schedules forming part of the Profi t and Loss account (Contd.)
Schedule 19 - SHARE & DEBENTURE ISSUE EXPENSES WRITTEN OFFIssue expenses for equity shares 152.96 25.28 Public issue expenses for non convertible debentures 1,046.41 473.42
1,199.37 498.70
Schedule 20 - PROVISIONS & WRITE OFFSProvision for non performing assets 7,151.12 14,575.88 Provision for standard assets [Refer note 1(e) of Schedule 21] 4,881.70 - Provision for credit loss on securitisation 21,559.32 7,971.84 Provision for diminution in value of investments (79.87) 20.34 Bad debts written off 22,599.24 18,668.99 Bad debt recovery (634.31) (549.34)
55,477.20 40,687.71
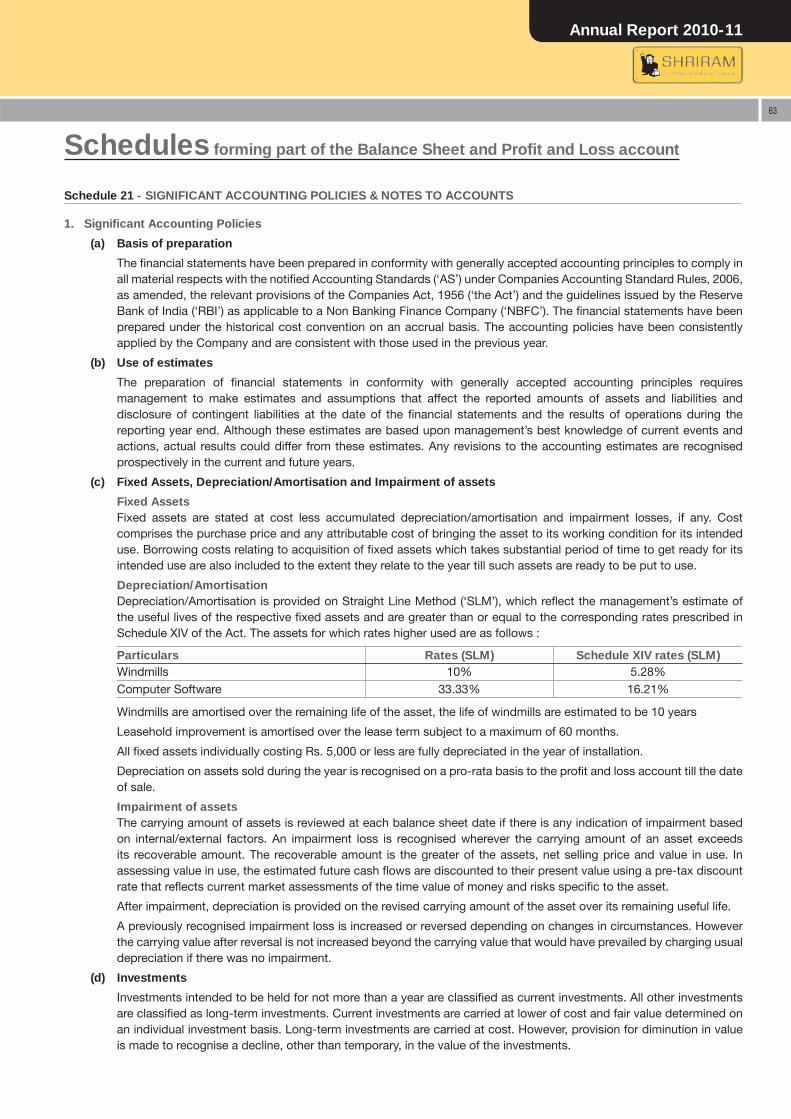
Annual Report 2010-11
63
Schedule 21 - SIGNIFICANT ACCOUNTING POLICIES & NOTES TO ACCOUNTS
1. Signifi cant Accounting Policies
(a) Basis of preparation
The fi nancial statements have been prepared in conformity with generally accepted accounting principles to comply in all material respects with the notifi ed Accounting Standards (‘AS’) under Companies Accounting Standard Rules, 2006, as amended, the relevant provisions of the Companies Act, 1956 (‘the Act’) and the guidelines issued by the Reserve Bank of India (‘RBI’) as applicable to a Non Banking Finance Company (‘NBFC’). The fi nancial statements have been prepared under the historical cost convention on an accrual basis. The accounting policies have been consistently applied by the Company and are consistent with those used in the previous year.
(b) Use of estimates
The preparation of fi nancial statements in conformity with generally accepted accounting principles requires management to make estimates and assumptions that affect the reported amounts of assets and liabilities and disclosure of contingent liabilities at the date of the fi nancial statements and the results of operations during the reporting year end. Although these estimates are based upon management’s best knowledge of current events and actions, actual results could differ from these estimates. Any revisions to the accounting estimates are recognised prospectively in the current and future years.
(c) Fixed Assets, Depreciation/Amortisation and Impairment of assets
Fixed Assets Fixed assets are stated at cost less accumulated depreciation/amortisation and impairment losses, if any. Cost
comprises the purchase price and any attributable cost of bringing the asset to its working condition for its intended use. Borrowing costs relating to acquisition of fi xed assets which takes substantial period of time to get ready for its intended use are also included to the extent they relate to the year till such assets are ready to be put to use.
Depreciation/Amortisation Depreciation/Amortisation is provided on Straight Line Method (‘SLM’), which refl ect the management’s estimate of
the useful lives of the respective fi xed assets and are greater than or equal to the corresponding rates prescribed in Schedule XIV of the Act. The assets for which rates higher used are as follows :
Particulars Rates (SLM) Schedule XIV rates (SLM)Windmills 10% 5.28%Computer Software 33.33% 16.21%
Windmills are amortised over the remaining life of the asset, the life of windmills are estimated to be 10 years
Leasehold improvement is amortised over the lease term subject to a maximum of 60 months.
All fi xed assets individually costing Rs. 5,000 or less are fully depreciated in the year of installation.
Depreciation on assets sold during the year is recognised on a pro-rata basis to the profi t and loss account till the date of sale.
Impairment of assets The carrying amount of assets is reviewed at each balance sheet date if there is any indication of impairment based
on internal/external factors. An impairment loss is recognised wherever the carrying amount of an asset exceeds its recoverable amount. The recoverable amount is the greater of the assets, net selling price and value in use. In assessing value in use, the estimated future cash fl ows are discounted to their present value using a pre-tax discount rate that refl ects current market assessments of the time value of money and risks specifi c to the asset.
After impairment, depreciation is provided on the revised carrying amount of the asset over its remaining useful life.
A previously recognised impairment loss is increased or reversed depending on changes in circumstances. However the carrying value after reversal is not increased beyond the carrying value that would have prevailed by charging usual depreciation if there was no impairment.
(d) Investments
Investments intended to be held for not more than a year are classifi ed as current investments. All other investments are classifi ed as long-term investments. Current investments are carried at lower of cost and fair value determined on an individual investment basis. Long-term investments are carried at cost. However, provision for diminution in value is made to recognise a decline, other than temporary, in the value of the investments.
Schedules forming part of the Balance Sheet and Profi t and Loss account
Finance Company LimitedShriram TransportShriram Transport
Standalone Accounts
64
Schedules forming part of the Balance Sheet and Profi t and Loss account (Contd.)
(e) Provisioning / Write-off of assets
Non performing loans are written off / provided for, as per management estimates, subject to the minimum provision required as per Non- Banking Financial (Deposit Accepting or Holding) Companies Prudential Norms (Reserve Bank) Directions, 2007. Delinquencies on assets securitised are provided for based on management estimates of the historical data.
Provision on standard assets is made as per the notifi cation DNBS.PD.CC.No.207/ 03.02.002 /2010-11 issued by Reserve Bank of India.
(f) Hypothecation loans
Hypothecation loans are stated at the amount advanced including fi nance charges accrued and expenses recoverable, as reduced by the amounts received up to the balance sheet date and loans securitised.
(g) Leases
Where the Company is the lessor Assets given on operating leases are included in fi xed assets. Lease income is recognised in the Profi t and Loss
Account on a straight-line basis over the lease term. Costs, including depreciation are recognised as an expense in the Profi t and Loss Account. Initial direct costs such as legal costs, brokerage costs, etc. are recognised immediately in the Profi t and Loss Account.
Where the Company is the lessee Leases where the lessor effectively retains substantially all the risks and benefi ts of ownership of the leased term, are
classifi ed as operating leases. Operating lease payments are recognised as an expense in the Profi t and Loss account on a straight-line basis over the lease term.
(h) Foreign currency translation
Initial recognition Transactions in foreign currency entered into during the year are recorded at the exchange rates prevailing on the date
of the transaction.
Conversion Monetary assets and liabilities denominated in foreign currency are translated in to Rupees at exchange rate prevailing
on the date of the Balance Sheet.
Exchange differences All exchange differences are dealt with in the profi t and loss account.
(i) Revenue recognition
Revenue is recognised to the extent that it is probable that the economic benefi ts will fl ow to the Company and the revenue can be reliably measured.
i. Income from fi nancing activities is recognised on the basis of internal rate of return.
ii. Income recognised and remaining unrealised after installments become overdue for six months or more in case of secured/unsecured loans and twelve months or more in case of fi nancial lease transactions are reversed and are accounted as income when these are actually realised.
iii. Additional fi nance charges / additional interest are treated to accrue only on realisation, due to uncertainty of realisation and are accounted accordingly.
iv. Gains arising on securitisation/direct assignment of assets is recognised over the tenure of agreements as per guideline on securitisation of standard assets issued by RBI, loss, if any is recognised upfront.
v. Income from services is recognised as per the terms of the contract on an accrual basis.
vi. Interest income on fi xed deposits/margin money, call money (CBLO), certifi cate of deposits, pass through certifi cates, subordinate debts and treasury bills is recognised on a time proportion basis taking into account the amount outstanding and the rate applicable.
vii. Dividend is recognised as income when right to receive payment is established by the date of balance sheet.
viii. Profi t/loss on the sale of investments is recognized at the time of actual sale/redemption.
ix. Income from operating lease is recognized as rentals, as accrued on straight line basis over the period of the lease.
Annual Report 2010-11
65
Schedules forming part of the Balance Sheet and Profi t and Loss account (Contd.)
(j) Employee benefi ts
Provident Fund All the employees of the Company are entitled to receive benefi ts under the Provident Fund, a defi ned contribution plan
in which both the employee and the Company contribute monthly at a stipulated rate. The Company has no liability for future Provident Fund benefi ts other than its annual contribution and recognises such contributions as an expense in the year it is incurred.
Gratuity The Company provides for the gratuity, a defi ned benefi t retirement plan covering all employees. The plan provides for
lump sum payments to employees upon death while in employment or on separation from employment after serving for the stipulated year mentioned under ‘The Payment of Gratuity Act, 1972’. The Company accounts for liability of future gratuity benefi ts based on an external actuarial valuation on projected unit credit method carried out for assessing liability as at the reporting date.
Leave Encashment Short term compensated absences are provided for based on estimates. Long term compensated absences are
provided for based on actuarial valuation. The actuarial valuation is done as per projected unit credit method as at the reporting date.
Actuarial gains/losses are immediately taken to profi t and loss account and are not deferred.
(k) Income tax
Tax expense comprises of current tax and deferred tax. Current income tax is measured at the amount expected to be paid to the tax authorities in accordance with the Indian Income Tax Act, 1961. Deferred income taxes refl ects the impact of current year timing differences between taxable income and accounting income for the year and reversal of timing differences of earlier years. Deferred tax is measured based on the tax rates and the tax laws enacted or substantively enacted at the balance sheet date. Deferred tax assets are recognised only to the extent that there is reasonable certainty that suffi cient future taxable income will be available against which such deferred tax assets can be realised. In situations where the Company has unabsorbed depreciation or carry forward tax losses, all deferred tax assets are recognised only if there is virtual certainty supported by convincing evidence that they can be realised against future taxable profi ts.
The un-recognised deferred tax assets are re-assessed by the Company at each balance sheet date and are recognised to the extent that it has become reasonably certain or virtually certain, as the case may be that suffi cient future taxable income will be available against which such deferred tax assets can be realised.
The carrying cost of the deferred tax assets are reviewed at each balance sheet date. The Company writes down the carrying amount of a deferred tax asset to the extent that it is no longer reasonably certain or virtually certain, as the case may be, that suffi cient future taxable income will be available against which deferred tax asset can be realised. Any such write down is reversed to the extent that it becomes reasonably certain or virtually certain, as the case may be, that suffi cient future taxable income will be available.
(l) Segment reporting policies
Identifi cation of segments: The Company’s operating businesses are organised and managed separately according to the nature of products and
services provided, with each segment representing a strategic business unit that offers different products and serves different markets. The analysis of geographical segments is based on the areas in which major operating divisions of the Company operate.
Unallocated items: Unallocated items include income and expenses which are not allocated to any reportable business segment.
Segment Policies : The company prepares its segment information in conformity with the accounting policies adopted for preparing and
presenting the fi nancial statements of the company as a whole.
(m) Earnings per share
Basic earnings per share is calculated by dividing the net profi t or loss for the year attributable to equity shareholders (after deducting attributable taxes) by the weighted average number of equity shares outstanding during the year.
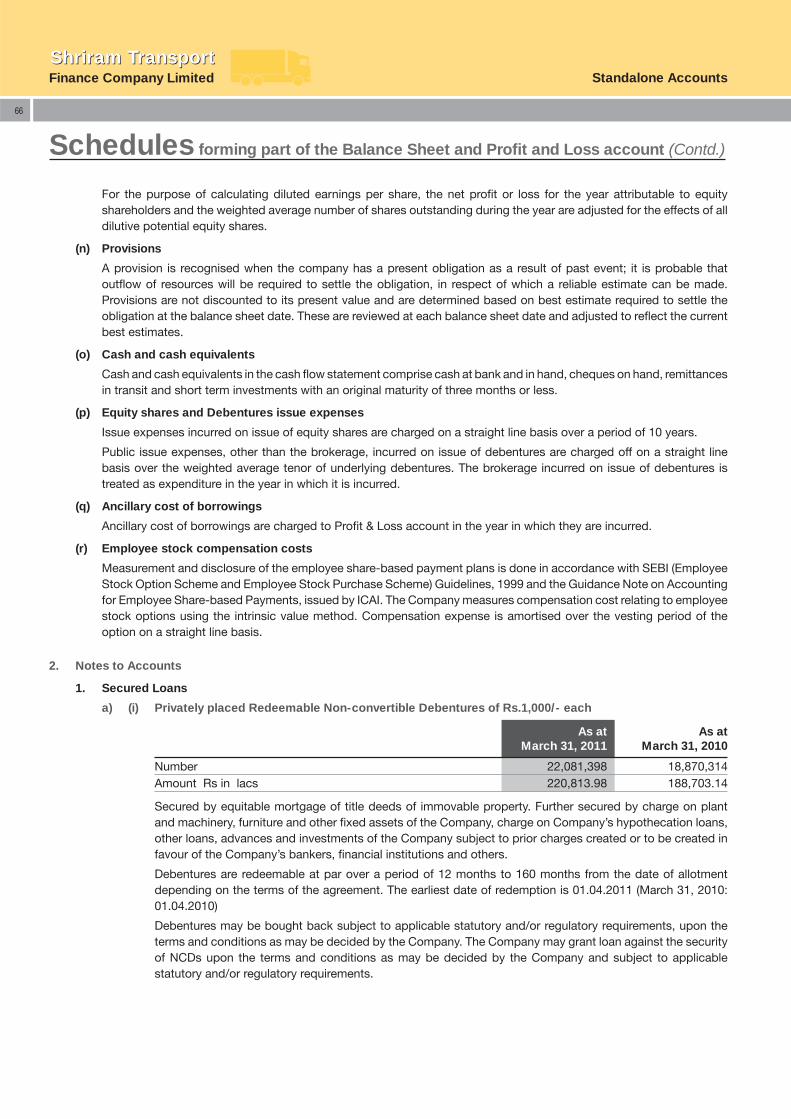
Finance Company LimitedShriram TransportShriram Transport
Standalone Accounts
66
For the purpose of calculating diluted earnings per share, the net profi t or loss for the year attributable to equity shareholders and the weighted average number of shares outstanding during the year are adjusted for the effects of all dilutive potential equity shares.
(n) Provisions
A provision is recognised when the company has a present obligation as a result of past event; it is probable that outfl ow of resources will be required to settle the obligation, in respect of which a reliable estimate can be made. Provisions are not discounted to its present value and are determined based on best estimate required to settle the obligation at the balance sheet date. These are reviewed at each balance sheet date and adjusted to refl ect the current best estimates.
(o) Cash and cash equivalents
Cash and cash equivalents in the cash fl ow statement comprise cash at bank and in hand, cheques on hand, remittances in transit and short term investments with an original maturity of three months or less.
(p) Equity shares and Debentures issue expenses
Issue expenses incurred on issue of equity shares are charged on a straight line basis over a period of 10 years.
Public issue expenses, other than the brokerage, incurred on issue of debentures are charged off on a straight line basis over the weighted average tenor of underlying debentures. The brokerage incurred on issue of debentures is treated as expenditure in the year in which it is incurred.
(q) Ancillary cost of borrowings
Ancillary cost of borrowings are charged to Profi t & Loss account in the year in which they are incurred.
(r) Employee stock compensation costs
Measurement and disclosure of the employee share-based payment plans is done in accordance with SEBI (Employee Stock Option Scheme and Employee Stock Purchase Scheme) Guidelines, 1999 and the Guidance Note on Accounting for Employee Share-based Payments, issued by ICAI. The Company measures compensation cost relating to employee stock options using the intrinsic value method. Compensation expense is amortised over the vesting period of the option on a straight line basis.
2. Notes to Accounts
1. Secured Loans
a) (i) Privately placed Redeemable Non-convertible Debentures of Rs.1,000/- each
As atMarch 31, 2011
As atMarch 31, 2010
Number 22,081,398 18,870,314Amount Rs in lacs 220,813.98 188,703.14
Secured by equitable mortgage of title deeds of immovable property. Further secured by charge on plant and machinery, furniture and other fi xed assets of the Company, charge on Company’s hypothecation loans, other loans, advances and investments of the Company subject to prior charges created or to be created in favour of the Company’s bankers, fi nancial institutions and others.
Debentures are redeemable at par over a period of 12 months to 160 months from the date of allotment depending on the terms of the agreement. The earliest date of redemption is 01.04.2011 (March 31, 2010: 01.04.2010)
Debentures may be bought back subject to applicable statutory and/or regulatory requirements, upon the terms and conditions as may be decided by the Company. The Company may grant loan against the security of NCDs upon the terms and conditions as may be decided by the Company and subject to applicable statutory and/or regulatory requirements.
Schedules forming part of the Balance Sheet and Profi t and Loss account (Contd.)
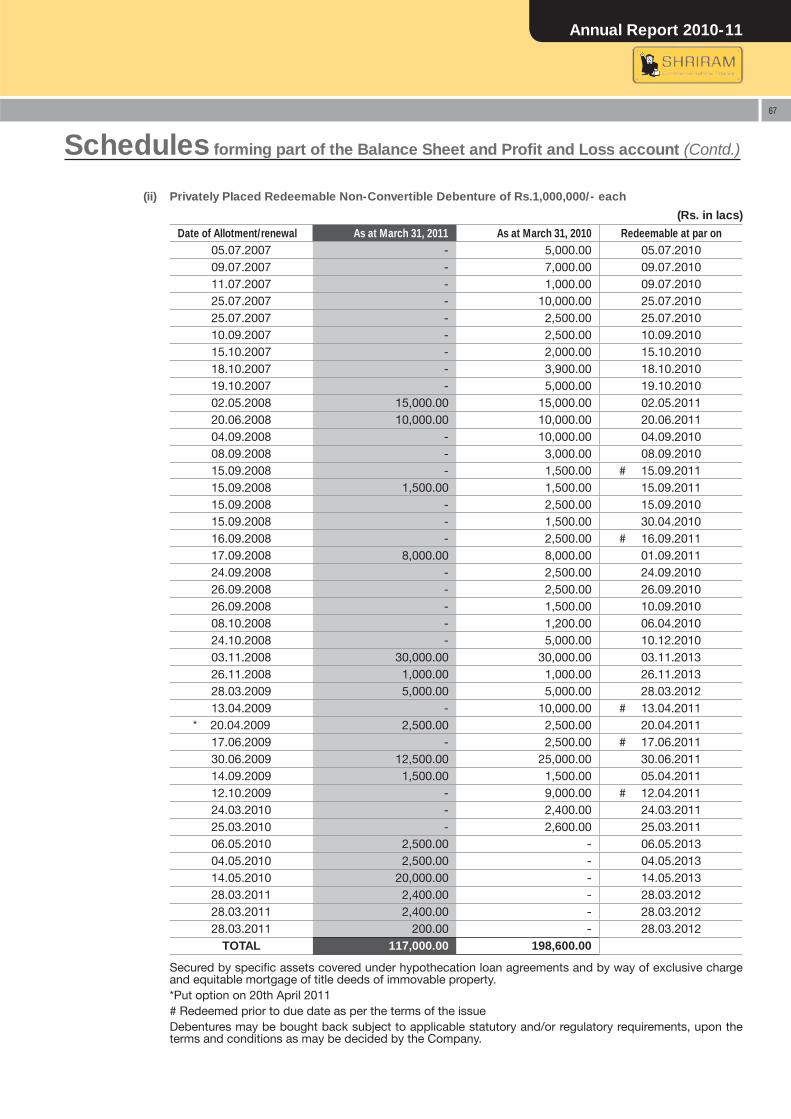
Annual Report 2010-11
67
(ii) Privately Placed Redeemable Non-Convertible Debenture of Rs.1,000,000/- each
(Rs. in lacs)
Date of Allotment/renewal As at March 31, 2011 As at March 31, 2010 Redeemable at par on05.07.2007 - 5,000.00 05.07.201009.07.2007 - 7,000.00 09.07.201011.07.2007 - 1,000.00 09.07.201025.07.2007 - 10,000.00 25.07.201025.07.2007 - 2,500.00 25.07.201010.09.2007 - 2,500.00 10.09.201015.10.2007 - 2,000.00 15.10.201018.10.2007 - 3,900.00 18.10.201019.10.2007 - 5,000.00 19.10.201002.05.2008 15,000.00 15,000.00 02.05.201120.06.2008 10,000.00 10,000.00 20.06.201104.09.2008 - 10,000.00 04.09.201008.09.2008 - 3,000.00 08.09.201015.09.2008 - 1,500.00 # 15.09.201115.09.2008 1,500.00 1,500.00 15.09.201115.09.2008 - 2,500.00 15.09.201015.09.2008 - 1,500.00 30.04.201016.09.2008 - 2,500.00 # 16.09.201117.09.2008 8,000.00 8,000.00 01.09.201124.09.2008 - 2,500.00 24.09.201026.09.2008 - 2,500.00 26.09.201026.09.2008 - 1,500.00 10.09.201008.10.2008 - 1,200.00 06.04.201024.10.2008 - 5,000.00 10.12.201003.11.2008 30,000.00 30,000.00 03.11.201326.11.2008 1,000.00 1,000.00 26.11.201328.03.2009 5,000.00 5,000.00 28.03.201213.04.2009 - 10,000.00 # 13.04.2011
* 20.04.2009 2,500.00 2,500.00 20.04.201117.06.2009 - 2,500.00 # 17.06.201130.06.2009 12,500.00 25,000.00 30.06.201114.09.2009 1,500.00 1,500.00 05.04.201112.10.2009 - 9,000.00 # 12.04.201124.03.2010 - 2,400.00 24.03.201125.03.2010 - 2,600.00 25.03.201106.05.2010 2,500.00 - 06.05.201304.05.2010 2,500.00 - 04.05.201314.05.2010 20,000.00 - 14.05.201328.03.2011 2,400.00 - 28.03.201228.03.2011 2,400.00 - 28.03.201228.03.2011 200.00 - 28.03.2012
TOTAL 117,000.00 198,600.00
Secured by specifi c assets covered under hypothecation loan agreements and by way of exclusive charge and equitable mortgage of title deeds of immovable property.*Put option on 20th April 2011# Redeemed prior to due date as per the terms of the issueDebentures may be bought back subject to applicable statutory and/or regulatory requirements, upon the terms and conditions as may be decided by the Company.
Schedules forming part of the Balance Sheet and Profi t and Loss account (Contd.)
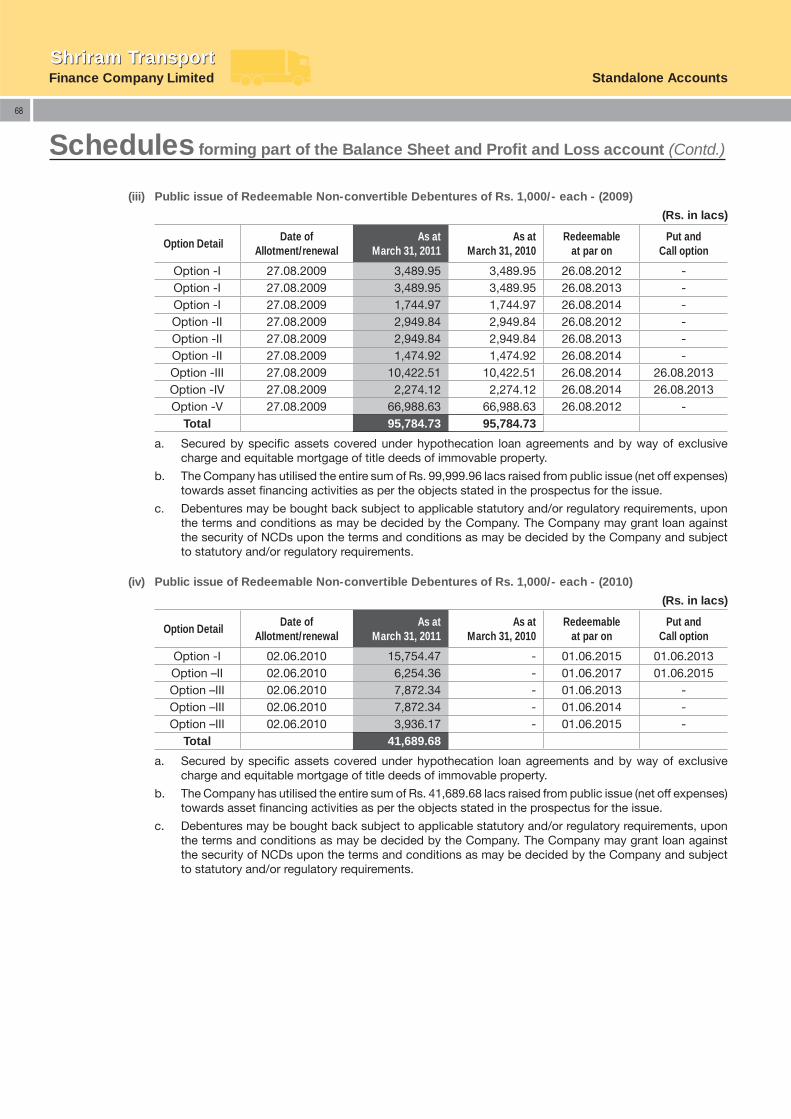
Finance Company LimitedShriram TransportShriram Transport
Standalone Accounts
68
Schedules forming part of the Balance Sheet and Profi t and Loss account (Contd.)
(iii) Public issue of Redeemable Non-convertible Debentures of Rs. 1,000/- each - (2009)
(Rs. in lacs)
Option DetailDate of
Allotment/renewalAs at
March 31, 2011As at
March 31, 2010Redeemable
at par onPut and
Call option
Option -I 27.08.2009 3,489.95 3,489.95 26.08.2012 -Option -I 27.08.2009 3,489.95 3,489.95 26.08.2013 -Option -I 27.08.2009 1,744.97 1,744.97 26.08.2014 -Option -II 27.08.2009 2,949.84 2,949.84 26.08.2012 -Option -II 27.08.2009 2,949.84 2,949.84 26.08.2013 -Option -II 27.08.2009 1,474.92 1,474.92 26.08.2014 -Option -III 27.08.2009 10,422.51 10,422.51 26.08.2014 26.08.2013Option -IV 27.08.2009 2,274.12 2,274.12 26.08.2014 26.08.2013Option -V 27.08.2009 66,988.63 66,988.63 26.08.2012 -
Total 95,784.73 95,784.73
a. Secured by specifi c assets covered under hypothecation loan agreements and by way of exclusive charge and equitable mortgage of title deeds of immovable property.
b. The Company has utilised the entire sum of Rs. 99,999.96 lacs raised from public issue (net off expenses) towards asset fi nancing activities as per the objects stated in the prospectus for the issue.
c. Debentures may be bought back subject to applicable statutory and/or regulatory requirements, upon the terms and conditions as may be decided by the Company. The Company may grant loan against the security of NCDs upon the terms and conditions as may be decided by the Company and subject to statutory and/or regulatory requirements.
(iv) Public issue of Redeemable Non-convertible Debentures of Rs. 1,000/- each - (2010)
(Rs. in lacs)
Option DetailDate of
Allotment/renewalAs at
March 31, 2011As at
March 31, 2010Redeemable
at par onPut and
Call option
Option -I 02.06.2010 15,754.47 - 01.06.2015 01.06.2013Option –II 02.06.2010 6,254.36 - 01.06.2017 01.06.2015Option –III 02.06.2010 7,872.34 - 01.06.2013 -Option –III 02.06.2010 7,872.34 - 01.06.2014 -Option –III 02.06.2010 3,936.17 - 01.06.2015 -
Total 41,689.68
a. Secured by specifi c assets covered under hypothecation loan agreements and by way of exclusive charge and equitable mortgage of title deeds of immovable property.
b. The Company has utilised the entire sum of Rs. 41,689.68 lacs raised from public issue (net off expenses) towards asset fi nancing activities as per the objects stated in the prospectus for the issue.
c. Debentures may be bought back subject to applicable statutory and/or regulatory requirements, upon the terms and conditions as may be decided by the Company. The Company may grant loan against the security of NCDs upon the terms and conditions as may be decided by the Company and subject to statutory and/or regulatory requirements.
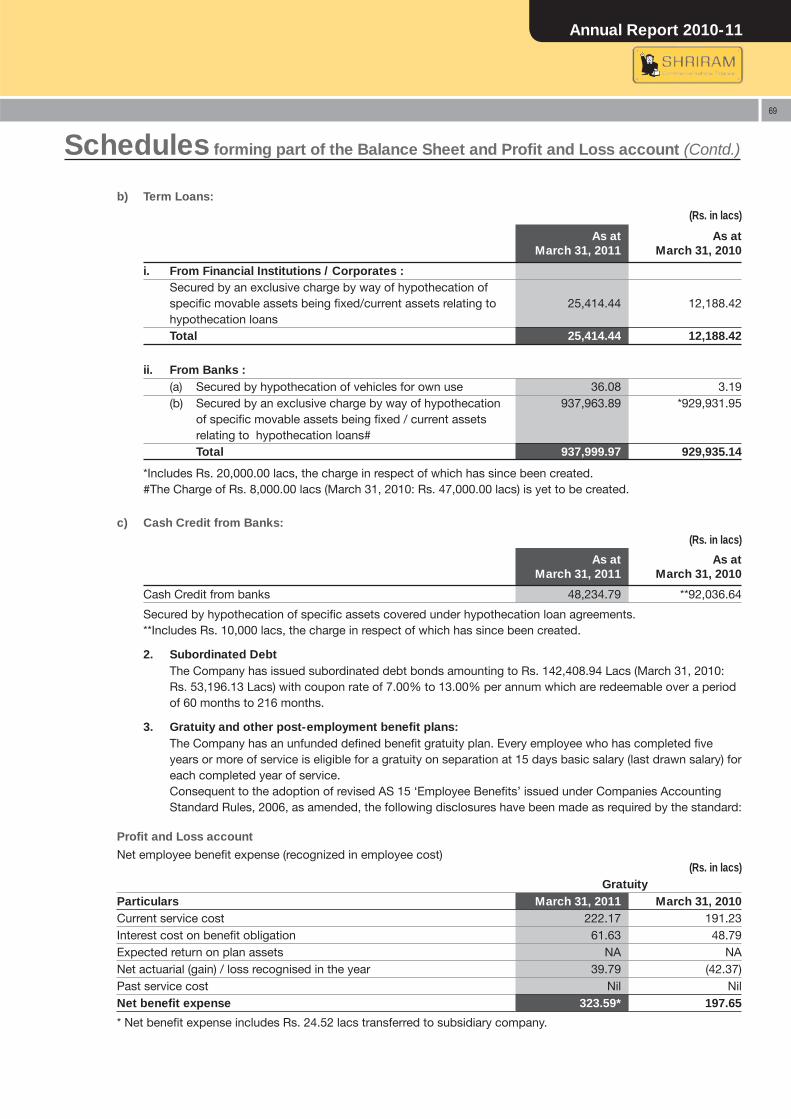
Annual Report 2010-11
69
Schedules forming part of the Balance Sheet and Profi t and Loss account (Contd.)
b) Term Loans:
(Rs. in lacs)
As atMarch 31, 2011
As atMarch 31, 2010
i. From Financial Institutions / Corporates : Secured by an exclusive charge by way of hypothecation of specifi c movable assets being fi xed/current assets relating to hypothecation loans
25,414.44 12,188.42
Total 25,414.44 12,188.42
ii. From Banks : (a) Secured by hypothecation of vehicles for own use 36.08 3.19(b) Secured by an exclusive charge by way of hypothecation
of specifi c movable assets being fi xed / current assets relating to hypothecation loans#
937,963.89 *929,931.95
Total 937,999.97 929,935.14
*Includes Rs. 20,000.00 lacs, the charge in respect of which has since been created.#The Charge of Rs. 8,000.00 lacs (March 31, 2010: Rs. 47,000.00 lacs) is yet to be created.
c) Cash Credit from Banks:(Rs. in lacs)
As atMarch 31, 2011
As atMarch 31, 2010
Cash Credit from banks 48,234.79 **92,036.64
Secured by hypothecation of specifi c assets covered under hypothecation loan agreements.**Includes Rs. 10,000 lacs, the charge in respect of which has since been created.
2. Subordinated DebtThe Company has issued subordinated debt bonds amounting to Rs. 142,408.94 Lacs (March 31, 2010: Rs. 53,196.13 Lacs) with coupon rate of 7.00% to 13.00% per annum which are redeemable over a period of 60 months to 216 months.
3. Gratuity and other post-employment benefi t plans:The Company has an unfunded defi ned benefi t gratuity plan. Every employee who has completed fi ve years or more of service is eligible for a gratuity on separation at 15 days basic salary (last drawn salary) for each completed year of service.Consequent to the adoption of revised AS 15 ‘Employee Benefi ts’ issued under Companies Accounting Standard Rules, 2006, as amended, the following disclosures have been made as required by the standard:
Profi t and Loss account
Net employee benefi t expense (recognized in employee cost)(Rs. in lacs)
GratuityParticulars March 31, 2011 March 31, 2010 Current service cost 222.17 191.23Interest cost on benefi t obligation 61.63 48.79Expected return on plan assets NA NANet actuarial (gain) / loss recognised in the year 39.79 (42.37)Past service cost Nil NilNet benefi t expense 323.59* 197.65
* Net benefi t expense includes Rs. 24.52 lacs transferred to subsidiary company.
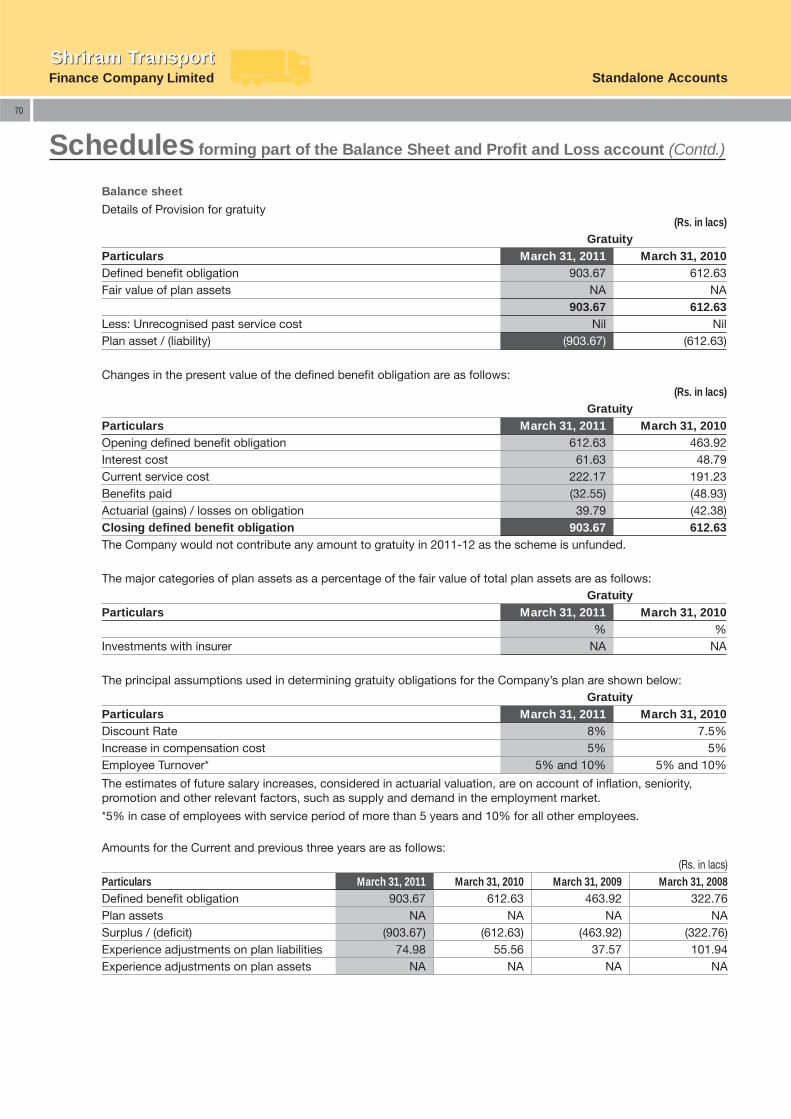
Finance Company LimitedShriram TransportShriram Transport
Standalone Accounts
70
Schedules forming part of the Balance Sheet and Profi t and Loss account (Contd.)
Balance sheet
Details of Provision for gratuity(Rs. in lacs)
GratuityParticulars March 31, 2011 March 31, 2010 Defi ned benefi t obligation 903.67 612.63Fair value of plan assets NA NA
903.67 612.63Less: Unrecognised past service cost Nil NilPlan asset / (liability) (903.67) (612.63)
Changes in the present value of the defi ned benefi t obligation are as follows:(Rs. in lacs)
GratuityParticulars March 31, 2011 March 31, 2010 Opening defi ned benefi t obligation 612.63 463.92Interest cost 61.63 48.79Current service cost 222.17 191.23Benefi ts paid (32.55) (48.93)Actuarial (gains) / losses on obligation 39.79 (42.38)Closing defi ned benefi t obligation 903.67 612.63The Company would not contribute any amount to gratuity in 2011-12 as the scheme is unfunded.
The major categories of plan assets as a percentage of the fair value of total plan assets are as follows:Gratuity
Particulars March 31, 2011 March 31, 2010 % %
Investments with insurer NA NA
The principal assumptions used in determining gratuity obligations for the Company’s plan are shown below:Gratuity
Particulars March 31, 2011 March 31, 2010 Discount Rate 8% 7.5%Increase in compensation cost 5% 5%Employee Turnover* 5% and 10% 5% and 10%
The estimates of future salary increases, considered in actuarial valuation, are on account of infl ation, seniority, promotion and other relevant factors, such as supply and demand in the employment market.
*5% in case of employees with service period of more than 5 years and 10% for all other employees.
Amounts for the Current and previous three years are as follows: (Rs. in lacs)
Particulars March 31, 2011 March 31, 2010 March 31, 2009 March 31, 2008Defi ned benefi t obligation 903.67 612.63 463.92 322.76Plan assets NA NA NA NASurplus / (defi cit) (903.67) (612.63) (463.92) (322.76)Experience adjustments on plan liabilities 74.98 55.56 37.57 101.94Experience adjustments on plan assets NA NA NA NA
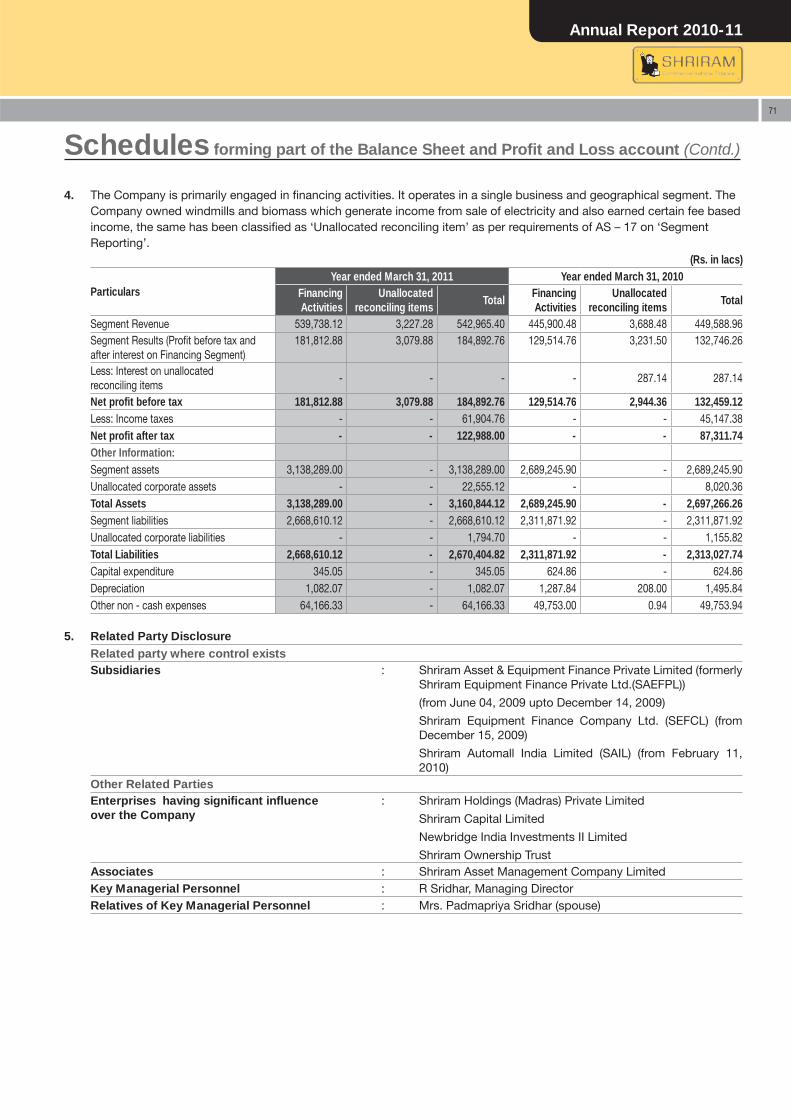
Annual Report 2010-11
71
Schedules forming part of the Balance Sheet and Profi t and Loss account (Contd.)
4. The Company is primarily engaged in fi nancing activities. It operates in a single business and geographical segment. The Company owned windmills and biomass which generate income from sale of electricity and also earned certain fee based income, the same has been classifi ed as ‘Unallocated reconciling item’ as per requirements of AS – 17 on ‘Segment Reporting’.
(Rs. in lacs)
ParticularsYear ended March 31, 2011 Year ended March 31, 2010
Financing Activities
Unallocated reconciling items
TotalFinancing Activities
Unallocated reconciling items
Total
Segment Revenue 539,738.12 3,227.28 542,965.40 445,900.48 3,688.48 449,588.96Segment Results (Profi t before tax and after interest on Financing Segment)
181,812.88 3,079.88 184,892.76 129,514.76 3,231.50 132,746.26
Less: Interest on unallocated reconciling items
- - - - 287.14 287.14
Net profi t before tax 181,812.88 3,079.88 184,892.76 129,514.76 2,944.36 132,459.12Less: Income taxes - - 61,904.76 - - 45,147.38Net profi t after tax - - 122,988.00 - - 87,311.74Other Information:Segment assets 3,138,289.00 - 3,138,289.00 2,689,245.90 - 2,689,245.90Unallocated corporate assets - - 22,555.12 - 8,020.36Total Assets 3,138,289.00 - 3,160,844.12 2,689,245.90 - 2,697,266.26Segment liabilities 2,668,610.12 - 2,668,610.12 2,311,871.92 - 2,311,871.92Unallocated corporate liabilities - - 1,794.70 - - 1,155.82Total Liabilities 2,668,610.12 - 2,670,404.82 2,311,871.92 - 2,313,027.74Capital expenditure 345.05 - 345.05 624.86 - 624.86Depreciation 1,082.07 - 1,082.07 1,287.84 208.00 1,495.84Other non - cash expenses 64,166.33 - 64,166.33 49,753.00 0.94 49,753.94
5. Related Party Disclosure Related party where control existsSubsidiaries : Shriram Asset & Equipment Finance Private Limited (formerly
Shriram Equipment Finance Private Ltd.(SAEFPL))
(from June 04, 2009 upto December 14, 2009)
Shriram Equipment Finance Company Ltd. (SEFCL) (from December 15, 2009)
Shriram Automall India Limited (SAIL) (from February 11, 2010)
Other Related PartiesEnterprises having signifi cant infl uence over the Company
: Shriram Holdings (Madras) Private Limited
Shriram Capital Limited
Newbridge India Investments II Limited
Shriram Ownership TrustAssociates : Shriram Asset Management Company LimitedKey Managerial Personnel : R Sridhar, Managing DirectorRelatives of Key Managerial Personnel : Mrs. Padmapriya Sridhar (spouse)
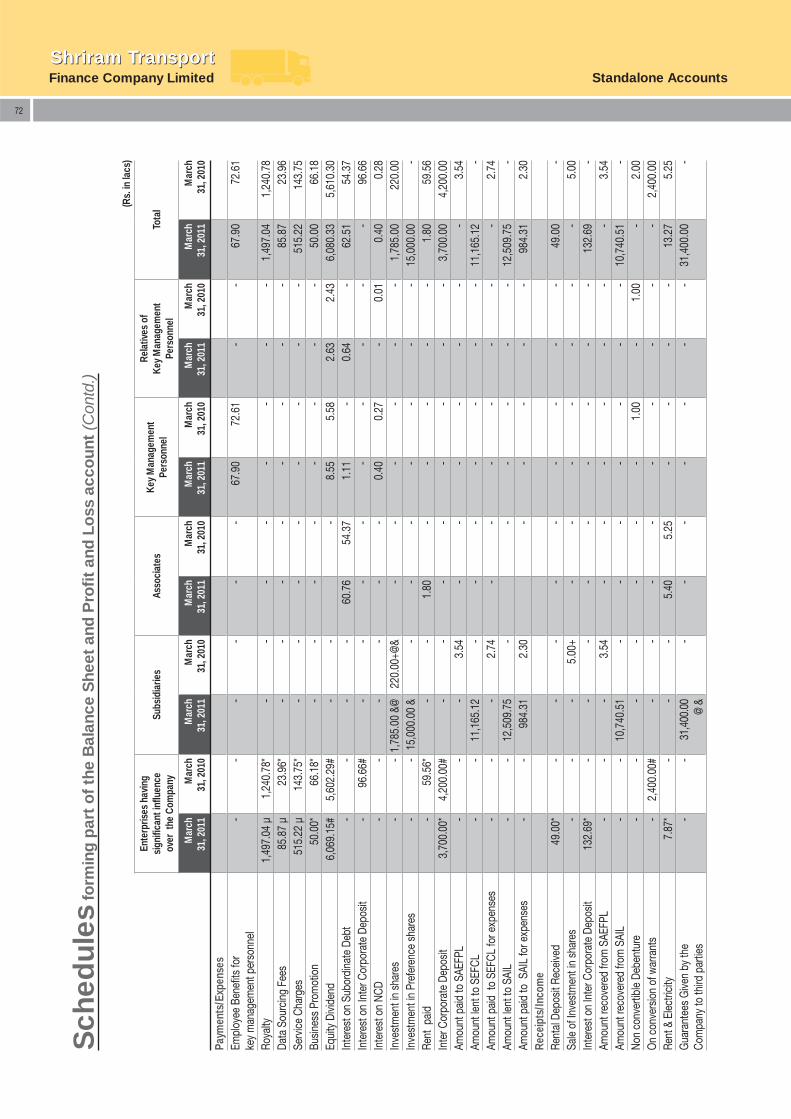
Finance Company LimitedShriram TransportShriram Transport
Standalone Accounts
72
Sch
edul
es f
orm
ing
par
t o
f the
Bal
ance
She
et a
nd P
rofi
t an
d L
oss
acc
oun
t (C
ontd
.)
Paym
ents
/Exp
ense
sEm
ploy
ee B
enefi
ts fo
r ke
y m
anag
emen
t per
sonn
el-
--
--
-67
.90
72.6
1-
-67
.90
72.6
1
Roya
lty1,
497.
04 μ
1,24
0.78
*-
--
--
--
-1,
497.
041,
240.
78Da
ta S
ourc
ing
Fees
85.8
7 μ
23.9
6*-
--
--
--
-85
.87
23.9
6Se
rvic
e Ch
arge
s51
5.22
μ14
3.75
*-
--
--
--
-51
5.22
143.
75Bu
sines
s Pr
omot
ion
50.0
0*66
.18*
--
--
--
--
50.0
066
.18
Equi
ty D
ivide
nd6,
069.
15#
5,60
2.29
#-
--
8.55
5.58
2.63
2.43
6,08
0.33
5,61
0.30
Inte
rest
on
Subo
rdin
ate
Debt
--
--
60.7
654
.37
1.11
-0.
64-
62.5
154
.37
Inte
rest
on
Inte
r Cor
pora
te D
epos
it-
96.6
6#-
--
--
--
--
96.6
6In
tere
st o
n NC
D-
--
--
-0.
400.
27-
0.01
0.40
0.28
Inve
stm
ent i
n sh
ares
--
1,78
5.00
&@
220.
00+@
&-
--
--
-1,
785.
0022
0.00
Inve
stm
ent i
n Pr
efer
ence
sha
res
--
15,0
00.0
0 &
--
--
--
-15
,000
.00
-Re
nt p
aid
-59
.56*
--
1.80
--
--
-1.
8059
.56
Inte
r Cor
pora
te D
epos
it3,
700.
00*
4,20
0.00
#-
--
--
--
-3,
700.
004,
200.
00Am
ount
pai
d to
SAE
FPL
--
-3.
54-
--
--
--
3.54
Amou
nt le
nt to
SEF
CL-
-11
,165
.12
--
--
--
-11
,165
.12
-Am
ount
pai
d to
SEF
CL fo
r exp
ense
s-
--
2.74
--
--
--
-2.
74Am
ount
lent
to S
AIL
--
12,5
09.7
5-
--
--
-12
,509
.75
-Am
ount
pai
d to
SAI
L fo
r exp
ense
s-
-98
4.31
2.30
--
--
-98
4.31
2.30
Rece
ipts
/Inco
me
Rent
al D
epos
it Re
ceive
d49
.00*
--
--
--
--
-49
.00
-Sa
le o
f Inv
estm
ent i
n sh
ares
--
-5.
00+
--
--
--
-5.
00In
tere
st o
n In
ter C
orpo
rate
Dep
osit
132.
69*
--
--
--
--
-13
2.69
-Am
ount
reco
vere
d fro
m S
AEFP
L-
--
3.54
--
--
--
-3.
54Am
ount
reco
vere
d fro
m S
AIL
--
10,7
40.5
1-
--
--
--
10,7
40.5
1-
Non
conv
ertib
le D
eben
ture
--
--
--
-1.
00-
1.00
-2.
00O
n co
nver
sion
of w
arra
nts
-2,
400.
00#
--
--
--
--
-2,
400.
00Re
nt &
Ele
ctric
ity7.
87*
--
-5.
405.
25-
--
-13
.27
5.25
Gua
rant
ees
Give
n by
the
Com
pany
to th
ird p
artie
s-
-31
,400
.00
@ &
--
--
--
-31
,400
.00
-
(Rs.
in la
cs)
Ente
rpris
es h
avin
g si
gnifi
cant
infl u
ence
ov
er t
he C
ompa
nySu
bsid
iarie
sAs
soci
ates
Key
Man
agem
ent
Pers
onne
l
Rela
tives
of
Key
Man
agem
ent
Pers
onne
lTo
tal
M
arch
31
, 201
1 M
arch
31
, 201
0M
arch
31
, 201
1 M
arch
31
, 201
0M
arch
31
, 201
1 M
arch
31
, 201
0M
arch
31
, 201
1 M
arch
31
, 201
0M
arch
31
, 201
1 M
arch
31
, 201
0M
arch
31
, 201
1 M
arch
31
, 201
0
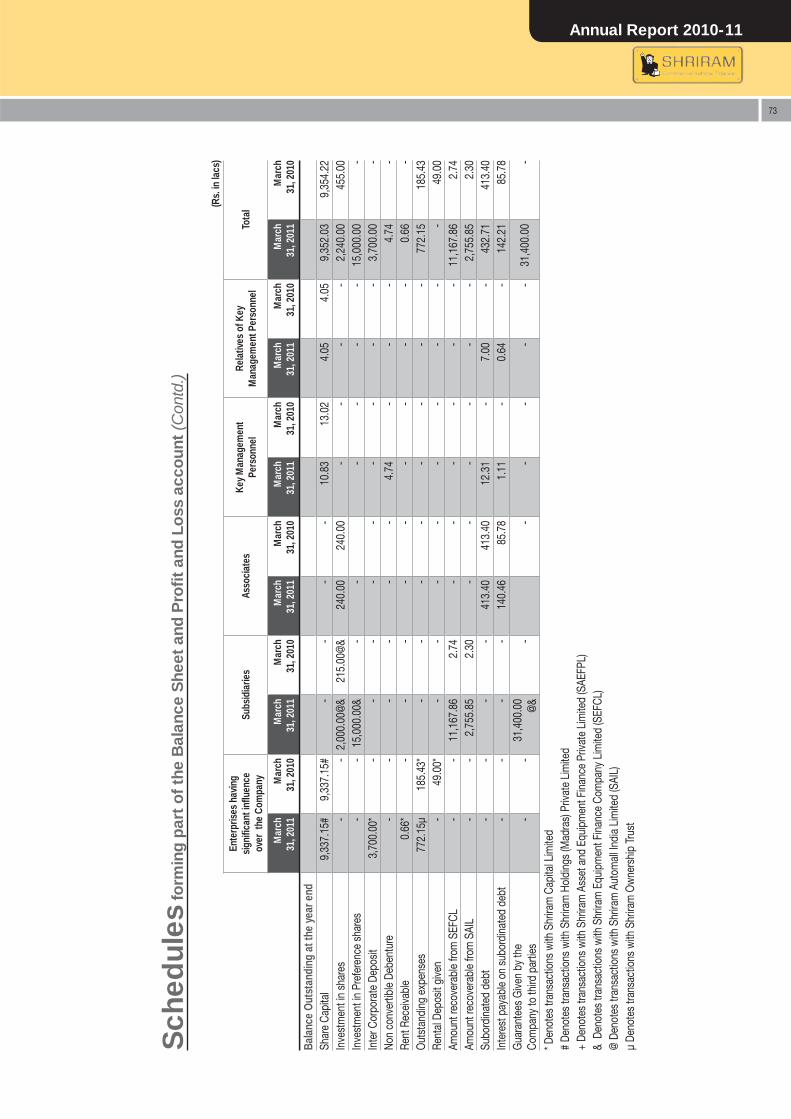
Annual Report 2010-11
73
Sch
edul
es f
orm
ing
par
t o
f the
Bal
ance
She
et a
nd P
rofi
t an
d L
oss
acc
oun
t (C
ontd
.)
(Rs.
in la
cs)
Ente
rpris
es h
avin
g si
gnifi
cant
infl u
ence
ov
er t
he C
ompa
nySu
bsid
iarie
sAs
soci
ates
Key
Man
agem
ent
Pers
onne
lRe
lativ
es o
f Key
M
anag
emen
t Per
sonn
elTo
tal
M
arch
31
, 201
1 M
arch
31
, 201
0M
arch
31
, 201
1 M
arch
31
, 201
0M
arch
31
, 201
1 M
arch
31
, 201
0M
arch
31
, 201
1 M
arch
31
, 201
0M
arch
31
, 201
1 M
arch
31
, 201
0M
arch
31
, 201
1 M
arch
31
, 201
0
Bala
nce
Out
stan
ding
at t
he y
ear e
ndSh
are
Capi
tal
9,33
7.15
#9,
337.
15#
--
--
10.8
313
.02
4.05
4.05
9,35
2.03
9,35
4.22
Inve
stm
ent i
n sh
ares
--
2,00
0.00
@&
215.
00@
&24
0.00
240.
00-
--
-2,
240.
0045
5.00
Inve
stm
ent i
n Pr
efer
ence
sha
res
--
15,0
00.0
0&-
--
--
-15
,000
.00
-In
ter C
orpo
rate
Dep
osit
3,70
0.00
*-
--
--
--
--
3,70
0.00
-No
n co
nver
tible
Deb
entu
re-
--
--
-4.
74-
--
4.74
-Re
nt R
ecei
vabl
e0.
66*
--
--
--
--
-0.
66-
Out
stan
ding
exp
ense
s77
2.15μ
185.
43*
--
--
--
--
772.
1518
5.43
Rent
al D
epos
it gi
ven
-49
.00*
--
--
--
--
-49
.00
Amou
nt re
cove
rabl
e fro
m S
EFCL
--
11,1
67.8
62.
74-
--
--
-11
,167
.86
2.74
Amou
nt re
cove
rabl
e fro
m S
AIL
--
2,75
5.85
2.30
--
--
--
2,75
5.85
2.30
Subo
rdin
ated
deb
t-
--
-41
3.40
413.
4012
.31
-7.
00-
432.
7141
3.40
Inte
rest
pay
able
on
subo
rdin
ated
deb
t-
--
-14
0.46
85.7
81.
11-
0.64
-14
2.21
85.7
8G
uara
ntee
s G
iven
by th
eCo
mpa
ny to
third
par
ties
--
31,4
00.0
0 @
&-
--
--
-31
,400
.00
-
* Den
otes
tran
sact
ions
with
Shr
iram
Cap
ital L
imite
d #
Deno
tes
trans
actio
ns w
ith S
hrira
m H
oldi
ngs
(Mad
ras)
Priv
ate
Lim
ited
+ De
note
s tra
nsac
tions
with
Shr
iram
Ass
et a
nd E
quip
men
t Fin
ance
Priv
ate
Lim
ited
(SAE
FPL)
& D
enot
es tr
ansa
ctio
ns w
ith S
hrira
m E
quip
men
t Fin
ance
Com
pany
Lim
ited
(SEF
CL)
@ D
enot
es tr
ansa
ctio
ns w
ith S
hrira
m A
utom
all I
ndia
Lim
ited
(SAI
L)μ
Deno
tes
trans
actio
ns w
ith S
hrira
m O
wne
rshi
p Tr
ust
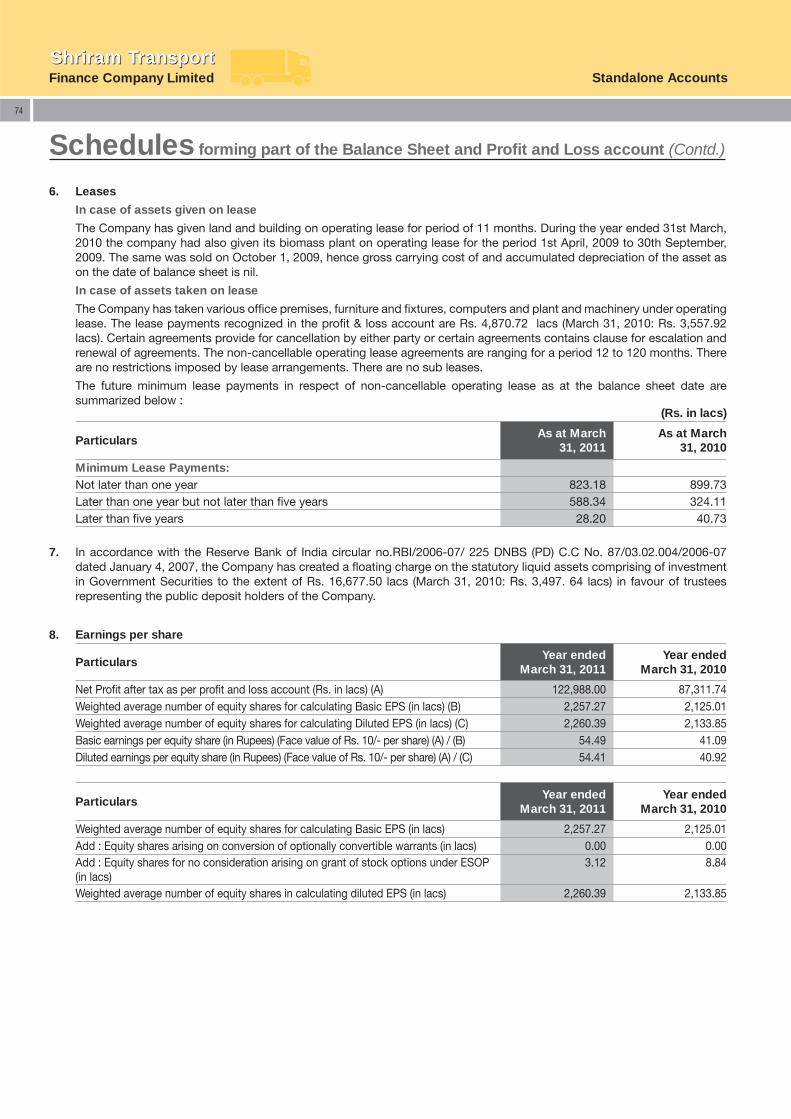
Finance Company LimitedShriram TransportShriram Transport
Standalone Accounts
74
6. Leases
In case of assets given on lease
The Company has given land and building on operating lease for period of 11 months. During the year ended 31st March, 2010 the company had also given its biomass plant on operating lease for the period 1st April, 2009 to 30th September, 2009. The same was sold on October 1, 2009, hence gross carrying cost of and accumulated depreciation of the asset as on the date of balance sheet is nil.
In case of assets taken on lease
The Company has taken various offi ce premises, furniture and fi xtures, computers and plant and machinery under operating lease. The lease payments recognized in the profi t & loss account are Rs. 4,870.72 lacs (March 31, 2010: Rs. 3,557.92 lacs). Certain agreements provide for cancellation by either party or certain agreements contains clause for escalation and renewal of agreements. The non-cancellable operating lease agreements are ranging for a period 12 to 120 months. There are no restrictions imposed by lease arrangements. There are no sub leases.
The future minimum lease payments in respect of non-cancellable operating lease as at the balance sheet date are summarized below :
(Rs. in lacs)
ParticularsAs at March
31, 2011As at March
31, 2010
Minimum Lease Payments:Not later than one year 823.18 899.73Later than one year but not later than fi ve years 588.34 324.11Later than fi ve years 28.20 40.73
7. In accordance with the Reserve Bank of India circular no.RBI/2006-07/ 225 DNBS (PD) C.C No. 87/03.02.004/2006-07 dated January 4, 2007, the Company has created a fl oating charge on the statutory liquid assets comprising of investment in Government Securities to the extent of Rs. 16,677.50 lacs (March 31, 2010: Rs. 3,497. 64 lacs) in favour of trustees representing the public deposit holders of the Company.
8. Earnings per share
ParticularsYear ended
March 31, 2011Year ended
March 31, 2010
Net Profi t after tax as per profi t and loss account (Rs. in lacs) (A) 122,988.00 87,311.74Weighted average number of equity shares for calculating Basic EPS (in lacs) (B) 2,257.27 2,125.01Weighted average number of equity shares for calculating Diluted EPS (in lacs) (C) 2,260.39 2,133.85Basic earnings per equity share (in Rupees) (Face value of Rs. 10/- per share) (A) / (B) 54.49 41.09Diluted earnings per equity share (in Rupees) (Face value of Rs. 10/- per share) (A) / (C) 54.41 40.92
ParticularsYear ended
March 31, 2011Year ended
March 31, 2010
Weighted average number of equity shares for calculating Basic EPS (in lacs) 2,257.27 2,125.01Add : Equity shares arising on conversion of optionally convertible warrants (in lacs) 0.00 0.00Add : Equity shares for no consideration arising on grant of stock options under ESOP (in lacs)
3.12 8.84
Weighted average number of equity shares in calculating diluted EPS (in lacs) 2,260.39 2,133.85
Schedules forming part of the Balance Sheet and Profi t and Loss account (Contd.)
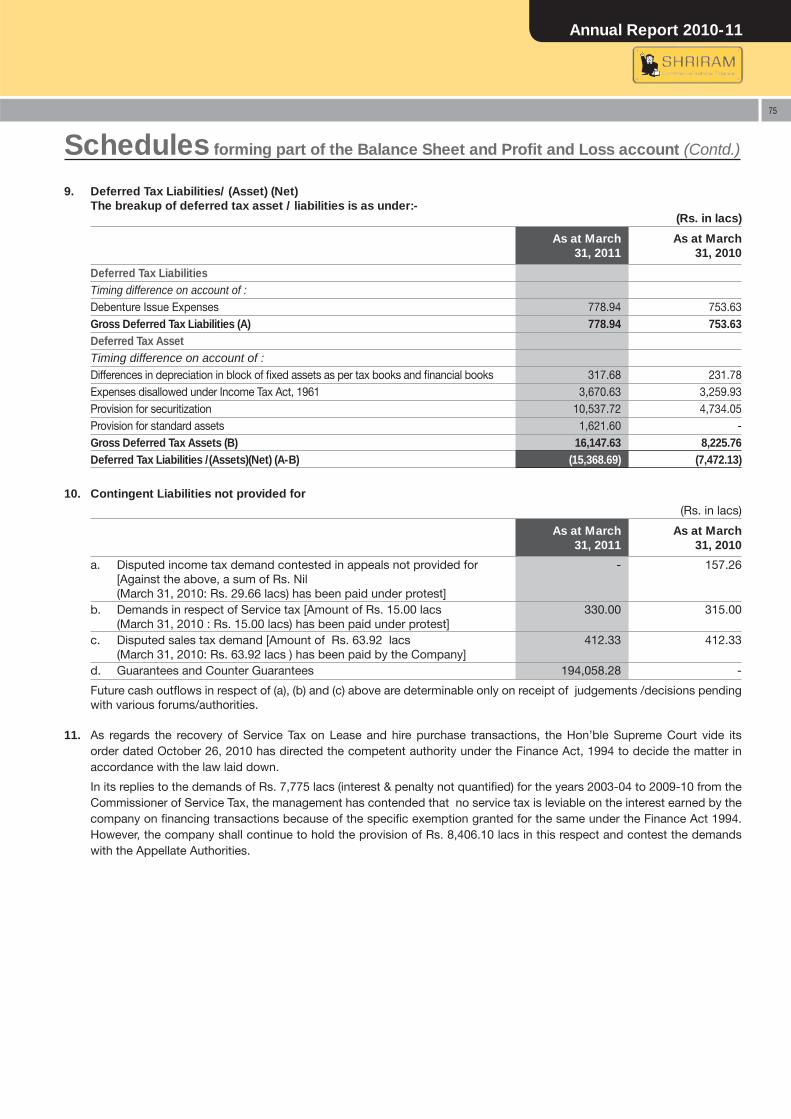
Annual Report 2010-11
75
Schedules forming part of the Balance Sheet and Profi t and Loss account (Contd.)
9. Deferred Tax Liabilities/ (Asset) (Net)The breakup of deferred tax asset / liabilities is as under:-
(Rs. in lacs)
As at March31, 2011
As at March31, 2010
Deferred Tax LiabilitiesTiming difference on account of :Debenture Issue Expenses 778.94 753.63Gross Deferred Tax Liabilities (A) 778.94 753.63Deferred Tax AssetTiming difference on account of :Differences in depreciation in block of fi xed assets as per tax books and fi nancial books 317.68 231.78Expenses disallowed under Income Tax Act, 1961 3,670.63 3,259.93Provision for securitization 10,537.72 4,734.05Provision for standard assets 1,621.60 -Gross Deferred Tax Assets (B) 16,147.63 8,225.76Deferred Tax Liabilities /(Assets)(Net) (A-B) (15,368.69) (7,472.13)
10. Contingent Liabilities not provided for(Rs. in lacs)
As at March31, 2011
As at March31, 2010
a. Disputed income tax demand contested in appeals not provided for [Against the above, a sum of Rs. Nil (March 31, 2010: Rs. 29.66 lacs) has been paid under protest]
- 157.26
b. Demands in respect of Service tax [Amount of Rs. 15.00 lacs (March 31, 2010 : Rs. 15.00 lacs) has been paid under protest]
330.00 315.00
c. Disputed sales tax demand [Amount of Rs. 63.92 lacs (March 31, 2010: Rs. 63.92 lacs ) has been paid by the Company]
412.33 412.33
d. Guarantees and Counter Guarantees 194,058.28 -
Future cash outfl ows in respect of (a), (b) and (c) above are determinable only on receipt of judgements /decisions pending with various forums/authorities.
11. As regards the recovery of Service Tax on Lease and hire purchase transactions, the Hon’ble Supreme Court vide its order dated October 26, 2010 has directed the competent authority under the Finance Act, 1994 to decide the matter in accordance with the law laid down.
In its replies to the demands of Rs. 7,775 lacs (interest & penalty not quantifi ed) for the years 2003-04 to 2009-10 from the Commissioner of Service Tax, the management has contended that no service tax is leviable on the interest earned by the company on fi nancing transactions because of the specifi c exemption granted for the same under the Finance Act 1994. However, the company shall continue to hold the provision of Rs. 8,406.10 lacs in this respect and contest the demands with the Appellate Authorities.
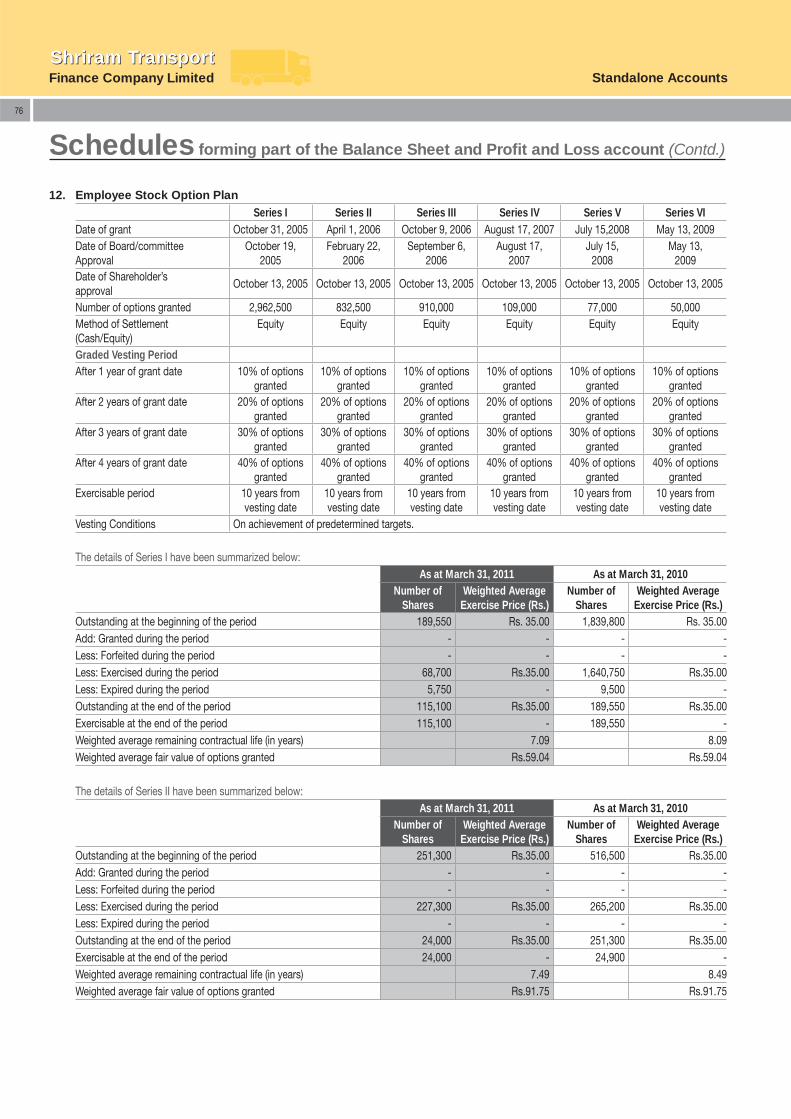
Finance Company LimitedShriram TransportShriram Transport
Standalone Accounts
76
Schedules forming part of the Balance Sheet and Profi t and Loss account (Contd.)
The details of Series I have been summarized below: As at March 31, 2011 As at March 31, 2010
Number of Shares
Weighted Average Exercise Price (Rs.)
Number of Shares
Weighted Average Exercise Price (Rs.)
Outstanding at the beginning of the period 189,550 Rs. 35.00 1,839,800 Rs. 35.00Add: Granted during the period - - - -Less: Forfeited during the period - - - -Less: Exercised during the period 68,700 Rs.35.00 1,640,750 Rs.35.00Less: Expired during the period 5,750 - 9,500 -Outstanding at the end of the period 115,100 Rs.35.00 189,550 Rs.35.00Exercisable at the end of the period 115,100 - 189,550 -Weighted average remaining contractual life (in years) 7.09 8.09Weighted average fair value of options granted Rs.59.04 Rs.59.04
The details of Series II have been summarized below: As at March 31, 2011 As at March 31, 2010
Number of Shares
Weighted Average Exercise Price (Rs.)
Number of Shares
Weighted Average Exercise Price (Rs.)
Outstanding at the beginning of the period 251,300 Rs.35.00 516,500 Rs.35.00Add: Granted during the period - - - -Less: Forfeited during the period - - - -Less: Exercised during the period 227,300 Rs.35.00 265,200 Rs.35.00Less: Expired during the period - - - -Outstanding at the end of the period 24,000 Rs.35.00 251,300 Rs.35.00Exercisable at the end of the period 24,000 - 24,900 -Weighted average remaining contractual life (in years) 7.49 8.49Weighted average fair value of options granted Rs.91.75 Rs.91.75
12. Employee Stock Option Plan Series I Series II Series III Series IV Series V Series VI
Date of grant October 31, 2005 April 1, 2006 October 9, 2006 August 17, 2007 July 15,2008 May 13, 2009Date of Board/committee Approval
October 19, 2005
February 22, 2006
September 6, 2006
August 17, 2007
July 15,2008
May 13, 2009
Date of Shareholder’s approval
October 13, 2005 October 13, 2005 October 13, 2005 October 13, 2005 October 13, 2005 October 13, 2005
Number of options granted 2,962,500 832,500 910,000 109,000 77,000 50,000Method of Settlement (Cash/Equity)
Equity Equity Equity Equity Equity Equity
Graded Vesting PeriodAfter 1 year of grant date 10% of options
granted10% of options
granted10% of options
granted10% of options
granted10% of options
granted10% of options
grantedAfter 2 years of grant date 20% of options
granted20% of options
granted20% of options
granted20% of options
granted20% of options
granted20% of options
grantedAfter 3 years of grant date 30% of options
granted30% of options
granted30% of options
granted30% of options
granted30% of options
granted30% of options
grantedAfter 4 years of grant date 40% of options
granted40% of options
granted40% of options
granted40% of options
granted40% of options
granted40% of options
grantedExercisable period 10 years from
vesting date10 years from vesting date
10 years from vesting date
10 years from vesting date
10 years from vesting date
10 years from vesting date
Vesting Conditions On achievement of predetermined targets.
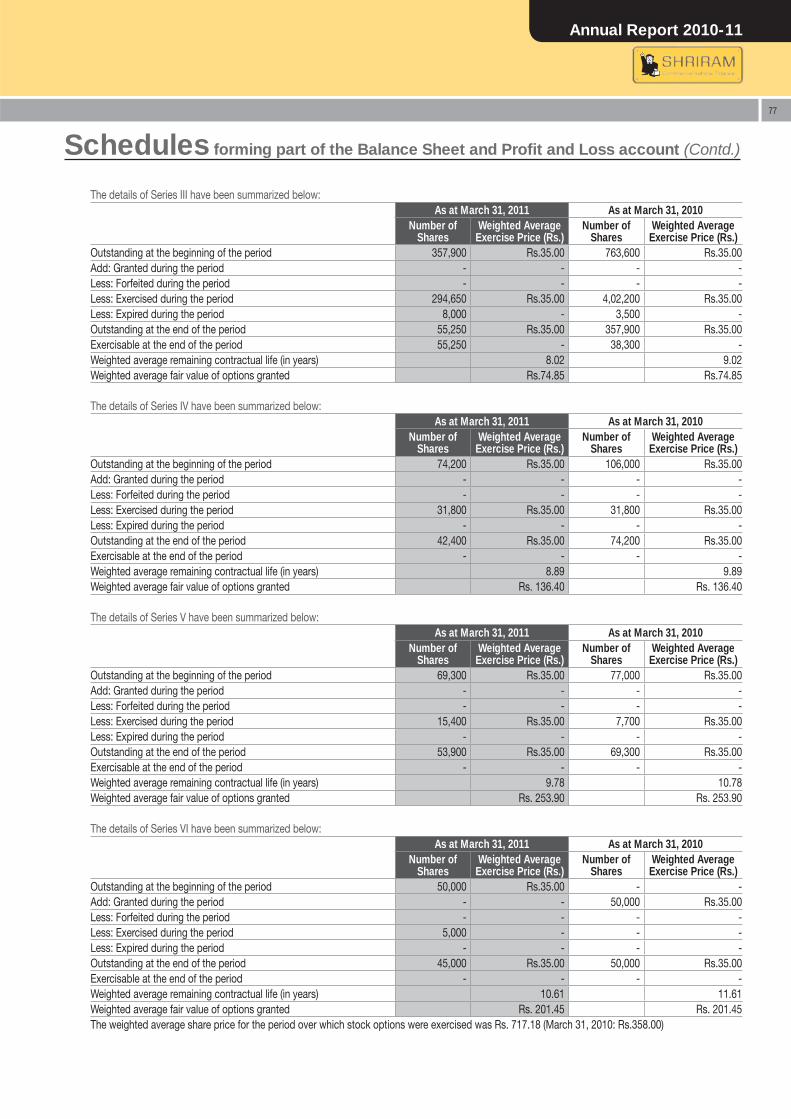
Annual Report 2010-11
77
Schedules forming part of the Balance Sheet and Profi t and Loss account (Contd.)
The details of Series III have been summarized below: As at March 31, 2011 As at March 31, 2010
Number of Shares
Weighted Average Exercise Price (Rs.)
Number of Shares
Weighted Average Exercise Price (Rs.)
Outstanding at the beginning of the period 357,900 Rs.35.00 763,600 Rs.35.00Add: Granted during the period - - - -Less: Forfeited during the period - - - -Less: Exercised during the period 294,650 Rs.35.00 4,02,200 Rs.35.00Less: Expired during the period 8,000 - 3,500 -Outstanding at the end of the period 55,250 Rs.35.00 357,900 Rs.35.00Exercisable at the end of the period 55,250 - 38,300 -Weighted average remaining contractual life (in years) 8.02 9.02Weighted average fair value of options granted Rs.74.85 Rs.74.85
The details of Series IV have been summarized below:As at March 31, 2011 As at March 31, 2010
Number of Shares
Weighted Average Exercise Price (Rs.)
Number of Shares
Weighted Average Exercise Price (Rs.)
Outstanding at the beginning of the period 74,200 Rs.35.00 106,000 Rs.35.00Add: Granted during the period - - - -Less: Forfeited during the period - - - -Less: Exercised during the period 31,800 Rs.35.00 31,800 Rs.35.00Less: Expired during the period - - - -Outstanding at the end of the period 42,400 Rs.35.00 74,200 Rs.35.00Exercisable at the end of the period - - - -Weighted average remaining contractual life (in years) 8.89 9.89Weighted average fair value of options granted Rs. 136.40 Rs. 136.40
The details of Series V have been summarized below: As at March 31, 2011 As at March 31, 2010
Number of Shares
Weighted Average Exercise Price (Rs.)
Number of Shares
Weighted Average Exercise Price (Rs.)
Outstanding at the beginning of the period 69,300 Rs.35.00 77,000 Rs.35.00Add: Granted during the period - - - -Less: Forfeited during the period - - - -Less: Exercised during the period 15,400 Rs.35.00 7,700 Rs.35.00Less: Expired during the period - - - -Outstanding at the end of the period 53,900 Rs.35.00 69,300 Rs.35.00Exercisable at the end of the period - - - -Weighted average remaining contractual life (in years) 9.78 10.78Weighted average fair value of options granted Rs. 253.90 Rs. 253.90
The details of Series VI have been summarized below: As at March 31, 2011 As at March 31, 2010
Number of Shares
Weighted Average Exercise Price (Rs.)
Number of Shares
Weighted Average Exercise Price (Rs.)
Outstanding at the beginning of the period 50,000 Rs.35.00 - -Add: Granted during the period - - 50,000 Rs.35.00Less: Forfeited during the period - - - -Less: Exercised during the period 5,000 - - -Less: Expired during the period - - - -Outstanding at the end of the period 45,000 Rs.35.00 50,000 Rs.35.00Exercisable at the end of the period - - - -Weighted average remaining contractual life (in years) 10.61 11.61Weighted average fair value of options granted Rs. 201.45 Rs. 201.45The weighted average share price for the period over which stock options were exercised was Rs. 717.18 (March 31, 2010: Rs.358.00)
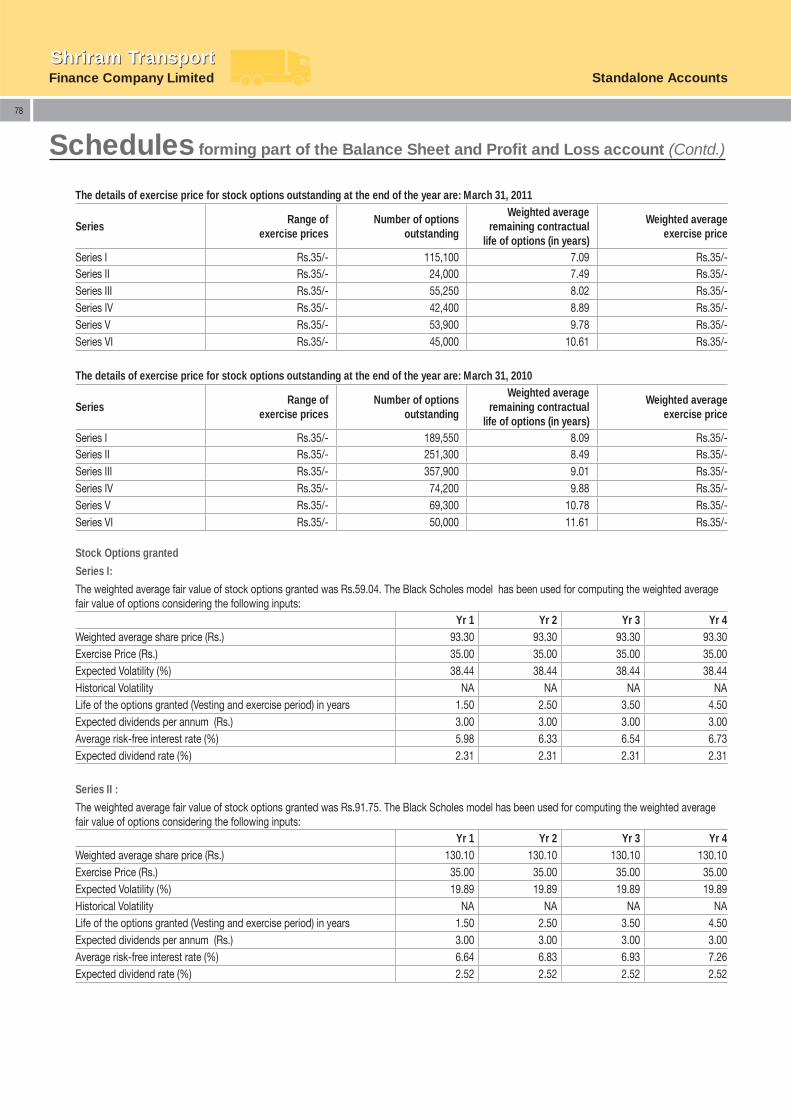
Finance Company LimitedShriram TransportShriram Transport
Standalone Accounts
78
Schedules forming part of the Balance Sheet and Profi t and Loss account (Contd.)
The details of exercise price for stock options outstanding at the end of the year are: March 31, 2011
SeriesRange of
exercise pricesNumber of options
outstanding
Weighted average remaining contractual
life of options (in years)
Weighted average exercise price
Series I Rs.35/- 115,100 7.09 Rs.35/-Series II Rs.35/- 24,000 7.49 Rs.35/-Series III Rs.35/- 55,250 8.02 Rs.35/-Series IV Rs.35/- 42,400 8.89 Rs.35/-Series V Rs.35/- 53,900 9.78 Rs.35/-Series VI Rs.35/- 45,000 10.61 Rs.35/-
The details of exercise price for stock options outstanding at the end of the year are: March 31, 2010
SeriesRange of
exercise pricesNumber of options
outstanding
Weighted average remaining contractual
life of options (in years)
Weighted average exercise price
Series I Rs.35/- 189,550 8.09 Rs.35/-Series II Rs.35/- 251,300 8.49 Rs.35/-Series III Rs.35/- 357,900 9.01 Rs.35/-Series IV Rs.35/- 74,200 9.88 Rs.35/-Series V Rs.35/- 69,300 10.78 Rs.35/-Series VI Rs.35/- 50,000 11.61 Rs.35/-
Stock Options granted
Series I:
The weighted average fair value of stock options granted was Rs.59.04. The Black Scholes model has been used for computing the weighted average fair value of options considering the following inputs:
Yr 1 Yr 2 Yr 3 Yr 4Weighted average share price (Rs.) 93.30 93.30 93.30 93.30Exercise Price (Rs.) 35.00 35.00 35.00 35.00Expected Volatility (%) 38.44 38.44 38.44 38.44Historical Volatility NA NA NA NALife of the options granted (Vesting and exercise period) in years 1.50 2.50 3.50 4.50Expected dividends per annum (Rs.) 3.00 3.00 3.00 3.00Average risk-free interest rate (%) 5.98 6.33 6.54 6.73Expected dividend rate (%) 2.31 2.31 2.31 2.31
Series II :
The weighted average fair value of stock options granted was Rs.91.75. The Black Scholes model has been used for computing the weighted average fair value of options considering the following inputs:
Yr 1 Yr 2 Yr 3 Yr 4Weighted average share price (Rs.) 130.10 130.10 130.10 130.10Exercise Price (Rs.) 35.00 35.00 35.00 35.00Expected Volatility (%) 19.89 19.89 19.89 19.89Historical Volatility NA NA NA NALife of the options granted (Vesting and exercise period) in years 1.50 2.50 3.50 4.50Expected dividends per annum (Rs.) 3.00 3.00 3.00 3.00Average risk-free interest rate (%) 6.64 6.83 6.93 7.26Expected dividend rate (%) 2.52 2.52 2.52 2.52
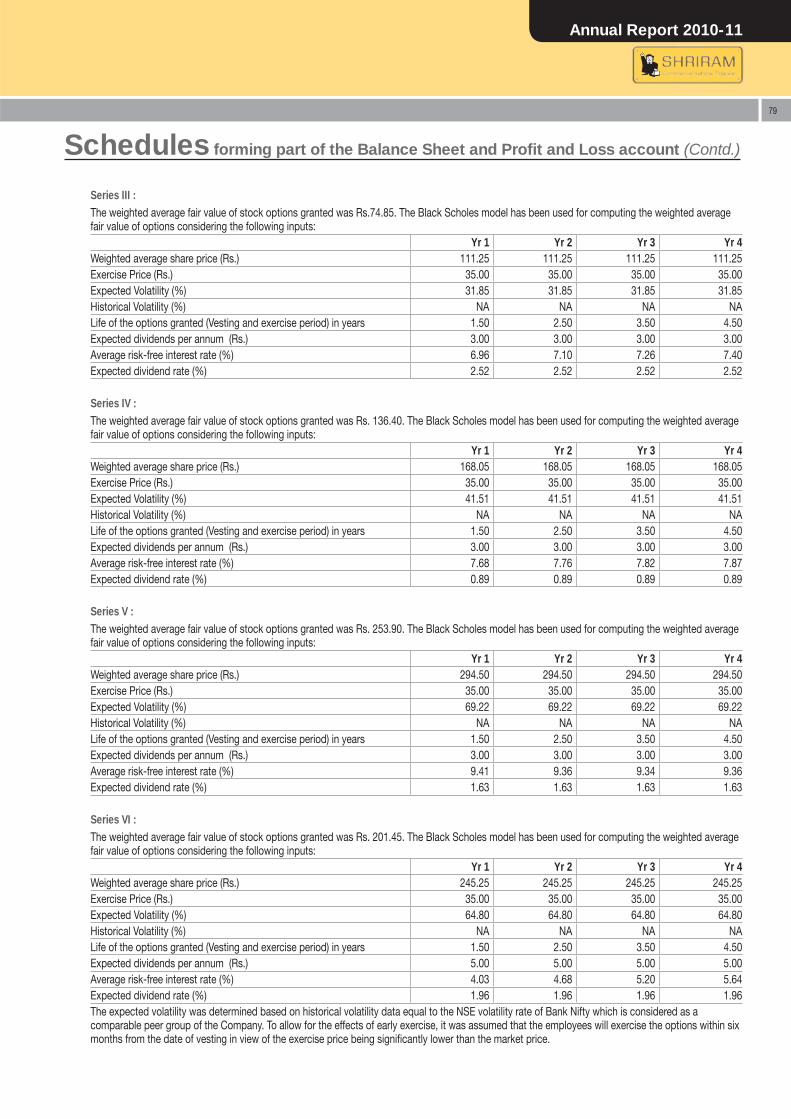
Annual Report 2010-11
79
Schedules forming part of the Balance Sheet and Profi t and Loss account (Contd.)
Series III : The weighted average fair value of stock options granted was Rs.74.85. The Black Scholes model has been used for computing the weighted average fair value of options considering the following inputs:
Yr 1 Yr 2 Yr 3 Yr 4Weighted average share price (Rs.) 111.25 111.25 111.25 111.25Exercise Price (Rs.) 35.00 35.00 35.00 35.00Expected Volatility (%) 31.85 31.85 31.85 31.85Historical Volatility (%) NA NA NA NALife of the options granted (Vesting and exercise period) in years 1.50 2.50 3.50 4.50Expected dividends per annum (Rs.) 3.00 3.00 3.00 3.00Average risk-free interest rate (%) 6.96 7.10 7.26 7.40Expected dividend rate (%) 2.52 2.52 2.52 2.52
Series IV : The weighted average fair value of stock options granted was Rs. 136.40. The Black Scholes model has been used for computing the weighted average fair value of options considering the following inputs:
Yr 1 Yr 2 Yr 3 Yr 4Weighted average share price (Rs.) 168.05 168.05 168.05 168.05Exercise Price (Rs.) 35.00 35.00 35.00 35.00Expected Volatility (%) 41.51 41.51 41.51 41.51Historical Volatility (%) NA NA NA NALife of the options granted (Vesting and exercise period) in years 1.50 2.50 3.50 4.50Expected dividends per annum (Rs.) 3.00 3.00 3.00 3.00Average risk-free interest rate (%) 7.68 7.76 7.82 7.87Expected dividend rate (%) 0.89 0.89 0.89 0.89
Series V : The weighted average fair value of stock options granted was Rs. 253.90. The Black Scholes model has been used for computing the weighted average fair value of options considering the following inputs:
Yr 1 Yr 2 Yr 3 Yr 4Weighted average share price (Rs.) 294.50 294.50 294.50 294.50Exercise Price (Rs.) 35.00 35.00 35.00 35.00Expected Volatility (%) 69.22 69.22 69.22 69.22Historical Volatility (%) NA NA NA NALife of the options granted (Vesting and exercise period) in years 1.50 2.50 3.50 4.50Expected dividends per annum (Rs.) 3.00 3.00 3.00 3.00Average risk-free interest rate (%) 9.41 9.36 9.34 9.36Expected dividend rate (%) 1.63 1.63 1.63 1.63
Series VI : The weighted average fair value of stock options granted was Rs. 201.45. The Black Scholes model has been used for computing the weighted average fair value of options considering the following inputs:
Yr 1 Yr 2 Yr 3 Yr 4Weighted average share price (Rs.) 245.25 245.25 245.25 245.25Exercise Price (Rs.) 35.00 35.00 35.00 35.00Expected Volatility (%) 64.80 64.80 64.80 64.80Historical Volatility (%) NA NA NA NALife of the options granted (Vesting and exercise period) in years 1.50 2.50 3.50 4.50Expected dividends per annum (Rs.) 5.00 5.00 5.00 5.00Average risk-free interest rate (%) 4.03 4.68 5.20 5.64Expected dividend rate (%) 1.96 1.96 1.96 1.96The expected volatility was determined based on historical volatility data equal to the NSE volatility rate of Bank Nifty which is considered as a comparable peer group of the Company. To allow for the effects of early exercise, it was assumed that the employees will exercise the options within six months from the date of vesting in view of the exercise price being signifi cantly lower than the market price.
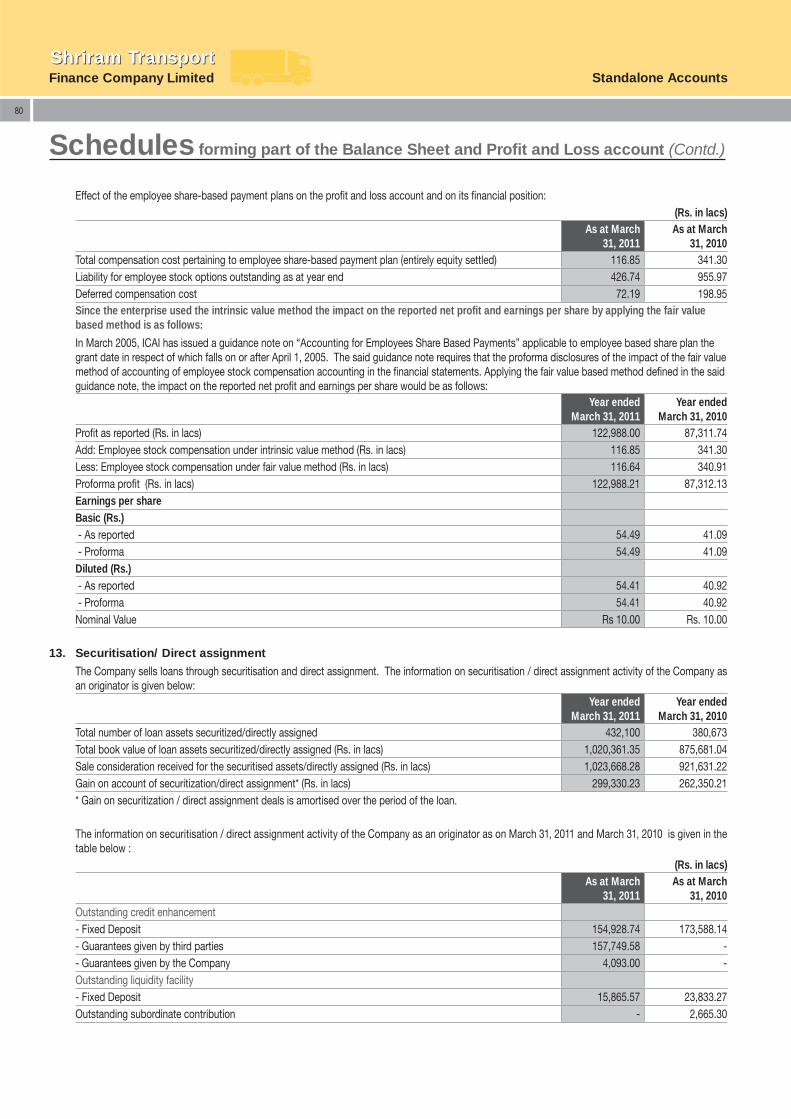
Finance Company LimitedShriram TransportShriram Transport
Standalone Accounts
80
Schedules forming part of the Balance Sheet and Profi t and Loss account (Contd.)
Effect of the employee share-based payment plans on the profi t and loss account and on its fi nancial position:(Rs. in lacs)
As at March31, 2011
As at March 31, 2010
Total compensation cost pertaining to employee share-based payment plan (entirely equity settled) 116.85 341.30Liability for employee stock options outstanding as at year end 426.74 955.97Deferred compensation cost 72.19 198.95Since the enterprise used the intrinsic value method the impact on the reported net profi t and earnings per share by applying the fair value based method is as follows:
In March 2005, ICAI has issued a guidance note on “Accounting for Employees Share Based Payments” applicable to employee based share plan the grant date in respect of which falls on or after April 1, 2005. The said guidance note requires that the proforma disclosures of the impact of the fair value method of accounting of employee stock compensation accounting in the fi nancial statements. Applying the fair value based method defi ned in the said guidance note, the impact on the reported net profi t and earnings per share would be as follows:
Year ended March 31, 2011
Year ended March 31, 2010
Profi t as reported (Rs. in lacs) 122,988.00 87,311.74Add: Employee stock compensation under intrinsic value method (Rs. in lacs) 116.85 341.30Less: Employee stock compensation under fair value method (Rs. in lacs) 116.64 340.91Proforma profi t (Rs. in lacs) 122,988.21 87,312.13Earnings per shareBasic (Rs.) - As reported 54.49 41.09 - Proforma 54.49 41.09Diluted (Rs.) - As reported 54.41 40.92 - Proforma 54.41 40.92Nominal Value Rs 10.00 Rs. 10.00
13. Securitisation/ Direct assignment
The Company sells loans through securitisation and direct assignment. The information on securitisation / direct assignment activity of the Company as an originator is given below:
Year ended March 31, 2011
Year ended March 31, 2010
Total number of loan assets securitized/directly assigned 432,100 380,673Total book value of loan assets securitized/directly assigned (Rs. in lacs) 1,020,361.35 875,681.04Sale consideration received for the securitised assets/directly assigned (Rs. in lacs) 1,023,668.28 921,631.22Gain on account of securitization/direct assignment* (Rs. in lacs) 299,330.23 262,350.21* Gain on securitization / direct assignment deals is amortised over the period of the loan.
The information on securitisation / direct assignment activity of the Company as an originator as on March 31, 2011 and March 31, 2010 is given in the table below :
(Rs. in lacs)As at March
31, 2011As at March
31, 2010Outstanding credit enhancement- Fixed Deposit 154,928.74 173,588.14- Guarantees given by third parties 157,749.58 -- Guarantees given by the Company 4,093.00 -Outstanding liquidity facility- Fixed Deposit 15,865.57 23,833.27Outstanding subordinate contribution - 2,665.30
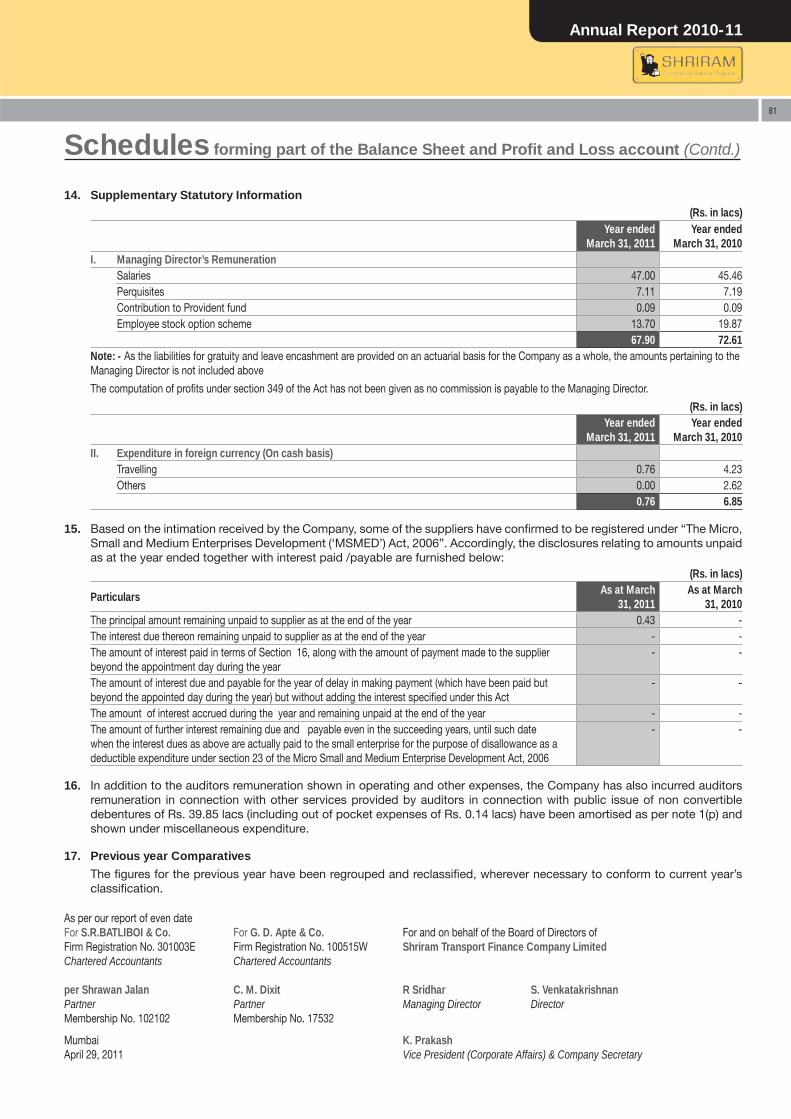
Annual Report 2010-11
81
Schedules forming part of the Balance Sheet and Profi t and Loss account (Contd.)
14. Supplementary Statutory Information(Rs. in lacs)
Year ended March 31, 2011
Year ended March 31, 2010
I. Managing Director’s RemunerationSalaries 47.00 45.46Perquisites 7.11 7.19Contribution to Provident fund 0.09 0.09Employee stock option scheme 13.70 19.87
67.90 72.61Note: - As the liabilities for gratuity and leave encashment are provided on an actuarial basis for the Company as a whole, the amounts pertaining to the Managing Director is not included above
The computation of profi ts under section 349 of the Act has not been given as no commission is payable to the Managing Director.
(Rs. in lacs)Year ended
March 31, 2011Year ended
March 31, 2010II. Expenditure in foreign currency (On cash basis)
Travelling 0.76 4.23Others 0.00 2.62
0.76 6.85
15. Based on the intimation received by the Company, some of the suppliers have confi rmed to be registered under “The Micro, Small and Medium Enterprises Development (‘MSMED’) Act, 2006”. Accordingly, the disclosures relating to amounts unpaid as at the year ended together with interest paid /payable are furnished below:
(Rs. in lacs)
ParticularsAs at March
31, 2011As at March
31, 2010The principal amount remaining unpaid to supplier as at the end of the year 0.43 -The interest due thereon remaining unpaid to supplier as at the end of the year - -The amount of interest paid in terms of Section 16, along with the amount of payment made to the supplier beyond the appointment day during the year
- -
The amount of interest due and payable for the year of delay in making payment (which have been paid but beyond the appointed day during the year) but without adding the interest specifi ed under this Act
- -
The amount of interest accrued during the year and remaining unpaid at the end of the year - -The amount of further interest remaining due and payable even in the succeeding years, until such date when the interest dues as above are actually paid to the small enterprise for the purpose of disallowance as a deductible expenditure under section 23 of the Micro Small and Medium Enterprise Development Act, 2006
- -
16. In addition to the auditors remuneration shown in operating and other expenses, the Company has also incurred auditors remuneration in connection with other services provided by auditors in connection with public issue of non convertible debentures of Rs. 39.85 lacs (including out of pocket expenses of Rs. 0.14 lacs) have been amortised as per note 1(p) and shown under miscellaneous expenditure.
17. Previous year Comparatives
The fi gures for the previous year have been regrouped and reclassifi ed, wherever necessary to conform to current year’s classifi cation.
As per our report of even dateFor S.R.BATLIBOI & Co. For G. D. Apte & Co. For and on behalf of the Board of Directors ofFirm Registration No. 301003E Firm Registration No. 100515W Shriram Transport Finance Company LimitedChartered Accountants Chartered Accountants
per Shrawan Jalan C. M. Dixit R Sridhar S. VenkatakrishnanPartner Partner Managing Director DirectorMembership No. 102102 Membership No. 17532
Mumbai K. PrakashApril 29, 2011 Vice President (Corporate Affairs) & Company Secretary
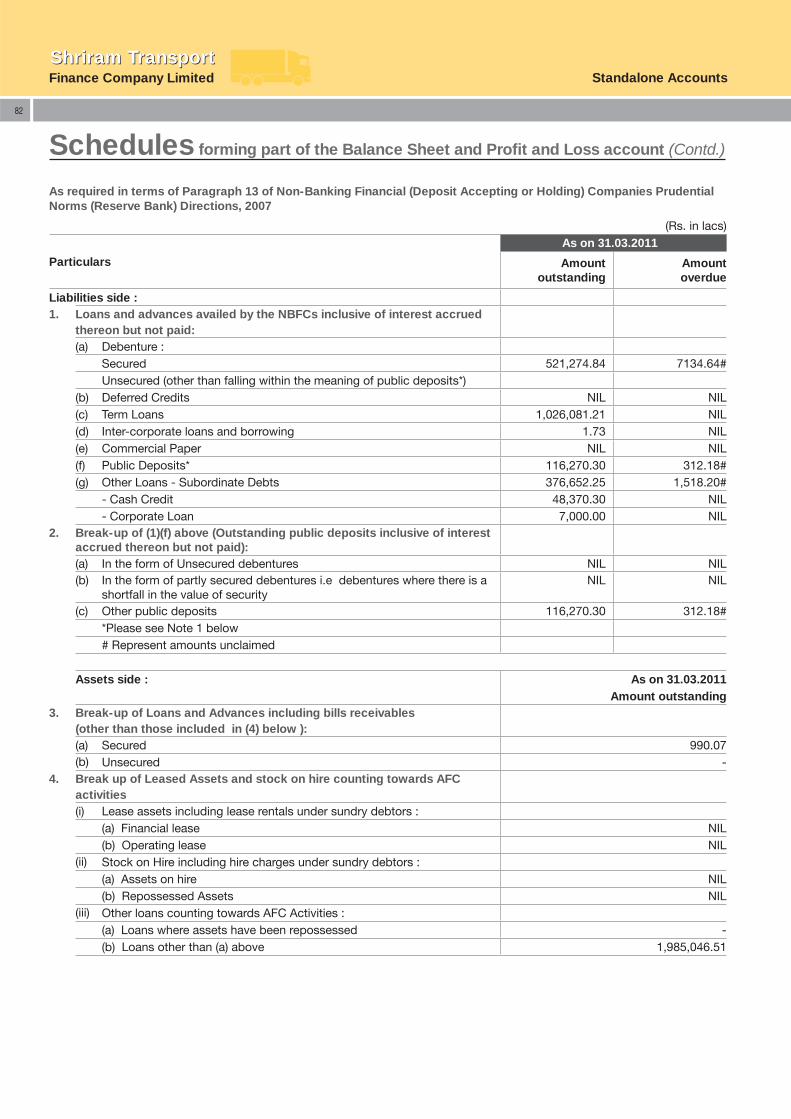
Finance Company LimitedShriram TransportShriram Transport
Standalone Accounts
82
Assets side : As on 31.03.2011Amount outstanding
3. Break-up of Loans and Advances including bills receivables (other than those included in (4) below ): (a) Secured 990.07(b) Unsecured -
4. Break up of Leased Assets and stock on hire counting towards AFC activities (i) Lease assets including lease rentals under sundry debtors :
(a) Financial lease NIL(b) Operating lease NIL
(ii) Stock on Hire including hire charges under sundry debtors : (a) Assets on hire NIL(b) Repossessed Assets NIL
(iii) Other loans counting towards AFC Activities : (a) Loans where assets have been repossessed -(b) Loans other than (a) above 1,985,046.51
As required in terms of Paragraph 13 of Non-Banking Financial (Deposit Accepting or Holding) Companies Prudential Norms (Reserve Bank) Directions, 2007
(Rs. in lacs)
Particulars
As on 31.03.2011
Amount outstanding
Amount overdue
Liabilities side : 1. Loans and advances availed by the NBFCs inclusive of interest accrued
thereon but not paid: (a) Debenture :
Secured 521,274.84 7134.64#Unsecured (other than falling within the meaning of public deposits*)
(b) Deferred Credits NIL NIL(c) Term Loans 1,026,081.21 NIL(d) Inter-corporate loans and borrowing 1.73 NIL(e) Commercial Paper NIL NIL(f) Public Deposits* 116,270.30 312.18#(g) Other Loans - Subordinate Debts 376,652.25 1,518.20#
- Cash Credit 48,370.30 NIL- Corporate Loan 7,000.00 NIL
2. Break-up of (1)(f) above (Outstanding public deposits inclusive of interest accrued thereon but not paid): (a) In the form of Unsecured debentures NIL NIL(b) In the form of partly secured debentures i.e debentures where there is a
shortfall in the value of securityNIL NIL
(c) Other public deposits 116,270.30 312.18#*Please see Note 1 below# Represent amounts unclaimed
Schedules forming part of the Balance Sheet and Profi t and Loss account (Contd.)
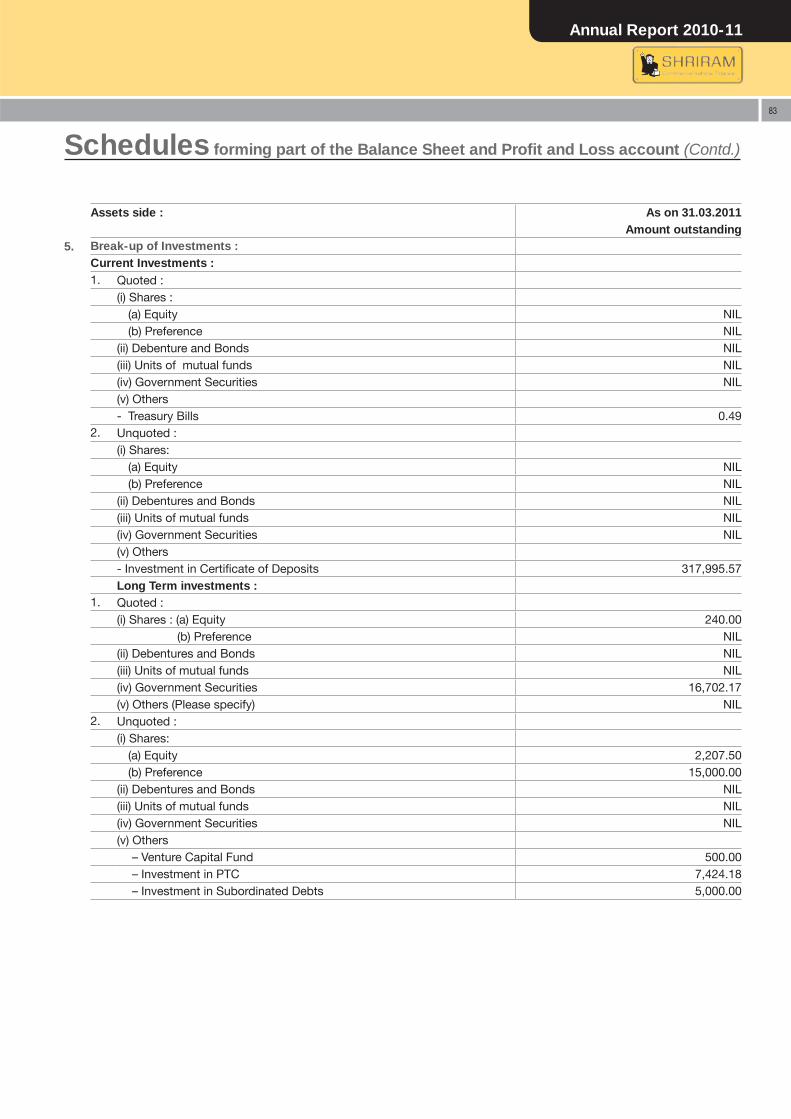
Annual Report 2010-11
83
Schedules forming part of the Balance Sheet and Profi t and Loss account (Contd.)
Assets side : As on 31.03.2011Amount outstanding
5. Break-up of Investments :Current Investments : 1. Quoted :
(i) Shares : (a) Equity NIL(b) Preference NIL
(ii) Debenture and Bonds NIL(iii) Units of mutual funds NIL(iv) Government Securities NIL(v) Others- Treasury Bills 0.49
2. Unquoted : (i) Shares:
(a) Equity NIL(b) Preference NIL
(ii) Debentures and Bonds NIL(iii) Units of mutual funds NIL(iv) Government Securities NIL(v) Others - Investment in Certifi cate of Deposits 317,995.57Long Term investments :
1. Quoted : (i) Shares : (a) Equity 240.00
(b) Preference NIL(ii) Debentures and Bonds NIL(iii) Units of mutual funds NIL(iv) Government Securities 16,702.17(v) Others (Please specify) NIL
2. Unquoted :(i) Shares:
(a) Equity 2,207.50(b) Preference 15,000.00
(ii) Debentures and Bonds NIL(iii) Units of mutual funds NIL(iv) Government Securities NIL(v) Others
– Venture Capital Fund 500.00– Investment in PTC 7,424.18– Investment in Subordinated Debts 5,000.00
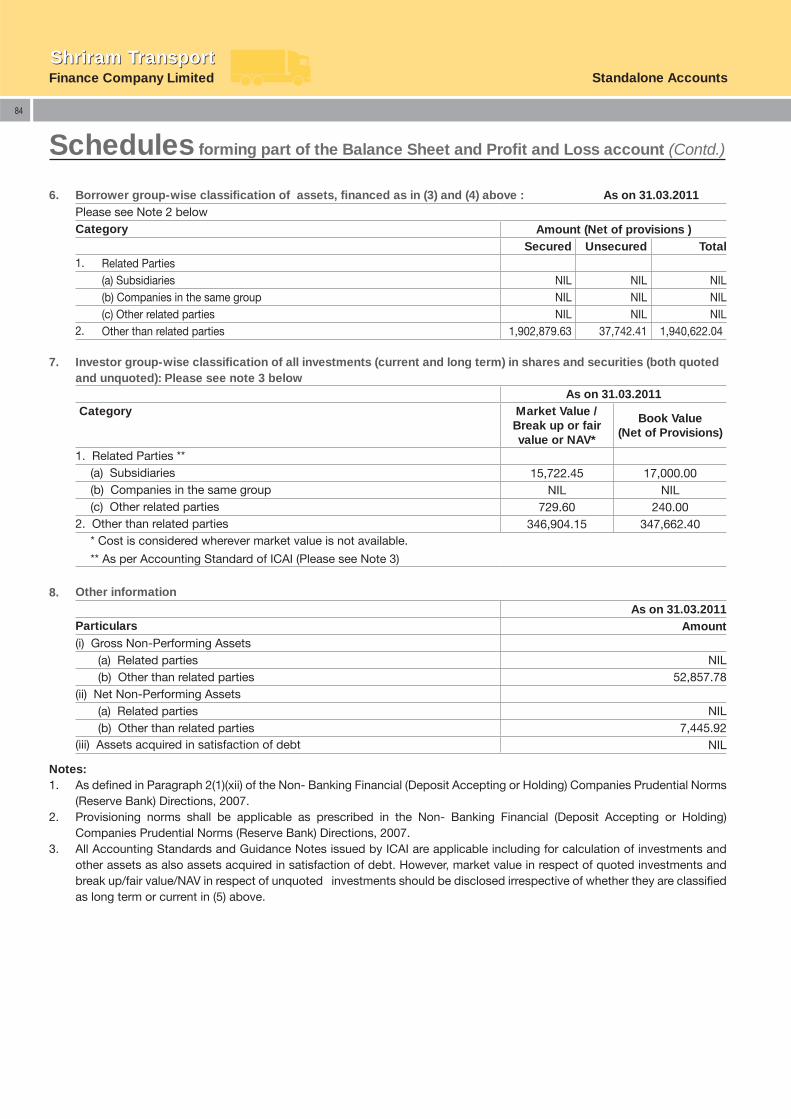
Finance Company LimitedShriram TransportShriram Transport
Standalone Accounts
84
6. Borrower group-wise classifi cation of assets, fi nanced as in (3) and (4) above : As on 31.03.2011Please see Note 2 belowCategory Amount (Net of provisions )
Secured Unsecured Total1. Related Parties
(a) Subsidiaries NIL NIL NIL(b) Companies in the same group NIL NIL NIL(c) Other related parties NIL NIL NIL
2. Other than related parties 1,902,879.63 37,742.41 1,940,622.04
7. Investor group-wise classifi cation of all investments (current and long term) in shares and securities (both quoted and unquoted): Please see note 3 below
As on 31.03.2011Category Market Value /
Break up or fair value or NAV*
Book Value (Net of Provisions)
1. Related Parties **(a) Subsidiaries 15,722.45 17,000.00(b) Companies in the same group NIL NIL(c) Other related parties 729.60 240.00
2. Other than related parties 346,904.15 347,662.40* Cost is considered wherever market value is not available.
** As per Accounting Standard of ICAI (Please see Note 3)
8. Other informationAs on 31.03.2011
Particulars Amount(i) Gross Non-Performing Assets
(a) Related parties NIL(b) Other than related parties 52,857.78
(ii) Net Non-Performing Assets (a) Related parties NIL(b) Other than related parties 7,445.92
(iii) Assets acquired in satisfaction of debt NIL
Notes: 1. As defi ned in Paragraph 2(1)(xii) of the Non- Banking Financial (Deposit Accepting or Holding) Companies Prudential Norms
(Reserve Bank) Directions, 2007. 2. Provisioning norms shall be applicable as prescribed in the Non- Banking Financial (Deposit Accepting or Holding)
Companies Prudential Norms (Reserve Bank) Directions, 2007. 3. All Accounting Standards and Guidance Notes issued by ICAI are applicable including for calculation of investments and
other assets as also assets acquired in satisfaction of debt. However, market value in respect of quoted investments and break up/fair value/NAV in respect of unquoted investments should be disclosed irrespective of whether they are classifi ed as long term or current in (5) above.
Schedules forming part of the Balance Sheet and Profi t and Loss account (Contd.)
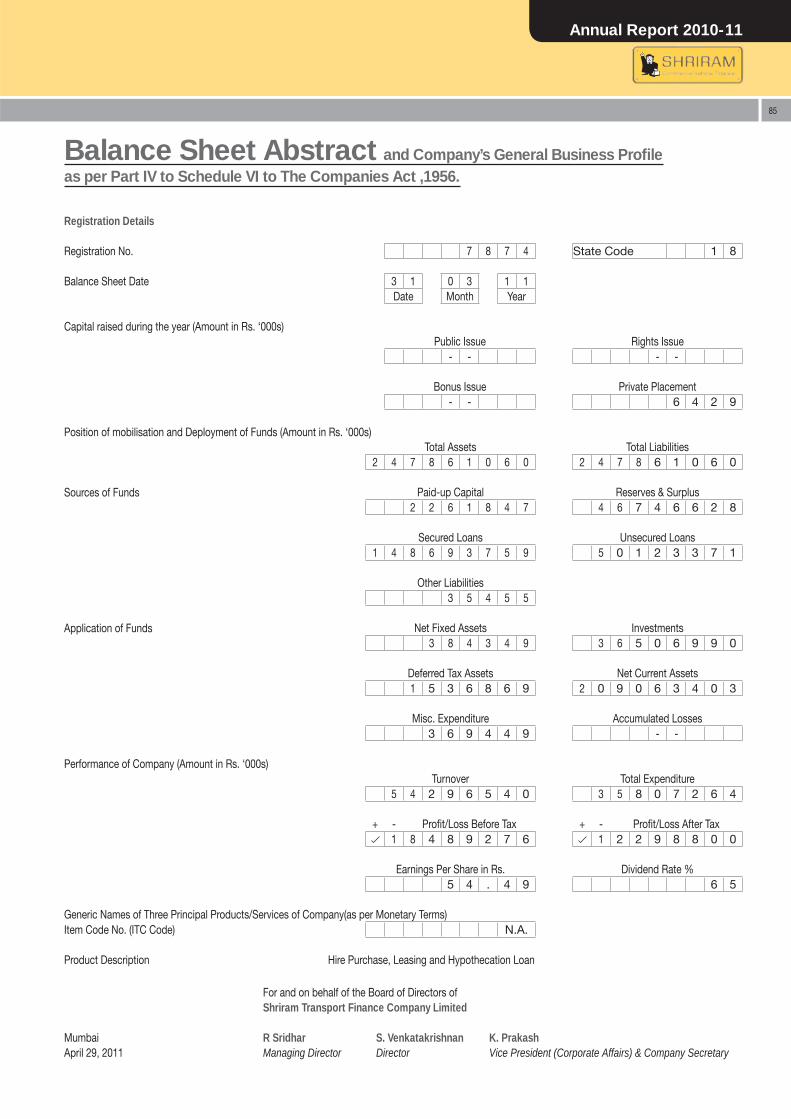
Annual Report 2010-11
85
For and on behalf of the Board of Directors ofShriram Transport Finance Company Limited
Mumbai R Sridhar S. Venkatakrishnan K. PrakashApril 29, 2011 Managing Director Director Vice President (Corporate Affairs) & Company Secretary
Registration Details
Registration No. 7 8 7 4
Balance Sheet Date 3 1 0 3 1 1Date Month Year
Capital raised during the year (Amount in Rs. ‘000s)Public Issue
- -
Bonus Issue- -
Position of mobilisation and Deployment of Funds (Amount in Rs. ‘000s)Total Assets
2 4 7 8 6 1 0 6 0
Sources of Funds Paid-up Capital2 2 6 1 8 4 7
Secured Loans1 4 8 6 9 3 7 5 9
Other Liabilities3 5 4 5 5
Application of Funds Net Fixed Assets3 8 4 3 4 9
Deferred Tax Assets1 5 3 6 8 6 9
Misc. Expenditure3 6 9 4 4 9
Performance of Company (Amount in Rs. ‘000s)Turnover
5 4 2 9 6 5 4 0
+ - Profi t/Loss Before Tax1 8 4 8 9 2 7 6
Earnings Per Share in Rs.5 4 . 4 9
Generic Names of Three Principal Products/Services of Company(as per Monetary Terms) Item Code No. (ITC Code) N.A.
Product Description Hire Purchase, Leasing and Hypothecation Loan
State Code 1 8
Rights Issue- -
Private Placement6 4 2 9
Total Liabilities2 4 7 8 6 1 0 6 0
Reserves & Surplus4 6 7 4 6 6 2 8
Unsecured Loans5 0 1 2 3 3 7 1
Investments3 6 5 0 6 9 9 0
Net Current Assets2 0 9 0 6 3 4 0 3
Accumulated Losses- -
Total Expenditure3 5 8 0 7 2 6 4
+ - Profi t/Loss After Tax1 2 2 9 8 8 0 0
Dividend Rate %6 5
Balance Sheet Abstract and Company’s General Business Profi le as per Part IV to Schedule VI to The Companies Act ,1956.
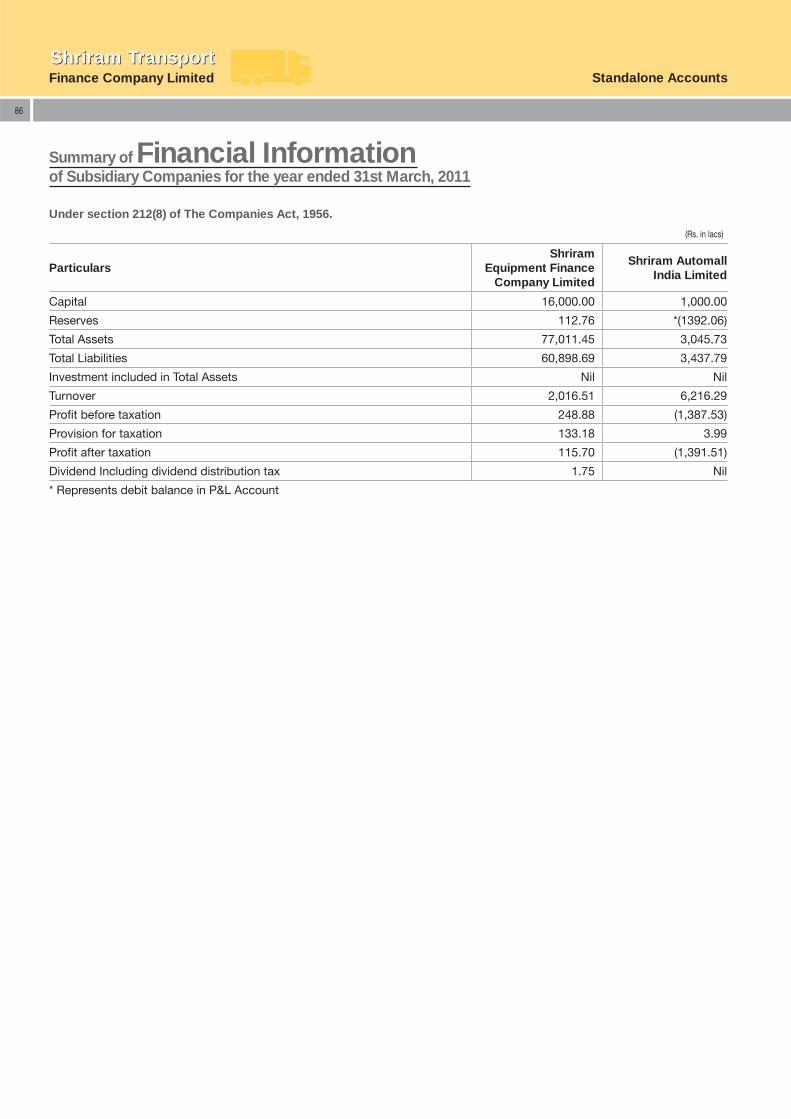
Finance Company LimitedShriram TransportShriram Transport
Standalone Accounts
86
Under section 212(8) of The Companies Act, 1956.
(Rs. in lacs)
ParticularsShriram
Equipment Finance Company Limited
Shriram Automall India Limited
Capital 16,000.00 1,000.00
Reserves 112.76 *(1392.06)
Total Assets 77,011.45 3,045.73
Total Liabilities 60,898.69 3,437.79
Investment included in Total Assets Nil Nil
Turnover 2,016.51 6,216.29
Profi t before taxation 248.88 (1,387.53)
Provision for taxation 133.18 3.99
Profi t after taxation 115.70 (1,391.51)
Dividend Including dividend distribution tax 1.75 Nil
* Represents debit balance in P&L Account
Summary of Financial Information of Subsidiary Companies for the year ended 31st March, 2011
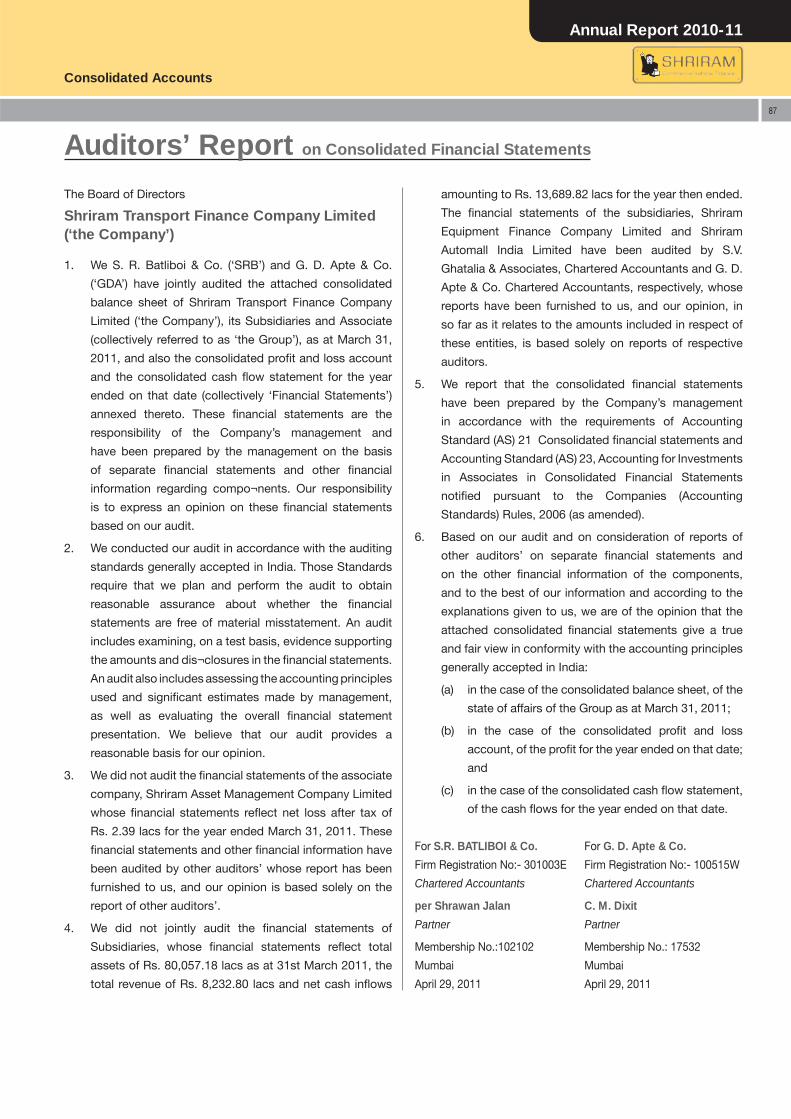
Annual Report 2010-11
Consolidated Accounts
87
Auditors’ Report on Consolidated Financial Statements
The Board of Directors
Shriram Transport Finance Company Limited (‘the Company’)
1. We S. R. Batliboi & Co. (‘SRB’) and G. D. Apte & Co.
(‘GDA’) have jointly audited the attached consolidated
balance sheet of Shriram Transport Finance Company
Limited (‘the Company’), its Subsidiaries and Associate
(collectively referred to as ‘the Group’), as at March 31,
2011, and also the consolidated profi t and loss account
and the consolidated cash fl ow statement for the year
ended on that date (collectively ‘Financial Statements’)
annexed thereto. These fi nancial statements are the
responsibility of the Company’s management and
have been prepared by the management on the basis
of separate fi nancial statements and other fi nancial
information regarding compo¬nents. Our responsibility
is to express an opinion on these fi nancial statements
based on our audit.
2. We conducted our audit in accordance with the auditing
standards generally accepted in India. Those Standards
require that we plan and perform the audit to obtain
reasonable assurance about whether the fi nancial
statements are free of material misstatement. An audit
includes examining, on a test basis, evidence supporting
the amounts and dis¬closures in the fi nancial statements.
An audit also includes assessing the accounting principles
used and signifi cant estimates made by management,
as well as evaluating the overall fi nancial statement
presentation. We believe that our audit provides a
reasonable basis for our opinion.
3. We did not audit the fi nancial statements of the associate
company, Shriram Asset Management Company Limited
whose fi nancial statements refl ect net loss after tax of
Rs. 2.39 lacs for the year ended March 31, 2011. These
fi nancial statements and other fi nancial information have
been audited by other auditors’ whose report has been
furnished to us, and our opinion is based solely on the
report of other auditors’.
4. We did not jointly audit the fi nancial statements of
Subsidiaries, whose fi nancial statements refl ect total
assets of Rs. 80,057.18 lacs as at 31st March 2011, the
total revenue of Rs. 8,232.80 lacs and net cash infl ows
amounting to Rs. 13,689.82 lacs for the year then ended.
The fi nancial statements of the subsidiaries, Shriram
Equipment Finance Company Limited and Shriram
Automall India Limited have been audited by S.V.
Ghatalia & Associates, Chartered Accountants and G. D.
Apte & Co. Chartered Accountants, respectively, whose
reports have been furnished to us, and our opinion, in
so far as it relates to the amounts included in respect of
these entities, is based solely on reports of respective
auditors.
5. We report that the consolidated fi nancial statements
have been prepared by the Company’s management
in accordance with the requirements of Accounting
Standard (AS) 21 Consolidated fi nancial statements and
Accounting Standard (AS) 23, Accounting for Investments
in Associates in Consolidated Financial Statements
notifi ed pursuant to the Companies (Accounting
Standards) Rules, 2006 (as amended).
6. Based on our audit and on consideration of reports of
other auditors’ on separate fi nancial statements and
on the other fi nancial information of the components,
and to the best of our information and according to the
explanations given to us, we are of the opinion that the
attached consolidated fi nancial statements give a true
and fair view in conformity with the accounting principles
generally accepted in India:
(a) in the case of the consolidated balance sheet, of the
state of affairs of the Group as at March 31, 2011;
(b) in the case of the consolidated profi t and loss
account, of the profi t for the year ended on that date;
and
(c) in the case of the consolidated cash fl ow statement,
of the cash fl ows for the year ended on that date.
For S.R. BATLIBOI & Co. For G. D. Apte & Co.
Firm Registration No:- 301003E Firm Registration No:- 100515W
Chartered Accountants Chartered Accountants
per Shrawan Jalan C. M. Dixit
Partner Partner
Membership No.:102102 Membership No.: 17532
Mumbai Mumbai
April 29, 2011 April 29, 2011
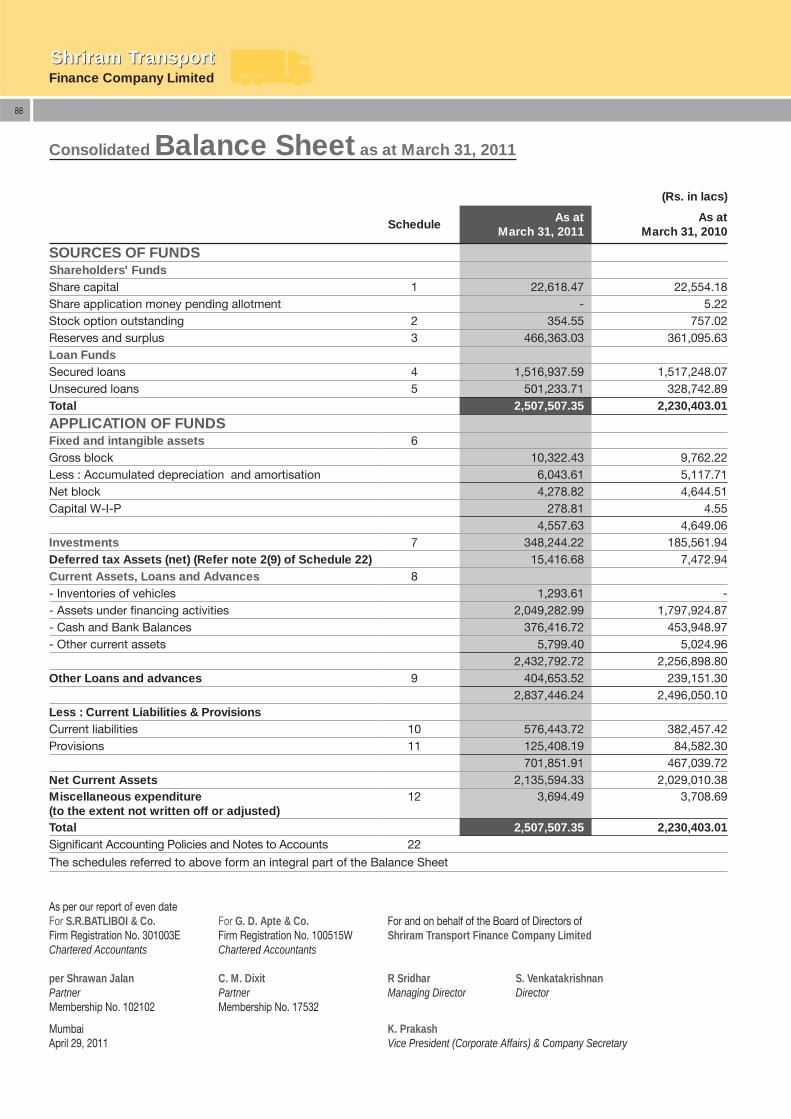
Finance Company LimitedShriram TransportShriram Transport
88
Consolidated Balance Sheet as at March 31, 2011
(Rs. in lacs)
Schedule As at
March 31, 2011 As at
March 31, 2010
SOURCES OF FUNDSShareholders' FundsShare capital 1 22,618.47 22,554.18 Share application money pending allotment - 5.22Stock option outstanding 2 354.55 757.02 Reserves and surplus 3 466,363.03 361,095.63 Loan FundsSecured loans 4 1,516,937.59 1,517,248.07 Unsecured loans 5 501,233.71 328,742.89 Total 2,507,507.35 2,230,403.01
APPLICATION OF FUNDSFixed and intangible assets 6Gross block 10,322.43 9,762.22 Less : Accumulated depreciation and amortisation 6,043.61 5,117.71 Net block 4,278.82 4,644.51 Capital W-I-P 278.81 4.55
4,557.63 4,649.06 Investments 7 348,244.22 185,561.94 Deferred tax Assets (net) (Refer note 2(9) of Schedule 22) 15,416.68 7,472.94 Current Assets, Loans and Advances 8- Inventories of vehicles 1,293.61 - - Assets under fi nancing activities 2,049,282.99 1,797,924.87 - Cash and Bank Balances 376,416.72 453,948.97 - Other current assets 5,799.40 5,024.96
2,432,792.72 2,256,898.80 Other Loans and advances 9 404,653.52 239,151.30
2,837,446.24 2,496,050.10 Less : Current Liabilities & ProvisionsCurrent liabilities 10 576,443.72 382,457.42 Provisions 11 125,408.19 84,582.30
701,851.91 467,039.72 Net Current Assets 2,135,594.33 2,029,010.38 Miscellaneous expenditure (to the extent not written off or adjusted)
12 3,694.49 3,708.69
Total 2,507,507.35 2,230,403.01 Signifi cant Accounting Policies and Notes to Accounts 22
The schedules referred to above form an integral part of the Balance Sheet
As per our report of even dateFor S.R.BATLIBOI & Co. For G. D. Apte & Co. For and on behalf of the Board of Directors ofFirm Registration No. 301003E Firm Registration No. 100515W Shriram Transport Finance Company LimitedChartered Accountants Chartered Accountants
per Shrawan Jalan C. M. Dixit R Sridhar S. VenkatakrishnanPartner Partner Managing Director DirectorMembership No. 102102 Membership No. 17532
Mumbai K. PrakashApril 29, 2011 Vice President (Corporate Affairs) & Company Secretary
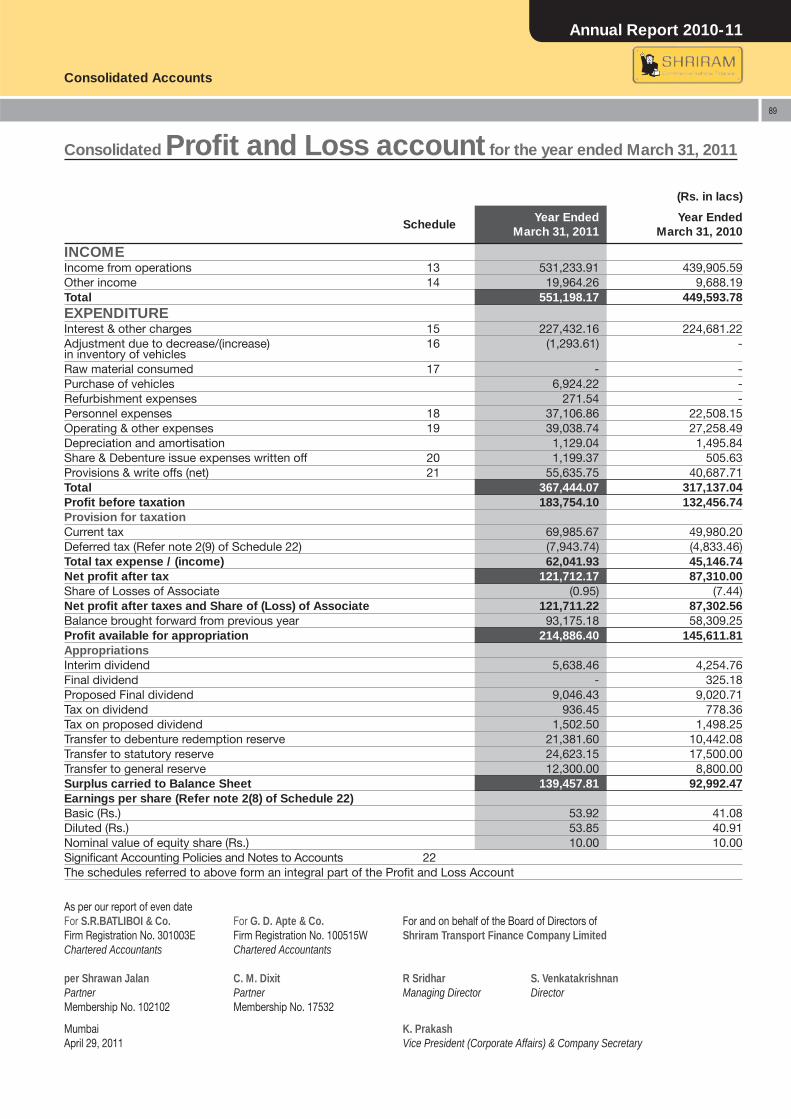
Annual Report 2010-11
Consolidated Accounts
89
Consolidated Profi t and Loss account for the year ended March 31, 2011
(Rs. in lacs)
Schedule Year Ended
March 31, 2011 Year Ended
March 31, 2010
INCOME Income from operations 13 531,233.91 439,905.59 Other income 14 19,964.26 9,688.19 Total 551,198.17 449,593.78 EXPENDITUREInterest & other charges 15 227,432.16 224,681.22 Adjustment due to decrease/(increase) in inventory of vehicles
16 (1,293.61) -
Raw material consumed 17 - - Purchase of vehicles 6,924.22 - Refurbishment expenses 271.54 - Personnel expenses 18 37,106.86 22,508.15 Operating & other expenses 19 39,038.74 27,258.49 Depreciation and amortisation 1,129.04 1,495.84 Share & Debenture issue expenses written off 20 1,199.37 505.63 Provisions & write offs (net) 21 55,635.75 40,687.71 Total 367,444.07 317,137.04 Profi t before taxation 183,754.10 132,456.74 Provision for taxationCurrent tax 69,985.67 49,980.20 Deferred tax (Refer note 2(9) of Schedule 22) (7,943.74) (4,833.46)Total tax expense / (income) 62,041.93 45,146.74 Net profi t after tax 121,712.17 87,310.00 Share of Losses of Associate (0.95) (7.44)Net profi t after taxes and Share of (Loss) of Associate 121,711.22 87,302.56 Balance brought forward from previous year 93,175.18 58,309.25 Profi t available for appropriation 214,886.40 145,611.81 AppropriationsInterim dividend 5,638.46 4,254.76 Final dividend - 325.18 Proposed Final dividend 9,046.43 9,020.71 Tax on dividend 936.45 778.36 Tax on proposed dividend 1,502.50 1,498.25 Transfer to debenture redemption reserve 21,381.60 10,442.08 Transfer to statutory reserve 24,623.15 17,500.00 Transfer to general reserve 12,300.00 8,800.00 Surplus carried to Balance Sheet 139,457.81 92,992.47 Earnings per share (Refer note 2(8) of Schedule 22)Basic (Rs.) 53.92 41.08 Diluted (Rs.) 53.85 40.91 Nominal value of equity share (Rs.) 10.00 10.00 Signifi cant Accounting Policies and Notes to Accounts 22The schedules referred to above form an integral part of the Profi t and Loss Account
As per our report of even dateFor S.R.BATLIBOI & Co. For G. D. Apte & Co. For and on behalf of the Board of Directors ofFirm Registration No. 301003E Firm Registration No. 100515W Shriram Transport Finance Company LimitedChartered Accountants Chartered Accountants
per Shrawan Jalan C. M. Dixit R Sridhar S. VenkatakrishnanPartner Partner Managing Director DirectorMembership No. 102102 Membership No. 17532
Mumbai K. PrakashApril 29, 2011 Vice President (Corporate Affairs) & Company Secretary
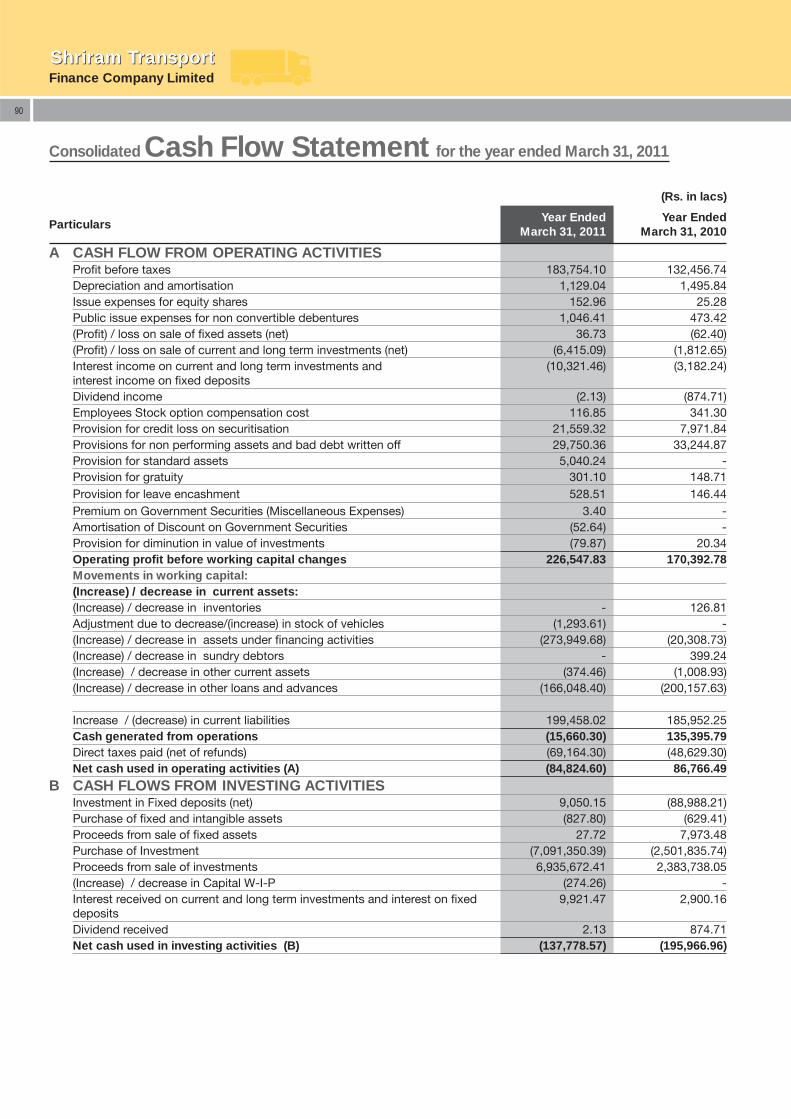
Finance Company LimitedShriram TransportShriram Transport
90
Consolidated Cash Flow Statement for the year ended March 31, 2011
(Rs. in lacs)
Particulars Year Ended
March 31, 2011 Year Ended
March 31, 2010
A CASH FLOW FROM OPERATING ACTIVITIESProfi t before taxes 183,754.10 132,456.74 Depreciation and amortisation 1,129.04 1,495.84 Issue expenses for equity shares 152.96 25.28 Public issue expenses for non convertible debentures 1,046.41 473.42 (Profi t) / loss on sale of fi xed assets (net) 36.73 (62.40)(Profi t) / loss on sale of current and long term investments (net) (6,415.09) (1,812.65)Interest income on current and long term investments and interest income on fi xed deposits
(10,321.46) (3,182.24)
Dividend income (2.13) (874.71)Employees Stock option compensation cost 116.85 341.30 Provision for credit loss on securitisation 21,559.32 7,971.84 Provisions for non performing assets and bad debt written off 29,750.36 33,244.87 Provision for standard assets 5,040.24 - Provision for gratuity 301.10 148.71 Provision for leave encashment 528.51 146.44 Premium on Government Securities (Miscellaneous Expenses) 3.40 - Amortisation of Discount on Government Securities (52.64) - Provision for diminution in value of investments (79.87) 20.34 Operating profi t before working capital changes 226,547.83 170,392.78 Movements in working capital: (Increase) / decrease in current assets:(Increase) / decrease in inventories - 126.81 Adjustment due to decrease/(increase) in stock of vehicles (1,293.61) - (Increase) / decrease in assets under fi nancing activities (273,949.68) (20,308.73)(Increase) / decrease in sundry debtors - 399.24 (Increase) / decrease in other current assets (374.46) (1,008.93)(Increase) / decrease in other loans and advances (166,048.40) (200,157.63)
Increase / (decrease) in current liabilities 199,458.02 185,952.25 Cash generated from operations (15,660.30) 135,395.79 Direct taxes paid (net of refunds) (69,164.30) (48,629.30)Net cash used in operating activities (A) (84,824.60) 86,766.49
B CASH FLOWS FROM INVESTING ACTIVITIESInvestment in Fixed deposits (net) 9,050.15 (88,988.21)Purchase of fi xed and intangible assets (827.80) (629.41)Proceeds from sale of fi xed assets 27.72 7,973.48 Purchase of Investment (7,091,350.39) (2,501,835.74)Proceeds from sale of investments 6,935,672.41 2,383,738.05 (Increase) / decrease in Capital W-I-P (274.26) - Interest received on current and long term investments and interest on fi xed deposits
9,921.47 2,900.16
Dividend received 2.13 874.71 Net cash used in investing activities (B) (137,778.57) (195,966.96)
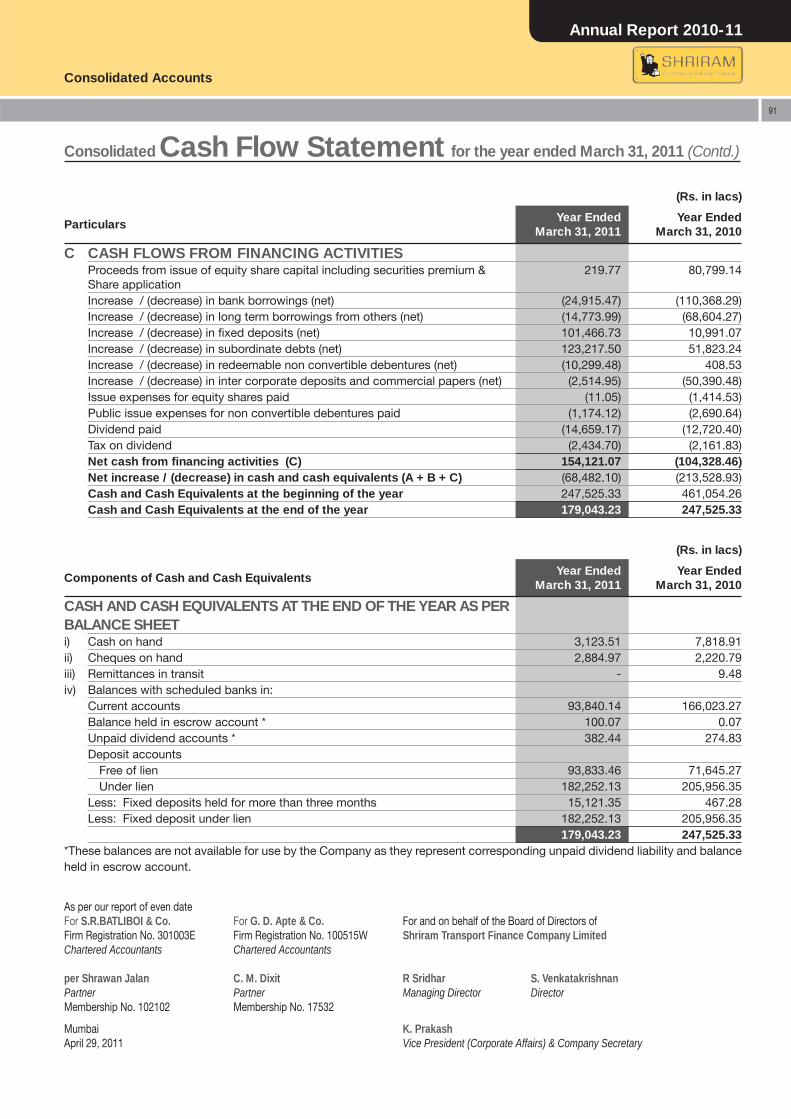
Annual Report 2010-11
Consolidated Accounts
91
C CASH FLOWS FROM FINANCING ACTIVITIESProceeds from issue of equity share capital including securities premium & Share application
219.77 80,799.14
Increase / (decrease) in bank borrowings (net) (24,915.47) (110,368.29)Increase / (decrease) in long term borrowings from others (net) (14,773.99) (68,604.27)Increase / (decrease) in fi xed deposits (net) 101,466.73 10,991.07 Increase / (decrease) in subordinate debts (net) 123,217.50 51,823.24 Increase / (decrease) in redeemable non convertible debentures (net) (10,299.48) 408.53 Increase / (decrease) in inter corporate deposits and commercial papers (net) (2,514.95) (50,390.48)Issue expenses for equity shares paid (11.05) (1,414.53)Public issue expenses for non convertible debentures paid (1,174.12) (2,690.64)Dividend paid (14,659.17) (12,720.40)Tax on dividend (2,434.70) (2,161.83)Net cash from fi nancing activities (C) 154,121.07 (104,328.46)Net increase / (decrease) in cash and cash equivalents (A + B + C) (68,482.10) (213,528.93)Cash and Cash Equivalents at the beginning of the year 247,525.33 461,054.26 Cash and Cash Equivalents at the end of the year 179,043.23 247,525.33
Consolidated Cash Flow Statement for the year ended March 31, 2011 (Contd.)
(Rs. in lacs)
Components of Cash and Cash Equivalents Year Ended
March 31, 2011 Year Ended
March 31, 2010
CASH AND CASH EQUIVALENTS AT THE END OF THE YEAR AS PER BALANCE SHEETi) Cash on hand 3,123.51 7,818.91 ii) Cheques on hand 2,884.97 2,220.79 iii) Remittances in transit - 9.48 iv) Balances with scheduled banks in:
Current accounts 93,840.14 166,023.27 Balance held in escrow account * 100.07 0.07 Unpaid dividend accounts * 382.44 274.83 Deposit accounts
Free of lien 93,833.46 71,645.27 Under lien 182,252.13 205,956.35
Less: Fixed deposits held for more than three months 15,121.35 467.28 Less: Fixed deposit under lien 182,252.13 205,956.35
179,043.23 247,525.33 *These balances are not available for use by the Company as they represent corresponding unpaid dividend liability and balance held in escrow account.
(Rs. in lacs)
Particulars Year Ended
March 31, 2011 Year Ended
March 31, 2010
As per our report of even dateFor S.R.BATLIBOI & Co. For G. D. Apte & Co. For and on behalf of the Board of Directors ofFirm Registration No. 301003E Firm Registration No. 100515W Shriram Transport Finance Company LimitedChartered Accountants Chartered Accountants
per Shrawan Jalan C. M. Dixit R Sridhar S. VenkatakrishnanPartner Partner Managing Director DirectorMembership No. 102102 Membership No. 17532
Mumbai K. PrakashApril 29, 2011 Vice President (Corporate Affairs) & Company Secretary
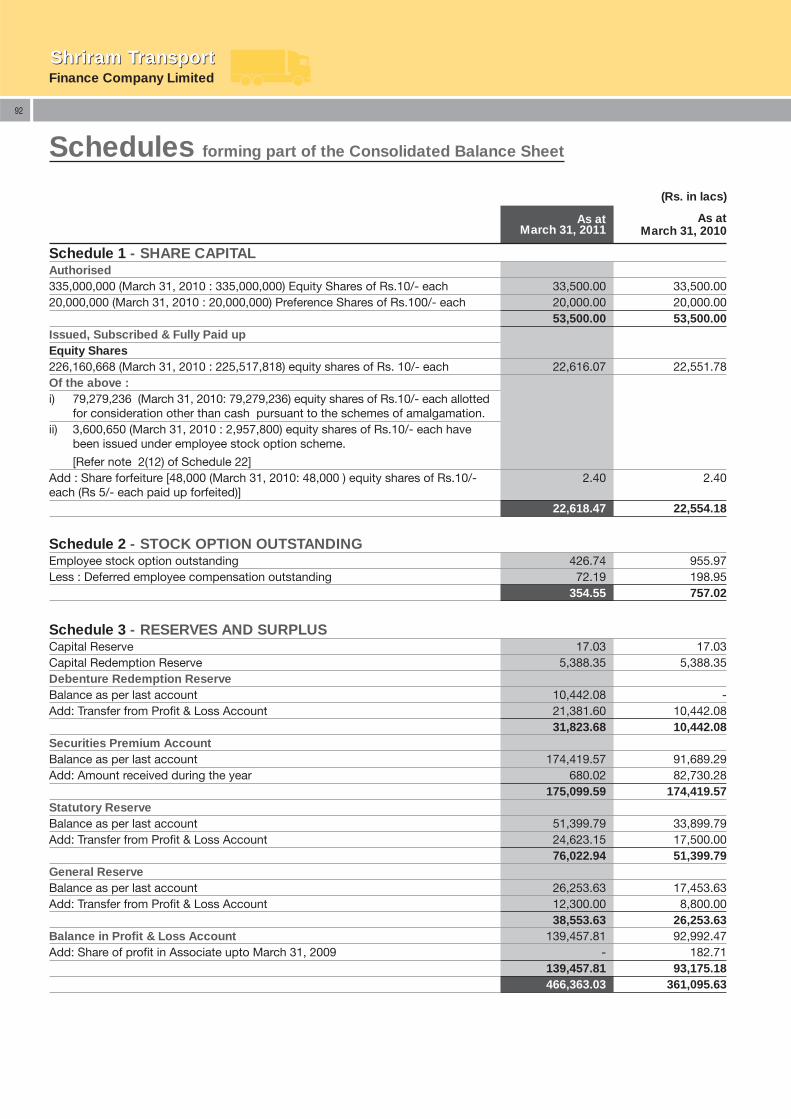
Finance Company LimitedShriram TransportShriram Transport
92
Schedules forming part of the Consolidated Balance Sheet
(Rs. in lacs)
As atMarch 31, 2011
As atMarch 31, 2010
Schedule 1 - SHARE CAPITALAuthorised335,000,000 (March 31, 2010 : 335,000,000) Equity Shares of Rs.10/- each 33,500.00 33,500.00 20,000,000 (March 31, 2010 : 20,000,000) Preference Shares of Rs.100/- each 20,000.00 20,000.00 53,500.00 53,500.00 Issued, Subscribed & Fully Paid up Equity Shares226,160,668 (March 31, 2010 : 225,517,818) equity shares of Rs. 10/- each 22,616.07 22,551.78 Of the above :i) 79,279,236 (March 31, 2010: 79,279,236) equity shares of Rs.10/- each allotted
for consideration other than cash pursuant to the schemes of amalgamation.ii) 3,600,650 (March 31, 2010 : 2,957,800) equity shares of Rs.10/- each have
been issued under employee stock option scheme.
[Refer note 2(12) of Schedule 22]Add : Share forfeiture [48,000 (March 31, 2010: 48,000 ) equity shares of Rs.10/- each (Rs 5/- each paid up forfeited)]
2.40 2.40
22,618.47 22,554.18
Schedule 3 - RESERVES AND SURPLUSCapital Reserve 17.03 17.03 Capital Redemption Reserve 5,388.35 5,388.35 Debenture Redemption ReserveBalance as per last account 10,442.08 - Add: Transfer from Profi t & Loss Account 21,381.60 10,442.08
31,823.68 10,442.08 Securities Premium AccountBalance as per last account 174,419.57 91,689.29 Add: Amount received during the year 680.02 82,730.28
175,099.59 174,419.57 Statutory ReserveBalance as per last account 51,399.79 33,899.79 Add: Transfer from Profi t & Loss Account 24,623.15 17,500.00
76,022.94 51,399.79 General ReserveBalance as per last account 26,253.63 17,453.63 Add: Transfer from Profi t & Loss Account 12,300.00 8,800.00
38,553.63 26,253.63 Balance in Profi t & Loss Account 139,457.81 92,992.47 Add: Share of profi t in Associate upto March 31, 2009 - 182.71
139,457.81 93,175.18 466,363.03 361,095.63
Schedule 2 - STOCK OPTION OUTSTANDINGEmployee stock option outstanding 426.74 955.97 Less : Deferred employee compensation outstanding 72.19 198.95
354.55 757.02
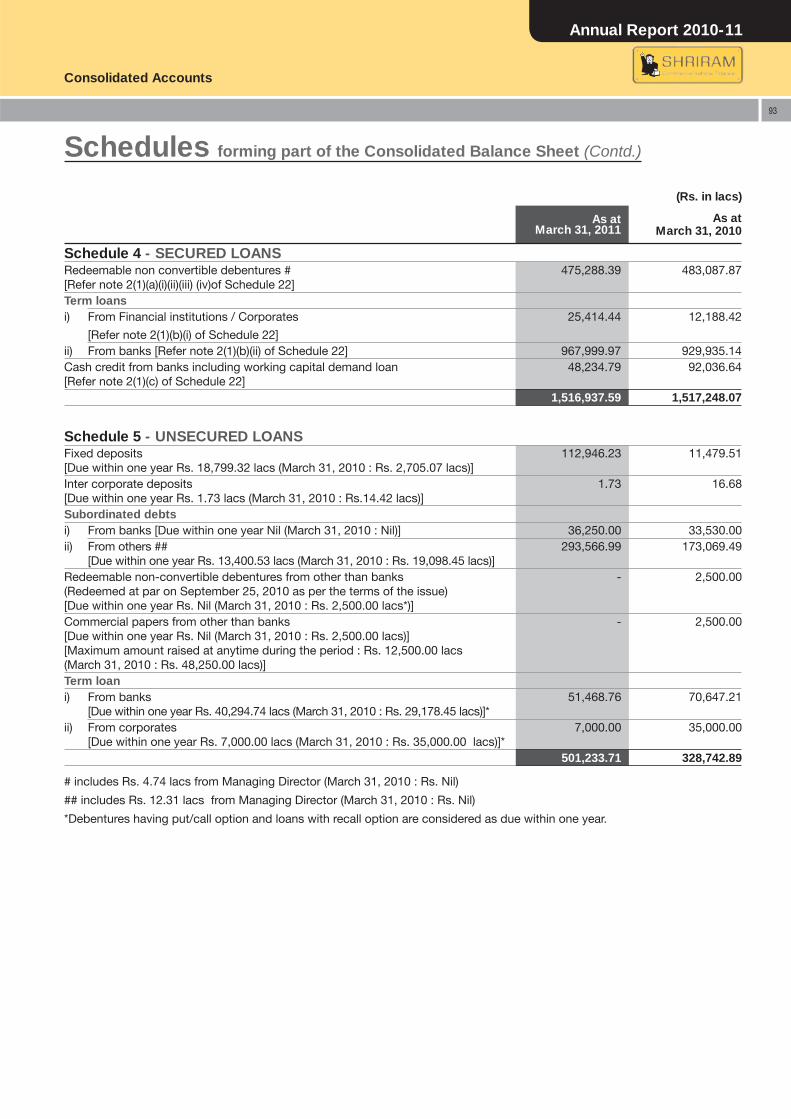
Annual Report 2010-11
Consolidated Accounts
93
Schedules forming part of the Consolidated Balance Sheet (Contd.)
(Rs. in lacs)
As atMarch 31, 2011
As atMarch 31, 2010
Schedule 4 - SECURED LOANSRedeemable non convertible debentures #[Refer note 2(1)(a)(i)(ii)(iii) (iv)of Schedule 22]
475,288.39 483,087.87
Term loansi) From Financial institutions / Corporates
[Refer note 2(1)(b)(i) of Schedule 22]
25,414.44 12,188.42
ii) From banks [Refer note 2(1)(b)(ii) of Schedule 22] 967,999.97 929,935.14 Cash credit from banks including working capital demand loan[Refer note 2(1)(c) of Schedule 22]
48,234.79 92,036.64
1,516,937.59 1,517,248.07
Schedule 5 - UNSECURED LOANSFixed deposits[Due within one year Rs. 18,799.32 lacs (March 31, 2010 : Rs. 2,705.07 lacs)]
112,946.23 11,479.51
Inter corporate deposits[Due within one year Rs. 1.73 lacs (March 31, 2010 : Rs.14.42 lacs)]
1.73 16.68
Subordinated debtsi) From banks [Due within one year Nil (March 31, 2010 : Nil)] 36,250.00 33,530.00 ii) From others ##
[Due within one year Rs. 13,400.53 lacs (March 31, 2010 : Rs. 19,098.45 lacs)] 293,566.99 173,069.49
Redeemable non-convertible debentures from other than banks(Redeemed at par on September 25, 2010 as per the terms of the issue)[Due within one year Rs. Nil (March 31, 2010 : Rs. 2,500.00 lacs*)]
- 2,500.00
Commercial papers from other than banks[Due within one year Rs. Nil (March 31, 2010 : Rs. 2,500.00 lacs)][Maximum amount raised at anytime during the period : Rs. 12,500.00 lacs (March 31, 2010 : Rs. 48,250.00 lacs)]
- 2,500.00
Term loani) From banks
[Due within one year Rs. 40,294.74 lacs (March 31, 2010 : Rs. 29,178.45 lacs)]* 51,468.76 70,647.21
ii) From corporates[Due within one year Rs. 7,000.00 lacs (March 31, 2010 : Rs. 35,000.00 lacs)]*
7,000.00 35,000.00
501,233.71 328,742.89
# includes Rs. 4.74 lacs from Managing Director (March 31, 2010 : Rs. Nil)
## includes Rs. 12.31 lacs from Managing Director (March 31, 2010 : Rs. Nil)
*Debentures having put/call option and loans with recall option are considered as due within one year.
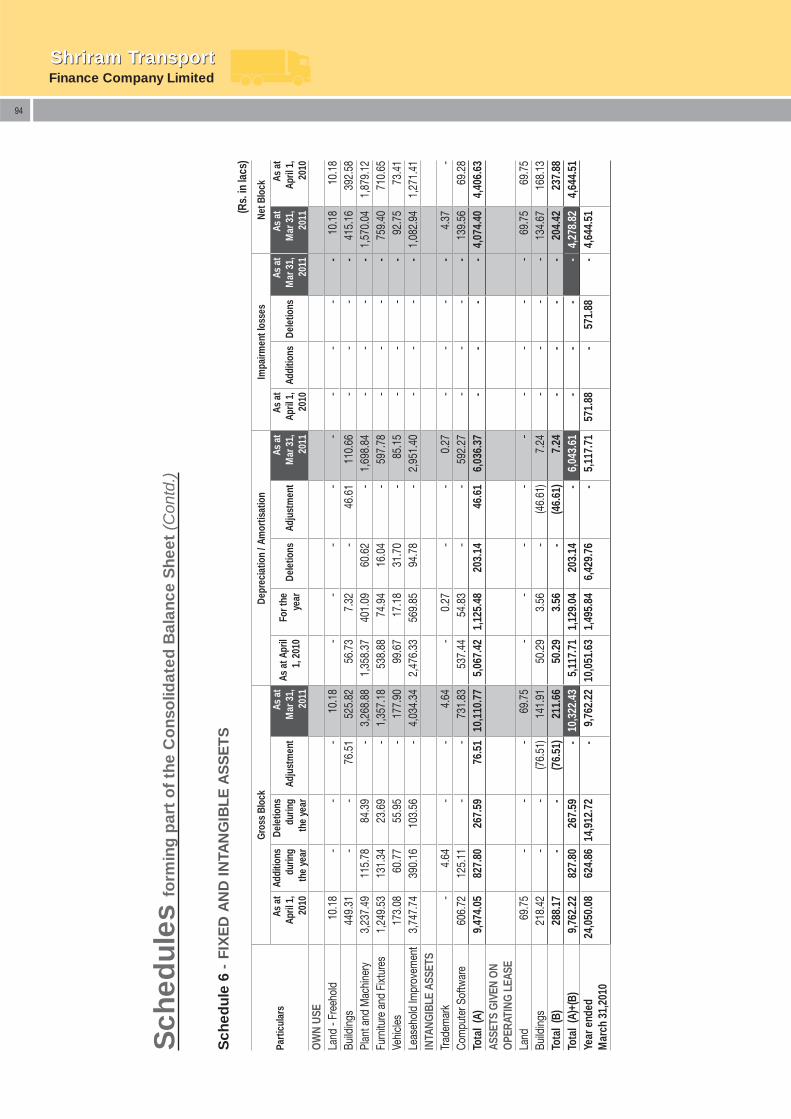
Finance Company LimitedShriram TransportShriram Transport
94
Sch
edul
es fo
rmin
g p
art
of
the
Co
nso
lidat
ed B
alan
ce S
heet
(C
ontd
.)
Sch
edul
e 6
- FI
XE
D A
ND
INTA
NG
IBLE
AS
SE
TS
(Rs.
in la
cs)
Parti
cula
rs
Gro
ss B
lock
Dep
reci
atio
n / A
mor
tisat
ion
Impa
irmen
t los
ses
Net B
lock
As
at
April
1,
2010
Add
ition
s du
ring
the
year
Del
etio
ns
durin
g th
e ye
ar
Adj
ustm
ent
As
at
Mar
31,
20
11 A
s at
Apr
il 1,
201
0 F
or th
e ye
ar
Del
etio
ns
Adj
ustm
ent
As
at
Mar
31,
20
11
As
at
April
1,
2010
Add
ition
s D
elet
ions
A
s at
M
ar 3
1,
2011
As
at
Mar
31,
20
11
As
at
April
1,
2010
O
WN
USE
Land
- Fr
eeho
ld 1
0.18
-
-
-
1
0.18
-
-
-
-
-
-
-
-
-
1
0.18
1
0.18
Bu
ildin
gs 4
49.3
1 -
-
7
6.51
5
25.8
2 5
6.73
7
.32
-
46.
61
110
.66
- -
-
-
4
15.1
6 3
92.5
8 Pl
ant a
nd M
achi
nery
3,2
37.4
9 1
15.7
8 8
4.39
-
3
,268
.88
1,3
58.3
7 4
01.0
9 6
0.62
-
1
,698
.84
-
-
-
-
1,57
0.04
1
,879
.12
Furn
iture
and
Fix
ture
s 1
,249
.53
131
.34
23.
69
-
1,3
57.1
8 5
38.8
8 7
4.94
1
6.04
-
5
97.7
8 -
-
-
-
7
59.4
0 7
10.6
5 Ve
hicl
es 1
73.0
8 6
0.77
5
5.95
-
1
77.9
0 9
9.67
1
7.18
3
1.70
-
8
5.15
-
-
-
-
9
2.75
7
3.41
Le
aseh
old
Impr
ovem
ent
3,7
47.7
4 3
90.1
6 1
03.5
6 -
4
,034
.34
2,4
76.3
3 5
69.8
5 9
4.78
-
2
,951
.40
-
-
-
-
1,08
2.94
1
,271
.41
INTA
NGIB
LE A
SSET
STr
adem
ark
-
4.6
4 -
-
4
.64
-
0.2
7 -
-
0
.27
-
-
-
-
4.3
7 -
Com
pute
r Sof
twar
e 6
06.7
2 1
25.1
1 -
-
7
31.8
3 5
37.4
4 5
4.83
-
-
5
92.2
7 -
-
-
-
1
39.5
6 6
9.28
To
tal
(A)
9,4
74.0
5 8
27.8
0 2
67.5
9 7
6.51
10
,110
.77
5,0
67.4
2 1
,125
.48
203
.14
46.
61
6,0
36.3
7 -
-
-
-
4,
074.
40
4,4
06.6
3 AS
SETS
GIV
EN O
N O
PERA
TING
LEA
SELa
nd 6
9.75
-
-
-
69.
75
-
-
-
-
-
-
-
-
-
69.
75
69.
75
Build
ings
218
.42
-
-
(76.
51)
141
.91
50.
29
3.5
6 -
(4
6.61
) 7
.24
-
-
-
-
134
.67
168
.13
Tota
l (B
)
288
.17
-
-
(76.
51)
211
.66
50.
29
3.5
6 -
(4
6.61
) 7
.24
-
-
-
-
204
.42
237
.88
Tota
l (A
)+(B
) 9
,762
.22
827
.80
267
.59
- 1
0,32
2.43
5
,117
.71
1,1
29.0
4 2
03.1
4 -
6
,043
.61
-
-
-
-
4,27
8.82
4
,644
.51
Year
end
ed
Mar
ch 3
1,20
10 2
4,05
0.08
6
24.8
6 1
4,91
2.72
-
9,7
62.2
2 10
,051
.63
1,4
95.8
4 6
,429
.76
-
5,1
17.7
1 5
71.8
8 -
5
71.8
8 -
4,
644.
51

Annual Report 2010-11
Consolidated Accounts
95
Long Term Investments (At cost)*
Trade
Shares : Fully paid up
Unquoted - Preference ShareMahaveer Finance India Limited (10% Cumulative RedeemablePreference Share of Rs 10/- each) (Sold during the year)
- 100,000 - 10.00
Other than trade
A Government Securities [Refer note 2(7) of Schedule 22]
Quoted
6.13% GOI Loan 2028 (Face Value - Rs.176.00 Lacs) 176,000 176,000 176.00 178.55
6.35% GOI Loan 2020 (Face Value - Rs. 2,000.00 Lacs) 2,000,000 2,000,000 2,000.00 1,847.00
6.49% GOI Loan 2015 (Face Value - Rs. 500.00 Lacs) 500,000 500,000 500.00 480.00
7.02% GOI Loan 2016 (Face Value - Rs. 400.00 Lacs) 400,000 400,000 400.00 391.30
7.40% GOI Loan 2012 (Face Value - Rs. 13.50 Lacs) 13,500 13,500 13.50 15.27
8.24% GOI Loan 2027 (Face Value - Rs. 500.00 Lacs) 500,000 500,000 500.00 496.40
11.50% Tamilnadu Loan 2010 (Face Value - Rs. 0.06 Lacs ) (Redeemed during year) - 60 - 0.06
12.00% Tamilnadu Loan 2011 (Face Value - Rs. 3.00 Lacs) 3,000 3,000 3.00 3.03
12.40% GOI Loan 2013 (Face Value - Rs.85.00 Lacs) 85,000 85,000 85.00 86.09
Purchased during the year
6.35 % GOI Loan 2020 (Face Value - Rs. 500.00 Lacs) 500,000 - 500.00 -
6.90% GOI Loan 2019 (Face Value - Rs. 5,000.00 Lacs) 5,000,000 - 5,000.00 -
7.80% GOI Loan 2020 (Face Value - Rs. 2,500.00 Lacs) 2,500,000 - 2,500.00 -
8.13% GOI Loan 2022 (Face Value - Rs. 2,500.00 Lacs) 2,500,000 - 2,500.00 -
8.26% GOI Loan 2027 (Face Value - Rs. 2,500.00 Lacs) 2,500,000 - 2,524.67 -
B. Shares : Fully paid up
a) Quoted - Equity shares fully paid up
Shriram Asset Management Company Limited (Face value of Rs. 10/-each) # 2,400,000 2,400,000 240.00 240.00
Cost of investment (including Rs. Nil of Goodwill / Capital Reserve)
Add:-Share of post acquisition profi t 174.32 175.27
414.32 415.27
b) Unquoted - Equity sharesState Industrial Investment Corporation of Maharashtra Limited (Face value of Rs.10/- each)
50,000 50,000 40.00 40.00
Credential Finance Limited (Face value of Rs.10/-each) 25,000 25,000 25.00 25.00
Ashley Transport Services Limited (Face value of Rs.100/- each) 225,000 225,000 142.50 142.50
C Unquoted-Pass Trough Certifi catesCorporate Loan Securitization series XXXIII Trust 2006 - 40 - 4,284.55 (Face value Rs. 4,017.84 lacs, annualised yield NSEMIBOR + 800 bps subject to fl oor of 9.20% p.a. and cap of 9.40% p.a.)ISTF Loan Trust (Purchased during the year)(Face value of Rs. 7,000.00 lacs, Fixed Discount Rate of 8.4% XIRR)
70 - 7,424.18 -
D Unquoted- Venture Capital FundICICI Investment Management Company Limited (Purchased 5,000 units, Face Value - Rs. 10,000/- each)
5,000 - 500.00 -
Schedule 7 - INVESTMENTS (Rs. in lacs)
Particulars
Quantity Quantity Amount Amount
As at March 31, 2011
As at March 31, 2010
As at March 31, 2011
As at March 31, 2010
Schedules forming part of the Consolidated Balance Sheet (Contd.)
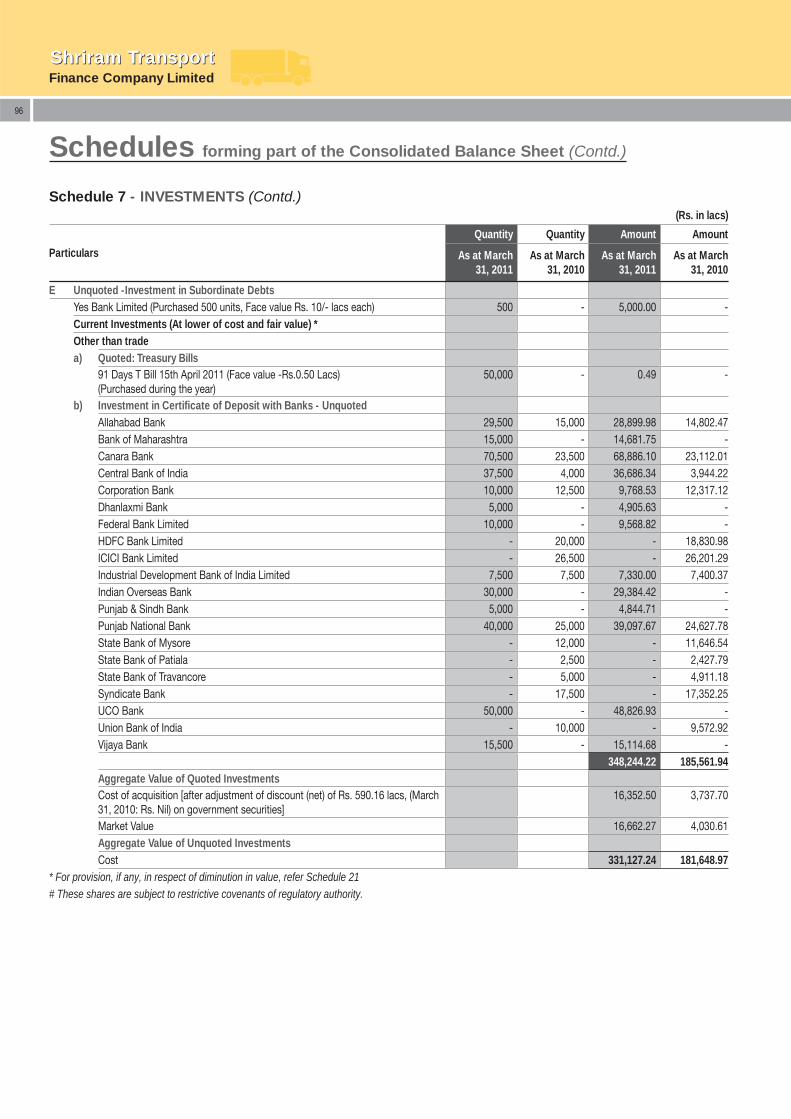
Finance Company LimitedShriram TransportShriram Transport
96
E Unquoted -Investment in Subordinate DebtsYes Bank Limited (Purchased 500 units, Face value Rs. 10/- lacs each) 500 - 5,000.00 -Current Investments (At lower of cost and fair value) *Other than tradea) Quoted: Treasury Bills
91 Days T Bill 15th April 2011 (Face value -Rs.0.50 Lacs)(Purchased during the year)
50,000 - 0.49 -
b) Investment in Certifi cate of Deposit with Banks - UnquotedAllahabad Bank 29,500 15,000 28,899.98 14,802.47 Bank of Maharashtra 15,000 - 14,681.75 - Canara Bank 70,500 23,500 68,886.10 23,112.01 Central Bank of India 37,500 4,000 36,686.34 3,944.22 Corporation Bank 10,000 12,500 9,768.53 12,317.12 Dhanlaxmi Bank 5,000 - 4,905.63 - Federal Bank Limited 10,000 - 9,568.82 - HDFC Bank Limited - 20,000 - 18,830.98 ICICI Bank Limited - 26,500 - 26,201.29 Industrial Development Bank of India Limited 7,500 7,500 7,330.00 7,400.37 Indian Overseas Bank 30,000 - 29,384.42 - Punjab & Sindh Bank 5,000 - 4,844.71 - Punjab National Bank 40,000 25,000 39,097.67 24,627.78 State Bank of Mysore - 12,000 - 11,646.54 State Bank of Patiala - 2,500 - 2,427.79 State Bank of Travancore - 5,000 - 4,911.18 Syndicate Bank - 17,500 - 17,352.25 UCO Bank 50,000 - 48,826.93 - Union Bank of India - 10,000 - 9,572.92 Vijaya Bank 15,500 - 15,114.68 -
348,244.22 185,561.94 Aggregate Value of Quoted Investments Cost of acquisition [after adjustment of discount (net) of Rs. 590.16 lacs, (March 31, 2010: Rs. Nil) on government securities]
16,352.50 3,737.70
Market Value 16,662.27 4,030.61 Aggregate Value of Unquoted Investments Cost 331,127.24 181,648.97
* For provision, if any, in respect of diminution in value, refer Schedule 21# These shares are subject to restrictive covenants of regulatory authority.
Schedule 7 - INVESTMENTS (Contd.) (Rs. in lacs)
Particulars
Quantity Quantity Amount Amount
As at March 31, 2011
As at March 31, 2010
As at March 31, 2011
As at March 31, 2010
Schedules forming part of the Consolidated Balance Sheet (Contd.)
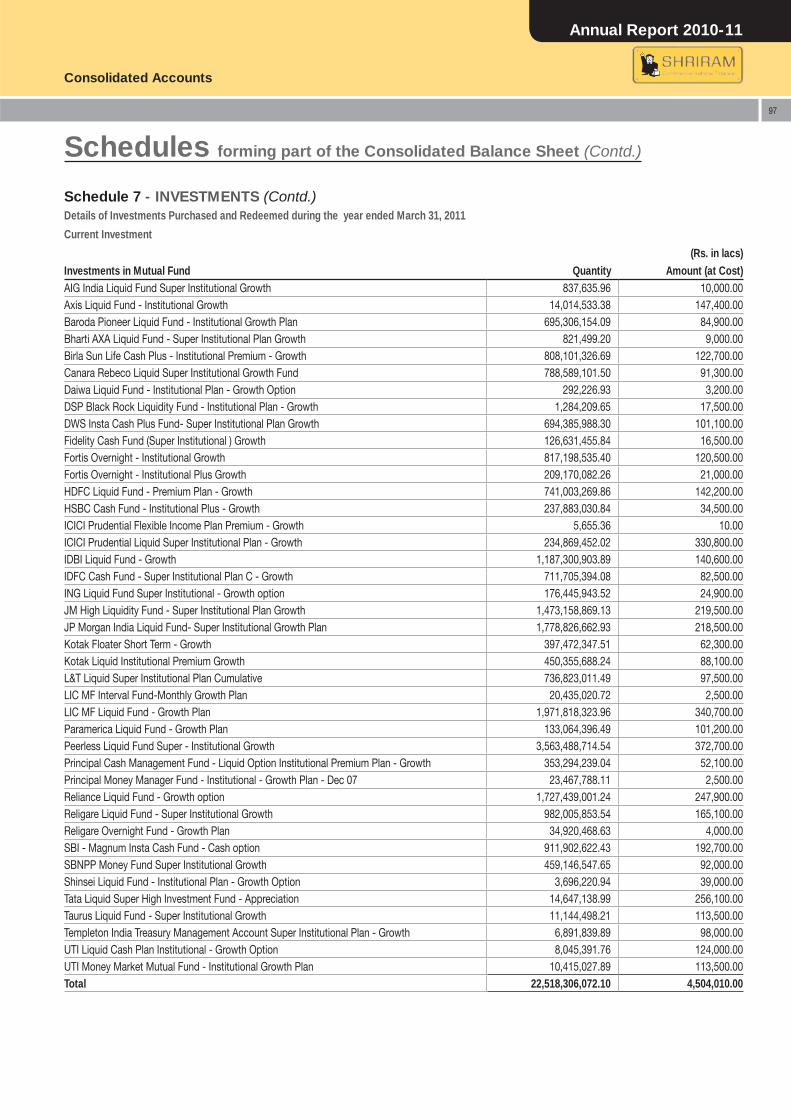
Annual Report 2010-11
Consolidated Accounts
97
Details of Investments Purchased and Redeemed during the year ended March 31, 2011
Current Investment
(Rs. in lacs) Investments in Mutual Fund Quantity Amount (at Cost) AIG India Liquid Fund Super Institutional Growth 837,635.96 10,000.00 Axis Liquid Fund - Institutional Growth 14,014,533.38 147,400.00 Baroda Pioneer Liquid Fund - Institutional Growth Plan 695,306,154.09 84,900.00 Bharti AXA Liquid Fund - Super Institutional Plan Growth 821,499.20 9,000.00 Birla Sun Life Cash Plus - Institutional Premium - Growth 808,101,326.69 122,700.00 Canara Rebeco Liquid Super Institutional Growth Fund 788,589,101.50 91,300.00 Daiwa Liquid Fund - Institutional Plan - Growth Option 292,226.93 3,200.00 DSP Black Rock Liquidity Fund - Institutional Plan - Growth 1,284,209.65 17,500.00 DWS Insta Cash Plus Fund- Super Institutional Plan Growth 694,385,988.30 101,100.00 Fidelity Cash Fund (Super Institutional ) Growth 126,631,455.84 16,500.00 Fortis Overnight - Institutional Growth 817,198,535.40 120,500.00 Fortis Overnight - Institutional Plus Growth 209,170,082.26 21,000.00 HDFC Liquid Fund - Premium Plan - Growth 741,003,269.86 142,200.00 HSBC Cash Fund - Institutional Plus - Growth 237,883,030.84 34,500.00 ICICI Prudential Flexible Income Plan Premium - Growth 5,655.36 10.00 ICICI Prudential Liquid Super Institutional Plan - Growth 234,869,452.02 330,800.00 IDBI Liquid Fund - Growth 1,187,300,903.89 140,600.00 IDFC Cash Fund - Super Institutional Plan C - Growth 711,705,394.08 82,500.00 ING Liquid Fund Super Institutional - Growth option 176,445,943.52 24,900.00 JM High Liquidity Fund - Super Institutional Plan Growth 1,473,158,869.13 219,500.00 JP Morgan India Liquid Fund- Super Institutional Growth Plan 1,778,826,662.93 218,500.00 Kotak Floater Short Term - Growth 397,472,347.51 62,300.00 Kotak Liquid Institutional Premium Growth 450,355,688.24 88,100.00 L&T Liquid Super Institutional Plan Cumulative 736,823,011.49 97,500.00 LIC MF Interval Fund-Monthly Growth Plan 20,435,020.72 2,500.00 LIC MF Liquid Fund - Growth Plan 1,971,818,323.96 340,700.00 Paramerica Liquid Fund - Growth Plan 133,064,396.49 101,200.00 Peerless Liquid Fund Super - Institutional Growth 3,563,488,714.54 372,700.00 Principal Cash Management Fund - Liquid Option Institutional Premium Plan - Growth 353,294,239.04 52,100.00 Principal Money Manager Fund - Institutional - Growth Plan - Dec 07 23,467,788.11 2,500.00 Reliance Liquid Fund - Growth option 1,727,439,001.24 247,900.00 Religare Liquid Fund - Super Institutional Growth 982,005,853.54 165,100.00 Religare Overnight Fund - Growth Plan 34,920,468.63 4,000.00 SBI - Magnum Insta Cash Fund - Cash option 911,902,622.43 192,700.00 SBNPP Money Fund Super Institutional Growth 459,146,547.65 92,000.00 Shinsei Liquid Fund - Institutional Plan - Growth Option 3,696,220.94 39,000.00 Tata Liquid Super High Investment Fund - Appreciation 14,647,138.99 256,100.00 Taurus Liquid Fund - Super Institutional Growth 11,144,498.21 113,500.00 Templeton India Treasury Management Account Super Institutional Plan - Growth 6,891,839.89 98,000.00 UTI Liquid Cash Plan Institutional - Growth Option 8,045,391.76 124,000.00 UTI Money Market Mutual Fund - Institutional Growth Plan 10,415,027.89 113,500.00 Total 22,518,306,072.10 4,504,010.00
Schedule 7 - INVESTMENTS (Contd.)
Schedules forming part of the Consolidated Balance Sheet (Contd.)
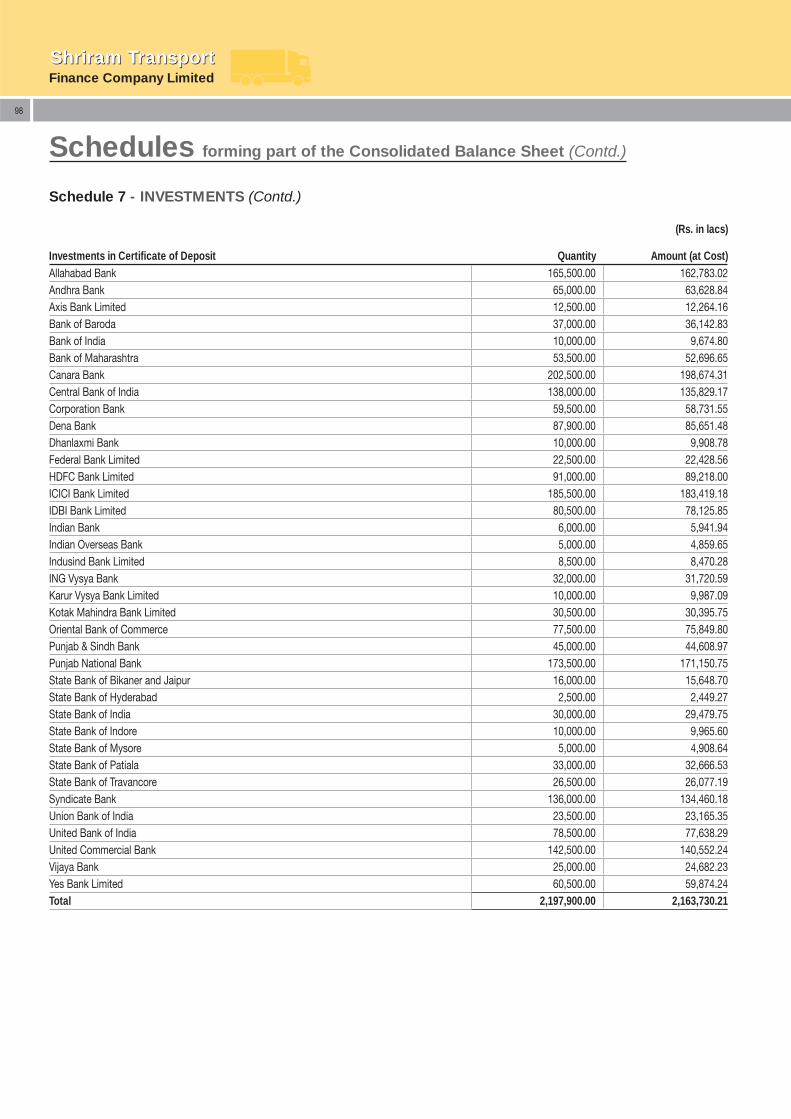
Finance Company LimitedShriram TransportShriram Transport
98
(Rs. in lacs)
Investments in Certifi cate of Deposit Quantity Amount (at Cost) Allahabad Bank 165,500.00 162,783.02 Andhra Bank 65,000.00 63,628.84 Axis Bank Limited 12,500.00 12,264.16 Bank of Baroda 37,000.00 36,142.83 Bank of India 10,000.00 9,674.80 Bank of Maharashtra 53,500.00 52,696.65 Canara Bank 202,500.00 198,674.31 Central Bank of India 138,000.00 135,829.17 Corporation Bank 59,500.00 58,731.55 Dena Bank 87,900.00 85,651.48 Dhanlaxmi Bank 10,000.00 9,908.78 Federal Bank Limited 22,500.00 22,428.56 HDFC Bank Limited 91,000.00 89,218.00 ICICI Bank Limited 185,500.00 183,419.18 IDBI Bank Limited 80,500.00 78,125.85 Indian Bank 6,000.00 5,941.94 Indian Overseas Bank 5,000.00 4,859.65 Indusind Bank Limited 8,500.00 8,470.28 ING Vysya Bank 32,000.00 31,720.59 Karur Vysya Bank Limited 10,000.00 9,987.09 Kotak Mahindra Bank Limited 30,500.00 30,395.75 Oriental Bank of Commerce 77,500.00 75,849.80 Punjab & Sindh Bank 45,000.00 44,608.97 Punjab National Bank 173,500.00 171,150.75 State Bank of Bikaner and Jaipur 16,000.00 15,648.70 State Bank of Hyderabad 2,500.00 2,449.27 State Bank of India 30,000.00 29,479.75 State Bank of Indore 10,000.00 9,965.60 State Bank of Mysore 5,000.00 4,908.64 State Bank of Patiala 33,000.00 32,666.53 State Bank of Travancore 26,500.00 26,077.19 Syndicate Bank 136,000.00 134,460.18 Union Bank of India 23,500.00 23,165.35 United Bank of India 78,500.00 77,638.29 United Commercial Bank 142,500.00 140,552.24 Vijaya Bank 25,000.00 24,682.23 Yes Bank Limited 60,500.00 59,874.24 Total 2,197,900.00 2,163,730.21
Schedule 7 - INVESTMENTS (Contd.)
Schedules forming part of the Consolidated Balance Sheet (Contd.)
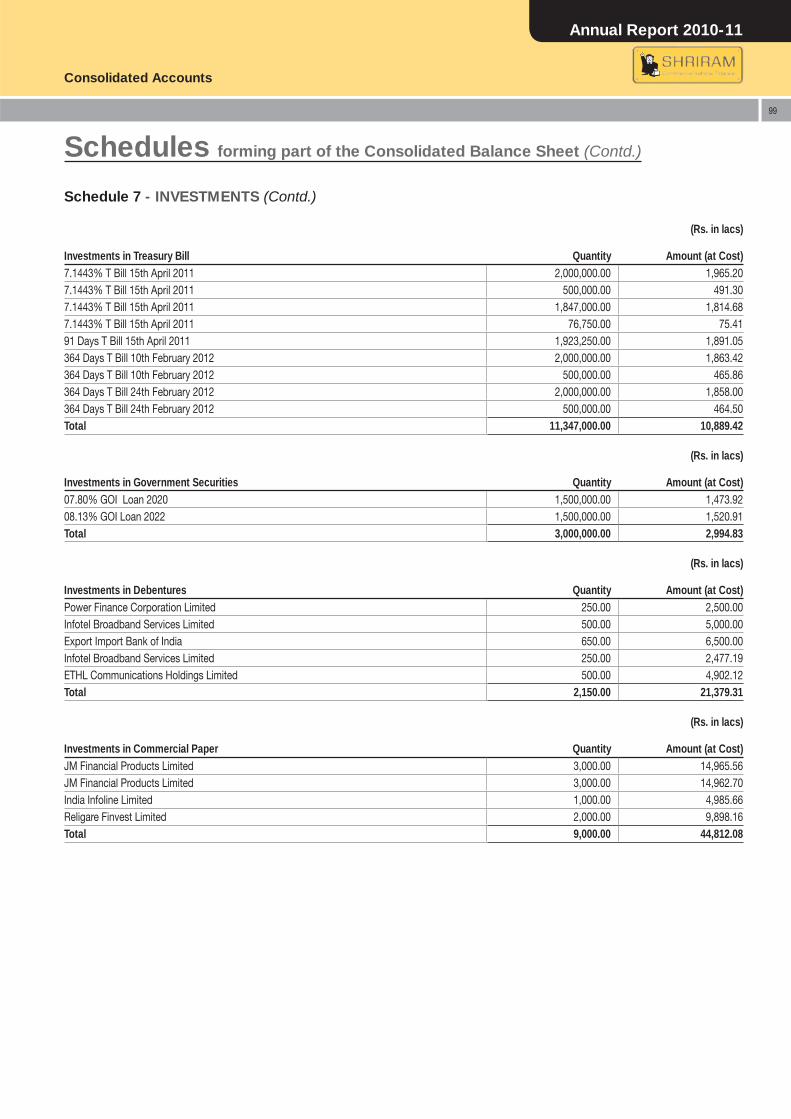
Annual Report 2010-11
Consolidated Accounts
99
(Rs. in lacs)
Investments in Treasury Bill Quantity Amount (at Cost) 7.1443% T Bill 15th April 2011 2,000,000.00 1,965.20 7.1443% T Bill 15th April 2011 500,000.00 491.30 7.1443% T Bill 15th April 2011 1,847,000.00 1,814.68 7.1443% T Bill 15th April 2011 76,750.00 75.41 91 Days T Bill 15th April 2011 1,923,250.00 1,891.05 364 Days T Bill 10th February 2012 2,000,000.00 1,863.42 364 Days T Bill 10th February 2012 500,000.00 465.86 364 Days T Bill 24th February 2012 2,000,000.00 1,858.00 364 Days T Bill 24th February 2012 500,000.00 464.50 Total 11,347,000.00 10,889.42
(Rs. in lacs)
Investments in Government Securities Quantity Amount (at Cost) 07.80% GOI Loan 2020 1,500,000.00 1,473.92 08.13% GOI Loan 2022 1,500,000.00 1,520.91 Total 3,000,000.00 2,994.83
(Rs. in lacs)
Investments in Debentures Quantity Amount (at Cost) Power Finance Corporation Limited 250.00 2,500.00 Infotel Broadband Services Limited 500.00 5,000.00 Export Import Bank of India 650.00 6,500.00 Infotel Broadband Services Limited 250.00 2,477.19 ETHL Communications Holdings Limited 500.00 4,902.12 Total 2,150.00 21,379.31
(Rs. in lacs)
Investments in Commercial Paper Quantity Amount (at Cost) JM Financial Products Limited 3,000.00 14,965.56 JM Financial Products Limited 3,000.00 14,962.70 India Infoline Limited 1,000.00 4,985.66 Religare Finvest Limited 2,000.00 9,898.16 Total 9,000.00 44,812.08
Schedule 7 - INVESTMENTS (Contd.)
Schedules forming part of the Consolidated Balance Sheet (Contd.)
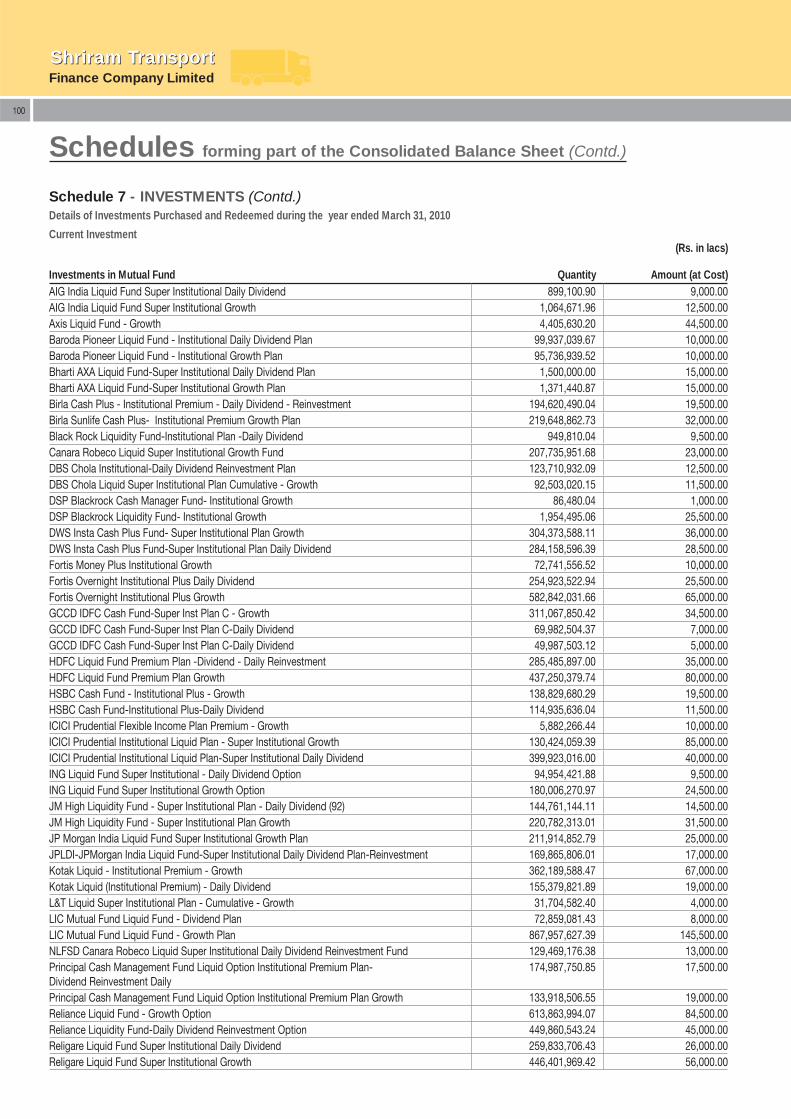
Finance Company LimitedShriram TransportShriram Transport
100
(Rs. in lacs)
Investments in Mutual Fund Quantity Amount (at Cost) AIG India Liquid Fund Super Institutional Daily Dividend 899,100.90 9,000.00 AIG India Liquid Fund Super Institutional Growth 1,064,671.96 12,500.00 Axis Liquid Fund - Growth 4,405,630.20 44,500.00 Baroda Pioneer Liquid Fund - Institutional Daily Dividend Plan 99,937,039.67 10,000.00 Baroda Pioneer Liquid Fund - Institutional Growth Plan 95,736,939.52 10,000.00 Bharti AXA Liquid Fund-Super Institutional Daily Dividend Plan 1,500,000.00 15,000.00 Bharti AXA Liquid Fund-Super Institutional Growth Plan 1,371,440.87 15,000.00 Birla Cash Plus - Institutional Premium - Daily Dividend - Reinvestment 194,620,490.04 19,500.00 Birla Sunlife Cash Plus- Institutional Premium Growth Plan 219,648,862.73 32,000.00 Black Rock Liquidity Fund-Institutional Plan -Daily Dividend 949,810.04 9,500.00 Canara Robeco Liquid Super Institutional Growth Fund 207,735,951.68 23,000.00 DBS Chola Institutional-Daily Dividend Reinvestment Plan 123,710,932.09 12,500.00 DBS Chola Liquid Super Institutional Plan Cumulative - Growth 92,503,020.15 11,500.00 DSP Blackrock Cash Manager Fund- Institutional Growth 86,480.04 1,000.00 DSP Blackrock Liquidity Fund- Institutional Growth 1,954,495.06 25,500.00 DWS Insta Cash Plus Fund- Super Institutional Plan Growth 304,373,588.11 36,000.00 DWS Insta Cash Plus Fund-Super Institutional Plan Daily Dividend 284,158,596.39 28,500.00 Fortis Money Plus Institutional Growth 72,741,556.52 10,000.00 Fortis Overnight Institutional Plus Daily Dividend 254,923,522.94 25,500.00 Fortis Overnight Institutional Plus Growth 582,842,031.66 65,000.00 GCCD IDFC Cash Fund-Super Inst Plan C - Growth 311,067,850.42 34,500.00 GCCD IDFC Cash Fund-Super Inst Plan C-Daily Dividend 69,982,504.37 7,000.00 GCCD IDFC Cash Fund-Super Inst Plan C-Daily Dividend 49,987,503.12 5,000.00 HDFC Liquid Fund Premium Plan -Dividend - Daily Reinvestment 285,485,897.00 35,000.00 HDFC Liquid Fund Premium Plan Growth 437,250,379.74 80,000.00 HSBC Cash Fund - Institutional Plus - Growth 138,829,680.29 19,500.00 HSBC Cash Fund-Institutional Plus-Daily Dividend 114,935,636.04 11,500.00 ICICI Prudential Flexible Income Plan Premium - Growth 5,882,266.44 10,000.00 ICICI Prudential Institutional Liquid Plan - Super Institutional Growth 130,424,059.39 85,000.00 ICICI Prudential Institutional Liquid Plan-Super Institutional Daily Dividend 399,923,016.00 40,000.00 ING Liquid Fund Super Institutional - Daily Dividend Option 94,954,421.88 9,500.00 ING Liquid Fund Super Institutional Growth Option 180,006,270.97 24,500.00 JM High Liquidity Fund - Super Institutional Plan - Daily Dividend (92) 144,761,144.11 14,500.00 JM High Liquidity Fund - Super Institutional Plan Growth 220,782,313.01 31,500.00 JP Morgan India Liquid Fund Super Institutional Growth Plan 211,914,852.79 25,000.00 JPLDI-JPMorgan India Liquid Fund-Super Institutional Daily Dividend Plan-Reinvestment 169,865,806.01 17,000.00 Kotak Liquid - Institutional Premium - Growth 362,189,588.47 67,000.00 Kotak Liquid (Institutional Premium) - Daily Dividend 155,379,821.89 19,000.00 L&T Liquid Super Institutional Plan - Cumulative - Growth 31,704,582.40 4,000.00 LIC Mutual Fund Liquid Fund - Dividend Plan 72,859,081.43 8,000.00 LIC Mutual Fund Liquid Fund - Growth Plan 867,957,627.39 145,500.00 NLFSD Canara Robeco Liquid Super Institutional Daily Dividend Reinvestment Fund 129,469,176.38 13,000.00 Principal Cash Management Fund Liquid Option Institutional Premium Plan- Dividend Reinvestment Daily
174,987,750.85 17,500.00
Principal Cash Management Fund Liquid Option Institutional Premium Plan Growth 133,918,506.55 19,000.00 Reliance Liquid Fund - Growth Option 613,863,994.07 84,500.00 Reliance Liquidity Fund-Daily Dividend Reinvestment Option 449,860,543.24 45,000.00 Religare Liquid Fund Super Institutional Daily Dividend 259,833,706.43 26,000.00 Religare Liquid Fund Super Institutional Growth 446,401,969.42 56,000.00
Schedule 7 - INVESTMENTS (Contd.)Details of Investments Purchased and Redeemed during the year ended March 31, 2010
Current Investment
Schedules forming part of the Consolidated Balance Sheet (Contd.)
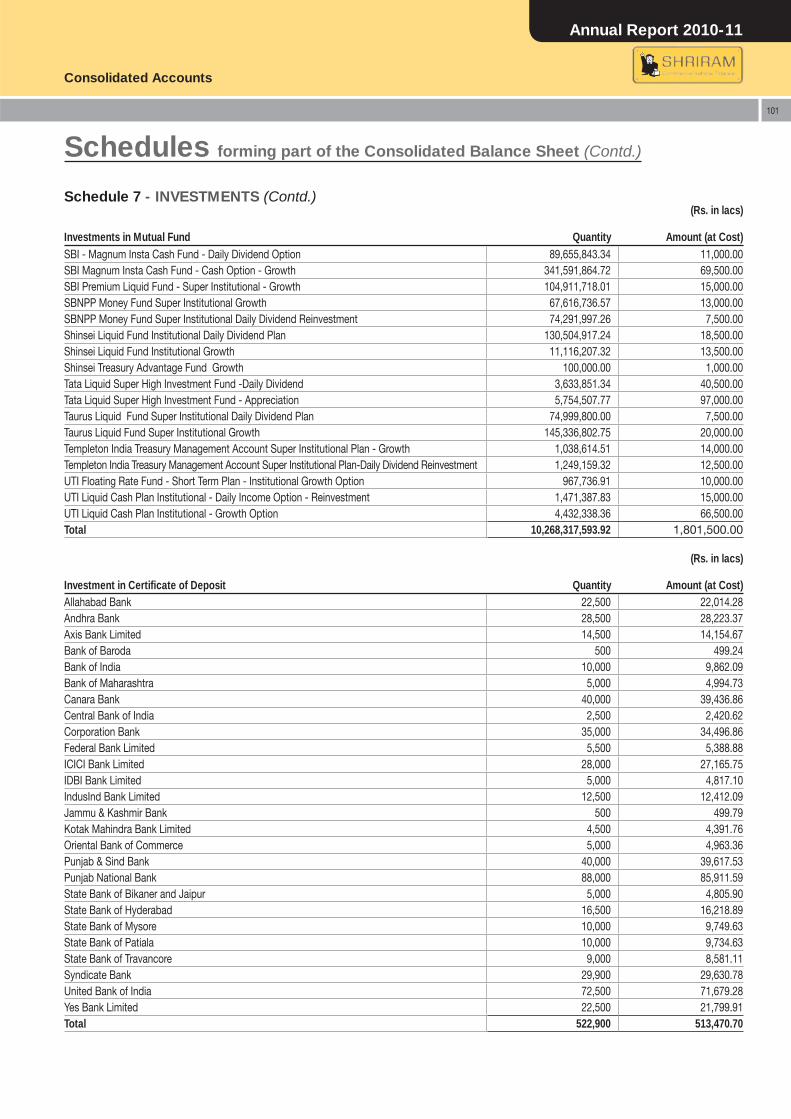
Annual Report 2010-11
Consolidated Accounts
101
SBI - Magnum Insta Cash Fund - Daily Dividend Option 89,655,843.34 11,000.00 SBI Magnum Insta Cash Fund - Cash Option - Growth 341,591,864.72 69,500.00 SBI Premium Liquid Fund - Super Institutional - Growth 104,911,718.01 15,000.00 SBNPP Money Fund Super Institutional Growth 67,616,736.57 13,000.00 SBNPP Money Fund Super Institutional Daily Dividend Reinvestment 74,291,997.26 7,500.00 Shinsei Liquid Fund Institutional Daily Dividend Plan 130,504,917.24 18,500.00 Shinsei Liquid Fund Institutional Growth 11,116,207.32 13,500.00 Shinsei Treasury Advantage Fund Growth 100,000.00 1,000.00 Tata Liquid Super High Investment Fund -Daily Dividend 3,633,851.34 40,500.00 Tata Liquid Super High Investment Fund - Appreciation 5,754,507.77 97,000.00 Taurus Liquid Fund Super Institutional Daily Dividend Plan 74,999,800.00 7,500.00 Taurus Liquid Fund Super Institutional Growth 145,336,802.75 20,000.00 Templeton India Treasury Management Account Super Institutional Plan - Growth 1,038,614.51 14,000.00 Templeton India Treasury Management Account Super Institutional Plan-Daily Dividend Reinvestment 1,249,159.32 12,500.00 UTI Floating Rate Fund - Short Term Plan - Institutional Growth Option 967,736.91 10,000.00 UTI Liquid Cash Plan Institutional - Daily Income Option - Reinvestment 1,471,387.83 15,000.00 UTI Liquid Cash Plan Institutional - Growth Option 4,432,338.36 66,500.00 Total 10,268,317,593.92 1,801,500.00
(Rs. in lacs)
Investment in Certifi cate of Deposit Quantity Amount (at Cost) Allahabad Bank 22,500 22,014.28 Andhra Bank 28,500 28,223.37 Axis Bank Limited 14,500 14,154.67 Bank of Baroda 500 499.24 Bank of India 10,000 9,862.09 Bank of Maharashtra 5,000 4,994.73 Canara Bank 40,000 39,436.86 Central Bank of India 2,500 2,420.62 Corporation Bank 35,000 34,496.86 Federal Bank Limited 5,500 5,388.88 ICICI Bank Limited 28,000 27,165.75 IDBI Bank Limited 5,000 4,817.10 IndusInd Bank Limited 12,500 12,412.09 Jammu & Kashmir Bank 500 499.79 Kotak Mahindra Bank Limited 4,500 4,391.76 Oriental Bank of Commerce 5,000 4,963.36 Punjab & Sind Bank 40,000 39,617.53 Punjab National Bank 88,000 85,911.59 State Bank of Bikaner and Jaipur 5,000 4,805.90 State Bank of Hyderabad 16,500 16,218.89 State Bank of Mysore 10,000 9,749.63 State Bank of Patiala 10,000 9,734.63 State Bank of Travancore 9,000 8,581.11 Syndicate Bank 29,900 29,630.78 United Bank of India 72,500 71,679.28 Yes Bank Limited 22,500 21,799.91 Total 522,900 513,470.70
(Rs. in lacs)
Investments in Mutual Fund Quantity Amount (at Cost)
Schedule 7 - INVESTMENTS (Contd.)
Schedules forming part of the Consolidated Balance Sheet (Contd.)
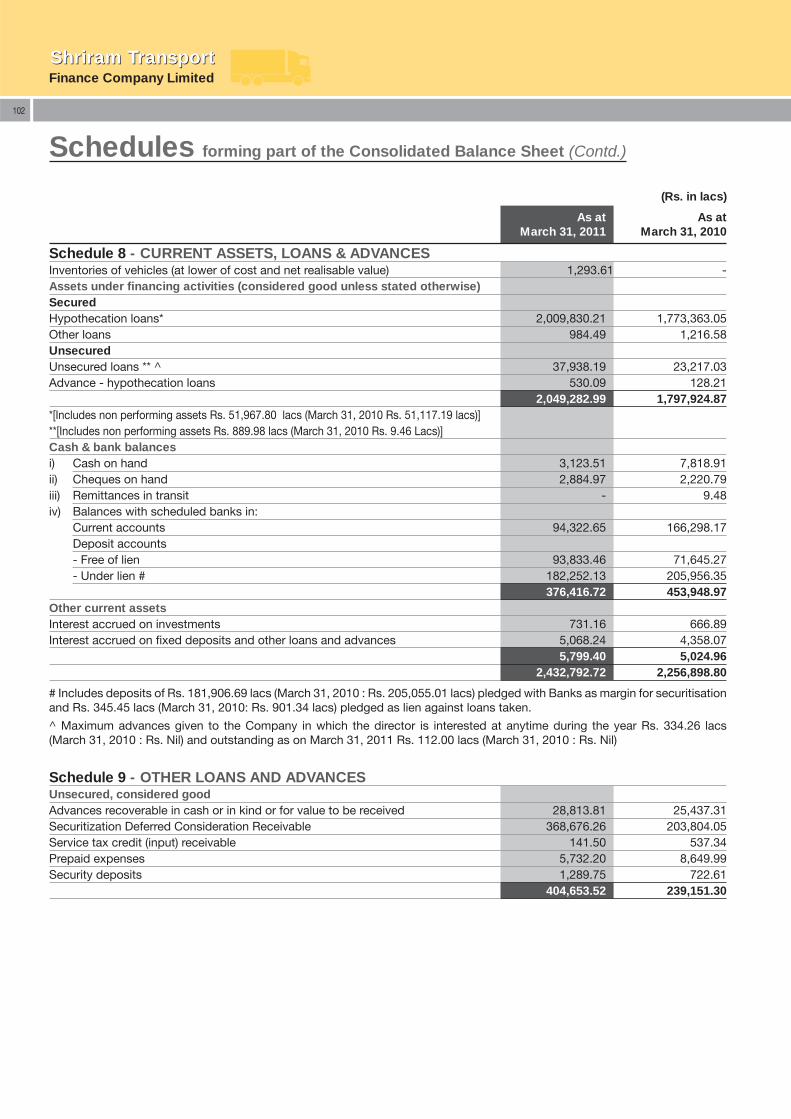
Finance Company LimitedShriram TransportShriram Transport
102
(Rs. in lacs)
As at March 31, 2011
As atMarch 31, 2010
Schedule 8 - CURRENT ASSETS, LOANS & ADVANCESInventories of vehicles (at lower of cost and net realisable value) 1,293.61 - Assets under fi nancing activities (considered good unless stated otherwise)SecuredHypothecation loans* 2,009,830.21 1,773,363.05 Other loans 984.49 1,216.58 UnsecuredUnsecured loans ** ^ 37,938.19 23,217.03 Advance - hypothecation loans 530.09 128.21
2,049,282.99 1,797,924.87 *[Includes non performing assets Rs. 51,967.80 lacs (March 31, 2010 Rs. 51,117.19 lacs)]**[Includes non performing assets Rs. 889.98 lacs (March 31, 2010 Rs. 9.46 Lacs)]Cash & bank balancesi) Cash on hand 3,123.51 7,818.91 ii) Cheques on hand 2,884.97 2,220.79 iii) Remittances in transit - 9.48 iv) Balances with scheduled banks in:
Current accounts 94,322.65 166,298.17 Deposit accounts- Free of lien 93,833.46 71,645.27 - Under lien # 182,252.13 205,956.35
376,416.72 453,948.97 Other current assetsInterest accrued on investments 731.16 666.89 Interest accrued on fi xed deposits and other loans and advances 5,068.24 4,358.07
5,799.40 5,024.96 2,432,792.72 2,256,898.80
# Includes deposits of Rs. 181,906.69 lacs (March 31, 2010 : Rs. 205,055.01 lacs) pledged with Banks as margin for securitisation and Rs. 345.45 lacs (March 31, 2010: Rs. 901.34 lacs) pledged as lien against loans taken.
^ Maximum advances given to the Company in which the director is interested at anytime during the year Rs. 334.26 lacs (March 31, 2010 : Rs. Nil) and outstanding as on March 31, 2011 Rs. 112.00 lacs (March 31, 2010 : Rs. Nil)
Schedule 9 - OTHER LOANS AND ADVANCESUnsecured, considered goodAdvances recoverable in cash or in kind or for value to be received 28,813.81 25,437.31 Securitization Deferred Consideration Receivable 368,676.26 203,804.05 Service tax credit (input) receivable 141.50 537.34 Prepaid expenses 5,732.20 8,649.99 Security deposits 1,289.75 722.61
404,653.52 239,151.30
Schedules forming part of the Consolidated Balance Sheet (Contd.)
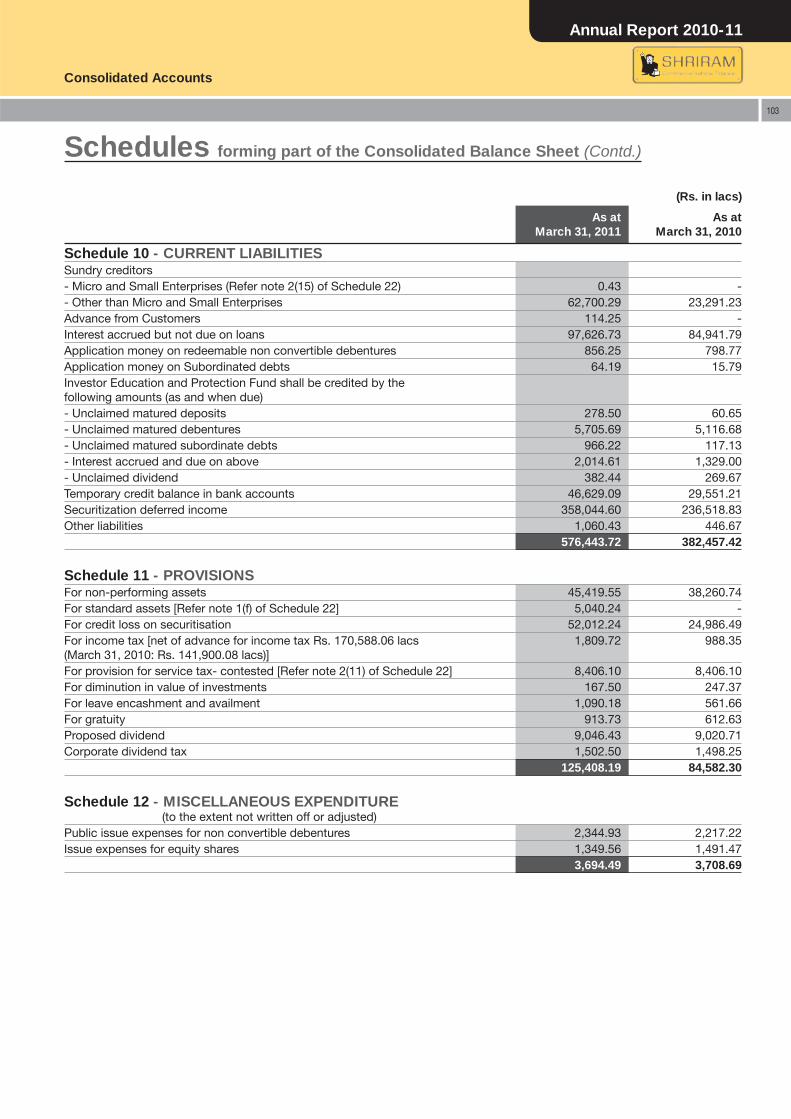
Annual Report 2010-11
Consolidated Accounts
103
(Rs. in lacs)
As atMarch 31, 2011
As atMarch 31, 2010
Schedule 10 - CURRENT LIABILITIESSundry creditors - Micro and Small Enterprises (Refer note 2(15) of Schedule 22) 0.43 - - Other than Micro and Small Enterprises 62,700.29 23,291.23 Advance from Customers 114.25 - Interest accrued but not due on loans 97,626.73 84,941.79 Application money on redeemable non convertible debentures 856.25 798.77 Application money on Subordinated debts 64.19 15.79 Investor Education and Protection Fund shall be credited by the following amounts (as and when due)- Unclaimed matured deposits 278.50 60.65 - Unclaimed matured debentures 5,705.69 5,116.68 - Unclaimed matured subordinate debts 966.22 117.13 - Interest accrued and due on above 2,014.61 1,329.00 - Unclaimed dividend 382.44 269.67 Temporary credit balance in bank accounts 46,629.09 29,551.21 Securitization deferred income 358,044.60 236,518.83 Other liabilities 1,060.43 446.67
576,443.72 382,457.42
Schedule 11 - PROVISIONSFor non-performing assets 45,419.55 38,260.74 For standard assets [Refer note 1(f) of Schedule 22] 5,040.24 - For credit loss on securitisation 52,012.24 24,986.49 For income tax [net of advance for income tax Rs. 170,588.06 lacs (March 31, 2010: Rs. 141,900.08 lacs)]
1,809.72 988.35
For provision for service tax- contested [Refer note 2(11) of Schedule 22] 8,406.10 8,406.10 For diminution in value of investments 167.50 247.37 For leave encashment and availment 1,090.18 561.66 For gratuity 913.73 612.63 Proposed dividend 9,046.43 9,020.71 Corporate dividend tax 1,502.50 1,498.25
125,408.19 84,582.30
Schedule 12 - MISCELLANEOUS EXPENDITURE(to the extent not written off or adjusted)
Public issue expenses for non convertible debentures 2,344.93 2,217.22 Issue expenses for equity shares 1,349.56 1,491.47
3,694.49 3,708.69
Schedules forming part of the Consolidated Balance Sheet (Contd.)
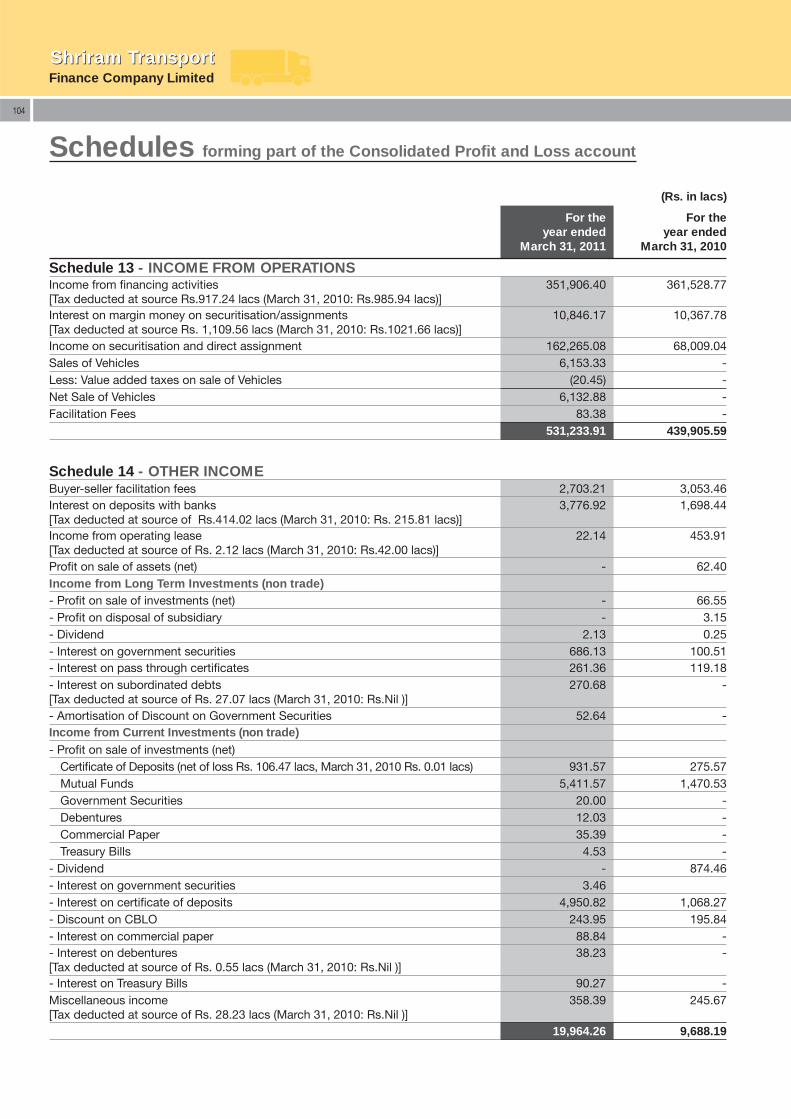
Finance Company LimitedShriram TransportShriram Transport
104
(Rs. in lacs)
For theyear ended
March 31, 2011
For theyear ended
March 31, 2010
Schedule 13 - INCOME FROM OPERATIONSIncome from fi nancing activities[Tax deducted at source Rs.917.24 lacs (March 31, 2010: Rs.985.94 lacs)]
351,906.40 361,528.77
Interest on margin money on securitisation/assignments [Tax deducted at source Rs. 1,109.56 lacs (March 31, 2010: Rs.1021.66 lacs)]
10,846.17 10,367.78
Income on securitisation and direct assignment 162,265.08 68,009.04 Sales of Vehicles 6,153.33 - Less: Value added taxes on sale of Vehicles (20.45) -Net Sale of Vehicles 6,132.88 -Facilitation Fees 83.38 -
531,233.91 439,905.59
Schedule 14 - OTHER INCOMEBuyer-seller facilitation fees 2,703.21 3,053.46 Interest on deposits with banks[Tax deducted at source of Rs.414.02 lacs (March 31, 2010: Rs. 215.81 lacs)]
3,776.92 1,698.44
Income from operating lease [Tax deducted at source of Rs. 2.12 lacs (March 31, 2010: Rs.42.00 lacs)]
22.14 453.91
Profi t on sale of assets (net) - 62.40 Income from Long Term Investments (non trade)- Profi t on sale of investments (net) - 66.55 - Profi t on disposal of subsidiary - 3.15 - Dividend 2.13 0.25 - Interest on government securities 686.13 100.51 - Interest on pass through certifi cates 261.36 119.18 - Interest on subordinated debts[Tax deducted at source of Rs. 27.07 lacs (March 31, 2010: Rs.Nil )]
270.68 -
- Amortisation of Discount on Government Securities 52.64 - Income from Current Investments (non trade)- Profi t on sale of investments (net)
Certifi cate of Deposits (net of loss Rs. 106.47 lacs, March 31, 2010 Rs. 0.01 lacs) 931.57 275.57 Mutual Funds 5,411.57 1,470.53 Government Securities 20.00 - Debentures 12.03 - Commercial Paper 35.39 - Treasury Bills 4.53 -
- Dividend - 874.46 - Interest on government securities 3.46 - Interest on certifi cate of deposits 4,950.82 1,068.27 - Discount on CBLO 243.95 195.84 - Interest on commercial paper 88.84 - - Interest on debentures [Tax deducted at source of Rs. 0.55 lacs (March 31, 2010: Rs.Nil )]
38.23 -
- Interest on Treasury Bills 90.27 - Miscellaneous income[Tax deducted at source of Rs. 28.23 lacs (March 31, 2010: Rs.Nil )]
358.39 245.67
19,964.26 9,688.19
Schedules forming part of the Consolidated Profi t and Loss account
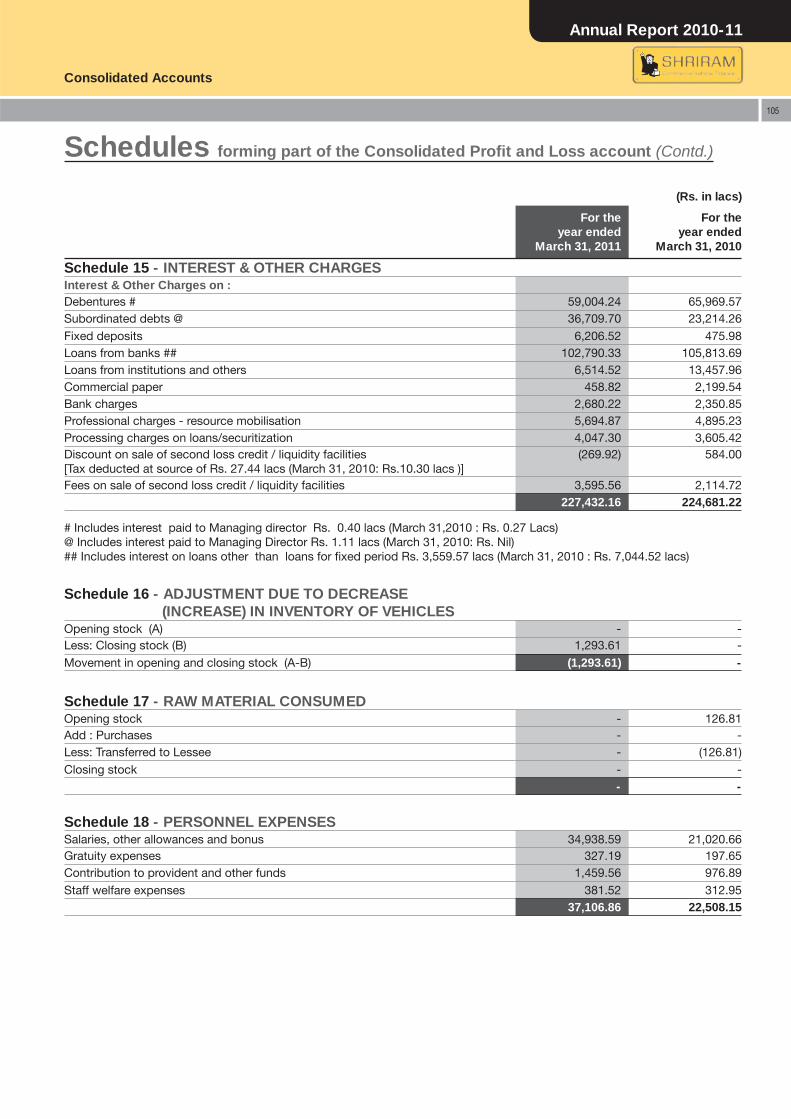
Annual Report 2010-11
Consolidated Accounts
105
(Rs. in lacs)
For theyear ended
March 31, 2011
For theyear ended
March 31, 2010
Schedule 15 - INTEREST & OTHER CHARGESInterest & Other Charges on :Debentures # 59,004.24 65,969.57 Subordinated debts @ 36,709.70 23,214.26 Fixed deposits 6,206.52 475.98 Loans from banks ## 102,790.33 105,813.69 Loans from institutions and others 6,514.52 13,457.96 Commercial paper 458.82 2,199.54 Bank charges 2,680.22 2,350.85 Professional charges - resource mobilisation 5,694.87 4,895.23 Processing charges on loans/securitization 4,047.30 3,605.42 Discount on sale of second loss credit / liquidity facilities[Tax deducted at source of Rs. 27.44 lacs (March 31, 2010: Rs.10.30 lacs )]
(269.92) 584.00
Fees on sale of second loss credit / liquidity facilities 3,595.56 2,114.72 227,432.16 224,681.22
# Includes interest paid to Managing director Rs. 0.40 lacs (March 31,2010 : Rs. 0.27 Lacs)@ Includes interest paid to Managing Director Rs. 1.11 lacs (March 31, 2010: Rs. Nil)## Includes interest on loans other than loans for fi xed period Rs. 3,559.57 lacs (March 31, 2010 : Rs. 7,044.52 lacs)
Schedule 16 - ADJUSTMENT DUE TO DECREASE(INCREASE) IN INVENTORY OF VEHICLES
Opening stock (A) - - Less: Closing stock (B) 1,293.61 - Movement in opening and closing stock (A-B) (1,293.61) -
Schedule 17 - RAW MATERIAL CONSUMEDOpening stock - 126.81 Add : Purchases - - Less: Transferred to Lessee - (126.81)Closing stock - -
- -
Schedule 18 - PERSONNEL EXPENSESSalaries, other allowances and bonus 34,938.59 21,020.66 Gratuity expenses 327.19 197.65 Contribution to provident and other funds 1,459.56 976.89 Staff welfare expenses 381.52 312.95
37,106.86 22,508.15
Schedules forming part of the Consolidated Profi t and Loss account (Contd.)
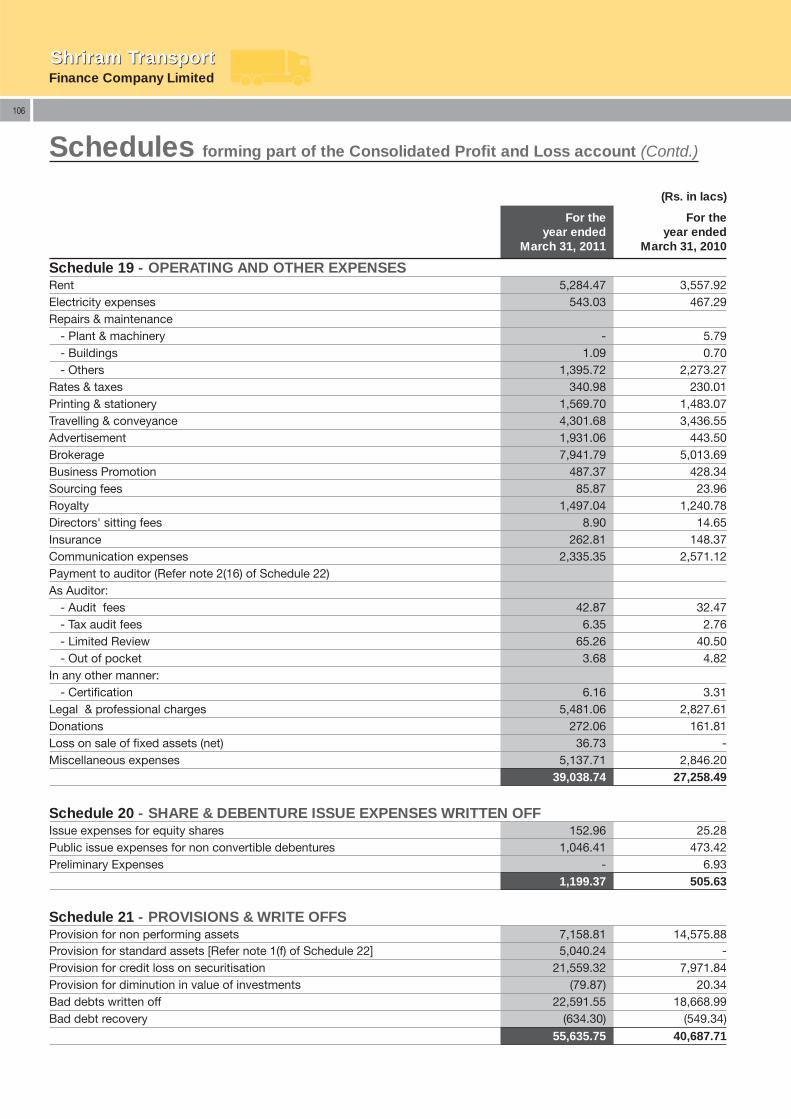
Finance Company LimitedShriram TransportShriram Transport
106
(Rs. in lacs)
For theyear ended
March 31, 2011
For theyear ended
March 31, 2010
Schedule 19 - OPERATING AND OTHER EXPENSESRent 5,284.47 3,557.92 Electricity expenses 543.03 467.29 Repairs & maintenance
- Plant & machinery - 5.79 - Buildings 1.09 0.70 - Others 1,395.72 2,273.27
Rates & taxes 340.98 230.01 Printing & stationery 1,569.70 1,483.07 Travelling & conveyance 4,301.68 3,436.55 Advertisement 1,931.06 443.50 Brokerage 7,941.79 5,013.69 Business Promotion 487.37 428.34 Sourcing fees 85.87 23.96 Royalty 1,497.04 1,240.78 Directors' sitting fees 8.90 14.65 Insurance 262.81 148.37 Communication expenses 2,335.35 2,571.12 Payment to auditor (Refer note 2(16) of Schedule 22)As Auditor:
- Audit fees 42.87 32.47 - Tax audit fees 6.35 2.76 - Limited Review 65.26 40.50 - Out of pocket 3.68 4.82
In any other manner:- Certifi cation 6.16 3.31
Legal & professional charges 5,481.06 2,827.61 Donations 272.06 161.81 Loss on sale of fi xed assets (net) 36.73 - Miscellaneous expenses 5,137.71 2,846.20
39,038.74 27,258.49
Schedule 20 - SHARE & DEBENTURE ISSUE EXPENSES WRITTEN OFFIssue expenses for equity shares 152.96 25.28 Public issue expenses for non convertible debentures 1,046.41 473.42 Preliminary Expenses - 6.93
1,199.37 505.63
Schedule 21 - PROVISIONS & WRITE OFFSProvision for non performing assets 7,158.81 14,575.88 Provision for standard assets [Refer note 1(f) of Schedule 22] 5,040.24 - Provision for credit loss on securitisation 21,559.32 7,971.84 Provision for diminution in value of investments (79.87) 20.34 Bad debts written off 22,591.55 18,668.99 Bad debt recovery (634.30) (549.34)
55,635.75 40,687.71
Schedules forming part of the Consolidated Profi t and Loss account (Contd.)
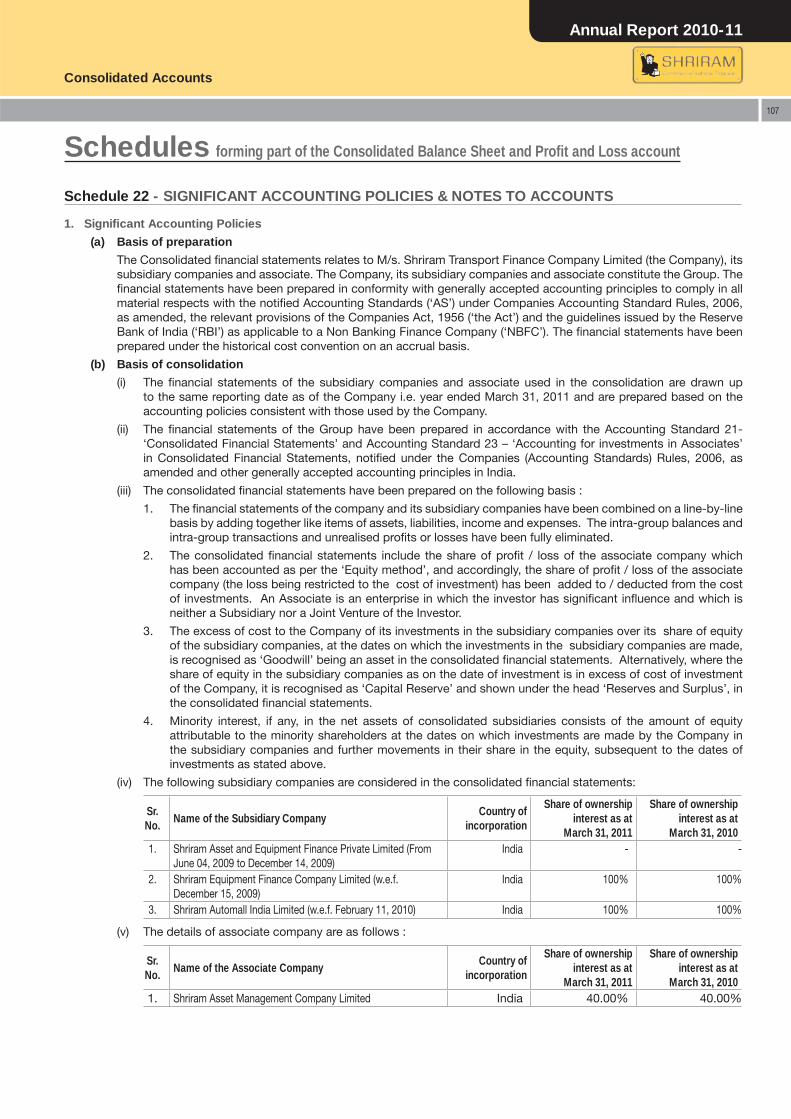
Annual Report 2010-11
Consolidated Accounts
107
Schedule 22 - SIGNIFICANT ACCOUNTING POLICIES & NOTES TO ACCOUNTS
1. Signifi cant Accounting Policies
(a) Basis of preparation
The Consolidated fi nancial statements relates to M/s. Shriram Transport Finance Company Limited (the Company), its subsidiary companies and associate. The Company, its subsidiary companies and associate constitute the Group. The fi nancial statements have been prepared in conformity with generally accepted accounting principles to comply in all material respects with the notifi ed Accounting Standards (‘AS’) under Companies Accounting Standard Rules, 2006, as amended, the relevant provisions of the Companies Act, 1956 (‘the Act’) and the guidelines issued by the Reserve Bank of India (‘RBI’) as applicable to a Non Banking Finance Company (‘NBFC’). The fi nancial statements have been prepared under the historical cost convention on an accrual basis.
(b) Basis of consolidation
(i) The fi nancial statements of the subsidiary companies and associate used in the consolidation are drawn up to the same reporting date as of the Company i.e. year ended March 31, 2011 and are prepared based on the accounting policies consistent with those used by the Company.
(ii) The fi nancial statements of the Group have been prepared in accordance with the Accounting Standard 21- ‘Consolidated Financial Statements’ and Accounting Standard 23 – ‘Accounting for investments in Associates’ in Consolidated Financial Statements, notifi ed under the Companies (Accounting Standards) Rules, 2006, as amended and other generally accepted accounting principles in India.
(iii) The consolidated fi nancial statements have been prepared on the following basis :
1. The fi nancial statements of the company and its subsidiary companies have been combined on a line-by-line basis by adding together like items of assets, liabilities, income and expenses. The intra-group balances and intra-group transactions and unrealised profi ts or losses have been fully eliminated.
2. The consolidated fi nancial statements include the share of profi t / loss of the associate company which has been accounted as per the ‘Equity method’, and accordingly, the share of profi t / loss of the associate company (the loss being restricted to the cost of investment) has been added to / deducted from the cost of investments. An Associate is an enterprise in which the investor has signifi cant infl uence and which is neither a Subsidiary nor a Joint Venture of the Investor.
3. The excess of cost to the Company of its investments in the subsidiary companies over its share of equity of the subsidiary companies, at the dates on which the investments in the subsidiary companies are made, is recognised as ‘Goodwill’ being an asset in the consolidated fi nancial statements. Alternatively, where the share of equity in the subsidiary companies as on the date of investment is in excess of cost of investment of the Company, it is recognised as ‘Capital Reserve’ and shown under the head ‘Reserves and Surplus’, in the consolidated fi nancial statements.
4. Minority interest, if any, in the net assets of consolidated subsidiaries consists of the amount of equity attributable to the minority shareholders at the dates on which investments are made by the Company in the subsidiary companies and further movements in their share in the equity, subsequent to the dates of investments as stated above.
(iv) The following subsidiary companies are considered in the consolidated fi nancial statements:
Sr. No.
Name of the Subsidiary CompanyCountry of
incorporation
Share of ownership interest as at
March 31, 2011
Share of ownership interest as at
March 31, 2010 1. Shriram Asset and Equipment Finance Private Limited (From
June 04, 2009 to December 14, 2009)India - -
2. Shriram Equipment Finance Company Limited (w.e.f. December 15, 2009)
India 100% 100%
3. Shriram Automall India Limited (w.e.f. February 11, 2010) India 100% 100%
(v) The details of associate company are as follows :
Sr. No.
Name of the Associate CompanyCountry of
incorporation
Share of ownership interest as at
March 31, 2011
Share of ownership interest as at
March 31, 20101. Shriram Asset Management Company Limited India 40.00% 40.00%
Schedules forming part of the Consolidated Balance Sheet and Profi t and Loss account
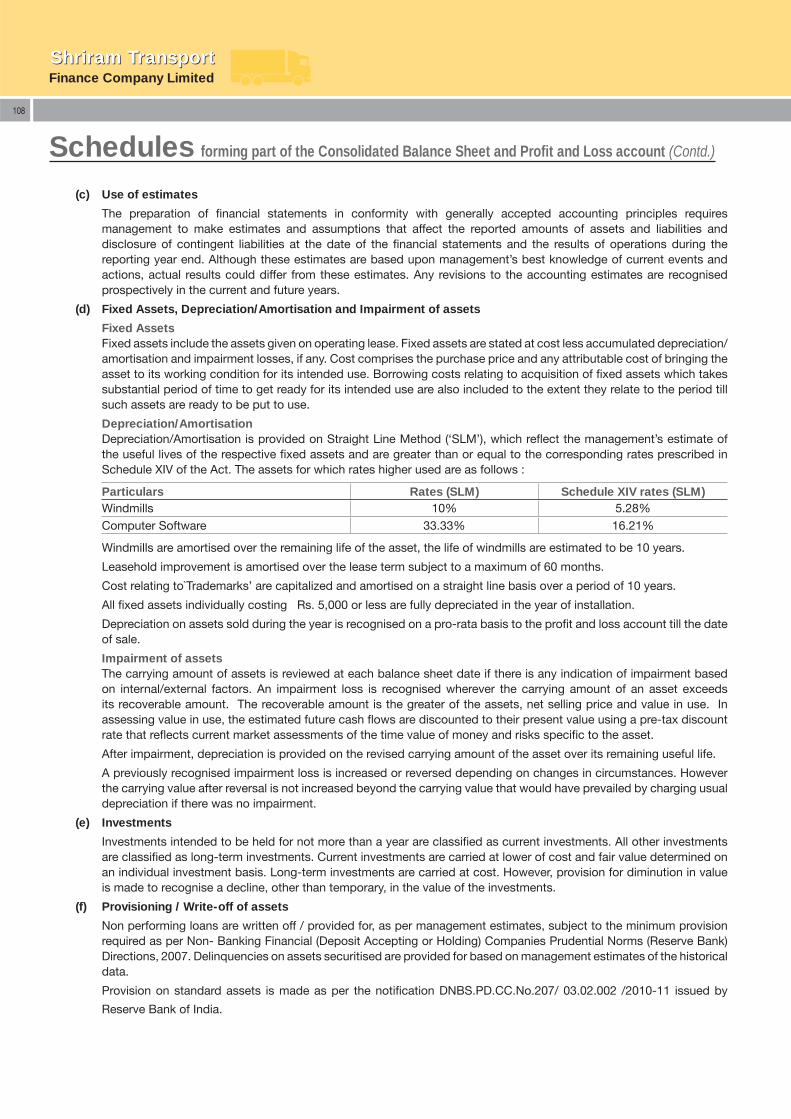
Finance Company LimitedShriram TransportShriram Transport
108
(c) Use of estimates
The preparation of fi nancial statements in conformity with generally accepted accounting principles requires management to make estimates and assumptions that affect the reported amounts of assets and liabilities and disclosure of contingent liabilities at the date of the fi nancial statements and the results of operations during the reporting year end. Although these estimates are based upon management’s best knowledge of current events and actions, actual results could differ from these estimates. Any revisions to the accounting estimates are recognised prospectively in the current and future years.
(d) Fixed Assets, Depreciation/Amortisation and Impairment of assets
Fixed Assets Fixed assets include the assets given on operating lease. Fixed assets are stated at cost less accumulated depreciation/
amortisation and impairment losses, if any. Cost comprises the purchase price and any attributable cost of bringing the asset to its working condition for its intended use. Borrowing costs relating to acquisition of fi xed assets which takes substantial period of time to get ready for its intended use are also included to the extent they relate to the period till such assets are ready to be put to use.
Depreciation/Amortisation Depreciation/Amortisation is provided on Straight Line Method (‘SLM’), which refl ect the management’s estimate of
the useful lives of the respective fi xed assets and are greater than or equal to the corresponding rates prescribed in Schedule XIV of the Act. The assets for which rates higher used are as follows :
Particulars Rates (SLM) Schedule XIV rates (SLM)Windmills 10% 5.28%Computer Software 33.33% 16.21%
Windmills are amortised over the remaining life of the asset, the life of windmills are estimated to be 10 years.
Leasehold improvement is amortised over the lease term subject to a maximum of 60 months.
Cost relating to`Trademarks’ are capitalized and amortised on a straight line basis over a period of 10 years.
All fi xed assets individually costing Rs. 5,000 or less are fully depreciated in the year of installation.
Depreciation on assets sold during the year is recognised on a pro-rata basis to the profi t and loss account till the date of sale.
Impairment of assets The carrying amount of assets is reviewed at each balance sheet date if there is any indication of impairment based
on internal/external factors. An impairment loss is recognised wherever the carrying amount of an asset exceeds its recoverable amount. The recoverable amount is the greater of the assets, net selling price and value in use. In assessing value in use, the estimated future cash fl ows are discounted to their present value using a pre-tax discount rate that refl ects current market assessments of the time value of money and risks specifi c to the asset.
After impairment, depreciation is provided on the revised carrying amount of the asset over its remaining useful life.
A previously recognised impairment loss is increased or reversed depending on changes in circumstances. However the carrying value after reversal is not increased beyond the carrying value that would have prevailed by charging usual depreciation if there was no impairment.
(e) Investments
Investments intended to be held for not more than a year are classifi ed as current investments. All other investments are classifi ed as long-term investments. Current investments are carried at lower of cost and fair value determined on an individual investment basis. Long-term investments are carried at cost. However, provision for diminution in value is made to recognise a decline, other than temporary, in the value of the investments.
(f) Provisioning / Write-off of assets
Non performing loans are written off / provided for, as per management estimates, subject to the minimum provision required as per Non- Banking Financial (Deposit Accepting or Holding) Companies Prudential Norms (Reserve Bank) Directions, 2007. Delinquencies on assets securitised are provided for based on management estimates of the historical data.
Provision on standard assets is made as per the notifi cation DNBS.PD.CC.No.207/ 03.02.002 /2010-11 issued by
Reserve Bank of India.
Schedules forming part of the Consolidated Balance Sheet and Profi t and Loss account (Contd.)
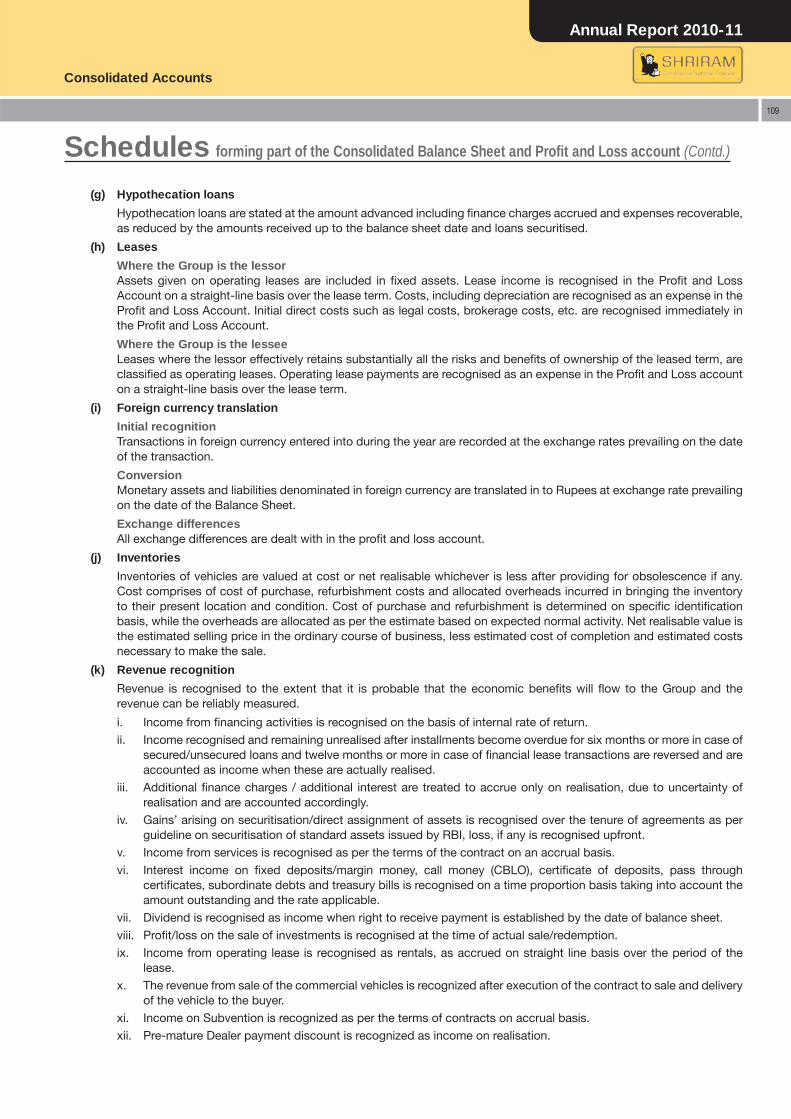
Annual Report 2010-11
Consolidated Accounts
109
(g) Hypothecation loans
Hypothecation loans are stated at the amount advanced including fi nance charges accrued and expenses recoverable, as reduced by the amounts received up to the balance sheet date and loans securitised.
(h) Leases
Where the Group is the lessor Assets given on operating leases are included in fi xed assets. Lease income is recognised in the Profi t and Loss
Account on a straight-line basis over the lease term. Costs, including depreciation are recognised as an expense in the Profi t and Loss Account. Initial direct costs such as legal costs, brokerage costs, etc. are recognised immediately in the Profi t and Loss Account.
Where the Group is the lessee Leases where the lessor effectively retains substantially all the risks and benefi ts of ownership of the leased term, are
classifi ed as operating leases. Operating lease payments are recognised as an expense in the Profi t and Loss account on a straight-line basis over the lease term.
(i) Foreign currency translation
Initial recognition Transactions in foreign currency entered into during the year are recorded at the exchange rates prevailing on the date
of the transaction.
Conversion Monetary assets and liabilities denominated in foreign currency are translated in to Rupees at exchange rate prevailing
on the date of the Balance Sheet.
Exchange differences All exchange differences are dealt with in the profi t and loss account.
(j) Inventories
Inventories of vehicles are valued at cost or net realisable whichever is less after providing for obsolescence if any. Cost comprises of cost of purchase, refurbishment costs and allocated overheads incurred in bringing the inventory to their present location and condition. Cost of purchase and refurbishment is determined on specifi c identifi cation basis, while the overheads are allocated as per the estimate based on expected normal activity. Net realisable value is the estimated selling price in the ordinary course of business, less estimated cost of completion and estimated costs necessary to make the sale.
(k) Revenue recognition
Revenue is recognised to the extent that it is probable that the economic benefi ts will fl ow to the Group and the revenue can be reliably measured.
i. Income from fi nancing activities is recognised on the basis of internal rate of return.
ii. Income recognised and remaining unrealised after installments become overdue for six months or more in case of secured/unsecured loans and twelve months or more in case of fi nancial lease transactions are reversed and are accounted as income when these are actually realised.
iii. Additional fi nance charges / additional interest are treated to accrue only on realisation, due to uncertainty of realisation and are accounted accordingly.
iv. Gains’ arising on securitisation/direct assignment of assets is recognised over the tenure of agreements as per guideline on securitisation of standard assets issued by RBI, loss, if any is recognised upfront.
v. Income from services is recognised as per the terms of the contract on an accrual basis.
vi. Interest income on fi xed deposits/margin money, call money (CBLO), certifi cate of deposits, pass through certifi cates, subordinate debts and treasury bills is recognised on a time proportion basis taking into account the amount outstanding and the rate applicable.
vii. Dividend is recognised as income when right to receive payment is established by the date of balance sheet.
viii. Profi t/loss on the sale of investments is recognised at the time of actual sale/redemption.
ix. Income from operating lease is recognised as rentals, as accrued on straight line basis over the period of the lease.
x. The revenue from sale of the commercial vehicles is recognized after execution of the contract to sale and delivery of the vehicle to the buyer.
xi. Income on Subvention is recognized as per the terms of contracts on accrual basis.
xii. Pre-mature Dealer payment discount is recognized as income on realisation.
Schedules forming part of the Consolidated Balance Sheet and Profi t and Loss account (Contd.)
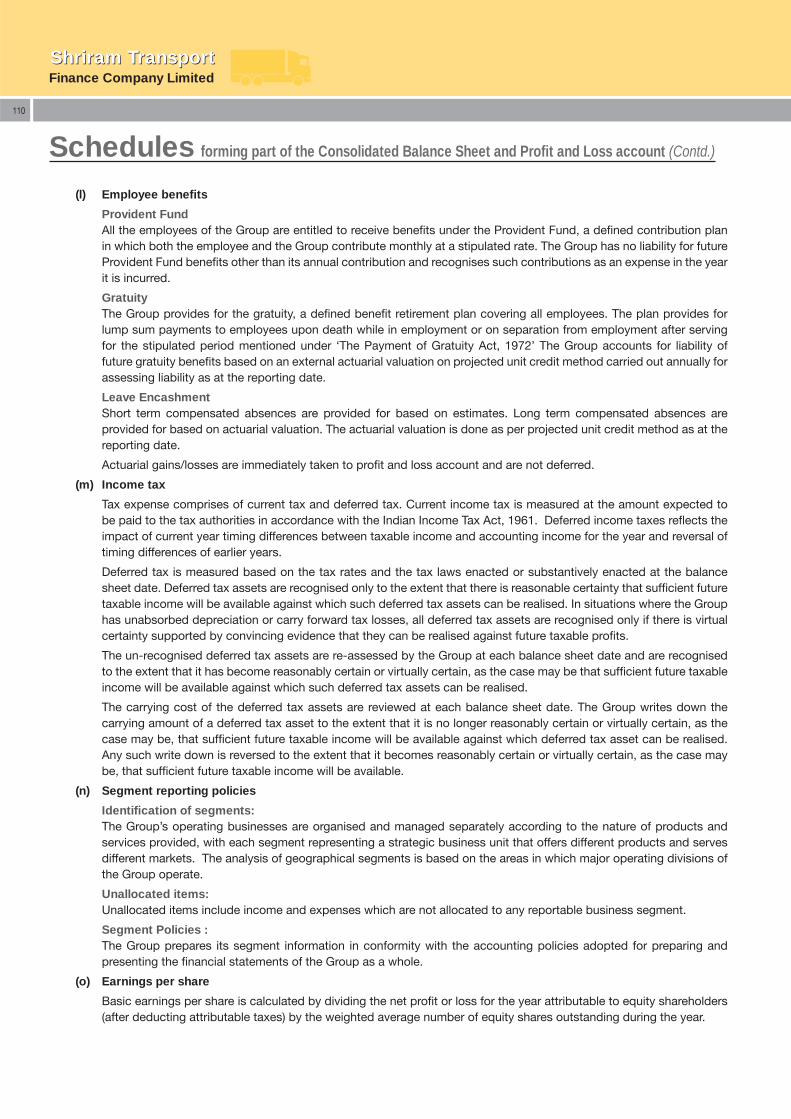
Finance Company LimitedShriram TransportShriram Transport
110
(l) Employee benefi ts
Provident Fund All the employees of the Group are entitled to receive benefi ts under the Provident Fund, a defi ned contribution plan
in which both the employee and the Group contribute monthly at a stipulated rate. The Group has no liability for future Provident Fund benefi ts other than its annual contribution and recognises such contributions as an expense in the year it is incurred.
Gratuity The Group provides for the gratuity, a defi ned benefi t retirement plan covering all employees. The plan provides for
lump sum payments to employees upon death while in employment or on separation from employment after serving for the stipulated period mentioned under ‘The Payment of Gratuity Act, 1972’ The Group accounts for liability of future gratuity benefi ts based on an external actuarial valuation on projected unit credit method carried out annually for assessing liability as at the reporting date.
Leave Encashment Short term compensated absences are provided for based on estimates. Long term compensated absences are
provided for based on actuarial valuation. The actuarial valuation is done as per projected unit credit method as at the reporting date.
Actuarial gains/losses are immediately taken to profi t and loss account and are not deferred.
(m) Income tax
Tax expense comprises of current tax and deferred tax. Current income tax is measured at the amount expected to be paid to the tax authorities in accordance with the Indian Income Tax Act, 1961. Deferred income taxes refl ects the impact of current year timing differences between taxable income and accounting income for the year and reversal of timing differences of earlier years.
Deferred tax is measured based on the tax rates and the tax laws enacted or substantively enacted at the balance sheet date. Deferred tax assets are recognised only to the extent that there is reasonable certainty that suffi cient future taxable income will be available against which such deferred tax assets can be realised. In situations where the Group has unabsorbed depreciation or carry forward tax losses, all deferred tax assets are recognised only if there is virtual certainty supported by convincing evidence that they can be realised against future taxable profi ts.
The un-recognised deferred tax assets are re-assessed by the Group at each balance sheet date and are recognised to the extent that it has become reasonably certain or virtually certain, as the case may be that suffi cient future taxable income will be available against which such deferred tax assets can be realised.
The carrying cost of the deferred tax assets are reviewed at each balance sheet date. The Group writes down the carrying amount of a deferred tax asset to the extent that it is no longer reasonably certain or virtually certain, as the case may be, that suffi cient future taxable income will be available against which deferred tax asset can be realised. Any such write down is reversed to the extent that it becomes reasonably certain or virtually certain, as the case may be, that suffi cient future taxable income will be available.
(n) Segment reporting policies
Identifi cation of segments: The Group’s operating businesses are organised and managed separately according to the nature of products and
services provided, with each segment representing a strategic business unit that offers different products and serves different markets. The analysis of geographical segments is based on the areas in which major operating divisions of the Group operate.
Unallocated items: Unallocated items include income and expenses which are not allocated to any reportable business segment.
Segment Policies : The Group prepares its segment information in conformity with the accounting policies adopted for preparing and
presenting the fi nancial statements of the Group as a whole.
(o) Earnings per share
Basic earnings per share is calculated by dividing the net profi t or loss for the year attributable to equity shareholders (after deducting attributable taxes) by the weighted average number of equity shares outstanding during the year.
Schedules forming part of the Consolidated Balance Sheet and Profi t and Loss account (Contd.)
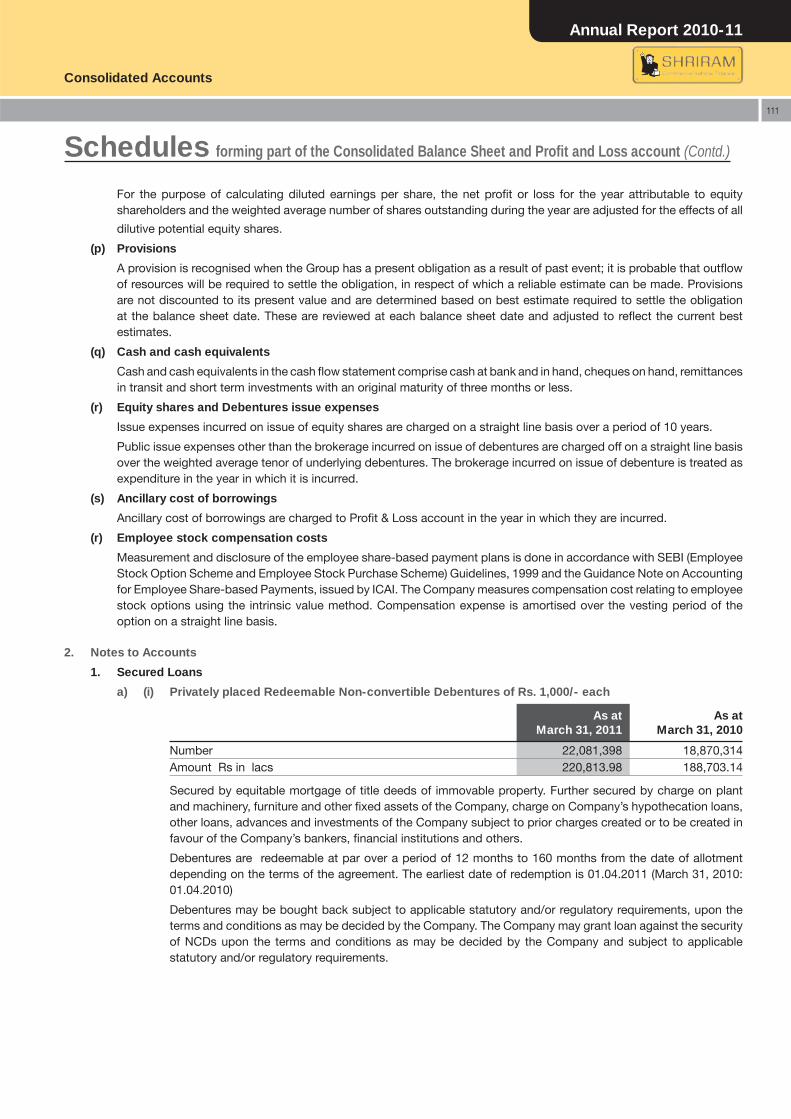
Annual Report 2010-11
Consolidated Accounts
111
For the purpose of calculating diluted earnings per share, the net profi t or loss for the year attributable to equity shareholders and the weighted average number of shares outstanding during the year are adjusted for the effects of all
dilutive potential equity shares.
(p) Provisions
A provision is recognised when the Group has a present obligation as a result of past event; it is probable that outfl ow of resources will be required to settle the obligation, in respect of which a reliable estimate can be made. Provisions are not discounted to its present value and are determined based on best estimate required to settle the obligation at the balance sheet date. These are reviewed at each balance sheet date and adjusted to refl ect the current best estimates.
(q) Cash and cash equivalents
Cash and cash equivalents in the cash fl ow statement comprise cash at bank and in hand, cheques on hand, remittances in transit and short term investments with an original maturity of three months or less.
(r) Equity shares and Debentures issue expenses
Issue expenses incurred on issue of equity shares are charged on a straight line basis over a period of 10 years.
Public issue expenses other than the brokerage incurred on issue of debentures are charged off on a straight line basis over the weighted average tenor of underlying debentures. The brokerage incurred on issue of debenture is treated as expenditure in the year in which it is incurred.
(s) Ancillary cost of borrowings
Ancillary cost of borrowings are charged to Profi t & Loss account in the year in which they are incurred.
(r) Employee stock compensation costs
Measurement and disclosure of the employee share-based payment plans is done in accordance with SEBI (Employee Stock Option Scheme and Employee Stock Purchase Scheme) Guidelines, 1999 and the Guidance Note on Accounting for Employee Share-based Payments, issued by ICAI. The Company measures compensation cost relating to employee stock options using the intrinsic value method. Compensation expense is amortised over the vesting period of the option on a straight line basis.
2. Notes to Accounts
1. Secured Loans
a) (i) Privately placed Redeemable Non-convertible Debentures of Rs. 1,000/- each
As atMarch 31, 2011
As atMarch 31, 2010
Number 22,081,398 18,870,314Amount Rs in lacs 220,813.98 188,703.14
Secured by equitable mortgage of title deeds of immovable property. Further secured by charge on plant and machinery, furniture and other fi xed assets of the Company, charge on Company’s hypothecation loans, other loans, advances and investments of the Company subject to prior charges created or to be created in favour of the Company’s bankers, fi nancial institutions and others.
Debentures are redeemable at par over a period of 12 months to 160 months from the date of allotment depending on the terms of the agreement. The earliest date of redemption is 01.04.2011 (March 31, 2010: 01.04.2010)
Debentures may be bought back subject to applicable statutory and/or regulatory requirements, upon the terms and conditions as may be decided by the Company. The Company may grant loan against the security of NCDs upon the terms and conditions as may be decided by the Company and subject to applicable statutory and/or regulatory requirements.
Schedules forming part of the Consolidated Balance Sheet and Profi t and Loss account (Contd.)
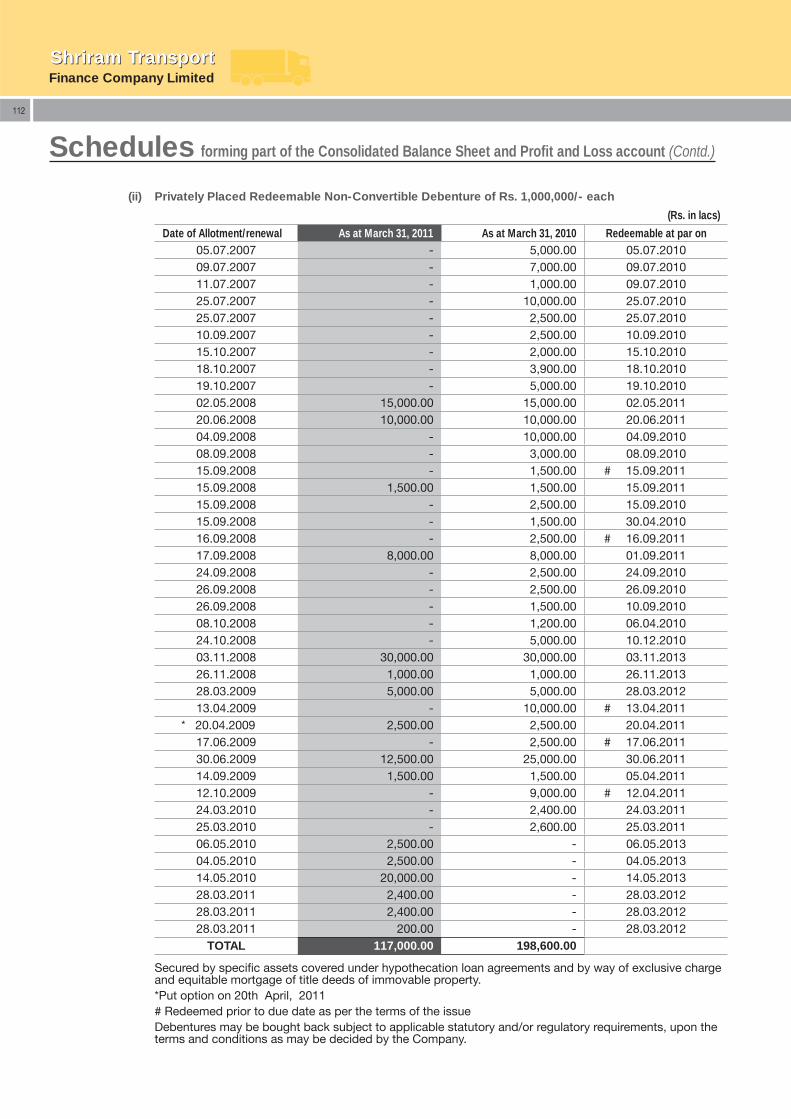
Finance Company LimitedShriram TransportShriram Transport
112
(ii) Privately Placed Redeemable Non-Convertible Debenture of Rs. 1,000,000/- each
(Rs. in lacs)
Date of Allotment/renewal As at March 31, 2011 As at March 31, 2010 Redeemable at par on05.07.2007 - 5,000.00 05.07.201009.07.2007 - 7,000.00 09.07.201011.07.2007 - 1,000.00 09.07.201025.07.2007 - 10,000.00 25.07.201025.07.2007 - 2,500.00 25.07.201010.09.2007 - 2,500.00 10.09.201015.10.2007 - 2,000.00 15.10.201018.10.2007 - 3,900.00 18.10.201019.10.2007 - 5,000.00 19.10.201002.05.2008 15,000.00 15,000.00 02.05.201120.06.2008 10,000.00 10,000.00 20.06.201104.09.2008 - 10,000.00 04.09.201008.09.2008 - 3,000.00 08.09.201015.09.2008 - 1,500.00 # 15.09.201115.09.2008 1,500.00 1,500.00 15.09.201115.09.2008 - 2,500.00 15.09.201015.09.2008 - 1,500.00 30.04.201016.09.2008 - 2,500.00 # 16.09.201117.09.2008 8,000.00 8,000.00 01.09.201124.09.2008 - 2,500.00 24.09.201026.09.2008 - 2,500.00 26.09.201026.09.2008 - 1,500.00 10.09.201008.10.2008 - 1,200.00 06.04.201024.10.2008 - 5,000.00 10.12.201003.11.2008 30,000.00 30,000.00 03.11.201326.11.2008 1,000.00 1,000.00 26.11.201328.03.2009 5,000.00 5,000.00 28.03.201213.04.2009 - 10,000.00 # 13.04.2011
* 20.04.2009 2,500.00 2,500.00 20.04.201117.06.2009 - 2,500.00 # 17.06.201130.06.2009 12,500.00 25,000.00 30.06.201114.09.2009 1,500.00 1,500.00 05.04.201112.10.2009 - 9,000.00 # 12.04.201124.03.2010 - 2,400.00 24.03.201125.03.2010 - 2,600.00 25.03.201106.05.2010 2,500.00 - 06.05.201304.05.2010 2,500.00 - 04.05.201314.05.2010 20,000.00 - 14.05.201328.03.2011 2,400.00 - 28.03.201228.03.2011 2,400.00 - 28.03.201228.03.2011 200.00 - 28.03.2012
TOTAL 117,000.00 198,600.00
Secured by specifi c assets covered under hypothecation loan agreements and by way of exclusive charge and equitable mortgage of title deeds of immovable property.*Put option on 20th April, 2011# Redeemed prior to due date as per the terms of the issueDebentures may be bought back subject to applicable statutory and/or regulatory requirements, upon the terms and conditions as may be decided by the Company.
Schedules forming part of the Consolidated Balance Sheet and Profi t and Loss account (Contd.)
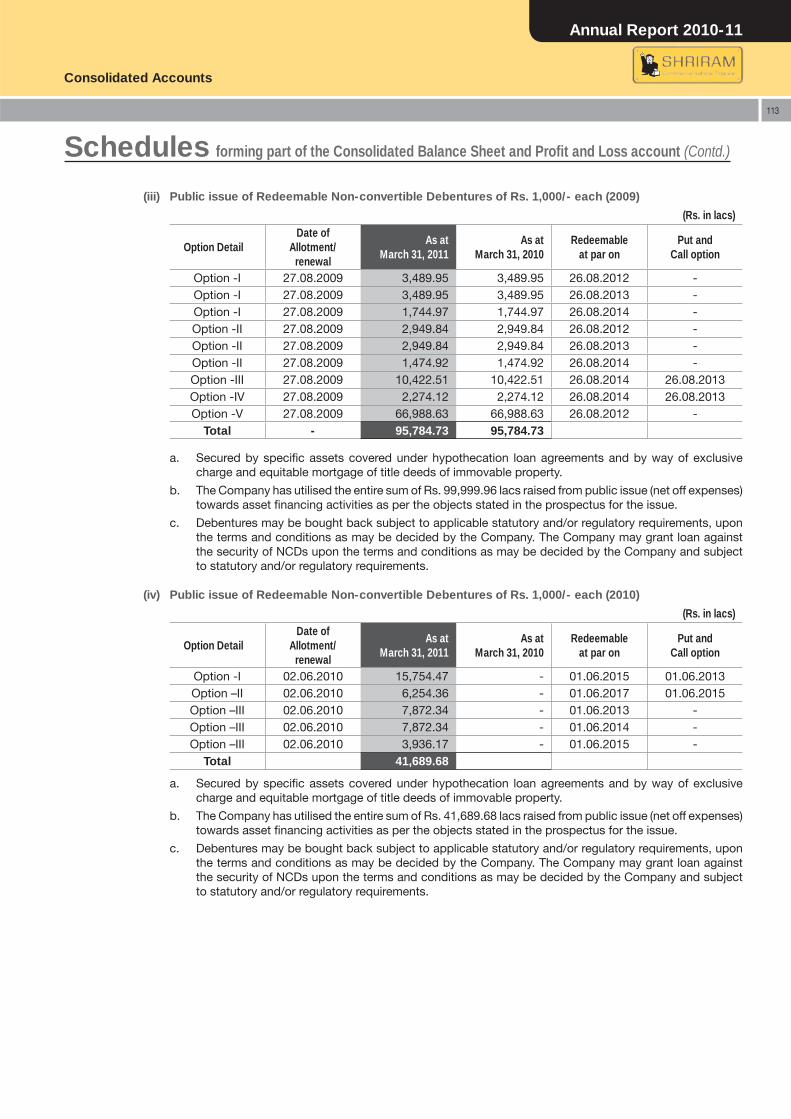
Annual Report 2010-11
Consolidated Accounts
113
(iii) Public issue of Redeemable Non-convertible Debentures of Rs. 1,000/- each (2009)
(Rs. in lacs)
Option DetailDate of
Allotment/ renewal
As at March 31, 2011
As at March 31, 2010
Redeemable at par on
Put andCall option
Option -I 27.08.2009 3,489.95 3,489.95 26.08.2012 -Option -I 27.08.2009 3,489.95 3,489.95 26.08.2013 -Option -I 27.08.2009 1,744.97 1,744.97 26.08.2014 -Option -II 27.08.2009 2,949.84 2,949.84 26.08.2012 -Option -II 27.08.2009 2,949.84 2,949.84 26.08.2013 -Option -II 27.08.2009 1,474.92 1,474.92 26.08.2014 -Option -III 27.08.2009 10,422.51 10,422.51 26.08.2014 26.08.2013Option -IV 27.08.2009 2,274.12 2,274.12 26.08.2014 26.08.2013Option -V 27.08.2009 66,988.63 66,988.63 26.08.2012 -
Total - 95,784.73 95,784.73
a. Secured by specifi c assets covered under hypothecation loan agreements and by way of exclusive charge and equitable mortgage of title deeds of immovable property.
b. The Company has utilised the entire sum of Rs. 99,999.96 lacs raised from public issue (net off expenses) towards asset fi nancing activities as per the objects stated in the prospectus for the issue.
c. Debentures may be bought back subject to applicable statutory and/or regulatory requirements, upon the terms and conditions as may be decided by the Company. The Company may grant loan against the security of NCDs upon the terms and conditions as may be decided by the Company and subject to statutory and/or regulatory requirements.
(iv) Public issue of Redeemable Non-convertible Debentures of Rs. 1,000/- each (2010)
(Rs. in lacs)
Option DetailDate of
Allotment/ renewal
As at March 31, 2011
As at March 31, 2010
Redeemable at par on
Put andCall option
Option -I 02.06.2010 15,754.47 - 01.06.2015 01.06.2013Option –II 02.06.2010 6,254.36 - 01.06.2017 01.06.2015Option –III 02.06.2010 7,872.34 - 01.06.2013 -Option –III 02.06.2010 7,872.34 - 01.06.2014 -Option –III 02.06.2010 3,936.17 - 01.06.2015 -
Total 41,689.68
a. Secured by specifi c assets covered under hypothecation loan agreements and by way of exclusive charge and equitable mortgage of title deeds of immovable property.
b. The Company has utilised the entire sum of Rs. 41,689.68 lacs raised from public issue (net off expenses) towards asset fi nancing activities as per the objects stated in the prospectus for the issue.
c. Debentures may be bought back subject to applicable statutory and/or regulatory requirements, upon the terms and conditions as may be decided by the Company. The Company may grant loan against the security of NCDs upon the terms and conditions as may be decided by the Company and subject to statutory and/or regulatory requirements.
Schedules forming part of the Consolidated Balance Sheet and Profi t and Loss account (Contd.)
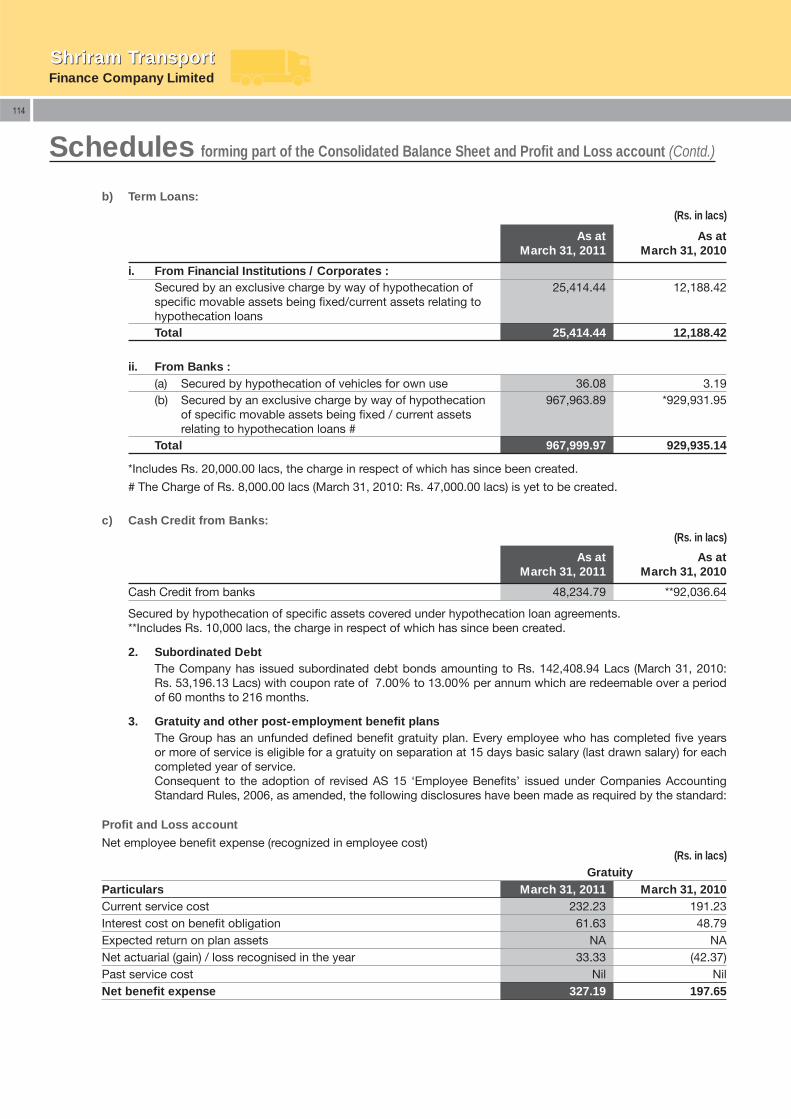
Finance Company LimitedShriram TransportShriram Transport
114
b) Term Loans:
(Rs. in lacs)
As atMarch 31, 2011
As atMarch 31, 2010
i. From Financial Institutions / Corporates : Secured by an exclusive charge by way of hypothecation of specifi c movable assets being fi xed/current assets relating to hypothecation loans
25,414.44 12,188.42
Total 25,414.44 12,188.42
ii. From Banks : (a) Secured by hypothecation of vehicles for own use 36.08 3.19(b) Secured by an exclusive charge by way of hypothecation
of specifi c movable assets being fi xed / current assets relating to hypothecation loans #
967,963.89 *929,931.95
Total 967,999.97 929,935.14
*Includes Rs. 20,000.00 lacs, the charge in respect of which has since been created.
# The Charge of Rs. 8,000.00 lacs (March 31, 2010: Rs. 47,000.00 lacs) is yet to be created.
c) Cash Credit from Banks:(Rs. in lacs)
As atMarch 31, 2011
As atMarch 31, 2010
Cash Credit from banks 48,234.79 **92,036.64
Secured by hypothecation of specifi c assets covered under hypothecation loan agreements.**Includes Rs. 10,000 lacs, the charge in respect of which has since been created.
2. Subordinated DebtThe Company has issued subordinated debt bonds amounting to Rs. 142,408.94 Lacs (March 31, 2010: Rs. 53,196.13 Lacs) with coupon rate of 7.00% to 13.00% per annum which are redeemable over a period of 60 months to 216 months.
3. Gratuity and other post-employment benefi t plansThe Group has an unfunded defi ned benefi t gratuity plan. Every employee who has completed fi ve years or more of service is eligible for a gratuity on separation at 15 days basic salary (last drawn salary) for each completed year of service.Consequent to the adoption of revised AS 15 ‘Employee Benefi ts’ issued under Companies Accounting Standard Rules, 2006, as amended, the following disclosures have been made as required by the standard:
Profi t and Loss account
Net employee benefi t expense (recognized in employee cost)(Rs. in lacs)
GratuityParticulars March 31, 2011 March 31, 2010 Current service cost 232.23 191.23Interest cost on benefi t obligation 61.63 48.79Expected return on plan assets NA NANet actuarial (gain) / loss recognised in the year 33.33 (42.37)Past service cost Nil NilNet benefi t expense 327.19 197.65
Schedules forming part of the Consolidated Balance Sheet and Profi t and Loss account (Contd.)
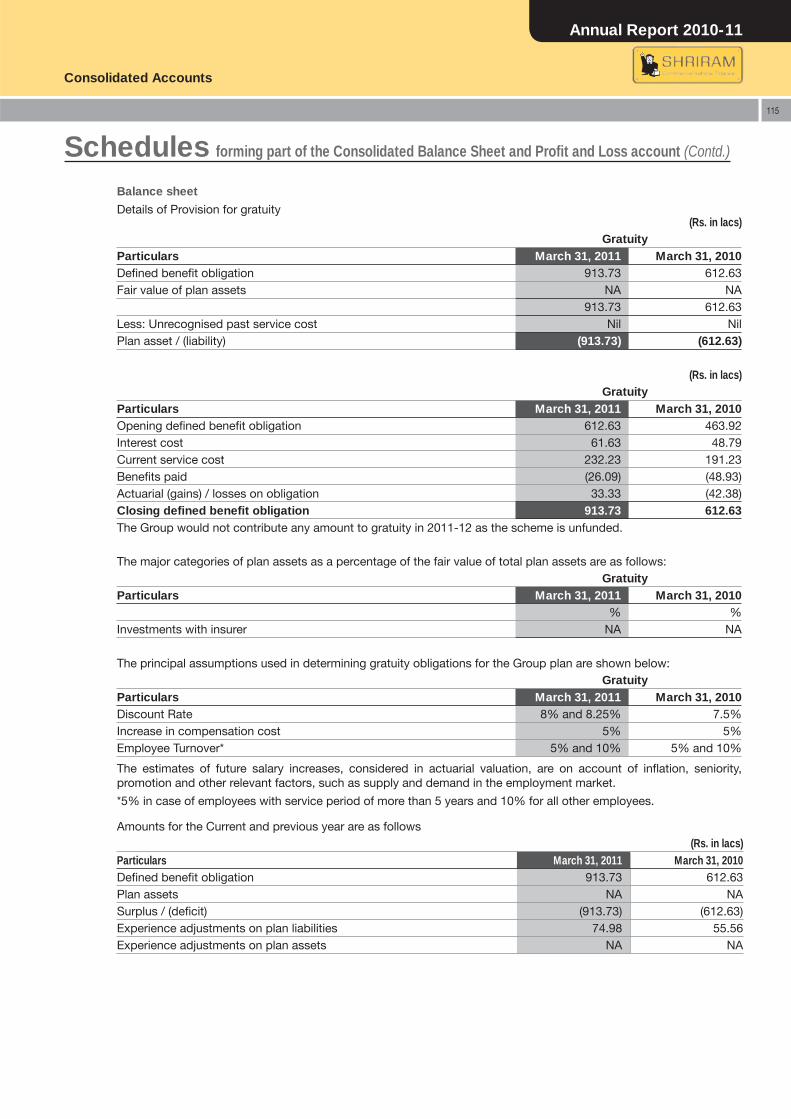
Annual Report 2010-11
Consolidated Accounts
115
Balance sheet
Details of Provision for gratuity(Rs. in lacs)
GratuityParticulars March 31, 2011 March 31, 2010 Defi ned benefi t obligation 913.73 612.63Fair value of plan assets NA NA
913.73 612.63Less: Unrecognised past service cost Nil NilPlan asset / (liability) (913.73) (612.63)
(Rs. in lacs)Gratuity
Particulars March 31, 2011 March 31, 2010 Opening defi ned benefi t obligation 612.63 463.92Interest cost 61.63 48.79Current service cost 232.23 191.23Benefi ts paid (26.09) (48.93)Actuarial (gains) / losses on obligation 33.33 (42.38)Closing defi ned benefi t obligation 913.73 612.63The Group would not contribute any amount to gratuity in 2011-12 as the scheme is unfunded.
The major categories of plan assets as a percentage of the fair value of total plan assets are as follows:Gratuity
Particulars March 31, 2011 March 31, 2010 % %
Investments with insurer NA NA
The principal assumptions used in determining gratuity obligations for the Group plan are shown below:Gratuity
Particulars March 31, 2011 March 31, 2010 Discount Rate 8% and 8.25% 7.5% Increase in compensation cost 5% 5%Employee Turnover* 5% and 10% 5% and 10%
The estimates of future salary increases, considered in actuarial valuation, are on account of infl ation, seniority, promotion and other relevant factors, such as supply and demand in the employment market.
*5% in case of employees with service period of more than 5 years and 10% for all other employees.
Amounts for the Current and previous year are as follows(Rs. in lacs)
Particulars March 31, 2011 March 31, 2010 Defi ned benefi t obligation 913.73 612.63Plan assets NA NASurplus / (defi cit) (913.73) (612.63)Experience adjustments on plan liabilities 74.98 55.56Experience adjustments on plan assets NA NA
Schedules forming part of the Consolidated Balance Sheet and Profi t and Loss account (Contd.)
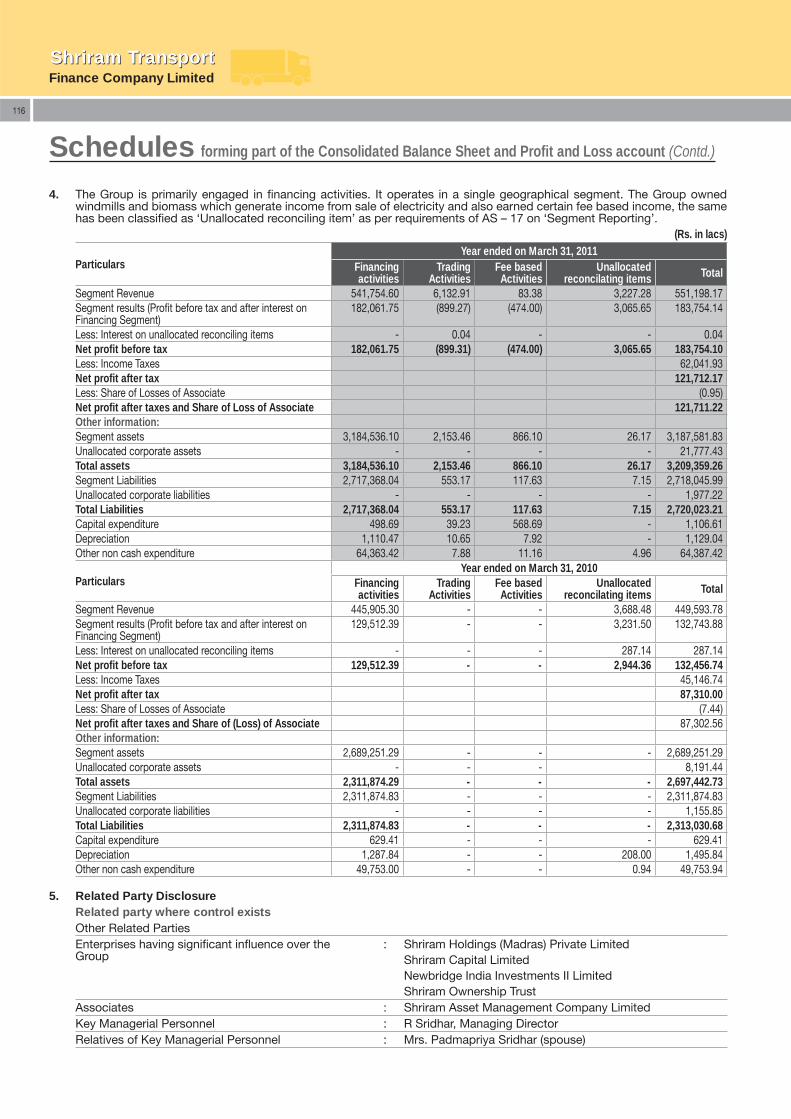
Finance Company LimitedShriram TransportShriram Transport
116
4. The Group is primarily engaged in fi nancing activities. It operates in a single geographical segment. The Group owned windmills and biomass which generate income from sale of electricity and also earned certain fee based income, the same has been classifi ed as ‘Unallocated reconciling item’ as per requirements of AS – 17 on ‘Segment Reporting’.
(Rs. in lacs)
ParticularsYear ended on March 31, 2011
Financing activities
Trading Activities
Fee based Activities
Unallocated reconcilating items Total
Segment Revenue 541,754.60 6,132.91 83.38 3,227.28 551,198.17Segment results (Profi t before tax and after interest on Financing Segment)
182,061.75 (899.27) (474.00) 3,065.65 183,754.14
Less: Interest on unallocated reconciling items - 0.04 - - 0.04Net profi t before tax 182,061.75 (899.31) (474.00) 3,065.65 183,754.10Less: Income Taxes 62,041.93Net profi t after tax 121,712.17Less: Share of Losses of Associate (0.95)Net profi t after taxes and Share of Loss of Associate 121,711.22Other information:Segment assets 3,184,536.10 2,153.46 866.10 26.17 3,187,581.83Unallocated corporate assets - - - - 21,777.43Total assets 3,184,536.10 2,153.46 866.10 26.17 3,209,359.26Segment Liabilities 2,717,368.04 553.17 117.63 7.15 2,718,045.99 Unallocated corporate liabilities - - - - 1,977.22Total Liabilities 2,717,368.04 553.17 117.63 7.15 2,720,023.21 Capital expenditure 498.69 39.23 568.69 - 1,106.61Depreciation 1,110.47 10.65 7.92 - 1,129.04Other non cash expenditure 64,363.42 7.88 11.16 4.96 64,387.42
ParticularsYear ended on March 31, 2010
Financing activities
Trading Activities
Fee based Activities
Unallocated reconcilating items Total
Segment Revenue 445,905.30 - - 3,688.48 449,593.78Segment results (Profi t before tax and after interest on Financing Segment)
129,512.39 - - 3,231.50 132,743.88
Less: Interest on unallocated reconciling items - - - 287.14 287.14Net profi t before tax 129,512.39 - - 2,944.36 132,456.74Less: Income Taxes 45,146.74Net profi t after tax 87,310.00Less: Share of Losses of Associate (7.44) Net profi t after taxes and Share of (Loss) of Associate 87,302.56 Other information:Segment assets 2,689,251.29 - - - 2,689,251.29Unallocated corporate assets - - - 8,191.44Total assets 2,311,874.29 - - - 2,697,442.73Segment Liabilities 2,311,874.83 - - - 2,311,874.83Unallocated corporate liabilities - - - - 1,155.85Total Liabilities 2,311,874.83 - - - 2,313,030.68Capital expenditure 629.41 - - - 629.41Depreciation 1,287.84 - - 208.00 1,495.84Other non cash expenditure 49,753.00 - - 0.94 49,753.94
5. Related Party Disclosure Related party where control existsOther Related PartiesEnterprises having signifi cant infl uence over the Group
: Shriram Holdings (Madras) Private LimitedShriram Capital Limited Newbridge India Investments II LimitedShriram Ownership Trust
Associates : Shriram Asset Management Company LimitedKey Managerial Personnel : R Sridhar, Managing DirectorRelatives of Key Managerial Personnel : Mrs. Padmapriya Sridhar (spouse)
Schedules forming part of the Consolidated Balance Sheet and Profi t and Loss account (Contd.)
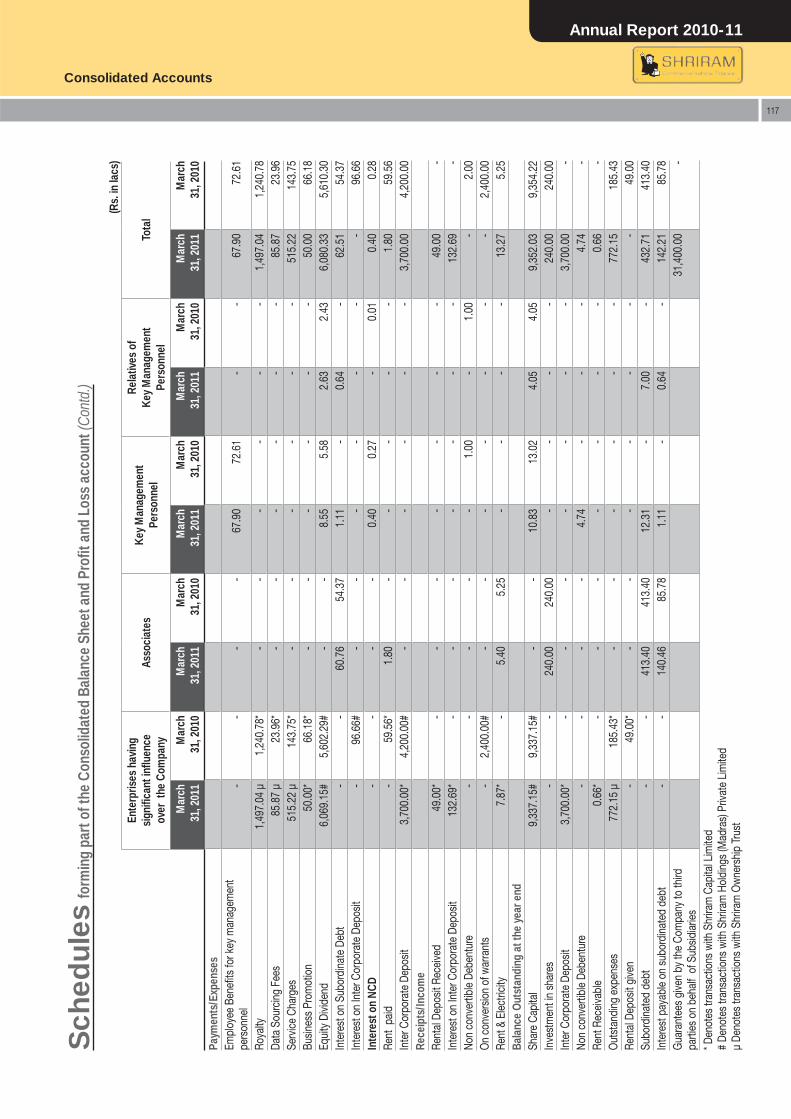
Annual Report 2010-11
Consolidated Accounts
117
Sch
edul
es fo
rmin
g pa
rt of
the
Cons
olid
ated
Bal
ance
She
et a
nd P
rofi t
and
Los
s ac
coun
t (Co
ntd.
)
(Rs.
in la
cs)
Ente
rpris
es h
avin
g si
gnifi
cant
infl u
ence
ov
er t
he C
ompa
nyAs
soci
ates
Key
Man
agem
ent
Pers
onne
l
Rela
tives
of
Key
Man
agem
ent
Pers
onne
lTo
tal
M
arch
31
, 201
1 M
arch
31
, 201
0M
arch
31
, 201
1 M
arch
31
, 201
0M
arch
31
, 201
1 M
arch
31
, 201
0M
arch
31
, 201
1 M
arch
31
, 201
0M
arch
31
, 201
1 M
arch
31
, 201
0
Paym
ents
/Exp
ense
sEm
ploy
ee B
enefi
ts fo
r key
man
agem
ent
pers
onne
l
- -
--
67.9
072
.61
-
-
67.9
0
72.6
1
Roya
lty1,
497.
04 μ
1,24
0.78
*-
--
-
- -
1
,497
.04
1
,240
.78
Data
Sou
rcin
g Fe
es85
.87 μ
23.9
6*-
--
-
- -
85
.87
23
.96
Serv
ice
Char
ges
515.
22 μ
143.
75*
--
--
-
-
5
15.2
2
1
43.7
5 Bu
sines
s Pr
omot
ion
5
0.00
* 66
.18*
--
--
-
-
50.0
0
66.1
8 Eq
uity
Divi
dend
6
,069
.15#
5,
602.
29#
--
8.55
5.58
2.63
2.
436,
080.
33
5,6
10.3
0 In
tere
st o
n Su
bord
inat
e De
bt
- -
60.7
654
.37
1.11
-
0.
64
-62
.51
54
.37
Inte
rest
on
Inte
r Cor
pora
te D
epos
it
- 96
.66#
--
--
-
-
-
96.6
6 In
tere
st o
n NC
D
- -
--
0.40
0.27
-
0.01
0
.40
0
.28
Rent
pai
d
- 59
.56*
1.80
--
-
- -
1.8
0
59
.56
Inte
r Cor
pora
te D
epos
it
3,7
00.0
0*
4,20
0.00
#-
--
-
- -
3
,700
.00
4
,200
.00
Rece
ipts
/Inco
me
Rent
al D
epos
it Re
ceive
d
49.
00*
--
--
-
- -
49
.00
-
Inte
rest
on
Inte
r Cor
pora
te D
epos
it
1
32.6
9*
--
--
-
- -
132
.69
-
Non
conv
ertib
le D
eben
ture
-
--
--
1.00
-
1.00
-
2
.00
On
conv
ersio
n of
war
rant
s
- 2,
400.
00#
--
--
-
-
-
2
,400
.00
Rent
& E
lect
ricity
7.87
* -
5.40
5.25
--
-
-
13.
27
5
.25
Bala
nce
Out
stan
ding
at t
he y
ear e
nd
Sh
are
Capi
tal
9,33
7.15
# 9,
337.
15#
--
10.8
313
.02
4.05
4.
05
9,3
52.0
3
9,3
54.2
2 In
vest
men
t in
shar
es
- -
240.
0024
0.00
--
-
-24
0.00
2
40.0
0 In
ter C
orpo
rate
Dep
osit
3,70
0.00
* -
--
--
-
-
3,7
00.0
0
- No
n co
nver
tible
Deb
entu
re
- -
--
4.74
-
- -
4.74
- Re
nt R
ecei
vabl
e
0.
66*
--
--
-
- -
0
.66
-
Out
stan
ding
exp
ense
s
7
72.1
5 μ
185.
43*
--
--
-
-
7
72.1
5
1
85.4
3 Re
ntal
Dep
osit
give
n
- 49
.00*
--
--
-
-
-
49.0
0 Su
bord
inat
ed d
ebt
-
-41
3.40
413.
4012
.31
-7.
00
-43
2.71
413
.40
Inte
rest
pay
able
on
subo
rdin
ated
deb
t
- -
140.
4685
.78
1.11
-0.
64
-
1
42.2
1 85
.78
Gua
rant
ees
give
n by
the
Com
pany
to th
ird
parti
es o
n be
half
of S
ubsid
iarie
s31
,400
.00
-
* Den
otes
tran
sact
ions
with
Shr
iram
Cap
ital L
imite
d#
Deno
tes
trans
actio
ns w
ith S
hrira
m H
oldi
ngs
(Mad
ras)
Priv
ate
Lim
ited
μ De
note
s tra
nsac
tions
with
Shr
iram
Ow
ners
hip
Trus
t
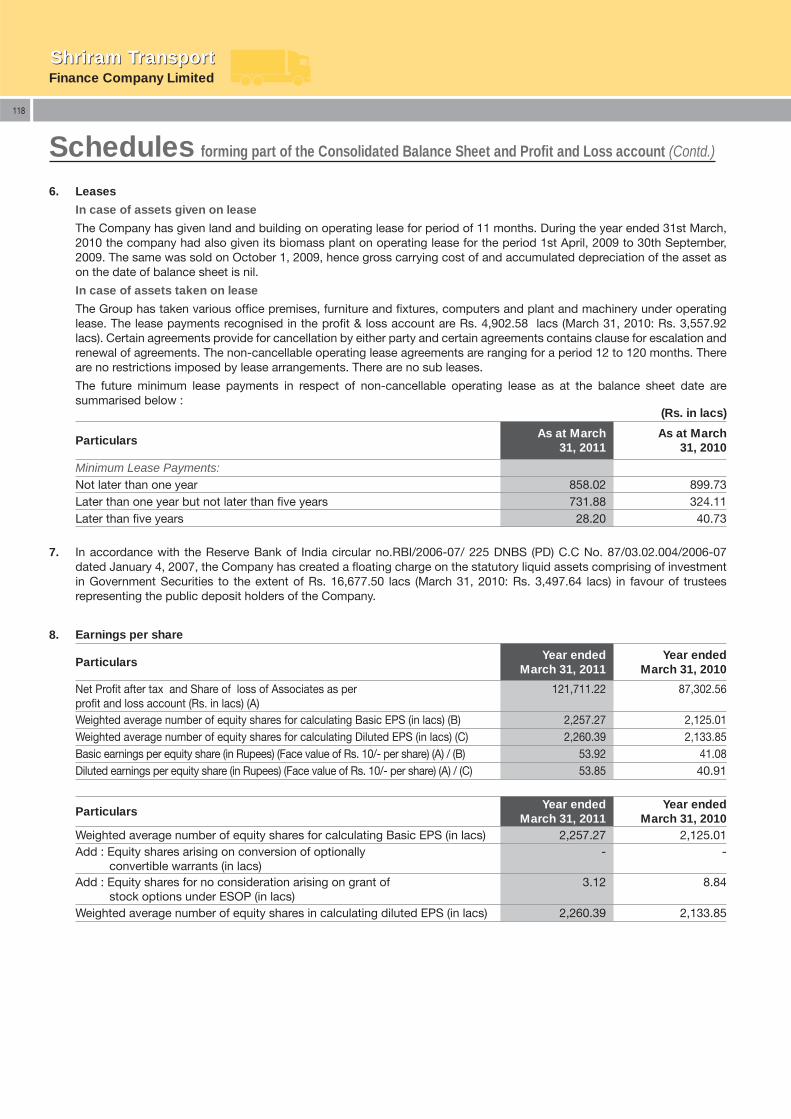
Finance Company LimitedShriram TransportShriram Transport
118
6. Leases
In case of assets given on lease
The Company has given land and building on operating lease for period of 11 months. During the year ended 31st March, 2010 the company had also given its biomass plant on operating lease for the period 1st April, 2009 to 30th September, 2009. The same was sold on October 1, 2009, hence gross carrying cost of and accumulated depreciation of the asset as on the date of balance sheet is nil.
In case of assets taken on lease
The Group has taken various offi ce premises, furniture and fi xtures, computers and plant and machinery under operating lease. The lease payments recognised in the profi t & loss account are Rs. 4,902.58 lacs (March 31, 2010: Rs. 3,557.92 lacs). Certain agreements provide for cancellation by either party and certain agreements contains clause for escalation and renewal of agreements. The non-cancellable operating lease agreements are ranging for a period 12 to 120 months. There are no restrictions imposed by lease arrangements. There are no sub leases.
The future minimum lease payments in respect of non-cancellable operating lease as at the balance sheet date are summarised below :
(Rs. in lacs)
ParticularsAs at March
31, 2011As at March
31, 2010
Minimum Lease Payments:Not later than one year 858.02 899.73Later than one year but not later than fi ve years 731.88 324.11Later than fi ve years 28.20 40.73
7. In accordance with the Reserve Bank of India circular no.RBI/2006-07/ 225 DNBS (PD) C.C No. 87/03.02.004/2006-07 dated January 4, 2007, the Company has created a fl oating charge on the statutory liquid assets comprising of investment in Government Securities to the extent of Rs. 16,677.50 lacs (March 31, 2010: Rs. 3,497.64 lacs) in favour of trustees representing the public deposit holders of the Company.
8. Earnings per share
ParticularsYear ended
March 31, 2011Year ended
March 31, 2010
Net Profi t after tax and Share of loss of Associates as per profi t and loss account (Rs. in lacs) (A)
121,711.22 87,302.56
Weighted average number of equity shares for calculating Basic EPS (in lacs) (B) 2,257.27 2,125.01Weighted average number of equity shares for calculating Diluted EPS (in lacs) (C) 2,260.39 2,133.85Basic earnings per equity share (in Rupees) (Face value of Rs. 10/- per share) (A) / (B) 53.92 41.08Diluted earnings per equity share (in Rupees) (Face value of Rs. 10/- per share) (A) / (C) 53.85 40.91
ParticularsYear ended
March 31, 2011Year ended
March 31, 2010Weighted average number of equity shares for calculating Basic EPS (in lacs) 2,257.27 2,125.01Add : Equity shares arising on conversion of optionally
convertible warrants (in lacs) - -
Add : Equity shares for no consideration arising on grant of stock options under ESOP (in lacs)
3.12 8.84
Weighted average number of equity shares in calculating diluted EPS (in lacs) 2,260.39 2,133.85
Schedules forming part of the Consolidated Balance Sheet and Profi t and Loss account (Contd.)
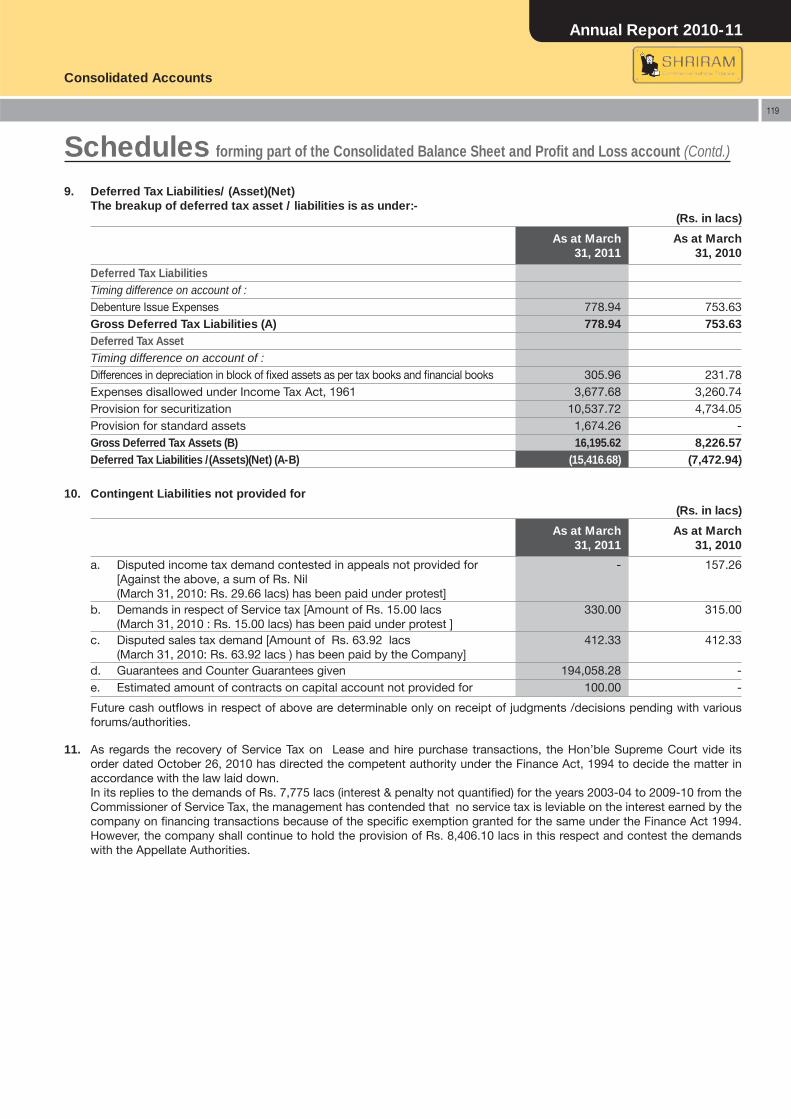
Annual Report 2010-11
Consolidated Accounts
119
9. Deferred Tax Liabilities/ (Asset)(Net)The breakup of deferred tax asset / liabilities is as under:-
(Rs. in lacs)
As at March31, 2011
As at March31, 2010
Deferred Tax LiabilitiesTiming difference on account of :Debenture Issue Expenses 778.94 753.63Gross Deferred Tax Liabilities (A) 778.94 753.63Deferred Tax AssetTiming difference on account of :Differences in depreciation in block of fi xed assets as per tax books and fi nancial books 305.96 231.78Expenses disallowed under Income Tax Act, 1961 3,677.68 3,260.74Provision for securitization 10,537.72 4,734.05Provision for standard assets 1,674.26 -Gross Deferred Tax Assets (B) 16,195.62 8,226.57Deferred Tax Liabilities /(Assets)(Net) (A-B) (15,416.68) (7,472.94)
10. Contingent Liabilities not provided for(Rs. in lacs)
As at March31, 2011
As at March31, 2010
a. Disputed income tax demand contested in appeals not provided for [Against the above, a sum of Rs. Nil (March 31, 2010: Rs. 29.66 lacs) has been paid under protest]
- 157.26
b. Demands in respect of Service tax [Amount of Rs. 15.00 lacs (March 31, 2010 : Rs. 15.00 lacs) has been paid under protest ]
330.00 315.00
c. Disputed sales tax demand [Amount of Rs. 63.92 lacs (March 31, 2010: Rs. 63.92 lacs ) has been paid by the Company]
412.33 412.33
d. Guarantees and Counter Guarantees given 194,058.28 -e. Estimated amount of contracts on capital account not provided for 100.00 -
Future cash outfl ows in respect of above are determinable only on receipt of judgments /decisions pending with various forums/authorities.
11. As regards the recovery of Service Tax on Lease and hire purchase transactions, the Hon’ble Supreme Court vide its order dated October 26, 2010 has directed the competent authority under the Finance Act, 1994 to decide the matter in accordance with the law laid down. In its replies to the demands of Rs. 7,775 lacs (interest & penalty not quantifi ed) for the years 2003-04 to 2009-10 from the Commissioner of Service Tax, the management has contended that no service tax is leviable on the interest earned by the company on fi nancing transactions because of the specifi c exemption granted for the same under the Finance Act 1994. However, the company shall continue to hold the provision of Rs. 8,406.10 lacs in this respect and contest the demands with the Appellate Authorities.
Schedules forming part of the Consolidated Balance Sheet and Profi t and Loss account (Contd.)
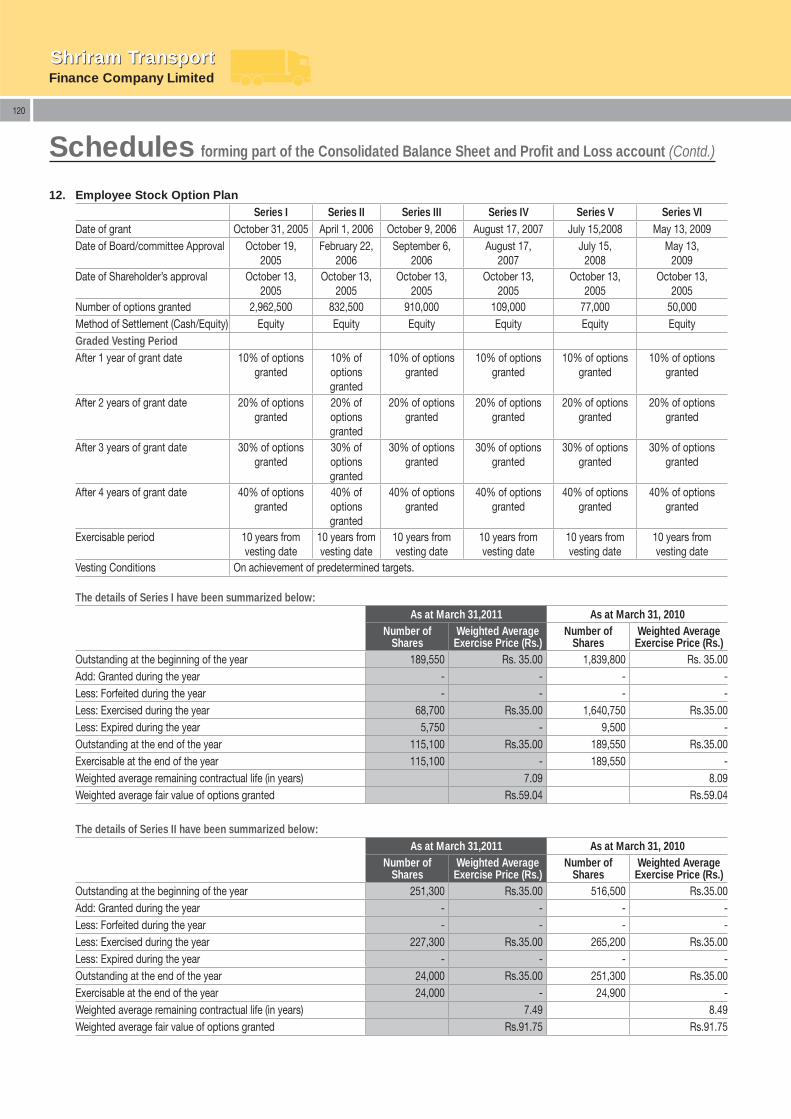
Finance Company LimitedShriram TransportShriram Transport
120
The details of Series I have been summarized below: As at March 31,2011 As at March 31, 2010
Number of Shares
Weighted Average Exercise Price (Rs.)
Number of Shares
Weighted Average Exercise Price (Rs.)
Outstanding at the beginning of the year 189,550 Rs. 35.00 1,839,800 Rs. 35.00Add: Granted during the year - - - -Less: Forfeited during the year - - - -Less: Exercised during the year 68,700 Rs.35.00 1,640,750 Rs.35.00Less: Expired during the year 5,750 - 9,500 -Outstanding at the end of the year 115,100 Rs.35.00 189,550 Rs.35.00Exercisable at the end of the year 115,100 - 189,550 -Weighted average remaining contractual life (in years) 7.09 8.09Weighted average fair value of options granted Rs.59.04 Rs.59.04
The details of Series II have been summarized below: As at March 31,2011 As at March 31, 2010
Number of Shares
Weighted Average Exercise Price (Rs.)
Number of Shares
Weighted Average Exercise Price (Rs.)
Outstanding at the beginning of the year 251,300 Rs.35.00 516,500 Rs.35.00Add: Granted during the year - - - -Less: Forfeited during the year - - - -Less: Exercised during the year 227,300 Rs.35.00 265,200 Rs.35.00Less: Expired during the year - - - -Outstanding at the end of the year 24,000 Rs.35.00 251,300 Rs.35.00Exercisable at the end of the year 24,000 - 24,900 -Weighted average remaining contractual life (in years) 7.49 8.49Weighted average fair value of options granted Rs.91.75 Rs.91.75
12. Employee Stock Option Plan Series I Series II Series III Series IV Series V Series VI
Date of grant October 31, 2005 April 1, 2006 October 9, 2006 August 17, 2007 July 15,2008 May 13, 2009Date of Board/committee Approval October 19,
2005February 22,
2006September 6,
2006August 17,
2007July 15,
2008May 13,
2009Date of Shareholder’s approval October 13,
2005October 13,
2005October 13,
2005October 13,
2005October 13,
2005October 13,
2005Number of options granted 2,962,500 832,500 910,000 109,000 77,000 50,000Method of Settlement (Cash/Equity) Equity Equity Equity Equity Equity EquityGraded Vesting PeriodAfter 1 year of grant date 10% of options
granted10% of options granted
10% of options granted
10% of options granted
10% of options granted
10% of options granted
After 2 years of grant date 20% of options granted
20% of options granted
20% of options granted
20% of options granted
20% of options granted
20% of options granted
After 3 years of grant date 30% of options granted
30% of options granted
30% of options granted
30% of options granted
30% of options granted
30% of options granted
After 4 years of grant date 40% of options granted
40% of options granted
40% of options granted
40% of options granted
40% of options granted
40% of options granted
Exercisable period 10 years from vesting date
10 years from vesting date
10 years from vesting date
10 years from vesting date
10 years from vesting date
10 years from vesting date
Vesting Conditions On achievement of predetermined targets.
Schedules forming part of the Consolidated Balance Sheet and Profi t and Loss account (Contd.)
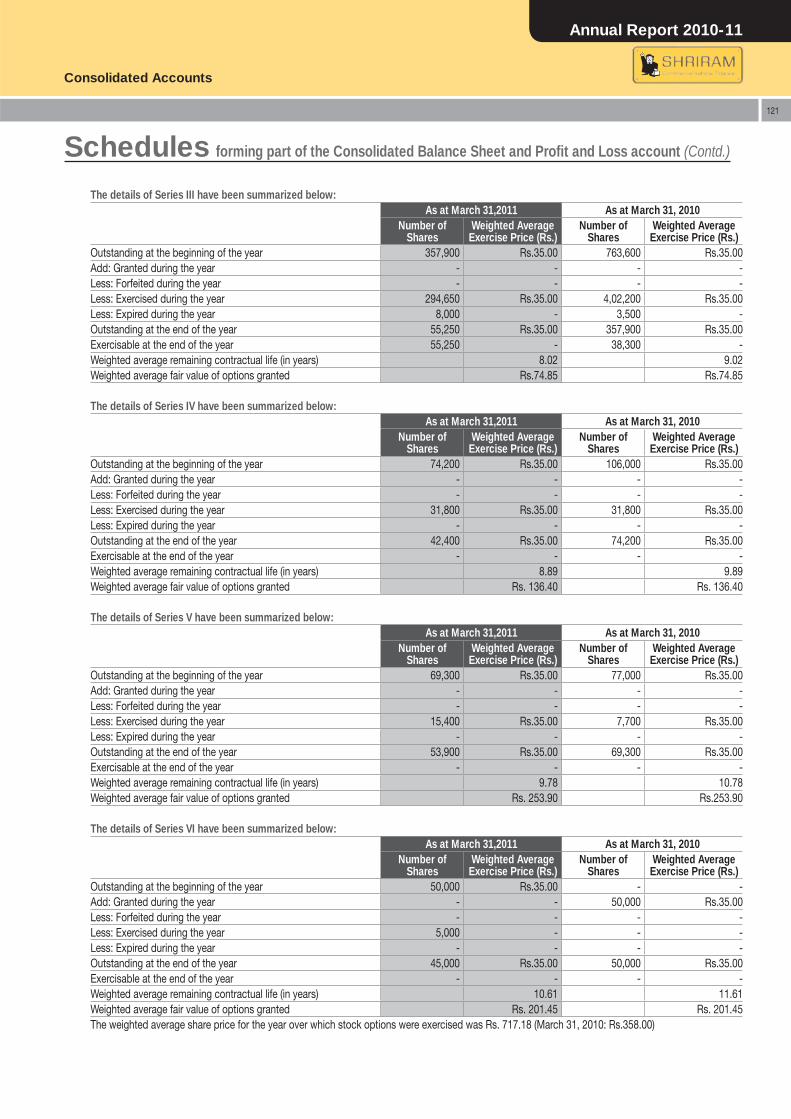
Annual Report 2010-11
Consolidated Accounts
121
The details of Series III have been summarized below: As at March 31,2011 As at March 31, 2010
Number of Shares
Weighted Average Exercise Price (Rs.)
Number of Shares
Weighted Average Exercise Price (Rs.)
Outstanding at the beginning of the year 357,900 Rs.35.00 763,600 Rs.35.00Add: Granted during the year - - - -Less: Forfeited during the year - - - -Less: Exercised during the year 294,650 Rs.35.00 4,02,200 Rs.35.00Less: Expired during the year 8,000 - 3,500 -Outstanding at the end of the year 55,250 Rs.35.00 357,900 Rs.35.00Exercisable at the end of the year 55,250 - 38,300 -Weighted average remaining contractual life (in years) 8.02 9.02Weighted average fair value of options granted Rs.74.85 Rs.74.85
The details of Series IV have been summarized below: As at March 31,2011 As at March 31, 2010
Number of Shares
Weighted Average Exercise Price (Rs.)
Number of Shares
Weighted Average Exercise Price (Rs.)
Outstanding at the beginning of the year 74,200 Rs.35.00 106,000 Rs.35.00Add: Granted during the year - - - -Less: Forfeited during the year - - - -Less: Exercised during the year 31,800 Rs.35.00 31,800 Rs.35.00Less: Expired during the year - - - -Outstanding at the end of the year 42,400 Rs.35.00 74,200 Rs.35.00Exercisable at the end of the year - - - -Weighted average remaining contractual life (in years) 8.89 9.89Weighted average fair value of options granted Rs. 136.40 Rs. 136.40
The details of Series V have been summarized below: As at March 31,2011 As at March 31, 2010
Number of Shares
Weighted Average Exercise Price (Rs.)
Number of Shares
Weighted Average Exercise Price (Rs.)
Outstanding at the beginning of the year 69,300 Rs.35.00 77,000 Rs.35.00Add: Granted during the year - - - -Less: Forfeited during the year - - - -Less: Exercised during the year 15,400 Rs.35.00 7,700 Rs.35.00Less: Expired during the year - - - -Outstanding at the end of the year 53,900 Rs.35.00 69,300 Rs.35.00Exercisable at the end of the year - - - -Weighted average remaining contractual life (in years) 9.78 10.78Weighted average fair value of options granted Rs. 253.90 Rs.253.90
The details of Series VI have been summarized below: As at March 31,2011 As at March 31, 2010
Number of Shares
Weighted Average Exercise Price (Rs.)
Number of Shares
Weighted Average Exercise Price (Rs.)
Outstanding at the beginning of the year 50,000 Rs.35.00 - -Add: Granted during the year - - 50,000 Rs.35.00Less: Forfeited during the year - - - -Less: Exercised during the year 5,000 - - -Less: Expired during the year - - - -Outstanding at the end of the year 45,000 Rs.35.00 50,000 Rs.35.00Exercisable at the end of the year - - - -Weighted average remaining contractual life (in years) 10.61 11.61Weighted average fair value of options granted Rs. 201.45 Rs. 201.45The weighted average share price for the year over which stock options were exercised was Rs. 717.18 (March 31, 2010: Rs.358.00)
Schedules forming part of the Consolidated Balance Sheet and Profi t and Loss account (Contd.)
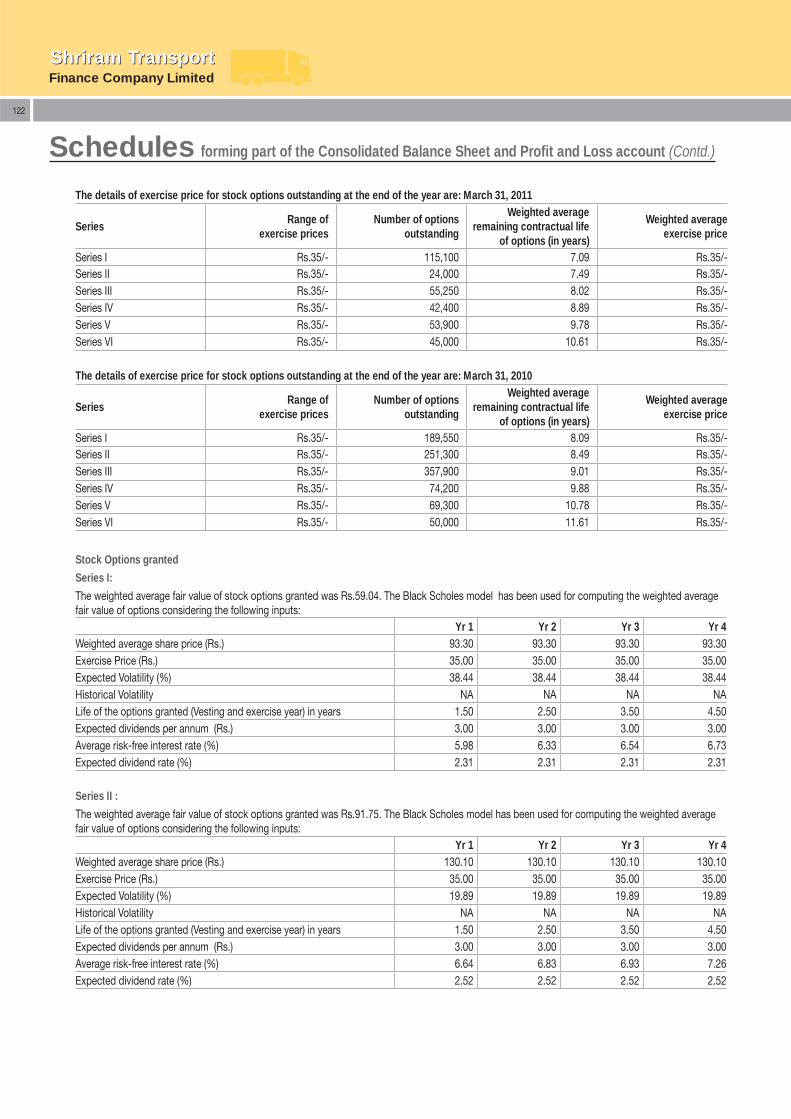
Finance Company LimitedShriram TransportShriram Transport
122
The details of exercise price for stock options outstanding at the end of the year are: March 31, 2011
SeriesRange of
exercise pricesNumber of options
outstanding
Weighted average remaining contractual life
of options (in years)
Weighted average exercise price
Series I Rs.35/- 115,100 7.09 Rs.35/-Series II Rs.35/- 24,000 7.49 Rs.35/-Series III Rs.35/- 55,250 8.02 Rs.35/-Series IV Rs.35/- 42,400 8.89 Rs.35/-Series V Rs.35/- 53,900 9.78 Rs.35/-Series VI Rs.35/- 45,000 10.61 Rs.35/-
The details of exercise price for stock options outstanding at the end of the year are: March 31, 2010
SeriesRange of
exercise pricesNumber of options
outstanding
Weighted average remaining contractual life
of options (in years)
Weighted average exercise price
Series I Rs.35/- 189,550 8.09 Rs.35/-Series II Rs.35/- 251,300 8.49 Rs.35/-Series III Rs.35/- 357,900 9.01 Rs.35/-Series IV Rs.35/- 74,200 9.88 Rs.35/-Series V Rs.35/- 69,300 10.78 Rs.35/-Series VI Rs.35/- 50,000 11.61 Rs.35/-
Stock Options granted
Series I:
The weighted average fair value of stock options granted was Rs.59.04. The Black Scholes model has been used for computing the weighted average fair value of options considering the following inputs:
Yr 1 Yr 2 Yr 3 Yr 4Weighted average share price (Rs.) 93.30 93.30 93.30 93.30Exercise Price (Rs.) 35.00 35.00 35.00 35.00Expected Volatility (%) 38.44 38.44 38.44 38.44Historical Volatility NA NA NA NALife of the options granted (Vesting and exercise year) in years 1.50 2.50 3.50 4.50Expected dividends per annum (Rs.) 3.00 3.00 3.00 3.00Average risk-free interest rate (%) 5.98 6.33 6.54 6.73Expected dividend rate (%) 2.31 2.31 2.31 2.31
Series II :
The weighted average fair value of stock options granted was Rs.91.75. The Black Scholes model has been used for computing the weighted average fair value of options considering the following inputs:
Yr 1 Yr 2 Yr 3 Yr 4Weighted average share price (Rs.) 130.10 130.10 130.10 130.10Exercise Price (Rs.) 35.00 35.00 35.00 35.00Expected Volatility (%) 19.89 19.89 19.89 19.89Historical Volatility NA NA NA NALife of the options granted (Vesting and exercise year) in years 1.50 2.50 3.50 4.50Expected dividends per annum (Rs.) 3.00 3.00 3.00 3.00Average risk-free interest rate (%) 6.64 6.83 6.93 7.26Expected dividend rate (%) 2.52 2.52 2.52 2.52
Schedules forming part of the Consolidated Balance Sheet and Profi t and Loss account (Contd.)
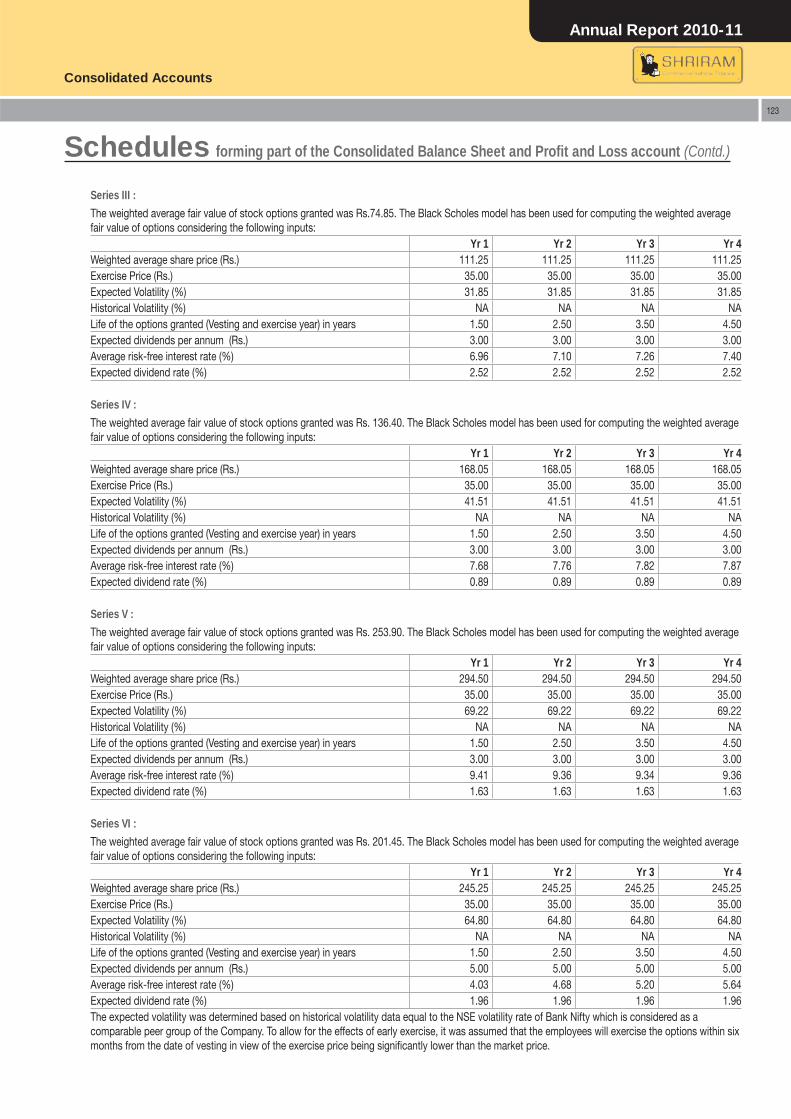
Annual Report 2010-11
Consolidated Accounts
123
Series III :
The weighted average fair value of stock options granted was Rs.74.85. The Black Scholes model has been used for computing the weighted average fair value of options considering the following inputs:
Yr 1 Yr 2 Yr 3 Yr 4Weighted average share price (Rs.) 111.25 111.25 111.25 111.25Exercise Price (Rs.) 35.00 35.00 35.00 35.00Expected Volatility (%) 31.85 31.85 31.85 31.85Historical Volatility (%) NA NA NA NALife of the options granted (Vesting and exercise year) in years 1.50 2.50 3.50 4.50Expected dividends per annum (Rs.) 3.00 3.00 3.00 3.00Average risk-free interest rate (%) 6.96 7.10 7.26 7.40Expected dividend rate (%) 2.52 2.52 2.52 2.52
Series IV :
The weighted average fair value of stock options granted was Rs. 136.40. The Black Scholes model has been used for computing the weighted average fair value of options considering the following inputs:
Yr 1 Yr 2 Yr 3 Yr 4Weighted average share price (Rs.) 168.05 168.05 168.05 168.05Exercise Price (Rs.) 35.00 35.00 35.00 35.00Expected Volatility (%) 41.51 41.51 41.51 41.51Historical Volatility (%) NA NA NA NALife of the options granted (Vesting and exercise year) in years 1.50 2.50 3.50 4.50Expected dividends per annum (Rs.) 3.00 3.00 3.00 3.00Average risk-free interest rate (%) 7.68 7.76 7.82 7.87Expected dividend rate (%) 0.89 0.89 0.89 0.89
Series V :
The weighted average fair value of stock options granted was Rs. 253.90. The Black Scholes model has been used for computing the weighted average fair value of options considering the following inputs:
Yr 1 Yr 2 Yr 3 Yr 4Weighted average share price (Rs.) 294.50 294.50 294.50 294.50Exercise Price (Rs.) 35.00 35.00 35.00 35.00Expected Volatility (%) 69.22 69.22 69.22 69.22Historical Volatility (%) NA NA NA NALife of the options granted (Vesting and exercise year) in years 1.50 2.50 3.50 4.50Expected dividends per annum (Rs.) 3.00 3.00 3.00 3.00Average risk-free interest rate (%) 9.41 9.36 9.34 9.36Expected dividend rate (%) 1.63 1.63 1.63 1.63
Series VI :
The weighted average fair value of stock options granted was Rs. 201.45. The Black Scholes model has been used for computing the weighted average fair value of options considering the following inputs:
Yr 1 Yr 2 Yr 3 Yr 4Weighted average share price (Rs.) 245.25 245.25 245.25 245.25Exercise Price (Rs.) 35.00 35.00 35.00 35.00Expected Volatility (%) 64.80 64.80 64.80 64.80Historical Volatility (%) NA NA NA NALife of the options granted (Vesting and exercise year) in years 1.50 2.50 3.50 4.50Expected dividends per annum (Rs.) 5.00 5.00 5.00 5.00Average risk-free interest rate (%) 4.03 4.68 5.20 5.64Expected dividend rate (%) 1.96 1.96 1.96 1.96The expected volatility was determined based on historical volatility data equal to the NSE volatility rate of Bank Nifty which is considered as a comparable peer group of the Company. To allow for the effects of early exercise, it was assumed that the employees will exercise the options within six months from the date of vesting in view of the exercise price being signifi cantly lower than the market price.
Schedules forming part of the Consolidated Balance Sheet and Profi t and Loss account (Contd.)
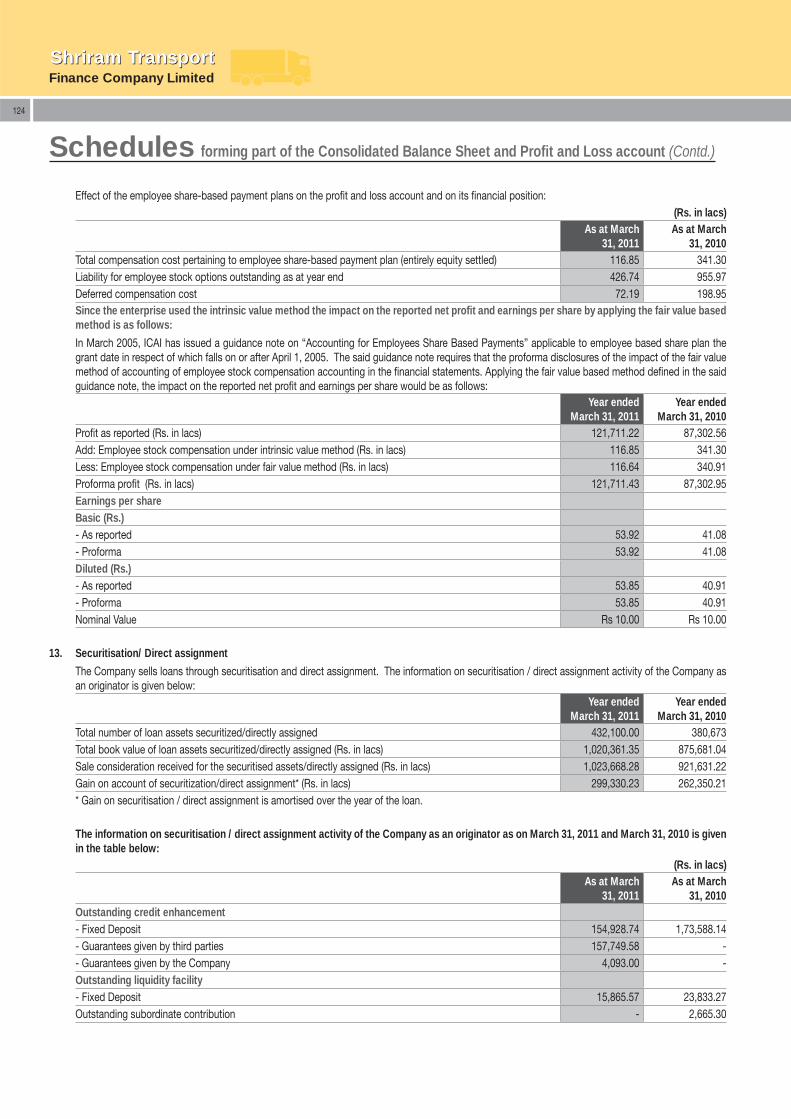
Finance Company LimitedShriram TransportShriram Transport
124
Effect of the employee share-based payment plans on the profi t and loss account and on its fi nancial position:(Rs. in lacs)
As at March31, 2011
As at March 31, 2010
Total compensation cost pertaining to employee share-based payment plan (entirely equity settled) 116.85 341.30Liability for employee stock options outstanding as at year end 426.74 955.97Deferred compensation cost 72.19 198.95Since the enterprise used the intrinsic value method the impact on the reported net profi t and earnings per share by applying the fair value based method is as follows:
In March 2005, ICAI has issued a guidance note on “Accounting for Employees Share Based Payments” applicable to employee based share plan the grant date in respect of which falls on or after April 1, 2005. The said guidance note requires that the proforma disclosures of the impact of the fair value method of accounting of employee stock compensation accounting in the fi nancial statements. Applying the fair value based method defi ned in the said guidance note, the impact on the reported net profi t and earnings per share would be as follows:
Year ended March 31, 2011
Year ended March 31, 2010
Profi t as reported (Rs. in lacs) 121,711.22 87,302.56Add: Employee stock compensation under intrinsic value method (Rs. in lacs) 116.85 341.30Less: Employee stock compensation under fair value method (Rs. in lacs) 116.64 340.91Proforma profi t (Rs. in lacs) 121,711.43 87,302.95Earnings per shareBasic (Rs.)- As reported 53.92 41.08- Proforma 53.92 41.08Diluted (Rs.)- As reported 53.85 40.91- Proforma 53.85 40.91Nominal Value Rs 10.00 Rs 10.00
13. Securitisation/ Direct assignment
The Company sells loans through securitisation and direct assignment. The information on securitisation / direct assignment activity of the Company as an originator is given below:
Year ended March 31, 2011
Year ended March 31, 2010
Total number of loan assets securitized/directly assigned 432,100.00 380,673Total book value of loan assets securitized/directly assigned (Rs. in lacs) 1,020,361.35 875,681.04Sale consideration received for the securitised assets/directly assigned (Rs. in lacs) 1,023,668.28 921,631.22Gain on account of securitization/direct assignment* (Rs. in lacs) 299,330.23 262,350.21* Gain on securitisation / direct assignment is amortised over the year of the loan.
The information on securitisation / direct assignment activity of the Company as an originator as on March 31, 2011 and March 31, 2010 is given in the table below:
(Rs. in lacs)As at March
31, 2011As at March
31, 2010Outstanding credit enhancement- Fixed Deposit 154,928.74 1,73,588.14- Guarantees given by third parties 157,749.58 -- Guarantees given by the Company 4,093.00 -Outstanding liquidity facility- Fixed Deposit 15,865.57 23,833.27Outstanding subordinate contribution - 2,665.30
Schedules forming part of the Consolidated Balance Sheet and Profi t and Loss account (Contd.)
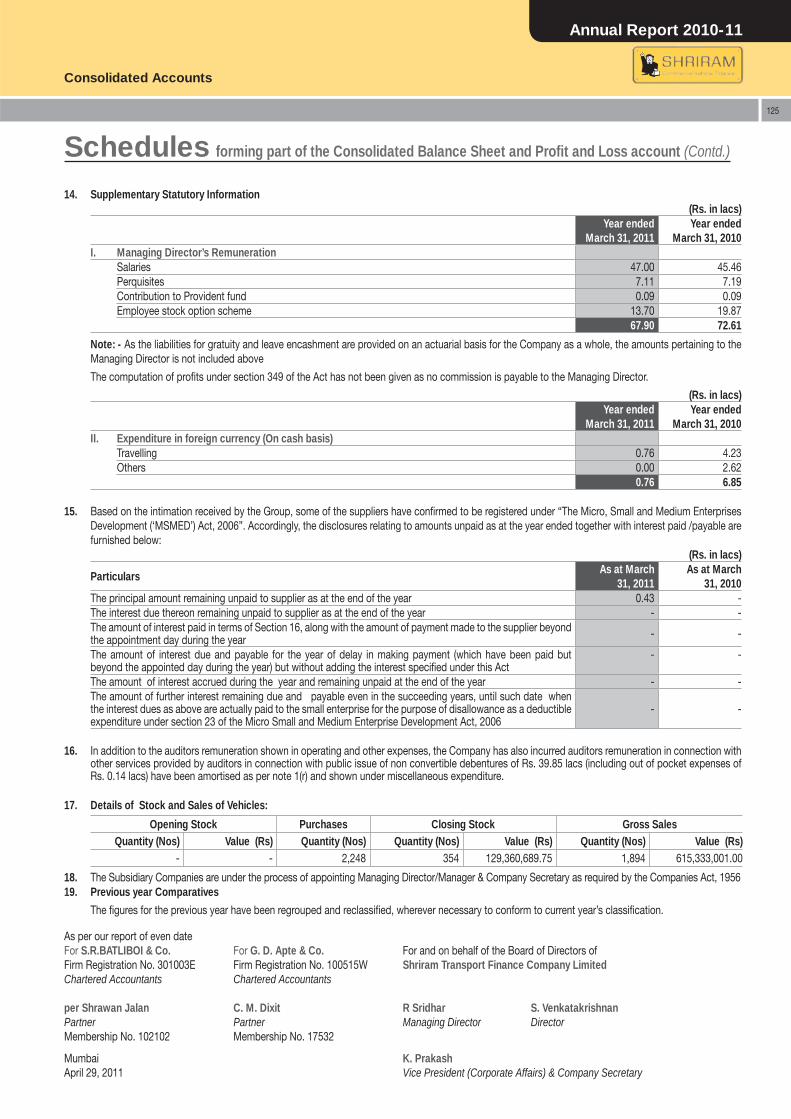
Annual Report 2010-11
Consolidated Accounts
125
14. Supplementary Statutory Information(Rs. in lacs)
Year ended March 31, 2011
Year ended March 31, 2010
I. Managing Director’s RemunerationSalaries 47.00 45.46Perquisites 7.11 7.19Contribution to Provident fund 0.09 0.09Employee stock option scheme 13.70 19.87
67.90 72.61
Note: - As the liabilities for gratuity and leave encashment are provided on an actuarial basis for the Company as a whole, the amounts pertaining to the Managing Director is not included above
The computation of profi ts under section 349 of the Act has not been given as no commission is payable to the Managing Director.
(Rs. in lacs)Year ended
March 31, 2011Year ended
March 31, 2010II. Expenditure in foreign currency (On cash basis)
Travelling 0.76 4.23Others 0.00 2.62
0.76 6.85
15. Based on the intimation received by the Group, some of the suppliers have confi rmed to be registered under “The Micro, Small and Medium Enterprises Development (‘MSMED’) Act, 2006”. Accordingly, the disclosures relating to amounts unpaid as at the year ended together with interest paid /payable are furnished below:
(Rs. in lacs)
ParticularsAs at March
31, 2011As at March
31, 2010The principal amount remaining unpaid to supplier as at the end of the year 0.43 -The interest due thereon remaining unpaid to supplier as at the end of the year - -The amount of interest paid in terms of Section 16, along with the amount of payment made to the supplier beyond the appointment day during the year - -
The amount of interest due and payable for the year of delay in making payment (which have been paid but beyond the appointed day during the year) but without adding the interest specifi ed under this Act
- -
The amount of interest accrued during the year and remaining unpaid at the end of the year - -The amount of further interest remaining due and payable even in the succeeding years, until such date when the interest dues as above are actually paid to the small enterprise for the purpose of disallowance as a deductible expenditure under section 23 of the Micro Small and Medium Enterprise Development Act, 2006
- -
16. In addition to the auditors remuneration shown in operating and other expenses, the Company has also incurred auditors remuneration in connection with other services provided by auditors in connection with public issue of non convertible debentures of Rs. 39.85 lacs (including out of pocket expenses of Rs. 0.14 lacs) have been amortised as per note 1(r) and shown under miscellaneous expenditure.
17. Details of Stock and Sales of Vehicles:
Opening Stock Purchases Closing Stock Gross SalesQuantity (Nos) Value (Rs) Quantity (Nos) Quantity (Nos) Value (Rs) Quantity (Nos) Value (Rs)
- - 2,248 354 129,360,689.75 1,894 615,333,001.00
18. The Subsidiary Companies are under the process of appointing Managing Director/Manager & Company Secretary as required by the Companies Act, 195619. Previous year Comparatives
The fi gures for the previous year have been regrouped and reclassifi ed, wherever necessary to conform to current year’s classifi cation.
Schedules forming part of the Consolidated Balance Sheet and Profi t and Loss account (Contd.)
As per our report of even dateFor S.R.BATLIBOI & Co. For G. D. Apte & Co. For and on behalf of the Board of Directors ofFirm Registration No. 301003E Firm Registration No. 100515W Shriram Transport Finance Company LimitedChartered Accountants Chartered Accountants
per Shrawan Jalan C. M. Dixit R Sridhar S. VenkatakrishnanPartner Partner Managing Director DirectorMembership No. 102102 Membership No. 17532
Mumbai K. PrakashApril 29, 2011 Vice President (Corporate Affairs) & Company Secretary

Finance Company LimitedShriram TransportShriram Transport
126
Notes

Annual Report 2010-11
Finance Company LimitedShriram TransportShriram Transport
127
Notes

Finance Company LimitedShriram TransportShriram Transport
128
Notes


Shriram Transport Finance Company Limitedwww.stfc.in