Embed Size (px)
Citation preview

W&M ScholarWorks W&M ScholarWorks
Arts & Sciences Book Chapters Arts and Sciences
8-14-2018
Shrinking Suburbs in a Time of Crisis Shrinking Suburbs in a Time of Crisis
Justin B. Hollander
Colin Polsky
Dan Zinder
Daniel M. Runfola College of William and Mary
Follow this and additional works at: https://scholarworks.wm.edu/asbookchapters
Part of the Environmental Health and Protection Commons
Recommended Citation Recommended Citation Hollander, J. B., Polsky, C., Zinder, D., & Runfola, D. M. (2018). Shrinking Suburbs in a Time of Crisis. Bernadette Hanlon and Thomas J. Vicino (Ed.), The Routledge Companion to the Suburbs (pp. 266-279). Routledge. https://scholarworks.wm.edu/asbookchapters/76
This Book Chapter is brought to you for free and open access by the Arts and Sciences at W&M ScholarWorks. It has been accepted for inclusion in Arts & Sciences Book Chapters by an authorized administrator of W&M ScholarWorks. For more information, please contact [email protected].

The Routledge Companion to the Suburbs
Edited by Bernadette Hanlon and Thomas J. Vicino
I? ���:!:���p LONDON AND NEW YORK
THE

Fir t pubb hcd 2019 by Routledge 2 Park ~qua re, Milton Park, Abingdon, Oxon ;;>Cl 4 4RN
and by Routledge 711 Third Avenue, ew York, NY 10017
Routledge is an imprint of the 1aylor & Francis Group, an iriforma business
2019 election and editorial matter, Bernadette Hanlon and Thoma J. Vicino; individual chapter , the contributors
The right of Bernadette Hanlon and Thomas J. Vicino to be identified as the author of the editorial material, and of the author for their individual chapter , ha been as erred in accordance with ection 77 and 78 of the Copyright, De 1gn and Patents Act 1988.
All right re erved. No part of thi book may be reprinted or reproduced or utili ed in any form or by any electronic, mechanical, or other mean , now known or hereafter invented, including photocopying and recording, or in any mformation torage or retrieval y tern, without permi sion in writing from the publi her .
'lrademark notice: Product or corporate name may be trademarks or regi tered trademark , and are u ed only for identification and explanation without intent to infringe.
British Library Cataloguing-in-Publication Data A catalogue record for thi book i available from the British Library
Library of Congress Cataloging-in-Publication Data Name : Hanlon, Bernadette, 1969- editor. I Vicino, Thoma J., editor. Title: The Routledge companion to the uburb / edited by Bernadette Hanlon
and Thoma J. Vicino. De cription: Abingdon, Oxon ; New York, NY : Routledge, 2019. I Include
bibliographical reference and index. Identifier : LCCN 2018018777 I ISBN 9781138290235 (hbk: alk. paper)
I BN 9781315266442 (ebk) ubjects: L H: uburb . I uburban life. la ification:L HT351.R6852019 I DD 307.74--dc23
L record available at http :/ /lccn.loc.gov/2018018777
I B : 978-1-138-29023-5 (hbk) I BN: 978-1-315-26644-2 (ebk)
Type et in Bembo by Apex o Vantage, LLC Printed and bound by CPI Group (UK) Ltd, Croydon, CR0 4YY

List of figures List of tables
otes on contributors Preface
Introduction Bernadette Hanlon and Thomas J Vicino
PART I
Suburban definitions and descriptions
1 Defining suburbs Ann Forsyth
2 Suburban stereotypes Richard Harris
3 In what sense a post-suburban era? Nicholas A. Phelps
PART II
Global perspectives on the suburbs
4 Toward a comparative global suburbanism Pierre Hamel and Roger Keil
5 Suburbanization in Latin America Lawrence A. Herzog
6 Suburbanization in Australia Robert Freestone, Bill Randolph, and Simon Pinnegar
Contents
Vtll
X
X l
XVl
1
11
13
29
39
49
51
62
72
V

Contents
7 uburbanization in Europe: a focu on Dublin
Ruth McManus
8 uburbanization in Asia: a focu on India
Annapurna Shaw
9 uburbanization in A ia: a focus on Jakarta Deden Rukmana, Fikri Zul Fahrni, and Tommy Firman
10 uburbanization in Asia: a focus on Seoul Chang Gyu Choi and Sugie Lee
PART Ill
Diversity, exclusion, and poverty in the suburbs
11 Queer suburb : (sub)urban spaces and sexualities in the Global North Andrew Gorman-Murray and Catherine J Nash
12 Inequality and poverty in the suburbs: the case of metropolitan Cairo Erina Iwasaki
13 ocial exclusion and multiethnic suburbs in Sweden Magnus Dahlstedt and David Ekholm
7
100
110
121
133
135
147
163
14 Uneven development and the making of Rio de Janeiro 173 Anjuli . Fahlberg
15 Dividing the metropolis: the political history of suburban incorporation in the United State 184 Jon C. Teciford
16 Immigrants in U. . uburbs 193 Kyle Walker
17 Poverty in U .. uburb 208 Katrin B. Anacker
1 From anford to Fergu on: race, poverty, and protest in the American uburb
Willow Lung-Amam and Alex Schafran
1 tigrna and the U. . uburb !Vl1itney Airgood-Obrycki and Cody R. Price
vi
220
230

PART IV
Planning, public policy, and reshaping the suburbs
20 Metropolitan governance in Paris Theresa Enright
21 The French banlieue: renovating the suburb
Juliet Carpenter
22 Shrinking suburbs in a time of crisis Justin B. Hollander, Colin Polsky, Dan Zinder, and Dan Runfola
23 Redesigning the suburbs: new town and master-planned suburbs of the 1960s and 1970s Lisa Benton-Short
24 Keeping up with the Joneses: residential reinvestment and mansionization in American inner-ring suburbs Suzanne Lanyi Charles
25 Planning and the cultural landscapes of suburban Turkey Bahar Durmaz-Drinkwater, Jaap Vos, and Asli Ceylan Oner
26 Cultural production in the suburban context Alison L. Bain
PARTV
Conclusion and future prospects
27 The end of the suburbs John Rennie Short
28 Conclusion and future research on global suburbs Bernadette Hanlon and Thomas J Vicino
Index
Contents
241
243
254
266
280
296
308
323
333
335
342
348
vii

Introduction
22
Shrinking suburbs in a time of crisis
Justin B. Hollande'1 Colin Polsky, Dan Zinde'1 and Dan Runfola
In recent years, increased scholarly attention has been paid to the fall-out from the 2008 ub
prime lending debacle, a national collap e of the housing market that resulted in ma sive foreclosures and wide pread housing vacancy throughout the United States (Immergluck 2011; Hollander, 2009). Its effect on perennially growing areas such as Sunbelt cities and suburban
living was unprecedented (Goodman, 2007; Leland, 2007; Dash, 2011). From Atlanta to Fort Meyers to Phoenix, ma sive new hou ing developments at largely unoccupied while older housing at abandoned due to foreclosure (Runfola and Hankins, 2010). With the housing
market in a tailspin, cities in the Sunbelt faced depopulation and housing vacancy akin to that ob erved in the early stages of industrial Rustbelt cities' decline when their major industrie
began to falter. It appeared that the Great Recession (the interval between 2006 and 2009) brought on a new
era of shrinkage in formerly growing cities. In this chapter, we define shrinkage as net decline
in occupied hou ing units. Lucy and Phillip (2006) note that decline in housing occupancy is a more meaningful indicator of decline than population los , ince the latter may indicate that
unit are being used differently rather than, for example, a community having more single or dual occupancy units where previously mo t units housed an entire family. In that in tance, population
decrea es but the neighborhood ha not necessarily experienced any destabilizing effect . The circum tances surrounding the e new decline differ from Ru tbelt population declines that date from the 1950 . In the Ru tbelt, shrinkage has been driven by global economic conditions that
pu hed many manufacturing industrie oversea - an economic trend unlikely to rever e in the near future. In contra t to thi , the sun will alway hine on the unbelt, likely driving an eventual return of the demand for retiree hou ing, even if tempered lending practice do not permit the ame rate of con umption without capital.
Even if the circum tances around decline and shrinkage differ in the e region , we can till learn le on from the Ru tbelt about the proces of shrinkage and the planning method already
undertaken in that region to encourage recovery. It ha been sugge ted that once individual neighborhood reach a certain thre hold of vacancy, the likelihood of rever ing that trend dimin-1 he greatly (Hoyt, 1933; Wil on and Kelling, 1982· Wallace, 19 9; Temkin and Rohe, 1996;
266
Shrinking suburbs in a time of crisis
Keenan et al., 1999). Even as the United State a a whole recover , individual pocket neighbor
hoods, or region that are still declining will likely persi t in doing o po ing increa ingl daunt
ing challenges such a crime, poverty, depopulation, and ultimatel revenue lo to local planner and policymaker .
A planners in this new group of shrinking places develop trategies to addres decline
there is much they can learn from the emerging body of literature on mart shrinkage (Pop
per and Popper, 2002; Schilling and Logan, 2008; Hollander et al., 2009). Smart hrinkage
is a set of policies that help areas with declining populations manage the as ociated land
u e changes. Instead of fighting population loss, smart hrinkage begins with the idea that
maintaining a high quality of life for the remaining residents can be achieved without
growth.
Central to smart shrinkage is recognizing the "fallibility of the myth of endless growth"
(Popper and Popper, 2002, p. 23). Smart shrinkage was mentioned as early a 1989, when Clark
encouraged preserving declining areas for "parkland and recreational spaces" (p. 143) - a ug
ge tion echoed recently by Schilling and Logan (2008). Armborst, D'Oca, and Theodore (2005) introduced the idea of widespread acquisitions of vacant lots as a n1eans of expanding average lot
sizes and better managing shrinking populations, a process they described as "blotting."
A number of policymakers and lobbying groups have already implemented or considered
smart shrinkage policies. Community leaders in Youngstown, Ohio, a city that has lost half of
its population since 1950, adopted this approach with a new Master Plan to address its remain
ing population of 74,000. In the Plan, the city came to terms with its ongoing population loss
and called for a "better, smaller Youngstown," focusing on improving the quality of life for
existing residents rather than attempting to grow the city (City of Youngstown, 2005; Hol
lander, 2009;Schatz, 2010). In Philadelphia, the nonprofit Public/ Private Ventures office is ued
a report calling for "the consolidation of abandoned areas and, in some cases, the relocation
of those hou eholds that remain in blocks that too often look like Dresden after the Second
World War" (Hughes and Cook-Mack, 1999, p. 15). City leaders in ew Bedford, Massachu
setts, and Rochester, New York have also explored the potential of smart decline (Goodnough, 2009; Fairbanks, 2010).
As shrinkage spreads beyond a handful of Rustbelt capitals, the smart shrinkage approach may
gain increasing prominence in planning practice. Before studying smart shrinkage as a solution,
however, planners need to better understand the process of shrinkage. When places lose a sizable
number of people, the first thing that changes is housing demand. Glaeser and Gyourko (2005)
have demonstrated the durability of housing using economic analysis - that is, as people leave a
place, homes do not leave in concomitant levels synchronously. In time, many factors will result
in fewer occupied hou ing unit , including abandonment, demolition, arson, or an unwillingness of landlords to lease their property.
In this chapter, we seek to understand the physical impacts of economic contraction on hous
ing occupancy patterns before and after the Great Recession. Additionally, we ask whether or not
different census-defined density-determined regions - urbanized areas, metropolitan stati tical areas, and rural areas - were affected uniformly during economic contraction.
We answer these questions by exploring household residential delivery data acquired from the
U.S. Postal Service for February of 2000, 2006, and 2011; these years roughly mark the beginning of the real estate boom, peak of the real estate market, and years of decline and instability in the
housing market following that peak. The e data contain household delivery counts for every zip code in the country. In analyzing this data et, net changes in occupied housing by zip code were
tabulated and mapped, and patterns of spatial clustering were explored using Global and Local Moran's I tatistics and Local Indicators of Spatial Association (LISA).
267

Justin B. Hollander, et al.
The planning context
Planners and developer have, for decades, been caught up in a fal e dichotomy: when a community grows in population it prosper , and when its population decline it uffer . E. F. chumacher challenged that false dichotomy in 1973 with his volume mall is Beautiful. Popper et al. followed with rban ongrowth in 1976. But the on-the-ground world of practice never really re ponded to those critiques, and the growth/ decline dichotomy prevailed until ju t recently.
ow, some local officials are asking if their communitie can thrive and improve while taying mall or even declining in population. In many ways, it is out of desperation driven by the profound failure of economic development strategies to arrest decline in many urban areas over
the last several decades. The infusion of public monie into new tadium , job training center , infrastructure, and new housing in cities big and small has had a positive effect on ome cities but not all. Called the "forgotten citie " by Hoyt and Leroux (2007), the power and succe s of economic turn-around by building additional infrastructure has irn.ply not worked everywhere. In fact, there is evidence that economic development has failed to rever e structural economic conditions contributing to decline more often than it has succeeded (Schumpeter, 1934; Boyer,
1983; Logan and Molotch, 1987). Urban population decline has a bad reputation. Beauregard's 2003 book Voices of Decline docu
mented in fastidious detail the ways that the di courses of decline were developed and positioned in American culture. Beauregard concludes that modern society's drive for bigger, faster, more of everything required that population and employment loss in mid-twentieth century citie
was to be viewed in antipode to the growth and vitality of the suburbs. Lucy and Phillip 's 2000 work further illustrated the plight of suburbs facing disinvestment and decline. They argued that booming, growing suburbs were at the greatest risk for decline, because they generally lacked the
en e of place that can continue to attract new residents. Lang and Lefurgy's 2007 "boomburb " analysis found that the e growing suburbs were a significant phenomenon; they found 53 such
boomtowns - places at high risk for decline in the event of economic contraction.
Little is known about how the Great Recession affected growing place like "boomburbs": whether they lost housing, how pervasive that loss was, and whether it was geographically clus
tered or dispersed. A uch, the Great Rece sion provides a useful natural experiment for studying
how an economic crisis influences shrinkage.
Alternative methods of calculating neighborhood decline
Bowman and Pagano (2004) conducted an exhaustive study on this topic, seeking to under-tand the vacancy problem's extent. They administered written surveys to local officials and
a embled a database of abandoned buildings and vacant lot counts across more than a hundred U .. cities. Unfortunately, this urvey-based method wa proven unreliable when cros -
checked against hou ing unit count from the Decennial Cen u (Hollander, 2009). Local official aero the country u e very different strategies to account for vacancy and abandon
ment, making the u e of locally di tinct admini trative data source a uboptimal approach for producing national generalization (Bowman and Pagano, 2000). Hillier et al. (2003) exan1ined Philadelphia' housing database to track vacancy and abandonment data, but their
) ten1 are not interoperable, making comparative analy is practically impo ible. il on and Marguli (1994) developed a imilarly localized analysi in leveland. Runfola and Hankin (2010) conducted on-the-ground fieldwork in Atlanta to tally abandoned and derelict hou -mg, but their method wa time-inten ive and thu only conducted in a limited nun1ber of cen u block group .
268
Shrinking suburbs in a time of crisis
Many remote- en ing and GIS-based tudies have had son1e ucce measurino- urban popula
tion change, examining areas experiencing growth throughout the duration of the tudie eber
and Puis ant, 2003;Xiao et al., 2006;Yang and Lo, 2002). Examining urban hrinkage R znar and
Wagner (2001) attempted to study the effects of population decline but could onl mea ure net
change in forested and agricultural land, extrapolating their finding to housing and con1n1ercial land use change . Banzhaf et al. (2007) explored shrinkage in Leipzig, German but found that
the necessary data to validate their findings was lacking.
While remote-sen ing-based approaches uggest that urban change may one da be mea ured
accurately by aerial and satellite imagery, the data and technical requirements can be out of reach
for many planning departments, and widely replicable methodologie have not yet been devel
oped. One possible solution is to reconsider some of the available data from the U.S. Decennial
Census. Data from the census provides total counts of occupied hou ing units for neighborhood
level census tracts every 10 years. Each housing unit in the U.S. is clas ified as either occupied
or vacant. If vacant, the Census Bureau devised everal possible cla sification to reflect different
reasons including for sale, seasonal home, or a catchall category, "other vacant," which researcher
u e to indicate abandoned homes (Hollander, 2010).
The challenge of using this dataset to produce insights into events such as the economic down
turn is the process of population movement unfolds on a continuous basis whereas the census i
only collected every 10 years. Other cen us data source , such as the American Community ur
vey, provide annual updates; however, the finest scale on which these housing occupancy data are
released is the municipal level, making this option inadequate for a neighborhood-level analysis.
Methodological approach
Occupied housing units offer a clear and useful path for studying abandonment at a national
scale. This study explores a relatively unstudied data source, the U.S. Postal Service Delivery Sta
ti tics, as an alternative to the more spatially and time constrictive datasets described in the previ
ous section. Six days a week, every week of the year, USPS sends a postal worker to walk up and
down nearly every street in America and collects data on total deliveries for each zip code. The
USPS regularly releases datasets that provide inforn1ation on occupied housing units for each U.S.
zip code. When a postal worker determines that a housing unit has not been occupied for more
than 90 days, the USPS remove the address fron1 its active inventory, data which is aggregated to
zip codes and made available on a monthly basis.
Basic tabulation
For this study, three USP data ets were analyzed: February 2000, February 2006, and February
2011. Nearly all zip codes in the lower 48 states were included in the analysis. Two time interval
were selected for analysis: February 2000 to February 2006 and February 2006 to February 2011.
The first interval corresponds with the housing boom in the decade's first half and the second
interval corresponds with the approximate tipping point of the boom into the foreclosure crisis
and rece ion. Change for each tin1e interval was calculated by subtracting total occupied housing at the
beginning point of each interval from occupied housing at the interval' end. The later time
intervals total households from the earlier tin1e intervals (e.g., total households in Feb 2000 for zip code X ubtracted from total households in Feb 2006 from that ame zip code, produce a
mea urement of occupied housing change for the interval between 2000-2006, where a negative value implies shrinkage and a positive value implies population growth). Change in hou ing
269

Justin B. Hollander, et al.
occupancy was measured nationally (see Table 22.1) and for each of the four major cen u region :
ortheast ( ee Table 22.2),South ( ee Table 22.3), Midwest (see Table 22.4), and Wet ( ee Table 22.5).
Additionally, the national and regional datasets were divided into three ub-region based on
" urban-ness" to test the severity in which more densely populated urban core were impacted
relative to less densely populated suburban and rural area . Because the cen us categorize region
as "Urbanized Areas" and "Metropolitan Statistical Areas" by population density, we u ed these
boundaries as a rough approximation of different component of the metropolitan region for our
study. Area out ide of Metropolitan Statistical Areas were identified as "rural and small town .'
Data mapping
Zip codes were also mapped nationally to show zip codes with net gains and declines for each
interval (see Figures 22.1 and 22.2). Data from Figures 22.1 and 22.2 were combined into a third
Table 22. 7 Summary statistics for national zip code district housing occupancy
Urbanized Metropolitan Rural and Total Areas* Statistical Small Towns
Areas**
Interval 1: Total Count of Zip Codes 6686 12071 9855 28612 2000-2006 Count of ZDHOs*** 2000 1361 2250 5611
Percentage ZDHOs 29.9% 11.3% 22.8% 19.6%
Interval 2: Total Count of Zip Codes 6243 11447 9186 26906 2006-2011 Count of ZDHOs 2239 1945 2425 6609
Percentage ZDHOs 35.9% 17.0% 26.4% 24.6%
Change in ZDHOs 239 584 175 998
Adjusted Change in ZDHOs 256 616 188 1061
% Change in ZDHOs 12.8% 45.2% 8.3% 18.9%
* Within Metropolitan Statistical Areas ** Excluding zip codes located in Urbanized Areas *** Zip codes with a net decline in housing occupancy
Table 22.2 Summary statistics for Northeastern zip code district housing occupancy
Urbanized Metropolitan Rural and Total
Areas Statistical Small Towns Areas
Interval 1: Total Count of Zip Codes 1918 1966 1298 5182 2000-2006 Count of ZDHOs 434 185 170 789
Percentage ZDHOs 22.6% 9.4% 13.1 15.2%
Interval 2: Total Count of Zip Codes 1859 1874 1221 4954 2006-2011 Count of ZDHOs 560 274 212 1046
Percentage ZDHOs 30.1% 14.6% 17.4% 21.1%
Change in ZDHOs 126 89 42 257
Adjusted Change in ZDHOs 130 93 45 269
% Change in ZDHOs 30.0% 50.5% 26.3% 34.1%
270
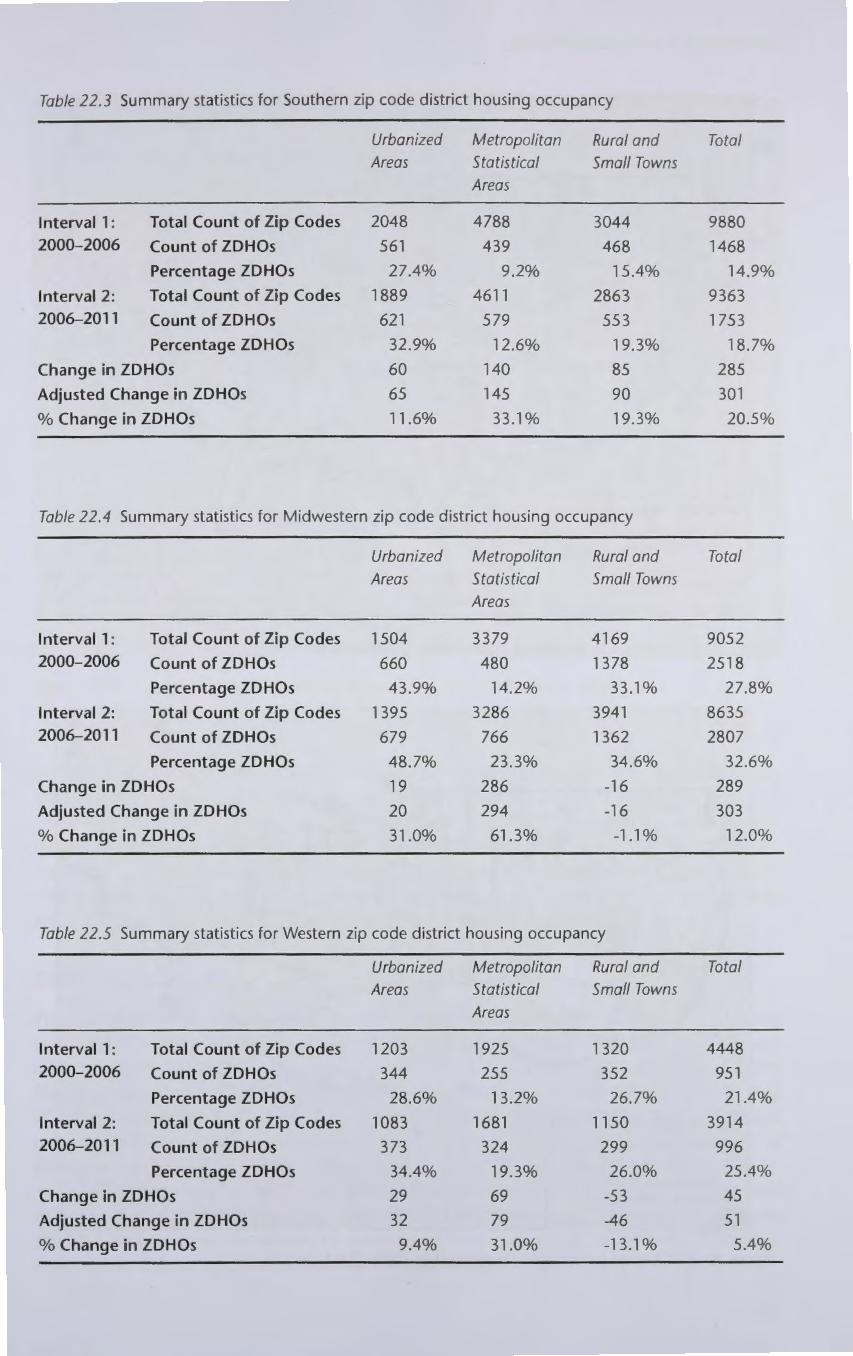
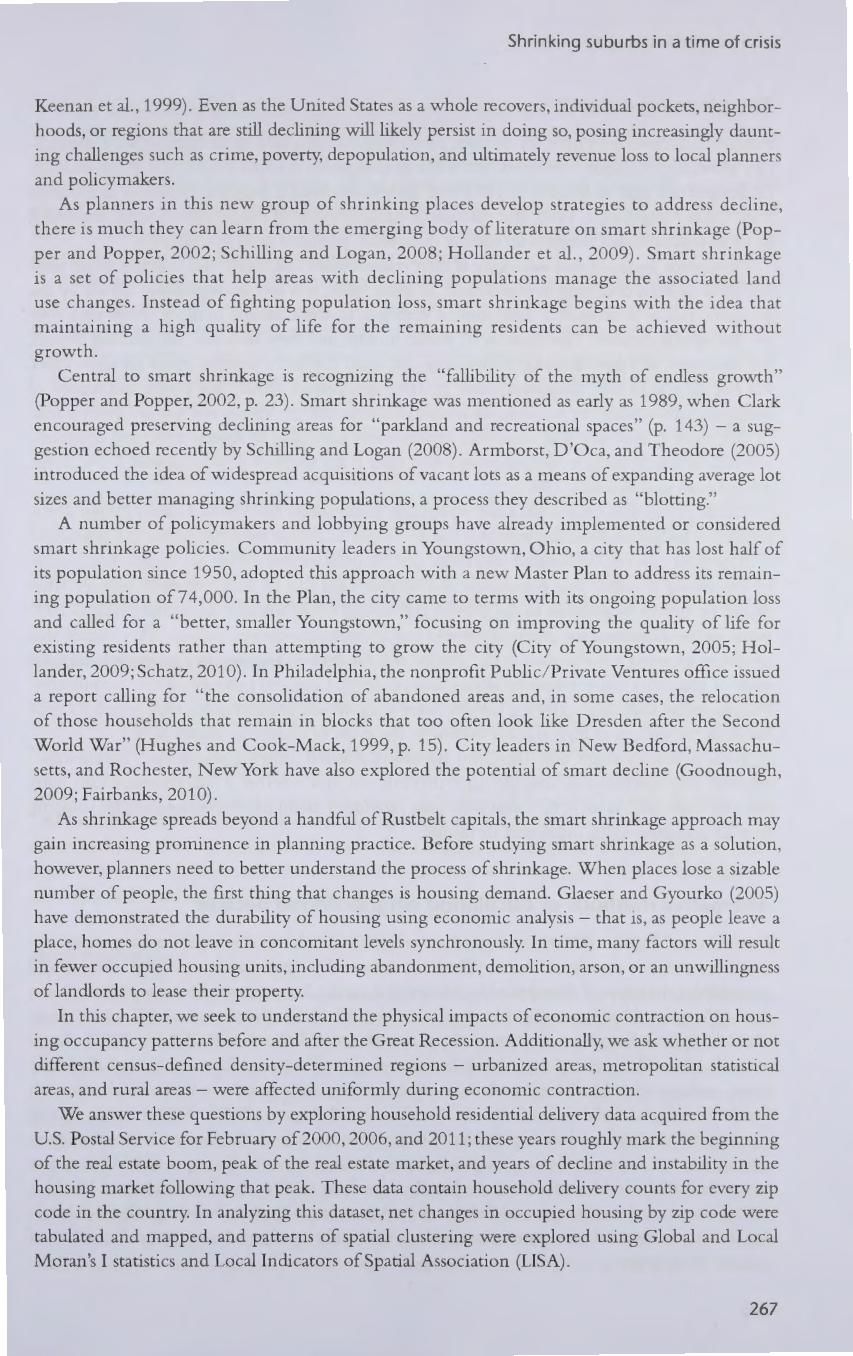
Table 22.3 Summary statistics for Southern zip code district housing occupancy
Urbanized Metropolitan Rural and Total Areas Statistical Small Towns
Areas
Interval 1: Total Count of Zip Codes 2048 4788 3044 9880 2000-2006 Count of ZDHOs 561 439 468 1468
Percentage ZDHOs 27.4% 9.2% 15.4% 14.9%
Interval 2: Total Count of Zip Codes 1889 4611 2863 9363 2006-2011 Count of ZDHOs 621 579 553 1753
Percentage ZDHOs 32.9% 12.6% 19.3% 18.7%
Change in ZDHOs 60 140 85 285
Adjusted Change in ZDHOs 65 145 90 301
% Change in ZDHOs 11.6% 33.1% 19.3% 20.5%
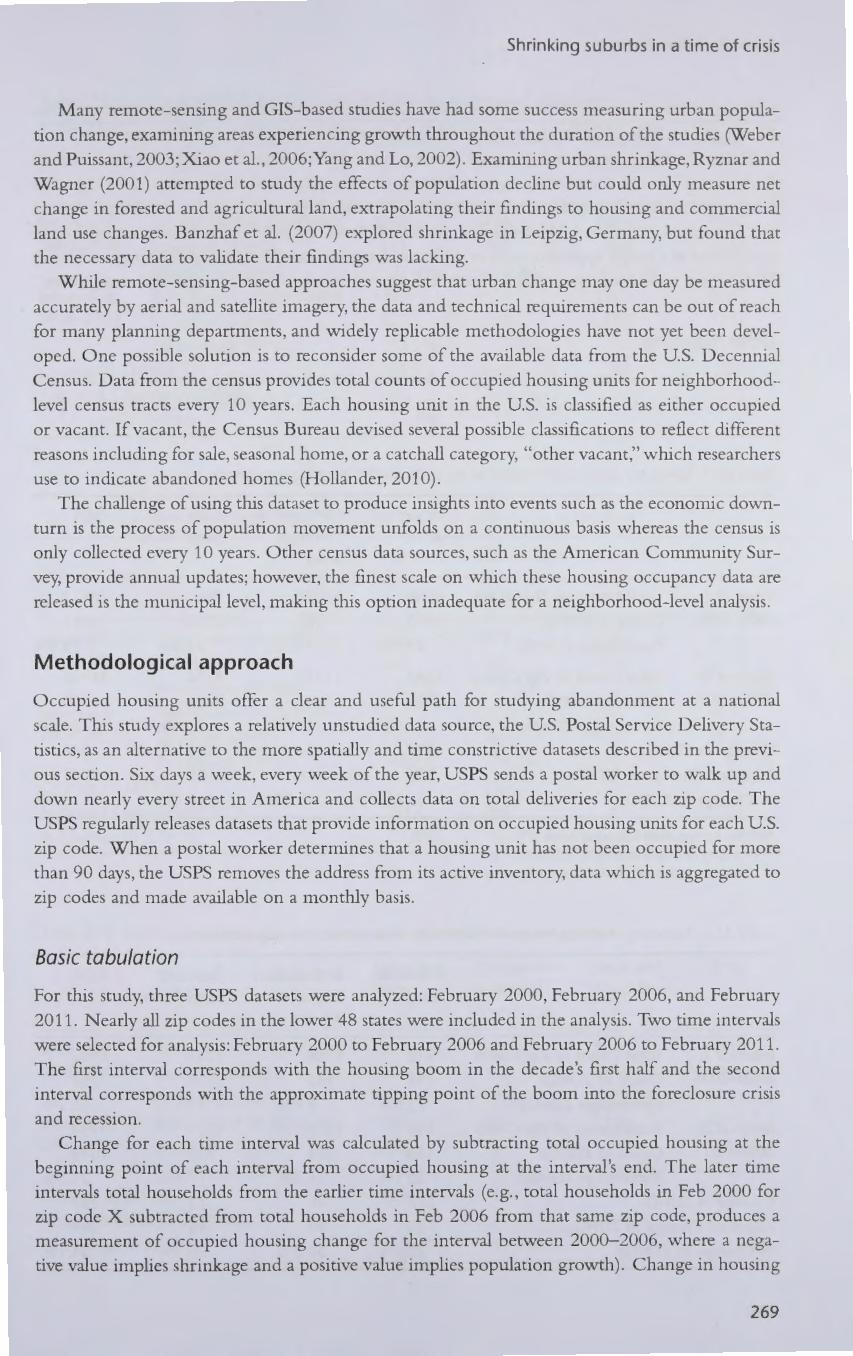
Table 22.4 Summary statistics for Midwestern zip code district housing occupancy
Urbanized Metropolitan Rural and Total Areas Statistical Small Towns
Areas
Interval 1: Total Count of Zip Codes 1504 3379 4169 9052 2000-2006 Count of ZDHOs 660 480 1378 2518
Percentage ZDHOs 43.9% 14.2% 33.1% 27.8%
Interval 2: Total Count of Zip Codes 1395 3286 3941 8635 2006-2011 Count of ZDHOs 679 766 1362 2807
Percentage ZDHOs 48.7% 23.3% 34.6% 32.6%
Change in ZDHOs 19 286 -16 289
Adjusted Change in ZDHOs 20 294 -16 303
% Change in ZDHOs 31.0% 61.3% -1.1% 12.0%
Table 22.5 Summary statistics for Western zip code district housing occupancy
Urbanized Metropolitan Rural and Total Areas Statistical Small Towns
Areas
Interval 1: Total Count of Zip Codes 1203 1925 1320 4448 2000-2006 Count of ZDHOs 344 255 352 951
Percentage ZDHOs 28.6% 13.2% 26.7% 21.4%
Interval 2: Total Count of Zip Codes 1083 1681 1150 3914 2006-2011 Count of ZDHOs 373 324 299 996
Percentage ZDHOs 34.4% 19.3% 26.0% 25.4%
Change in ZDHOs 29 69 -53 45
Adjusted Change in ZDHOs 32 79 -46 51
% Change in ZDHOs 9.4% 31.0% -13.1 % 5.4%
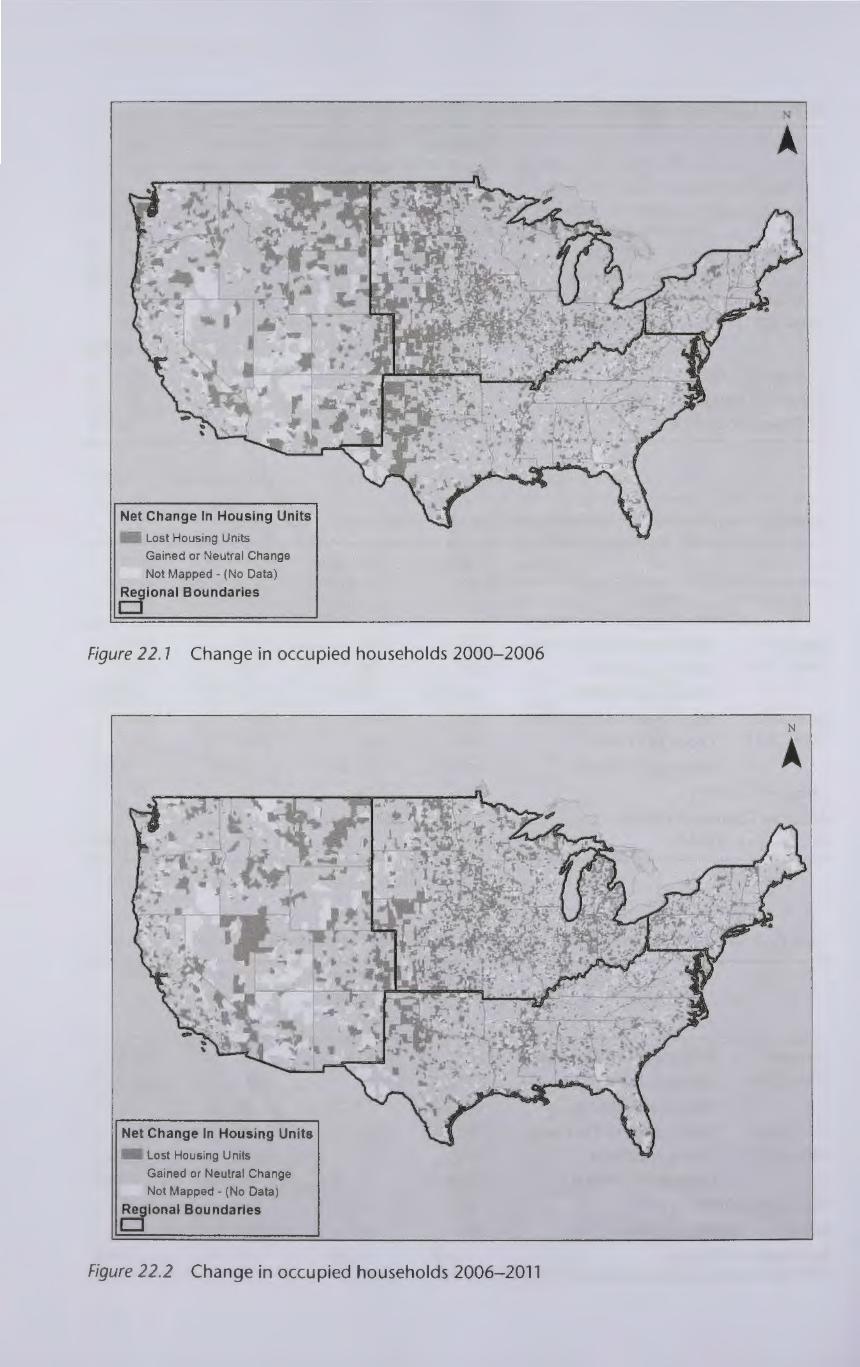
Net Change In Housing Units
Lost Housing Units
Gained or Neutral Change
Not Mapped - (No Data)
Regional Boundaries D
Figure 22. 1 Change in occupied households 2000-2006
Net Change In Housing Units
Lost Housing Units
Gained or Neutral Change
Not Mapped - (No Data)
Regional Boundaries D
Figure 22.2 Change in occupied households 2006-2011
A

Shrinking suburbs in a time of crisis
Net Change In Housing Occupancy Between Periods
Net Gain from 2000-2006 And Loss From 2006-2011 Net Gain In Both Periods
Net Loss from 2000-2006And Gain From 2006-2011 Not Mapped - (No Data)
Net Loss In Both Periods Regional Boundaries Cl
Figure 22.3 Occupied housing trends: comparing 2000-2006 with 2006-2011
national summary map (see Figure 22.3) showing trends over the full 11-year span by highlight
ing zip codes that declined in both intervals, Interval 1 only, and Interval 2 only.
To quantify severity of declines , maps were also created for all declining zip codes in each
interval, showing what housing percentage was lost in these zip codes ( ee Figures 22.4 and 22. 5).
Declining zip codes from Interval 1 were divided into quartiles based on the percentage of the
total housing stock lost during that interval. The quartile cutoff points for the first interval were
applied to Interval 2 as well, to contrast how severe declines were for each interval.
Global and local indicators of spatial autocorrelation
Prior research has shown contagion effects for decline at the sub-neighborhood level (Harding et al., 2009). To test this, two univariate measures of spatial autocorrelation, Global Moran's I and
a Local Indicator of Spatial Association (LISA), are used to explore spatial clustering of USPS
Housing Unit Occupancy Change (cf. Anselin, 1995). These tests identify geographic du tering
of zip codes showing statistically similar occupancy trends. Identifying adjacent declining clusters not only shows where "contagion effects" have been prevalent, but also elucidates "hot spots" of
hrinkage (and growth) across the United States for each time interval. The Global Moran's I analysis is employed to examine if household mail recipient losses and/
or gains occurred in neighboring zip codes. Where the global statistic is statistically significant,
the LISA analysi maps the cluster by partitioning them into groups of zip codes exhibiting
anomalously high or low values, relative to the national mean.
273

Percent Housing Lost
More than 10%
5%-10%
1%-5%
Less than 1%
DNo Net Loss
Regional Boundaries CJ
Figure 22.4 Percentage occupied housing lost 2000-2006
Percent Housing Lost
More than 10%
5%-10%
1%-5%
Less than 1%
0No Net Loss
Regional Boundaries CJ
Figure 22.5 Percentage occupied housing lost 2006-2011
N
A
Shrinking suburbs in a time of crisis
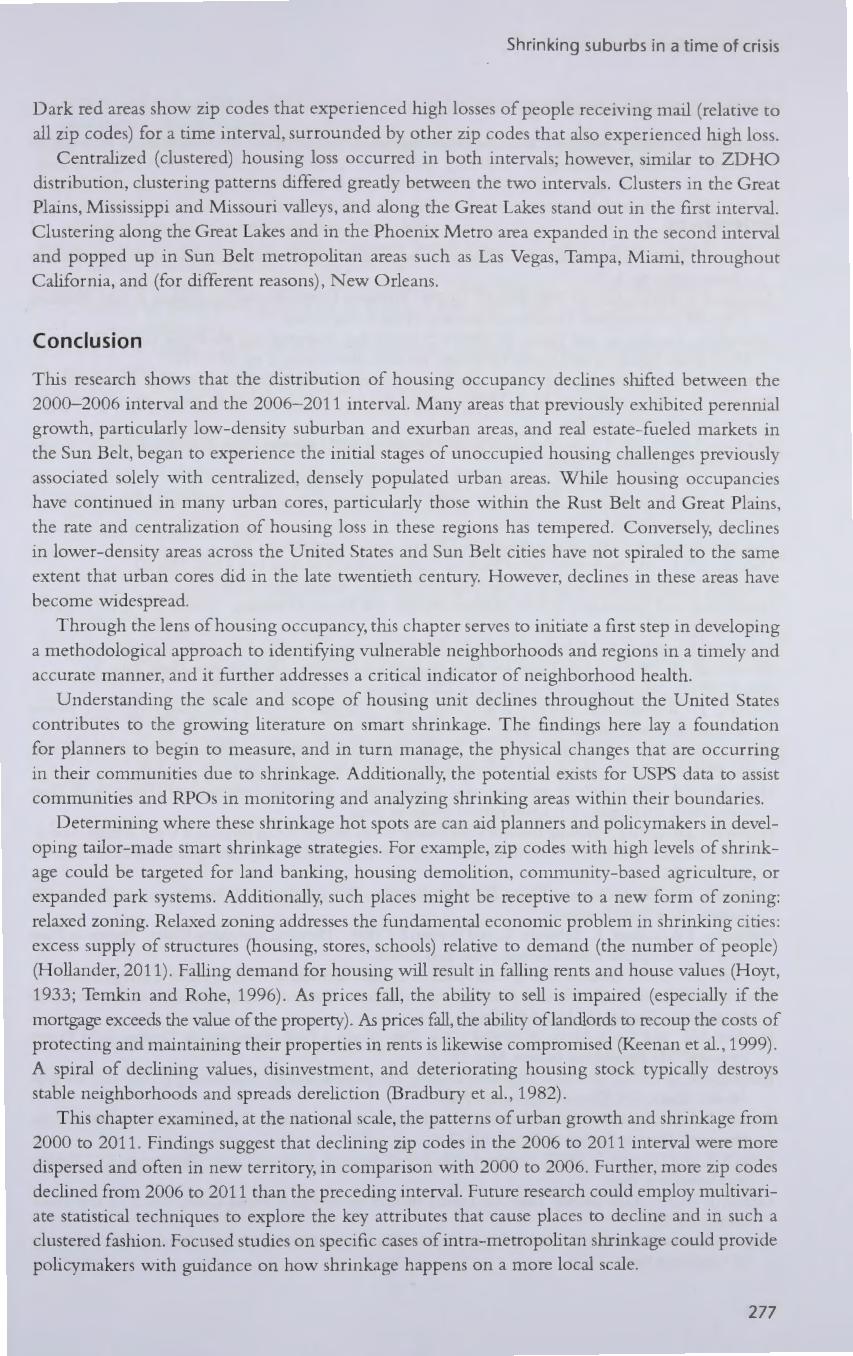
Each zip code in a cluster is labeled according to four pos ible categorie in the LI A te t:
1) High-High du tering - zip codes that experienced anomalously high growth urrounded by zip code that also experienced anomalously high growth;
2) Low-Low clustering - zip codes that experienced anomalously high lo urrounded by zip codes that also experienced anomalously high loss;
3) Low-High clustering - declining zip codes surrounded by gaining zip codes;
4) High-Low clustering - gaining zip codes surrounded by declining zip code .
Of these results, only low-low results, indicating homogeneous local clustering of zip codes
anomalously below the national mean were mapped. Only zip codes that shared a border (the
"Queen's" first-order contiguity matrix) were defined as being "neighbors."
Methodological considerations
Similar to remotely sensed and census data sources, using zip codes to measure urban shrinkage
comes with a number of methodological concerns. Zip code boundaries occasionally change.
In some cases, zip codes are eliminated; in other cases, two or more neighboring zip codes may
be merged. In both cases, our calculations for such zip codes nught indicate spuriou losse or
gains. Luckily, the Postal Service makes these changes available through their biweekly publica
tion, The Postal Bulletin, enabling an analysis of how much these changes might impact analysis.
Between 2000-2011, of the roughly 30,000 zip codes in the United States, roughly 130 zip codes
on average changed boundaries per year. Any zip code that had a boundary change was omitted
from the analysis.
Additional zip codes were omitted from the 2006-2011 interval in instances where the hous
ing total went from a positive number in 2006 to zero occupied housing units in 2011. While it
is conceptually possible that a zip code could lose its entire housing stock, our preliminary analysis
identified 356 egregious cases where a zip code containing many housing units in 2006 - thousands in some cases - would be reduced to 0 in 2011.
In addition to these challenges, zip codes face many issues common to census, town, or oth
erwise zonal datasets. The number of occupied housing units within a zip code is a one-dimen
sional metric, and negative changes may be unrelated to neighborhood decline. For instance,
a zip code could lose households if a new civic center is built and residences demolished or if
multi-family homes are converted into single-family.
Findings
Absolute change in housing occupancy
This analysis of the USPS dataset revealed a number of trends that provide new and expanded insight into the spatial context in which we understand the Great Recession and subprime lend
ing crisis' impact. Additionally, it provides a previously unavailable, imitable tool for periodic
analysi of national and regional housing trends. As expected, m.ore zip codes had a decline in occupied housing in the 2006-2011 interval than the 2000-2006 interval (see Table 22.1).
ationally, 998 more zip codes lost housing in the latter interval, resulting in a 19.6 percent
increa e in declining zip codes over the previous interval. Each of the national sub-regions examined in thi study experienced an increa e in Zip
Code District H ousing O ccupancy (ZDHOs) in the second interval. However, the magnitude
275

Justin B. Hollander, et al.
of that change was not uniform across urban areas. In both intervals, Urbanized Area had the highest percentage of ZDHOs, rural areas and mall towns the second highe t, and Metropolitan tatistical Areas the lowe t. However, Metropolitan tatistical Area had far and away the largest
increase in ZDHOs in the second interval. The finding that less den ely populated ection of metropolitan areas outside of the urban core showed the greatest percentage change in ZDHOs wa consistent with findings limited to the subdivision of Urbanized Areas (Zinder, 2009).
All four of the regions examined experienced an increase in ZDHO . The Midwest had the greate t overall percentage of ZDHOs in both intervals, followed by the West, orthea t, and South, re pectively. However, the West and Midwest had the smallest percentage increa e of ZDHOs between the two intervals. The Northeast had the greatest percentage increase in
ZDHOs. The two largest subregion percentage changes in ZDHOs occurred within Metropolitan Statistical Areas in the Midwest and Northeast, respectively. The only two sub-regions that did not show an increase in ZDHOs were Midwestern and Western Rural and Small Town. The second interval was not only notable for an overall increase in ZDHOs but also for an increased
migration in the distribution of ZDHOs from urban centers into suburban and exurban area .
Comparing spatial distribution of ZDHOs between intervals
Only 9.3 percent of zip codes nationally declined in both intervals (see Figure 22.3). The majority of the ZD HOs only declined in one of the intervals, with 11.1 percent of zip codes nationally only declining in the first interval and 15.2 percent of the zip codes only declining in the ec
ond interval. The Midwest had the most continuity between the two intervals, but each region showed volatility in new areas for the second interval. Thus, the second interval was not only
marked by a general increase in ZDHOs, but by a widespread number of zip codes and regions whose housing occupancy reversed from growth to decline. Conversely, many previously declin
ing regions, notably the High Plains and Pacific Northwest, began to see reversal patterns towards
growth in the econd interval.
Magnitude
While the second interval has been thus far characterized as having more widespread and new instances of decline, the first interval was better characterized as having the sharpest declines.
Housing occupancy of 50 percent of all ZDHOs declined by more than 3.5 percent in the first interval whereas only 29. 9 percent declined at that rate in the second interval. These trends were
fairly consistent regionally for the first interval with the Midwest and South, as well as rural
and mall towns experiencing slightly disproportionate numbers of ZDHOs that lo t over 3. 5
percent of their housing stock. Regions with a high number of zip codes that declined only in
the econd interval tended to have a high percentage of ZDHOs with housing occupancy lo ses below 1. 4 percent.
Global Moran's I and LISA
The re ults of the Moran' I global autocorrelation test indicated gaining and losing zip code
tended to du ter on the land cape. This was true in both time intervals, with Moran's I re ult
0.16 (p < 0.05) for the 2000-2006 interval and 0.24 (p < 0.05) for the 2006-2011 interval.
Thi prompted u to perform a Local Indicator of Spatial Autocorrelation (LI A) to determine where thi patial du tering occurred. The e result are een in Figure 22.3 and 22.4, focu ing only on tati tically ignificant (p < 0.05) zip code that had a net lo of occupied hou ehold .
276
Shrinking suburbs in a time of crisis
Dark red area show zip codes that experienced high lo e of people receiving mail (relati e to
all zip codes) for a time interval, surrounded by other zip code that al o experienced high lo .
Centralized (du tered) hou ing loss occurred in both interval ; however imilar to ZDH
distribution du tering pattern differed greatly between the two interval . Clu ter in the Great
Plains, Missis ippi and Missouri valleys, and along the Great Lake stand out in the first interval. Clu tering along the Great Lakes and in the Phoenix Metro area expanded in the econd inter al
and popped up in Sun Belt metropolitan areas uch a Las Vega , Tampa Miami, throughout California, and (for different reason ) , ew Orleans.
Conclusion
This re earch show that the distribution of housing occupancy declines hifted between the
2000-2006 interval and the 2006-2011 interval. Many areas that previou ly exhibited perennial
growth, particularly low-density suburban and exurban areas, and real e tate-fueled market in
the Sun Belt, began to experience the initial stages of unoccupied housing challenges previously
associated olely with centralized, densely populated urban areas. While housing occupancie
have continued in many urban cores, particularly those within the Rust Belt and Great Plains,
the rate and centralization of housing loss in these regions has tempered. Conversely, decline
in lower-density areas across the United States and Sun Belt cities have not spiraled to the ame
extent that urban cores did in the late twentieth century. However, declines in the e areas have
becom.e widespread.
Through the lens ofhou ing occupancy, thi chapter serves to initiate a first step in developing
a methodological approach to identifying vulnerable neighborhoods and regions in a timely and
accurate manner, and it further addresses a critical indicator of neighborhood health.
Understanding the scale and scope of housing unit declines throughout the United State
contributes to the growing literature on smart shrinkage. The findings here lay a foundation
for planners to begin to measure, and in turn manage, the physical changes that are occurring
in their communities due to shrinkage. Additionally, the potential exists for USPS data to assi t
communities and RPOs in monitoring and analyzing shrinking areas within their boundaries.
Determining where these shrinkage hot spots are can aid planners and policymakers in devel
oping tailor-made smart shrinkage trategies. For exan1ple, zip codes with high levels of shrink
age could be targeted for land banking, housing dem.olition, community-based agriculture, or
expanded park systems. Additionally, such places might be receptive to a new form of zoning:
relaxed zoning. Relaxed zoning addresses the fundamental economic problem in shrinking cities:
excess upply of structures (housing, stores, schools) relative to demand (the number of people)
(Hollander, 2011). Falling demand for housing will result in falling rents and house value (Hoyt,
1933· Temkin and Rohe, 1996). A pr.ices fall, the ability to sell is impaired (especially if the
mortgage exceeds the value of the property). As prices fall, the ability oflandlords to recoup the co ts of
protecting and maintaining their propertie in rents is likewise compromised (Keenan et al., 1999).
A spiral of declining values, disinvestment, and deteriorating housing stock typically destroys
stable neighborhood and spreads dereliction (Bradbury et al., 1982).
Thi chapter examined, at the national scale, the patterns of urban growth and shrinkage from
2000 to 2011. Findings suggest that declining zip codes in the 2006 to 2011 interval were more disper ed and often in new territory, in comparison with 2000 to 2006. Further, more zip codes
declined from 2006 to 2011 than the preceding interval. Future research could employ multivariate tati tical techniques to explore the key attributes that cause place to decline and in such a
du tered fashion. Focused studie on specific cases of intra-metropolitan shrinkage could provide
policymaker with guidance on how hrinkage happens on a more local cale.
277
Justin B. Hollander, et al.
Guide to further reading
Hollander, J.B. (2011) unburnt Cities: The Great Recession, Depopulation and Urban Planning in the American unbelt. ew York: Routledge.
References
An elin, L. (1995) "Local Indicators of Spatial Autocorrelation: LISA." Regional Research Institute Research Chapter, 9331, pp. 1-26.
Armborst, T., D'Oca, D., and Theodore, G. (2005) "However Unspectacular." In: Oswalt, P. (ed.) hrinking Cities, Vol. 2: Interllentions. Ostfildern, Germany: Hatje Cantz Verlag.
Banzhaf, E., Kindler, A., and Haase, D. (2007) "Monitoring, Mapping and Modeling Urban Decline: A Multi-Scale Approach for Leipzig, Germany." EARSeL eProceedings, 2, pp. 101-114.
Beauregard, R.A. (2003) Voices of Decline: The Postwar Fate of US. Cities. 2nd ed. ew York: Routledge. Bowman, A.O'M. and Pagano, M.A. (2000) Vacant Land in Cities: An Urban Re Source. Washington, DC:
Brookings Institution Press. Bowman,A.O'M. and Pagano,M.A. (2004) Terra Incognita:Vacant Land and Urban trategies. Washington, DC:
Georgetown University Press. Boyer, M.C. (1983) Dreaming the Rational City. Cambridge, MA: MIT Press. Bradbury, K.L., Downs, A., and Small, K.A. (1982) Urban Decline and the Future of American Cities. Washing-
ton, DC: Brookings Institution Press. City ofYoungstown (2005) Youngstown 2010 Citywide Plan. Youngstown, OH. Dash, E. (2011) "Banks Amass Glut of Homes, Chilling Sales." The ew York Times, May 23. Fairbanks, P. (2010) "Shrinking of Cities Catches Traction." Buffalo ews, August 3. Glaeser, E.L. and Gyourko, J. (2005) "Urban Decline and Durable Housing." Journal of Political Economy,
113(2), pp. 345-375. Goodman, P.S. (2007) "This Is the Sound of a Bubble Bursting." The ew York Times, December 23. Goodnough, A. (2009) "Hard Times for New England's 3-Deckers." The ew York Times, June 20. Hall, P. (1997) "Modeling the Post-Industrial City." Futures, 29(4/5), pp. 311-322. Harding, J.P.,Rosenblatt,E.,andYao, V.W (2009) "The Contagion Effect ofForeclosed Propertie ."Journal
of Urban Economics, 66, pp. 164-178. Hillier, A.E., Culhane, D.P., Smith, T.E., and Tomlin, D.C. (2003) "Predicting Housing Abandonment with
the Philadelphia Neighborhood Information System." J Urban Affairs, 25(1), pp. 91-105. Hollander, J.B. (2009) Polluted and Dangerous: America's Worst Abandoned Properties and What Can Be Done
about Them. Burlington, VT: University of Vermont Press. Hollander, J.B. (2010) "Moving towards a Shrinking Cities Metric: Analyzing Land Use Changes Associ
ated with Depopulation in Flint,Michigan." Cityscape: A Journal of Policy Development and Research, 12(1), pp. 133-151.
Hollander, J.B. (2011) unburnt Cities: The Great Recession, Depopulation and Urban Planning in the American unbelt. ew York: Routledge.
Hollander, J.B., Pallagst, K., Schwarz, T., and Popper, F. (2009) "Planning Shrinking Cities." Progress in Planning, 72, p. 3 ( pecial issue: Emerging Research Areas).
Hoyt H. (1933) One Hundred Years of Land Values in Chicago. Chicago, IL: Univer ity of Chicago Pre . Hoyt, L. and Leroux, A. (2007) Voices from Forgotten Cities: Innovative Revitalization Coalitions in America's Older
mall Cities. Cambridge, MA: MIT Pre s. Hughe , A.H. and Cook-Mack, R. (1999) "The City eeds a Fresh Approach to Dealing with Vacant
Property." The Philadelphia Inquirer, May 23. Immergluck, D. (2011) Foreclosed: High-Risk Lending, Deregulation, and the Undermining of America's Mortgage
Market. Ithaca, NY: Cornell Univer ity Pre . Keenan, P., Lowe, ., et al. (1999) "Hou ing Abandonment in Inner Citie : The Politics of Low Demand for
Hou ing." Housing tudies, 14(5), pp. 703-716. Lang, R.E. and Lefurgy, J. (2007) Boon-iburbs: 71ie Rise of America's Accidental Cities. Washington, D : Brook
ings In titution Pres . Leland, J. (2007) "Official ay They Are Falling Behind on Mortgage Fraud Ca e ." 11ie ew York Times,
December 25. Logan, JR. and Molotch, H .L. (1987) rba11 Fortunes: 11ie Political Economy of Place. Berkeley, A: U niver ity
of alifornia Pre .
278
Shrinking suburbs in a time of crisis
Lucy, WH. and Phillip , D.L. (2000) Confronting uburban Decline: trategic Pla1111ingfor 1'tfetropolitan Renewal. Washington, DC: I land Press.
Lucy, WH. and Phillip , D.L. (2006) Today's Cities, Tomorrow's Suburbs. Chicago, IL: Planners Pre Oswalt, P (ed.) (2006) Shrinking Cities, vol. 2: Interventions. Ostfildern: Harje Cantz Verlag. Popper, D.E. and Popper, FJ. (2002) "Small Can Be Beautiful." Planning July pp. 20-21. Runfola, D.M. and Hankin , K. (2010) "Urban Dereliction as Environmental Inju tice." ACME: An Inter
national E-Journal for Critical Geographies, 9(3), p. 345. Ryznar, R. and Wagner, T. (2001) "Using Remotely Sen ed Imagery to Detect Urban Change." Journal of
the American Planning Association, 67, pp. 327-336. Schatz, L. (2010) What Helps or Hinders the Adoption of "Good Planning}) Principles in hrinki11g Cities? A
Comparison of Recent Planning Exercises in Sudburi Ontario and Youngstown, Ohio, PhD di . Waterloo: University of Waterloo.
Schilling, J. and Logan, J. (2008) "Greening the Rust Belt." Journal of the American Planning Association, 7 4( 4) pp. 451-466.
Schumpeter, J. (1934) The Theory of Economic Development. Cambridge, MA: Harvard University Pre . Temkin,K. and Rohe, WM. (1996) "Neighborhood Change and Urban Policy."Journal of Planning Education
and Research, 15(3), pp. 159-170. Wallace, R. (1989) "Homelessnes , Contagiou Destruction of Housing and Municipal Service Cuts in ew
York City: 1. Demographics of a Housing Deficit." Environment and Planning A, 21, pp. 1285-1603. Weber, C. and Puissant, A. (2003) "Urbanization Pressure and Modeling of Urban Growth: Example of
the Tunis Metropolitan Area." Remote Sensing of Environment, 86(3), pp. 341-352. Available at: http: // linkinghub. else vier. co ml retrieve/ pii/S00 344 2 5 7 0 3000 7 7 4.
Wilson, D. and Margulis, H. (1994) "Spatial Aspects of Housing Abandonment in the 1990s: The Cleveland Experience." Housing Studies, 9(4), pp. 493-511.
Wilson, J.Q. and Kelling, G.L. (1982) "Broken Windows: The Police and Neighborhood Safety." The Atlantic, March.
Xiao, ]., et al. (2006) "Evaluating Urban Expansion and Land Use Change in Shijiazhuang, China, by Using GIS and Remote Sensing." Landscape and Urban Planning, 75(1-2), pp. 69-80. Available at: http:/ / linkinghub.elsevier.com/retrieve/ pii/S0169204605000058.
Yang, X. and Lo, C. (2002) "Using Satellite Imagery to Detect Land Use Land Cover Changes in Atlanta, Georgia M etropolitan Area." International Journal of Remote Sensing, 23, pp. 1775-1798.
Zinder, D.H. (2009) Through the Rings: A Study of Housing Occupancy Declines across Major Urbanized Areas in the United States, Unpublished Master's Thesis. Department of Urban and Environn1ental Planning and Policy. Medford, MA: Tufts University.
279