Embed Size (px)
Citation preview
BioOne sees sustainable scholarly publishing as an inherently collaborative enterprise connecting authors, nonprofit publishers, academic institutions, researchlibraries, and research funders in the common goal of maximizing access to critical research.
Energy, Forest, and Indoor Air Pollution Models for Sagarmatha National Parkand Buffer Zone, NepalAuthor(s) :Franco Salerno, Gaetano Viviano, Sudeep Thakuri, Bastian Flury, Ramesh Kumar Maskey,Sanjay Nath Khanal, Dinesh Bhuju, Marco Carrer, Silu Bhochhibhoya, Maria Teresa Melis, FrancescoGiannino, Anna Staiano, Fabrizio Carteni, Stefano Mazzoleni, Annalisa Cogo, Atindra Sapkota, SandeepShrestha, Rojan Kumar Pandey, and Emanuela Chiara ManfrediSource: Mountain Research and Development, 30(2):113-126. 2010.Published By: International Mountain SocietyDOI: 10.1659/MRD-JOURNAL-D-10-00027.1URL: http://www.bioone.org/doi/full/10.1659/MRD-JOURNAL-D-10-00027.1
BioOne (www.bioone.org) is a a nonprofit, online aggregation of core research in the biological, ecological, andenvironmental sciences. BioOne provides a sustainable online platform for over 170 journals and books publishedby nonprofit societies, associations, museums, institutions, and presses.
Your use of this PDF, the BioOne Web site, and all posted and associated content indicates your acceptance ofBioOne’s Terms of Use, available at www.bioone.org/page/terms_of_use.
Usage of BioOne content is strictly limited to personal, educational, and non-commercial use. Commercial inquiriesor rights and permissions requests should be directed to the individual publisher as copyright holder.
Energy, Forest, and Indoor Air Pollution Models forSagarmatha National Park and Buffer Zone, NepalImplementation of a Participatory Modeling Framework
Franco Salerno1,2*, Gaetano Viviano1,2, Sudeep Thakuri1, Bastian Flury1, Ramesh Kumar Maskey3, Sanjay Nath Khanal3,
Dinesh Bhuju4, Marco Carrer5, Silu Bhochhibhoya3, Maria Teresa Melis1,6, Francesco Giannino7, Anna Staiano7,
Fabrizio Carteni7, Stefano Mazzoleni7, Annalisa Cogo1,8, Atindra Sapkota3, Sandeep Shrestha3, Rojan Kumar Pandey3, and
Emanuela Chiara Manfredi1,2
*Corresponding author: [email protected] Ev-K2-CNR Committee, Via San Bernardino 145, 24126 Bergamo, Italy2Water Research Institute-National Research Council, Via del Mulino 19, 20047 Brugherio (MB) Italy3 Kathmandu University, Dhulikhel, PO Box 6250, Kathmandu, Nepal4 Nepali Academy of Science and Technology, GPO Box 3323, Khumaltar, Lalitpur, Nepal5 University of Padova, TESAF Department, Viale dell’Universita 16, 35020 Legnaro (PD), Italy6 University of Cagliari, Department of Earth Science, Via Trentino 51, 09127 Cagliari, Italy7 University Federico II, Department of Agricultural Engineering and Agronomy, Via Universita 100, 80055 Portici (Napoli), Italy8 University of Ferrara, Via Gramicia 35, 44100 Ferrara, Italy
Open access article: please credit the authors and the full source.
This paper presents the
results of management-
oriented research on
energy, forest, and human
health issues in a remote
mountain area, the
Sagarmatha National Park
and Buffer Zone (SNPBZ),
Nepal. The research was
based on a broader,
integrated participatory framework ultimately intended for use
in adaptive management. The present study focused on the
application of a participatory modeling framework to address
problems related to energy demand and consumption, forest
condition, and indoor air pollution, which were defined by the
stakeholders as important issues to be addressed. The
models were developed using a generalizing design that
allows for user-friendly adaptation to other contexts (free
download at http://hkkhpartnership.org). Moreover, we
simulated management scenarios in collaboration with all
modeling actors with the aim of building consensus on the
understanding of the system as well as supporting decision-
makers’ capacity not only to respond to changes, but also to
anticipate them. Importantly, the system dynamics
assessment found that the SNPBZ forests are affected by an
increasing demand for fuelwood (occurring due to tourism
growth), as one of the main sources of energy. Selected
forests show an average reduction of 38% in forest biomass
from 1992 to 2008. This shows that the business-as-usualscenario is unlikely to result in the preservation of the current
forest status; in fact, such preservation would require 75% of
fuelwood to be replaced with alternative energy sources. At
the same time, a 75% reduction of fuelwood use (and an 80%
reduction of dung use) would reduce indoor carbon monoxide
(CO) concentrations to the standard limits for CO exposure set
by the World Health Organization.
Keywords: Participatory modeling; system dynamics; energy
management; forest management; indoor air pollution;
Sagarmatha National Park and Buffer Zone; Nepal.
Peer-reviewed: March 2010 Accepted: March 2010
Introduction
Energy is a prerequisite for the survival, development,and economic welfare of human beings. Various energysources have been explored by human society to fulfillenergy needs. However, biomass, especially wood, stillconstitutes a primary energy source in rural areas ofdeveloping countries (Nepal 2008). For example, in theHimalayan Mountain region, fuelwood is one of theprincipal sources of energy for cooking, space heating,and water heating in rural households (Rijal 1999).Fuelwood harvesting has been identified as one of the
most significant causes of forest decline in rural areas ofdeveloping countries (Bhatt and Sachan 2004). Many ruralareas are also major tourism attractions. The rise inhuman population and the uncontrolled growth oftourism in rural and remote tourist destinations hascreated great pressure on forestlands, resulting in theirdegradation and heavy depletion of the resource (Nepal2008). The situation is particularly serious in the fragileHimalayan ecosystem, which is facing large-scale forestdecline (Prasad 2000; Prasad et al 2001; Stevens 2003;Nepal 2008). Heavy exploitation of fuelwood can alsosignificantly affect both the environment, through
MountainResearchSystems knowledge
Mountain Research and Development (MRD)An international, peer-reviewed open access journalpublished by the International Mountain Society (IMS)www.mrd-journal.org
Mountain Research and Development Vol 30 No 2 May 2010: 113–126 http://dx.doi.org/10.1659/MRD-JOURNAL-D-10-00027.1 � 2010 by the authors113
emissions of greenhouse gases causing global warming(Omer 2008), and human health, through indoorcombustion in poorly ventilated houses (Pandey andBasnet 1987; Hessen et al 2001). Therefore, it is necessaryto develop and adopt renewable energy sources as analternative to present energy sources to ensure thesustainable use of natural resources, which are vital bothfor social–ecological systems (SESs) and for the tourismindustry in the Himalayan region.
Participatory modeling can provide a platform forintegrating scientific knowledge with local knowledge;when executed well, it provides an objective, value-neutral place for a diverse group of stakeholders tocontribute information regarding natural resource issuesof interest (Cokerill et al 2006). While participatorymodeling has been widely accepted and promoted, it hasalso been criticized by practitioners, natural resourcemanagers, and development scientists. Much of thecriticism revolves around the apparent lack of rigor,structure, and analytical framework provided by theseapproaches. The strength of these approaches lies in thehighly transparent and open-ended exploration of theissues, problems, and objectives that characterize thecomplex environment typical of many resourcemanagement situations. It is imperative to have a generalmechanism or comprehensive framework (Cooke andKothari 2002).
Salerno et al (2010) address this problem by proposinga 5-module framework coupling hard and softmethodology for the development of participatorymodeling that enables an overall modeling process; thisframework has its roots in adaptive management,computer-supported collaborative work, and SES theory.The process begins with a participant-led system bounding(Module 1), including a historical profile, assessments ofissues and drivers, and the development of a commonunderstanding of the future. Module 2 (qualitative modeling)represents the conceptualization of the system, exploringthe SES in an iterative way. Management-oriented research(Module 3) uses the outputs from Modules 1 and 2,defining data requirements to supplement mental modelswith quantitative relationships. Module 4 (quantitativemodeling) makes it possible to properly anticipate systemchange employing mathematical models, theories, andhypotheses pertaining to natural phenomena. Adaptivemanagement (Module 5) is a stakeholder evaluation of theprocess and outcomes in terms of policy and managementimplications. The present paper applies this methodologyand framework to support the participatory modeling ofenergy management issues and the relevant impacts onforests and human health. The case study presented wasconducted from 2006 to 2009 in the Sagarmatha NationalPark and Buffer Zone (SNPBZ), Nepal.
After identifying key actors, scenario planning(Daconto and Sherpa 2010) was used to identify thedrivers and key issues of the SES, and simple qualitative
models of past and future dynamics were created. In whatfollows, we describe the main features of our case study aswell as the key management constraints identifiedthrough the first scenario planning session withconcerned stakeholders (Module 1). We continue with adescription of the methods used to collect the data—inthe literature and in the field, according to amanagement-oriented research plan—that wereidentified as necessary to address the management issuesselected by the stakeholders. This is followed by apresentation of the data themselves from a management-oriented perspective (Module 3). For each modeldeveloped, we briefly present its aims and qualitativedesign, combining Modules 2 and 4, while we focus moreextensively on presenting management scenarios (Module5). In closing, we elaborate our lessons learned, drawingconclusions for a broader application of the adoptedparticipatory modeling framework.
Social-ecological system (SES) bounding
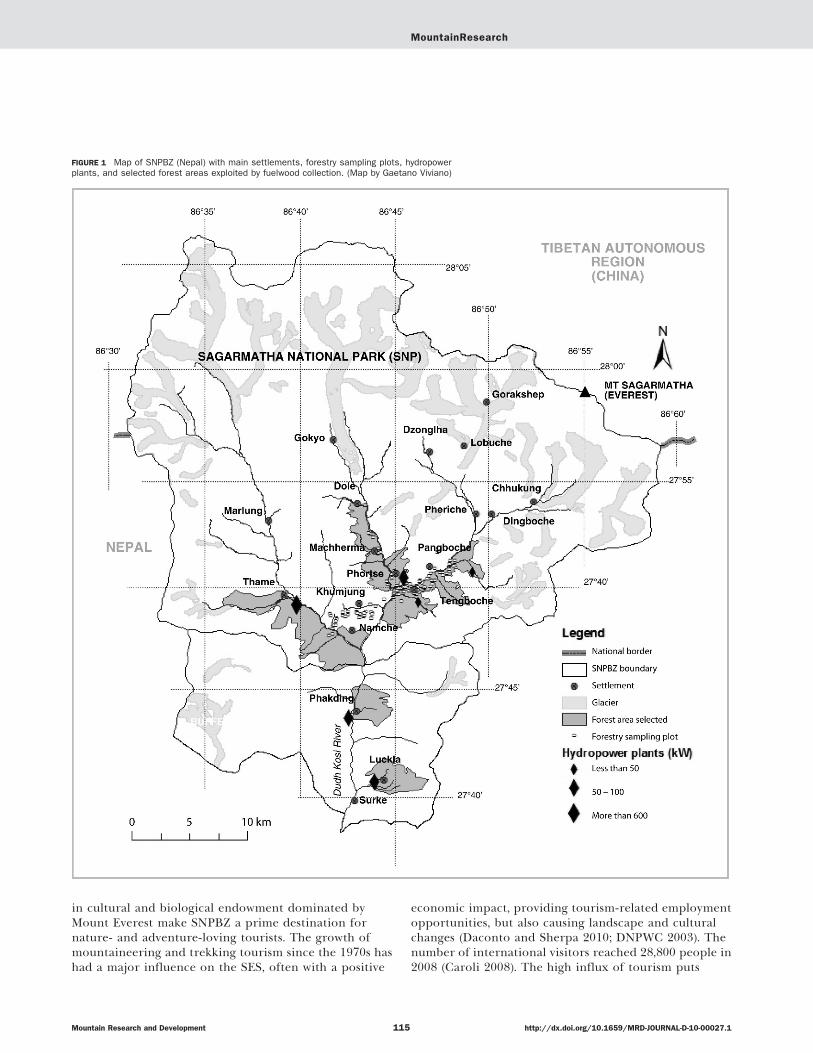
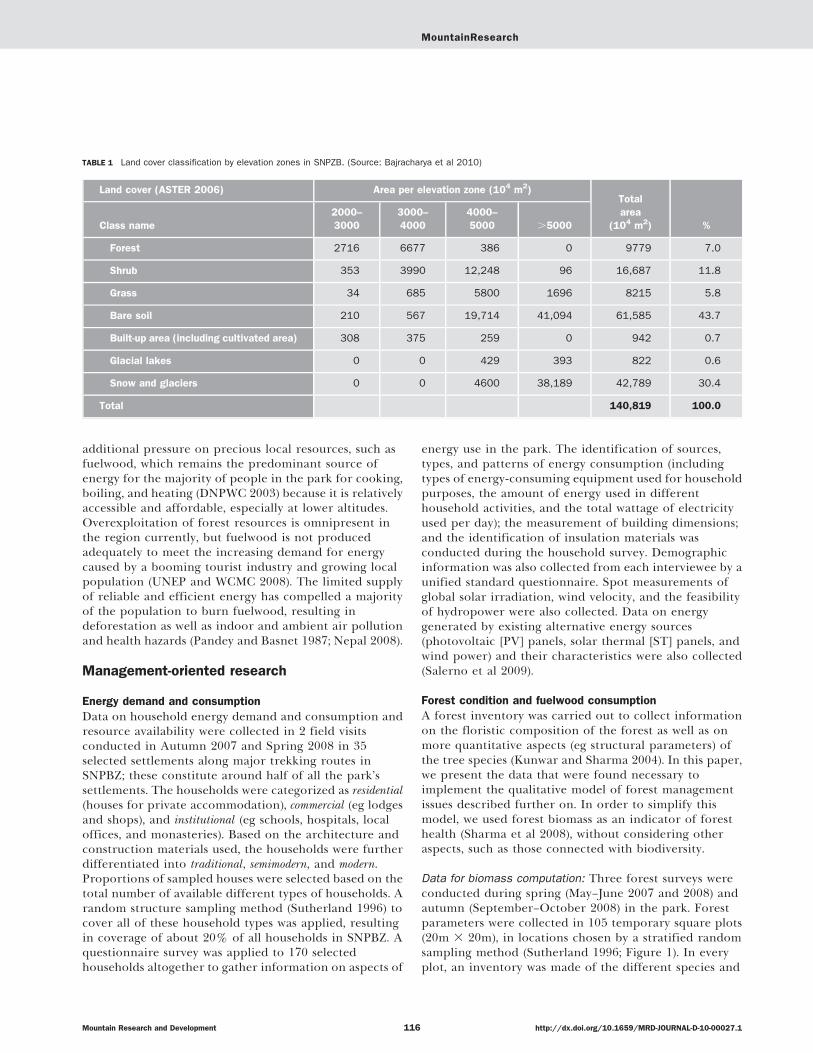
SNPBZ is situated in the northeastern part of Nepal,amidst the world’s highest peaks. The park encompassesextremely rugged terrain, deeply incised valleys, andglaciers; the elevation ranges from 2300 m (Surke villagein the BZ) to the summit of Mount Sagarmatha (Nepaliname of Mount Everest) at 8848 m (Figure 1). It spreadsover a total area of about 1400 km2, including the uppercatchment of the Dudh Kosi River basin. Byers (2005) andSalerno et al (2008) have described the climatic andphysical–chemical features of SNPBZ, which aredetermined by the monsoon regime with mostprecipitation (70–80%) occurring between June andSeptember. Although relatively small in size, SNPBZ has abroad range of bioclimatic conditions, with 4 bioclimaticzones: a forested lower zone; a zone of alpine scrub; theupper alpine zone, which includes the upper limit ofvegetation growth, and the Arctic zone, where no plantscan grow (United Nations Environment Programme[UNEP] and World Conservation Monitoring Centre[WCMC] 2008). Land cover classes for elevation ranges inSNPBZ are summarized in Table 1, which shows thatalmost one third of the territory is characterized by snowand glaciers, while less than 10% of the park area isforested.
In 2008, the park included about 100 settlements with6221 local residents, mostly of the Sherpa people, withover 1892 head of livestock. Although in many villages,traditional agriculture and animal husbandry are still themain sources of livelihood, more recently the localeconomy has become dependent upon tourism andtourism-related activities (climbing, portering, guiding,and lodge management), which represent increasinglyimportant employment sources for local communities(Department of National Park and Wildlife Conservation[DNPWC] 2003). Exceptional natural beauty and diversity
MountainResearch
Mountain Research and Development http://dx.doi.org/10.1659/MRD-JOURNAL-D-10-00027.1114
in cultural and biological endowment dominated byMount Everest make SNPBZ a prime destination fornature- and adventure-loving tourists. The growth ofmountaineering and trekking tourism since the 1970s hashad a major influence on the SES, often with a positive
economic impact, providing tourism-related employmentopportunities, but also causing landscape and culturalchanges (Daconto and Sherpa 2010; DNPWC 2003). Thenumber of international visitors reached 28,800 people in2008 (Caroli 2008). The high influx of tourism puts
FIGURE 1 Map of SNPBZ (Nepal) with main settlements, forestry sampling plots, hydropowerplants, and selected forest areas exploited by fuelwood collection. (Map by Gaetano Viviano)
MountainResearch
Mountain Research and Development http://dx.doi.org/10.1659/MRD-JOURNAL-D-10-00027.1115
additional pressure on precious local resources, such asfuelwood, which remains the predominant source ofenergy for the majority of people in the park for cooking,boiling, and heating (DNPWC 2003) because it is relativelyaccessible and affordable, especially at lower altitudes.Overexploitation of forest resources is omnipresent inthe region currently, but fuelwood is not producedadequately to meet the increasing demand for energycaused by a booming tourist industry and growing localpopulation (UNEP and WCMC 2008). The limited supplyof reliable and efficient energy has compelled a majorityof the population to burn fuelwood, resulting indeforestation as well as indoor and ambient air pollutionand health hazards (Pandey and Basnet 1987; Nepal 2008).
Management-oriented research
Energy demand and consumption
Data on household energy demand and consumption andresource availability were collected in 2 field visitsconducted in Autumn 2007 and Spring 2008 in 35selected settlements along major trekking routes inSNPBZ; these constitute around half of all the park’ssettlements. The households were categorized as residential(houses for private accommodation), commercial (eg lodgesand shops), and institutional (eg schools, hospitals, localoffices, and monasteries). Based on the architecture andconstruction materials used, the households were furtherdifferentiated into traditional, semimodern, and modern.Proportions of sampled houses were selected based on thetotal number of available different types of households. Arandom structure sampling method (Sutherland 1996) tocover all of these household types was applied, resultingin coverage of about 20% of all households in SNPBZ. Aquestionnaire survey was applied to 170 selectedhouseholds altogether to gather information on aspects of
energy use in the park. The identification of sources,types, and patterns of energy consumption (includingtypes of energy-consuming equipment used for householdpurposes, the amount of energy used in differenthousehold activities, and the total wattage of electricityused per day); the measurement of building dimensions;and the identification of insulation materials wasconducted during the household survey. Demographicinformation was also collected from each interviewee by aunified standard questionnaire. Spot measurements ofglobal solar irradiation, wind velocity, and the feasibilityof hydropower were also collected. Data on energygenerated by existing alternative energy sources(photovoltaic [PV] panels, solar thermal [ST] panels, andwind power) and their characteristics were also collected(Salerno et al 2009).
Forest condition and fuelwood consumption
A forest inventory was carried out to collect informationon the floristic composition of the forest as well as onmore quantitative aspects (eg structural parameters) ofthe tree species (Kunwar and Sharma 2004). In this paper,we present the data that were found necessary toimplement the qualitative model of forest managementissues described further on. In order to simplify thismodel, we used forest biomass as an indicator of foresthealth (Sharma et al 2008), without considering otheraspects, such as those connected with biodiversity.
Data for biomass computation: Three forest surveys wereconducted during spring (May–June 2007 and 2008) andautumn (September–October 2008) in the park. Forestparameters were collected in 105 temporary square plots(20m 3 20m), in locations chosen by a stratified randomsampling method (Sutherland 1996; Figure 1). In everyplot, an inventory was made of the different species and
TABLE 1 Land cover classification by elevation zones in SNPZB. (Source: Bajracharya et al 2010)
Land cover (ASTER 2006) Area per elevation zone (104 m2)Total
area
(104 m2) %Class name
2000–
3000
3000–
4000
4000–
5000 .5000
Forest 2716 6677 386 0 9779 7.0
Shrub 353 3990 12,248 96 16,687 11.8
Grass 34 685 5800 1696 8215 5.8
Bare soil 210 567 19,714 41,094 61,585 43.7
Built-up area (including cultivated area) 308 375 259 0 942 0.7
Glacial lakes 0 0 429 393 822 0.6
Snow and glaciers 0 0 4600 38,189 42,789 30.4
Total 140,819 100.0
MountainResearch
Mountain Research and Development http://dx.doi.org/10.1659/MRD-JOURNAL-D-10-00027.1116
individual plants, and tree height (H), diameter at breastheight (Dbh), coverage, and seedling and sampling densitywere measured. These data were quantitatively analyzedfor abundance, density, and frequency (Salerno et al2009). For all forest plots, the diameter frequencydistribution was calculated, and the average basal area(BA) of each tree species in the plot was computed usingDbh. We used the allometric relationships available fromearlier studies in Nepal (Sharma and Pukkala 1990) toestimate the stem biomass (SB). After calculating the stemvolume (BA 3 H), this was multiplied by the species-specific wood density to get the SB for each plot (Sharmaet al 2008). However, due to the nonavailability of otherrequired species-specific parameters for all tree species inthe plots, the SB computation was possible only for thedominant species (ie Abies spectabilis). The referencecondition for SB for the kinds of forest in the plots wasassessed using the SB table prepared by Yoda (1968).
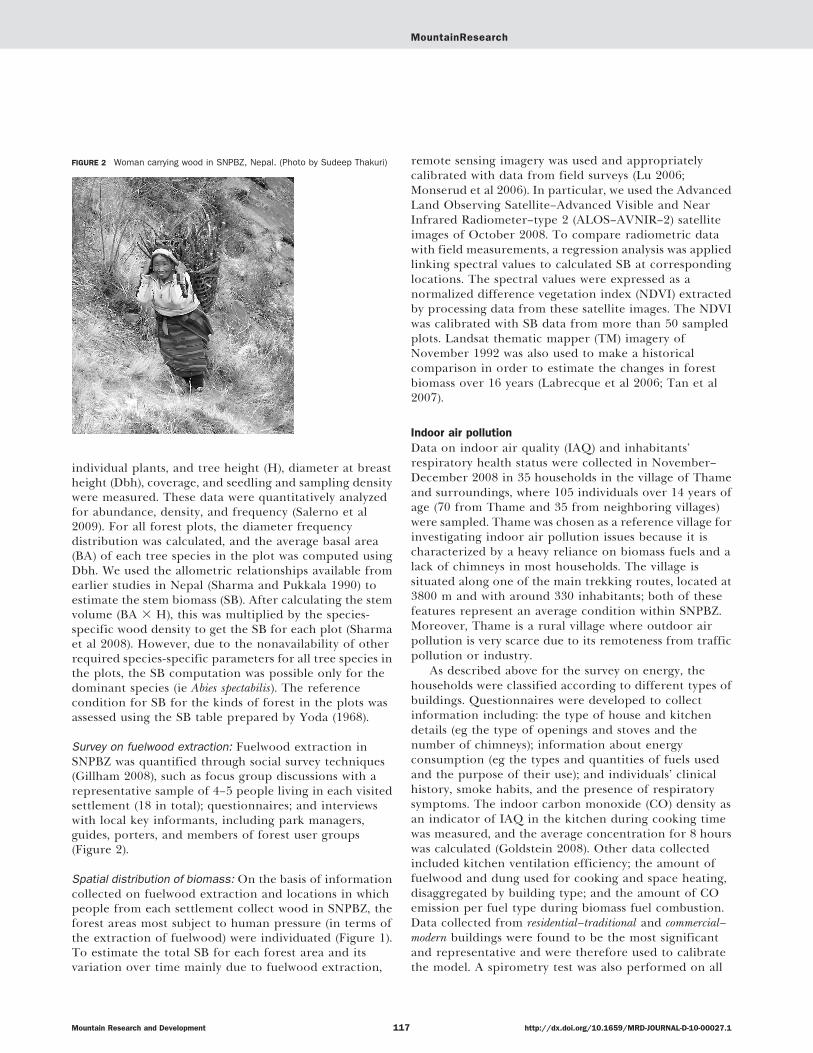
Survey on fuelwood extraction: Fuelwood extraction inSNPBZ was quantified through social survey techniques(Gillham 2008), such as focus group discussions with arepresentative sample of 4–5 people living in each visitedsettlement (18 in total); questionnaires; and interviewswith local key informants, including park managers,guides, porters, and members of forest user groups(Figure 2).
Spatial distribution of biomass: On the basis of informationcollected on fuelwood extraction and locations in whichpeople from each settlement collect wood in SNPBZ, theforest areas most subject to human pressure (in terms ofthe extraction of fuelwood) were individuated (Figure 1).To estimate the total SB for each forest area and itsvariation over time mainly due to fuelwood extraction,
remote sensing imagery was used and appropriatelycalibrated with data from field surveys (Lu 2006;Monserud et al 2006). In particular, we used the AdvancedLand Observing Satellite–Advanced Visible and NearInfrared Radiometer–type 2 (ALOS–AVNIR–2) satelliteimages of October 2008. To compare radiometric datawith field measurements, a regression analysis was appliedlinking spectral values to calculated SB at correspondinglocations. The spectral values were expressed as anormalized difference vegetation index (NDVI) extractedby processing data from these satellite images. The NDVIwas calibrated with SB data from more than 50 sampledplots. Landsat thematic mapper (TM) imagery ofNovember 1992 was also used to make a historicalcomparison in order to estimate the changes in forestbiomass over 16 years (Labrecque et al 2006; Tan et al2007).
Indoor air pollution
Data on indoor air quality (IAQ) and inhabitants’respiratory health status were collected in November–December 2008 in 35 households in the village of Thameand surroundings, where 105 individuals over 14 years ofage (70 from Thame and 35 from neighboring villages)were sampled. Thame was chosen as a reference village forinvestigating indoor air pollution issues because it ischaracterized by a heavy reliance on biomass fuels and alack of chimneys in most households. The village issituated along one of the main trekking routes, located at3800 m and with around 330 inhabitants; both of thesefeatures represent an average condition within SNPBZ.Moreover, Thame is a rural village where outdoor airpollution is very scarce due to its remoteness from trafficpollution or industry.
As described above for the survey on energy, thehouseholds were classified according to different types ofbuildings. Questionnaires were developed to collectinformation including: the type of house and kitchendetails (eg the type of openings and stoves and thenumber of chimneys); information about energyconsumption (eg the types and quantities of fuels usedand the purpose of their use); and individuals’ clinicalhistory, smoke habits, and the presence of respiratorysymptoms. The indoor carbon monoxide (CO) density asan indicator of IAQ in the kitchen during cooking timewas measured, and the average concentration for 8 hourswas calculated (Goldstein 2008). Other data collectedincluded kitchen ventilation efficiency; the amount offuelwood and dung used for cooking and space heating,disaggregated by building type; and the amount of COemission per fuel type during biomass fuel combustion.Data collected from residential–traditional and commercial–modern buildings were found to be the most significantand representative and were therefore used to calibratethe model. A spirometry test was also performed on all
FIGURE 2 Woman carrying wood in SNPBZ, Nepal. (Photo by Sudeep Thakuri)
MountainResearch
Mountain Research and Development http://dx.doi.org/10.1659/MRD-JOURNAL-D-10-00027.1117
people according to the American Thoracic Society/European Respiratory Society guidelines (Miller et al2005) to assess their lung function and measurepulmonary parameters. Other health status data (ie bloodpressure, pulse, oxygen in the blood, height, and weight)were also taken (Salerno et al 2009).
Management-oriented research results
The following major findings of field research activitiesconducted in SNPBZ on energy demand andconsumption, forest condition, and indoor air pollution(Salerno et al 2009) were used for implementing andcalibrating the relevant system dynamics models.
Energy demand and consumption
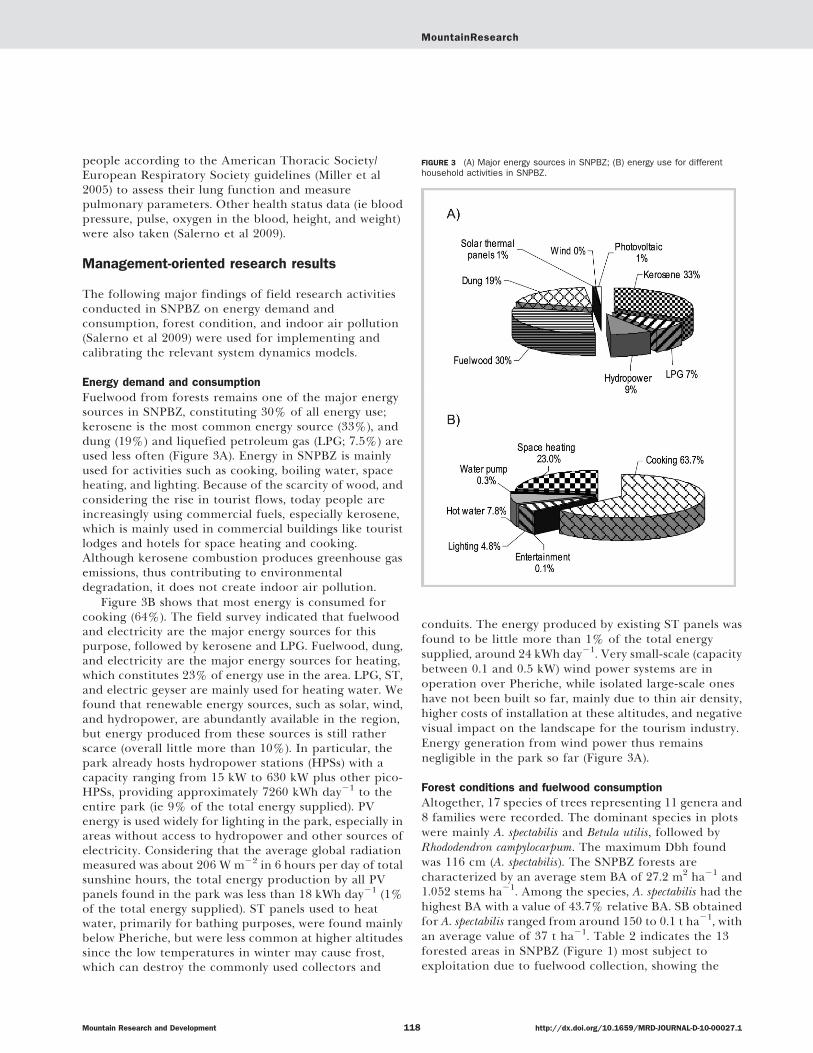
Fuelwood from forests remains one of the major energysources in SNPBZ, constituting 30% of all energy use;kerosene is the most common energy source (33%), anddung (19%) and liquefied petroleum gas (LPG; 7.5%) areused less often (Figure 3A). Energy in SNPBZ is mainlyused for activities such as cooking, boiling water, spaceheating, and lighting. Because of the scarcity of wood, andconsidering the rise in tourist flows, today people areincreasingly using commercial fuels, especially kerosene,which is mainly used in commercial buildings like touristlodges and hotels for space heating and cooking.Although kerosene combustion produces greenhouse gasemissions, thus contributing to environmentaldegradation, it does not create indoor air pollution.
Figure 3B shows that most energy is consumed forcooking (64%). The field survey indicated that fuelwoodand electricity are the major energy sources for thispurpose, followed by kerosene and LPG. Fuelwood, dung,and electricity are the major energy sources for heating,which constitutes 23% of energy use in the area. LPG, ST,and electric geyser are mainly used for heating water. Wefound that renewable energy sources, such as solar, wind,and hydropower, are abundantly available in the region,but energy produced from these sources is still ratherscarce (overall little more than 10%). In particular, thepark already hosts hydropower stations (HPSs) with acapacity ranging from 15 kW to 630 kW plus other pico-HPSs, providing approximately 7260 kWh day21 to theentire park (ie 9% of the total energy supplied). PVenergy is used widely for lighting in the park, especially inareas without access to hydropower and other sources ofelectricity. Considering that the average global radiationmeasured was about 206 W m22 in 6 hours per day of totalsunshine hours, the total energy production by all PVpanels found in the park was less than 18 kWh day21 (1%of the total energy supplied). ST panels used to heatwater, primarily for bathing purposes, were found mainlybelow Pheriche, but were less common at higher altitudessince the low temperatures in winter may cause frost,which can destroy the commonly used collectors and
conduits. The energy produced by existing ST panels wasfound to be little more than 1% of the total energysupplied, around 24 kWh day21. Very small-scale (capacitybetween 0.1 and 0.5 kW) wind power systems are inoperation over Pheriche, while isolated large-scale oneshave not been built so far, mainly due to thin air density,higher costs of installation at these altitudes, and negativevisual impact on the landscape for the tourism industry.Energy generation from wind power thus remainsnegligible in the park so far (Figure 3A).
Forest conditions and fuelwood consumption
Altogether, 17 species of trees representing 11 genera and8 families were recorded. The dominant species in plotswere mainly A. spectabilis and Betula utilis, followed byRhododendron campylocarpum. The maximum Dbh foundwas 116 cm (A. spectabilis). The SNPBZ forests arecharacterized by an average stem BA of 27.2 m2 ha21 and1.052 stems ha21. Among the species, A. spectabilis had thehighest BA with a value of 43.7% relative BA. SB obtainedfor A. spectabilis ranged from around 150 to 0.1 t ha21, withan average value of 37 t ha21. Table 2 indicates the 13forested areas in SNPBZ (Figure 1) most subject toexploitation due to fuelwood collection, showing the
FIGURE 3 (A) Major energy sources in SNPBZ; (B) energy use for differenthousehold activities in SNPBZ.
MountainResearch
Mountain Research and Development http://dx.doi.org/10.1659/MRD-JOURNAL-D-10-00027.1118
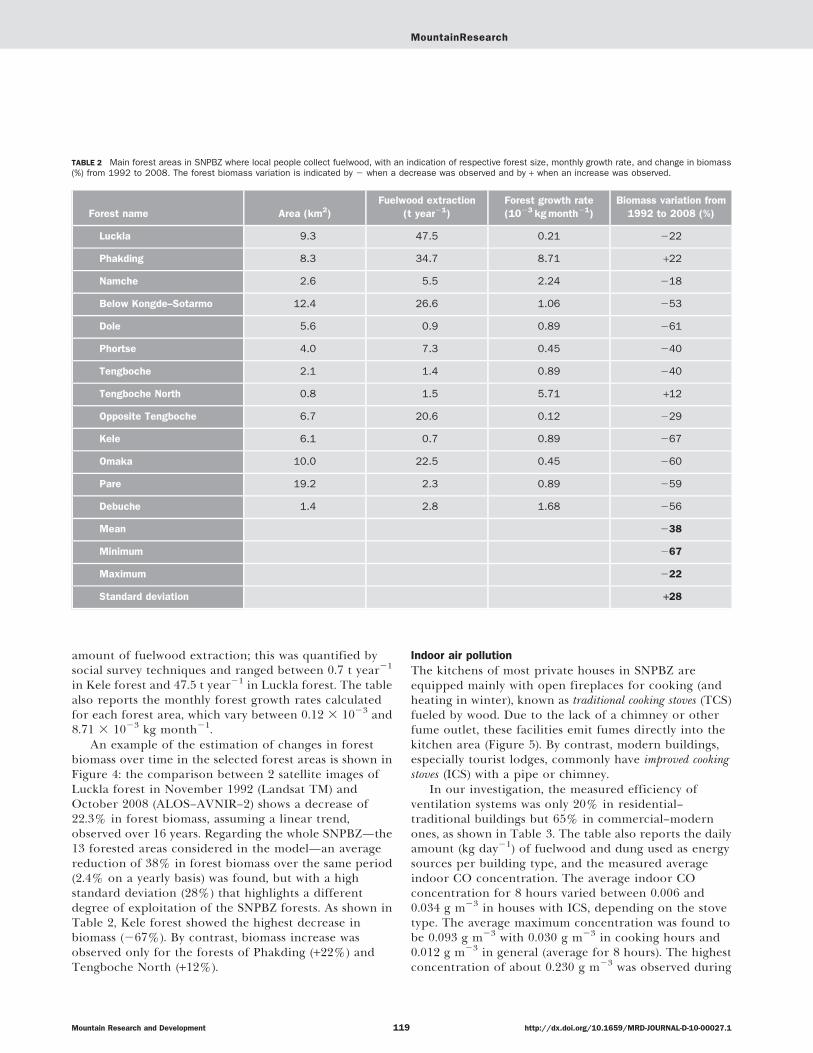
amount of fuelwood extraction; this was quantified bysocial survey techniques and ranged between 0.7 t year21
in Kele forest and 47.5 t year21 in Luckla forest. The tablealso reports the monthly forest growth rates calculatedfor each forest area, which vary between 0.12 3 1023 and8.71 3 1023 kg month21.
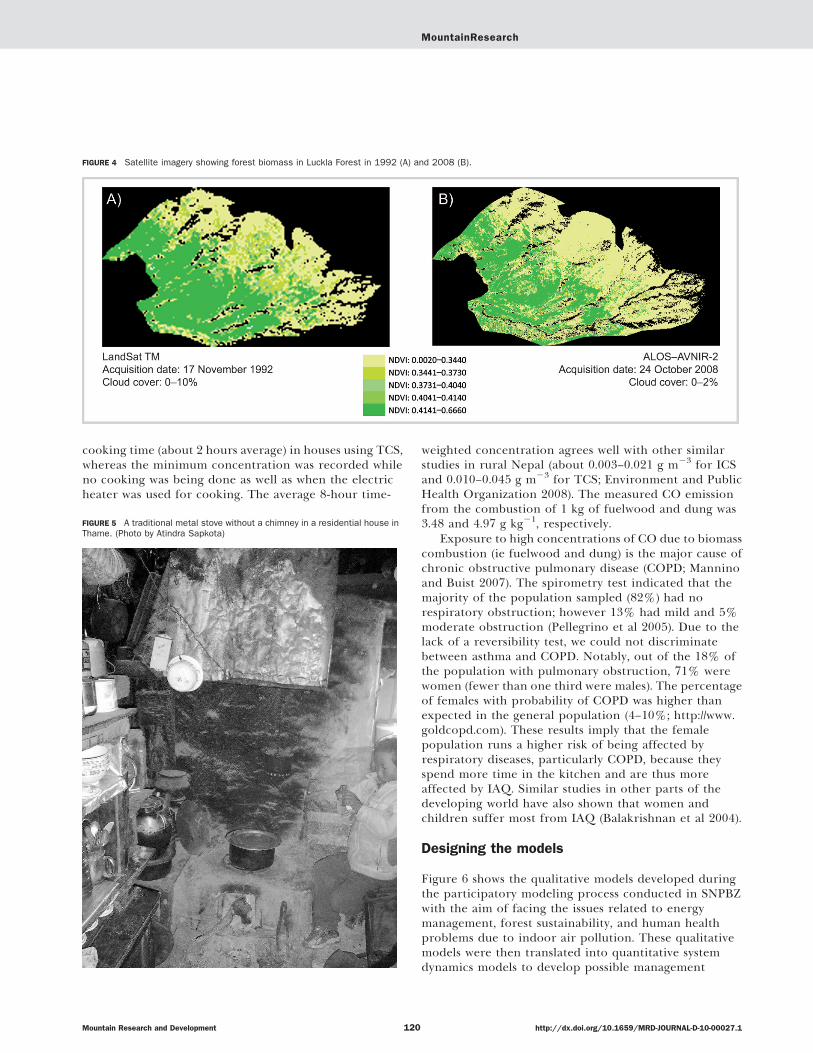
An example of the estimation of changes in forestbiomass over time in the selected forest areas is shown inFigure 4: the comparison between 2 satellite images ofLuckla forest in November 1992 (Landsat TM) andOctober 2008 (ALOS–AVNIR–2) shows a decrease of22.3% in forest biomass, assuming a linear trend,observed over 16 years. Regarding the whole SNPBZ—the13 forested areas considered in the model—an averagereduction of 38% in forest biomass over the same period(2.4% on a yearly basis) was found, but with a highstandard deviation (28%) that highlights a differentdegree of exploitation of the SNPBZ forests. As shown inTable 2, Kele forest showed the highest decrease inbiomass (267%). By contrast, biomass increase wasobserved only for the forests of Phakding (+22%) andTengboche North (+12%).
Indoor air pollution
The kitchens of most private houses in SNPBZ areequipped mainly with open fireplaces for cooking (andheating in winter), known as traditional cooking stoves (TCS)fueled by wood. Due to the lack of a chimney or otherfume outlet, these facilities emit fumes directly into thekitchen area (Figure 5). By contrast, modern buildings,especially tourist lodges, commonly have improved cookingstoves (ICS) with a pipe or chimney.
In our investigation, the measured efficiency ofventilation systems was only 20% in residential–traditional buildings but 65% in commercial–modernones, as shown in Table 3. The table also reports the dailyamount (kg day21) of fuelwood and dung used as energysources per building type, and the measured averageindoor CO concentration. The average indoor COconcentration for 8 hours varied between 0.006 and0.034 g m23 in houses with ICS, depending on the stovetype. The average maximum concentration was found tobe 0.093 g m23 with 0.030 g m23 in cooking hours and0.012 g m23 in general (average for 8 hours). The highestconcentration of about 0.230 g m23 was observed during
TABLE 2 Main forest areas in SNPBZ where local people collect fuelwood, with an indication of respective forest size, monthly growth rate, and change in biomass(%) from 1992 to 2008. The forest biomass variation is indicated by 2 when a decrease was observed and by + when an increase was observed.
Forest name Area (km2)
Fuelwood extraction
(t year21)
Forest growth rate
(1023 kg month21)
Biomass variation from
1992 to 2008 (%)
Luckla 9.3 47.5 0.21 222
Phakding 8.3 34.7 8.71 +22
Namche 2.6 5.5 2.24 218
Below Kongde–Sotarmo 12.4 26.6 1.06 253
Dole 5.6 0.9 0.89 261
Phortse 4.0 7.3 0.45 240
Tengboche 2.1 1.4 0.89 240
Tengboche North 0.8 1.5 5.71 +12
Opposite Tengboche 6.7 20.6 0.12 229
Kele 6.1 0.7 0.89 267
Omaka 10.0 22.5 0.45 260
Pare 19.2 2.3 0.89 259
Debuche 1.4 2.8 1.68 256
Mean 238
Minimum 267
Maximum 222
Standard deviation +28
MountainResearch
Mountain Research and Development http://dx.doi.org/10.1659/MRD-JOURNAL-D-10-00027.1119
cooking time (about 2 hours average) in houses using TCS,whereas the minimum concentration was recorded whileno cooking was being done as well as when the electricheater was used for cooking. The average 8-hour time-
weighted concentration agrees well with other similarstudies in rural Nepal (about 0.003–0.021 g m23 for ICSand 0.010–0.045 g m23 for TCS; Environment and PublicHealth Organization 2008). The measured CO emissionfrom the combustion of 1 kg of fuelwood and dung was3.48 and 4.97 g kg21, respectively.
Exposure to high concentrations of CO due to biomasscombustion (ie fuelwood and dung) is the major cause ofchronic obstructive pulmonary disease (COPD; Manninoand Buist 2007). The spirometry test indicated that themajority of the population sampled (82%) had norespiratory obstruction; however 13% had mild and 5%moderate obstruction (Pellegrino et al 2005). Due to thelack of a reversibility test, we could not discriminatebetween asthma and COPD. Notably, out of the 18% ofthe population with pulmonary obstruction, 71% werewomen (fewer than one third were males). The percentageof females with probability of COPD was higher thanexpected in the general population (4–10%; http://www.goldcopd.com). These results imply that the femalepopulation runs a higher risk of being affected byrespiratory diseases, particularly COPD, because theyspend more time in the kitchen and are thus moreaffected by IAQ. Similar studies in other parts of thedeveloping world have also shown that women andchildren suffer most from IAQ (Balakrishnan et al 2004).
Designing the models
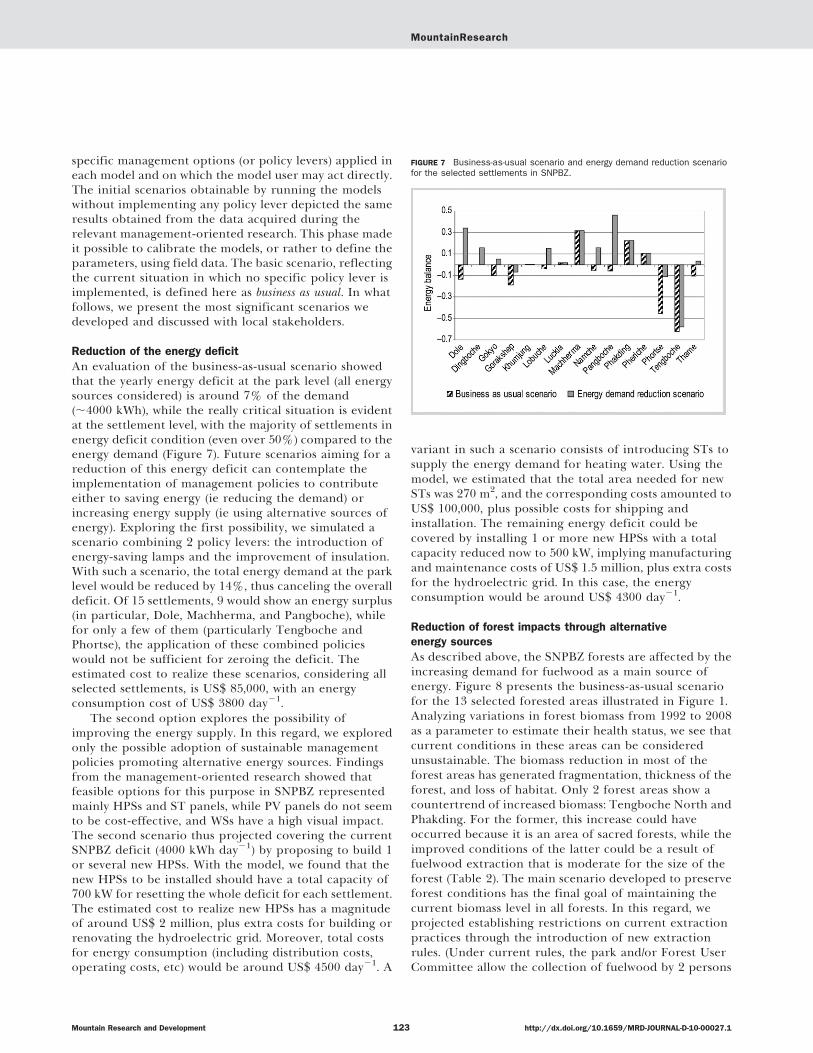
Figure 6 shows the qualitative models developed duringthe participatory modeling process conducted in SNPBZwith the aim of facing the issues related to energymanagement, forest sustainability, and human healthproblems due to indoor air pollution. These qualitativemodels were then translated into quantitative systemdynamics models to develop possible management
FIGURE 4 Satellite imagery showing forest biomass in Luckla Forest in 1992 (A) and 2008 (B).
FIGURE 5 A traditional metal stove without a chimney in a residential house inThame. (Photo by Atindra Sapkota)
MountainResearch
Mountain Research and Development http://dx.doi.org/10.1659/MRD-JOURNAL-D-10-00027.1120
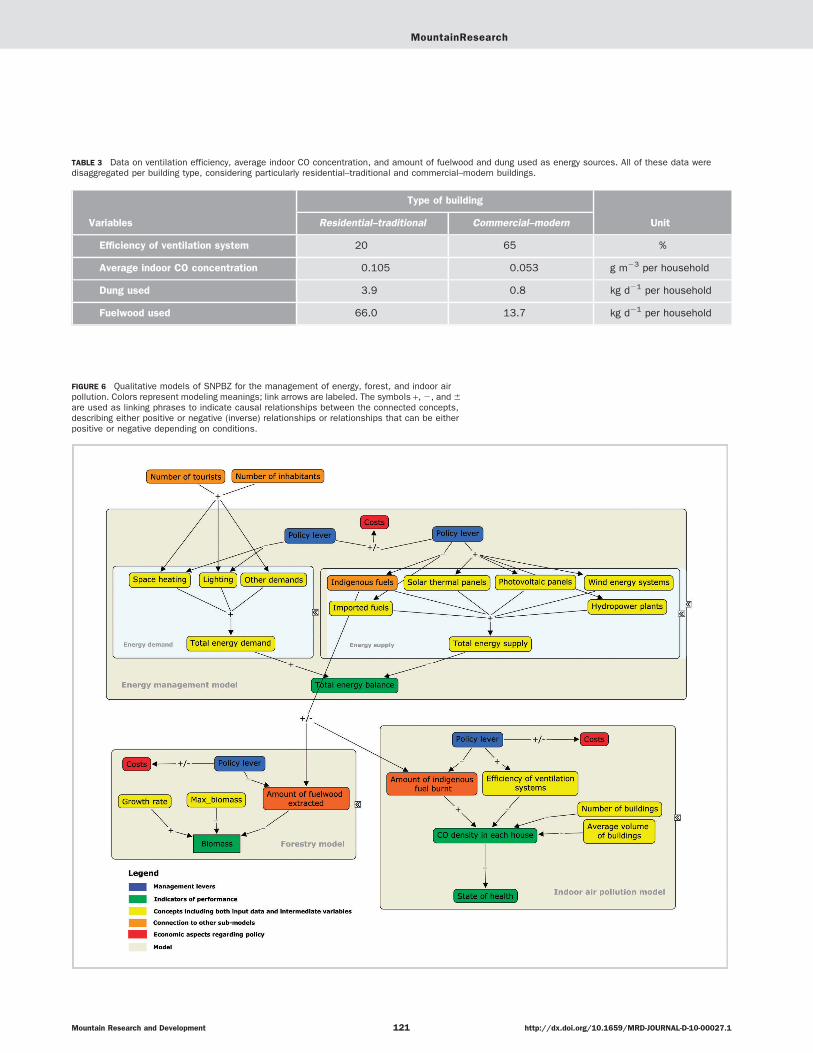
FIGURE 6 Qualitative models of SNPBZ for the management of energy, forest, and indoor airpollution. Colors represent modeling meanings; link arrows are labeled. The symbols +, 2, and 6
are used as linking phrases to indicate causal relationships between the connected concepts,describing either positive or negative (inverse) relationships or relationships that can be eitherpositive or negative depending on conditions.
TABLE 3 Data on ventilation efficiency, average indoor CO concentration, and amount of fuelwood and dung used as energy sources. All of these data weredisaggregated per building type, considering particularly residential–traditional and commercial–modern buildings.
Variables
Type of building
UnitResidential–traditional Commercial–modern
Efficiency of ventilation system 20 65 %
Average indoor CO concentration 0.105 0.053 g m23 per household
Dung used 3.9 0.8 kg d21 per household
Fuelwood used 66.0 13.7 kg d21 per household
MountainResearch
Mountain Research and Development http://dx.doi.org/10.1659/MRD-JOURNAL-D-10-00027.1121

scenarios. Approaches, design, and tools used within theparticipatory modeling process are described in detail inSalerno et al (2010).
Energy management model
The energy management model describes the demandand supply components for each selected settlement inorder to assess the total energy balance and the related costs.The total energy demand is the sum of energy used fordifferent purposes, including space heating, lighting, andother activities generalized in the model and indicatedunder other demands. Particularly, the energy demand forspace heating is related to many factors, such as buildingtype, base surface of buildings, volume of the heatedroom, insulation, and characteristics of walls andwindows. Such features allow for the calculation ofparameters such as heat required and thermal dispersion(Spakovszky 2006). Moreover, the total energy required(energy demand) is proportional to the number ofinhabitants and tourists present in each settlement, whichare model input variables coming from the tourism andpopulation dynamic models developed in a separate study(International Centre for Integrated MountainDevelopment 2009). The total energy supply is related todifferent energy sources, such as imported fuels (ie keroseneand LPG); indigenous fuels (ie fuelwood and dung); andnonconventional available energy sources, includingphotovoltaic panels, solar thermal panels, wind energy systems,and hydropower plants.
All of these energy sources may be influenced bydifferent management policies and relevant economicimplications. Imported fuels are derived from the amount offuel used and the energy produced for the combustion ofa kg of each fuel type. Indigenous fuel—in particular theamount of fuelwood used—is influenced by the currentnumber of fuelwood extraction permits as well as by theamount of fuelwood extracted from the forestry model. At thesame time, in the model, the amount of dung used as fuelcomes from the water pollution model described inManfredi et al (2010). Regarding the alternative energysources, the energy produced by both photovoltaic panelsand solar thermal panels depends on the panels’ surface andon the energy produced per m2. The energy produced bywind energy (aeolic) systems is correlated with the number ofwind energy systems (WSs), system power, the efficiency ofthe electric distribution network, and the hours of activityof the aeolic system. The total energy supply is alsocorrelated with the hydropower energy available in eachsettlement, which depends on the energy produced by allof the hydropower plants in the park area, the percentage ofuse of hydropower energy of each settlement, and theefficiency of the electric distribution network.
Indoor air pollution model
The indoor air pollution model was developed with theaim of: (1) evaluating the CO concentration in the houses
as an index for IAQ and (2) estimating the state of thelocal population’s health in the study area. The model cancalculate the CO density in each house by considering theamount of indigenous fuel burnt, which is linked with theenergy management model through the indigenous fuelsconcept (for the SNPBZ case study, the amount offirewood and dung) used in each selected settlement,which is also influenced by the respective number oftourists and inhabitants (Figure 6). Considering theamount of CO emitted by the combustion of 1 kg ofindigenous fuels together with the number of buildings andthe average volume of buildings in each settlement, the totalamount of CO produced in each house is obtained. Throughsuch variables, the model can calculate the CO density ineach house that will be reduced considering the efficiencyof ventilation systems per building type. Based on WorldHealth Organization (WHO) standards for COPD riskrelated to CO exposure (0.01 g m23 hour21), the modelenables an estimation of the state of health of the residents.
Forestry model
The development of the forestry model (Figure 6) wasconceived to address the problem of forest thinning,which represents a key management issue in SNPBZ(Stevens 2003). Increased tourist flows are contributing toa rising demand for energy sources, such as fuelwood,consumed in the lodging and food businesses. The modelaims to assess forest biomass as a performance indicatorof forest condition. Following Muetzelfeldt and Taylor(2001) and Mazzoleni et al (2003), vegetation biomass ismodeled as a simple logistic equation, considering on onehand both the growth rate of the forest and its reachablemaximum biomass (max_biomass), and on the other handhuman pressure on forests due to the extraction offuelwood (amount of fuelwood extracted), the main indigenousenergy source. The model equation is
dBi
dt~gi|Bi| 1{
Bi
Mi
� �{Ei with i~1,:::,13,
where Bi (kg m22) is the biomass in the i-th forest area (forSNPBZ, we identified 13 main forest areas where localpeople collect fuelwood); t (month21) is time; gi (month21)is the growth rate estimated considering the satelliteimagery of each forest area in 2 different periods, aspreviously described; Mi is the maximum biomass(max_biomass) of i-th forest area estimated; and Ei is theamount of fuelwood extracted (kg m22 month21; Figure 6). Byacting on the management levers that make it possible tochange extraction rules, and consequently the amount offuelwood extracted, it is possible to observe differentsustainable and nonsustainable forest scenarios.
Adaptive management
The above 3 models were useful in developing andanalyzing different scenarios simulating the effects of
MountainResearch
Mountain Research and Development http://dx.doi.org/10.1659/MRD-JOURNAL-D-10-00027.1122
specific management options (or policy levers) applied ineach model and on which the model user may act directly.The initial scenarios obtainable by running the modelswithout implementing any policy lever depicted the sameresults obtained from the data acquired during therelevant management-oriented research. This phase madeit possible to calibrate the models, or rather to define theparameters, using field data. The basic scenario, reflectingthe current situation in which no specific policy lever isimplemented, is defined here as business as usual. In whatfollows, we present the most significant scenarios wedeveloped and discussed with local stakeholders.
Reduction of the energy deficit
An evaluation of the business-as-usual scenario showedthat the yearly energy deficit at the park level (all energysources considered) is around 7% of the demand(,4000 kWh), while the really critical situation is evidentat the settlement level, with the majority of settlements inenergy deficit condition (even over 50%) compared to theenergy demand (Figure 7). Future scenarios aiming for areduction of this energy deficit can contemplate theimplementation of management policies to contributeeither to saving energy (ie reducing the demand) orincreasing energy supply (ie using alternative sources ofenergy). Exploring the first possibility, we simulated ascenario combining 2 policy levers: the introduction ofenergy-saving lamps and the improvement of insulation.With such a scenario, the total energy demand at the parklevel would be reduced by 14%, thus canceling the overalldeficit. Of 15 settlements, 9 would show an energy surplus(in particular, Dole, Machherma, and Pangboche), whilefor only a few of them (particularly Tengboche andPhortse), the application of these combined policieswould not be sufficient for zeroing the deficit. Theestimated cost to realize these scenarios, considering allselected settlements, is US$ 85,000, with an energyconsumption cost of US$ 3800 day21.
The second option explores the possibility ofimproving the energy supply. In this regard, we exploredonly the possible adoption of sustainable managementpolicies promoting alternative energy sources. Findingsfrom the management-oriented research showed thatfeasible options for this purpose in SNPBZ representedmainly HPSs and ST panels, while PV panels do not seemto be cost-effective, and WSs have a high visual impact.The second scenario thus projected covering the currentSNPBZ deficit (4000 kWh day21) by proposing to build 1or several new HPSs. With the model, we found that thenew HPSs to be installed should have a total capacity of700 kW for resetting the whole deficit for each settlement.The estimated cost to realize new HPSs has a magnitudeof around US$ 2 million, plus extra costs for building orrenovating the hydroelectric grid. Moreover, total costsfor energy consumption (including distribution costs,operating costs, etc) would be around US$ 4500 day21. A
variant in such a scenario consists of introducing STs tosupply the energy demand for heating water. Using themodel, we estimated that the total area needed for newSTs was 270 m2, and the corresponding costs amounted toUS$ 100,000, plus possible costs for shipping andinstallation. The remaining energy deficit could becovered by installing 1 or more new HPSs with a totalcapacity reduced now to 500 kW, implying manufacturingand maintenance costs of US$ 1.5 million, plus extra costsfor the hydroelectric grid. In this case, the energyconsumption would be around US$ 4300 day21.
Reduction of forest impacts through alternative
energy sources
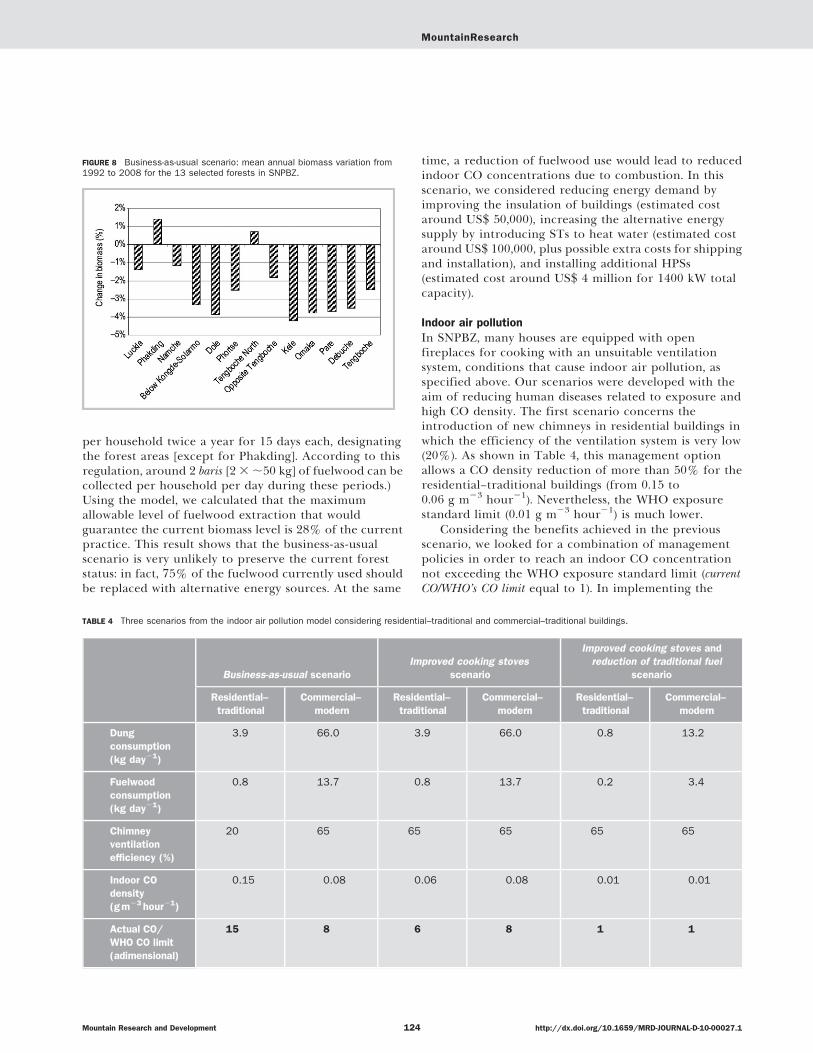
As described above, the SNPBZ forests are affected by theincreasing demand for fuelwood as a main source ofenergy. Figure 8 presents the business-as-usual scenariofor the 13 selected forested areas illustrated in Figure 1.Analyzing variations in forest biomass from 1992 to 2008as a parameter to estimate their health status, we see thatcurrent conditions in these areas can be consideredunsustainable. The biomass reduction in most of theforest areas has generated fragmentation, thickness of theforest, and loss of habitat. Only 2 forest areas show acountertrend of increased biomass: Tengboche North andPhakding. For the former, this increase could haveoccurred because it is an area of sacred forests, while theimproved conditions of the latter could be a result offuelwood extraction that is moderate for the size of theforest (Table 2). The main scenario developed to preserveforest conditions has the final goal of maintaining thecurrent biomass level in all forests. In this regard, weprojected establishing restrictions on current extractionpractices through the introduction of new extractionrules. (Under current rules, the park and/or Forest UserCommittee allow the collection of fuelwood by 2 persons
FIGURE 7 Business-as-usual scenario and energy demand reduction scenariofor the selected settlements in SNPBZ.
MountainResearch
Mountain Research and Development http://dx.doi.org/10.1659/MRD-JOURNAL-D-10-00027.1123
per household twice a year for 15 days each, designatingthe forest areas [except for Phakding]. According to thisregulation, around 2 baris [2 3 ,50 kg] of fuelwood can becollected per household per day during these periods.)Using the model, we calculated that the maximumallowable level of fuelwood extraction that wouldguarantee the current biomass level is 28% of the currentpractice. This result shows that the business-as-usualscenario is very unlikely to preserve the current foreststatus: in fact, 75% of the fuelwood currently used shouldbe replaced with alternative energy sources. At the same
time, a reduction of fuelwood use would lead to reducedindoor CO concentrations due to combustion. In thisscenario, we considered reducing energy demand byimproving the insulation of buildings (estimated costaround US$ 50,000), increasing the alternative energysupply by introducing STs to heat water (estimated costaround US$ 100,000, plus possible extra costs for shippingand installation), and installing additional HPSs(estimated cost around US$ 4 million for 1400 kW totalcapacity).
Indoor air pollution
In SNPBZ, many houses are equipped with openfireplaces for cooking with an unsuitable ventilationsystem, conditions that cause indoor air pollution, asspecified above. Our scenarios were developed with theaim of reducing human diseases related to exposure andhigh CO density. The first scenario concerns theintroduction of new chimneys in residential buildings inwhich the efficiency of the ventilation system is very low(20%). As shown in Table 4, this management optionallows a CO density reduction of more than 50% for theresidential–traditional buildings (from 0.15 to0.06 g m23 hour21). Nevertheless, the WHO exposurestandard limit (0.01 g m23 hour21) is much lower.
Considering the benefits achieved in the previousscenario, we looked for a combination of managementpolicies in order to reach an indoor CO concentrationnot exceeding the WHO exposure standard limit (currentCO/WHO’s CO limit equal to 1). In implementing the
FIGURE 8 Business-as-usual scenario: mean annual biomass variation from1992 to 2008 for the 13 selected forests in SNPBZ.
TABLE 4 Three scenarios from the indoor air pollution model considering residential–traditional and commercial–traditional buildings.
Business-as-usual scenario
Improved cooking stoves
scenario
Improved cooking stoves and
reduction of traditional fuel
scenario
Residential–
traditional
Commercial–
modern
Residential–
traditional
Commercial–
modern
Residential–
traditional
Commercial–
modern
Dung
consumption
(kg day21)
3.9 66.0 3.9 66.0 0.8 13.2
Fuelwood
consumption
(kg day21)
0.8 13.7 0.8 13.7 0.2 3.4
Chimney
ventilation
efficiency (%)
20 65 65 65 65 65
Indoor CO
density
(gm23 hour21)
0.15 0.08 0.06 0.08 0.01 0.01
Actual CO/
WHO CO limit
(adimensional)
15 8 6 8 1 1
MountainResearch
Mountain Research and Development http://dx.doi.org/10.1659/MRD-JOURNAL-D-10-00027.1124
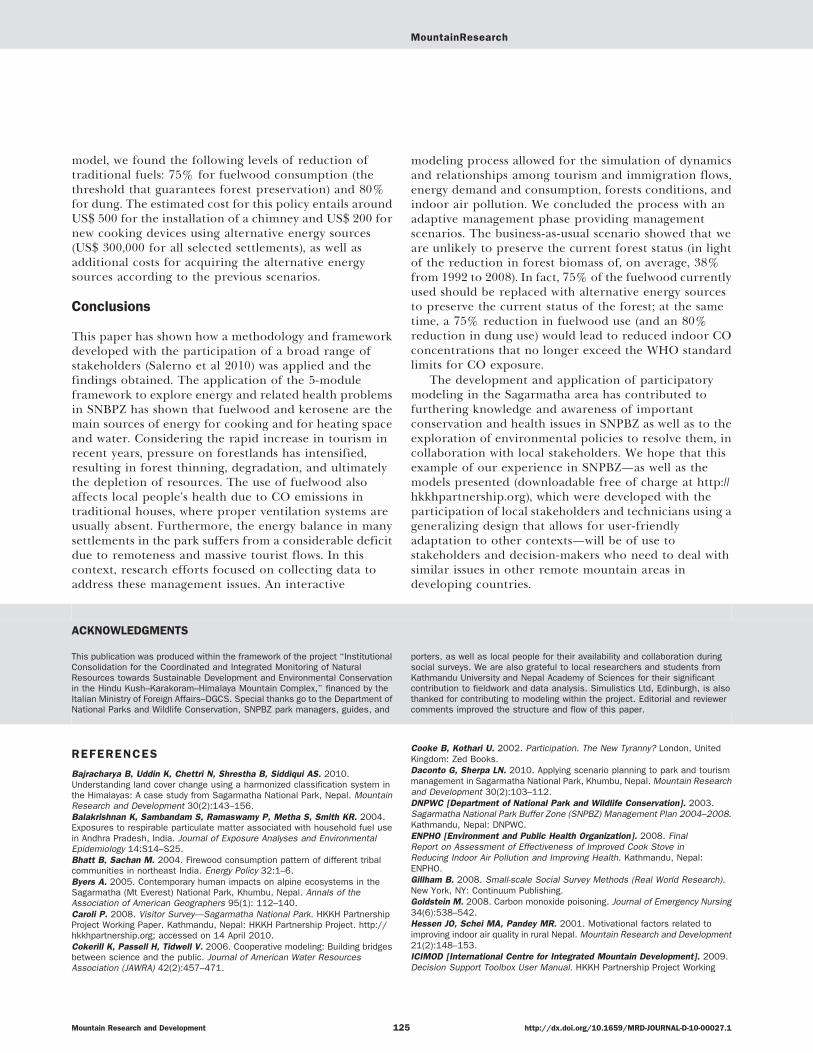
model, we found the following levels of reduction oftraditional fuels: 75% for fuelwood consumption (thethreshold that guarantees forest preservation) and 80%for dung. The estimated cost for this policy entails aroundUS$ 500 for the installation of a chimney and US$ 200 fornew cooking devices using alternative energy sources(US$ 300,000 for all selected settlements), as well asadditional costs for acquiring the alternative energysources according to the previous scenarios.
Conclusions
This paper has shown how a methodology and frameworkdeveloped with the participation of a broad range ofstakeholders (Salerno et al 2010) was applied and thefindings obtained. The application of the 5-moduleframework to explore energy and related health problemsin SNBPZ has shown that fuelwood and kerosene are themain sources of energy for cooking and for heating spaceand water. Considering the rapid increase in tourism inrecent years, pressure on forestlands has intensified,resulting in forest thinning, degradation, and ultimatelythe depletion of resources. The use of fuelwood alsoaffects local people’s health due to CO emissions intraditional houses, where proper ventilation systems areusually absent. Furthermore, the energy balance in manysettlements in the park suffers from a considerable deficitdue to remoteness and massive tourist flows. In thiscontext, research efforts focused on collecting data toaddress these management issues. An interactive
modeling process allowed for the simulation of dynamicsand relationships among tourism and immigration flows,energy demand and consumption, forests conditions, andindoor air pollution. We concluded the process with anadaptive management phase providing managementscenarios. The business-as-usual scenario showed that weare unlikely to preserve the current forest status (in lightof the reduction in forest biomass of, on average, 38%from 1992 to 2008). In fact, 75% of the fuelwood currentlyused should be replaced with alternative energy sourcesto preserve the current status of the forest; at the sametime, a 75% reduction in fuelwood use (and an 80%reduction in dung use) would lead to reduced indoor COconcentrations that no longer exceed the WHO standardlimits for CO exposure.
The development and application of participatorymodeling in the Sagarmatha area has contributed tofurthering knowledge and awareness of importantconservation and health issues in SNPBZ as well as to theexploration of environmental policies to resolve them, incollaboration with local stakeholders. We hope that thisexample of our experience in SNPBZ—as well as themodels presented (downloadable free of charge at http://hkkhpartnership.org), which were developed with theparticipation of local stakeholders and technicians using ageneralizing design that allows for user-friendlyadaptation to other contexts—will be of use tostakeholders and decision-makers who need to deal withsimilar issues in other remote mountain areas indeveloping countries.
ACKNOWLEDGMENTS
This publication was produced within the framework of the project ‘‘InstitutionalConsolidation for the Coordinated and Integrated Monitoring of NaturalResources towards Sustainable Development and Environmental Conservationin the Hindu Kush–Karakoram–Himalaya Mountain Complex,’’ financed by theItalian Ministry of Foreign Affairs–DGCS. Special thanks go to the Department ofNational Parks and Wildlife Conservation, SNPBZ park managers, guides, and
porters, as well as local people for their availability and collaboration duringsocial surveys. We are also grateful to local researchers and students fromKathmandu University and Nepal Academy of Sciences for their significantcontribution to fieldwork and data analysis. Simulistics Ltd, Edinburgh, is alsothanked for contributing to modeling within the project. Editorial and reviewercomments improved the structure and flow of this paper.
REFERENCES
Bajracharya B, Uddin K, Chettri N, Shrestha B, Siddiqui AS. 2010.Understanding land cover change using a harmonized classification system inthe Himalayas: A case study from Sagarmatha National Park, Nepal. MountainResearch and Development 30(2):143–156.Balakrishnan K, Sambandam S, Ramaswamy P, Metha S, Smith KR. 2004.Exposures to respirable particulate matter associated with household fuel usein Andhra Pradesh, India. Journal of Exposure Analyses and EnvironmentalEpidemiology 14:S14–S25.Bhatt B, Sachan M. 2004. Firewood consumption pattern of different tribalcommunities in northeast India. Energy Policy 32:1–6.Byers A. 2005. Contemporary human impacts on alpine ecosystems in theSagarmatha (Mt Everest) National Park, Khumbu, Nepal. Annals of theAssociation of American Geographers 95(1): 112–140.Caroli P. 2008. Visitor Survey—Sagarmatha National Park. HKKH PartnershipProject Working Paper. Kathmandu, Nepal: HKKH Partnership Project. http://hkkhpartnership.org; accessed on 14 April 2010.Cokerill K, Passell H, Tidwell V. 2006. Cooperative modeling: Building bridgesbetween science and the public. Journal of American Water ResourcesAssociation (JAWRA) 42(2):457–471.
Cooke B, Kothari U. 2002. Participation. The New Tyranny? London, UnitedKingdom: Zed Books.Daconto G, Sherpa LN. 2010. Applying scenario planning to park and tourismmanagement in Sagarmatha National Park, Khumbu, Nepal. Mountain Researchand Development 30(2):103–112.DNPWC [Department of National Park and Wildlife Conservation]. 2003.Sagarmatha National Park Buffer Zone (SNPBZ) Management Plan 2004–2008.Kathmandu, Nepal: DNPWC.ENPHO [Environment and Public Health Organization]. 2008. FinalReport on Assessment of Effectiveness of Improved Cook Stove inReducing Indoor Air Pollution and Improving Health. Kathmandu, Nepal:ENPHO.Gillham B. 2008. Small-scale Social Survey Methods (Real World Research).New York, NY: Continuum Publishing.Goldstein M. 2008. Carbon monoxide poisoning. Journal of Emergency Nursing34(6):538–542.Hessen JO, Schei MA, Pandey MR. 2001. Motivational factors related toimproving indoor air quality in rural Nepal. Mountain Research and Development21(2):148–153.ICIMOD [International Centre for Integrated Mountain Development]. 2009.Decision Support Toolbox User Manual. HKKH Partnership Project Working
MountainResearch
Mountain Research and Development http://dx.doi.org/10.1659/MRD-JOURNAL-D-10-00027.1125

Paper. Kathmandu, Nepal: HKKH Partnership Project. http://hkkhpartnership.org; accessed on 14 April 2010.Korfmacher KS. 2001. The politics of participation in watershed modeling.Environmental Management 27(2):161–176.Kunwar RM, Sharma SP. 2004. Quantitative analysis of tree species in twocommunity forests of Dolpa district, mid-west Nepal. Himalayan Journal ofSciences 2:23–28.Labrecque C, Fournier RA, Luther JE, Piercey D. 2006. A comparison of fourmethods to map biomass from Landsat–TM and inventory data in westernNewfoundland. Forest Ecology and Management 226:129–144.Lu D. 2006. The potential and challenge of remote sensing-based biomassestimation. International Journal of Remote Sensing 27:1297–1328.Manfredi EC, Flury B, Viviano G, Thakuri S, Khanal SN, Jha PK, Maskey RK,Kayastha RB, Kafle KR, Bhochhibhoya S, Ghimire NP, Shrestha BB, ChaudharyG, Giannino F, Carteni F, et al. 2010. Solid waste and water qualitymanagement models: Implementation of a participatory modeling framework inSagarmatha National Park Buffer Zone (Nepal). Mountain Research andDevelopment 30(2):127–142.Mannino DM, Buist AS. 2007. Global burden of COPD: Risk factors,prevalence, and future trends. Lancet 370:765–773.Mazzoleni S, Giannino F, Amato M, Gucci R, Toraldo G. 2003. Individual basedmodel of plant communities, mathematical modeling and computing in biologyand medicine. In: Capasso V, editor. The MIRIAM Project Series. Bologna, Italy:ESCULAPIO Publishing, pp 288–294.Miller MR, Hankinson J, Brusasco V, Burgos F, Casaburi R, Coates A, Crapo R,Enright P, van der Grinten CP, Gustafsson P, Jensen R, Johnson DC, MacIntyreN, McKay R, Navajas D, Pedersen OF, Pellegrino R, Viegi G, Wanger J, ATS/ERS Task Force. 2005. Standardization of spirometry. European RespiratoryJournal 26(2):319–338.Monserud RA, Huang S, Yang Y. 2006. Biomass and biomass change inlodgepole pine stands in Alberta. Tree Physiology 26:819–831.Muetzelfeldt RI, Taylor J. 2001. Developing forest models in the Simile visualmodeling environment. Unpublished paper presented at the IUFRO 4.11Conference on Forest Biometry, Modeling and Information Science. London,United Kingdom, University of Greenwich, 25–29 June. Available fromcorresponding author of this article.Nepal SK. 2008. Tourism-induced rural energy consumption in the Annapurnaregion of Nepal. Tourism Management 29:89–100.Omer AM. 2008. Energy, environment and sustainable development.Renewable Sustainable Energy Review 12(9):2265–2300.Pandey M, Basnet B. 1987. Chronic Bronchitis and Cor Pulmonale inNepal. A Scientific Epidemiological Study Monograph. Kathmandu, Nepal:Mrigendra Medical Trust.Pellegrino R, Viegi G, Brusasco V, Crapo RO, Burgos F, Casaburi R, Coates A,van der Grinten CP, Gustafsson P, Hankinson J, Jensen R, Johnson DC,MacIntyre N, McKay R, Miller MR, et al. 2005. Interpretative strategies forlung function tests. European Respiratory Journal 26(5):948–968.
Prasad R. 2000. Non-forest sources: Help to meet wood fuel requirements inIndia. Wood Energy News (FAO) 15(1):21–22.Prasad R, Maithel S, Mirza A. 2001. Renewable energy technologies forfuelwood conservation in Indian Himalayan region. Sustainable Development 9:103–108.Rijal K. 1999. Energy Use in Mountain Areas: Trends and Patterns in China,India, Nepal and Pakistan. Kathmandu, Nepal: ICIMOD [International Centre forIntegrated Mountain Development].Salerno F, Buraschi E, Bruccoleri G, Tartari G, Smiraglia C. 2008. Glaciersurface-area changes in Sagarmatha National Park, Nepal, in the second half ofthe 20th century, by comparison of historical maps. Journal of Glaciology54(187):738–752.Salerno F, Cuccillato E, Caroli P, Bajracharya B, Manfredi EC, Viviano G,Thakuri S, Flury B, Basani M, Giannino F, Panzeri D. 2010. Experience with ahard and soft participatory modeling framework for social-ecological systemmanagement in Mount Everest (Nepal) and K2 (Pakistan) protected areas.Mountain Research and Development 30(2):80–93.Salerno F, Flury B, Thakuri S, Basani M, Maskey R, Khanal SN, Sapkota A,Bhuju D, Jha P, Bhochhibhoya S. 2009. Management-oriented EnvironmentalResearch in Sagarmatha National Park and Buffer Zone (Nepal) (HKKHPartnership Project). HKKH Partnership Project Working Paper. Ev-K2-CNR.Kathmandu, Nepal: HKKH Partnership Project.Sharma ER, Pukkala T. 1990. Volume Equations and Biomass Prediction ofForest Trees of Nepal. Publication 47(1). Kathmandu, Nepal: Ministry of Forestsand Soil Conservation, Forest Survey and Statistics Division.Sharma RK, Sankhayan PL, Hofstad O. 2008. Forest biomass density,utilization and production dynamics in a western Himalayan watershed. Journalof Forestry Research 19(3):171–180.Spakovszky ZS. 2006. 16.Unified: Thermodynamics and Propulsion.Cambridge, MA: Massachusetts Institute of Technology. http://web.mit.edu/16.unified/www/FALL/thermodynamics/notes/index.html; accessed on 14April 2010.Stevens S. 2003. Tourism and deforestation in the Mt Everest region of Nepal.The Geographical Journal 169(3):255–277.Sutherland WJ. 1996. Ecological Census Techniques. A Handbook. Cambridge,MA: Cambridge University Press.Tan K, Piao S, Peng C, Fang J. 2007. Satellite-based estimation of biomasscarbon stocks for northern China’s forests between 1992 and 1999. ForestEcology and Management 240:114–121.UNEP [United Nations Environment Programme]–WCMC [World ConservationMonitoring Centre]. 2008. Sagarmatha National Park, Nepal. In: McGinley M,Cleveland CJ, editors. Encyclopedia of Earth. Washington, DC: EnvironmentalInformation Coalition, National Council for Science and the Environment.Yoda K. 1968. A preliminary survey of the forest vegetation of eastern Nepal, III.Plant biomass in the sample plots chosen from different vegetation zones.Journal of College Arts and Sciences, Chiba University 5(2):277–302.
MountainResearch
Mountain Research and Development http://dx.doi.org/10.1659/MRD-JOURNAL-D-10-00027.1126