Embed Size (px)
Citation preview
NBER WORKING PAPER SERIES
SHOW ME THE RIGHT STUFF:SIGNALS FOR HIGH TECH STARTUPS
Annamaria ContiMarie C. ThursbyFrank Rothaermel
Working Paper 17050http://www.nber.org/papers/w17050
NATIONAL BUREAU OF ECONOMIC RESEARCH1050 Massachusetts Avenue
Cambridge, MA 02138May 2011
We are indebted to Jerry Thursby for insightful comments and suggestions. We also thank ThomasAstebro, David Beck, Victor Bergonzoli, Carolin Haeussler, Matt Higgins, David Hsu, David Ku,Josh Lerner, Laura Lindsey, William Oakes, Florin Paun, Carlos Serrano, Scott Shane, RosemarieZiedonis, and seminar participants at the 2010 NBER's Entrepreneurship Working Group Meetingfor their valuable comments. Conti acknowledges support from the Hal and John Smith Chair in Entrepreneurshipfor support via a TI:GER Postdoctoral Fellowship and the Swiss National Foundation. Thursby acknowledgesNSF Award #0221600, and Rothaermel acknowledges NSF SES 0545544. The views expressed hereinare those of the authors and do not necessarily reflect the views of the National Bureau of EconomicResearch.
NBER working papers are circulated for discussion and comment purposes. They have not been peer-reviewed or been subject to the review by the NBER Board of Directors that accompanies officialNBER publications.
© 2011 by Annamaria Conti, Marie C. Thursby, and Frank Rothaermel. All rights reserved. Shortsections of text, not to exceed two paragraphs, may be quoted without explicit permission providedthat full credit, including © notice, is given to the source.
Show Me the Right Stuff: Signals for High Tech StartupsAnnamaria Conti, Marie C. Thursby, and Frank RothaermelNBER Working Paper No. 17050May 2011, Revised February 2013JEL No. G24
ABSTRACT
We present a theoretical model of startup signaling with multiple signals and potential di˙erences inexternal investor preferences. For a novel sample of technology incubator startups, we empiricallyexamine the use of patents and founder, friends, and family (FFF) money as such signals, ˝nding thatthey are jointly endogenous to venture capital and business angel investment in the startups. For thissample, venture capitalists appear to value patents more highly than FFF money, while the reverseis true for business angels. Moreover, the impact of patents on venture capitalists is larger than theimpact of FFF money on business angels.
Annamaria ContiGeorgia Institute of Technology800 W. Peachtree St N.W.Atlanta, GA [email protected]
Marie C. ThursbyCollege of ManagementGeorgia Institute of Technology800 West Peachtree Street, NWAtlanta, GA 30308-1149and [email protected]
Frank RothaermelGeorgia Institute of Technology800 W. Peachtree St N.W.Atlanta, GA [email protected]
1 Introduction
One of the most important challenges facing entrepreneurs in technology startups is access to
capital (Denis, 2004; Shane and Stuart, 2002). With little or no observable history of perfor-
mance and uncertain technology, a major issue for these entrepreneurs is how to signal their
company’s value to potential investors. One such signal is an entrepreneur’s own investment
(Leland and Pyle, 1976). For technology startups, patents are also a potential signal. In-
deed, the Berkeley Patent Survey finds that one of the most important reasons for startups to
patent is to secure funds (Graham and Sichelman, 2008; Graham et al., 2009).1 There is also
empirical evidence that alliances (Stuart et al., 1999; Hsu, 2004), Nobel laureates as advisors
(Higgins et al., 2011), and founder attributes (Burton et al., 2002) as well as patents (Hsu
and Ziedonis, 2008, 2011; Haeussler et al., 2009) are correlated with startup value, suggesting
they could serve as signals.
With multiple such mechanisms, how should managers choose signals? We address this
topic in the context of two signals, patents and investment of founders, friends, and family
(FFF) funds. We provide theoretical and empirical results on investment in these signals as a
function of the cost of signaling and investor preferences. The theoretical model considers a
situation of asymmetric information in which the founders of a startup have private informa-
tion about the technology underlying their business. The value of the startup is a function of
the probability of success of the technology, but also the founders’ commitment. In seeking
external investment, the founders consider using patents as a signal of the probability of suc-
cess and FFF money as a signal of their commitment. In our model, both signals have other
uses as well, and so they are productive signals in the sense of Spence (1974). The theory also
incorporates the observation that different classes of investors (i.e., business angel and venture
capitalists) vary in the extent to which they value startup characteristics (Osnabrugge and
1On average, ”improving chances of obtaining financing” ranked second in importance among the sevenreasons considered. Startups in the software sector also rated ”enhancing the firm’s reputation” more highlythan firms in other sectors. Thus the authors interpret signaling as a primary reason for software patenting(Graham and Sichelman 2008, p. 161).
2
Robinson, 2000; Graham et al., 2009). Investor preferences are known to the founders when
they choose their investment. Thus optimal investment is a function of both cost, which is
well documented as important (Amit et al., 1990) and investor preferences. We then examine
our predictions in the context of technology startups incubated in the Advanced Technology
Development Center (ATDC) from 1998-2008.
We provide conditions under which it is worthwhile for startup founders whose technolo-
gies have a high probability of success to signal their company’s ”quality,” and we characterize
the investment in patents relative to FFF money in terms of their cost and investor prefer-
ences. Independent of investor preferences, founders of these startups (high quality startups
hereafter) optimally invest more in patents and FFF money than they should in a situation
of symmetric information. However, when a potential investor places more weight on the
quality of the technology than founder commitment, high quality startups should invest more
in patents than FFF money relative to the symmetric information case. Conversely, when
a potential investor values founder commitment more highly, the startup should invest rel-
atively more in FFF money. Finally, when the potential investor is indifferent between the
two attributes, the signal ratio is inversely proportional to the ratio of their costs. Thus,
what distinguishes our model from prior models of multiple signals (Milgrom and Roberts,
1986; Engers, 1987; Grinblatt and Hwang, 1989) is that the investment in the signals, in
equilibrium, depends on the preferences of the external investors.
Empirically, we consider the impact of patents filed and FFF money on venture capitalist
and business angel investments, respectively. To this scope we use novel data which builds
on the startup database examined by Rothaermel and Thursby in their analysis of university
ties and incubator startup performance (2005a, 2005b). These data include information on
the investment of business angels and venture capitalists, the amount of FFF money invested
in the firm, and the number of patents filed, which we augmented with information from the
startup business plans and a survey of the founders.
Our empirical estimation addresses whether patents and FFF money are endogenously
3
determined variables with regard to startup financing. Understanding this is important since
otherwise patents and FFF money are simply attributes correlated with the value of a startup
because of their productive value to the firm. In that case, they might be strategic choices
with regard to output competition or other goals, but they would not be endogenous to the
financing problem. One of our major findings is that, for this sample of firms, patents and FFF
money are jointly endogenous to venture capital investment and business angel investment.
Accordingly, we estimate two structural equation models, one for each type of investor,
which take this endogeneity into account. Having taken into account the costs of investing
in the signals, the number of patents filed by a startup has a large, statistically significant
effect on venture capitalist investment while FFF money is not statistically significant. In
light of our theory, this suggests that venture capitalists care more about the quality of the
technology of startups than founder commitment. In the case of business angels we find that
FFF money has a positive statistically significant impact on investment while patents filed
does not. Moreover, we find that the impact of patents on venture capitalists is stronger
than the impact of FFF money on business angels: a 1% increase in the number of patents
filed increases the likelihood of venture capital financing by 46%, while a 1% increase in FFF
money increases the likelihood of business angel financing by 5%.
Both the theory and empirics contribute to the literature on entrepreneurial finance (see,
for instance, Leland and Pyle, 1976; Grinblatt and Hwang, 1989; Denis, 2004; Shane and
Stuart, 2002; Kaplan and Per Stromberg, 2004; Cumming, 2008; and Cumming and Johan,
2008), which with the exception of seminal work by Leland and Pyle (1976) and later that
of Grinblatt and Hwang (1989), has abstracted from signaling choices by startup founders.
While informational issues and quality variation among startups is well documented, much
of the emphasis has been on the value added that venture capitalists provide in terms of
selecting better quality startups in addition to their role in providing funds, advice, and
contacts (Sahlman, 1990; Stuart et al., 1999; Hellmann and Puri, 2002; Hsu, 2004; Bottazzi,
Da Rin and Hellmann, 2008). While Hsu (2004) shows that startups are willing to pay a price
4
for venture capitalist certification in the form of equity discounts, he does not examine the
startup’s decision to invest in signals, per se.
More recently, Hsu and Ziedonis (2008, 2011) and Haeussler et al. (2009) have examined
the relation between patents and firm valuation. Hsu and Ziedonis (2008, 2011) use a sample
of US semiconductor firms and find that the greater the number of patents filed, the higher
the pre-money valuation by venture capitalists. They interpret this result in terms of signaling
since the effect of patents is greater in early financing rounds, as one would expect if patents
worked as a signal. Haeussler et al. (2009) find similar results for a sample of German and
British biotechnology companies. In their study, patent oppositions increase the likelihood of
receiving venture capital, but ultimate grant decisions do not, presumably because they are
anticipated. However, neither study examines patents as a costly signal nor accounts for the
endogeneity of the signal.
We contribute to this literature in two ways– we endogenize the signaling decision and con-
sider multiple signals. Our study is also one of the few to consider business angel investment.
Kerr et al. (2010) is a notable exception which uses a regression discontinuity approach and
finds a positive impact of business angel funding on startup survival and growth. Goldfarb
et al. (2009) examines business angel and venture capitalist data to examine the relation
between control rights and investor composition, finding that business angels exert weaker
control rights. DeGennaro (2012) estimates expected returns on business angel investment
and find that Angel investors earn similar returns to those earned by venture capitalists.
Wong (2010) provides an agency model of funding in which business angels force the founders
to hold a large stake in the firm to ensure the alignment of their interests with the firm. None
of this work, however, examines startup decisions regarding signals.
2 Setup of the model
We build a simple model in which the founders of a startup company have private information
about the probability of success of a technology as well as their own commitment to developing
5
it. Potential investors observe these startup attributes only with noise. As in Leland and Pyle
(1976), the asymmetry of information gives the founders an incentive to signal the company’s
type to potential investors, who for our purposes exclude friends and family members. We
shall define the startup’s type by whether its technology has a high or low probability of
success.
We consider two potential signals which convey information about the quality of a com-
pany: number of patents filed and founders, friends and family money (hereafter ”FFF
money”). Patents reveal information on the quality of the firm’s underlying technology, while
FFF money reflects the founders’ commitment to the startup. The model differs from other
models with multiple signals (see for example Grinblatt and Hwang, 1989; and Milgrom and
Roberts, 1986) by our inclusion of the preferences of external investors, which, in equilibrium,
affect the founders’ investment in the signals.
In line with the existing literature on family finance (Parker, 2009; Casson, 2003), our
model assumes that family members and friends have private information about a startup
given their proximity to the founders. Thus their investment can be used as a signal for
external investors, who do not have private information on the startup’s type. While we do
not expect family members and friends to be informed about the technology, they are likely
to have information about founder attributes, such as dedication, which affect the startup’s
value.
As in the case of signaling with productive education (Spence 1974), the number of patents
filed and FFF money directly affect the value of a startup. In the case of patents, the Berkeley
Patent Survey examined six reasons, in addition to attracting financing, for startups to patent
their inventions (see Graham and Sichelman, 2008, p. 154). In general, patents generate
value for firms by excluding competitors from practicing their inventions, facilitating licensing
to interested parties or by increasing the startup’s bargaining position in negotiations with
other patent holders or established firms with complementary assets (Cohen et al., 2000;
Arora and Ceccagnoli, 2006; and Gans et al., 2002). The role of FFF money is threefold.
6
In addition to signaling founder commitment, it generates value by increasing the startup’s
bargaining position in negotiations with other potential investors. Finally, it is a source of
capital which complements the funds provided by other investors (Agrawal et al., 2011; Parker,
2009; Cumming and Johan, 2009).
2.1 Basic assumptions
The game is played in three periods. In the first period, Nature chooses each startup’s type, H
or L, depending on whether its underlying technology has a high or low probability of success,
respectively, θH or θL, with θH > θL. Each type of startup generates a value, V (p,M ; θ), which
depends on the founders’ investment in patents, p, the investment by the founders, their
friends and families in the startup, M , given the probability of success, θ, of the underlying
technology. As discussed above, patents and FFF money are “productive” in the sense that
they are inputs to a startup’s value function. A startup with a high probability of success
θH generates a greater value for any given p and M , thus Vθ(p,M ; θ) > 0. In addition to
contributing to the value of a startup, the investments in p and in M convey information about
the quality of the technology and the founders’ commitment to the technology, respectively.
We assume that V (p,M ; θ) is an increasing strictly concave function of p and M . For each
value of p and M, the derivatives of V (p,M ; θ) with respect to these signals are the same
and do not vary across types. Moreover, p and M are complements in the realization of
V (p,M ; θ), thus, VMp(p,M ; θ) > 0, where VMp(·) is a cross-partial derivative.
In the second period, the founders learn their type and choose the amounts p and M to
send as signals, incurring a cost c(p,M ; θ), which we assume is an additive function of the costs
of patents and FFF money, r(p) and q(M) respectively. Importantly, r(p) is the opportunity
cost of the effort necessary to develop a patentable invention. This definition of cost is not
only more reflective of the true cost of patenting, but also for a patent to provide a signal
in the economic sense, it must be more costly for L-type founders than for H-type founders.
Indeed, the fee to file for a patent does not depend on startup type, but the opportunity cost
7
does. Hence, we assume that for H-type founders r(p) is a linear function of the investment
in patents, bH × p, where bH > 0 is the marginal cost of effort, while for L-type founders, r(p)
is k × bH × p, with k > 1. This specification ensures that both the total and marginal costs
of making a patentable invention are higher for L- than for H-type founders.
There are two components of q(M). The first, ρM , with ρ > 0, is the opportunity cost of
investing M in a startup, which we assume is the same for both type of founders. Thus, ρM
can be viewed as the forgone returns from investing M in projects other than the startup. The
second is the risk premium required for each dollar of FFF money obtained. Our assumption
is that friends and family have private information about the startup type. Thus, we represent
the premium as zero for a high quality startup and gL > 0 for a low quality startup.
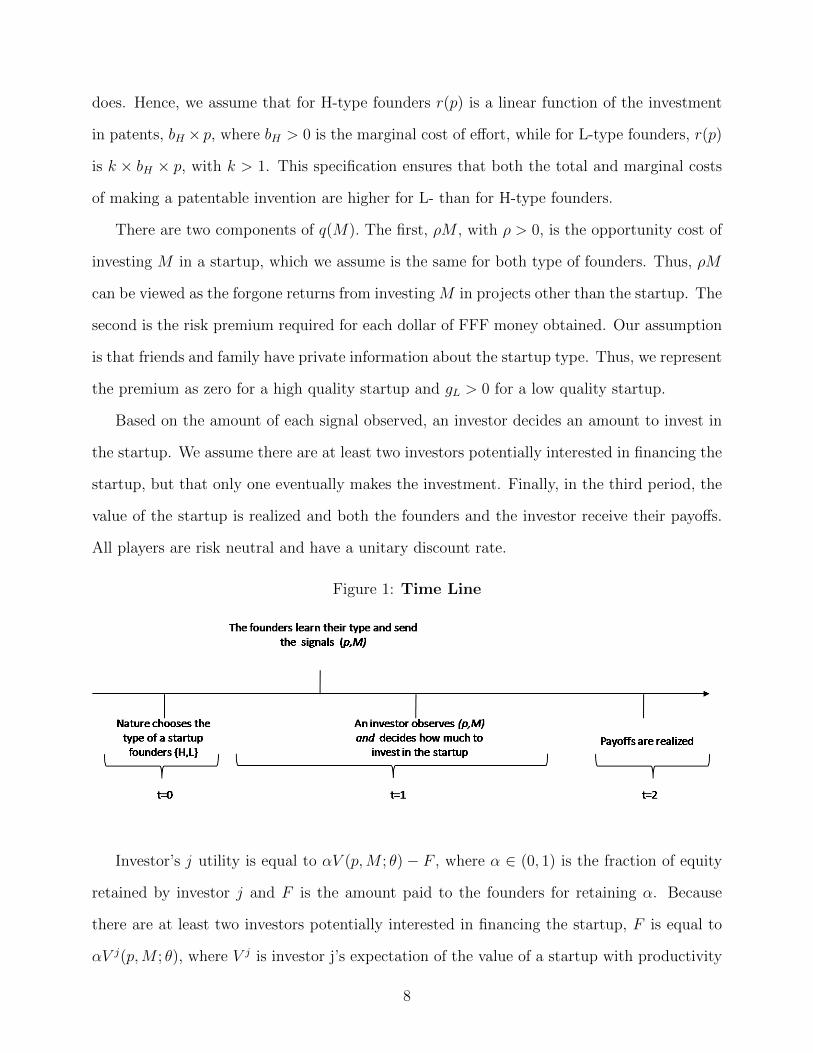
Based on the amount of each signal observed, an investor decides an amount to invest in
the startup. We assume there are at least two investors potentially interested in financing the
startup, but that only one eventually makes the investment. Finally, in the third period, the
value of the startup is realized and both the founders and the investor receive their payoffs.
All players are risk neutral and have a unitary discount rate.
Figure 1: Time Line
Investor’s j utility is equal to αV (p,M ; θ) − F , where α ∈ (0, 1) is the fraction of equity
retained by investor j and F is the amount paid to the founders for retaining α. Because
there are at least two investors potentially interested in financing the startup, F is equal to
αV j(p,M ; θ), where V j is investor j’s expectation of the value of a startup with productivity
8

θ and it coincides with that of the other potential investors.
Founder utility is a function of wealth in t = 1 and in t = 2, net of the costs of investing
in M and in p2:
Ui = W1(p,M ; θ) +W2(p,M ; θ)− c(p,M ; θ)
Wealth in t = 1 is equal to:
W1(p,M ; θ) = αV j(p,M ; θ) +M
M ≥ M ≥ 0, is FFF investment in the startup, which is at least equal to a minimum
amount M required to start the business. W1(p,M ; θ) is the sum of the amount received by
the founders from external investors, after selling a portion α of their equity, and the amount
M lent by friends and families or diverted by the founders to the startup, from alternative
uses. W1 is used to finance part of the venture, including the fees required to file a patent.
The founders’ expected wealth in t = 2 is equal to:
W2(p,M ; θ) = (1− α)V (p,M ; θ)−M
That is W2(p,M ; θ) is the return to equity, after the value of the startup is realized, net of
the debt repayment to friends, families and to the founders themselves, who can now reassign
to alternative uses the amount they had initially subtracted.
3 Solution of the game
We are interested in a separating equilibrium of this game. In order to find such an equi-
librium, we need to define the system of beliefs and strategies of a potential investor. We
allow the system of beliefs to depend on an investor’s preferences over two startup attributes:
2A very similar objective function is by Bhattacharya (1979) and Leland and Pyle (1976).
9
the quality of a technology being commercialized and the commitment of the founders. We
assume that investor preferences are known by the founders. In this setting, if an investor
values the quality of a technology more highly than founder commitment, she will believe that
the founders are type H if the ratio of patent investment to FFF money is greater or equal
than k, with k > 0. The reverse occurs, if an investor values founder commitment. Then,
the investor will believe that the founders are type H if p/M < k. If the external investor is
indifferent between the two aspects of a startup, then she will believe that the founders are
type H either if p/M ≥ k or if p/M < k.
The corresponding investor’s strategy will be to invest an amount αV j(M∗H , p
∗H ; θH) if she
believes that the founders are type H and an amount αV j(M∗L, p
∗L; θL) otherwise. M∗
H and p∗H
are the amounts that solve H-type founders’ constrained maximization problem. Similarly,
M∗L and p∗L solve the L-type founders’ maximization problem.
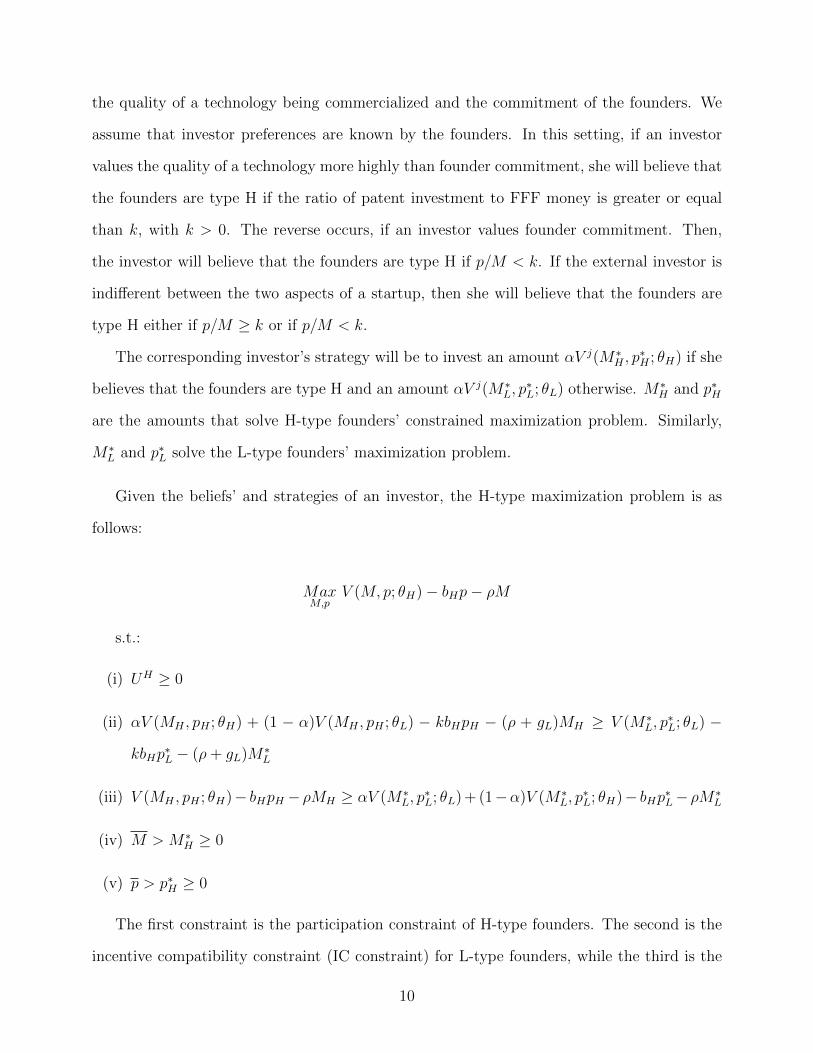
Given the beliefs’ and strategies of an investor, the H-type maximization problem is as
follows:
MaxM,p
V (M, p; θH)− bHp− ρM
s.t.:
(i) UH ≥ 0
(ii) αV (MH , pH ; θH) + (1 − α)V (MH , pH ; θL) − kbHpH − (ρ + gL)MH ≥ V (M∗L, p
∗L; θL) −
kbHp∗L − (ρ+ gL)M∗
L
(iii) V (MH , pH ; θH)− bHpH − ρMH ≥ αV (M∗L, p
∗L; θL) + (1−α)V (M∗
L, p∗L; θH)− bHp∗L− ρM∗
L
(iv) M > M∗H ≥ 0
(v) p > p∗H ≥ 0
The first constraint is the participation constraint of H-type founders. The second is the
incentive compatibility constraint (IC constraint) for L-type founders, while the third is the
10
IC constraint for H-type founders. The IC constraints show that a type of founder can mimic
the other type only in t = 1 because, in t = 2, the true type will be revealed. We assume that
with asymmetric information, L-type founders find it profitable to mimic H-type founders.
This implies that the equity share, α, retained by an investor has to be high enough in order
for L-type founders to find it profitable to invest an amount of p and M equivalent to that
which maximizes H-type founders utility. This ”envy” condition is crucial for the signaling
game, because, if this were not the case, H-type founders would not need to differentiate
themselves from L-type founders.
In any separating equilibrium, the expected value of a startup, V j(M, p; θ), must equal its
actual value V (M, p; θ). Indeed, the IC conditions require the utility of both types of founders
being maximized, subject to the market correctly believing that each startup’s value equals
its true value. The upper bound on M embodies the assumption that the founders, their
family and friends are wealth constrained. The upper bound on p stems from the fact that
the founders of a startup can only dedicate a limited amount of effort to the production of
patentable inventions. We assume that min{|Vpp(p,M ; θ)| , |VMM(p,M ; θ)|} > VMp(p,M ; θ),
where p and M are evaluated at {M∗H , p∗H}. This ensures that while an additional investment
in one of the two signals affects the impact of the other signal on V (p,M ; θ), this effect is not
too strong.
We restrict our attention to interior solutions of the game and examine how the different
structures of an investor’s belief affect these solutions.
Proposition 1. Given the system of beliefs and strategies of an investor, the following sepa-
rating equilibria arise:
(i) If an external investor values the quality of a startup’s technology relatively more than
founder commitment, then the founders’ investment in p and M will be such that p/M =
k.
11

(ii) If the external investor values the founder commitment relatively more than quality
of a startup’s technology, then the founders’ investment in p and M will be such that
p/M = z, with z < k.
(iii) If the external investor is indifferent between the quality of a startup’s technology and
founder commitment, then the founders’ investment in p and M will be either p/M = k
or p/M = z, depending on the values of bH and ρ.
All of these equilibria are characterized by the external investor investing αV (M∗H , p
∗H ; θH),
if a startup is of high value, and αV (M∗L, p
∗L; θL) < αV (M∗
H , p∗H ; θH), if a startup is of
low value. Moreover, a startup of type θH invests greater amounts of both M and p than
in symmetric information.
Proof. The proof of Proposition 1 is available in the appendix.
If external investors place more weight on the quality of the founders’ technology, then
k is equal to the ratio of patent investment, p, which is derived from the IC constraint
of L-type founders holding with equality and the investment in FFF money, M , which is
derived from the first order condition of the founders’ maximization problem. Intuitively, if
an external investor places more weight on p than on M , the founders will use their investment
in p to distinguish themselves from the low-type founders, thus leading to over-investment
in p relative to symmetric information. Because VMp(p,M ; θ) > 0, and therefore, dMdp
> 0,
an increase in p relative to the optimal amount under symmetric information leads M to be
greater than the optimal amount under symmetric information. However, the upper bound on
VMp(p,M ; θ), ensures that the increase in M relative to a situation of symmetric information
is lower than that of p.
If external investors value the commitment of the founders more highly, then the reverse
occurs. The ratio of p over M will be equal to a constant z, with z < k. Intuitively, if
external investors place more weight on M than on p, then the increase in M relative to
a situation of symmetric information, in which the optimal investments in p and in M are
12
independent of the investors’ preferences, will be more pronounced than the increase in p.
Because, the reverse occurs if the external investors place more weight on the quality of the
founders’ technology, then z has to be less than k. Finally, if the investors’ beliefs are such
that the investors are indifferent to combinations of M and p as long as the IC constraint
for L-type founders is met, then H-type founders will choose to invest relatively more in the
signal that costs the least in order to signal their type.
As we show in the Appendix, the application of the intuitive criterion proposed by Cho
and Kreps (1987) leads to the elimination of all pooling equilibria. To provide intuition,
under every configuration of an investor’s preferences, a candidate pooling equilibrium could
be one in which the founders invest amounts of p and/or M that are smaller than those
invested by H-type founders in the separating equilibrium we have outlined. However, such
candidate pooling equilibrium would be subject to profitable deviations by H-type founders.
Having observed the amounts of p and M invested by the founders, the investor would place
a probability of zero on the founders being H types since with constraint (iii) holding with
equality, H-type founders would be better off by deviating and providing the equilibrium
amounts of p and M . A similar argument can be made for candidate pooling equilibria in
which the founders invest amounts of p and/or M that are larger than those invested by
H-type founders in our separating equilibrium.
In some instances an external investor might place a relatively high weight on technology
value, but at the same time require the founders to invest a positive amount of own money as
a signal that they believe in their own venture (Dushnitsky, 2010a; Dushnitsky, 2010b; Lowe
and Ziedonis, 2006). In this case, there exists a separating equilibrium such that p/M ′ = k′.
Patent investment, p, is still be derived from the IC constraint of L-type founders holding
with equality, but this time the investment in FFF money, M , is equal to an amount M ′ set
by an external investor as a guarantee that the founders are not behaving opportunistically.
Hence, M ′ will be greater than the amount that maximizes the founders’ value function. The
opposite conclusion is reached if the external investor attaches relatively more importance to
13

founder commitment but requires a positive investment in patents as a guarantee that the
startup’s technology complies with a minimum standard. In this case, M is still derived from
the IC-constraint of L-type founders, while p is equal to an amount p′ set by the external
investor.
Two final points bear mention before turning to estimation. First, when external investors
have different preferences over startup attributes, then the founders need to choose which
external investors they intend to target with their signals, and, then, the amounts of M
and p consistent with the investor’s preferences, as in the separating equilibria depicted in
Proposition 1. The founders’ choice relative to the category of investors would depend on
the fraction of equity α, and the founders’ costs of investing in patents and FFF money.
Second, while we have focused on FFF money and patents, the logic of Proposition 1 can
clearly be extended to other signals, such as sweat equity to signal commitment rather than
FFF money. If for instance, founder commitment could be signaled by either FFF money
or sweat equity and the external investors have no specific preference regarding which signal
the founders should use, then the founders of a startup should pick the signal that costs the
least. If, instead, the external investors have specific preferences regarding which signal can
better convey information on the commitment of the founders, then the latter should pick
that signal.
4 Empirical estimation
In this section, we empirically examine the implications of Proposition 1: namely that the
founders of high quality technology startups consider patents and FFF money as signals
of their company’s value and (i) when they use these mechanisms to signal, the number
of patents they file is larger (smaller) than the investment in FFF money according to the
investor’s preferences for high quality technology relative to founder commitment, and (ii) the
amount provided by an external investor will be larger the greater the founders’ investment
in the signal the investor values relatively more. We exploit detailed information available
14
on technology startups located in the Advanced Technology Development Center (ATDC) of
the Georgia Institute of Technology. Specifically, we use information on startup investment
in patents and FFF money as well as the funds provided by business angels and venture
capitalists.
Section 4.1 describes the data, 4.2 explains the empirical models which take into account
endogeneity of FFF money and patents, 4.3 gives summary statistics, and 4.4 gives the results.
4.1 Dataset
The ATDC is a technology incubator sponsored by the Georgia Institute of Technology.
Founded in 1981, it has hosted a total 226 startups during the period 1998-2008. In ad-
dition to ensuring incubation space on entrepreneur-friendly terms, the ATDC has an im-
portant role in providing strategic entrepreneurial advice and key business connections to
the member companies. To this scope, it employs a staff of approximately 20 experienced
managers. Additionally, ATDC makes equity investments in the member companies alongside
angel investors and venture capitalists. Although this incubator is located on the campus of
the Georgia Institute of Technology, the member companies need not be spinoffs from the
university. Indeed, only 40% of those in our sample are university startups. For admission,
applicant companies must pass a two-stage review by ATDC managers and only between 10%
and 20% are eventually admitted (Rothaermel and Thursby, 2005b). As admission criteria,
a company has to be located in Georgia, commercialize a technology which is proprietary in
nature, and must have the potential for employing a large number of employees. The majority
of the member companies in our sample, 79%, were admitted within the first five years after
founding, 11% were admitted within their fifth and their tenth year, while the remaining
joined ATDC more than ten years after founding. The majority of the companies, 54%, were
active in the information technology sector, while only a small minority (about 5%) were in
life sciences.
The ATDC provided information on the 226 startups which they gathered from an annual
15
compulsory survey of member companies. This survey asks information on the company links
with the university (e.g., such as commercializing a university technology, employee contracts
with university students, informal contacts with the university’s faculty), the amount of money
they received from business angels and venture capitalists, the amount of FFF money invested
by the founders, the number of patents they filed and the number of patents they were
awarded. For 80 startups we integrated the information from this survey with information
from their business plans submitted to the ATDC at the time of their entry to the incubator.
The business plans contain information on the founders, including their age, whether they have
family connections, the year and the university at which they obtained either their bachelor
and/or master and/or PhD degree. They also include a detailed description of a startup’s
technology, including the industry sectors in which it should be commercialized. In cases
where the business plans were unavailable, we sent a survey to at least one of the founders
asking questions on their education background, the stage of their technology at the time of
entry in the incubator and the sectors in which their technology was to be commercialized.
The response rate was 25%, with 37 responses. The remaining information was obtained from
founder web sites or linkedin profiles.
We exclude from the sample those companies joining ATDC more than ten years after
founding, since for these companies information was incomplete. This, plus eliminating star-
tups for which we had neither business plans nor survey responses, gave a sample of 117
startups and a total of 471 firm-year observations. The startups in our sample spent at least
a year in the incubator during the period 1998-2008. On average a company spent 4.5 years,
with a minimum of 1 and a maximum of 8 years. More than half of the startups in the sample
had at least one founder who had studied either at the Georgia Institute of Technology or
Emory University.
16
4.2 Estimation Models
To examine the impact of FFF money and patents on venture capital and business angel
investment, we estimate two structural models one for each type of investor in which we
relate external investment to the startup’s investment in patents and FFF money:
V C BINARYit = δ0 + δ1FILED PATit + δ2FFF MONEYit +X ′itξ + εit (1)
ANGEL BINARYit = ϕ0 + ϕ1FILED PATit + ϕ2FFF MONEYit +X ′itγ + ηit (2)
VC BINARYit is a dummy which takes the value 1 if the startup i received venture
capital funding in year t. Similarly, ANGEL BINARYit is a dummy that takes the value 1
if the startup i received business angel funding in year t. FILED PATit is the amount of
patents filed (in log) in year t. FFF MONEYit is the amount invested in a startup by the
founders, their friends, and families in year t (in logs).3 We also estimate similar equations to
those above, using as dependent variables the amount (in logs) invested in year t by venture
capitalists in startup i (VCit FUNDS) and the amount (in logs)4 invested in year t by business
angels in startup i (ANGELit FUNDS).
As discussed in the theory section, FFF money is an alternative to external funding from
either type of investor. If this were its only role, then we should expect a negative impact of
FFF money on external founding. In contrast, if FFF money were to have a signaling role,
and this role were to outweigh the importance of FFF money as a source of funding, then we
should expect FFF to have a positive impact on external investment.
With regard to the patent variable, we use the number of patents filed rather than the
3Although we only have yearly data and, thus, cannot determine whether, on a given year, the amountof patents or FFF money invested by the founders occurs before or after the investment of the externalinvestors, we feel confident that either investment by the founders occurs just before or simultaneously withthe investment of the external investors, and not after. In fact, discussions with ATDC staff as well as withstartup founders revealed that external investors require that the founders commit their effort, be it in theform of FFF money or patents or other types of investment, before they invest.
4We add 1 to every variable in log. All the nominal variables were converted into real terms by dividingfor the yearly consumer price index.
17
number of patents awarded because the latter would conflate founder use of patents as a
productive signal with decision-making on the part of the patent office. In actuality, however,
there should be little difference in the results from the two measures since 95% of US PTO
patents filed are eventually granted (Quillen et al. 2002). We should also note that while we
cannot empirically separate the signaling value of patents from their productive contribution,
to the extent that the majority of the startups in our sample operate in the software sector,
recent studies point to the importance of the signaling role of patent in this sector. For
example, Bessen and Hunt (2007) find that patents as a means to increase a firm’s bargaining
position is less important for small firms than for large ones, and more to the point, the
Berkeley survey finds that for software startups the most important reason to patent is as a
reputational signal for external investors (Graham et al., 2009).
Xit is a matrix of controls. It includes the variable AV WORK YS, defined as the average
number of years the founders worked prior to founding the startup. This variable controls
for founder work experience, as well as the founders’ “pocket size” since the more years
worked the more years of possible savings to invest. The dummy STARTUP EXP controls
for whether the founders founded successful startups in the past. Serial founders are likely
to have developed managerial and technical skills, and built a network of contacts of use
in seeking external funds (McGrath and MacMillan, 2000; Shane, 2000). We consider only
serial founders of successful startups as Gompers et al. (2010) suggest that unsuccessful serial
entrepreneurs have substantially lower chances than successful ones of succeeding in the next
venture, and, moreover, the chances of the first category of entrepreneurs are similar to those
of first time entrepreneurs. To build the dummy, STARTUP EXP, we collected information
from the founders’ and the ATDC’s websites on the name of the startups the founders had
founded in the past and, through extensive web searches. We retained only those startups
which either had a successful exit event or as of the time of estimation had a website with
updated information on their activities. We include a count, N MASTER, of the founders
who had obtained a master’s degree in science or engineering, as a measure of founder quality.
18

We measure the size of a startup with the number of full time employees, FTit.
The control READY FOR MKT bears special mention. It is a dummy which takes the
value of one if a technology was ready to be commercialized or was at a manufacturing
feasibility stage at the time the startup joined ATDC. To construct this variable, we employed
two master’s students with engineering backgrounds to independently code the stage of the
startups’ technology based on the technology description provided in the business plans. The
students could choose among the following options: i) proof of concept; ii) prototype; iii)
manufacturing feasibility; or iv) ready for the market.5 For the startups with missing business
plans, we used the founder assessment from the survey mentioned above, in which we asked
the founder to choose among one of these four options to describe their technology’s stage at
the time of entry to ATDC. To reduce noise, we combined the four options into the binary
alternative ready/not ready for the market.
To control for sector fixed effects, we use a dummy, SOFTWARE, which takes the value
of one if a startup were to commercialize a software product. This dummy controls for the
fact that 45% of the startups in our sample were offering software products. We also include
a dummy, TIME TO ATDC, that controls for whether a startup had joined the incubator
within the first five years after foundation. Discussions with startup founders revealed that,
holding constant sector effects, one of the most important reasons for early year startups
to join ATDC is seeking access to external investment. This factor decreases in importance
for startups who join ATDC in their later years, relative to factors such as reaching new
markets or making contacts. We include a dummy, GT LINK, which takes the value of one
if a startup is commercializing proprietary knowledge of the Georgia Institute of Technology
based on an exclusive license. As in Rothaermel and Thursby (2005b), we argue that an
incubator firm founded to commercialize a technology from the sponsoring university might
have greater incentive to exert effort to ensure the success of the venture than a firm with no
such commitment. Finally, we include year dummies to control for time effects.
5Where the initial student assessments differed, we engaged the students in a discussion to determine aconsistent assessment.
19
Our central hypothesis is that if FFF money and patents are used as a signal for external
investors, then their investment is endogenous to the system. In this case, FFF money
and patents are caused by external funding as well as being caused by external funding.
This is because the founders of a startup choose their investment in FFF and patents taking
into account external investors’ beliefs and their corresponding investment strategies, and
external investors make their investment decisions based on the signals they observe. To take
the endogeneity of the signals into account we estimate two-stage least squares models. In
the case in which the investment by venture capitalists and business angels is treated as a
binary outcome we estimate a two-stage least squares linear probability model, which delivers
consistent estimates of the average partial effects (Wooldridge, 2002).
Our instruments are measures of the opportunity costs of investing in the signals. Specifi-
cally, we include a count variable, CLOSENESS, which takes the value of three if the founders
had family connections, two if they were in the same class during either their master or PhD,
one if they studied at the same university but not in the same class, and zero otherwise.
CLOSENESS is a measure for the opportunity costs of investing a dollar of FFF money (the
parameter ρ in our theoretical model), in the sense that the closer are the relational ties
among the founders, the less costly it is for them to risk invest their own money6.
As a proxy for the opportunity cost of a unit of effort devoted to making a patentable
invention (the parameter bH in our theoretical model), we use a variable, PHD,which is defined
as the number of founders with a PhD in science or engineering. The underlying logic is that,
with a PhD in science or engineering, the founders acquire a knowledge background that
reduces the costs of making a patentable invention. This instrument might be correlated
to the unobserved quality of the founders and, thus, might not be exogenous. However,
discussion with founders as well as with external investors revealed in many instances that
6There might be downsides to CLOSENESS as doing business with family andfriends could sometimes endanger a close relationship (see for instance Noam Wassermanin://founderresearch.blogspot.com/2005/12/thanksgiving-dinner-with-your.html). However, given thatinformation asymmetries are much lower when relational ties are close, a reasonable assumption is that thecosts from endangering a close relationship are still less important than the opportunity costs of investingFFF money when the founders do not know each other well.
20
good quality technologies are as likely to come from founders with a master’s degree -which
we account for with our control- as from founders with a PhD’s degree. What makes a
PhD attractive from the standpoint of producing inventions is that by having access to their
laboratory’s equipment, PhD students can produce inventions at a lower cost than founders
who need to buy the equipment themselves. In our sample, all founders with a PhD degree
had founded their startup towards the end of their PhD study, which leads us to conclude
that in our case having a PhD degree should principally translate into lower costs of making a
patentable invention. Holding a PhD might also mean better access to a network of external
investors interested in commercializing university technology, which might affect the likelihood
of obtaining external investment. However, to the extent that we observe external investment
only for the period in which the startup was located at the incubator and the majority of
founders with a PhD had obtained their degree from the Georgia Institute of Technology,
then our variable GT LINK is a good control for their network size.
Finally, we include a discrete variable, CYCLE, that takes increasing values the longer
the time spent at ATDC and which we use to measure the extent of asymmetric information
between startup founders and external investors. The rationale is that, having controlled for
the stage of a technology to be commercialized and time effects, the length of time spent at
ATDC affects external investors’ willingness to finance a startup only indirectly, through the
signaling investment decision of the founders.
4.3 Descriptive statistics
The descriptive statistics are given in Table 1. The average business angel and venture capital
investment in our startups during their tenure in the incubator are $87,498 and $454,419,
respectively7. Moreover, 54% of the startups in our sample received no business angel funding,
while 57% of them received no venture capital funding. Consistent with DeGennaro (2010)
and Shane (2009), only 20% of the startups in our sample received funding from both venture
7All figures are expressed in real terms.
21
capitalists and business angels. Further, with regard to funds raised, our sample of firms is
not random. For the period we examine, the business angel and venture capital investments
of the average ATDC startup are 24,000 USD and 143,633 USD, respectively. These means
are statistically different from the average in our sample at the 1% level.
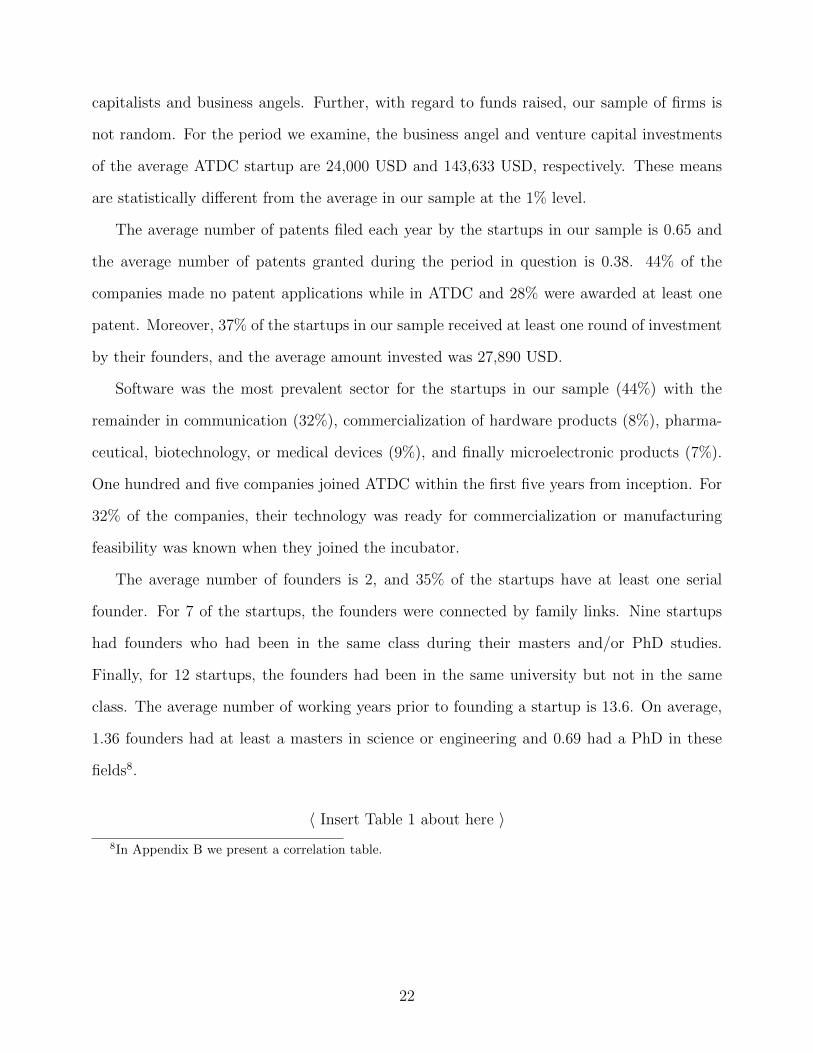
The average number of patents filed each year by the startups in our sample is 0.65 and
the average number of patents granted during the period in question is 0.38. 44% of the
companies made no patent applications while in ATDC and 28% were awarded at least one
patent. Moreover, 37% of the startups in our sample received at least one round of investment
by their founders, and the average amount invested was 27,890 USD.
Software was the most prevalent sector for the startups in our sample (44%) with the
remainder in communication (32%), commercialization of hardware products (8%), pharma-
ceutical, biotechnology, or medical devices (9%), and finally microelectronic products (7%).
One hundred and five companies joined ATDC within the first five years from inception. For
32% of the companies, their technology was ready for commercialization or manufacturing
feasibility was known when they joined the incubator.
The average number of founders is 2, and 35% of the startups have at least one serial
founder. For 7 of the startups, the founders were connected by family links. Nine startups
had founders who had been in the same class during their masters and/or PhD studies.
Finally, for 12 startups, the founders had been in the same university but not in the same
class. The average number of working years prior to founding a startup is 13.6. On average,
1.36 founders had at least a masters in science or engineering and 0.69 had a PhD in these
fields8.
〈 Insert Table 1 about here 〉8In Appendix B we present a correlation table.
22
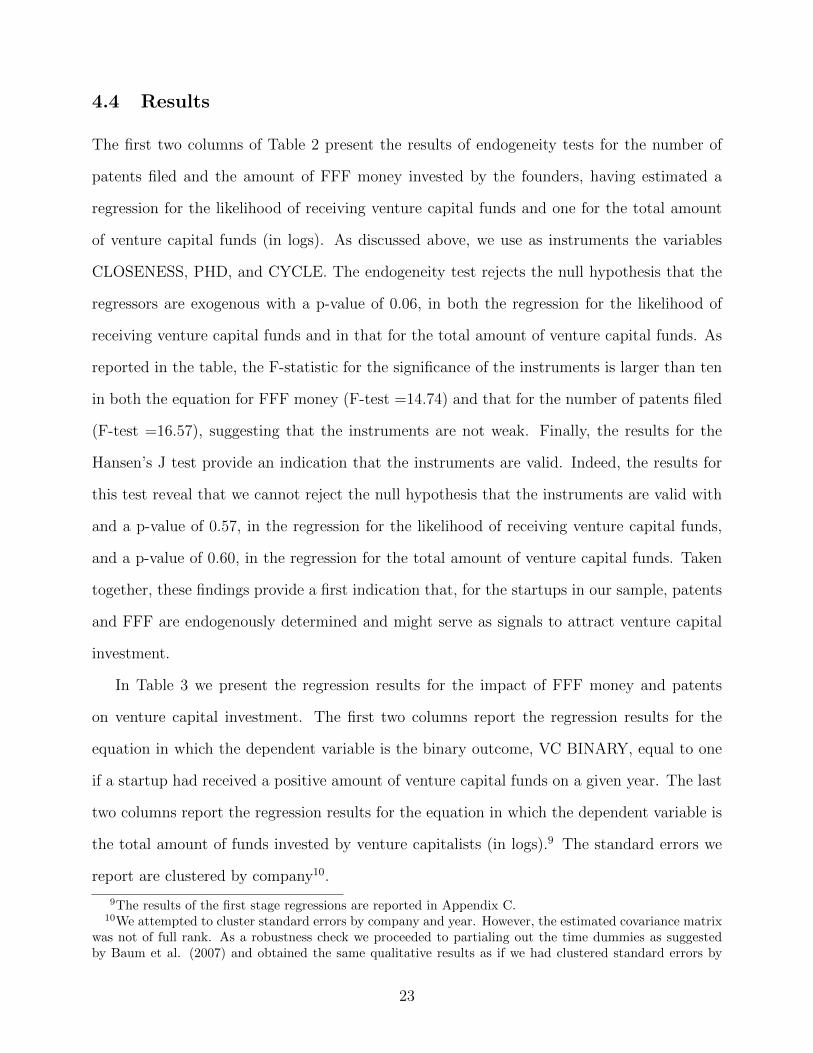
4.4 Results
The first two columns of Table 2 present the results of endogeneity tests for the number of
patents filed and the amount of FFF money invested by the founders, having estimated a
regression for the likelihood of receiving venture capital funds and one for the total amount
of venture capital funds (in logs). As discussed above, we use as instruments the variables
CLOSENESS, PHD, and CYCLE. The endogeneity test rejects the null hypothesis that the
regressors are exogenous with a p-value of 0.06, in both the regression for the likelihood of
receiving venture capital funds and in that for the total amount of venture capital funds. As
reported in the table, the F-statistic for the significance of the instruments is larger than ten
in both the equation for FFF money (F-test =14.74) and that for the number of patents filed
(F-test =16.57), suggesting that the instruments are not weak. Finally, the results for the
Hansen’s J test provide an indication that the instruments are valid. Indeed, the results for
this test reveal that we cannot reject the null hypothesis that the instruments are valid with
and a p-value of 0.57, in the regression for the likelihood of receiving venture capital funds,
and a p-value of 0.60, in the regression for the total amount of venture capital funds. Taken
together, these findings provide a first indication that, for the startups in our sample, patents
and FFF are endogenously determined and might serve as signals to attract venture capital
investment.
In Table 3 we present the regression results for the impact of FFF money and patents
on venture capital investment. The first two columns report the regression results for the
equation in which the dependent variable is the binary outcome, VC BINARY, equal to one
if a startup had received a positive amount of venture capital funds on a given year. The last
two columns report the regression results for the equation in which the dependent variable is
the total amount of funds invested by venture capitalists (in logs).9 The standard errors we
report are clustered by company10.
9The results of the first stage regressions are reported in Appendix C.10We attempted to cluster standard errors by company and year. However, the estimated covariance matrix
was not of full rank. As a robustness check we proceeded to partialing out the time dummies as suggestedby Baum et al. (2007) and obtained the same qualitative results as if we had clustered standard errors by
23
The main result that emerges from Table 3 is that the number of patents filed by the
founders has a positive and statistically significant impact on both the likelihood of receiving
venture capital funding and the amount of funds received. A 1% increase in the number
of patents filed increases the probability of venture capital funding by 46%. Moreover, the
elasticity of venture capital funding with respect to the founders’ investment in patents is 6.7,
suggesting a high sensitivity of VC investment to patent investment. The high value of the
elasticity should not be surprising given that so many companies in our sample had never filed
for a patent, and very few had filed for more than one patent. The investment in FFF does not
have a statistically significant impact on venture capital funding. Taken together, the results
on the number of patents filed and that on FFF money suggest that venture capitalists care
relatively more about the quality of a technology than about the commitment of the founders.
As for the other controls, having founded successful startups in the past has a statistically
significant impact on venture capital investment. The magnitude of the coefficients reveal that
having founded at least one successful startup in the past increases the likelihood of receiving
venture capital funds by 14% and the the elasticity of the amount of funds relative to the
investment in patents is 1.9. This result is in line with Gompers et al. (2010) as well as with
anecdotal evidence that venture capitalists attach a high value to the past experience of the
founders in assessing the quality of a venture. The number of full time employees is positively
associated with funding from external investors. This result implies that either larger size
startups require more funds from external investors, or, if size is positively correlated with
the value of a startup, then higher value startups are positively associated with the investment
provided by venture capitalists. Finally, startups that commercialize proprietary knowledge
of the Georgia Institute of Technology, via an exclusive licence, have a higher likelihood of
receiving venture capital funds and receive a greater amount. This could be due either to the
fact that these companies are better quality on average or that they have better access than
other startups to the network of venture capitalists.
company only.
24
Returning to Table 2, the last two columns present the results of endogeneity tests for
the number of patents filed and the amount of FFF money invested by the founders, hav-
ing estimated a regression for the likelihood of receiving business angel funds and one for
the total amount of business angels funds (in logs). As before, we use as instruments the
variables CLOSENESS, PHD, and CYCLE. The endogeneity test of FFF money rejects the
null hypothesis that the regressors are exogenous with a p-value of 0.001 in the regression for
the likelihood of receiving business angel funds, and with a p-value of 0.002 in the regression
for the amount of funds invested. As before, the results for the Hansen’s J test provide an
indication that the instruments are valid: we cannot reject the null hypothesis that the in-
struments are valid with and a p-value of 0.55 in the regression for the likelihood of receiving
business angel funds, and a p-value of 0.24 in the regression for the total amount of venture
capital funds. Again, our findings suggest that FFF money and the investment in patents are
endogenously determined.
In Table 4 we present the regression results for the impact of FFF money and patents on
business angel investment. The first two columns of the table report the regression results for
the equation in which the dependent variable is the binary outcome, ANGEL BINARY, equal
to one if a startup had received a positive amount of venture capital funds on a given year. The
last two columns report the regression results for the equation in which the dependent variable
is the total amount of funds invested by business angels (in log)11. Again, the standard errors
we report are clustered by company. Clearly, the main message from Table 4 is that FFF
money has a positive impact both on the likelihood and on the amount of business angel
funding. The magnitude of the coefficients suggests that an increase by 1% in the amount of
FFF money increases the likelihood of business angel funding by 5%, while the elasticity of
the total amount of business angel funding with respect to FFF money is 0.50. If the role of
FFF money were simply to complement business angel funding then we should have observed
a negative coefficient. Having found a positive coefficient suggests that FFF money have some
11The results of the first stage regressions are reported in Appendix C.
25
signaling value for business angels, while the investment in patents does not.
These findings are in line with survey evidence provided by Van Osnabrugge and Robinson
(2000) and DeGennaro (2010), and our own interviews of startup founders. In particular, Van
Osnabrugge and Robinson (2000) and DeGennaro (2010) show that business angels tend to
consider characteristics such as commitment, trust and enthusiasm more than do venture
capitalists. Our interviews point to similar conclusions. One of the founders we interviewed
argued that business angels are not willing to risk their own money if the founders do not
invest any funds of their own, that is unless the founders have some ”skin in the game.”
Finally, other founders pointed to the importance of founder commitment for business angels.
As for the other controls, contrary to our results for venture capital investment, neither
commercializing proprietary knowledge from the Georgia Institute of Technology nor having
past experience as a successful entrepreneur has a statistically significant impact on business
angel investment.
Overall, the results in Tables 3 and 4 provide an indication that patents are chosen by the
startup founders in our sample to attract venture capital investment but not business angel
investment. By contrast, FFF money is used to attract business angel investment but not
venture capital investment. More importantly, we find that the impact of patent investment
on venture capital investment is very strong and stronger than the impact of FFF money
on business angel investment. In the light of our theory, this result suggests that venture
capitalists care more about the quality of a startup’s technology than business angels care
about the commitment of the founders.
〈 Insert Table 2 about here 〉
〈 Insert Table 3 about here 〉
〈 Insert Table 4 about here 〉
26
4.5 Robustness checks
As a robustness check, we estimate the same models as in Tables 3 and 4 excluding those
startups whose external investment (either venture capital or business angel) falls within the
99th percentile. We present the results in Tables 5 and 6.
The results are quite similar. As found in Table 3, the larger the number of patents filed by
the founders, the greater the likelihood that startups receive funding from venture capitalists,
and the larger the amount received. Moreover, in line with the results in Table 4, the amount
invested by the founders, their friends, and their families, is positively associated with business
angel investment. In fact, the coefficient of FFF money is positive and statistically significant
at the 1% level in the regression for the amount invested by business angels as well as the
likelihood that business angel investment occurs. These results confirm an impact of patents
on venture capital investment which is larger than the impact of FFF money on business
angel investment.
〈 Insert Table 5 about here 〉
〈 Insert Table 6 about here 〉
5 Concluding remarks
This paper provides a simple model which can be used to frame the problem faced by founders
of a high-tech startup who need to signal the company’s value to potential investors. We
consider the use of patents and FFF money as signals of the quality of the technology and
founder commitment, respectively. We find that if an investor values relatively more (less)
the quality of a technology being commercialized, then there exists a separating equilibrium
where the founders of a high quality startup will make an investment in the number of
patents filed that is larger (smaller) than that in FFF money, and the amount invested by the
investor will be larger the greater the founders’ investment in the signal it values relatively
more. If an investor is indifferent between the two attributes of a startup, there exists a
27
separating equilibrium where the optimal proportion with which the two signals are combined
will depend on the costs incurred by the high quality startup’s founders of investing in each
signal. The results of our model can extend to the case of multiple signals. To the extent
that the investors’ preferences over the different aspects of a startups can be ordered, then
the founders of a startup will, in general, invest relatively more in those signals that convey
information about the aspect the investors value more highly.
We also provide an empirical analysis using a novel database on technology startups in the
incubator of the Georgia Institute of Technology. To evaluate the impact of FFF money and
patents on external investment we estimate two structural equation models, which take into
the account the endogeneity of the signals. We find that while patents and FFF money are
endogenous to venture capital investment, venture capitalists appear to value patents more
highly. By contrast, FFF money is strategically used by the founders to attract business angel
investment but not venture capital investment. Moreover, we also find that the impact of the
number of patents filed on venture capital investment is larger than the impact of FFF money
on business angel investment. This result provides an indication that venture capitalists value
more the quality of a startup’s technology than business angels value the commitment of the
founders.
Our empirical results are consistent with evidence found by Hellmann and Puri (2002)
that venture backed startups are more likely and faster to bring in outsiders as CEOs, this
event often coinciding with the departure of the founders. Therefore, if the founders are to be
substituted in case of venture capital financing, then the commitment of the founders should
be relatively less important for venture capitalists. Moreover, they are consistent with our
discussions with startup founders at ATDC who claimed that business angels often require
the founders to have some “skin in the game” as evidenced by FFF money. Finally, they
are in line with findings by Cosh et al. (2009) that there are systematic differences in the
characteristics of startups that seek capital from venture capitalists and startups that seek
capital from banks. Indeed, their findings provide evidence that the preferences of venture
28
capitalists are well defined and distinct from those of other categories of investors.
Taken together our theory and empirics have two important implications for founders or
managers of technology startups. The first is that, because investing in signals is costly, it
is important to control for the cost of the signals in order to correctly assess their impact
on the investment made by external investors. Our empirical model considers the costs of
making a patentable invention and the opportunity costs of investing FFF in a startup. Once
we take into account these costs, we find that FFF money has a positive impact on business
angel investment and that patents have a signaling value for venture capitalists. The second
implication is that the founders of a startup, when deciding which signal to invest in and how
much to invest, need to consider the preferences of the investors they want to target. Our
results, in fact, seem to suggest that patents have a signaling value for venture capitalists but
not for business angels, while FFF investment serves as a signal for business angels but not
for venture capitalists.
A few caveats are in order. First, the information available from the ATDC incubator
does not allow us to assess how investor characteristics affect their preferences. Except for
the distinction between venture capitalists and business angels, we do not have informa-
tion on investors’ characteristics such as sectors of specialization, reputation, and education
background. These and other characteristics are likely to affect the preferences of external
investors as well as their interpretation of the signals they receive. Extending the analysis
to include investors’ characteristics and the latter’s influence on their preferences remains a
subject for future research. Second, our data do not allow us to distinguish founders from
family and friends investment. The two categories of investment might signal different degrees
of commitment to external investors.
Our results are conditional on startups being located at an incubator. We know from
previous studies (Colombo and Delmastro, 2002; Cumming and Fischer, 2012) that being
member of an incubator is not a random event and member startups have different charac-
teristics from the non-members. In our case, we believe that the distinguishing features of
29
the member startups are their willingness to commercialize technology that is proprietary in
nature, their concentration in the information technology sector, and their ties -formal and
informal- with the Georgia Institute of Technology. Thus, these results may not generalize
to startups located outside of an incubator or to incubators at other academic institutions.
Extending the analysis to other university incubators and to a larger sample of startups in
general is a venue for future research.
Moreover, for the startups in our sample we observe that they tend to receive either venture
capital funding or business angel funding but not both. While this is not a specific feature of
our startups (DeGennaro, 2010; Shane, 2009), we believe that it is in part due to the fact that
the majority of our startups operate in the information technology sector and, hence, their
financial needs are likely to be less stringent than those of startups operating in other sectors,
such as life science. We have suggested in our theory that in the case of sequential investment,
the founders of a startup would find it profitable to choose the external investors in such a way
that they share the same preferences over the attributes of the startup. In fact, this choice
would minimize their investment in the signals since the amount invested by the intermediate
investor is considered as ”credible” signal by the late stage investors. A last clarification on
our results is in order. Van Osnabrugge and Robinson (2000) and Shane (2009) have argued
that sometimes it is not easy for the founders of a startup to distinguish between friends’ and
family’s money on the one side, and business angel’s money on the other. Our own experience
by interviewing a sample of startup founders revealed that they considered any investment
from friends or family, no matter how wealthy, as FFF money rather than business angel
investment.
References
[1] Agrawal A., C. Catalini, and A. Goldfarb. 2011. The Geography of Crowdfunding. SSRN
Working Paper Series.
30
[2] Amit R., L. Glosten, and E. Muller. 1990. Entrepreneurial Ability, Venture Investments,
and Risk Sharing. Management Science, 36(10): 1232-1245.
[3] Arora. A, and M. Ceccagnoli. 2006. Patent protection, complementary assets, and firms’
incentives for technology licensing. Management Science, 52(2): 293-308.
[4] Baum C. F., M. E. Schaffer, and S. Stillman. 2007. Enhanced routines for instrumental
variables/generalized method of moments estimation and testing, The Stata Journal,
7(4): 465-506.
[5] Bessen J., and R. M. Hunt. 2007. An Empirical Look at Software Patents. Journal of
Economics & Management Strategy, 16(1): 157-189.
[6] Bhattacharya S.. 1979. Imperfect Information, Dividend Policy, and ’The Bird in the
Hand Fallacy’. Bell Journal of Economics, 10: 259-270.
[7] Bottazzi L., M. Da Rin, and T. Hellmann. 2008. Who are the Active Investors? Evidence
from Venture Capital. Journal of Financial Economics, 89: 488-512.
[8] Burton M.D., Sorensen J., Beckman, C. 2002. Coming from good stock: career histories
and new venture formation. Research in the Sociology of Organizations, 19: 229262.
[9] Casson M.. 2003. The Entrepreneur: An Economic Theory. Second Edition, Cheltenham,
Edward Elgar.
[10] Cho I.K., and D.M. Kreps. 1987. Signaling Games and Stable Equilibria. The Quarterly
Journal of Economics, 102: 179-221.
[11] Cohen W.M., R.R. Nelson and J. Walsh. 2000. Protecting Their Intellectual Assets:
Appropriability Conditions and Why U.S. Manufacturing Firms Patent (or Not). NBER
Working Paper 7552.
[12] Colombo, M. G., and M. Delmastro. 2002. How effective are technology incubators?
Evidence from Italy. Research Policy, 31: 1103-1122.
31
[13] Cosh A., D. J. Cumming, and A., Hughes. 2009. Outside Entrepreneurial Capital. Eco-
nomic Journal, 119: 1494-1533.
[14] Cumming D. J., and E. Fischer. 2012. Publicly Funded Business Advisory Services and
Entrepreneurial Outcomes. Research Policy, forthcoming.
[15] Cumming D. J., and S. A. Johan. 2009. Venture Capital and Private Equity Contracting:
An International Perspective. Academic Press.
[16] Cumming D. J., and S. A. Johan. 2008. Preplanned Exit Strategies in Venture Capital.
European Economic Review, 52: 1209-1241.
[17] Cumming D. J.. Contracts and Exits in Venture capital Finance. Review of Financial
Studies, 21: 1947-1982.
[18] DeGennaro, R. P.. 2012. Angel Investors and their Investments, in D. J. Comming, ed.,
Oxford Handbook of Entrepreneurial Finance, Oxford University Press, Chapter 13: 392-
423.
[19] DeGennaro, R. P.. 2010. Angel Investors: Who They Are and What They Do. Can I Be
One, Too?. Journal of Wealth Management, 13(2): 55-60.
[20] Denis, D. J.. 2004. Entrepreneurial Finance: An Overview of the Issues and Evidence.
Journal of Corporate Finance, 10: 301-326.
[21] Dushnitsky G.. 2010a. Entrepreneurial Optimism and Venture Capital Valuations. Druid
Working Paper Series.
[22] Dushnitsky G.. 2010b. Entrepreneurial Optimism in the Market for Technological Inven-
tions. Organization Science, 21(1):150-167.
[23] Engers M.. 1987. Signalling with Many Signals. Econometrica, 55: 425-440.
[24] Gans J.S., D.H. Hsu, and S. Stern. 2002. When Does Start-up Innovation Spur the Gale
of Creative Destruction?. RAND Journal of Economics, 33: 571-86.
32
[25] Goldfarb B., G. Hoberg, D. Kirsch, and A. Triantis. 2009. Does Angel Participation
Matter? An Analysis of Early Venture Financing. Working Paper.
[26] Gompers, P. A., J. Lerner, D. Scharfstein, and A. Kovner. 2010. Performance Persistence
in Entrepreneurship and Venture Capital. Journal of Financial Economics, 96(1): 18-32.
[27] Graham S. J. H., and T. M. Sichelman. 2008. Why do Start-ups Patent?. Berkeley Tech-
nology Law Journal, 23(3):1063-1097.
[28] Graham S. J. H., R. P. Merges, P. Samuelson, and T. M. Sichelman. 2009. High Technol-
ogy Entrepreneurs and the Patent System: Results of the 2008 Berkeley Patent Survey
(June 30, 2009). Berkeley Technology Law Journal, 24(4): 255-327.
[29] Grinblatt M., and C. Y. Hwang. 1989. Signalling and the pricing of new issues. Journal
of Finance, 44: 393-420.
[30] Haeussler C., D. Harhoff, and E. Mueller. 2009. To Be Financed or Not. . . - The Role of
Patents for Venture Capital Financing. CEPR Discussion Papers 7115.
[31] Hellmann T., and M. Puri. 2002. Venture Capital and the Professionalization of Start-up
Firms: Empirical Evidence. Journal of Finance, 57(1): 169-197.
[32] Higgins, M.J., P. Stephan, and J. Thursby. 2011. Conveying quality and value in emerging
industries: star scientists and the role of learning in biotechnology. Research Policy 40(4):
605-617.
[33] Hsu D.. 2004. What Do Entrepreneurs Pay for Venture Capital Affiliation?. Journal of
Finance, 52: 1805-1844.
[34] Hsu D., and R.H. Ziedonis. 2008. Patents as Quality Signals for Entrepreneurial Ventures.
Academy of Management Best Papers Proceedings.
[35] Hsu D., and R.H. Ziedonis. 2011. The Dual Roles of Intangible Resources as Sources of
Advantage: Evidence from Technology Startup Patents, mimeo.
33
[36] Kaplan S. N., and P. Stromberg. 2004. Characteristics, Contracts, and Actions: Evidence
from Venture Capitalist Analyses. Journal of Finance, 59: 2177-2210.
[37] Kerr W. R., J. Lerner, and A. Schoar. 2010. The Consequences of Entrepreneurial Fi-
nance: A Regression Discontinuity Analysis. Harvard Business School Working Paper,
10-086.
[38] Lowe R., and R.H. Ziedonis. 2006. Overoptimism and the Performance of Entrepreneurial
Firms. Managemenr Science, 52: 173:186.
[39] Leland H. E., and D. H. Pyle. 1976. Informational Asymmetries, Financial Structure,
and Financial Intermediation. Journal of Finance, 32: 371:387.
[40] McGrath R.G., and I. Macmillan. 2000. The Entrepreneurial Mindset. Harvard Business
School Press: Boston, MA.
[41] Milgrom P., and J. Roberts. 1986. Price and Advertising Signals of Product Quality.
Journal of Political Economy. 94(4): 796-821.
[42] Parker S. C.. 2009. The Economics of Entrepreneurship. Cambridge University Press.
[43] Quillen C. D., O. H. Webster, and R. Eichmann. 2002. Continuing Patent Applications
and Performance of the U.S. Patent and Trademark Office - Extended. The Federal
Circuit Bar Journal, 12(1): 35-55.
[44] Rothaermel F., and M. Thursby. 2005a. University–Incubator Firm Knowledge Flows:
Assessing Their Impact on Incubator Firm Performance. Research Policy, 34: 305-320.
[45] Rothaermel F., and M. Thursby. 2005b. Incubator Firm Failure or Graduation? The
Role of University Linkages. Research Policy, 34: 1076-1090 .
[46] Sahlman W.. 1990. The Structure and Governance of Venture Capital Organizations.
Journal of Financial Economics, 2: 473-521.
34
[47] Shane S. A.. 2000. Prior knowledge and the Discovery of Entrepreneurial Opportunities.
Organization Science, 11: 448-469.
[48] Shane S. A., and T. Stuart. 2002. Organizational Endowments and the Performance of
University Start-ups. Management Science, 48: 154 - 170.
[49] Shane S. A.. 2009. Fool’s Gold? The Truth Behind Angel Investing in America. Oxford
University Press. New York.
[50] Sorensen M.. 2007. How Smart is the Smart Money? A Two-sided Matching Model of
Venture Capital. Journal of Finance, 62: 2725-2762.
[51] Spence M.. 1973. Job Market Signaling. Quarterly Journal of Economics, 87: 355-374.
[52] Spence M.. 1974. Competitive and Optimal Responses to Signals: An Analysis of Effi-
ciency and Distribution. Journal of Economic Theory, 7: 296-332.
[53] Stuart T., E. H. Hoang, and R. Hybels. 1999. Interorganizational Endorsements and the
Performance of Entrepreneurial Ventures. Administrative Science Quarterly, 44: 315-349.
[54] Van Osnabrugge M, and R. J. Robinson. 2000. Angel Investing: Matching Start-Up
Funds with Start-Up Companies. Jossey-Bass. San Francisco.
[55] Wong A.. 2010. Angel Finance: The Other Venture Capital, in D. D. Cumming, ed.,
Venture Capital: Investment Strategies, Structures and Policies, Wiley Press, Chapter
5:71-110.
[56] Wooldridge, J. M.. 2002. Econometric Analysis of Cross Section and Panel Data. The
MIT Press, Cambridge MA.
35
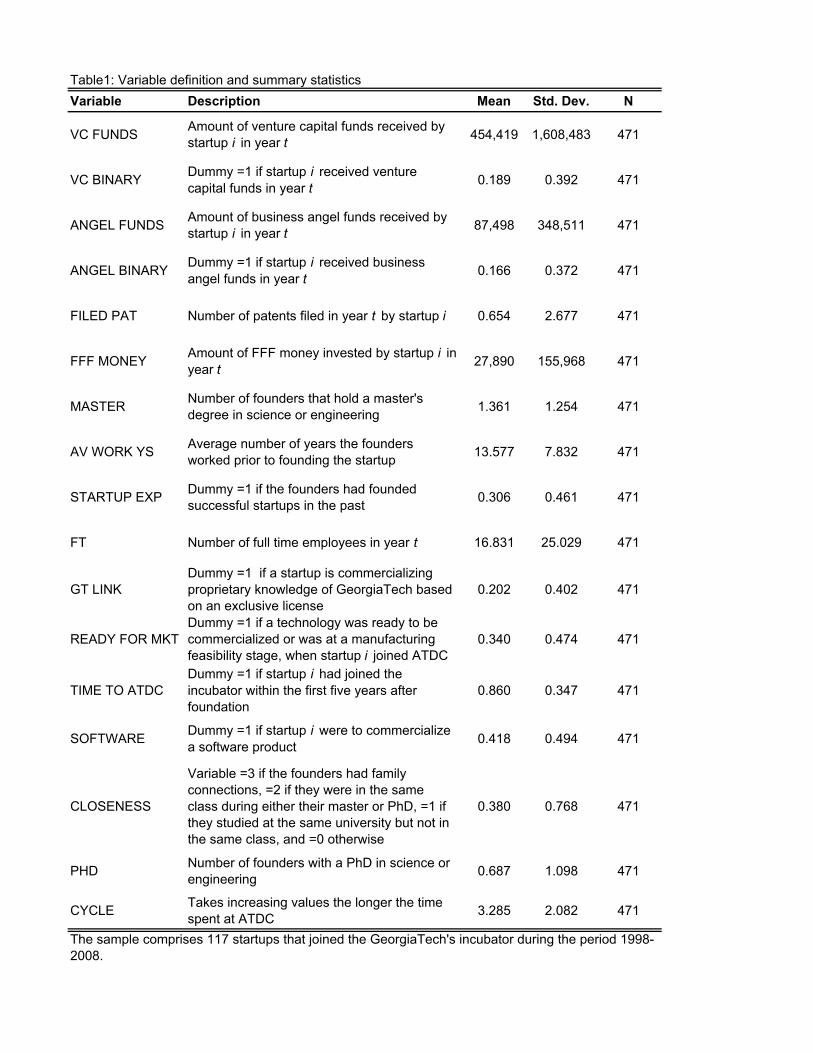
Table1: Variable definition and summary statistics
Variable Description Mean Std. Dev. N
VC FUNDS Amount of venture capital funds received by
startup i in year t454,419 1,608,483 471
VC BINARYDummy =1 if startup i received venture
capital funds in year t0.189 0.392 471
ANGEL FUNDSAmount of business angel funds received by
startup i in year t87,498 348,511 471
ANGEL BINARYDummy =1 if startup i received business
angel funds in year t0.166 0.372 471
FILED PAT Number of patents filed in year t by startup i 0.654 2.677 471
FFF MONEYAmount of FFF money invested by startup i in
year t 27,890 155,968 471
MASTERNumber of founders that hold a master's
degree in science or engineering1.361 1.254 471
AV WORK YSAverage number of years the founders
worked prior to founding the startup13.577 7.832 471
STARTUP EXPDummy =1 if the founders had founded
successful startups in the past0.306 0.461 471
FT Number of full time employees in year t 16.831 25.029 471
GT LINK
Dummy =1 if a startup is commercializing
proprietary knowledge of GeorgiaTech based
on an exclusive license
0.202 0.402 471
READY FOR MKT
Dummy =1 if a technology was ready to be
commercialized or was at a manufacturing
feasibility stage, when startup i joined ATDC
0.340 0.474 471
TIME TO ATDC
Dummy =1 if startup i had joined the
incubator within the first five years after
foundation
0.860 0.347 471
SOFTWAREDummy =1 if startup i were to commercialize
a software product0.418 0.494 471
CLOSENESS
Variable =3 if the founders had family
connections, =2 if they were in the same
class during either their master or PhD, =1 if
they studied at the same university but not in
the same class, and =0 otherwise
0.380 0.768 471
PHDNumber of founders with a PhD in science or
engineering0.687 1.098 471
CYCLETakes increasing values the longer the time
spent at ATDC3.285 2.082 471
The sample comprises 117 startups that joined the GeorgiaTech's incubator during the period 1998-
2008.
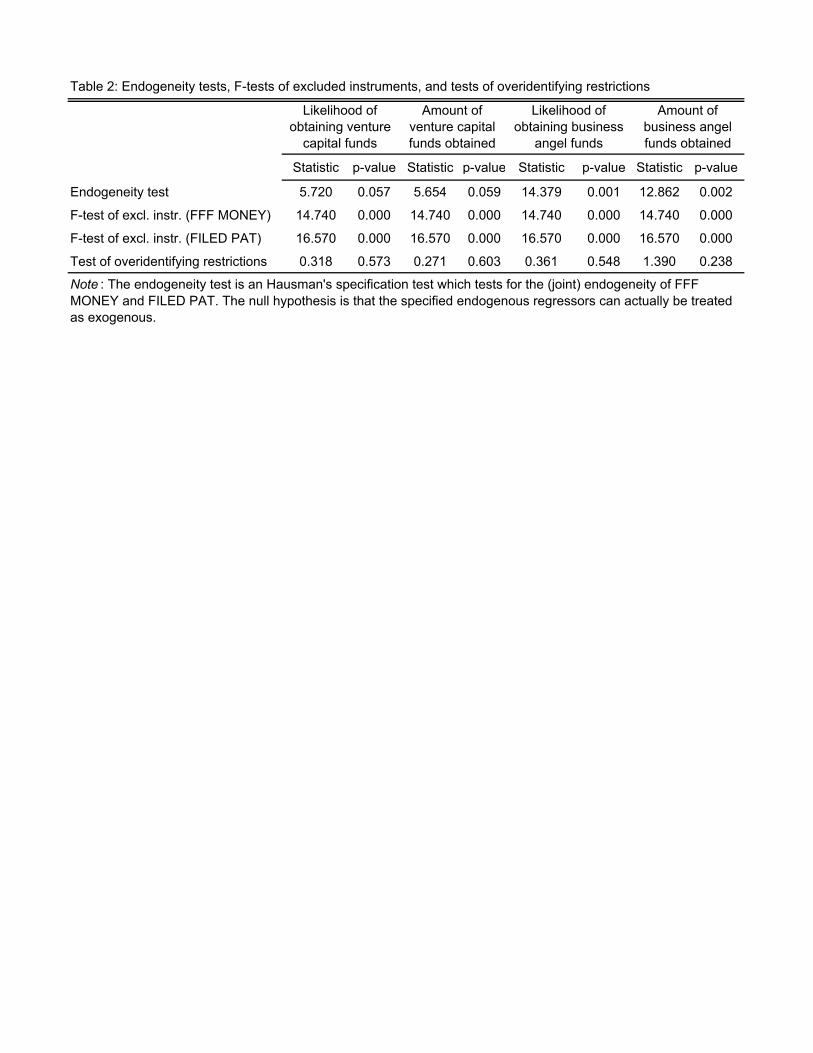
Table 2: Endogeneity tests, F-tests of excluded instruments, and tests of overidentifying restrictions
Statistic p-value Statistic p-value Statistic p-value Statistic p-value
Endogeneity test 5.720 0.057 5.654 0.059 14.379 0.001 12.862 0.002
F-test of excl. instr. (FFF MONEY) 14.740 0.000 14.740 0.000 14.740 0.000 14.740 0.000
F-test of excl. instr. (FILED PAT) 16.570 0.000 16.570 0.000 16.570 0.000 16.570 0.000
Test of overidentifying restrictions 0.318 0.573 0.271 0.603 0.361 0.548 1.390 0.238
Likelihood of
obtaining venture
capital funds
Likelihood of
obtaining business
angel funds
Amount of
venture capital
funds obtained
Amount of
business angel
funds obtained
Note : The endogeneity test is an Hausman's specification test which tests for the (joint) endogeneity of FFF
MONEY and FILED PAT. The null hypothesis is that the specified endogenous regressors can actually be treated
as exogenous.
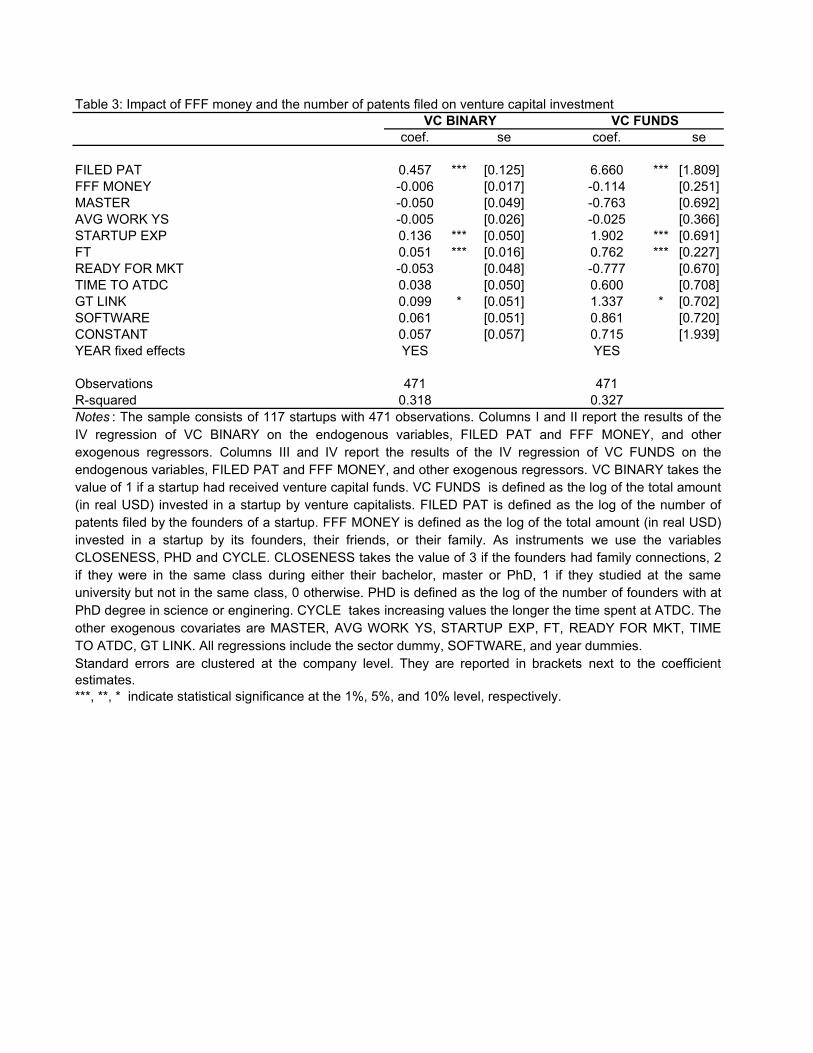
Table 3: Impact of FFF money and the number of patents filed on venture capital investment
coef. se coef. se
FILED PAT 0.457 *** [0.125] 6.660 *** [1.809]
FFF MONEY -0.006 [0.017] -0.114 [0.251]
MASTER -0.050 [0.049] -0.763 [0.692]
AVG WORK YS -0.005 [0.026] -0.025 [0.366]
STARTUP EXP 0.136 *** [0.050] 1.902 *** [0.691]
FT 0.051 *** [0.016] 0.762 *** [0.227]
READY FOR MKT -0.053 [0.048] -0.777 [0.670]
TIME TO ATDC 0.038 [0.050] 0.600 [0.708]
GT LINK 0.099 * [0.051] 1.337 * [0.702]
SOFTWARE 0.061 [0.051] 0.861 [0.720]
CONSTANT 0.057 [0.057] 0.715 [1.939]
YEAR fixed effects YES YES
Observations 471 471
R-squared 0.318 0.327
VC BINARY VC FUNDS
Notes : The sample consists of 117 startups with 471 observations. Columns I and II report the results of the
IV regression of VC BINARY on the endogenous variables, FILED PAT and FFF MONEY, and other
exogenous regressors. Columns III and IV report the results of the IV regression of VC FUNDS on the
endogenous variables, FILED PAT and FFF MONEY, and other exogenous regressors. VC BINARY takes the
value of 1 if a startup had received venture capital funds. VC FUNDS is defined as the log of the total amount
(in real USD) invested in a startup by venture capitalists. FILED PAT is defined as the log of the number of
patents filed by the founders of a startup. FFF MONEY is defined as the log of the total amount (in real USD)
invested in a startup by its founders, their friends, or their family. As instruments we use the variables
CLOSENESS, PHD and CYCLE. CLOSENESS takes the value of 3 if the founders had family connections, 2
if they were in the same class during either their bachelor, master or PhD, 1 if they studied at the same
university but not in the same class, 0 otherwise. PHD is defined as the log of the number of founders with at
PhD degree in science or enginering. CYCLE takes increasing values the longer the time spent at ATDC. The
other exogenous covariates are MASTER, AVG WORK YS, STARTUP EXP, FT, READY FOR MKT, TIME
TO ATDC, GT LINK. All regressions include the sector dummy, SOFTWARE, and year dummies.
Standard errors are clustered at the company level. They are reported in brackets next to the coefficient
estimates.
***, **, * indicate statistical significance at the 1%, 5%, and 10% level, respectively.
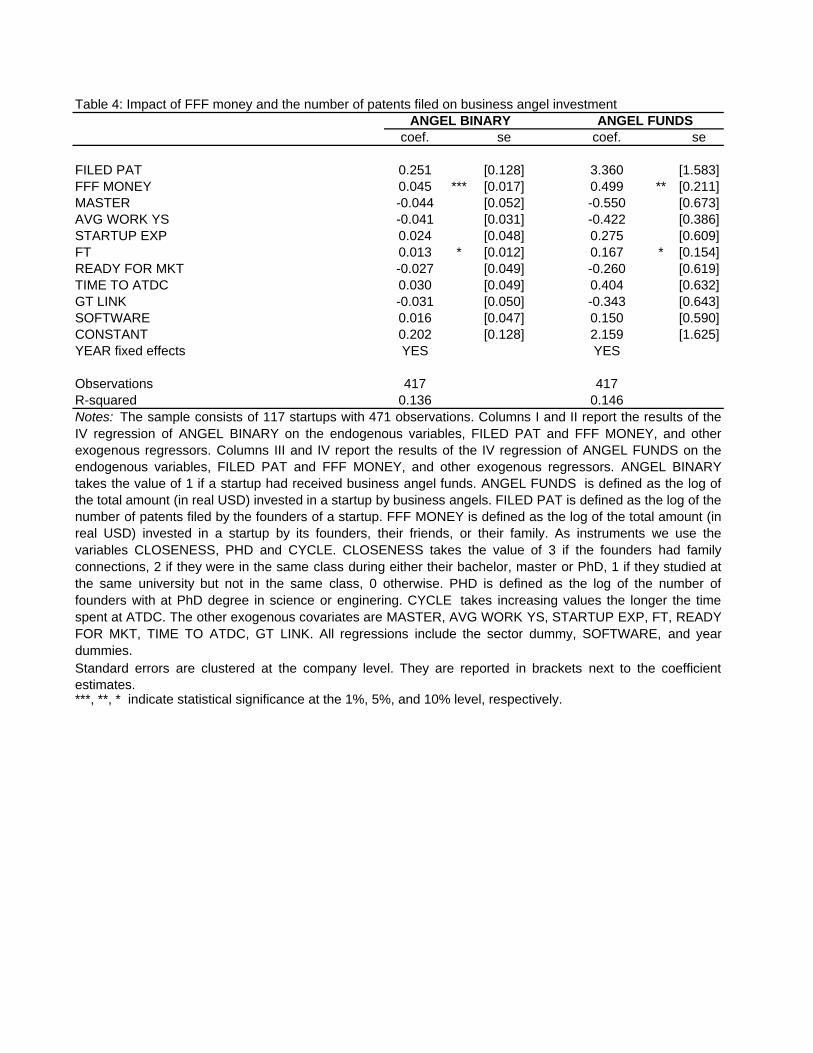
Table 4: Impact of FFF money and the number of patents filed on business angel investment
coef. se coef. se
FILED PAT 0.251 [0.128] 3.360 [1.583]FFF MONEY 0.045 *** [0.017] 0.499 ** [0.211]MASTER -0.044 [0.052] -0.550 [0.673]AVG WORK YS -0.041 [0.031] -0.422 [0.386]STARTUP EXP 0.024 [0.048] 0.275 [0.609]FT 0.013 * [0.012] 0.167 * [0.154]READY FOR MKT -0.027 [0.049] -0.260 [0.619]TIME TO ATDC 0.030 [0.049] 0.404 [0.632]GT LINK -0.031 [0.050] -0.343 [0.643]SOFTWARE 0.016 [0.047] 0.150 [0.590]CONSTANT 0.202 [0.128] 2.159 [1.625]YEAR fixed effects YES YES
Observations 417 417R-squared 0.136 0.146
Standard errors are clustered at the company level. They are reported in brackets next to the coefficientestimates.***, **, * indicate statistical significance at the 1%, 5%, and 10% level, respectively.
Notes: The sample consists of 117 startups with 471 observations. Columns I and II report the results of theIV regression of ANGEL BINARY on the endogenous variables, FILED PAT and FFF MONEY, and otherexogenous regressors. Columns III and IV report the results of the IV regression of ANGEL FUNDS on theendogenous variables, FILED PAT and FFF MONEY, and other exogenous regressors. ANGEL BINARYtakes the value of 1 if a startup had received business angel funds. ANGEL FUNDS is defined as the log ofthe total amount (in real USD) invested in a startup by business angels. FILED PAT is defined as the log of thenumber of patents filed by the founders of a startup. FFF MONEY is defined as the log of the total amount (inreal USD) invested in a startup by its founders, their friends, or their family. As instruments we use thevariables CLOSENESS, PHD and CYCLE. CLOSENESS takes the value of 3 if the founders had familyconnections, 2 if they were in the same class during either their bachelor, master or PhD, 1 if they studied atthe same university but not in the same class, 0 otherwise. PHD is defined as the log of the number offounders with at PhD degree in science or enginering. CYCLE takes increasing values the longer the timespent at ATDC. The other exogenous covariates are MASTER, AVG WORK YS, STARTUP EXP, FT, READYFOR MKT, TIME TO ATDC, GT LINK. All regressions include the sector dummy, SOFTWARE, and yeardummies.
ANGEL FUNDSANGEL BINARY
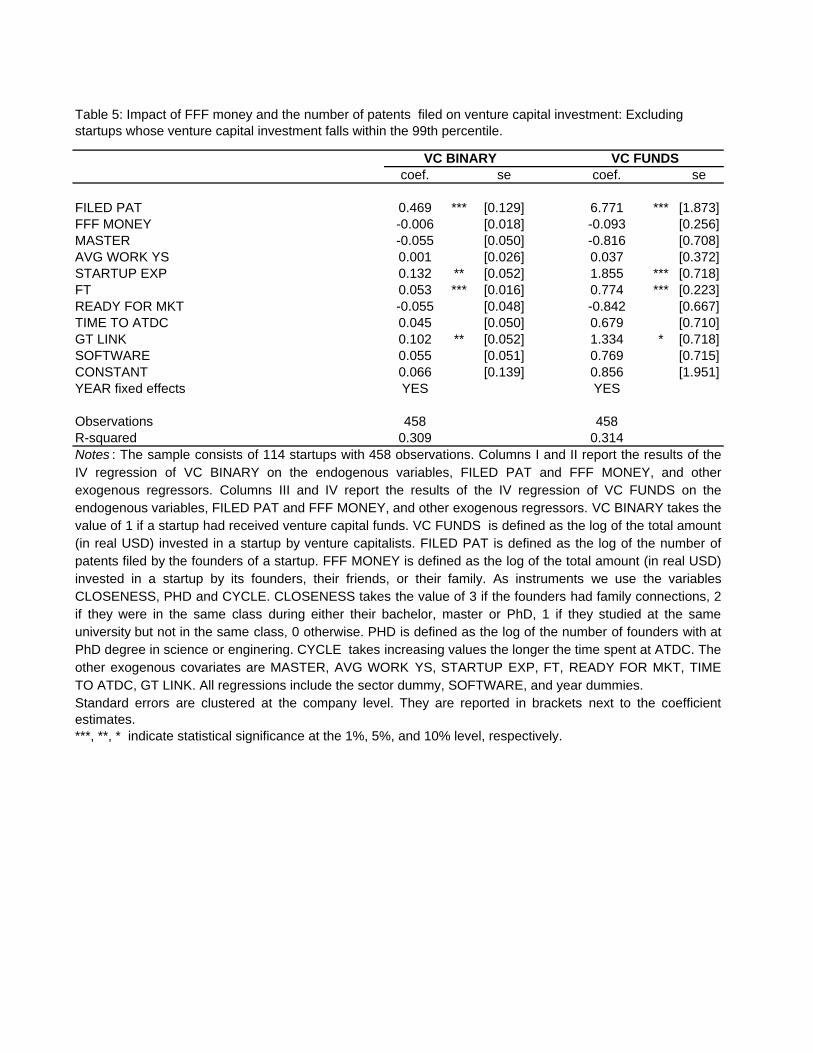
coef. se coef. se
FILED PAT 0.469 *** [0.129] 6.771 *** [1.873]FFF MONEY -0.006 [0.018] -0.093 [0.256]MASTER -0.055 [0.050] -0.816 [0.708]AVG WORK YS 0.001 [0.026] 0.037 [0.372]STARTUP EXP 0.132 ** [0.052] 1.855 *** [0.718]FT 0.053 *** [0.016] 0.774 *** [0.223]READY FOR MKT -0.055 [0.048] -0.842 [0.667]TIME TO ATDC 0.045 [0.050] 0.679 [0.710]GT LINK 0.102 ** [0.052] 1.334 * [0.718]SOFTWARE 0.055 [0.051] 0.769 [0.715]CONSTANT 0.066 [0.139] 0.856 [1.951]YEAR fixed effects YES YES
Observations 458 458R-squared 0.309 0.314
***, **, * indicate statistical significance at the 1%, 5%, and 10% level, respectively.
Table 5: Impact of FFF money and the number of patents filed on venture capital investment: Excluding startups whose venture capital investment falls within the 99th percentile.
VC BINARY VC FUNDS
Notes : The sample consists of 114 startups with 458 observations. Columns I and II report the results of theIV regression of VC BINARY on the endogenous variables, FILED PAT and FFF MONEY, and otherexogenous regressors. Columns III and IV report the results of the IV regression of VC FUNDS on theendogenous variables, FILED PAT and FFF MONEY, and other exogenous regressors. VC BINARY takes thevalue of 1 if a startup had received venture capital funds. VC FUNDS is defined as the log of the total amount(in real USD) invested in a startup by venture capitalists. FILED PAT is defined as the log of the number ofpatents filed by the founders of a startup. FFF MONEY is defined as the log of the total amount (in real USD)invested in a startup by its founders, their friends, or their family. As instruments we use the variablesCLOSENESS, PHD and CYCLE. CLOSENESS takes the value of 3 if the founders had family connections, 2if they were in the same class during either their bachelor, master or PhD, 1 if they studied at the sameuniversity but not in the same class, 0 otherwise. PHD is defined as the log of the number of founders with atPhD degree in science or enginering. CYCLE takes increasing values the longer the time spent at ATDC. Theother exogenous covariates are MASTER, AVG WORK YS, STARTUP EXP, FT, READY FOR MKT, TIMETO ATDC, GT LINK. All regressions include the sector dummy, SOFTWARE, and year dummies. Standard errors are clustered at the company level. They are reported in brackets next to the coefficientestimates.
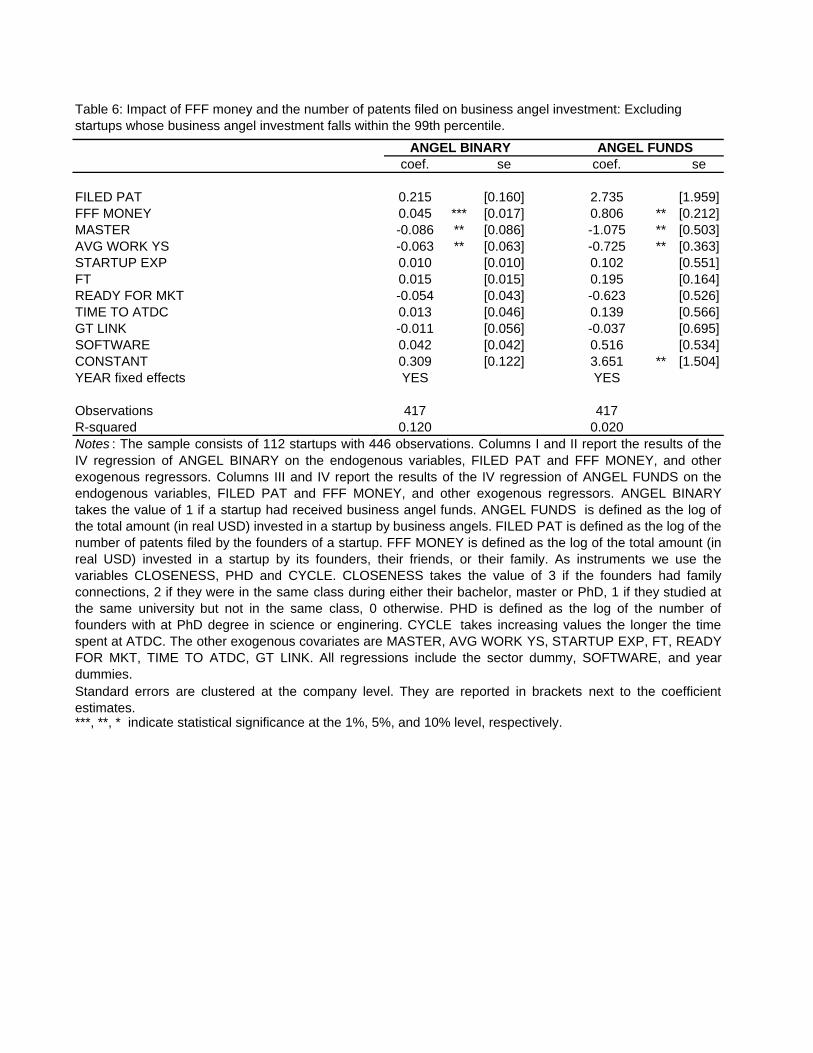
coef. se coef. se
FILED PAT 0.215 [0.160] 2.735 [1.959]FFF MONEY 0.045 *** [0.017] 0.806 ** [0.212]MASTER -0.086 ** [0.086] -1.075 ** [0.503]AVG WORK YS -0.063 ** [0.063] -0.725 ** [0.363]STARTUP EXP 0.010 [0.010] 0.102 [0.551]FT 0.015 [0.015] 0.195 [0.164]READY FOR MKT -0.054 [0.043] -0.623 [0.526]TIME TO ATDC 0.013 [0.046] 0.139 [0.566]GT LINK -0.011 [0.056] -0.037 [0.695]SOFTWARE 0.042 [0.042] 0.516 [0.534]CONSTANT 0.309 [0.122] 3.651 ** [1.504]YEAR fixed effects YES YES
Observations 417 417R-squared 0.120 0.020
***, **, * indicate statistical significance at the 1%, 5%, and 10% level, respectively.
Table 6: Impact of FFF money and the number of patents filed on business angel investment: Excluding startups whose business angel investment falls within the 99th percentile.
ANGEL BINARY ANGEL FUNDS
Notes : The sample consists of 112 startups with 446 observations. Columns I and II report the results of theIV regression of ANGEL BINARY on the endogenous variables, FILED PAT and FFF MONEY, and otherexogenous regressors. Columns III and IV report the results of the IV regression of ANGEL FUNDS on theendogenous variables, FILED PAT and FFF MONEY, and other exogenous regressors. ANGEL BINARYtakes the value of 1 if a startup had received business angel funds. ANGEL FUNDS is defined as the log ofthe total amount (in real USD) invested in a startup by business angels. FILED PAT is defined as the log of thenumber of patents filed by the founders of a startup. FFF MONEY is defined as the log of the total amount (inreal USD) invested in a startup by its founders, their friends, or their family. As instruments we use thevariables CLOSENESS, PHD and CYCLE. CLOSENESS takes the value of 3 if the founders had familyconnections, 2 if they were in the same class during either their bachelor, master or PhD, 1 if they studied atthe same university but not in the same class, 0 otherwise. PHD is defined as the log of the number offounders with at PhD degree in science or enginering. CYCLE takes increasing values the longer the timespent at ATDC. The other exogenous covariates are MASTER, AVG WORK YS, STARTUP EXP, FT, READYFOR MKT, TIME TO ATDC, GT LINK. All regressions include the sector dummy, SOFTWARE, and yeardummies. Standard errors are clustered at the company level. They are reported in brackets next to the coefficientestimates.

Appendix A: Proof of Propositions 1
We begin by proving Proposition 1 (i).
The utility maximization problem of H-type founders is defined in page 9 of the main
text. Given the preferences of the investors, a candidate for a separating equilibrium is
one in which p∗H is derived from condition ii) of the maximization problem being binding
and M∗H is derived from the first order condition for MH . Thus in this case p∗H/M
∗H = k.
This amounts to reducing the problem to a utility maximization in one variable, MH , while
allowing pH to be derived from condition ii). As mentioned in the paper, we will only
consider interior solutions for pH and MH . We need to show that a) the solution to M is a
maximum; b) H-type participation constraint is satisfied; c) H-type IC constraint is satisfied;
d) p∗H and M∗H are greater than the corresponding amounts under symmetric information
and ∆p ≥ ∆M ; and e) the solution to this maximization problem delivers a separating
equilibrium that rules out all pooling equilibria and all other separating Nash equilibria that
are equilibrium-dominated, given the beliefs of the investors.
a) The proposed solution for M is indeed a maximum because∂2V (M∗
H ,p∗H ;θH)
∂M2H
< 0.
b) H-type participation constraint is met. In fact:
V (M∗H , p
∗H ; θH)− bHp∗H − ρM∗
H >
αV (M∗H , p
∗H ; θH) + (1− α)V (M∗
H , p∗H ; θL)− kbHp∗H − (ρ+ gL)M∗
H = U∗L > 0
c) H-type IC constraint is met.
In fact, from 2 we have
αV (M∗L, p
∗L; θL) + (1−α)V (M∗
L, p∗L; θL)− kbHp∗L− (ρ+ gL)M∗
L = αV (M∗H , p
∗H ; θH) + (1−
α)V (M∗H , p
∗H ; θL)− kbHp∗H − (ρ+ gL)M∗
H
Rewriting we obtain:
αV (M∗L, p
∗L; θL) = −(1−α)V (M∗
L, p∗L; θL)+kbHp
∗L+(ρ+gL)M∗
L+αV (M∗H , p
∗H ; θH)+(1−
α)V (M∗H , p
∗H ; θL)− kbHp∗H − (ρ+ gL)M∗
H
Inserting this expression into condition 3 and rearranging, we obtain:
αV (M∗H , p
∗H ; θH) + (1− α)V (M∗
H , p∗H ; θH)− bHp∗H − ρM∗
H ≥
1

≥ −(1−α)V (M∗L, p
∗L; θL)+kbHp
∗L+(ρ+gL)M∗
L+αV (M∗H , p
∗H ; θH)+(1−α)V (M∗
H , p∗H ; θL)−
kbHp∗H − (ρ+ gL)M∗
H + (1− α)V (M∗L, p
∗L; θH)− bHp∗L − ρM∗
L
The expression above can be rewritten as:
(1− α)[V (M∗H , p
∗H ; θH)− V (M∗
H , p∗H ; θL)] + [bH(kp∗H − p∗H) + gLM
∗H ] ≥
≥ (1− α)[V (M∗L, p
∗L; θH)− V (M∗
L, p∗L; θL)] + [bH(kp∗L − p∗L) + gL)M∗
L]
This condition holds as a strict inequality. In fact:
[bH(kp∗H − p∗H) + gLM∗H ] > [bH(kp∗L − p∗L) + gLM
∗L]
And:
[V (M∗H , p
∗H ; θH)− V (M∗
H , p∗H ; θL)]− [V (M∗
L, p∗L; θH)− V (M∗
L, p∗L; θL)] = 0
d) The amounts M∗H and p∗H are greater than those under symmetric information
p+H ,M+H . Under symmetric information, the “envy” condition in the model ensures that
L-type founders find it profitable to cheat and invest the same amounts of M and p as
H-types would invest. Therefore, H-types need to invest a greater amount of at least one
of the two signals, M and p, relative to a situation of symmetric information in order to
differentiate from L-type founders. We will show that both signals are provided in greater
quantities but that ∆p ≥ ∆M .
Deriving the IC constraint for the L-type founders with respect to p, we obtain:
α∂V (M, p; θH)
∂p+ (1− α)
V (M, p; θL)
∂p− kbH = 0 (1)
Under symmetric information, the first order condition implies that α∂V (M,p;θH)∂p
+ (1 −
α)V (M,p;θL)∂p
= bH . Using result (1) into the first order condition, we obtain:
kbH − bH 6= 0
Thus, at the amount of p that meets (1) the first order condition under symmetric
information is greater than zero, for M = M+H , (1). Because kbH − bH > 0 , this implies that
p∗H > p+H .
As for M , the first order condition derived from the H-type maximization problem yields:
∂V (M,p;θH)∂M
− ρ = 0
2
Deriving this expression with respect to p, at {M∗H , p∗
H}, we obtain:
∂2V (M∗H ,p
∗H ;θH)
∂M2dMdp
+∂2V (M∗
H ,p∗H ;θH)
∂M∂p= 0
Solving for dpdM
, we obtain:
dMdp
= −∂2V (M∗
H,p∗H ;θH )
∂M∂p
∂2V (M∗H,p∗H
;θH )
∂M2
> 0
This implies that relative to the optimal quantities under symmetric information, an in-
crease in p∗H leads to an increase ofM∗H . Thus, M∗
H > M+H .However, because min{|Vpp(p,M ; θ), VMM(p,M ; θ)|} >
VMp(p,M ; θ), then∣∣∣∂2V (M∗
H ,p∗H ;θH)
∂p2
∣∣∣ > ∂2V (M∗H ,p
∗H ;θH)
∂M∂p. This implies that a unit increase in p
causes M to increase by less than a unit.
e) The solution to this maximization problem delivers a separating equilibrium that
rules out all pooling equilibria and all other separating Nash equilibria that are equilibrium-
dominated, given the beliefs of the investors. We apply the intuitive criterion proposed by
Cho and Kreps (1987). An equilibrium is said to violate the intuitive criterion if there are
some founders of type i ∈ {H,L} who have a deviation that yields a greater payoff than
the equilibrium payoff, provided that the investors do not assign a positive probability to
the deviation having being made by the other type of founders, for whom this action is
equilibrium dominated. Under this criterion, if H-type founders were to invest any amount
of p and M greater than the equilibrium amounts, they would still successfully differentiate
themselves from L-type founders but they would not earn a greater payoff. Because, M and
p are costly to provide, any amount of p and M greater than the equilibrium amounts would
yield a lower utility to H-type founders. Moreover, any amounts of p and M smaller than
the equilibrium amounts would yield a lower payoff to H-type founders because it would
lead the investors to believe that the founders are of type L. Finally, given the preferences
of the investors and the lower bound on α, any equilibrium amount of M and p respectively
obtained from the IC constraint of L-types and the first order condition for p, would yield
a lower payoff to H-type founders because it would lead the investors to believe that the
founders are of type L. As for L-type founders, any positive amounts of p and M lower than
the equilibrium amounts M∗H and p∗H would not change an investor’s belief that the founders
3

are of type L. Because the signals are costly, L-type founders’ best strategy is to provide the
same amounts as under symmetric information: M∗L and p∗L. Moreover it is not profitable
for L-type founders to provide amounts of p and M greater than the equilibrium amounts.
Finally, this criterion also eliminates all possible pooling equilibria. Any pooling equilibrium
with p and M smaller than the equilibrium amounts would be subject to deviations by H-
type founders. Similarly, any pooling equilibrium with p and M greater than the equilibrium
amounts would be subject to deviations by L-type founders. Finally, any equilibrium amount
of p and M respectively obtained from the IC constraint of L-types and the first order
condition for M , would be subject to deviations by L- and H-type founders.
Proof of Proposition 1 (ii) The proof that, when the preferences of the external
investors are such that they believe the startup is an H-type if p/M < k, p∗H/M∗H = z,
where M∗H is derived from condition 2 being binding and p∗H is derived from the first order
condition for pH , is the same as the proof of Proposition 1 (i). However, we still need to prove
that z < k. Mimicking the proof of Proposition 1 (i), point d), we find that the increase
in p relative to a situation of symmetric information, when external investors value relative
more the founders’ commitment, is less than the increase, when the external investors value
relative more the value of the founders’ technology. Similarly we find that the increase in
M relative to a situation of symmetric information, when external investors value relative
more the founders’ commitment, is greater than the increase, when the external investors
value relative more the value of the founders’ technology. Because, in symmetric information
the optimal investments in p and in M do not depend on the preferences of the external
investors, thus we conclude that z < k.
Proof of Proposition 1 (iii) Same as Proof of Proposition 1 (i).
Appendix B: Correlation Table
〈 Insert Table B1 about here 〉
4
Appendix C: First-Stage Regressions
Table C1 presents the regression results for the impact of the instruments on the number of
patents filed and FFF money, adjusting for the exogenous covariates. We use, as instruments,
the variables CLOSENESS, PHD and CYCLE. The first two columns report the regression
results for the number of patents filed. The last two columns report the regression results
for FFF money.
〈 Insert Table C1 about here 〉
5

Table B1: Correlation table
Variables 1 2 3 4 5 6 7 8 9 10 11 12 13 14 15 16 17(1) VC FUNDS 1.000(2) VC BINARY 0.586 1.000(3) ANGEL FUNDS 0.049 0.039 1.000(4) ANGEL BINARY 0.031 0.062 0.564 1.000(5) FILED PAT 0.424 0.251 0.081 0.085 1.000(6) FFF MONEY -0.015 -0.007 0.047 0.061 0.070 1.000(7) MASTER 0.100 0.142 0.137 0.059 0.130 -0.048 1.000(8) AV WORK YS 0.068 -0.011 0.021 -0.043 0.046 0.076 -0.128 1.000(9) STARTUP EXP 0.125 0.245 0.038 0.039 0.010 -0.052 0.085 0.161 1.000(10) FT 0.118 0.052 -0.036 -0.103 0.058 -0.067 -0.050 0.128 0.244 1.000(11) GT LINK 0.080 0.163 0.077 -0.010 0.031 -0.023 0.282 -0.173 -0.069 -0.083 1.000(12) READY FOR MKT -0.095 -0.117 -0.029 0.006 -0.075 -0.002 -0.021 -0.048 -0.048 0.047 -0.148 1.000(13) TIME TO ATDC 0.093 0.132 0.067 0.130 -0.009 0.067 0.107 -0.179 0.029 -0.196 0.172 -0.059 1.000(14) SOFTWARE -0.064 -0.035 -0.084 0.028 -0.106 -0.014 -0.155 -0.083 0.101 -0.033 -0.255 0.201 0.218 1.000(15) CYCLE -0.079 -0.019 -0.059 -0.033 -0.145 -0.144 -0.067 -0.028 -0.093 0.167 0.023 0.031 -0.154 -0.085 1.000(16) PHD 0.162 0.154 0.138 0.059 0.202 -0.010 0.682 -0.034 0.049 0.004 0.325 -0.061 -0.002 -0.139 -0.051 1.000(17) CLOSENESS -0.019 -0.020 0.016 0.019 0.107 0.108 0.233 -0.302 -0.185 0.017 0.020 0.112 -0.111 -0.100 -0.003 0.151 1.000
1
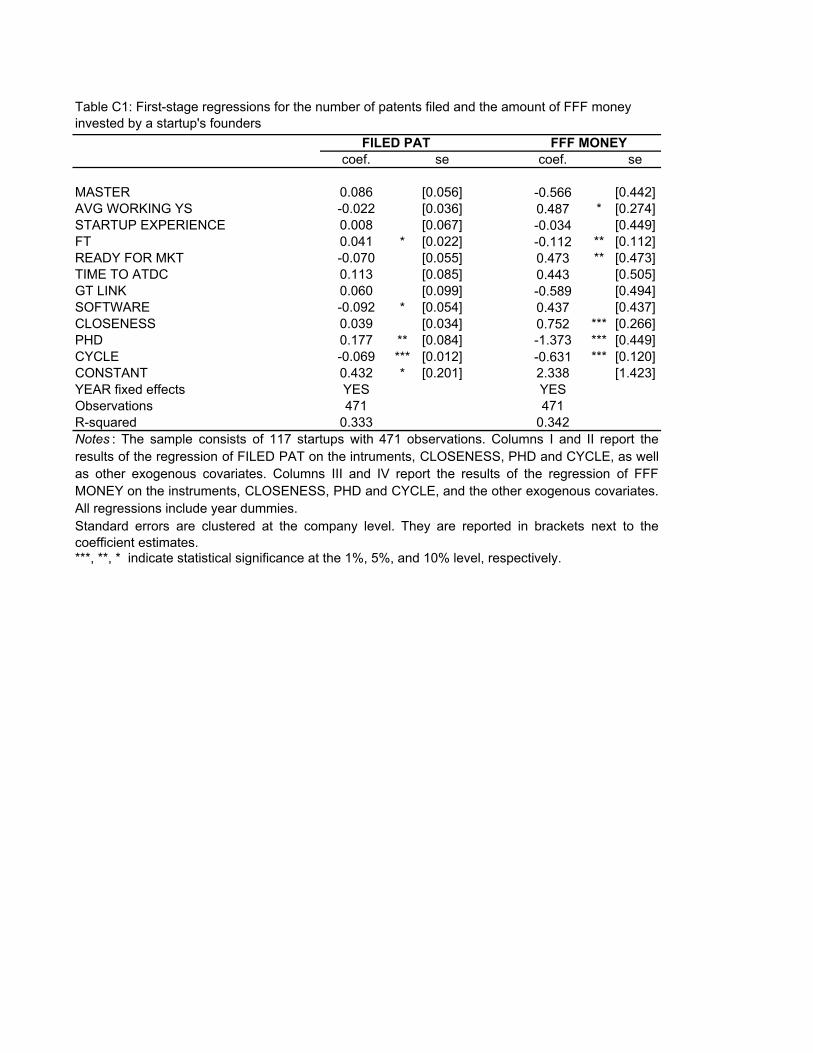
coef. se coef. se
MASTER 0.086 [0.056] -0.566 [0.442]
AVG WORKING YS -0.022 [0.036] 0.487 * [0.274]
STARTUP EXPERIENCE 0.008 [0.067] -0.034 [0.449]
FT 0.041 * [0.022] -0.112 ** [0.112]
READY FOR MKT -0.070 [0.055] 0.473 ** [0.473]
TIME TO ATDC 0.113 [0.085] 0.443 [0.505]
GT LINK 0.060 [0.099] -0.589 [0.494]
SOFTWARE -0.092 * [0.054] 0.437 [0.437]
CLOSENESS 0.039 [0.034] 0.752 *** [0.266]
PHD 0.177 ** [0.084] -1.373 *** [0.449]
CYCLE -0.069 *** [0.012] -0.631 *** [0.120]
CONSTANT 0.432 * [0.201] 2.338 [1.423]
YEAR fixed effects YES YES
Observations 471 471
R-squared 0.333 0.342
Table C1: First-stage regressions for the number of patents filed and the amount of FFF money
invested by a startup's founders
FFF MONEYFILED PAT
Notes : The sample consists of 117 startups with 471 observations. Columns I and II report the
results of the regression of FILED PAT on the intruments, CLOSENESS, PHD and CYCLE, as well
as other exogenous covariates. Columns III and IV report the results of the regression of FFF
MONEY on the instruments, CLOSENESS, PHD and CYCLE, and the other exogenous covariates.
All regressions include year dummies.
Standard errors are clustered at the company level. They are reported in brackets next to the
coefficient estimates.***, **, * indicate statistical significance at the 1%, 5%, and 10% level, respectively.
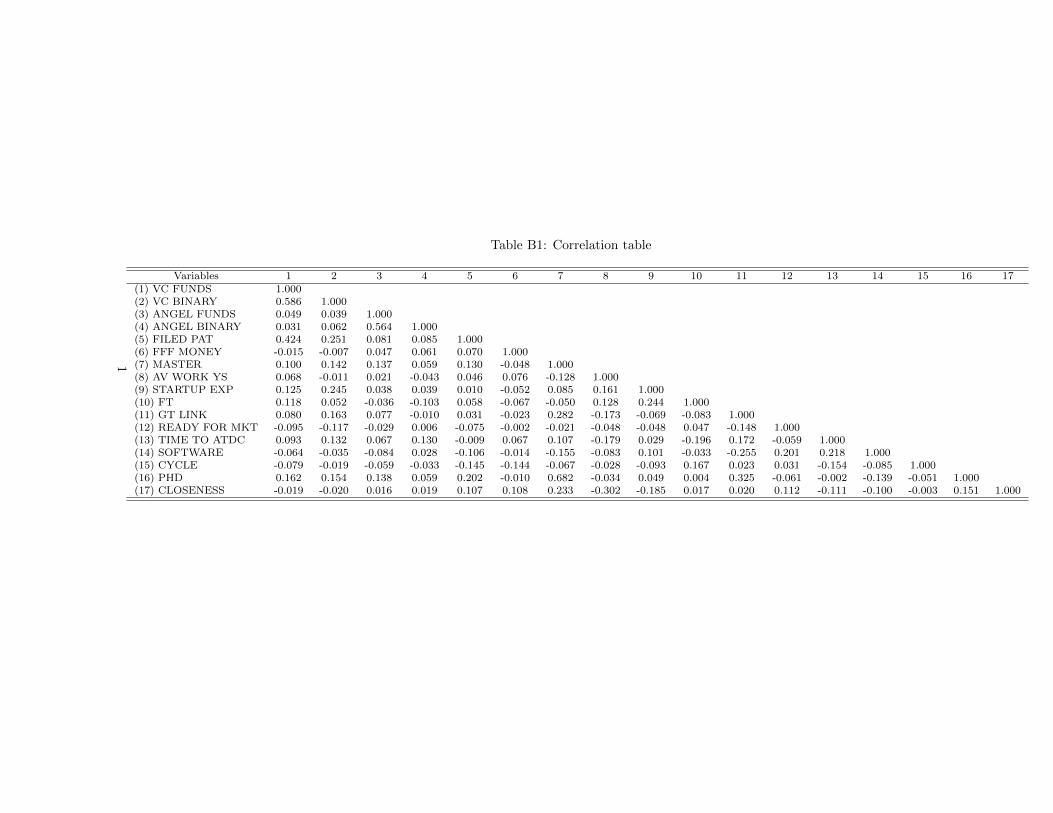