Embed Size (px)
Citation preview

PatternsA Function Based Approach to
Algebra

Coloured Blocks Diagram
Is there a pattern to these colours?
Can you use the pattern to predict what
colour will be at a particular point?
How can we investigate if there is a pattern?

Table
Block
PositionColour
1
2
3
4
5
6
Black
Block Position
1 2
2 4
3 6
4 8
5 10
Black block is always even.

Black
Block Position
1 2
2 4
3 6
4 8
5 10
n 2n
You double the number of the black block
Red
Block Position
1 1
2 3
3 5
4 7
5 9
n 2n – 1
Words:

identify patterns and describe
different situations using tables,
graphs, words and formulae
predict
generalise in words and symbols
justify
relationship
Key Outcomes and Words:

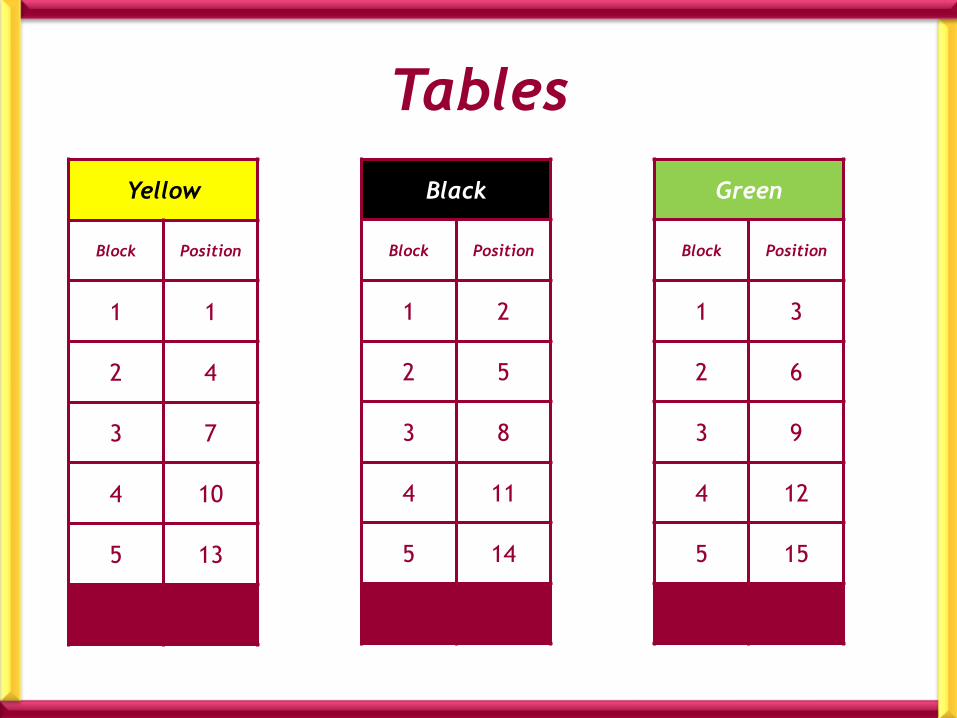
Coloured Blocks Diagram
Is there a pattern to these colours?
Can you use the pattern to predict the next colour?
Ways to investigate the pattern: table
story
general expression
justify
Tables
Green
Block Position
1 3
2 6
3 9
4 12
5 15
n 3n
Black
Block Position
1 2
2 5
3 8
4 11
5 14
n 3n – 1
Yellow
Block Position
1 1
2 4
3 7
4 10
5 13
n 3n – 2
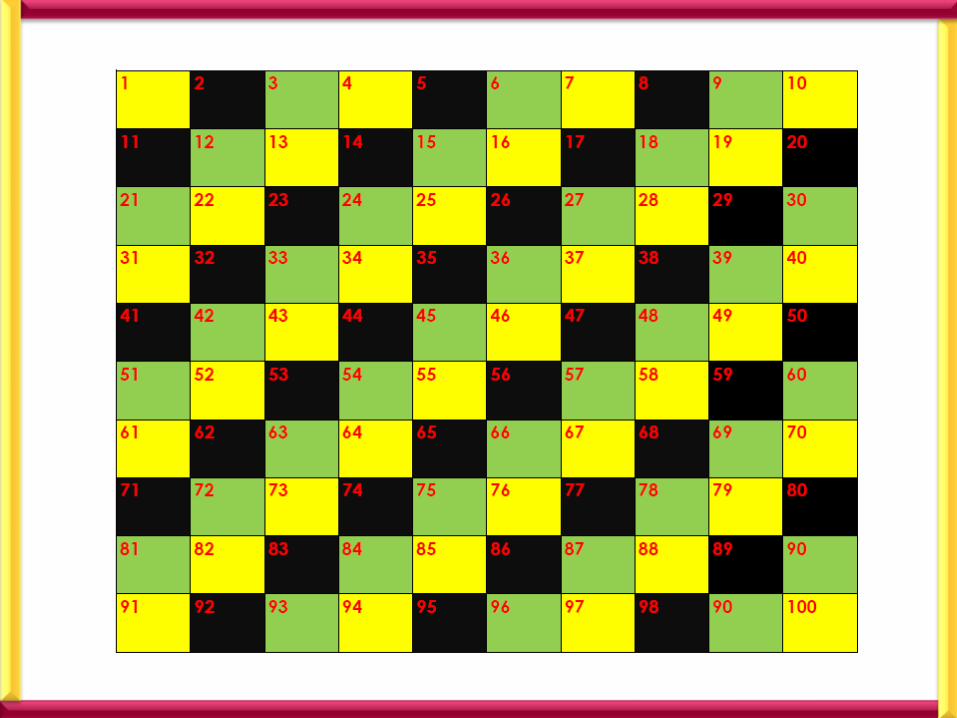

Money Box Problem
Mary Money Box
Start €0
Growth per day €2
We want to investigate the total amount
of money in the money box over time.
Is the growth of the money a pattern?
Can we predict how much money will be in
the box on day 10?
Is there a pattern to the growth of this money?
Can we use this pattern to predict how much money
will be in the box at some future time?
How can we investigate if a pattern exists?
Money Box Problem
John Money Box
Start €3
Growth per day €2

Table for John’s Money Box
Is there a pattern?
Where is the start value in € and growth per day
in this as seen in the table?
What do you notice about successive outputs ?
Time/days Money in Box/€
0 3
1 5
2 7
3 9
4 11
5 13
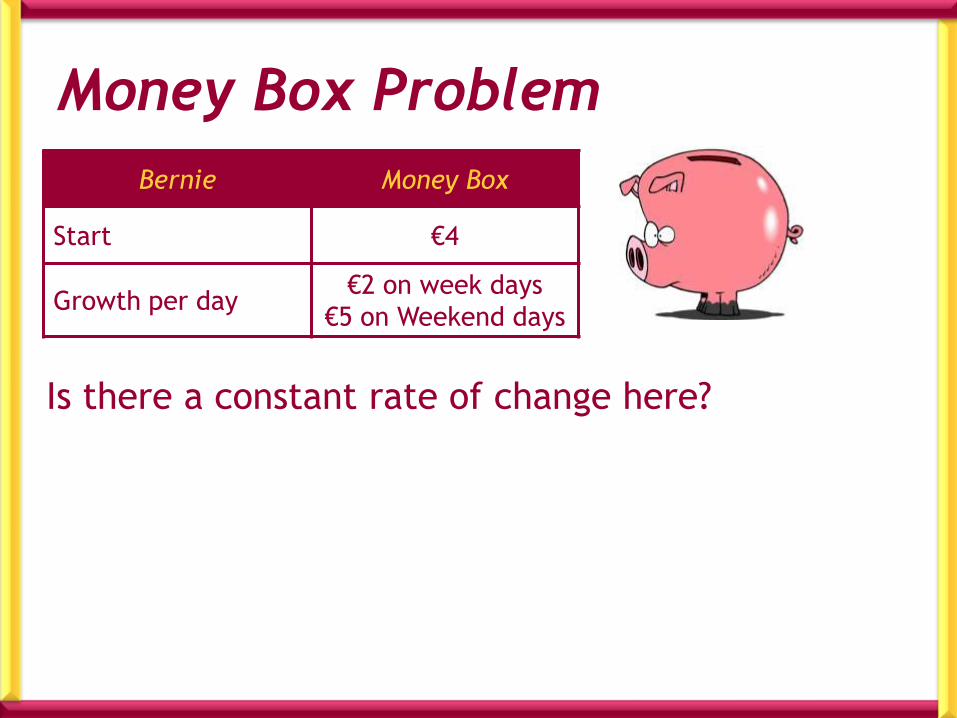
Money Box Problem
Is there a constant rate of change here?
Bernie Money Box
Start €4
Growth per day€2 on week days
€5 on Weekend days
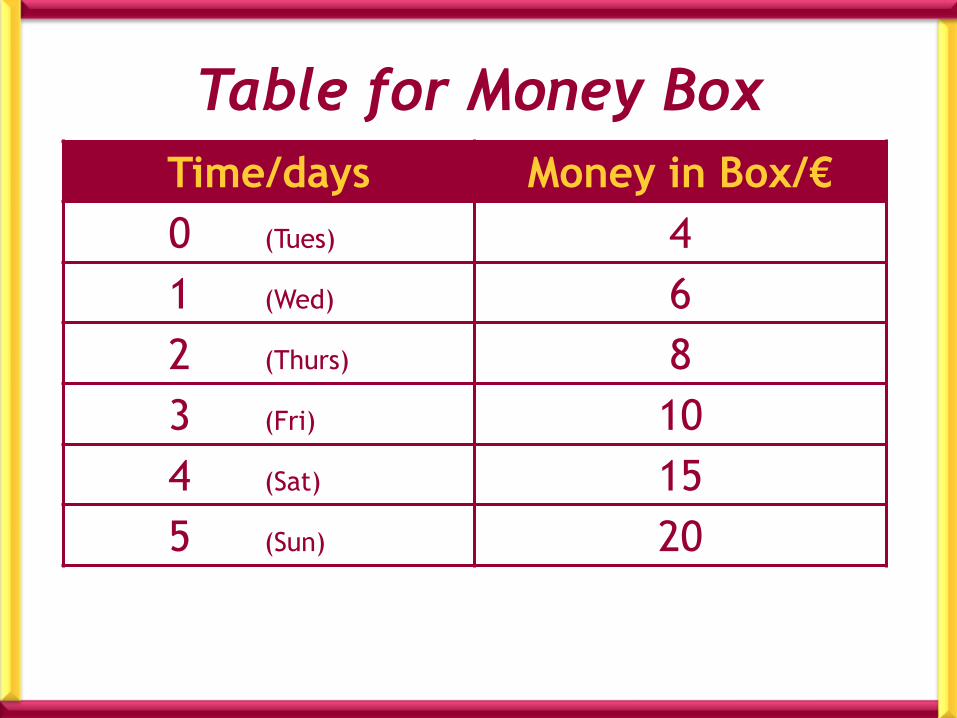
Table for Money Box
Time/days Money in Box/€
0 (Tues) 4
1 (Wed) 6
2 (Thurs) 8
3 (Fri) 10
4 (Sat) 15
5 (Sun) 20

Identifying variables and constants
Money Box Varying Constant
John
Mary
Bernie
What is varying each Day?
What is constant?
Can you put this into words?

Time/daysMoney in
Box €
0 0
1 2
2 4
3 6
4 8
5 10
Time/daysMoney in
Box €
0 3
1 5
2 7
3 9
4 11
5 13
Time/daysMoney in
Box €
0* 4
1 6
2 8
3 10
4 15
5 20
Mary John Bernie
Time on Horizontal Axis
Total Money on Vertical Axis* Note: in this example day 0 is a Tuesday.

Dra
w a
Gra
ph
22
21
19
18
20
17
16
15
14
13
12
11
10
9
8
7
6
5
4
3
2
1
01 5 6 7 8 9 10432
Mary
Bernie
John
Days
Am
ount
of
Money S
pent

Time/days Money/€ Change
0 3
1 5
2 7
3 9
4 11
5 13
6 15
Pattern of Growth for John’s Money
+2
+2
+2
+2
+2
+2

Explain in words & numbers, how to find
the total amount of money in John’s box
after 15 days.
Now, I want you to observe the pattern.
Do this on your white
board
Time/days Money/€ Change
0 3
1 5
2 7
3 9
4 11
5 13
6 15
+2
+2
+2
+2
+2
+2

Explain in words & symbols, how to find
the total amount of money in John’s box
after any given day.
Now, I want you to generalise.
Do this on your white
board
Time/days Money/€ Change
0 3
1 5
2 7
3 9
4 11
5 13
6 15
+2
+2
+2
+2
+2
+2

Table for Mary’s Money Box
What is the general
formula for Mary?
Time/daysMoney in
Box €
0 0
1 2
2 4
3 6
4 8
5 10
A 0 2D

3 2
2 0
Can you read the John 's start am ount?
Can you read Mary's rate of change?
are w e build ing up to?
or
A D
A D
W hat
y c m x y m x c
John :
M ary :
Only seeing the form ula :

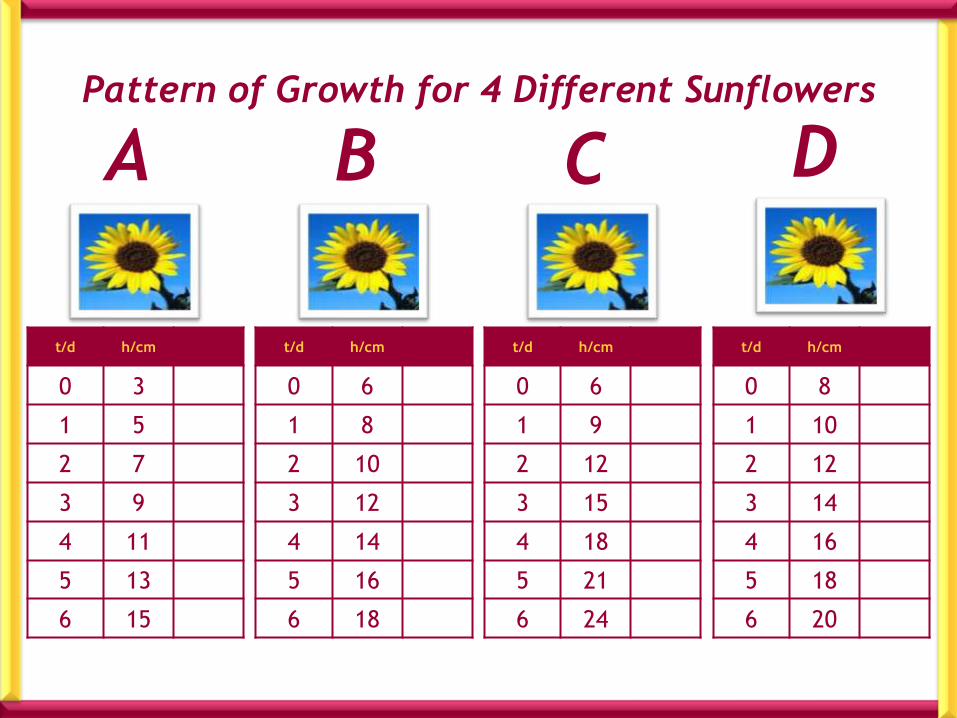
Sunflower growth
Sunflower a b c d
Start height/cm 3 6 6 8
Growth per day/cm 2 2 3 2
Is there a pattern to the growth of these sunflowers?
Can we use this pattern to predict height at some future time?
How can we investigate if a pattern exists?
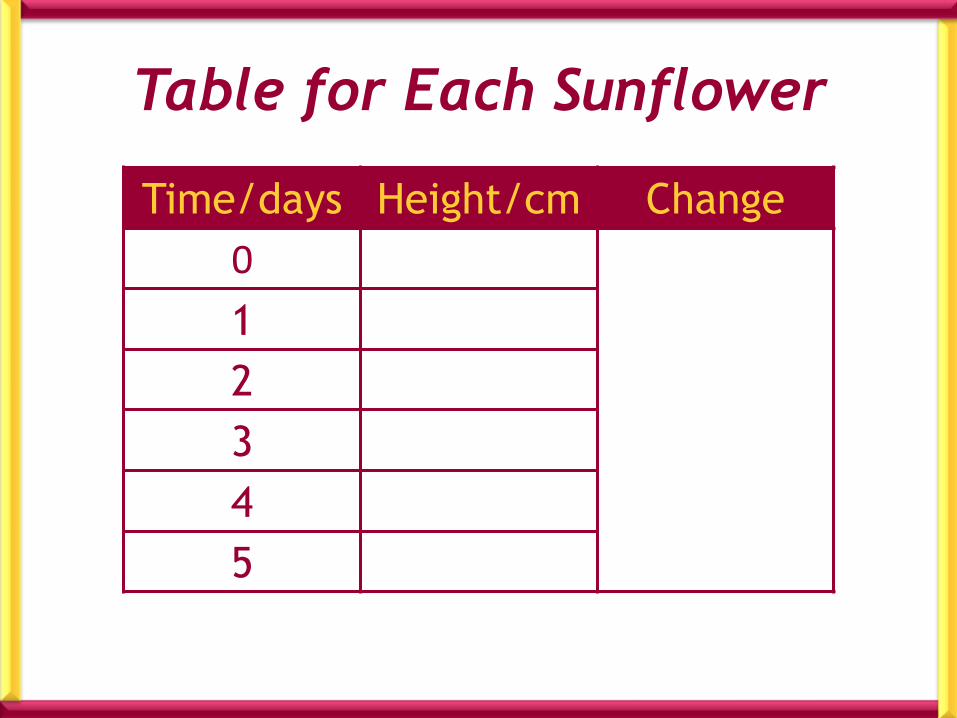
Table for Each Sunflower
Time/days Height/cm Change
0
1
2
3
4
5
t/d h/cm
0 8
1 10
2 12
3 14
4 16
5 18
6 20
C DPattern of Growth for 4 Different Sunflowers
A B
t/d h/cm
0 3
1 5
2 7
3 9
4 11
5 13
6 15
t/d h/cm
0 6
1 8
2 10
3 12
4 14
5 16
6 18
t/d h/cm
0 6
1 9
2 12
3 15
4 18
5 21
6 24

22
21
19
18
20
17
16
15
14
13
12
11
10
9
8
7
6
5
4
3
2
1
01 5 6 7 8 9 10432
Time/Days
Heig
ht/
cm
A and B
Sunflower A
Sunflower B

22
21
19
18
20
17
16
15
14
13
12
11
10
9
8
7
6
5
4
3
2
1
01 5 6 7 8 9 10432
Time/Days
Heig
ht/
cm
B and C
Sunflower B
Sunflower C

22
21
19
18
20
17
16
15
14
13
12
11
10
9
8
7
6
5
4
3
2
1
01 5 6 7 8 9 10432
Time/Days
Heig
ht/
cm
C and D
Sunflower C
Sunflower D

Formula Representation
• Describe in words the height of the sunflower a, on any day.
• Describe in symbols the height of the sunflower a, on any day.
• Identify the variables and constants in this formula.
• Where do the y – intercept and the slope of the graph appear in the formula?

Describe in words the height of the sunflower a, on any day.
Describe in symbols the height of the sunflower a, on any day.
Identify the variables and constants in this formula.
Where do the y – intercept and the slope of the graph appear in the formula?
C D
Pattern of Growth for 4 Different SunflowersA B
T
days
H
cmPattern
0 3 3
1 5 3+2
2 7 3+2+2
3 9 3+2+2+2
4 11 3+2+2+2+2
5 13 3+2+2+2+2+…
6 15 3+2+2+2+2+…
T
days
H
cmPattern
0 6 6
1 8 6+2
2 10 6+2+2
3 12 6+2+2+2
4 14 6+2+2+2+2
5 16 6+2+2+2+2+…
6 18 6+2+2+2+2+…
T
days
H
cmPattern
0 6 6
1 9 6+3
2 12 6+3+3
3 15 6+3+3+3
4 18 6+3+3+3+3
5 21 6+3+3+3+3+…
6 24 6+3+3+3+3+…
T
days
H
cmPattern
0 8 8
1 10 8+2
2 12 8+2+2
3 14 8+2+2+2
4 16 8+2+2+2+2
5 18 8+2+2+2+2+…
6 20 8+2+2+2+2+…
h 3 2t
y int ercept 3
slope 2
h 6 2t
y int ercept 6
slope 2
h 6 3t
y int ercept 6
slope 3
h 8 2t
y int ercept 8
slope 2
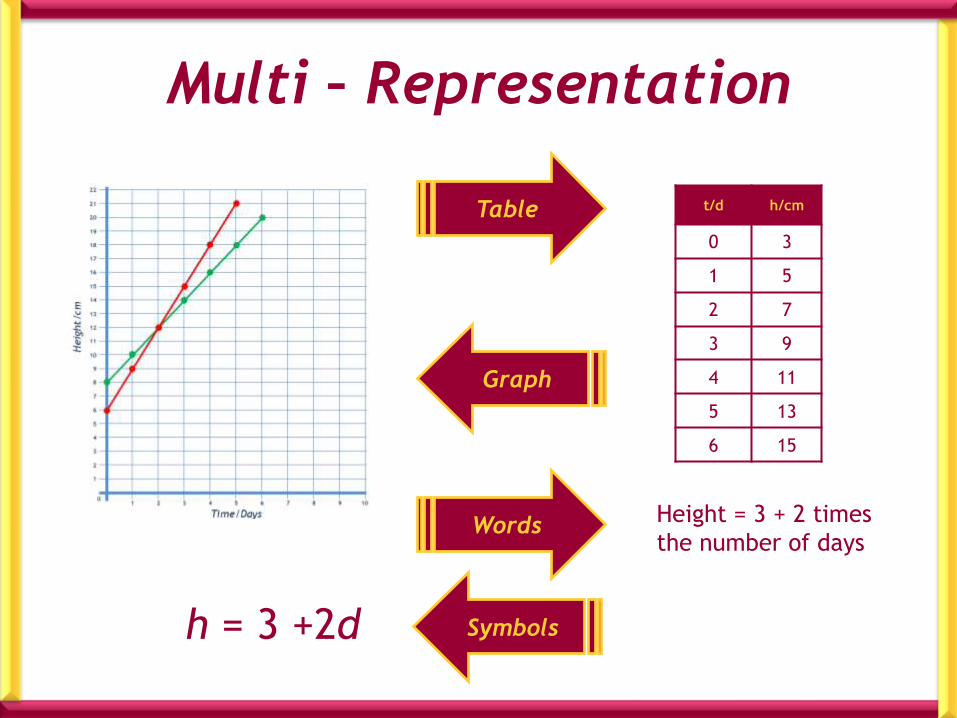
h = 3 +2d
t/d h/cm
0 3
1 5
2 7
3 9
4 11
5 13
6 15
Multi – Representation
Table
Graph
Height = 3 + 2 times
the number of daysWords
Symbols

Draw a rough sketch of the graph: y 2x 11.
Over to you on your White Boards

I start off w ith 6 euro in my money box and put in 3 euro each day.
Draw a rough sketch of the graph.
2.
Over to you on your White Boards

2
The initial speed of a car is 10 m/s and the rate at which it increases its
speed every second is 2 m/s .
W rite down a linear law for the speed of the car after t seconds.
Draw a graph of the law.
3.
Over to you on your White Boards
Speed 10 2(num ber of seconds travelling)
v 10 2t
or v 2t 10
Solution :
2
4
6
8
10
22
18
20
24
16
14
12
26
28
30
1 2 3 4 5 6 7 8 9 10 11 12 13 14 15

slope 1
1slope
2
1slope
3
1slope
4
1slope
5
slope 2
slope 3
slope 4slope 5
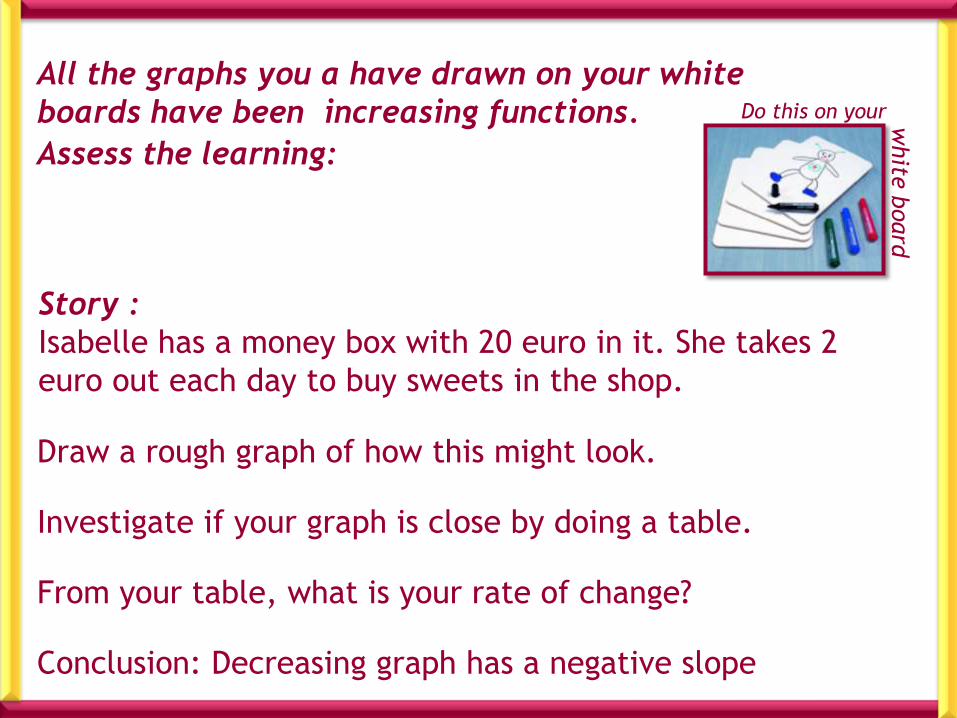
All the graphs you a have drawn on your white
boards have been increasing functions.
Assess the learning:
Story :
Isabelle has a money box with 20 euro in it. She takes 2
euro out each day to buy sweets in the shop.
Draw a rough graph of how this might look.
Investigate if your graph is close by doing a table.
From your table, what is your rate of change?
Conclusion: Decreasing graph has a negative slope
Do this on your white
board

2
4
6
8
10
22
18
20
24
16
14
12
26
28
30
1 2 3 4 5 6 7 8 9 10 11 12 13 14 15
Time/Days
0
Am
ou
nt o
f M
on
ey/€
Isabelle Box Problem

GrowingSquares
Write down a relationship which defines how many red squares are required for each
white square.Hint: You may need more than one representation to help you!

Are the characteristics of…..
A Linear Relationship
Characteristics :
first change constant
term
linear graph
n
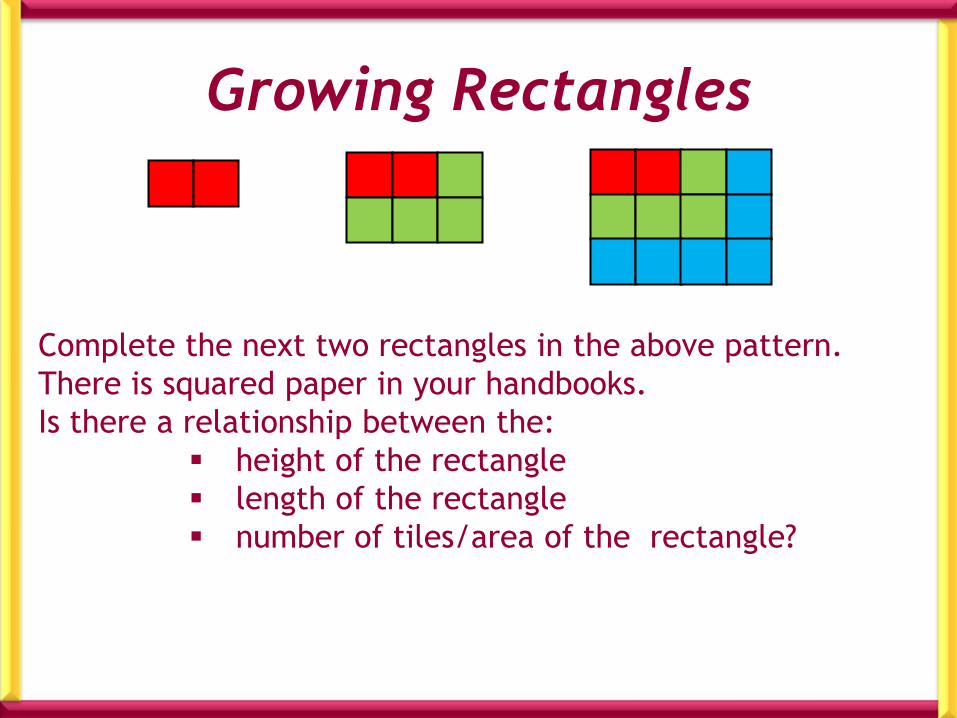
Growing Rectangles
Complete the next two rectangles in the above pattern.
There is squared paper in your handbooks.
Is there a relationship between the:
height of the rectangle
length of the rectangle
number of tiles/area of the rectangle?

Height, h Length, l Area = h x l
Number of
tiles n in
each
rectangle
ChangeChange of
change
1 2 2 2
2 3 6 6
3 4 12 12
4 5 20 20
5 6 30 30
6 7 42 42
7 8 56 56
Investigate the first change and the second change.
What do we notice?
If we let n be the height, write a formula for the area in terms of n,
on your white board.
Table
+4
+6
+8
+10
+12
+14
+2
+2
+2
+2
+2

What do you observe about the shape of your graph?
Draw a graph of the table
Height, h Length, l Area = h x l
Number of
tiles n in
each
rectangle
Change
Change of
change
1 2 2 2
2 3 6 6
3 4 12 12
4 5 20 20
5 6 30 30
6 7 42 42
7 8 56 56

Are the characteristics of…..
A Quadratic Relationship
2
Characteristics :
first change varies
second change constant
term
curved graph
n

“I only want you to give me pocket money for the month of July.
All I want is for you to give me 2 c on the first day of the month,
double that for the second day, and double that again for the 3rd
day... and so on.
On the first day I will get 2 c, on the 2nd day 4 c, on the 3rd day
8c and so on until the end of the month. That is all I want.”
Story: How to ask for Pocket Money
Is this a good deal for my parents
or is it a good deal for me?

Day Money in cent
1 2
2 2 x 2
3 2 x 2 x 2
4
5
6
7
8
9
10
Investigate using a Table
If we let n be the number of days, can we write a formula
for the Amount of Pocket Money?
Do this on your white
board
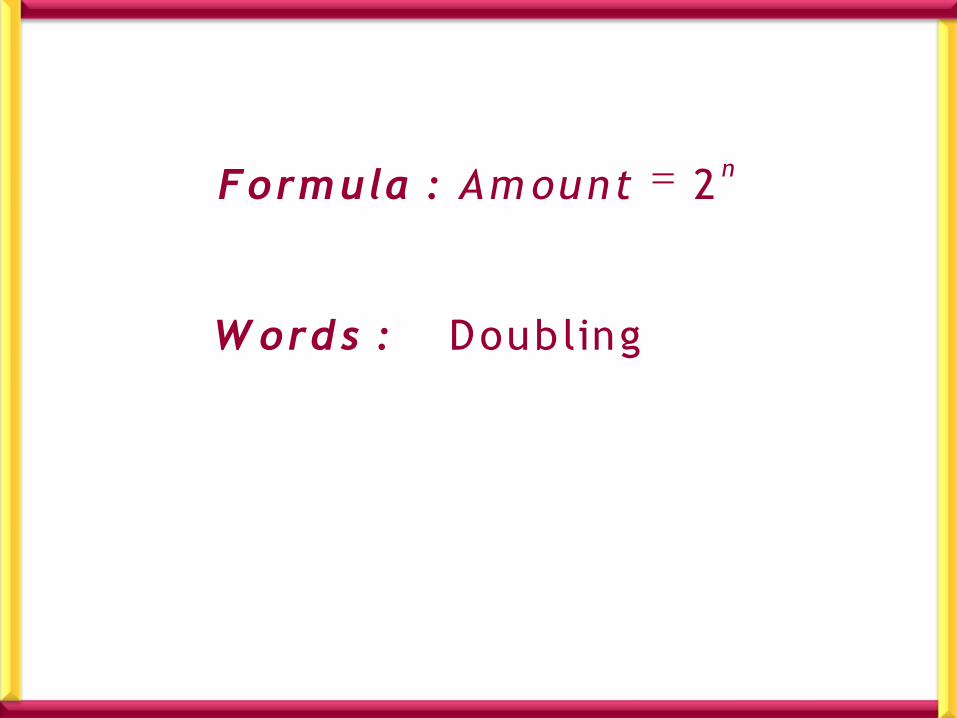
2
Doubling
Form ula :
W ords :
nAm ount

Time/Days
Money/Cents
Graph
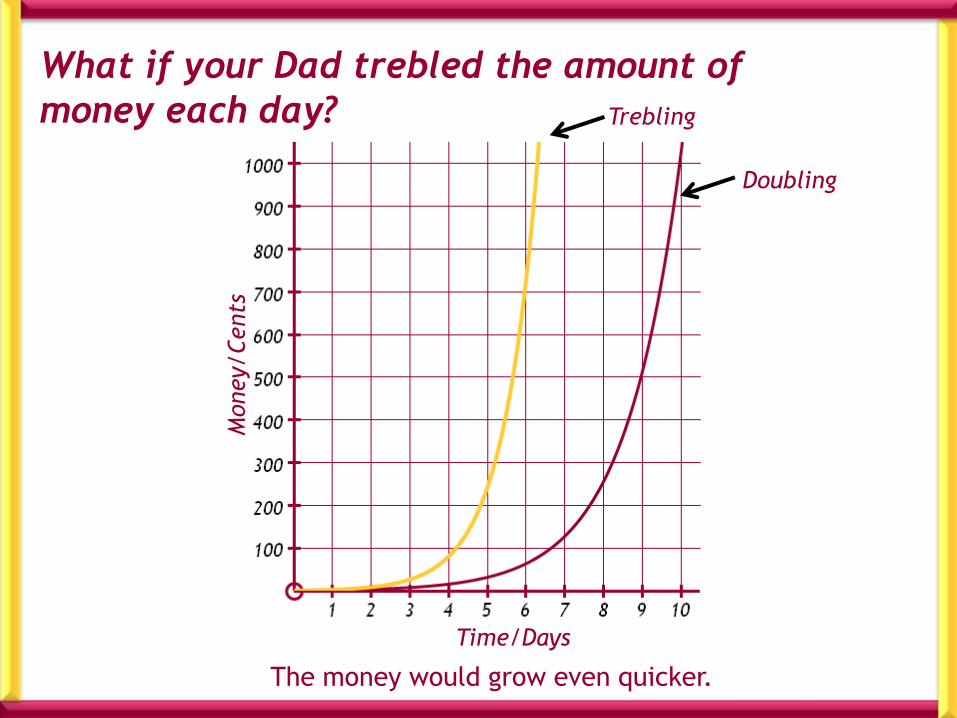
What if your Dad trebled the amount of
money each day?
The money would grow even quicker.
Time/Days
Money/Cents
Doubling
Trebling

Lets look at the Changes in a Table
DaysMoney in
centChange
Change of
change
1 2
2 4
3 8
4 16
5 32
6 64
7 128
8 256
9 512
10 1024
What do you notice about the Change columns……
They develop in a ratio.
+2
+4
+8
+16
+32
+64
+128
+256
+512
+2
+4
+8
+16
+32
+64
+128
+256

Are the characteristics of…..
An Exponential Relationship
Characteristics :
change develops in a ratio
Form ula: or
W ords: Doubling or Trebling
curved graph that grows very quickly
n n2 3

1t
F P( i )Ignoring the principal, the interest rate, and the number of years by setting all these variables equal to "1", and
looking only at the influence of the number of compoundings, we get:
1
2
4
12
52
365
1 1 2
11 2 25
2
11 2 44140625
4
11 2 61303529022
12
11 2 692596954444
52
11 2 71456748202
365
11
8760
yearly
sem i annually .
quarterly .
m onthly . ...
w eekly . ...
da ily . ...
hourly
8760
525600
31536000
2 71892792154
11 2 7182792154
525600
11 2 71828247254
31536000
. ...
every m inute . ...
every second . ...