Embed Size (px)
Citation preview
Should We Re-think Income Taxation in the Philippines?
SA. Quimbo 4 December 2014
Ayala-UPSE Lecture Series
PCED Auditorium
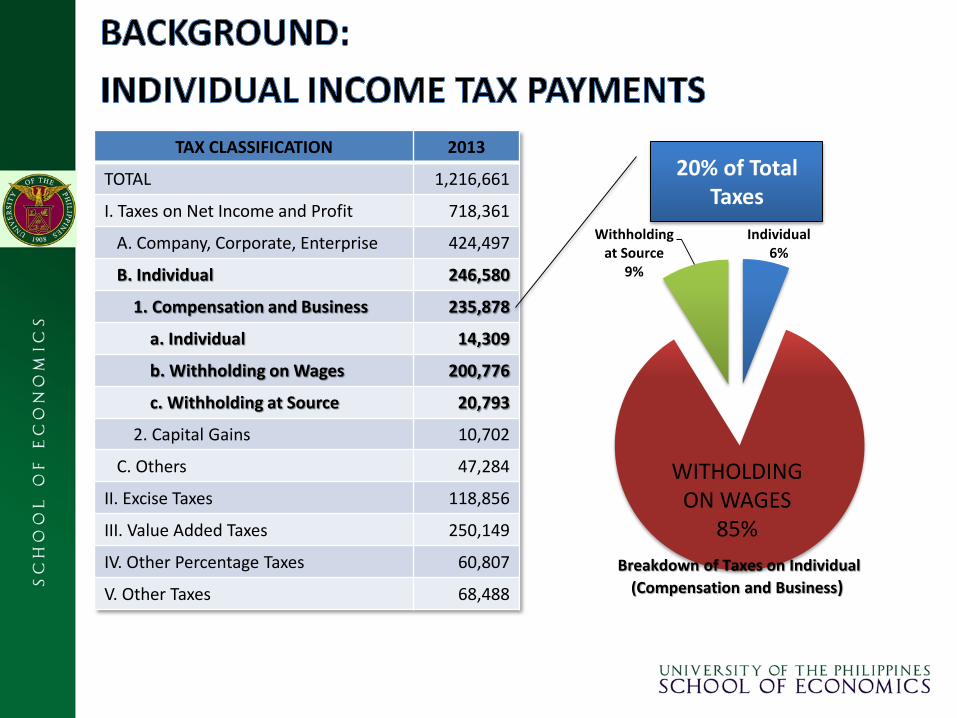
Individual 6%
Withholding at Source
9%
Breakdown of Taxes on Individual
(Compensation and Business)
TAX CLASSIFICATION 2013
TOTAL 1,216,661
I. Taxes on Net Income and Profit 718,361
A. Company, Corporate, Enterprise 424,497
B. Individual 246,580
1. Compensation and Business 235,878
a. Individual 14,309
b. Withholding on Wages 200,776
c. Withholding at Source 20,793
2. Capital Gains 10,702
C. Others 47,284
II. Excise Taxes 118,856
III. Value Added Taxes 250,149
IV. Other Percentage Taxes 60,807
V. Other Taxes 68,488
20% of Total Taxes
WITHOLDING ON WAGES
85%
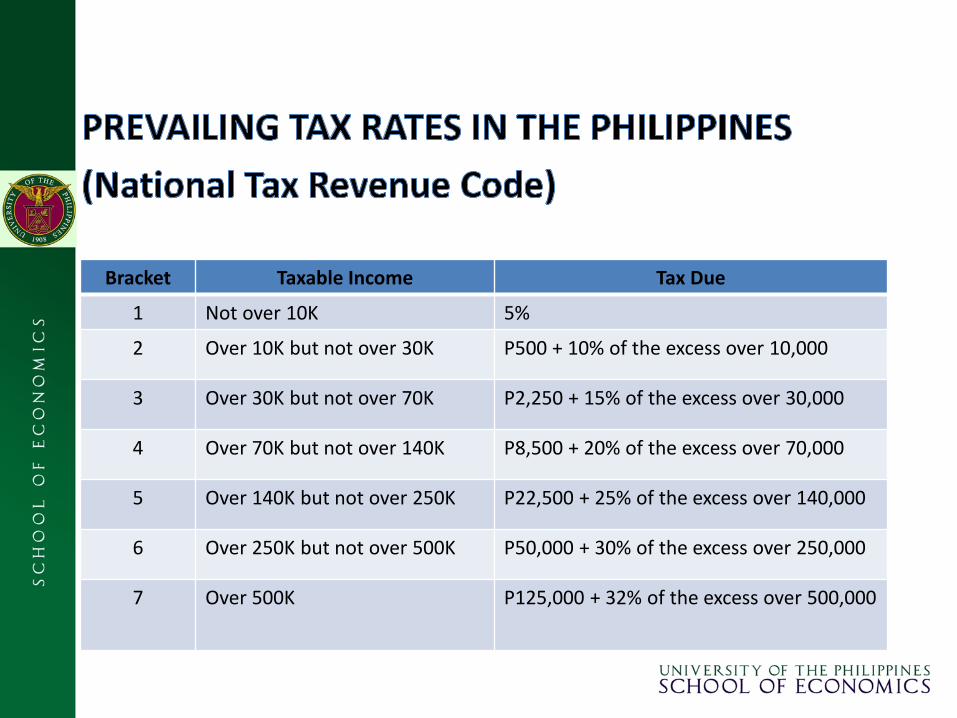
Bracket Taxable Income Tax Due
1 Not over 10K 5%
2 Over 10K but not over 30K P500 + 10% of the excess over 10,000
3 Over 30K but not over 70K P2,250 + 15% of the excess over 30,000
4 Over 70K but not over 140K P8,500 + 20% of the excess over 70,000
5 Over 140K but not over 250K P22,500 + 25% of the excess over 140,000
6 Over 250K but not over 500K P50,000 + 30% of the excess over 250,000
7 Over 500K P125,000 + 32% of the excess over 500,000
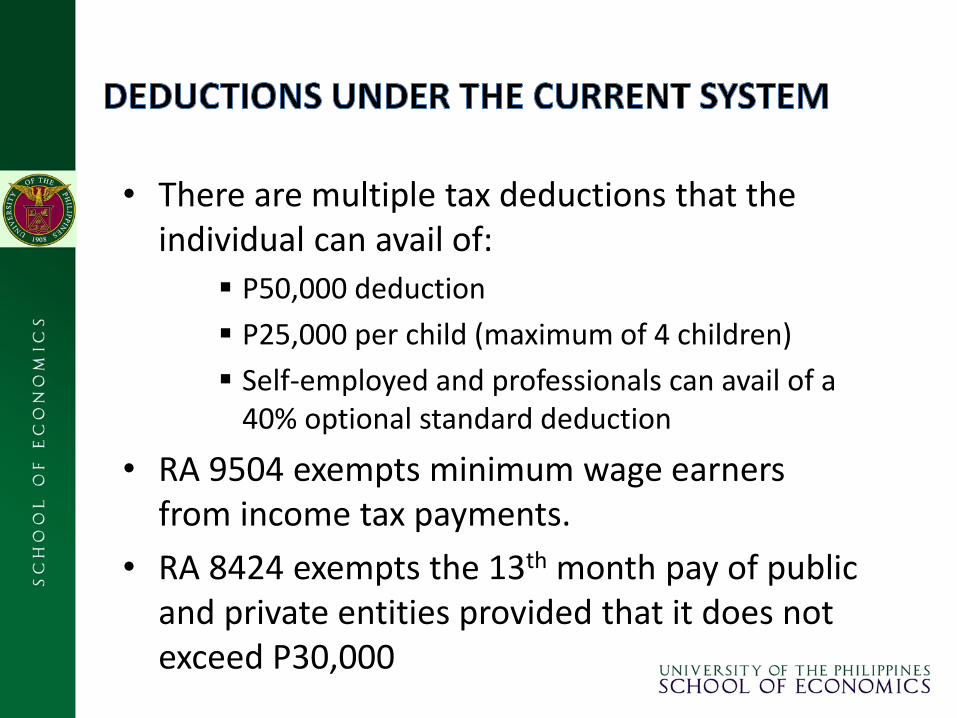
• There are multiple tax deductions that the individual can avail of:
P50,000 deduction
P25,000 per child (maximum of 4 children)
Self-employed and professionals can avail of a 40% optional standard deduction
• RA 9504 exempts minimum wage earners from income tax payments.
• RA 8424 exempts the 13th month pay of public and private entities provided that it does not exceed P30,000
• Several calls for lower income tax rates among legislators
There are currently eight (8) bills filed in the House of Representatives and three (3) bills in the Senate seeking to lower income tax rates or initiate re-bracketing.
All these measures acknowledge the unfairness and inequality of the prevailing income tax system, wherein the burden falls on the middle class.
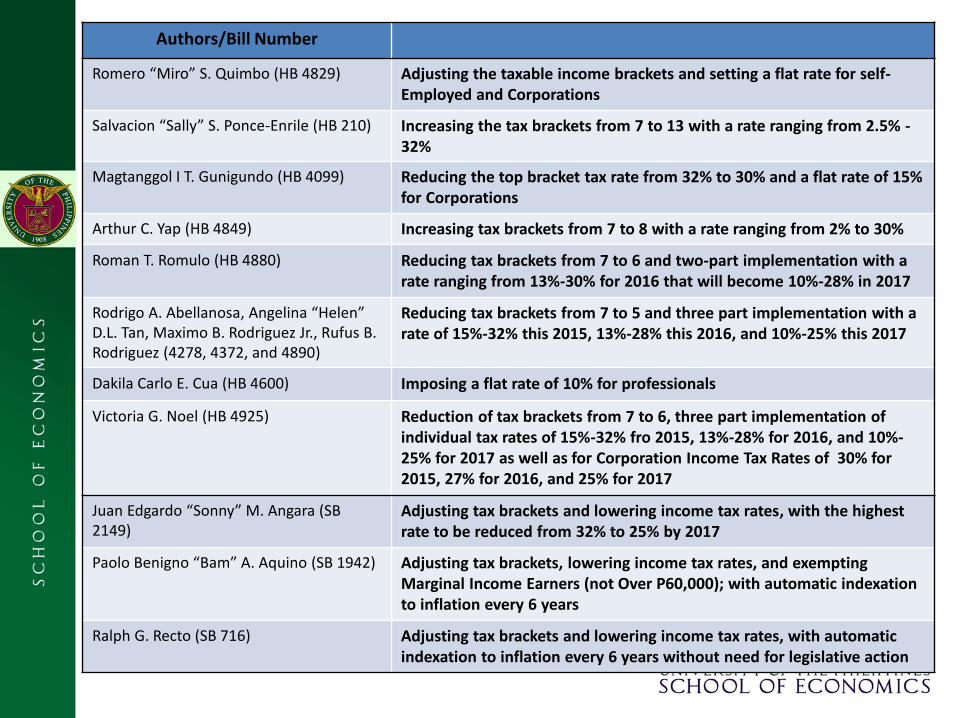
Authors/Bill Number
Romero “Miro” S. Quimbo (HB 4829) Adjusting the taxable income brackets and setting a flat rate for self-Employed and Corporations
Salvacion “Sally” S. Ponce-Enrile (HB 210) Increasing the tax brackets from 7 to 13 with a rate ranging from 2.5% - 32%
Magtanggol I T. Gunigundo (HB 4099) Reducing the top bracket tax rate from 32% to 30% and a flat rate of 15% for Corporations
Arthur C. Yap (HB 4849) Increasing tax brackets from 7 to 8 with a rate ranging from 2% to 30%
Roman T. Romulo (HB 4880) Reducing tax brackets from 7 to 6 and two-part implementation with a rate ranging from 13%-30% for 2016 that will become 10%-28% in 2017
Rodrigo A. Abellanosa, Angelina “Helen” D.L. Tan, Maximo B. Rodriguez Jr., Rufus B. Rodriguez (4278, 4372, and 4890)
Reducing tax brackets from 7 to 5 and three part implementation with a rate of 15%-32% this 2015, 13%-28% this 2016, and 10%-25% this 2017
Dakila Carlo E. Cua (HB 4600) Imposing a flat rate of 10% for professionals
Victoria G. Noel (HB 4925) Reduction of tax brackets from 7 to 6, three part implementation of individual tax rates of 15%-32% fro 2015, 13%-28% for 2016, and 10%-25% for 2017 as well as for Corporation Income Tax Rates of 30% for 2015, 27% for 2016, and 25% for 2017
Juan Edgardo “Sonny” M. Angara (SB 2149)
Adjusting tax brackets and lowering income tax rates, with the highest rate to be reduced from 32% to 25% by 2017
Paolo Benigno “Bam” A. Aquino (SB 1942) Adjusting tax brackets, lowering income tax rates, and exempting Marginal Income Earners (not Over P60,000); with automatic indexation to inflation every 6 years
Ralph G. Recto (SB 716) Adjusting tax brackets and lowering income tax rates, with automatic indexation to inflation every 6 years without need for legislative action
QUESTIONS
• Are income taxes equitable? – Horizontal Equity: Similarly situated taxpayers
are taxed similarly.
– Vertical Equity: Taxes are based on the ability to pay.
– Compliance Equity: All taxpayers pay what they owe on a timely basis.
– Time-Related Equity: Taxes are not unduly distorted when income or wealth levels fluctuate over time.
QUESTIONS
• What are the tax revenue and equity implications of tax reform measures:
– Inflation-adjustment of tax brackets
– Lowering of tax rates
– Reduced number of tax brackets
– Removal of deductions
METHODOLOGY
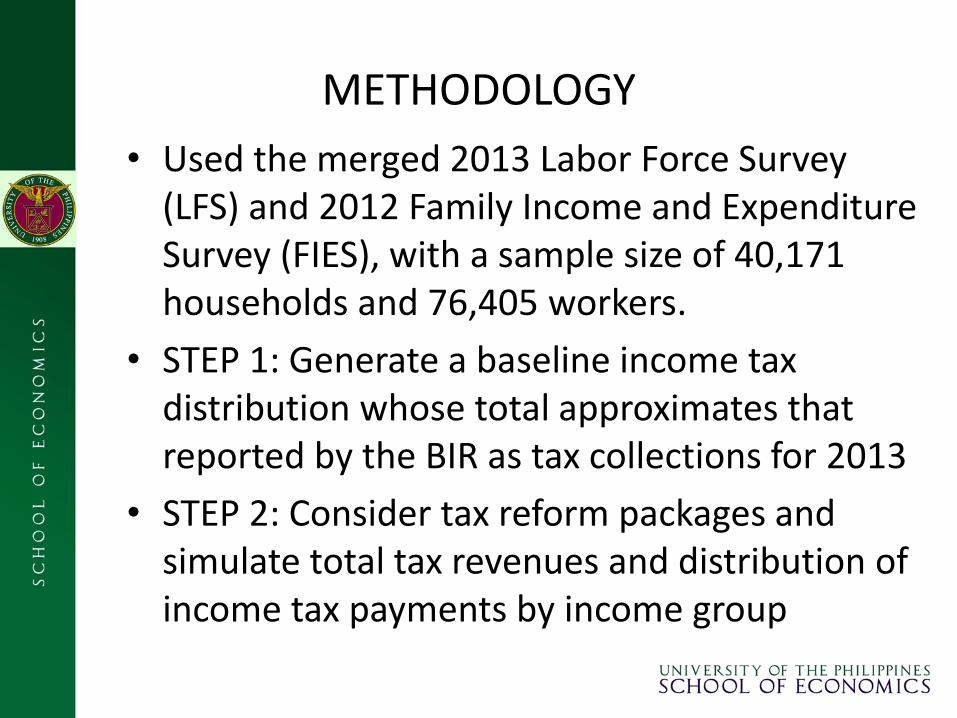
• Used the merged 2013 Labor Force Survey (LFS) and 2012 Family Income and Expenditure Survey (FIES), with a sample size of 40,171 households and 76,405 workers.
• STEP 1: Generate a baseline income tax distribution whose total approximates that reported by the BIR as tax collections for 2013
• STEP 2: Consider tax reform packages and simulate total tax revenues and distribution of income tax payments by income group
METHODOLOGY
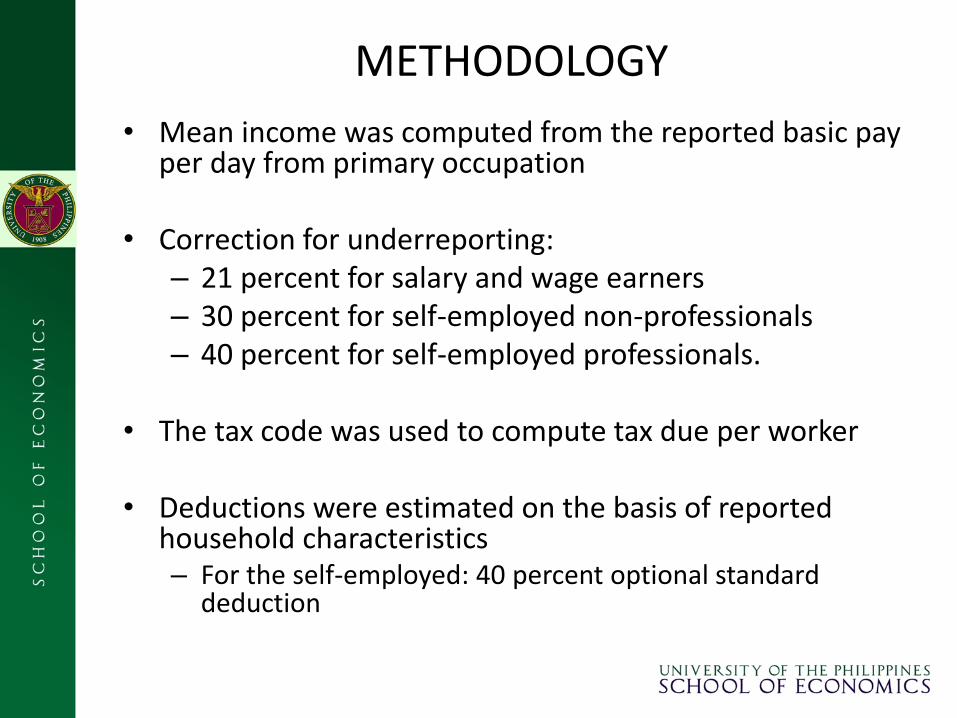
• Mean income was computed from the reported basic pay per day from primary occupation
• Correction for underreporting: – 21 percent for salary and wage earners – 30 percent for self-employed non-professionals – 40 percent for self-employed professionals.
• The tax code was used to compute tax due per worker
• Deductions were estimated on the basis of reported
household characteristics – For the self-employed: 40 percent optional standard
deduction
LIMITATIONS
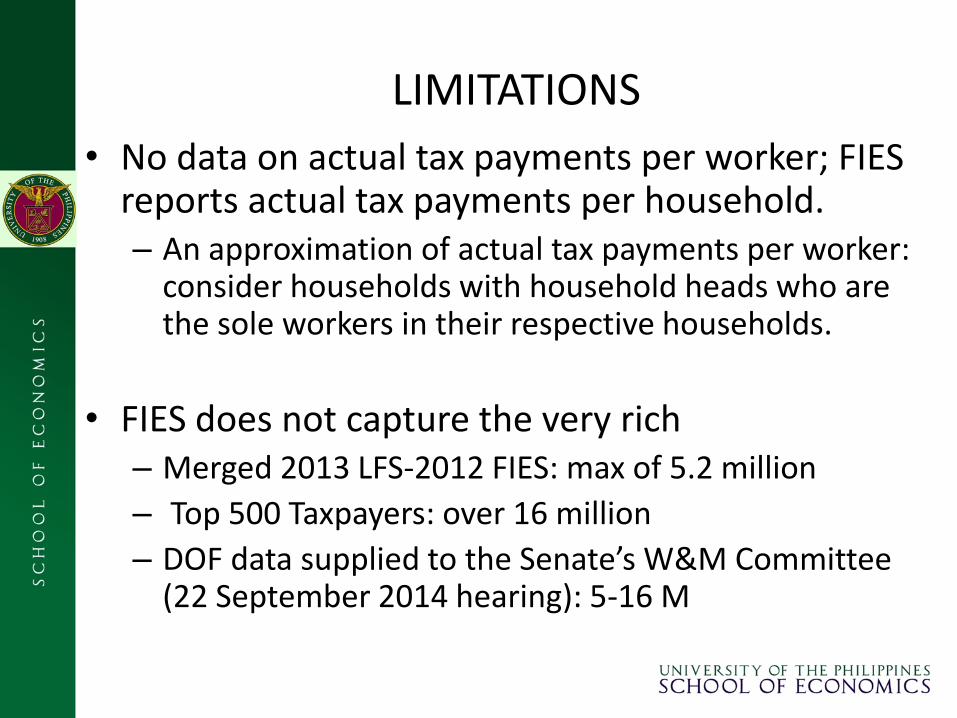
• No data on actual tax payments per worker; FIES reports actual tax payments per household. – An approximation of actual tax payments per worker:
consider households with household heads who are the sole workers in their respective households.
• FIES does not capture the very rich – Merged 2013 LFS-2012 FIES: max of 5.2 million
– Top 500 Taxpayers: over 16 million
– DOF data supplied to the Senate’s W&M Committee (22 September 2014 hearing): 5-16 M
COMPLIANCE EQUITY:
Who pays income taxes?
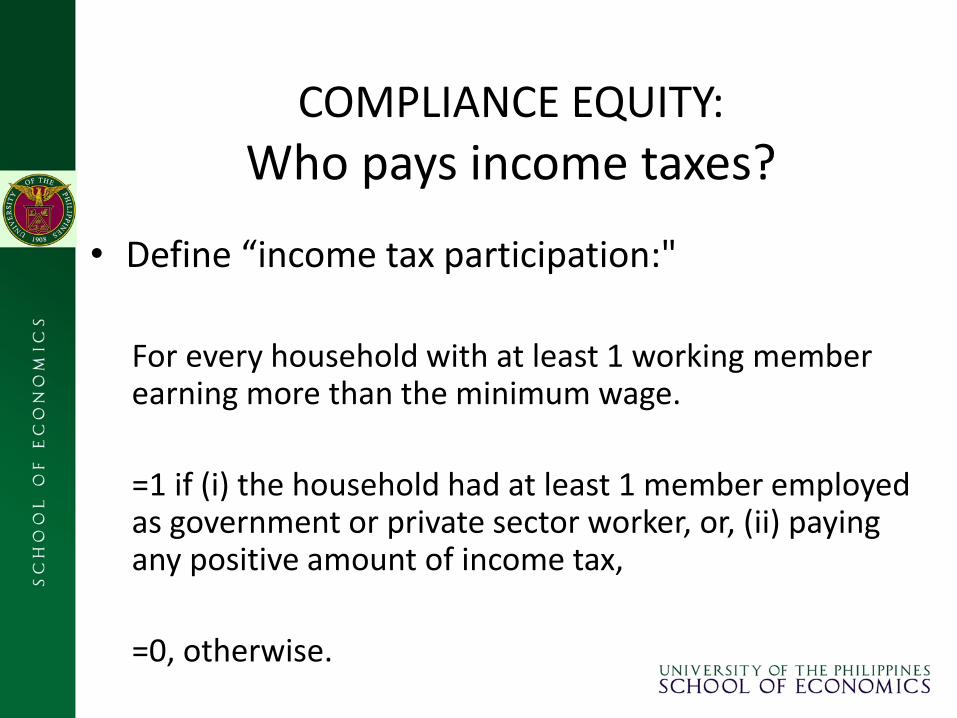
• Define “income tax participation:"
For every household with at least 1 working member earning more than the minimum wage.
=1 if (i) the household had at least 1 member employed as government or private sector worker, or, (ii) paying any positive amount of income tax,
=0, otherwise.
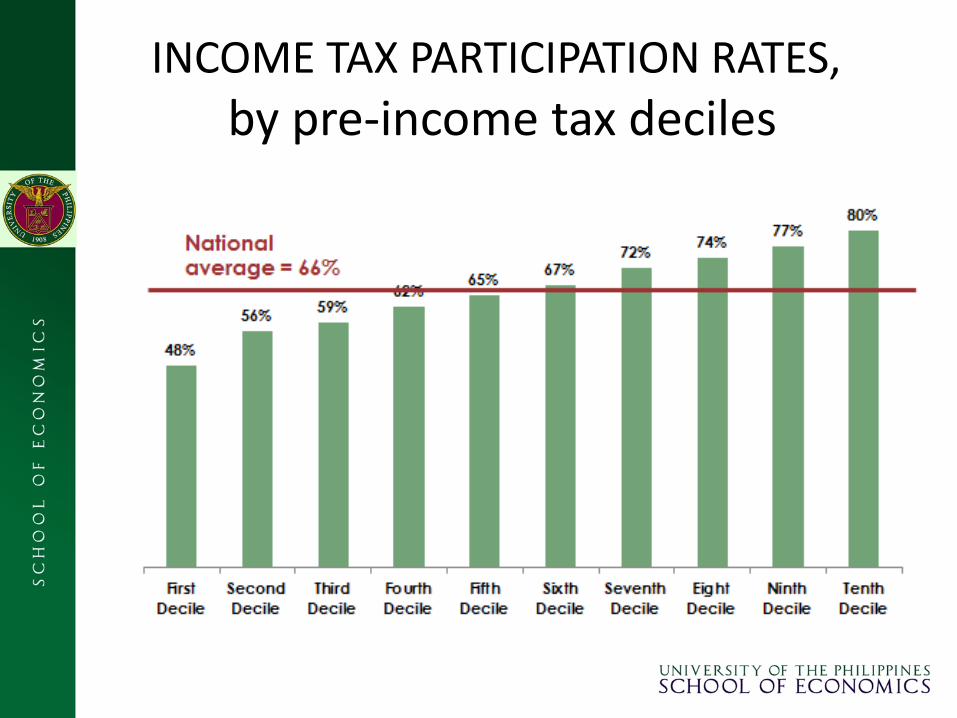
INCOME TAX PARTICIPATION RATES,
by pre-income tax deciles
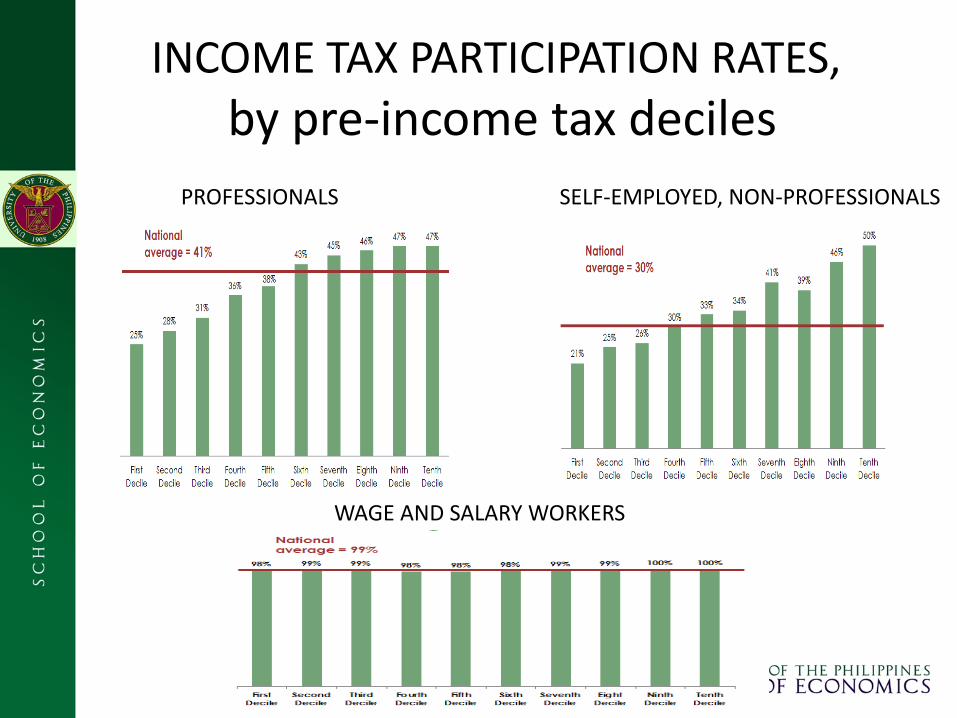
INCOME TAX PARTICIPATION RATES,
by pre-income tax deciles
PROFESSIONALS SELF-EMPLOYED, NON-PROFESSIONALS
WAGE AND SALARY WORKERS
COMPLIANCE EQUITY: What portion of the tax due is unpaid?
• Define “tax gap”
= 1 minus the proportion of declared income taxes paid to income taxes due (based on the code)
used household-level data headed by lone member who works (sample size of ~11,500 households)
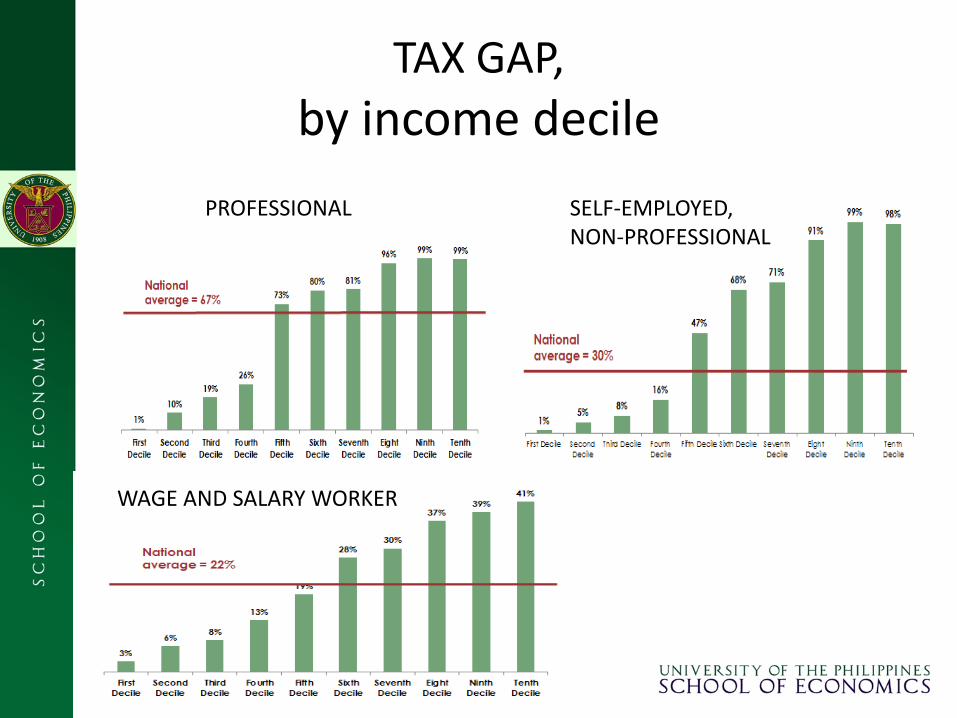
TAX GAP,
by income decile
PROFESSIONAL SELF-EMPLOYED, NON-PROFESSIONAL
WAGE AND SALARY WORKER
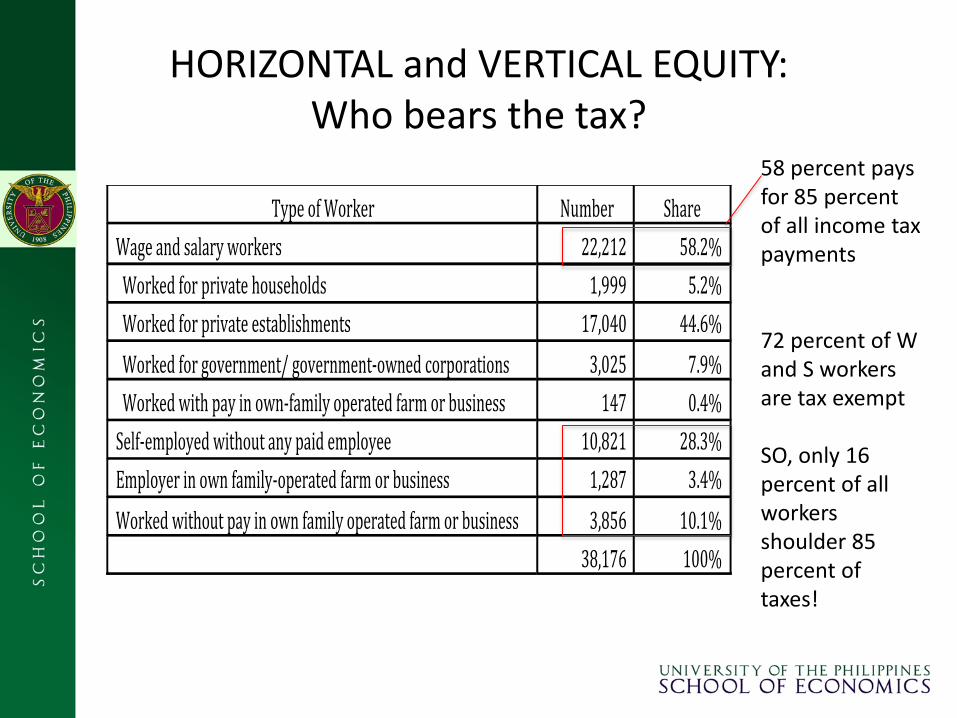
HORIZONTAL and VERTICAL EQUITY: Who bears the tax?
TypeofWorker Number Share
Wageandsalaryworkers 22,212 58.2%
Workedforprivatehouseholds 1,999 5.2%
Workedforprivateestablishments 17,040 44.6%
Workedforgovernment/government-ownedcorporations 3,025 7.9%
Workedwithpayinown-familyoperatedfarmorbusiness 147 0.4%
Self-employedwithoutanypaidemployee 10,821 28.3%
Employerinownfamily-operatedfarmorbusiness 1,287 3.4%
Workedwithoutpayinownfamilyoperatedfarmorbusiness 3,856 10.1%
38,176 100%
58 percent pays for 85 percent of all income tax payments 72 percent of W and S workers are tax exempt SO, only 16 percent of all workers shoulder 85 percent of taxes!
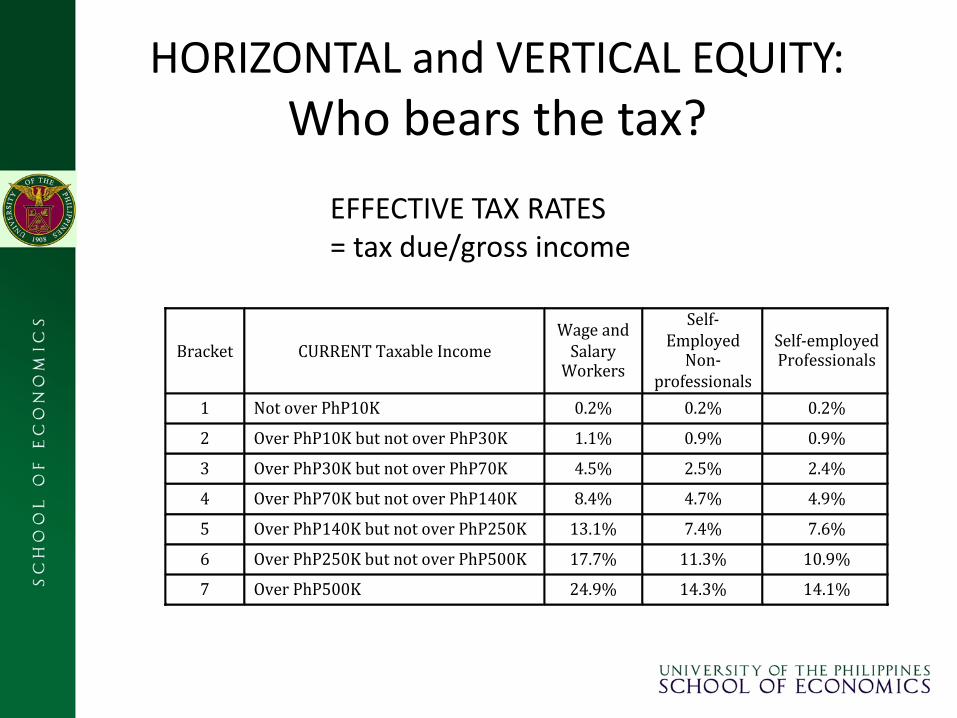
HORIZONTAL and VERTICAL EQUITY:
Who bears the tax?
EFFECTIVE TAX RATES = tax due/gross income
Bracket CURRENTTaxableIncomeWageand
SalaryWorkers
Self-Employed
Non-professionals
Self-employedProfessionals
1 NotoverPhP10K 0.2% 0.2% 0.2%
2 OverPhP10KbutnotoverPhP30K 1.1% 0.9% 0.9%
3 OverPhP30KbutnotoverPhP70K 4.5% 2.5% 2.4%
4 OverPhP70KbutnotoverPhP140K 8.4% 4.7% 4.9%
5 OverPhP140KbutnotoverPhP250K 13.1% 7.4% 7.6%
6 OverPhP250KbutnotoverPhP500K 17.7% 11.3% 10.9%
7 OverPhP500K 24.9% 14.3% 14.1%
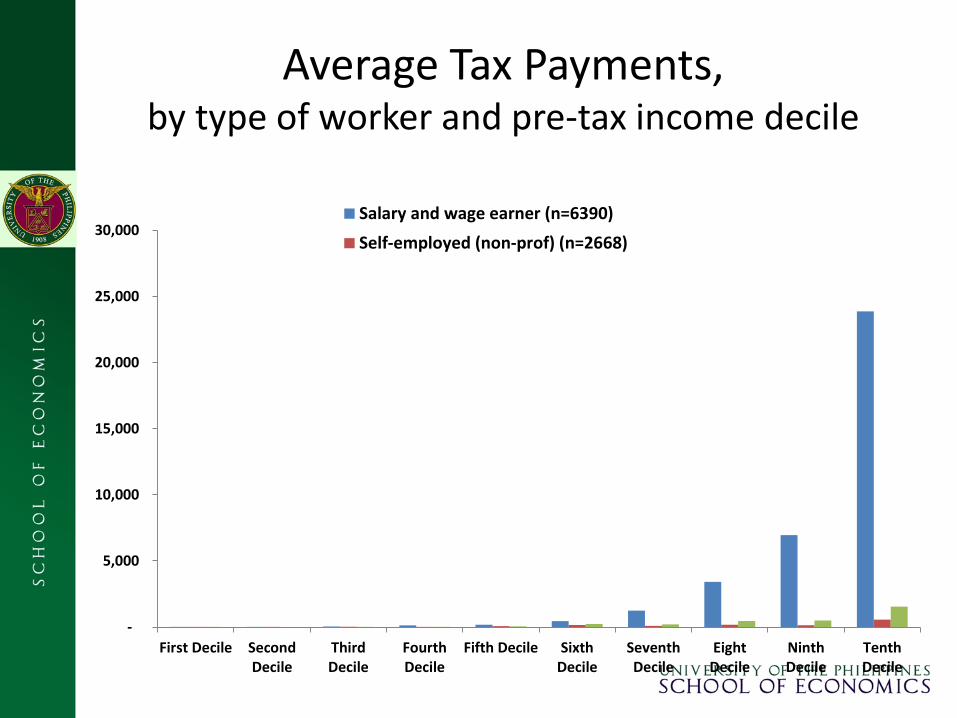
Average Tax Payments, by type of worker and pre-tax income decile
-
5,000
10,000
15,000
20,000
25,000
30,000
First Decile SecondDecile
ThirdDecile
FourthDecile
Fifth Decile SixthDecile
SeventhDecile
EightDecile
NinthDecile
TenthDecile
Salary and wage earner (n=6390)
Self-employed (non-prof) (n=2668)
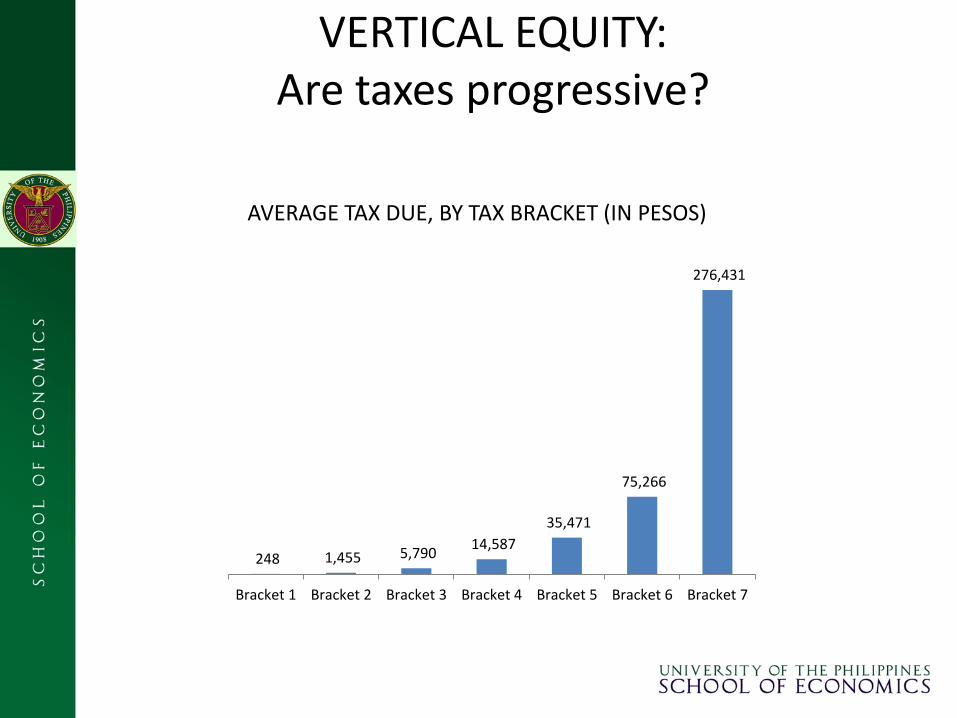
VERTICAL EQUITY: Are taxes progressive?
248 1,455 5,790 14,587
35,471
75,266
276,431
Bracket 1 Bracket 2 Bracket 3 Bracket 4 Bracket 5 Bracket 6 Bracket 7
AVERAGE TAX DUE, BY TAX BRACKET (IN PESOS)
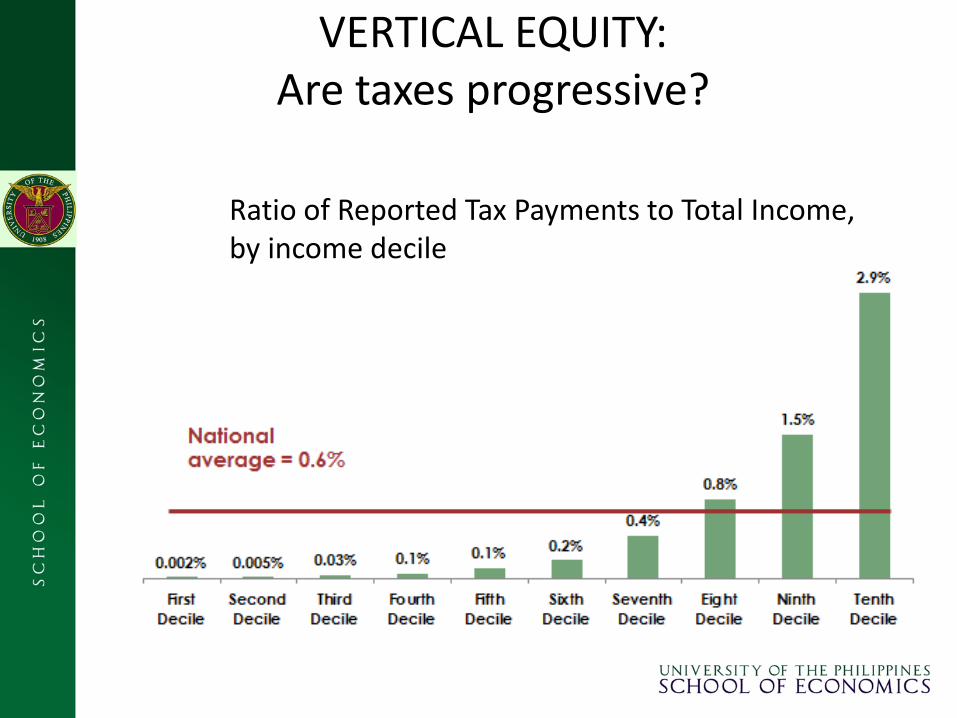
VERTICAL EQUITY: Are taxes progressive?
Ratio of Reported Tax Payments to Total Income, by income decile
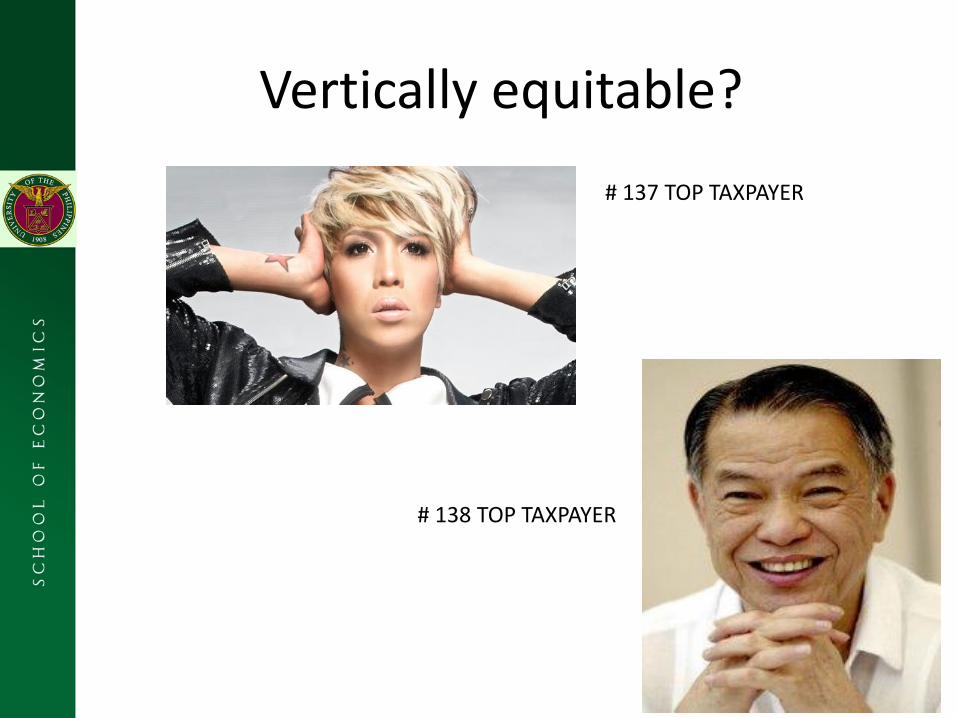
Vertically equitable?
# 137 TOP TAXPAYER
# 138 TOP TAXPAYER
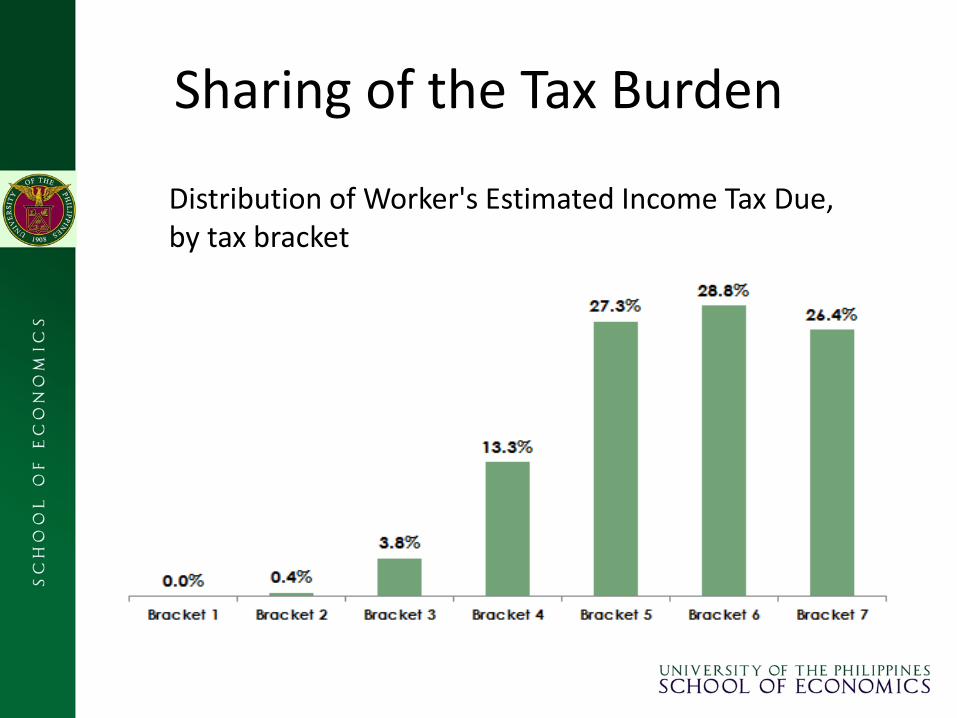
Sharing of the Tax Burden
Distribution of Worker's Estimated Income Tax Due, by tax bracket
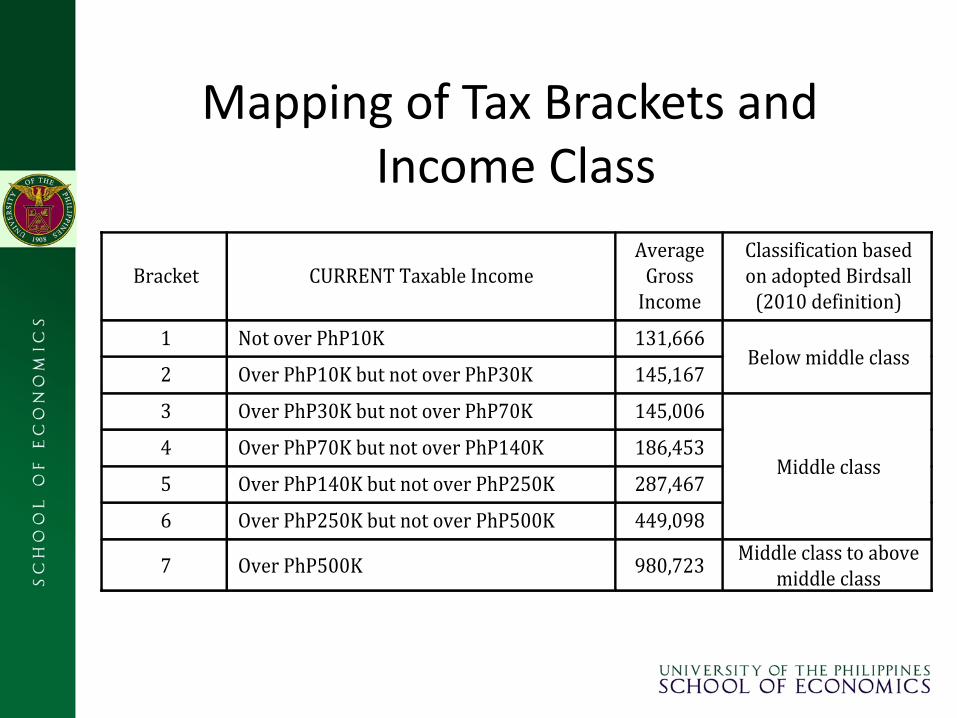
Mapping of Tax Brackets and Income Class
Bracket CURRENTTaxableIncomeAverage
GrossIncome
ClassificationbasedonadoptedBirdsall
(2010definition)
1 NotoverPhP10K 131,666Belowmiddleclass
2 OverPhP10KbutnotoverPhP30K 145,167
3 OverPhP30KbutnotoverPhP70K 145,006
Middleclass4 OverPhP70KbutnotoverPhP140K 186,453
5 OverPhP140KbutnotoverPhP250K 287,467
6 OverPhP250KbutnotoverPhP500K 449,098
7 OverPhP500K 980,723Middleclasstoabove
middleclass
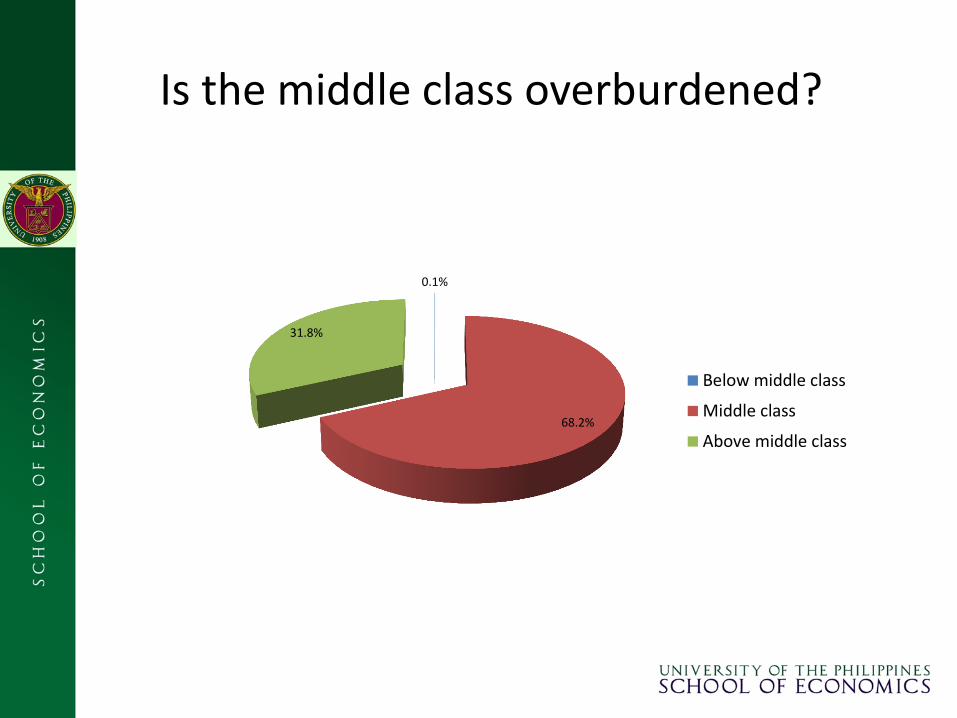
Is the middle class overburdened?
0.1%
68.2%
31.8%
Below middle class
Middle class
Above middle class
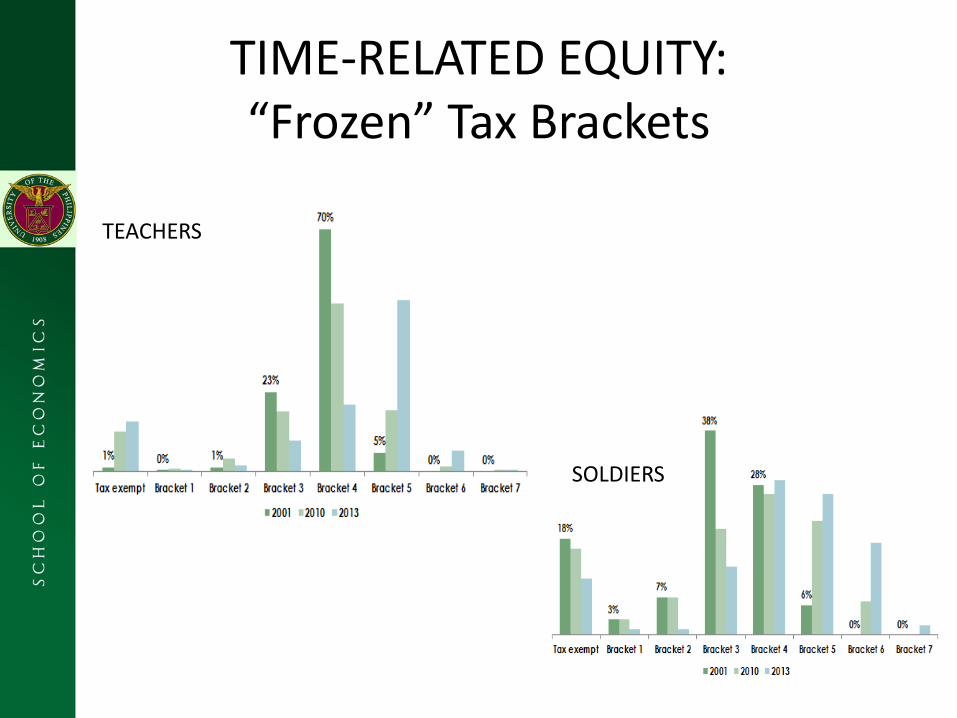
TIME-RELATED EQUITY: “Frozen” Tax Brackets
TEACHERS
SOLDIERS
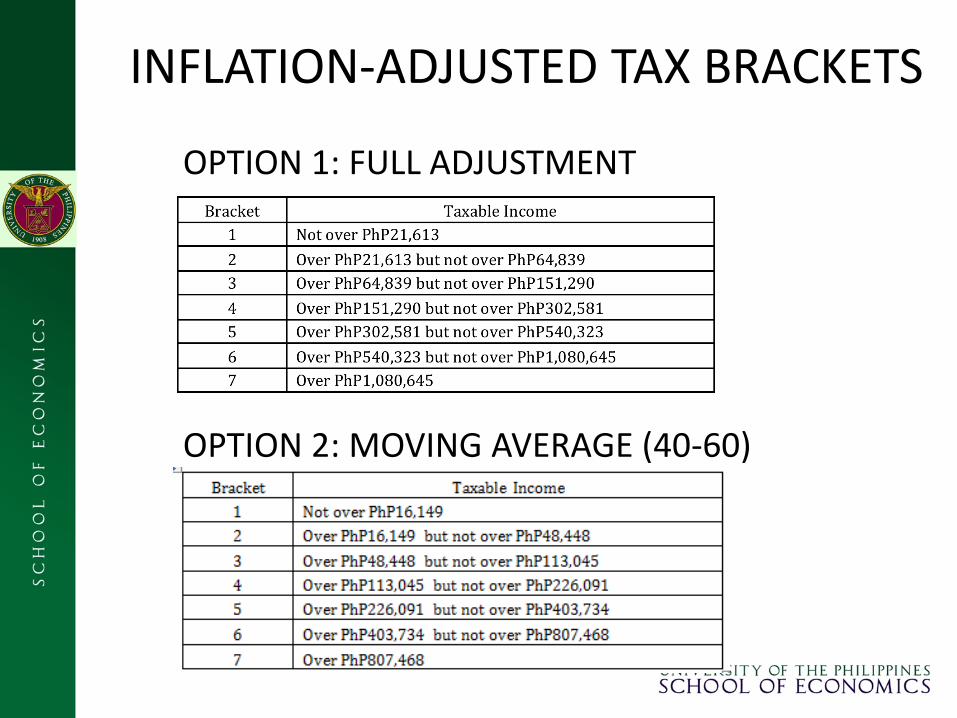
INFLATION-ADJUSTED TAX BRACKETS
OPTION 1: FULL ADJUSTMENT
OPTION 2: MOVING AVERAGE (40-60)
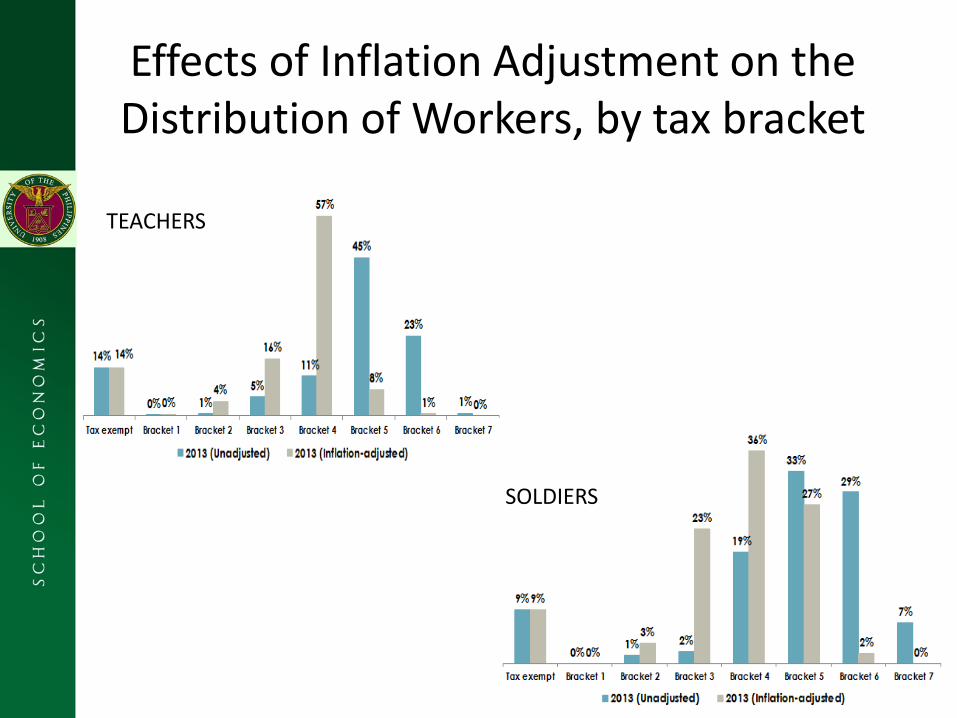
Effects of Inflation Adjustment on the Distribution of Workers, by tax bracket
TEACHERS
SOLDIERS
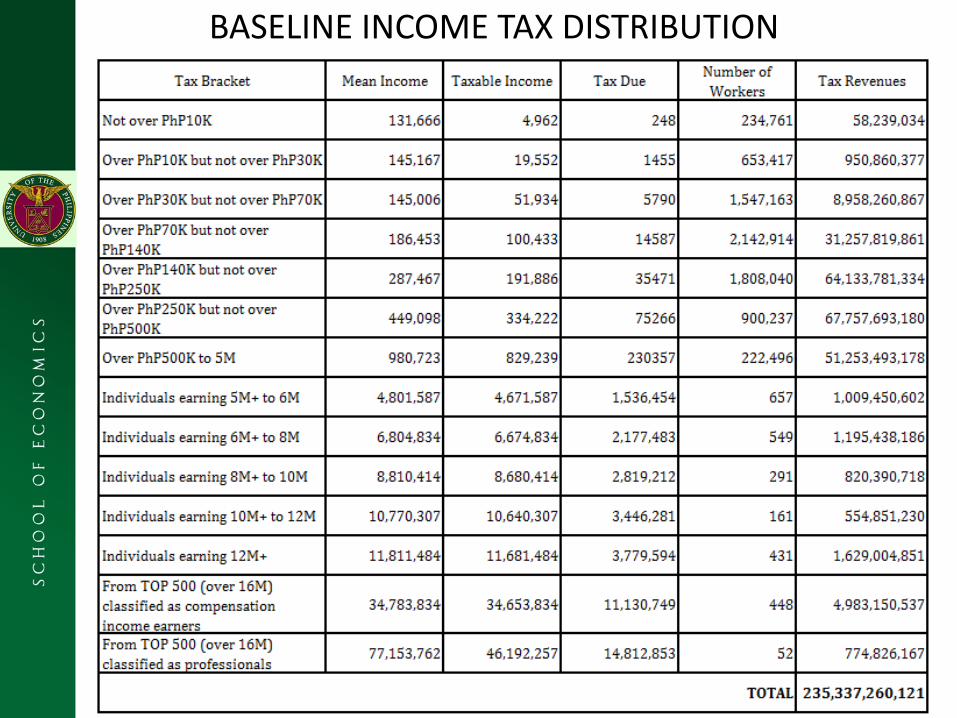
BASELINE INCOME TAX DISTRIBUTION
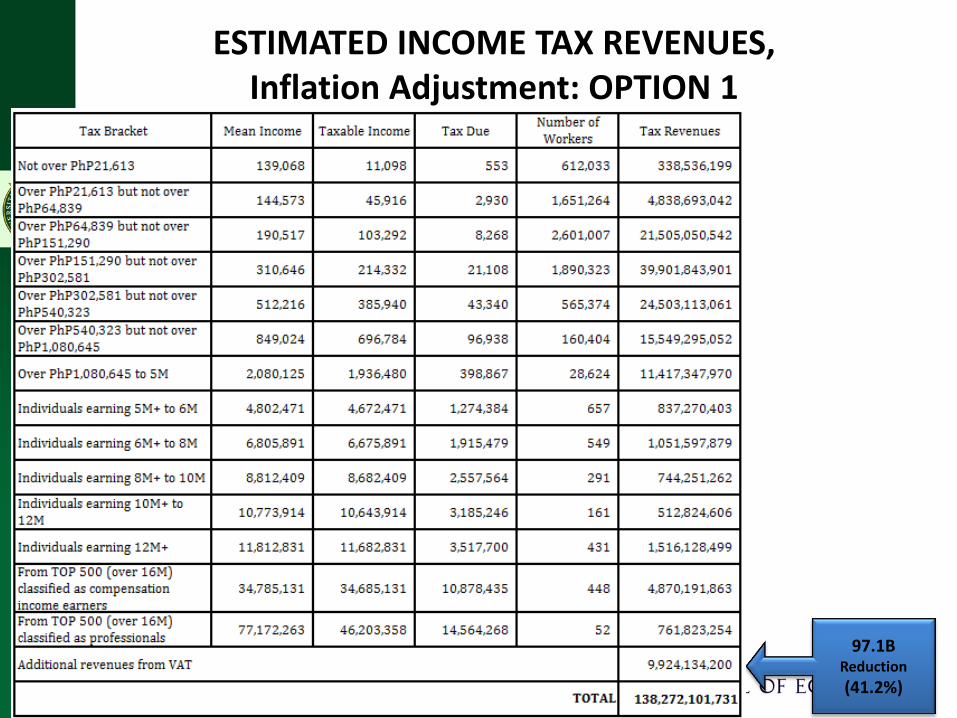
ESTIMATED INCOME TAX REVENUES, Inflation Adjustment: OPTION 1
97.1B Reduction
(41.2%)
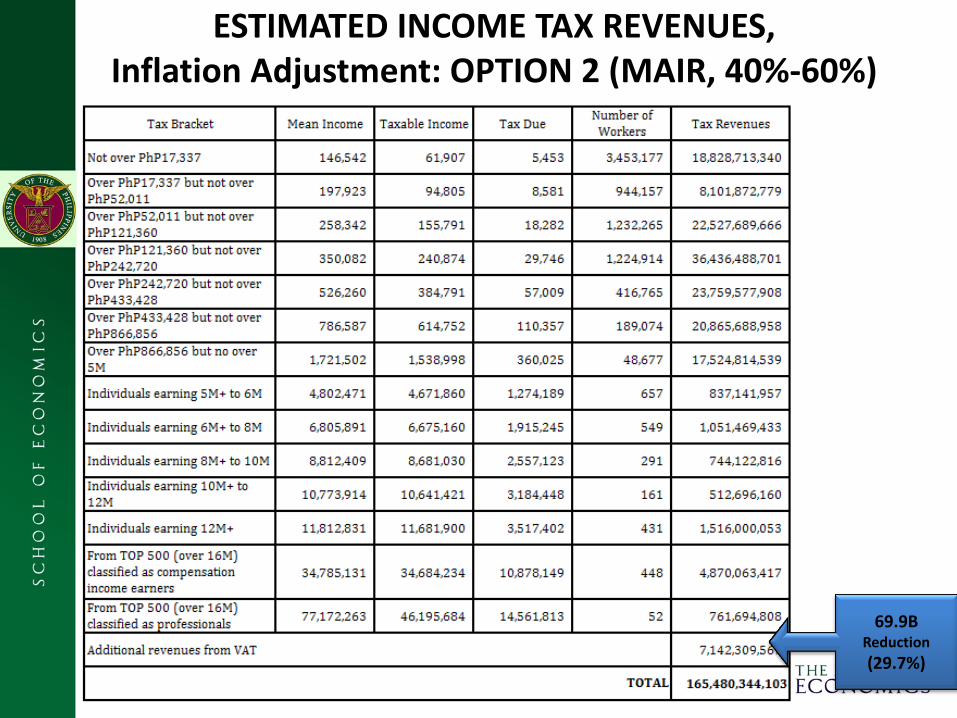
ESTIMATED INCOME TAX REVENUES, Inflation Adjustment: OPTION 2 (MAIR, 40%-60%)
69.9B Reduction
(29.7%)
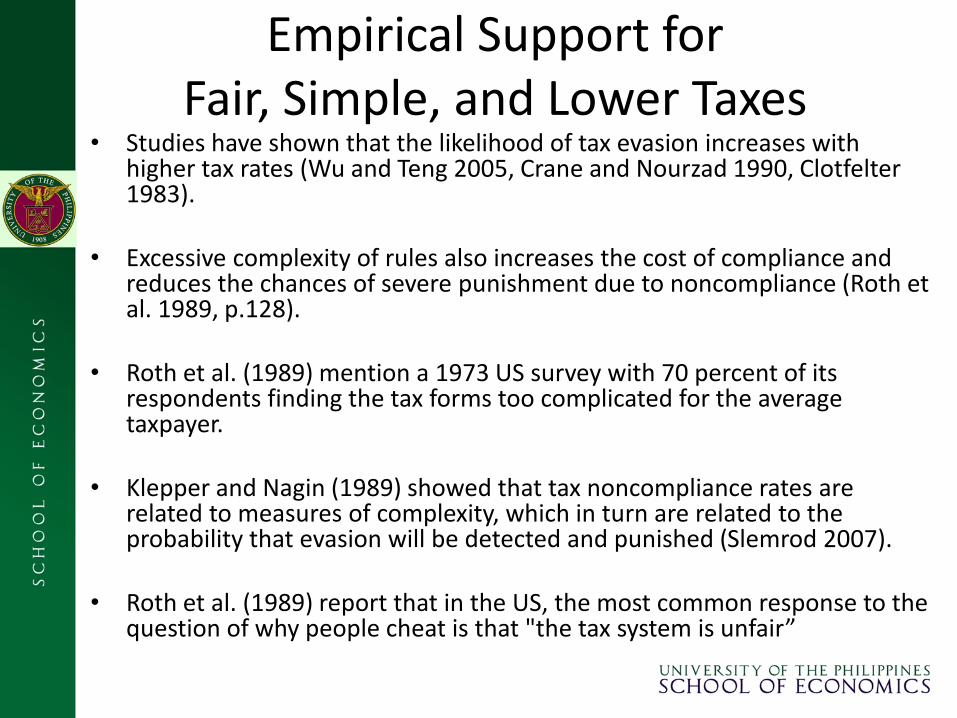
Empirical Support for Fair, Simple, and Lower Taxes
• Studies have shown that the likelihood of tax evasion increases with higher tax rates (Wu and Teng 2005, Crane and Nourzad 1990, Clotfelter 1983).
• Excessive complexity of rules also increases the cost of compliance and
reduces the chances of severe punishment due to noncompliance (Roth et al. 1989, p.128).
• Roth et al. (1989) mention a 1973 US survey with 70 percent of its
respondents finding the tax forms too complicated for the average taxpayer.
• Klepper and Nagin (1989) showed that tax noncompliance rates are
related to measures of complexity, which in turn are related to the probability that evasion will be detected and punished (Slemrod 2007).
• Roth et al. (1989) report that in the US, the most common response to the
question of why people cheat is that "the tax system is unfair”
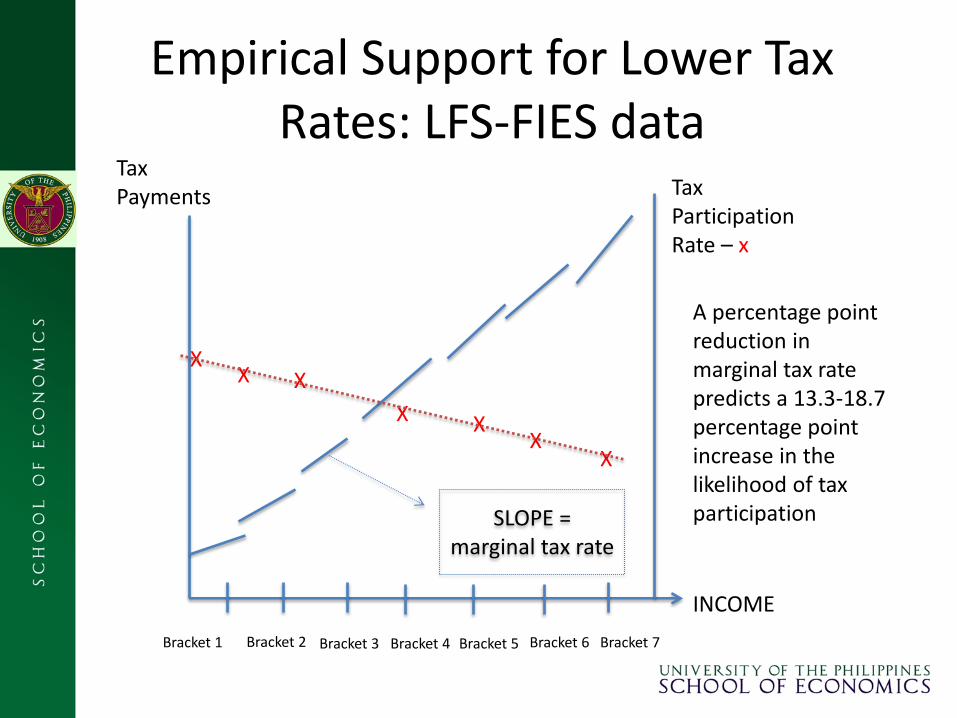
Empirical Support for Lower Tax Rates: LFS-FIES data
Tax Payments Tax
Participation Rate – x
Bracket 1 Bracket 3 Bracket 4 Bracket 5 Bracket 6 Bracket 7 Bracket 2
INCOME
SLOPE = marginal tax rate
X X X
X X X
X
A percentage point reduction in marginal tax rate predicts a 13.3-18.7 percentage point increase in the likelihood of tax participation
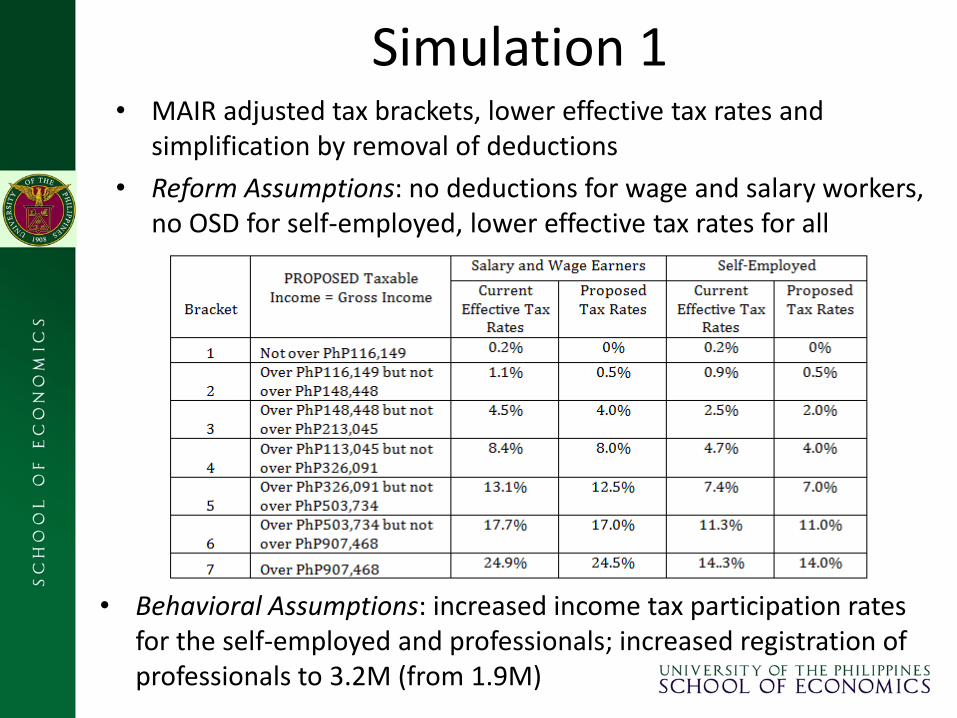
Simulation 1
• Behavioral Assumptions: increased income tax participation rates for the self-employed and professionals; increased registration of professionals to 3.2M (from 1.9M)
• MAIR adjusted tax brackets, lower effective tax rates and simplification by removal of deductions
• Reform Assumptions: no deductions for wage and salary workers, no OSD for self-employed, lower effective tax rates for all
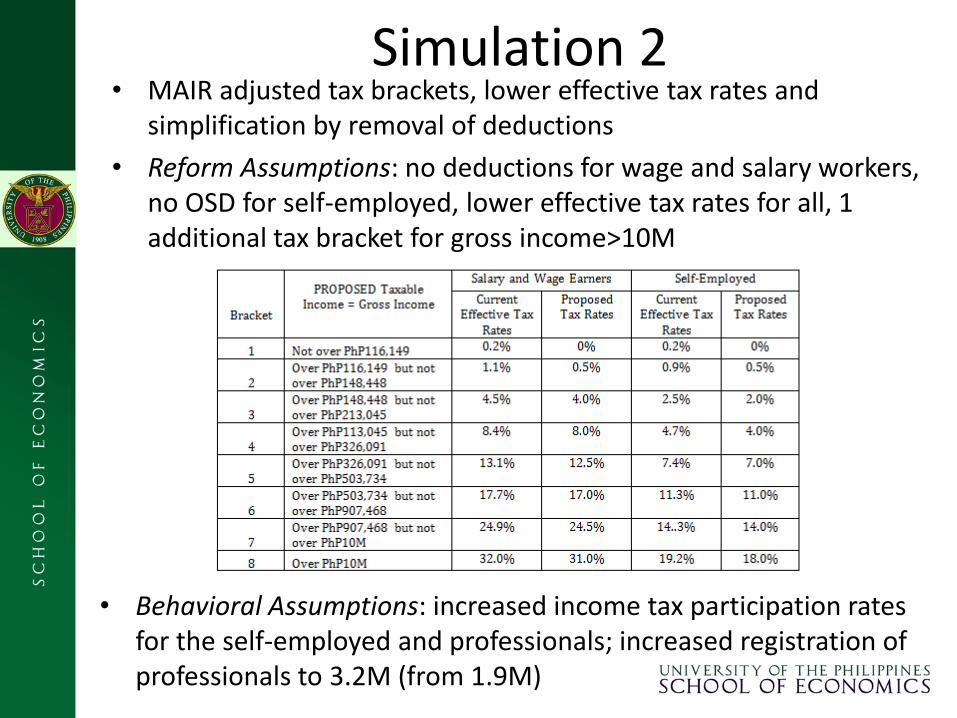
Simulation 2
• Behavioral Assumptions: increased income tax participation rates for the self-employed and professionals; increased registration of professionals to 3.2M (from 1.9M)
• MAIR adjusted tax brackets, lower effective tax rates and simplification by removal of deductions
• Reform Assumptions: no deductions for wage and salary workers, no OSD for self-employed, lower effective tax rates for all, 1 additional tax bracket for gross income>10M
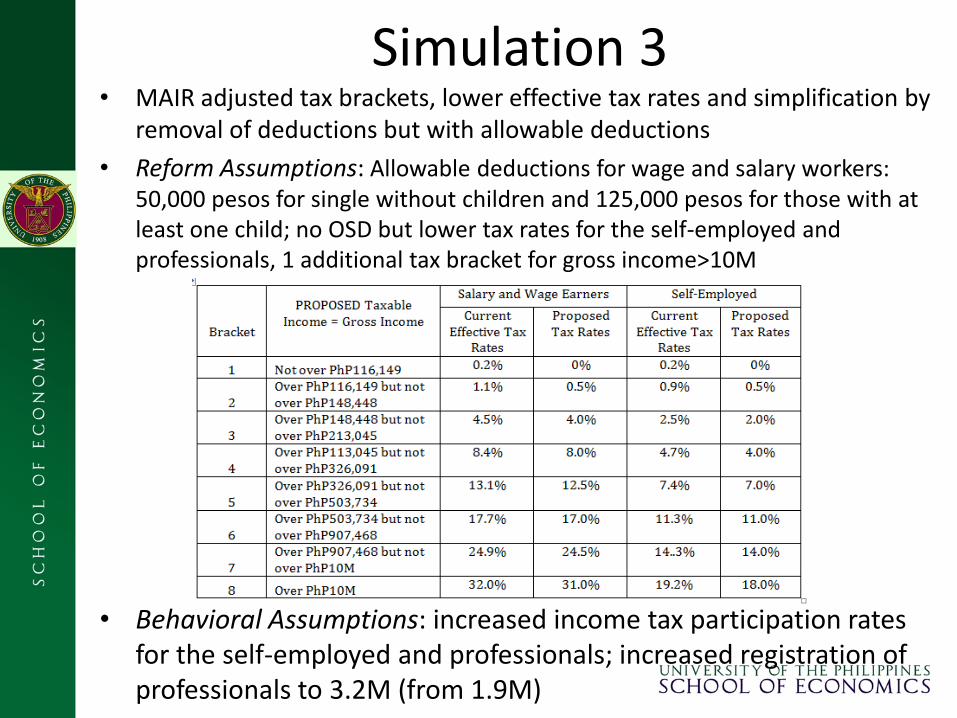
Simulation 3
• Behavioral Assumptions: increased income tax participation rates for the self-employed and professionals; increased registration of professionals to 3.2M (from 1.9M)
• MAIR adjusted tax brackets, lower effective tax rates and simplification by removal of deductions but with allowable deductions
• Reform Assumptions: Allowable deductions for wage and salary workers: 50,000 pesos for single without children and 125,000 pesos for those with at least one child; no OSD but lower tax rates for the self-employed and professionals, 1 additional tax bracket for gross income>10M
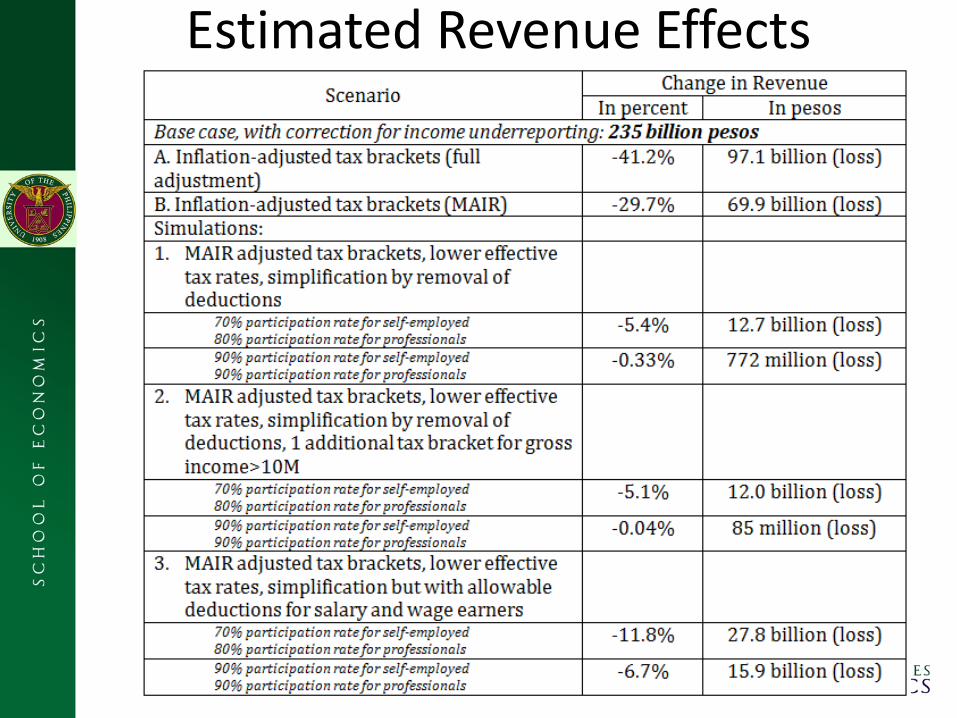
Estimated Revenue Effects
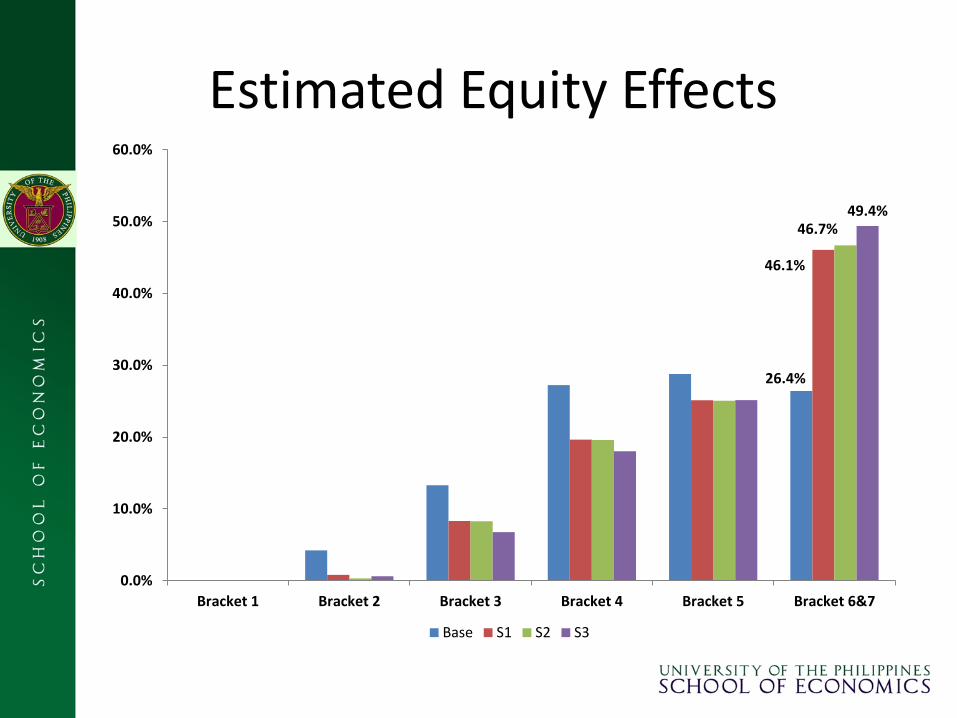
Estimated Equity Effects
26.4%
46.1%
46.7% 49.4%
0.0%
10.0%
20.0%
30.0%
40.0%
50.0%
60.0%
Bracket 1 Bracket 2 Bracket 3 Bracket 4 Bracket 5 Bracket 6&7
Base S1 S2 S3
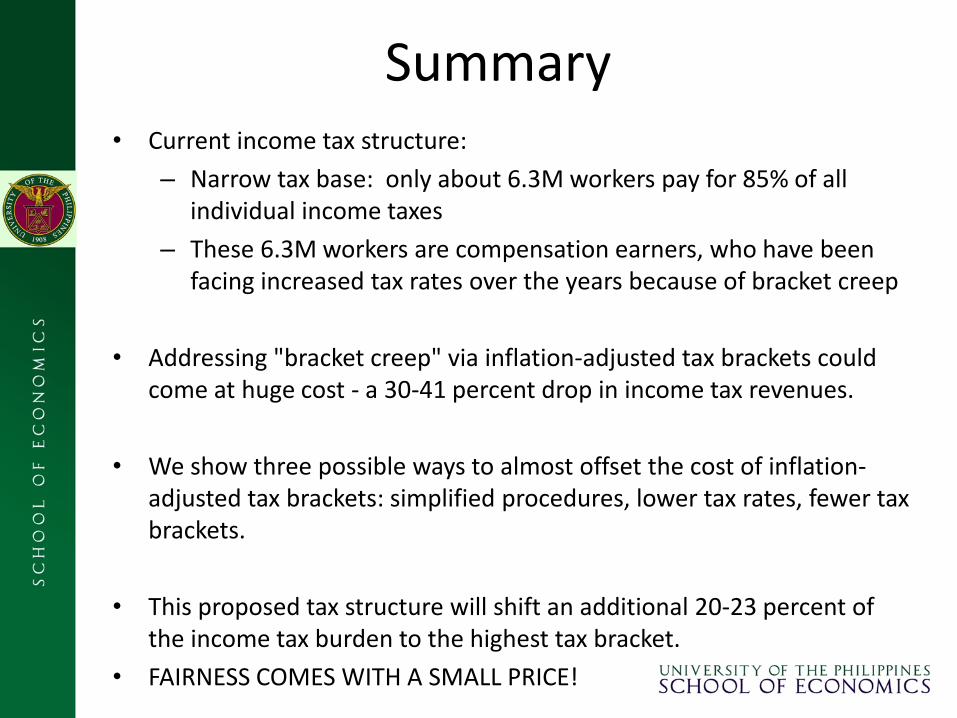
Summary • Current income tax structure:
– Narrow tax base: only about 6.3M workers pay for 85% of all individual income taxes
– These 6.3M workers are compensation earners, who have been facing increased tax rates over the years because of bracket creep
• Addressing "bracket creep" via inflation-adjusted tax brackets could come at huge cost - a 30-41 percent drop in income tax revenues.
• We show three possible ways to almost offset the cost of inflation-adjusted tax brackets: simplified procedures, lower tax rates, fewer tax brackets.
• This proposed tax structure will shift an additional 20-23 percent of the income tax burden to the highest tax bracket.
• FAIRNESS COMES WITH A SMALL PRICE!
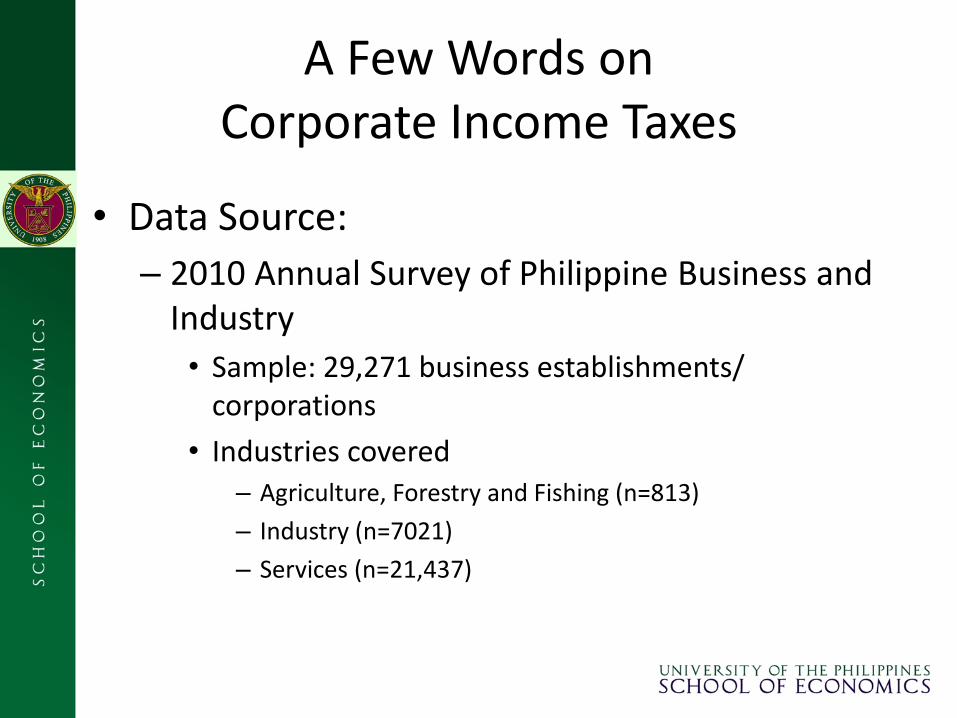
A Few Words on Corporate Income Taxes
• Data Source:
– 2010 Annual Survey of Philippine Business and Industry
• Sample: 29,271 business establishments/ corporations
• Industries covered – Agriculture, Forestry and Fishing (n=813)
– Industry (n=7021)
– Services (n=21,437)
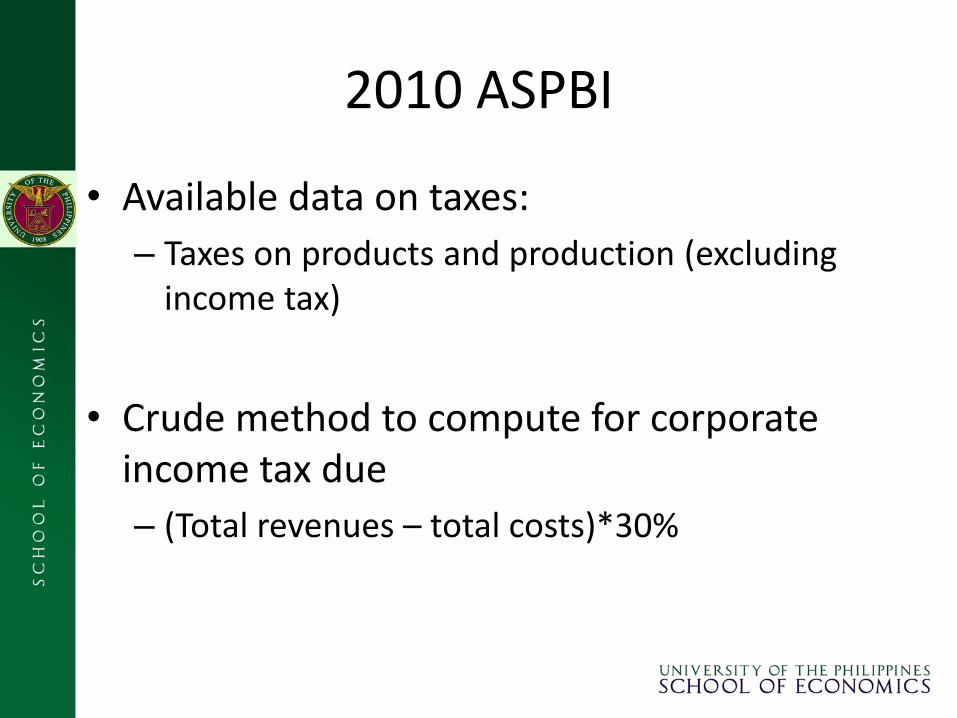
• Available data on taxes:
– Taxes on products and production (excluding income tax)
• Crude method to compute for corporate income tax due
– (Total revenues – total costs)*30%
2010 ASPBI
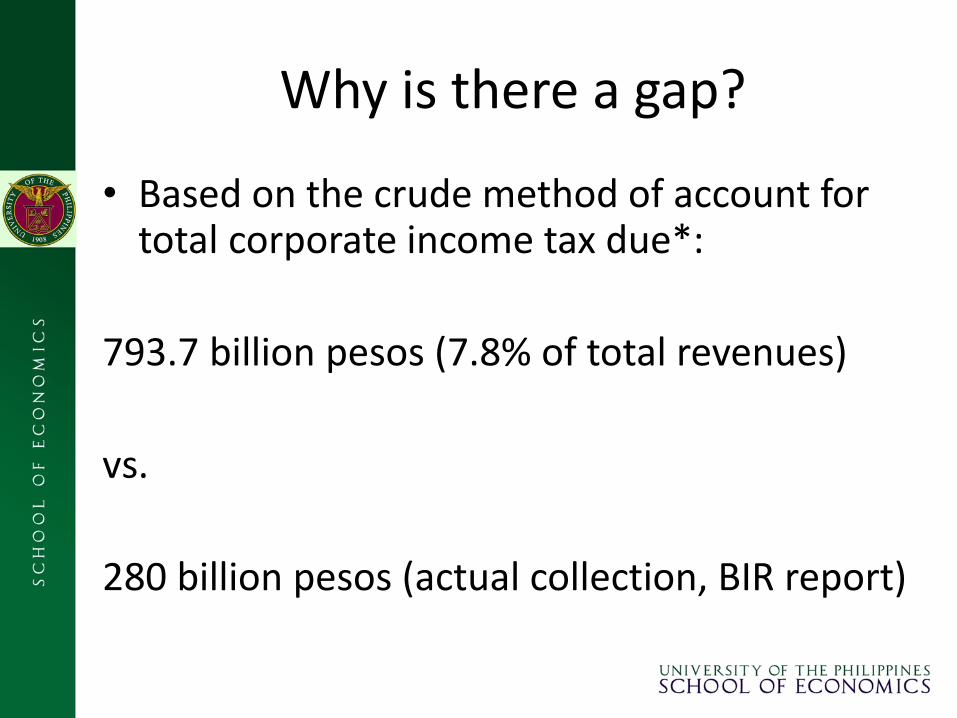
Why is there a gap?
• Based on the crude method of account for total corporate income tax due*:
793.7 billion pesos (7.8% of total revenues)
vs.
280 billion pesos (actual collection, BIR report)
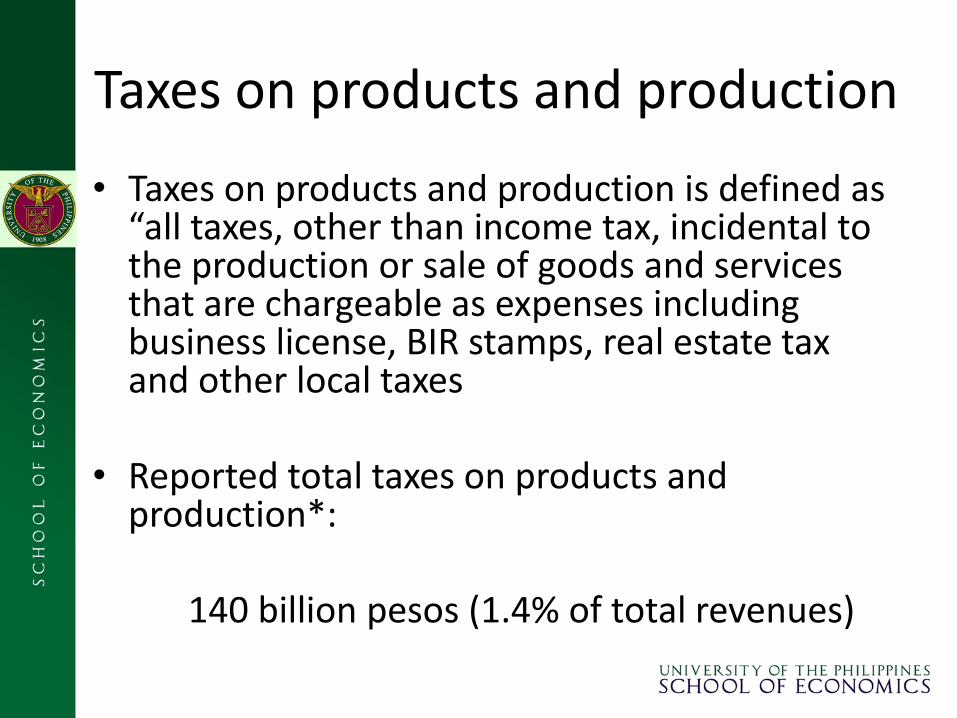
Taxes on products and production
• Taxes on products and production is defined as “all taxes, other than income tax, incidental to the production or sale of goods and services that are chargeable as expenses including business license, BIR stamps, real estate tax and other local taxes
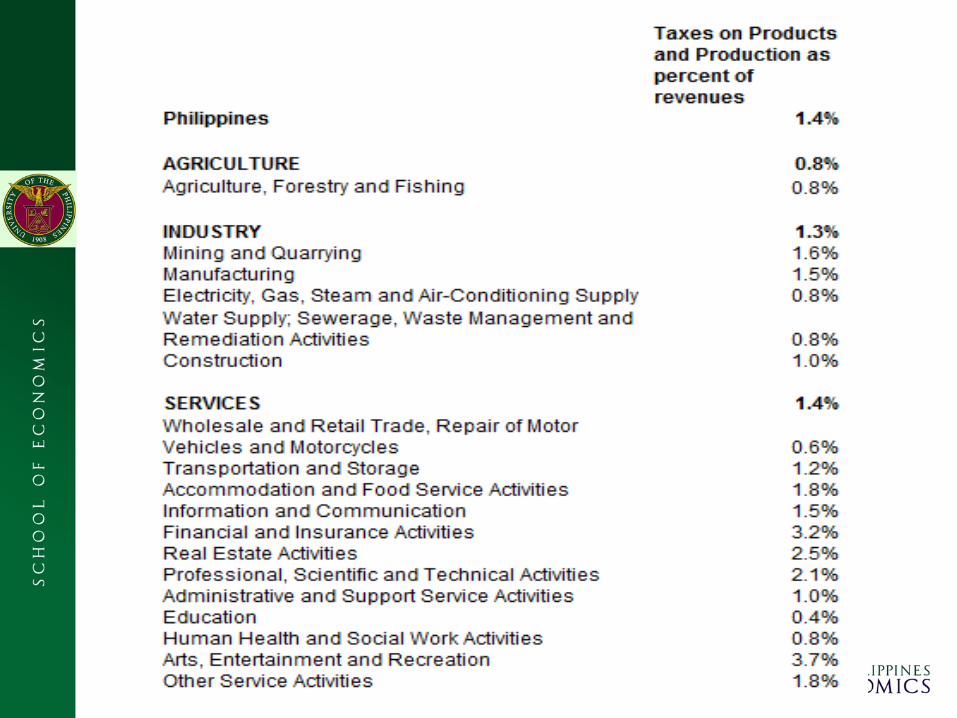
• Reported total taxes on products and production*:
140 billion pesos (1.4% of total revenues)
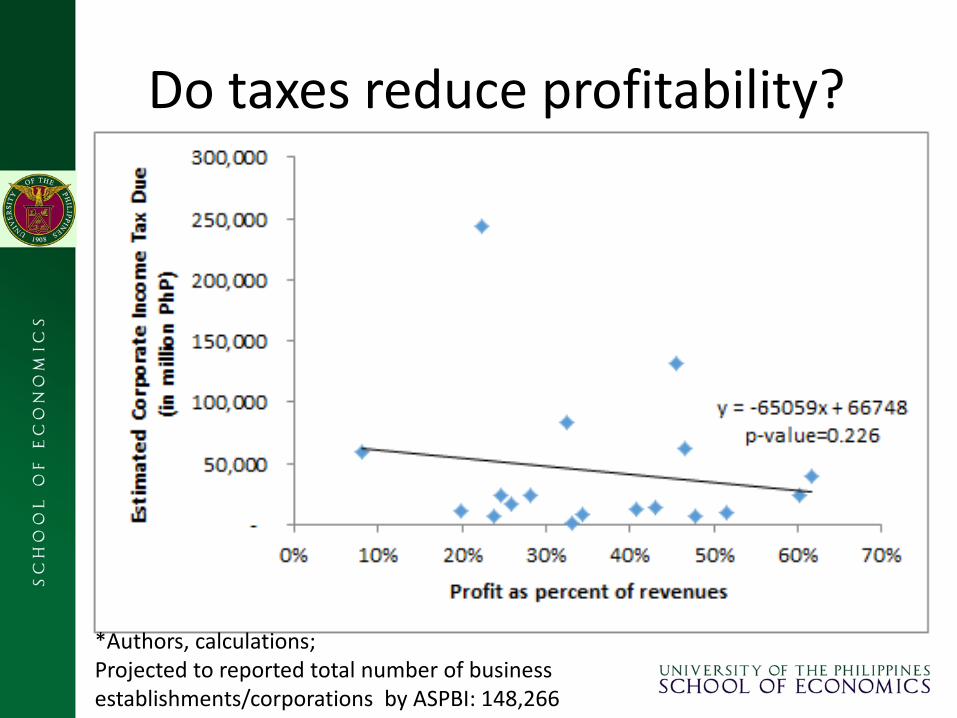
Do taxes reduce profitability?
*Authors, calculations; Projected to reported total number of business establishments/corporations by ASPBI: 148,266
Closing Remarks
• A lot more to study especially: – the incentive effects of income tax changes on labor supply
decisions, saving, fertility – operational research on tax administration – Corporate income taxes and effects on competitiveness of
industries in the light of ASEAN economic integration
• Figures are illustrative; further debate and discussion needed,
especially with the DOF/BIR
• The importance of data, data, data – TAXSIM model of the US uses actual tax records – Constitutional provisions on the prohibition of the use of firm-
level data