Embed Size (px)
Citation preview

Should I Trust You? Earnings Quality as a Signal in Earnout Agreements
Authors:
Annalisa Prencipe Department of Accounting
Università Bocconi [email protected]
Luca Viarengo* Department of Accounting
Università Bocconi [email protected]
This draft: March 2016 Preliminary, please do not quote
Comments Welcome
*Corresponding Author
2
Should I Trust You? Earnings Quality as a Signal in Earnout Agreements
Abstract
This paper aims to test whether past earnings quality of the acquirer serves as a signal of its
trustworthiness in view of the inclusion of an earnout agreement in an acquisition contract. Earnouts
are contractual agreements that link part of the payment of an acquisition to the future performance
of the acquired company. In the US, above 12% of the corporate acquisitions over the period 2002-
2014 include earnout agreements, and this percentage raises to over 20% in some industries.
Typically, earnouts are contractual solutions aimed at bridging valuation disagreement between the
potential acquirer and the seller of the target firm. Prior studies have highlighted earnouts’
usefulness in reducing adverse selection problems and the acquirer’s valuation risk in M&A
transactions. However, from the seller’s perspective, such agreements are subject to moral hazard
issues as the acquirer may not exert effort to achieve pre-determined benchmarks, as originally
contracted. Moreover, many earnouts are based on accounting performance measures, which may
be affected by accounting measurement issues. Consequently, earnouts agreements are often settled
in courts of law.
To reduce the probability of a litigation process, the uncertainty and costs associated with it, we
expect the sellers to explore and investigate the quality type of the acquirer, in particular of its
trustworthiness, prior to entering into an earnout agreement. A possible indicator of trustworthiness
is the acquirer’s past earnings quality. Based on a sample of 9,178 acquisition deals completed in
the US between 2002 and 2014, we find that the acquirer’s past earnings management is negatively
associated to the probability of inclusion of an earnout in acquisition contracts.
Keywords: Earnouts, acquisitions, earnings quality, earnings management.

3
1. Introduction
An earnout is a contractual agreement that links part of an acquisition price to the future
performance of the acquired company. Earnouts are fairly common in acquisition deals. In the US,
over 12% of the corporate acquisitions, during the period 2002-2014, include earnout agreements.
Earnout deals are also significant in terms of nominal value. Over the same period, the annual
average value of earnout deals is close to 3 billion dollars, compared to the annual average of non-
earnout deals of 32.6 billion dollars.
Earnouts aim at bridging a valuation gap between the acquirer and the sellers, thus making the deal
possible. When the negotiating parties are unable to reach an agreement on the value of the target
company, earnouts contracts facilitate the closing of the deal by linking part of the acquisition price
to the certain milestones, such as hitting target levels of performance of the acquired company.
Earnouts are advantageous for acquirers as they allow risk sharing and reduce information
asymmetry that typically affects acquisitions. In other words, earnouts allow to share the valuation
risk between acquirer and sellers, and act as a mechanism of partial verification of the quality of the
target company, as the sellers are willing to accept a deferred payment contingent on the
performance of their firm only if they believe that the agreed-upon benchmarks, which trigger the
additional payment, will be met.
Earnouts are valuable also to the sellers, as they reduce the adverse selection risk for the target firm,
thus allowing to negotiate a higher consideration. However, this benefit is costly, because, after the
closing of the deal, the sellers bear not only the risk that the acquired company will not meet the
pre-specified earnout requirements, but also the risk that the acquirer will behave opportunistically
in the attempt to reduce, or avoid, the contingent payment. Such opportunism can be implemented
by either ‘managing’ the (reported and/or real) accounting results, or by reducing effort made to
reach the target’s benchmarks.
The sellers of the target firm may be aware of the risk of opportunistic behavior by the acquirer,
thereby introducing stringent rules on how to measure performance benchmarks. Such measurement
4
rules are applied in the attempts to reduce possible costly litigations. Nonetheless, legal disputes on
the actual realization of the performance levels stated by the earnout are frequent1. Trevis Laster, a
judge who had to decide on a dispute related to an earnout payment, once said "an earnout often
converts today's disagreement over price into tomorrow's litigation over outcome"2. A survey
conducted by the law firm Morrison & Foerster LLP (2012) on a sample of acquisitions in the high-
tech sector – an industry where earnouts are used the most3 – with over 300 respondents reports that
almost three-quarters of those who have used earnouts claimed that such clauses led to subsequent
disputes or litigation, and nearly one-fifth of respondents estimated there had been post-deal
conflicts over earnouts up to half of the times. In fact, practitioners warn M&A dealers to carefully
define the accounting measures or entries to be included or excluded from the computation of the
earnout4. Recent anecdotal evidence helps clarifying this issue5. In 2007 3M acquired Acolyte
Biomedica, a pharmaceutical company owned by Porton Capital, for an upfront payment of £10.4m
and an earnout of £41m, contingent on net sales targets. In 2011, 3M was sued in the UK Court of
Law by Porton Capital. The former owners of Acolyte Biomedica requested the Courts to rule for
a higher earnout payment than that offered by 3M, accusing 3M for applying a highly
“conservative” recognition approach for recording net sales.6
Apparently, once the earnout acquisition deal is agreed and ownership has passed to the acquirer,
only the target’s former owners face transaction risk. That risk is associated with the acquirer
incentive to either shirk and/or employ tactics to reduce the earnout payment. The target firm is
1 Some examples of earnout disputes ended up in litigation are Comet Systems Inc Shareholders’ Agent v. MIVA Inc, 980 A.2d 1024 (Del. Ch. 2008); Chambers v. Genesee & Wyoming Inc, 2005 WL 2000765 (Del. Ch. Aug. 11, 2005); William J. LaPoint v. AmerisourceBergen Corp, 2007 WL 2565709 (Del. Ch. Sept. 4, 2007), aff’d, 956 A.2d 642 (Del. 2008). 2 Airborne Health, Inc. and Weil, Gotshal & Manges LLP v. Squid Soap, LP, C.A. No. 4410-VCL (Del. Ch. Nov. 23, 2009). 3 Datar, Frankel and Wolfson (2001) report that earnout in the high tech sector are more than one third of the total. 4 See, for example, Fox and Wolf (2010), Crimmins, Gray, Waller, Brown (2010) or Shannon and Reilly (2011). 5 Porton Capital Technology Funds & Ors v 3M UK Holdings Ltd & Anor [2011] EWHC 2895 (Comm), 07 November 2011. 6 The trial, however, ended largely in favor of 3M.

5
likely to be aware of the asymmetric risk inherited with that transaction.7
Following this line of reasoning, we hypothesize that the decision to include an earnout agreement
in an acquisition contract is positively (negatively) related to the acquirer’s past earnings quality
(earnings management).
Therefore, we expect
that, during negotiations, both sides to the negotiations attempt to study the counterparty’s quality,
including its reliability, honesty, and trustworthiness, part of which depends on that party’s past
‘behavior’. One possible signal of reliability and honesty is the firms’ financial reporting practices.
Put differently, the sellers may gain additional insights into the degree of honesty by observing the
acquirer’s financial reporting quality in terms of earnings management, serving as an indication of
trustworthiness. Following Healy and Whalen (1999) definition, earnings management occurs when
managers use judgment in financial reporting and in structuring transactions to alter financial
reports to either mislead some stakeholders about the underlying economic performance of the
company or to influence contractual outcomes that depend on reported accounting numbers. Target
owners may assume that, if the acquirer has the tendency to act opportunistically through earnings
management to affect contractual outcomes, it is likely that it will act opportunistically also after
the acquisition to deceive the target’s owners. Therefore, sellers’ decision whether to accept an
earnout agreement may depend on their perceived probability that the acquirer will use
opportunistic tactics to avoid the contingent payment. The extent to which the acquirer manages
earnings in the past may be used as a signal of such probability, i.e. the greater the earnings
management, the higher the probability of future opportunistic behavior by the acquirer.
We test this hypothesis on a sample of 9,178 deals completed in the US over the period 2002-2014.
In order to capture the quality of earnings of the bidder, we rely on an earnings management proxy,
7 In Appendix A we provide an example of an earnout agreement (Source: https://www.sec.gov/Archives/edgar/data/56978/000119312508162770/dex103.htm).
6
computed using a version of the modified Jones’ model (Dechow, Sloan and Sweeney, 1995). A
lower earnings management proxy indicates a higher level of earnings quality, and therefore a
higher acquirer’s trustworthiness.
While controlling for earnouts’ determinants as reported by prior studies, we provide statistical
evidence of a significantly negative association between the acquirer’s past earnings management
and the likelihood of inclusion of an earnout in an acquisition deal. Overall, our results validate the
hypothesis that the acquirer’s past earnings quality is used as a signal by the seller to evaluate the
former’s reliability.
Our paper contributes to the literature on earnouts by showing that the acquirer’s reporting quality
is used as a signal of the acquirer’s trustworthiness and is a significant determinant of the decision
by the seller to accept such contractual agreements. Our paper contributes also to the literature on
the relation between M&As and earnings management, that so far has mainly been focused on the
managerial incentives to manage earnings around the acquisition time to enhance the results of the
negotiation. As far as we know, our study is the first to show that past earnings quality of the
counterparty is a relevant determinant of the structure of acquisition contracts.
The remainder of the paper is organized as follows. The next section provides a review of the
relevant literature on earnouts and earnings management. In Section 3 we develop our hypothesis,
and in Section 4 we describe the sample and data used in the empirical analysis. In Section 5 we
describe our model, while in Section 6 we report our empirical results. In Section 7 we discuss
some robustness tests. Section 8 concludes.

7
2. Literature review
2.1 Earnouts
Compared to other areas in the disciplines of finance and accounting, research on earnouts is fairly
recent. The seminal papers on the topic focus on the role of earnout contracts as mechanisms to
reduce information asymmetry. Kohers and Ang (2000) analyze acquisitions of US companies over
the period 1984-1996. They report that earnouts are mainly used in acquisitions of private
companies and subsidiaries – due to the absence of a market price which increases the uncertainties
on the value of the target – and in acquisitions of companies operating in the service or high-tech
sectors, characterized by higher uncertainty due to issues related to market demand for the target
company products, human capital and growth opportunities. They also suggest that the likelihood of
using earnout contracts is increasing in the size of the target, while it is decreasing in the size of the
acquirer, and that the likelihood increases when the target firm operates in a different industry than
the acquirer’s. A later study by Datar, Frankel and Wolfson (2001) reaffirm Kohers and Ang’s
results, using international acquisitions over the period 1990-1996.
More recently, Ragozzino and Reuer (2009) analyze acquisitions of private target firms, pointing
out that earnouts are used more frequently when the target is young, and when it operates in an
industry that requires different expertise than that of the acquirer. Barbopulos and Sudarsanam
(2012) focus on UK acquisitions, suggesting that when earnouts are optimally applied to reduce
information asymmetry the acquirer experiences higher market returns compared to non-earnout
transactions. Similar results are found by Kohers and Ang (2000). Using a sample of US deals over
the period 1994-2003, Cain, Denis and Denis (2011) show that the performance parameters used in
earnouts agreement are chosen in order to discover the actual value of the target firm. Cain et al.
also suggest that the time period over which the earnout-related performance benchmark is
measured tends to increase with the relevance of R&D costs and to decrease with the return
volatility in the target’s industry.

8
However, research on accounting or reporting issues related to earnouts is fairly limited. Allee and
Wangerin (2013) study the impact of changes in accounting regulation on the use of earnouts. More
specifically, they analyze the effects of the revised US accounting standards on business
combinations (i.e. FASB ASC 805, formerly SFAS 141(R)), which modified the accounting
recognition and valuation of contingent payments. While there was no obligation to recognize
earnouts in financial statements prior to the revision, as of the fiscal year beginning after December
15, 2008, it is mandatory to value contingent payments at their fair value, and to evaluate these
contingent payments each year until their expiration. Consistent with a financial reporting cost
hypothesis, Allee and Wangerin (2013) report less frequent use of earnouts after the adoption of the
new standard. However, the presence of a high-quality auditor tends to decrease such an effect.
Based on a sample of deals carried out over the period July 1, 2006 – June 30, 2011, Cadman,
Carrizosa, and Faurel (2014) arrive at different conclusions, showing that the percentage of deals
including earnouts did not change significantly after the new standard adoption.
2.2 Earnings management in M&As
Although literature on earnings quality and earnings management is vast, evidence on the relation
between M&A transactions and earnings management is rather limited. Using a sample of stock-
for-stock deals completed between 1985 and 1990, Erickson and Wang (1999) suggest that earnings
are managed upward by acquirers in the quarters preceding the deal, and it is proportional to the
economic benefit for the acquirer, as captured by the relative size of the deal compared to the value
of the acquirer’s capitalization. The rationale behind this type of earnings management is that
acquirers attempt to increase their stock price, thus reducing the relative cost of acquiring the target.
Studying UK acquisition deals, Botsari and Meeks (2008) report similar results. Based on a US
sample of acquisitions during 1992 - 2000, Louis (2004) reports that the effect of pre-acquisition
earnings management on the acquirer’s stock prices is reversed after closing the deal. Indeed, the

9
study reports a negative correlation between the level of earnings management and both short and
the long term post-acquisition returns to the acquirer. Jensen (2005) contends that overvalued firms
tend to inflate earnings and to undertake stock acquisitions to create the illusion of growth to satisfy
market expectations. However, Ball and Shivakumar (2008) claim that, because large corporate
events are characterized by higher than usual litigation and regulatory risk from inflating earnings,
managers should be dissuaded from manipulating their reported earnings around these events.
Gong, Louis and Sun (2008) reports that pre-merger abnormal accruals are a strong determinant of
post-merger lawsuits. The effect of abnormal accruals is significant even after controlling for the
post-merger abnormal return, which suggests that pre-merger earnings management has a first-order
effect on the likelihood of a lawsuit.
To the best of our knowledge, there are no prior studies that examine the acquirer’s earnings
management as an ex-ante signal of its reliability and at its consequences on the structure of
acquisition contracts.
3. Hypothesis development
As mentioned above, if an acquisition contract includes an earnout, the payment of part of the
consideration is postponed to the future, and that part of payment depends on the achievement of
pre-established benchmarks by the target company. Such benchmarks are often based on
performance measures.
The presence of an earnout reverses the “information asymmetry” problem that usually
characterizes acquisitions. While before the closing the sellers have perfect monitoring over their
company, and the bidder faces an information asymmetry problem which can be only partially
unveiled through a due diligence process, the situation is reversed afterwards. Indeed, at the deal
closing the bidder acquires the ownership and the control of the target company. As a consequence,

10
it is now the acquirer who potentially possesses more information on the acquired company, while
the sellers (of the target company) face the issues and the consequences of information asymmetry.
By acquiring control, the buyer becomes in-charge of measuring and reporting the post-acquisition
performance of the acquired company. However, there is a risk of opportunistic behavior aimed at
reducing or avoiding the contractual payment to the sellers. Indeed, the acquirer may affect the
reported performance of the acquired company either by reducing the exerted effort or through
accounting policies aimed at reducing the reported performance. The risk that the acquirer will
engage in opportunistic behavior is increased by the sellers’ limited monitoring ability and lack of
ability to influence the decisions of the acquirer itself.
In case of disagreement about the benchmark outcomes, due to an alleged opportunistic behavior by
the acquirer, the sellers may revert to a judicial court. However, the judges themselves may be
affected by an information asymmetry that an investigation process may not completely resolve.
Also, the judges may be called to decide on matters like the computation of accounting numbers,
which are subject to discretion.
The limited ex-post monitoring and enforcement possibilities, along with the risk to bear
deadweight litigation cost in case of unsuccessful legal trial, will induce the sellers to engage in a
rigorous and accurate ex-ante screening of their counterparties before accepting an earnout
agreement.
We hypothesize that bidder’s past earnings quality is one of the signals employed by sellers to
evaluate the bidder’s trustworthiness. Using earnings management as an inverse proxy for earnings
quality, we expect that a higher level of earnings management in the bidder’s past financial
statements will be assumed by the sellers as an indicator of higher risk of opportunistic behavior
after the closing of the deal. Thus, the sellers would be more inclined to accept an agreement
including an earnout when their counterparty showed low level of past earnings management.
Based on this line of reasoning, we formulate our hypothesis as follows:
11
The likelihood of inclusion of earnouts in acquisition deals is negatively associated with the level of
earnings management in the acquirer’s past financial statements.
In the next section we provide a description of the sample and the data used to test our hypothesis.
4. Data and variable description
4.1. Sample composition
We collect acquisitions data over the period January 1st, 2002 – December 31st, 2014 from Thomson
ONE Banker, provided by SDC. This initial sample is merged with Compustat to retrieve the
relevant accounting information. The final sample includes deals completed during the selected
period, and for which the acquirer is a non-financial public company. Information on the total
consideration paid, market value of the acquirer prior to the acquisition, and the accounting
numbers required for estimating the abnormal accrual measure (i.e. our earnings management
proxy) must be available.
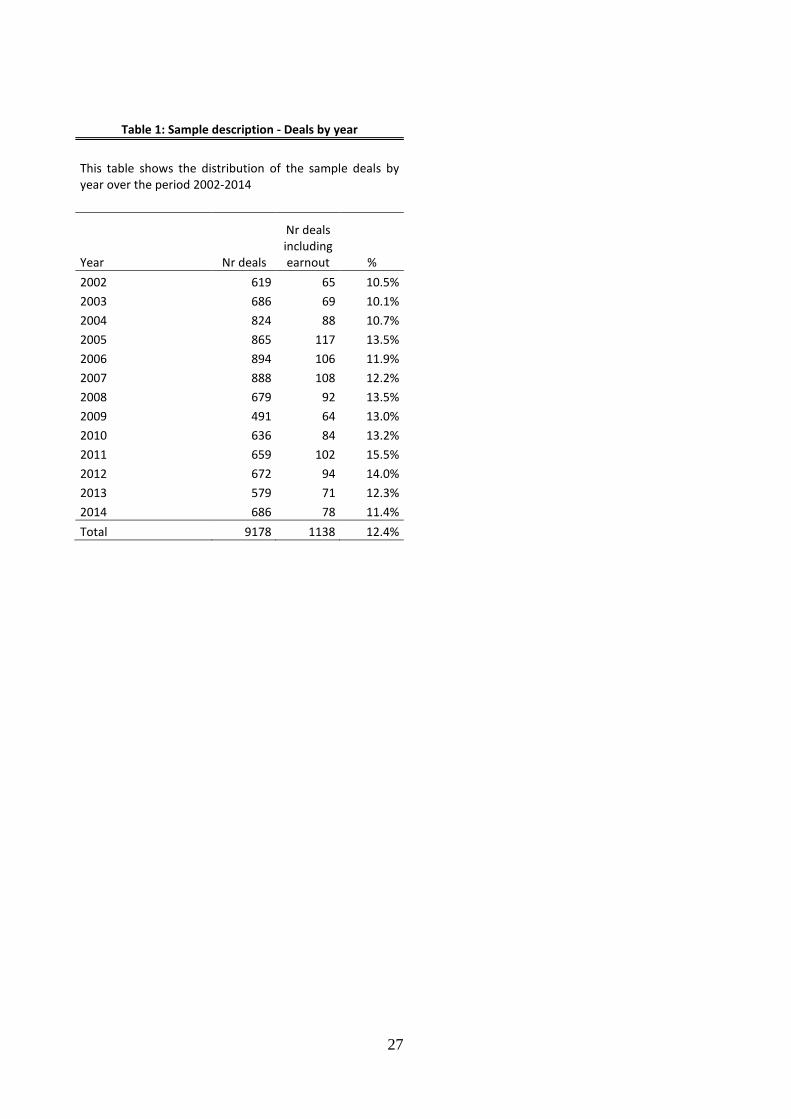
Table 1 provides details on the composition of the sample. The sample comprises 9,178 deals, out
of which 1,138 deals include earnout agreements, i.e. 12.4% of total deals, a significantly higher
proportion than the 9% reported by Cadman, et. al. (2014). There is a substantial variation in the
number of earnout deals over the sample years, from 64 in 2009 to 117 earnout deals in 2005. The
sample exhibits also a variation of the earnout deals proportion over the sample period, from 10.1%
in 2003 to 15% in 2011.
[Insert Table 1 here]
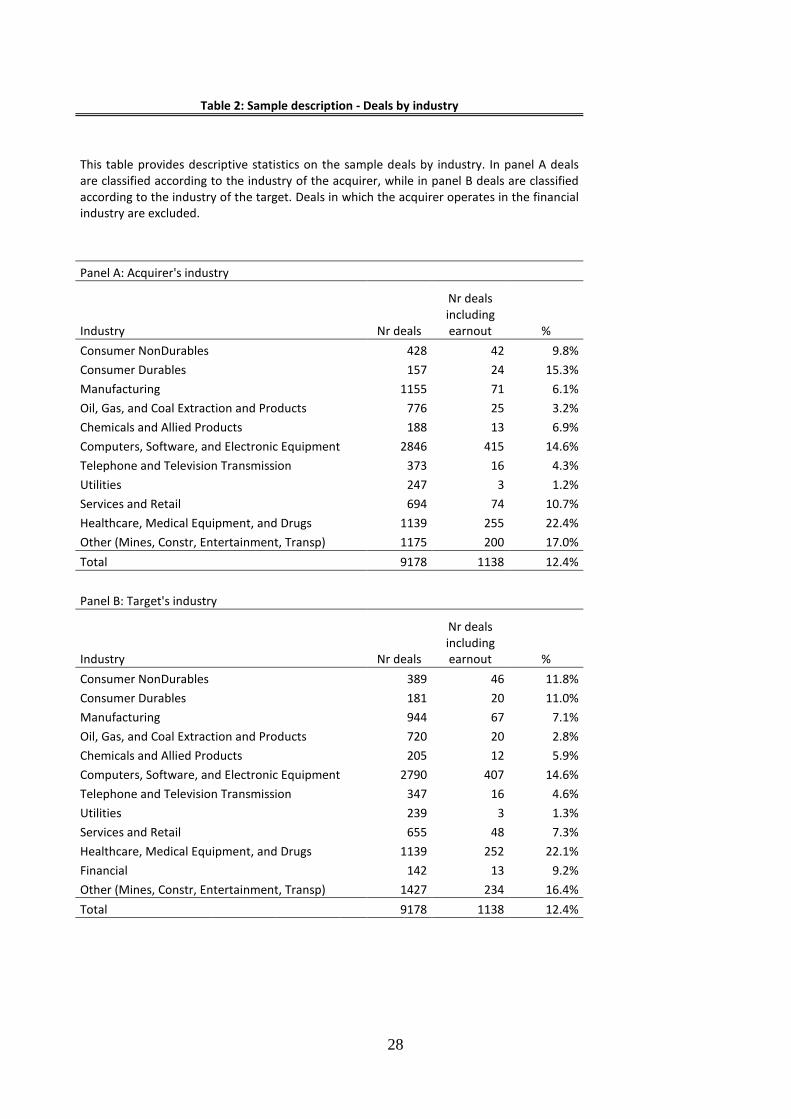
Panel A of Table 2 provides additional descriptives of the sample. Using Fama-French 12 industries
classification, we note a high proportion of earnouts deals in several industries: 22.4% in
healthcare, followed by consumer durables (15.3%) and Computers (14.6%). Panel B of Table 2

12
classifies the sample according to the target’s industry. Also here we note similar industrial
concentration: 22,1% in healthcare, and 14.6% in computers. This sample attributes are similar to
those reported by Datar et al. (2001).
[Insert Tables 2 here]
4.2 Earnings management proxy
To estimate the level of the acquirers’ earnings management we apply the modified-Jones model
as in Dechow et. al. (1995), adding ROA to the model as suggested by Kothari, Leone and Wasley
(2005). We use a cross-sectional specification of the model by time and industry (i.e. quarter or
year, consistently with the definition of the time variable). We follow Peasnell, Pope and Young
(2000) and Jeter and Shivakumar (1999), who suggest that cross-sectional models seem to be better
specified and have higher power than time series estimation models.
The model used to estimate accruals is the following:
ACCRj,t/TAj,t-1 = α[1/TAj,t-1] + β1[(ΔREVj,t - ΔRECj,t)/ TAj,t-1] + β2[PPEj,t/TAj,t-1] + β3ROAj,t
+ εj,t
(1)
Where j and t designate firm and time, respectively, ACCR is the total accruals, ΔREV is the
change in revenues, ΔREC is the change in accounts receivable, PPE designates property, plants
and equipment, ROA is return on assets, and TA stands for total assets.
Quarterly data are used to estimate the model, defining industries according to the Fama-French 12
industry classification. Abnormal accruals are defined as the actual accruals not explained by the
expectation as estimated by model (1), i.e.,
EMj,t = |ACCRj,t/TAj,t-1 – E(ACCRj,t/TAj,t-1)|

13
We apply the absolute abnormal accruals of the acquirer averaged over the four quarters preceding
the acquisition, which we label EM. We opt for an absolute measure because we are more interested
in the reliability of earnings rather than in the direction of their effects. We compute the average of
the four quarters in order to capture a behavior that is consistent in time, rather than occasional.
However, for robustness tests, we resort to variations of EM measures to validate the reported
results.
4.3 Explanatory variables
To test our hypothesis, we perform both a univariate and a multivariate analyses. In the latter case,
we use the model that includes control variables as reported in prior studies, i.e., Kohers and Ang
(2000), Datar et al. (2001), Barbopulos and Sudarsanam (2012), and Cadman et al. (2014). They
suggest that earnouts are more frequently used in deals involving private companies and
subsidiaries, for which the problem of asymmetry of information is relevant, also because of the
absence of a market price for the target. Similarly, earnouts are more likely used for the acquisitions
of targets operating in the service or high-tech industries, due to the high growth opportunities and
relevant uncertainties related to the role of human capital that characterizes these industries. The
presence of a toehold in the target company reduces the probability of an earnout, because the
acquirer possibly possesses information on the target, and thus the valuation risk is less relevant
than when a toehold is absent. Moreover, the likelihood of observing an earnout in a deal is
positively associated with the size of the deal, and negatively associated with the value of the
acquirer. We control also for whether the bidder and the target operate in same industry.8
Our model also controls for known determinants of earnings quality which may also affect the
likelihood of an earnout. In particular, we control for the audit firm size, typically reported to be
8 There is a lack of consensus on the association between diversifying acquisitions, that is, deals in which the acquirer and the target operate in different industries, and the use of earnouts. Focusing on the US market, Kohers and Ang (2000) and Datar et al. (2001), who focus on acquisitions during the 80’s and the 90’s, report a positive association between cross-industry deals and the use of earnouts. Instead, Cadman et al. (2014), who focus on a more recent sample, find opposite results.

14
positively (negatively) associated with earnings quality (earnings management) (e.g., DeAngelo,
1981), and for ROA (e.g., McNichols, 2000; Kothari et al., 2005). In additional tests we control also
for the quality of corporate governance, measured as the proportion of non-executive directors of
the total number of board directors. We add the corporate governance variable for two reasons: it
has been reported to be positively (negatively) associated to earnings quality (earnings
management) (e.g., Beasley, 1996; Klein, 2002), and may be argued that corporate governance
quality is an indicator of the acquirer reliability.
5. The logit model
Since the decision to include an earnout in a deal is a dichotomous variable, a logit model is
employed to test our hypothesis. We define and estimate the following model:
Logit{Prob(Earnoutit=1)} = β0 + β1EMit + Σ βi Controlsit + εit (2)
Our dependent variable is Earnout, a dummy variable that takes value 1 if an earnout agreement is
part of the deal, zero otherwise.
The model includes the following controls:
HighTech = a dummy variable that takes value 1 if the target operates in the high-tech sector, 0
otherwise;
Service = a dummy variable that takes value 1 if the target operates in the service industry, 0
otherwise;
DealValue = log of the transaction price of the deal, including the earnout;
MVacquirer = the log of the market value of the acquirer prior to the deal announcement;
Subsidiary = a dummy variable that takes value 1 if the target is a subsidiary, 0 otherwise;
Private = a dummy variable that takes value 1 if the target is a private company, 0 otherwise;

15
SameIND = a dummy variable that takes value 1 if bidder and target have the same two-digits SIC
code;
Toehold = a dummy variable that takes value 1 if the bidder holds a stake in the target before the
acquisition, 0 otherwise;
Stock = a dummy variable that takes value 1 if the upfront payment is at least partly in stocks, 0
otherwise;
ROA = the return on assets of the acquirer calculated as the ratio of net income to total assets in the
quarter (year) preceding the acquisition ;
Big4 = a dummy variable that takes value 1 if the bidder’s financial statements are audited by one
of the big 4 audit firms, 0 otherwise;
CorpGov = Acquirer’s ratio of non-executive directors over total number of directors at the
acquisition time.
We also include year fixed effects to control for possible trends or changes in the regulatory or
economic environment over time.
6. Empirical analysis
6.1 Descriptive statistics
Table 3 provides descriptive statistics for the variables used in our study. Panel A compares the
variables’ statistics between earnout and non–earnout deals. The proportion of deals in which the
target is a high-tech or a service company is significantly higher in the earnout group (34.6% vs.
22.7%, and 40.0% vs. 31.9%, respectively), consistent with prior literature. The table also exhibits
that earnout transactions tend to be characterized by smaller-size acquirers (7.27 vs. 6.46,
respectively). Moreover, when the acquisition involves contingent payments, the frequency of
private companies is much higher than for the non-earnout sample (75.9% vs. 46.9%, respectively).
The opposite seems to hold if we look at the proportion of subsidiaries (22% vs. 37.1%). However,

16
filtering out the relative presence of private companies, we notice that among non-private
companies the frequency of subsidiaries is higher in deals involving earnouts. Earnout deals seem
also to be characterized by a higher frequency of transactions in the same industry (63.9% vs.
60.7%), and by a higher proportion of acquisitions that include common stocks in the upfront
payment (26.4% vs. 18.4%, respectively). The frequency of bidders having a toehold in the target
company, instead, is significantly lower for earnout deals. Finally, if we compare the average value
of our earnings management variable, we observe that it is rather similar in earnout and non-earnout
deals (0.043 vs. 0.045, respectively).
Panel B provides the Pearson correlation matrix. The first column of the table reports correlations in
line with prior literature. Indeed, earnouts are positively correlated with high-tech and service
industries, with the target being a private firm and (weakly) with the target being in the same
industry as the acquirer. Earnouts are negatively correlated with the deal value and the market value
of the acquirer, with the target being a subsidiary, and with the acquirer having a toehold in the
target., Earnouts seem to be (weakly) negatively correlated with the acquirer’s auditor size and its
corporate governance measure. Such correlation, however, is most probably associated with the
high correlations of these variables with the acquirer’s size (MVacquirer), as shown in column 6.
The table reveals that earnings management (EM) is significantly negatively correlated to the
acquirer’s size (-0.337), with auditor size (-0.296), with ROA (-0.274) and the corporate
governance variable (-0.110). These correlations are in line with those reported in the earnings
management literature. The panel also indicates that earnings management is positively correlated
with cases where deals include a payment partly with stocks (0.115), consistent with the extant
literature (e.g., Erickson and Wang, 1999; Botsari and Meeks, 2008).
[Insert Table 3 here]
17
6.2 Results
The results of our main logit regression models are reported in Table 4.
The table provides coefficients values of four versions of Model (2), where different controls are
applied as explanatory variables. These regressions are based on 9,178 acquisitions and all four
regressions are significant with all Chi2 values above 500.
Model 1 is similar to the models applied in prior studies, with the inclusion of the auditor size
(Big4) as an additional control variable. The regression coefficient of Big4 is insignificant, possibly
due to the lack of variation in the sample, once considered its high correlation with the acquirer
size. The variable SameIND, which controls for deals done in the same industry, is found
insignificantly different from zero. This is not surprising as prior literature report conflicting results
regarding this variable. All other variables in the model are consistent with prior findings. In
particular, the negative coefficient of the acquirer size (MVacquirer) (-0.191) suggests that large
firms are less inclined to use earnouts in acquisition deals, perhaps because they can likely afford
higher misvaluation risk. The probability of a deal to include earnouts is increasing with the target
being in the service (0.638) or high-tech (1.046) industries, with deal size (0.102), with the target
being either private firms (2.507) or subsidiaries of other firms (1.589). All these results are
consistent with those reported by Kohers and Ang (2000), Datar et al. (2001), Barbopulos and
Sudarsanam (2012), and Cadman et al. (2014).
Model 2 includes the earnings management variable (EM). Consistently with our hypothesis, the
coefficient is significantly negative (coefficient of -1.472, with s.e. of 0.549), suggesting that the
higher the acquirer’s earnings management in the four quarters preceding the deal, the less likely
the sellers to accept an earnout agreement to be included in the transaction. In Model 3 we control
also for the presence of a toehold. We find that it is negatively associated with the probability of
inclusion of an earnout, significant at the 10% confidence level (coefficient of -0.376 and s.e. of
0.200). In model 4 we include the variable Stock, which captures the fact that part of the upfront
payment is made in stocks. The latter variable shows a significant positive coefficient (0.268, with
18
s.e. of 0.0843), suggesting that common stocks and earnouts tend to be used as complementary tools
for risk sharing purposes. In both Models 3 and 4, the coefficient on the earnings management
variable remains negative and significant, and very close in their magnitude to that in Model 2. This
empirical evidence supports our expectation that the sellers do a ‘reverse due diligence’ on the
acquirers, to screen the acquirer trustworthiness.
In Table 5 we include an additional control for the corporate governance quality, proxied by the
ratio between non-executive directors and total number of board members. The idea behind this
inclusion is that the quality of the firm corporate governance may be considered as a ‘corporate’
quality sign. Therefore it may serve either as a substitute or as a complement to the earnings
management signal. The inclusion of this control reduces the sample size to 7,831 deals.
Nonetheless, the results are very similar to those reported in Table 4. The corporate governance
coefficient is negative but it lacks statistical significance, thus it does not seem to affect the
likelihood of the inclusion of an earnout in the acquisition contract.
[Insert Table 4 and Table 5 here]
In the next section, we test the robustness of our results to various definition of earnings
management (applying variations of window period estimations), and to stricter requirements on the
sample selection process.
7. Robustness tests
7.1 Changing the time horizon for the measurement of earnings management
In our main analysis we measure earnings management over the four quarters preceding the
acquisition. Prior literature suggests that acquirers have the incentive to manage earnings upwards
in the quarters preceding the deal in order to increase the stock price of their company, and thus to

19
reduce the cost of acquiring the target (e.g., Erickson and Wang, 1999; Botsari and Meeks, 2008).
Therefore, the quarters immediately preceding the acquisitions may be considered a good indicator
of the tendency to carry out earnings management in the presence of a contractual incentive.
However, one may question the sellers’s ability to observe the last quarter’s results before deciding
on the inclusion of an earnout in the agreement. In order to address this concern, we first repeat our
logit models excluding the last quarter, i.e. the quarter just prior to the completion of the deal. Our
results (untabulated) remain qualitatively unchanged, confirming that earnings management is
negatively related to the likelihood of inclusion of an earnout in the acquisition contract. We repeat
these analyses after calculating our test variable as the average of the earnings management proxy
over a longer time horizon, i.e. the six quarters preceding the deal (both including and excluding the
last quarter). The results (untabulated) remain qualitatively unchanged.
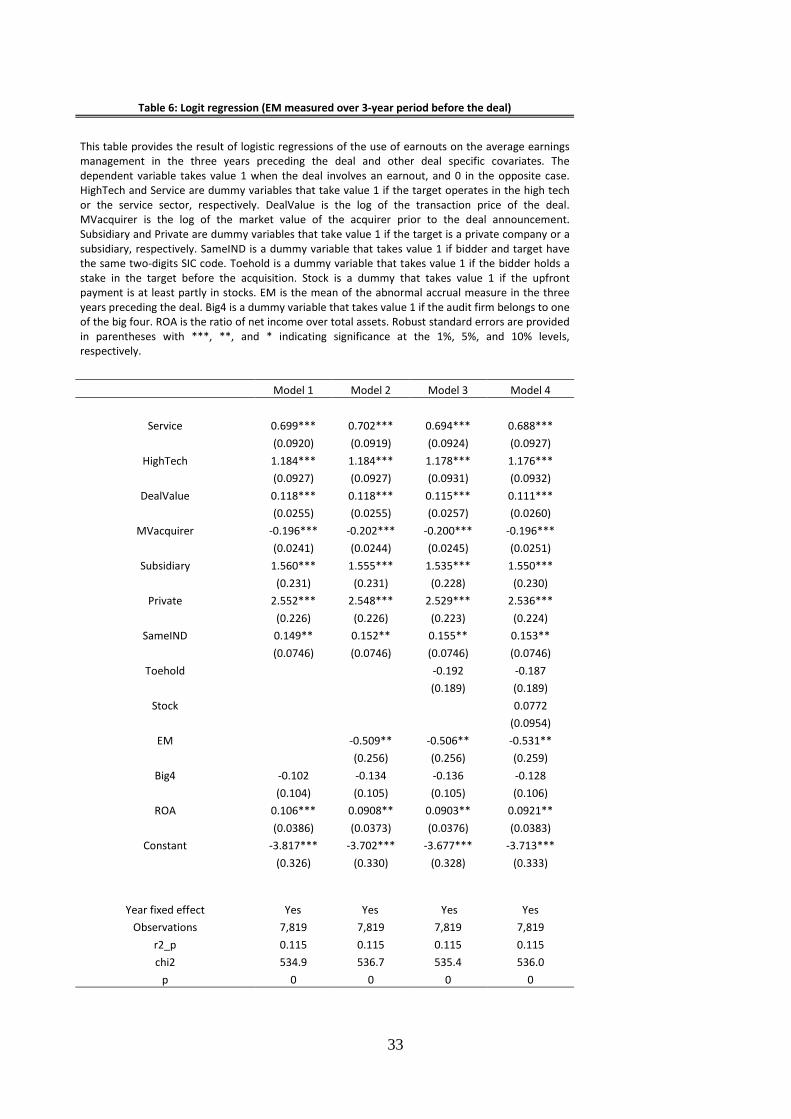
In further tests, we check whether using annual data to measure the attitude to manage earnings by
the bidder alters our main findings. Table 6 reports the results of the logit regressions when earnings
management is estimated using annual data over a 3-year period preceding the deal. Basically, these
revised definitions of earnings management measures do not alter our reported results. The earnings
management variable is found to be negatively and significantly related to the likelihood of
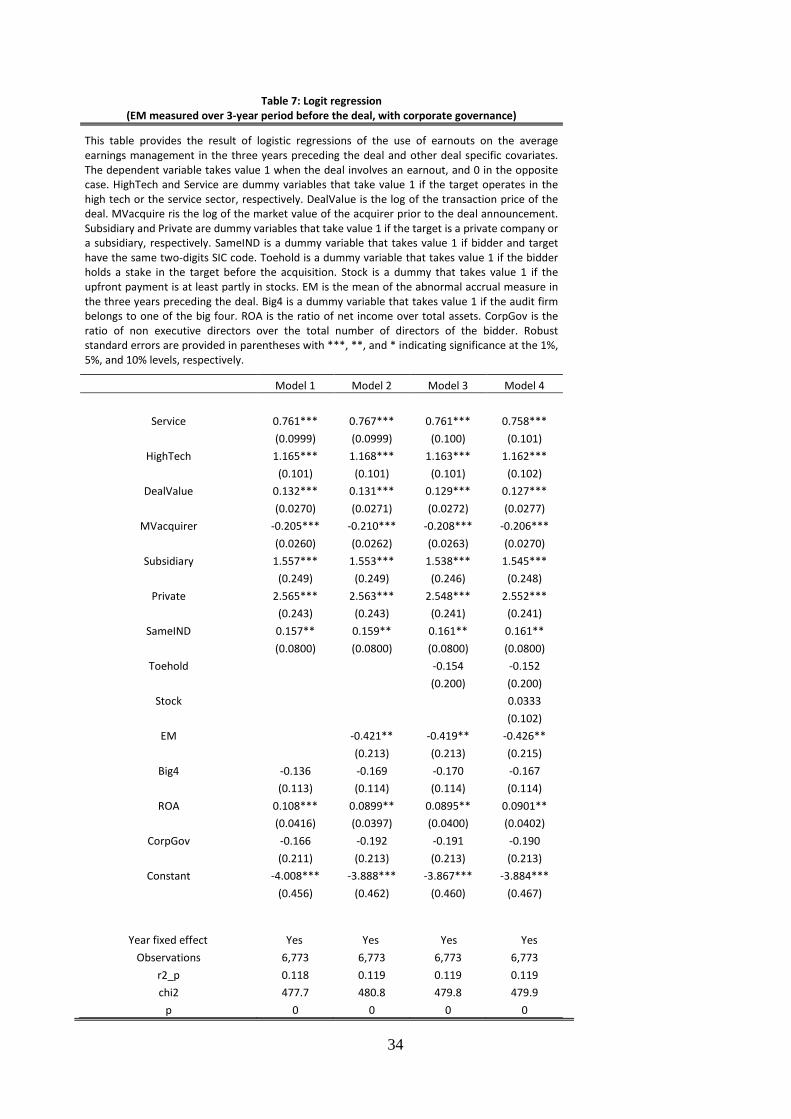
inclusion of an earnout in the contract (-0.509, s.e. 0.256). Similar results are shown when we also
control for the corporate governance quality (Table 7).
[Insert Table 6 and Table 7 here]
Our main findings (untabulated) hold also when we exclude the last year prior to the acquisition
and, therefore, consider only the earnings management carried out in years t-2 and t-3.

20
7.2 Propensity Score Matching
In order to further check the validity of our hypothesis, we compute a t-test for the differences in the
mean level of earnings management for the group of deals in which earnouts are included and for
those in which they are not, using a Propensity Score Matching procedure (PSM), as described in
Becker and Ichino (2002). The idea behind this methodology is to compare the level of earnings
management (our outcome variable) between a group of treated subjects (earnout users) and a group
of non-treated subjects (non-earnout users) selected as similar as possible to the treated
observations. We follow this procedure to reduce the possibility that the comparison of subjects that
are inherently different could bias the results.
The propensity score is computed taking into consideration the following deal characteristics: the
acquirer size, defined as total assets, the deal value , that is the total value of the transaction, the
target operating in the high tech or service industry, and a dummy variable for the period before the
financial crisis of 20079. The model is parsimonious, yet it satisfies the balancing hypothesis10
.
Moreover, in order to improve the quality of the match, only the observations belonging to the
common support of the treated and non-treated are used in the comparison.
[Insert Table 8 here]
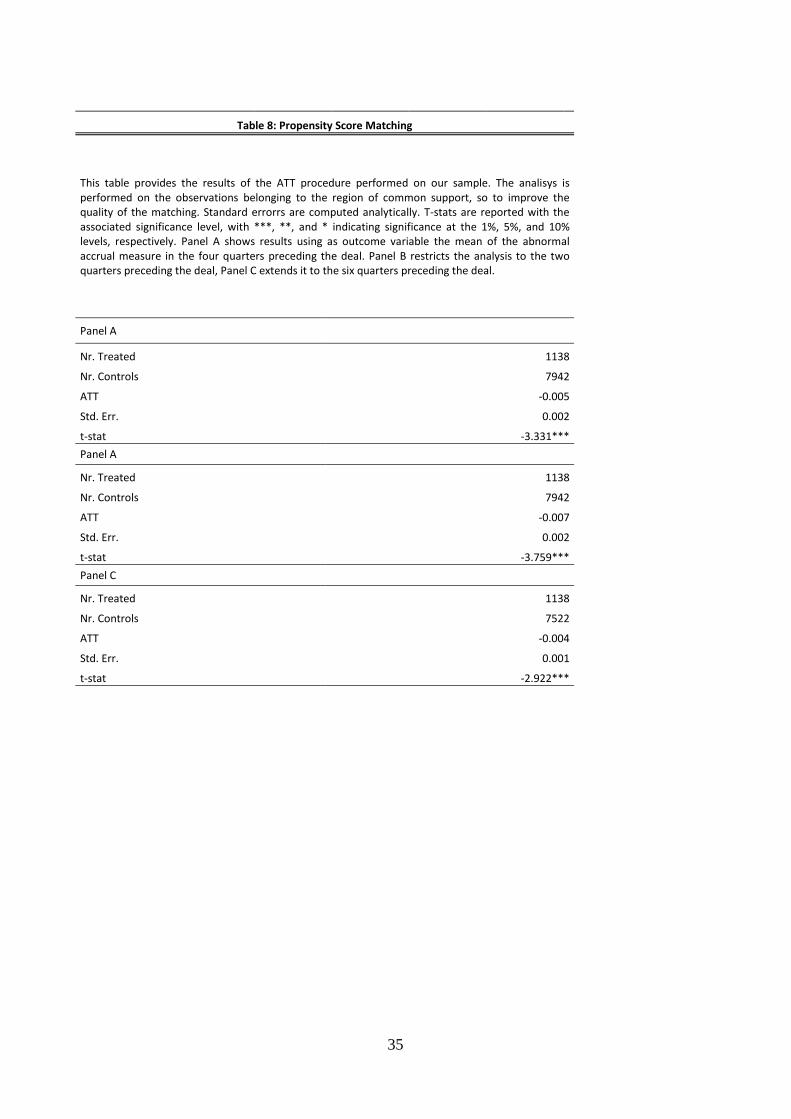
The results of the PSM analysis, performed using the nearest neighbor method, are shown in Table
8. The level of earnings management is estimated over the four quarters preceding the deal, as in
our main analysis. Consistently with our hypothesis, the acquirers of deals in which earnouts are
9 The size of the acquirer and the size of the deal are defined in terms of terciles of their sample distribution. Each observation is assigned to one of three groups: high, medium or small bidder size, and high, medium or small deal size. This partitioning is used for the computation of the propensity score. 10 If the balancing hypothesis is satisfied, treated observations and non-treated observations with the same propensity score share the same distribution of observable and unobservable characteristics.

21
used show a lower level of earnings management compared to their matched peers (i.e. non-users).
The difference is significant at the 1% level (t-values of -3.759 to -2.922).
7.3 Introducing additional filters
In line with Datar et al. (2001) and Cadman et al. (2014), in our main analyses we did not impose
any restriction on the percentage of shares acquired in the deal. By using more restrictive filters on
the sample, however, our results remain qualitatively the same.
[Insert Tables 9 and 10 here]
Table 9 reports the results obtained considering only the subsample of deals in which at least 20%
of the shares of the target is acquired. In a setting like the US, in which ownership is generally
fragmented, such percentage is usually sufficient to gain control on a company. The results in terms
of signs and levels of significance remain substantially the same.
In table 10 we apply an even more stringent filter, as we consider only deals in which the toehold in
the target before the acquisition is lower than 50%, and the ownership of the acquirer after the
acquisition is at least 90%. Our main results confirm to be robust, suggesting that past earnings
management of the acquirer is negatively associated with the probability of inclusion of an earnout
in the deal.
8. Conclusions
Earnouts are contractual agreements that condition part of the payment of an acquisition to the
future performance of the acquired company.
22
Earnouts are beneficial for acquirers as they reduce the information asymmetry that typically affects
acquisitions, and act as a selection mechanism on the quality of the target company. They are
advantageous also to the sellers, as they reduce the risk of adverse selection for the target company,
thus allowing to negotiate a higher consideration. However, this benefit comes at a price, because,
after the closing of the deal, the sellers bear not only the risk that the acquired company will not
meet the earnout requirements, but also the risk that the acquirer will act opportunistically to
reduce, or even avoid, the accounting based benchmarks for determining the contingent payment.
Such opportunism can be implemented by either managing the accounting numbers, or by reducing
the effort in directing the target’s activities.
Legal disputes on the actual realization of the performance levels stated by the earnout are indeed
frequent. However, anecdotal evidence indicates that the risk to lose the legal case and to bear the
cost of the litigation for the sellers is not trivial.
Given the above-mentioned risks related to the ex post enforcement of earnout contracts, sellers
who intend to agree for earnout contracts are likely to engage in ex-ante screening of the
trustworthiness of their counterparties. To this purpose, past earnings quality of the acquirer may
be used by the sellers as a signal of the former’s reliability. Therefore, we hypothesize that the
decision to include an earnout agreement in an acquisition contract is positively related to the
acquirer’s past earnings quality.
We test this hypothesis on a sample of 9,178 deals completed in US between 2002 and 2014. In
order to capture the quality of earnings of the acquirer, we rely on the absolute value of the earnings
management proxy, computed using a variation of the modified Jones’ model (Dechow et al.,
1995). A lower absolute value of our earnings management proxy indicates a higher level of
earnings quality, and therefore of higher level of trustworthiness.
After controlling for the determinants that prior studies have associated with the use of earnouts,
through a logit model we show that there is a negative and significant relation between earnings
management and the likelihood of inclusion of an earnout in an acquisition deal. Overall, our results

23
validate the hypothesis that the acquirer’s past earnings quality is used as a signal by the seller to
evaluate the former’s reliability.
Our paper contributes to the literature on earnouts by showing that the bidder’s trustworthiness is a
significant determinant of the decision by the seller to accept such contractual agreements. Our
paper contributes also to the literature on the relation between M&As and earnings management,
that so far has mainly been focused on the managerial incentives to manage earnings around the
acquisition time to improve the results of the negotiation. Our study is the first to show that past
earnings quality of the counterparty is a relevant determinant of the structure of acquisition
contracts.

References
Allee, K., Wangerin, D. (2013). Auditors’ Role in Financial Contracting: Evidence from SFAS 141
(R). Working paper.
Ball, R., Shivakumar, L. (2008). Earnings quality at initial public offerings: managerial
opportunism or public-firm conservatism. Journal of Accounting and Economics, 45, 324-
349.
Beasley, M. S. (1996). An Empirical Analysis of the Relation between the Board of Director
Composition and Financial Statement Fraud. The Accounting Review, 71, 443–465.
Becker, S. O., Ichino, A. (2002). Estimation of average treatment effects based on propensity
scores. The Stata Journal 2(4).
Barbopoulos, L., Sudarsanam, S. (2012). Determinants of earnout as acquisition payment currency
and bidder’s value gains. Journal of Banking & Finance, 36(3).
Botsari, A., Meeks, G. (2008). Do acquirers manage earnings prior to a share for share bid?.
Journal of Business Finance & Accounting, 35(5‐6).
Cadman, B., Carrizosa, R., Faurel, L. (2014). Economic Determinants and Information
Environment Effects of Earnouts: New Insights from SFAS 141 (R). Journal of Accounting
Research, 52(1).
Cain, M. D., Denis, D. J., Denis, D. K. (2011). Earnouts: A study of financial contracting in
acquisition agreements. Journal of Accounting and Economics, 51(1).
Crimmins, P. M., Gray, B, Waller, J., Brown, M. (2010). Earn-outs in M&A Transactions. The
M&A Journal, 10(10).
Datar, S., Frankel, R., Wolfson, M. (2001). Earnouts: The effects of adverse selection and agency
costs on acquisition techniques. Journal of Law, Economics, and Organization, 17(1).
DeAngelo, L.E. (1981). Auditor size and audit quality. Journal of Accounting and Economics, 3,
183-199.

25
Dechow, P. M., Sloan, R. G., Sweeney, A. P. (1995). Detecting earnings management. Accounting
Review, 70(2).
DuCharme, L. L., Malatesta, P. H., Sefcik, S. E. (2004). Earnings management, stock issues, and
shareholder lawsuits. Journal of financial economics, 71(1).
Erickson, M., Wang, S. (1999). Earnings management by acquiring firms in stock for stock
mergers. Journal of Accounting and Economics, 27(2).
Fox, D., Wolf, D. E. (2010). An Earnout Is In the Eye of the Beholder. Investment Dealers' Digest,
76(4).
Gong, G., Louis, H., Sun A. (2008). Earnings management, lawsuits, and stock-for-stock acquirers’
market performance. Journal of Accounting and Economics, 46, 62-77.
Healy, P. and J. Whalen, (1999). A Review of the Earnings Management Literature and its
Implication for Standard Setting, Accounting Horizons 13, 365–383.
Jensen, M. (2005). Agency costs of overvalued equity. Financial Management, 34, 5–19.
Jeter, D. C., Shivakumar, L. (1999). Cross-sectional estimation of abnormal accruals using quarterly
and annual data: Effectiveness in detecting event-specific earnings management. Accounting
and Business Research, 29(4).
Jones, J. J. (1991). Earnings management during import relief investigations. Journal of Accounting
Research, 29(2).
Klein, A. (2002). Audit Committee, Board of Director Characteristics and Earnings Management.
Journal of Accounting and Economics, 33, 375–400.
Kohers, N., Ang, J. (2000). Earnouts in Mergers: Agreeing to Disagree and Agreeing to Stay. The
Journal of Business, 73(3).
Kothari, S., Leone, A., Wasley, C., (2005), Performance Matched Discretionary Accrual Measures,
Journal of Accounting & Economics 39, 163-197.
Louis, H. (2004). Earnings management and the market performance of acquiring firms. Journal of
Financial Economics, 74(1).
26
McNichols, M.F. (2000). Research design issues in earnings management studies. Journal of
Accounting and Public Policy, 19, 313-345.
Morrison and Foerster LLP (2012). M&A Leaders Survey. Press Releases 5/15/2012. Available at:
www.mofo.com
Peasnell, K. V., Pope, P. F., Young, S. (2000). Detecting earnings management using cross-
sectional abnormal accruals models. Accounting and Business Research, 30(4).
Ragozzino, R., Reuer, J. J. (2009). Contingent earnouts in acquisitions of privately held targets.
Journal of Management, 35(4).
Shannon, K., Reilly, M. (2011). Post-Closing Earnouts in M&A Transactions: Avoiding Common
Disputes. American Bar Association Newsletter.
Subramanyam, K. R. (1996). The pricing of discretionary accruals. Journal of Accounting and
Economics, 22(1).
27
Table 1: Sample description - Deals by year
This table shows the distribution of the sample deals by year over the period 2002-2014
Year Nr deals
Nr deals including earnout %
2002 619 65 10.5% 2003 686 69 10.1% 2004 824 88 10.7% 2005 865 117 13.5% 2006 894 106 11.9% 2007 888 108 12.2% 2008 679 92 13.5% 2009 491 64 13.0% 2010 636 84 13.2% 2011 659 102 15.5% 2012 672 94 14.0% 2013 579 71 12.3% 2014 686 78 11.4% Total 9178 1138 12.4%
28
Table 2: Sample description - Deals by industry
This table provides descriptive statistics on the sample deals by industry. In panel A deals are classified according to the industry of the acquirer, while in panel B deals are classified according to the industry of the target. Deals in which the acquirer operates in the financial industry are excluded.
Panel A: Acquirer's industry
Industry Nr deals
Nr deals including earnout %
Consumer NonDurables 428 42 9.8% Consumer Durables 157 24 15.3% Manufacturing 1155 71 6.1% Oil, Gas, and Coal Extraction and Products 776 25 3.2% Chemicals and Allied Products 188 13 6.9% Computers, Software, and Electronic Equipment 2846 415 14.6% Telephone and Television Transmission 373 16 4.3% Utilities 247 3 1.2% Services and Retail 694 74 10.7% Healthcare, Medical Equipment, and Drugs 1139 255 22.4% Other (Mines, Constr, Entertainment, Transp) 1175 200 17.0% Total 9178 1138 12.4%
Panel B: Target's industry
Industry Nr deals
Nr deals including earnout %
Consumer NonDurables 389 46 11.8% Consumer Durables 181 20 11.0% Manufacturing 944 67 7.1% Oil, Gas, and Coal Extraction and Products 720 20 2.8% Chemicals and Allied Products 205 12 5.9% Computers, Software, and Electronic Equipment 2790 407 14.6% Telephone and Television Transmission 347 16 4.6% Utilities 239 3 1.3% Services and Retail 655 48 7.3% Healthcare, Medical Equipment, and Drugs 1139 252 22.1% Financial 142 13 9.2% Other (Mines, Constr, Entertainment, Transp) 1427 234 16.4% Total 9178 1138 12.4%

Table 3: Descriptive statistics and correlations
This table provides descriptive statistics on the main variables used in the analysis. HighTech and Service are dummy variables that take value 1 if the target operates in the high tech or the service sector, respectively. DealValue is the log of the transaction price of the deal. MVacquirer is the log of the market value of the acquirer prior to the deal announcement. Subsidiary and Private are dummy variables that take value 1 if the target is a private company or a subsidiary, respectively. SameIND is a dummy variable that takes value 1 if bidder and target have the same two-digits SIC code. Toehold is a dummy variable that takes value 1 if the bidder holds a stake in the target before the acquisition. Stock is a dummy that takes value 1 if the upfront payment is at least partly in stocks. EM is the mean of the abnormal accrual measure in the four quarters preceding the deal. Big4 is a dummy variable that takes value 1 if the audit firm is belongs to one of the big four. ROA is the ratio of net income over total assets. CorpGov is the ratio of non-executive directors over the total number of directors of the bidder. Panel A provides, for each variable, mean and standard deviation, detailed for the subsample of earnout users, non earnout users, and in the whole sample. Panel B provides correlations. ***, **, and * indicate significance at the 1%, 5%, and 10% levels, respectively.
Panel A: Means and standard deviations
Non-earnout users Earnout users Total
Mean SD Mean SD Sign. Mean SD HighTech 22.70% 41.90% 34.60% 47.60% *** 24.10% 42.80% Service 31.90% 46.60% 40.00% 49.00% *** 32.90% 47.00% DealValue 3.964 1.884 3.516 1.540 *** 3.908 1.851 MVacquirer 7.276 2.124 6.460 1.997 *** 7.170 2.126 Subsidiary 37.10% 48.30% 22.00% 41.40% *** 35.20% 47.80% Private 46.90% 49.90% 75.90% 42.80% *** 50.50% 50.00% SameIND 60.70% 48.80% 63.90% 48.10% ** 61.10% 48.70% Toehold 6.50% 24.60% 2.50% 15.80% *** 6.00% 23.70% Stock 18.40% 38.80% 26.40% 44.10% *** 19.40% 39.60% Big4 80.60% 39.60% 73.10% 44.40% *** 79.60% 40.30% ROA -0.50% 47.30% 0.30% 6.80% -0.40% 44.30% CorpGov 38.20% 37.90% 39.20% 37.20% 38.30% 37.80% EM 0.043 0.06 0.045 0.047 0.043 0.059

30
Panel B: Pearson Correlations
Earnout HighTech Service DealValue MVacquirer Subsidary Private SameIND Toehold Stock Big4 ROA CorpGov EM
Earnout
1 HighTech
0.104*** 1
Service
0.011*** -0.392*** 1 DealValue -0.077*** 0.018* -0.127*** 1
MVacquirer -0.125*** 0,006 0.057*** 0.619*** 1 Subsidiary -0.054*** 0.024*** -0.176*** 0.056*** -0.032*** 1
Private 0.085*** -0.064*** 0.208*** -0.269*** -0.026*** -0.83*** 1 SameIND 0.028*** 0.041*** 0.037*** 0.024*** -0.065*** 0,004 -0.016** 1
Toehold
-0.039*** -0,003 -0.069*** 0,001 0.041*** -0.021*** -0.106*** 0,009 1 Stock
0.128*** 0.033*** 0,006 -0.016* -0.226*** -0.085*** 0,003 0.034*** -0.031*** 1
Big4
-0.053*** 0.02*** 0,006 0.326*** 0.556*** 0.027*** -0.061*** 0,01 0.019*** -0.186*** 1 ROA
0,007 -0.017** 0,01 0.042*** 0.073*** -0,001 -0,002 0.017** -0,009 -0.046*** 0.058*** 1
CorpGov
-0.016** -0,009 0.025*** 0.162*** 0.222*** -0.031*** 0.034*** -0,004 0,004 -0.102*** 0.052*** 0.019*** 1 EM 0,008 -0.022*** -0.013* -0.2*** -0.337*** -0,008 0.015** -0,006 -0,001 0.115*** -0.296*** -0.274*** -0.11*** 1

Table 4: Logit regression (EM measured over 4 quarters before the deal)
This table provides the result of logistic regressions of the use of earnouts on the average earnings management in the four quarters preceding the deal and other deal specific covariates. The dependent variable takes value 1 when the deal involves an earnout, and 0 in the opposite case. HighTech and Service are dummy variables that take value 1 if the target operates in the high tech or the service sector, respectively. DealValue is the log of the transaction price of the deal. MVacquirer is the log of the market value of the acquirer prior to the deal announcement. Subsidiary and Private are dummy variables that take value 1 if the target is a private company or a subsidiary, respectively. SameIND is a dummy variable that takes value 1 if bidder and target have the same two-digits SIC code. Toehold is a dummy variable that takes value 1 if the bidder holds a stake in the target before the acquisition. Stock is a dummy that takes value 1 if the upfront payment is at least partly in stocks. EM is the mean of the abnormal accrual measure in the four quarters preceding the deal. Big4 is a dummy variable that takes value 1 if the audit firm belongs to one of the big four. ROA is the ratio of net income over total assets. Robust standard errors are provided in parentheses with ***, **, and * indicating significance at the 1%, 5%, and 10% levels, respectively.
Model 1 Model 2 Model 3 Model 4
Service 0.638*** 0.633*** 0.620*** 0.596***
(0.0829) (0.0829) (0.0833) (0.0837)
HighTech 1.046*** 1.038*** 1.028*** 1.017***
(0.0851) (0.0852) (0.0855) (0.0857)
DealValue 0.102*** 0.102*** 0.0978*** 0.0841***
(0.0236) (0.0236) (0.0238) (0.0241)
MVacquirer -0.191*** -0.202*** -0.198*** -0.183***
(0.0216) (0.0223) (0.0224) (0.0229)
Subsidiary 1.589*** 1.580*** 1.544*** 1.604***
(0.221) (0.221) (0.218) (0.220)
Private 2.507*** 2.501*** 2.465*** 2.495***
(0.216) (0.216) (0.213) (0.215)
SameIND 0.0795 0.0762 0.0810 0.0735
(0.0685) (0.0686) (0.0686) (0.0687)
Toehold
-0.376* -0.360*
(0.200) (0.200)
Stock
0.268***
(0.0843)
EM
-1.472*** -1.463*** -1.609***
(0.549) (0.547) (0.555)
Big4 0.0443 0.0101 0.00687 0.0406
(0.0947) (0.0946) (0.0946) (0.0957)
ROA 0.0904* 0.105** 0.105** 0.105**
(0.0492) (0.0423) (0.0425) (0.0446)
Constant -3.926*** -3.740*** -3.693*** -3.876***
(0.291) (0.301) (0.300) (0.310)
Year fixed effect Yes Yes Yes Yes
Observations 9,178 9,178 9,178 9,178 r2_p 0.0997 0.101 0.101 0.103 chi2 529.6 534.3 530.6 541.8
p 0 0 0 0

32
Table 5: Logit regression controlling for corporate governance quality
This table provides the result of logistic regressions of the use of earnouts on the average earnings management in the four quarters preceding the deal and other deal specific covariates. The dependent variable takes value 1 when the deal involves an earnout, and 0 in the opposite case. HighTech and Service are dummy variables that take value 1 if the target operates in the high tech or the service sector, respectively. DealValue is the log of the transaction price of the deal. MVacquirer is the log of the market value of the acquirer prior to the deal announcement. Subsidiary and Private are dummy variables that take value 1 if the target is a private company or a subsidiary, respectively. SameIND is a dummy variable that takes value 1 if bidder and target have the same two-digits SIC code. Toehold is a dummy variable that takes value 1 if the bidder holds a stake in the target before the acquisition. Stock is a dummy that takes value 1 if the upfront payment is at least partly in stocks. EM is the mean of the abnormal accrual measure in the four quarters preceding the deal. Big4 is a dummy variable that takes value 1 if the audit firm belongs to one of the big four. ROA is the ratio of net income over total assets. CorpGov is the ratio of non executive directors over the total number of directors of the bidder. Robust standard errors are provided in parentheses with ***, **, and * indicating significance at the 1%, 5%, and 10% levels, respectively.
Model 1 Model 2 Model 3 Model 4
Service 0.699*** 0.693*** 0.683*** 0.664***
(0.0906) (0.0906) (0.0910) (0.0915)
HighTech 1.043*** 1.033*** 1.026*** 1.018***
(0.0934) (0.0936) (0.0938) (0.0940)
DealValue 0.115*** 0.115*** 0.112*** 0.101***
(0.0254) (0.0254) (0.0256) (0.0259)
MVacquirer -0.197*** -0.207*** -0.204*** -0.192***
(0.0236) (0.0241) (0.0242) (0.0249)
Subsidiary 1.614*** 1.607*** 1.579*** 1.628***
(0.242) (0.242) (0.239) (0.242)
Private 2.571*** 2.568*** 2.540*** 2.565***
(0.237) (0.237) (0.234) (0.235)
SameIND 0.0857 0.0837 0.0874 0.0819
(0.0741) (0.0741) (0.0741) (0.0742)
Toehold
-0.306 -0.293
(0.209) (0.209)
Stock
0.216**
(0.0908)
EM
-1.544** -1.535** -1.645***
(0.625) (0.623) (0.630)
Big4 -0.0162 -0.0530 -0.0554 -0.0282
(0.107) (0.107) (0.107) (0.108)
ROA 0.0743 0.0978** 0.0976** 0.0968**
(0.0476) (0.0431) (0.0432) (0.0447)
CorpGov -0.173 -0.223 -0.223 -0.205
(0.194) (0.197) (0.197) (0.198)
Constant -3.923*** -3.735*** -3.697*** -3.846***
(0.314) (0.325) (0.324) (0.333)
Year fixed effect Yes Yes Yes Yes
Observations 7,831 7,831 7,831 7,831 r2_p 0.106 0.106 0.107 0.108 chi2 476.1 480.2 477.8 484.8
p 0 0 0 0
33
Table 6: Logit regression (EM measured over 3-year period before the deal)
This table provides the result of logistic regressions of the use of earnouts on the average earnings management in the three years preceding the deal and other deal specific covariates. The dependent variable takes value 1 when the deal involves an earnout, and 0 in the opposite case. HighTech and Service are dummy variables that take value 1 if the target operates in the high tech or the service sector, respectively. DealValue is the log of the transaction price of the deal. MVacquirer is the log of the market value of the acquirer prior to the deal announcement. Subsidiary and Private are dummy variables that take value 1 if the target is a private company or a subsidiary, respectively. SameIND is a dummy variable that takes value 1 if bidder and target have the same two-digits SIC code. Toehold is a dummy variable that takes value 1 if the bidder holds a stake in the target before the acquisition. Stock is a dummy that takes value 1 if the upfront payment is at least partly in stocks. EM is the mean of the abnormal accrual measure in the three years preceding the deal. Big4 is a dummy variable that takes value 1 if the audit firm belongs to one of the big four. ROA is the ratio of net income over total assets. Robust standard errors are provided in parentheses with ***, **, and * indicating significance at the 1%, 5%, and 10% levels, respectively.
Model 1 Model 2 Model 3 Model 4
Service 0.699*** 0.702*** 0.694*** 0.688***
(0.0920) (0.0919) (0.0924) (0.0927)
HighTech 1.184*** 1.184*** 1.178*** 1.176***
(0.0927) (0.0927) (0.0931) (0.0932)
DealValue 0.118*** 0.118*** 0.115*** 0.111***
(0.0255) (0.0255) (0.0257) (0.0260)
MVacquirer -0.196*** -0.202*** -0.200*** -0.196***
(0.0241) (0.0244) (0.0245) (0.0251)
Subsidiary 1.560*** 1.555*** 1.535*** 1.550***
(0.231) (0.231) (0.228) (0.230)
Private 2.552*** 2.548*** 2.529*** 2.536***
(0.226) (0.226) (0.223) (0.224)
SameIND 0.149** 0.152** 0.155** 0.153**
(0.0746) (0.0746) (0.0746) (0.0746)
Toehold
-0.192 -0.187
(0.189) (0.189)
Stock
0.0772
(0.0954)
EM
-0.509** -0.506** -0.531**
(0.256) (0.256) (0.259)
Big4 -0.102 -0.134 -0.136 -0.128
(0.104) (0.105) (0.105) (0.106)
ROA 0.106*** 0.0908** 0.0903** 0.0921**
(0.0386) (0.0373) (0.0376) (0.0383)
Constant -3.817*** -3.702*** -3.677*** -3.713***
(0.326) (0.330) (0.328) (0.333)
Year fixed effect Yes Yes Yes Yes
Observations 7,819 7,819 7,819 7,819 r2_p 0.115 0.115 0.115 0.115 chi2 534.9 536.7 535.4 536.0
p 0 0 0 0
34
Table 7: Logit regression (EM measured over 3-year period before the deal, with corporate governance)
This table provides the result of logistic regressions of the use of earnouts on the average earnings management in the three years preceding the deal and other deal specific covariates. The dependent variable takes value 1 when the deal involves an earnout, and 0 in the opposite case. HighTech and Service are dummy variables that take value 1 if the target operates in the high tech or the service sector, respectively. DealValue is the log of the transaction price of the deal. MVacquire ris the log of the market value of the acquirer prior to the deal announcement. Subsidiary and Private are dummy variables that take value 1 if the target is a private company or a subsidiary, respectively. SameIND is a dummy variable that takes value 1 if bidder and target have the same two-digits SIC code. Toehold is a dummy variable that takes value 1 if the bidder holds a stake in the target before the acquisition. Stock is a dummy that takes value 1 if the upfront payment is at least partly in stocks. EM is the mean of the abnormal accrual measure in the three years preceding the deal. Big4 is a dummy variable that takes value 1 if the audit firm belongs to one of the big four. ROA is the ratio of net income over total assets. CorpGov is the ratio of non executive directors over the total number of directors of the bidder. Robust standard errors are provided in parentheses with ***, **, and * indicating significance at the 1%, 5%, and 10% levels, respectively.
Model 1 Model 2 Model 3 Model 4
Service 0.761*** 0.767*** 0.761*** 0.758***
(0.0999) (0.0999) (0.100) (0.101)
HighTech 1.165*** 1.168*** 1.163*** 1.162***
(0.101) (0.101) (0.101) (0.102)
DealValue 0.132*** 0.131*** 0.129*** 0.127***
(0.0270) (0.0271) (0.0272) (0.0277)
MVacquirer -0.205*** -0.210*** -0.208*** -0.206***
(0.0260) (0.0262) (0.0263) (0.0270)
Subsidiary 1.557*** 1.553*** 1.538*** 1.545***
(0.249) (0.249) (0.246) (0.248)
Private 2.565*** 2.563*** 2.548*** 2.552***
(0.243) (0.243) (0.241) (0.241)
SameIND 0.157** 0.159** 0.161** 0.161**
(0.0800) (0.0800) (0.0800) (0.0800)
Toehold
-0.154 -0.152
(0.200) (0.200)
Stock
0.0333
(0.102)
EM
-0.421** -0.419** -0.426**
(0.213) (0.213) (0.215)
Big4 -0.136 -0.169 -0.170 -0.167
(0.113) (0.114) (0.114) (0.114)
ROA 0.108*** 0.0899** 0.0895** 0.0901**
(0.0416) (0.0397) (0.0400) (0.0402)
CorpGov -0.166 -0.192 -0.191 -0.190
(0.211) (0.213) (0.213) (0.213)
Constant -4.008*** -3.888*** -3.867*** -3.884***
(0.456) (0.462) (0.460) (0.467)
Year fixed effect Yes Yes Yes Yes
Observations 6,773 6,773 6,773 6,773 r2_p 0.118 0.119 0.119 0.119 chi2 477.7 480.8 479.8 479.9
p 0 0 0 0
35
Table 8: Propensity Score Matching
This table provides the results of the ATT procedure performed on our sample. The analisys is performed on the observations belonging to the region of common support, so to improve the quality of the matching. Standard errorrs are computed analytically. T-stats are reported with the associated significance level, with ***, **, and * indicating significance at the 1%, 5%, and 10% levels, respectively. Panel A shows results using as outcome variable the mean of the abnormal accrual measure in the four quarters preceding the deal. Panel B restricts the analysis to the two quarters preceding the deal, Panel C extends it to the six quarters preceding the deal.
Panel A Nr. Treated 1138
Nr. Controls 7942
ATT -0.005
Std. Err. 0.002
t-stat -3.331*** Panel A Nr. Treated 1138
Nr. Controls 7942
ATT -0.007
Std. Err. 0.002
t-stat -3.759*** Panel C Nr. Treated 1138
Nr. Controls 7522
ATT -0.004
Std. Err. 0.001
t-stat -2.922***

36
Table 9: Logit regression (EM measured over 4 quarters before the deal) Subsample of deals with acquisitions of at least 20% of the capital of the target firm
This table provides the result of logistic regressions of the use of earnouts on the average earnings management in the four quarters preceding the deal and other deal specific covariates. The dependent variable takes value 1 when the deal involves an earnout, and 0 in the opposite case. HighTech and Service are dummy variables that take value 1 if the target operates in the high tech or the service sector, respectively. DealValue is the log of the transaction price of the deal. MVacquirer is the log of the market value of the acquirer prior to the deal announcement. Subsidiary and Private are dummy variables that take value 1 if the target is a private company or a subsidiary, respectively. SameIND is a dummy variable that takes value 1 if bidder and target have the same two-digits SIC code. Toehold is a dummy variable that takes value 1 if the bidder holds a stake in the target before the acquisition. Stock is a dummy that takes value 1 if the upfront payment is at least partly in stocks. EM is the mean of the abnormal accrual measure in the four quarters preceding the deal. Big4 is a dummy variable that takes value 1 if the audit firm belongs to one of the big four. ROA is the ratio of net income over total assets. Robust standard errors are provided in parentheses with ***, **, and * indicating significance at the 1%, 5%, and 10% levels, respectively.
Model 1 Model 2 Model 3 Model 4
Service 0.602*** 0.598*** 0.600*** 0.577***
(0.0834) (0.0834) (0.0835) (0.0840)
HighTech 1.016*** 1.008*** 1.012*** 1.002***
(0.0856) (0.0858) (0.0861) (0.0862)
DealValue 0.0884*** 0.0886*** 0.0890*** 0.0756***
(0.0240) (0.0241) (0.0241) (0.0243)
MVacquirer -0.182*** -0.193*** -0.193*** -0.178***
(0.0220) (0.0227) (0.0227) (0.0233)
Subsidary 1.589*** 1.582*** 1.597*** 1.657***
(0.230) (0.230) (0.224) (0.226)
Private 2.514*** 2.509*** 2.525*** 2.556***
(0.226) (0.226) (0.220) (0.221)
SameIND 0.0854 0.0823 0.0808 0.0733
(0.0690) (0.0690) (0.0691) (0.0692)
Big4 0.0429 0.0109 0.0120 0.0450
(0.0952) (0.0951) (0.0951) (0.0962)
ROA 0.0891* 0.104** 0.104** 0.104**
(0.0496) (0.0430) (0.0430) (0.0450)
Toehold
0.154 0.167
(0.242) (0.243)
Stock
0.261***
(0.0845)
EM
-1.400*** -1.398** -1.540***
(0.543) (0.544) (0.551)
Constant -3.902*** -3.727*** -3.746*** -3.927***
(0.300) (0.310) (0.305) (0.315)
Year fixed effect Yes Yes Yes Yes Observations 8,830 8,830 8,830 8,830
r2_p 0.0969 0.0978 0.0978 0.0993 chi2 513.3 517.2 534.7 545.3
p 0 0 0 0

37
Table 10: Logit regression (EM measured over 4 quarters before the deal) Subsample of acquisition with ownership passing from less than 50% to at least 90%
This table provides the result of logistic regressions of the use of earnouts on the average earnings management in the four quarters preceding the deal and other deal specific covariates. The dependent variable takes value 1 when the deal involves an earnout, and 0 in the opposite case. HighTech and Service are dummy variables that take value 1 if the target operates in the high tech or the service sector, respectively. DealValue is the log of the transaction price of the deal. MVacquirer is the log of the market value of the acquirer prior to the deal announcement. Subsidiary and Private are dummy variables that take value 1 if the target is a private company or a subsidiary, respectively. SameIND is a dummy variable that takes value 1 if bidder and target have the same two-digits SIC code. Toehold is a dummy variable that takes value 1 if the bidder holds a stake in the target before the acquisition. Stock is a dummy that takes value 1 if the upfront payment is at least partly in stocks. EM is the mean of the abnormal accrual measure in the four quarters preceding the deal. Big4 is a dummy variable that takes value 1 if the audit firm belongs to one of the big four. ROA is the ratio of net income over total assets. Robust standard errors are provided in parentheses with ***, **, and * indicating significance at the 1%, 5%, and 10% levels, respectively.
Model 1 Model 2 Model 3 Model 4
Service 0.615*** 0.611*** 0.613*** 0.590***
(0.0854) (0.0854) (0.0855) (0.0860)
HighTech 1.028*** 1.021*** 1.023*** 1.013***
(0.0875) (0.0876) (0.0877) (0.0878)
DealValue 0.0800*** 0.0802*** 0.0800*** 0.0675***
(0.0244) (0.0245) (0.0245) (0.0246)
MVacquirer -0.178*** -0.188*** -0.188*** -0.174***
(0.0226) (0.0231) (0.0231) (0.0237)
Subsidary 1.857*** 1.851*** 1.862*** 1.927***
(0.273) (0.273) (0.272) (0.274)
Private 2.771*** 2.768*** 2.776*** 2.812***
(0.270) (0.270) (0.269) (0.270)
SameIND 0.0844 0.0821 0.0800 0.0730
(0.0703) (0.0703) (0.0703) (0.0703)
Big4 -0.00799 -0.0389 -0.0385 -0.00558
(0.0965) (0.0964) (0.0964) (0.0976)
ROA 0.142 0.159* 0.159* 0.165*
(0.133) (0.0848) (0.0849) (0.0912)
Toehold
0.286 0.284
(0.343) (0.346)
Stock
0.250***
(0.0861)
EM
-1.367** -1.365** -1.514***
(0.567) (0.568) (0.578)
Constant -4.078*** -3.910*** -3.922*** -4.103***
(0.340) (0.349) (0.348) (0.358)
Year fixed effect Yes Yes Yes Yes Observations 8,268 8,268 8,268 8,268
r2_p 0.0977 0.0985 0.0986 0.0999 chi2 495.7 501.2 506.8 516.8
p 0 0 0 0

38
APPENDIX A
SAMPLE EARNOUT AGREEMENT
(Bold added) This EARNOUT AGREEMENT (this “Agreement”) is entered into this 31st day of July, 2008 by and between
Orthodyne Electronics Corporation (“Orthodyne”) and Kulicke and Soffa Industries, Inc. (the “Company,” and together with Orthodyne, the “Parties”). The Parties are entering into this Agreement in connection with Orthodyne’s sale of the Purchased Assets to the Company, pursuant to an Asset Purchase Agreement, dated as of July 31, 2008, by and among Orthodyne and the Company (the “Purchase Agreement”). Capitalized terms used herein without definition shall have the meanings ascribed to such terms in the Purchase Agreement.
WHEREAS, as part of the transactions contemplated in the Purchase Agreement, Orthodyne shall be entitled to certain payments in addition to those set forth in the Purchase Agreement based upon the financial performance of the Business.
WHEREAS, Orthodyne and the Company have agreed that calculation and payment of such earnout amounts is to be made in accordance with the terms of this Agreement.
NOW, THEREFORE, in consideration of the premises and of the respective covenants and provisions contained herein, Orthodyne and the Company agree as follows: 1. Definitions.
“Additional Earnout” means, with respect to the three-year period following the Commencement Date, up to an aggregate of $10 million, the payment of which shall be made in cash based on the formula set forth on Exhibit A hereto.
“Base Earnout” means, with respect to each of the twelve-month periods ending on the first, second and third anniversary of the Commencement Date, up to an aggregate of $30 million, the payment of which shall be made in cash based on the formula set forth on Exhibit A hereto.
“Budgeted Gross Profit” means, for each Earnout Period, the amount set forth on Exhibit A. “Commencement Date” shall mean the Closing Date if the Closing Date coincides with the first day of a fiscal
quarter of the Company or, if the Closing Date does not coincide with the first day of a fiscal quarter of the Company, the Commencement Date shall be the first day of the fiscal quarter succeeding the Closing Date.
“Earnout Payment” means each payment made pursuant to Section 2(a) below on account of Base Earnout and Additional Earnout.
“Earnout Periods” means the twelve-month periods ending on the first, second and third anniversaries of the Commencement Date, respectively.
“Forecast” means the forecast provided by Orthodyne to the Company on which the Company’s valuation of the Business was based, which is set forth on Exhibit C.
“Gross Profit” shall have the meaning assigned to such term in Section 3(a). “Gross Profit Statement” shall have the meaning assigned to such term in Section 3(b)(i). “Independent Accounting Firm” shall have the meaning assigned to such term in Section 3(b)(ii). “Maximum Aggregate Earnout Amount” means $40 million. “Term” means the period commencing on the Commencement Date and ending on the third anniversary thereof.
2. Earnout Payment.
(a) Period for Payment. The Budgeted Gross Profit, Base Earnout and Additional Earnout for each of the Earnout Periods shall be as set forth on Exhibit A.
(b) Earnout Payment.

39
(i) For each Earnout Period during the Term, the Company shall, pursuant to Section 3, calculate the Gross Profit for such period and shall pay to Orthodyne the Base Earnout that corresponds to the amount of Gross Profit set forth in the Base Earnout table on Exhibit A with respect to such Earnout Period; provided that the Base Earnout for the first Earnout Period shall not exceed $10 million and the aggregate Base Earnout for the first and second Earnout Periods shall not exceed $20 million.
(ii) If the cumulative Gross Profit during the Term, as determined pursuant to Section 3, exceeds the Budgeted Gross Profit for the Term, the Company shall pay to Orthodyne the Additional Earnout attributable to such amount of Gross Profit set forth in the Additional Earnout table on Exhibit A.
(iii) The Earnout Payment with respect to each Earnout Period shall be paid to Orthodyne as soon as practicable after the amount of the Earnout Payment has been determined and any dispute with respect thereto has been settled pursuant to Section 3.
(iv) Orthodyne shall not be entitled to any interest on any payments under this Agreement. (v) For the sake of clarity, Exhibit A hereto sets forth examples of the application of this Section 2
to different amounts of Gross Profit. (c) Right of Setoff. The Company shall have the right to withhold and set off, against any amount due
Orthodyne hereunder, any amount owed by Orthodyne to the Company or the Company pursuant to any claim for indemnification or payment of damages to which the Company may be entitled under the Purchase Agreement or any other agreement entered into in connection with the transactions contemplated therein.
- 2 -
3. Computation of Gross Profit. (a) Calculation of Gross Profit. “Gross Profit” shall mean the gross profit of the Business for any
Earnout Period, as determined in accordance with GAAP and shall be calculated as set forth on Exhibit B hereto.
(b) Time of Determination. (i) For each quarter during the Term, the Company shall prepare or cause to be prepared and
delivered to Orthodyne, within 10 days after completion by the Company’s independent accountants of their audit or review, as applicable, of the Company’s financial statements, but in no event more than 10 days following the date the Company files its Quarterly Report on Form 10-Q or its Annual Report on Form 10-K, as applicable, a written statement setting forth the computation of Gross Profit of the Company for such quarter (the “Gross Profit Statement”). During the 10 Business Days immediately following Orthodyne’s receipt of the Gross Profit Statement and during the period in which any dispute with respect thereto is pending and unresolved, the Company shall provide Orthodyne reasonable access during normal business hours to such books and records of the Company as Orthodyne may reasonably request in order to review and verify the Company’s calculation of Gross Profit as set forth in the Gross Profit Statement. The Gross Profit set forth in such Gross Profit Statement shall become final and binding upon the Parties 10 Business Days following Orthodyne’s receipt thereof unless Orthodyne gives written notice of their disagreement to the Company prior to such date, setting forth in reasonable detail the basis for such disagreement.
(ii) If Orthodyne shall have any objections to the Company’s calculation of Gross Profit as set forth on the Gross Profit Statement, the Company and Orthodyne shall attempt in good faith to reach an agreement as to the matter in dispute. If the Company and Orthodyne fail to resolve such dispute within 20 Business Days after the Company’s receipt of such objection (or such longer period as mutually agreed upon by the Company and Orthodyne), then any such dispute may thereafter be referred by either Party for resolution to the Nonpartisan Accountants. The Company and Orthodyne shall take, or cause to be taken, all actions and do, or cause to be done, all things necessary to cooperate with the Independent Accounting Firm in its resolution of the dispute. The determination of the Independent Accounting Firm shall be made as promptly as practicable and shall be final, binding and conclusive on all parties hereto. The fees and expenses of the Independent Accounting Firm incurred in resolving the dispute shall be borne by Orthodyne, unless the final determination of Gross Profit, after resolution of such dispute, exceeds the Company’s calculation of Gross Profit set forth on the Gross Profit Statement by more than 5%, in which case such fees and expenses shall be borne by the Company.
(c) Time of Payment. Any payments owed to Orthodyne pursuant to this Agreement shall be made within 10 Business Days following the date upon which the applicable Gross Profit Statement for the fourth quarter of any Earnout Period becomes final and binding pursuant to Section 3(b)(i) above or any dispute with respect to such Gross Profit Statement is resolved pursuant to Section 3(b)(ii) above.

40
- 3 -
4. Management of the Business.
(a) Subject to applicable Law and the provisions of this Section 4, the rules and regulations of NASDAQ and the Company’s obligations to its shareholders, the Company shall be entitled to do any act (or refrain therefrom) in the conduct of the Business if they act in good faith, consistent with reasonable business practices and reasonably consider such action (or determination not to act) to be necessary and not for the purpose of adversely affecting the Gross Profit of the Business or impairing the ability of the Business to maximize Gross Profit; provided that if the Company proposes to take any action outside of the ordinary course of business that could reasonably be expected to have a material adverse effect on Gross Profit, it shall notify Orthodyne and if Orthodyne reasonably believes that such action would have a material adverse effect on Gross Profit, then the Company and Seller shall negotiate in good faith with respect to adjusting the Budgeted Gross Profit for any periods affected thereby or otherwise amending the methodology for calculation of Earnout Payments hereunder.
(b) Notwithstanding the provisions of Section 4(a) above, during the Term, the Company shall: (i) maintain a financial record keeping system that enables the Company to separately
account for all items of revenue and expense of the Business necessary to calculate Gross Profit hereunder; (ii) subject to the provisions of Section 4(c) below, enable Orthodyne’s current management
team to retain reasonable authority to make decisions regarding the operation of the Business consistent with maximizing both Gross Profit and the operating results of the Company; and
(iii) provide the Business with such commercially reasonable personnel, technical and financial resources as are appropriate to operate the Business consistent with the Forecast. The determination of whether such resources are consistent with the level of resources underlying the Forecast shall be measured by ratios, including the ratios of operating expenses to revenue, the ratio of capital expenditures to revenue, the ratio of working capital to revenue and the ratio of gross profit to revenue; provided, that any adjustment to resources shall be subject to a commercially reasonable time frame.
(c) During the Term, the Company shall consult with the Named Individual(s) then employed by the Company with respect to the selection of the President of the Company’s Orthodyne Division or his successor.
(d) If (i) the Company sells or transfers to an unrelated third party all or substantially all of the Business, including substantially all of the assets used by the Company in conducting the Business, prior to the end of the Term and (ii) such third party does not assume all of the Company’s obligations under this Agreement, then the Company shall pay to Orthodyne (x) $10.0 million in Base Earnout for each Earnout Period not yet completed as of the date of such sale or transfer, plus (y) in the event that the maximum amount of Base Earnout has been paid, or is payable pursuant to this Section 4(d), and the cumulative Gross Profit through the date of such sale or transfer, if it were to continue at the same rate for the remainder of the
- 4 -
Earnout Period, would result in payment in full of the Additional Earnout, the maximum amount of Additional Earnout. Such amount will be paid to Orthodyne within 30 days of the closing of such sale or transfer. […]