Embed Size (px)
Citation preview
Progress in Oceanography 105 (2012) 47–60
Contents lists available at SciVerse ScienceDirect
Progress in Oceanography
journal homepage: www.elsevier .com/ locate /pocean
Short-term flow and water temperature fluctuations in Sagami Bay, Japan,associated with variations of the Kuroshio during the non-large-meander path
Daisuke Takahashi a,⇑, Akihiko Morimoto a, Tetsuya Nakamura b, Takuji Hosaka c, Yoshihisa Mino a,Vu Hai Dang d, Toshiro Saino e
a Hydrospheric Atmospheric Research Center, Nagoya University, Furo-cho, Chikusa-ku, Nagoya, Aichi 464-8601, Japanb Nichiyu Giken Kogyo Co., Ltd., 21-2, Matobashin-machi, Kawagoe, Saitama 350-1107, Japanc Oceanographic Observation Center, Tokyo University of Marine Science and Technology, 4-5-7, Minatominami, Minato-ku, Tokyo 108-8477, Japand Institute for Marine Geology and Geophysics, 18, Hoang quoc viet, Ha noi 84, Viet Name Yokosuka Headquarters, Japan Agency for Marine-Earth Science and Technology, 2-15, Natsushima-cho, Yokosuka-city, Kanagawa 237-0061, Japan
a r t i c l e i n f o
Article history:Available online 27 April 2012
0079-6611/$ - see front matter � 2012 Elsevier Ltd. Ahttp://dx.doi.org/10.1016/j.pocean.2012.04.012
⇑ Corresponding author. Present address: HokkaidoFisheries Research Agency, 116 Katsurakoi, Kushiro-shTel.: +81 0154921723.
E-mail address: [email protected] (D. Takahas
a b s t r a c t
Short-term flow and water temperature fluctuations in Sagami Bay were examined using mooring andhydrographic data observed during the non-large-meander path (NLM) of the Kuroshio. In the surfacelayer (<150 m), the flow fluctuation is predominant and is excited by the sudden strong eastward flowwith speeds greater than 20 cm s�1 in the central part of the bay. This flow is a part of an intrusion ofKuroshio water via the Oshima West Channel into the bay and/or a cyclonic circulation in the northernpart of the bay. The cyclonic circulation, which is approximately balanced under the geostrophic flowrelationship, is mainly generated or enhanced by the intrusion, which is accompanied by eastward prop-agation of the small meander of the Kuroshio south of Japan during the transition from the nearshorenon-large-meander path (nNLM) to the offshore non-large-meander path (oNLM), regardless of season.The water temperature fluctuation in the subsurface layer (�150 m) is caused by upwelling of cold dee-per water and is closely related to the eastward flow fluctuations in the surface layer in the central part ofthe bay. Our analysis leads us the conclusion that the upwelling occurs as the response of the subsurfacedensity field to the surface flow field under the Earth’s rotation. Additionally, the intrusion of Kuroshiowater via the Oshima West Channel tends to cause, not only cyclonic circulation and upwelling in thenorthern part of the bay, but also the Kyucho, which is the coastal density current under the Earth’s rota-tion, in the bay’s coastal area during the non-large-meander path (NLM).
� 2012 Elsevier Ltd. All rights reserved.
1. Introduction
Sagami Bay in southern Japan is rectangular in shape with alength of about 50 km and a width of about 60 km, and is con-nected to the Pacific Ocean through two channels: the OshimaWest Channel (�600 m) and the Oshima East Channel(�1500 m). Oshima Island is part of the northern Izu Ridge offthe bay. The bottom topography is characterized by steep slopeswith depths of 200–500 m around the bay, and by deep troughsof about 1500 m depth connected to the Pacific Ocean via the Oshi-ma East Channel (Fig. 1a and b).
Oceanographic conditions in Sagami Bay, such as flow field andwater mass structure, are greatly affected by the Kuroshio. TheKuroshio flows eastward and has bimodal stationary paths,namely, the typical large-meander path (tLM) and the non-large-
ll rights reserved.
National Fisheries Institute,i, Hokkaido 085-0802, Japan.
hi).
meander path (NLM) south of Japan. Moreover, the NLM is classi-fied into two types: the nearshore non-large-meander path (nNLM)and the offshore non-large-meander path (oNLM) (Kawabe, 1985;see Fig. 1a). It is well known that the path of the Kuroshio south ofJapan changes between these paths over various time scales. ThetLM is a decadal phenomenon and has a dominant period of about20 years, and the transition between the tLM and NLM requiresseveral months (Kawabe, 1987). In contrast, the Kuroshio path alsovaries between the nNLM and oNLM with periods of about110 days, 195 days, 1 year, and 1.6–1.8 years during the NLM,and the dominant period is 1.6–1.8 years. The transition betweenthe nNLM and oNLM requires about 1 month (Kawabe, 1986,1987).
The variations in the flow field and water mass structure ofSagami Bay are closely related to those in the Kuroshio south ofJapan. Long-term variations in the flow field and water mass struc-ture with time scales of several months to a few decades are accom-panied by the transition between the tLM, nNLM, and oNLM. Duringthe tLM, water temperature at a depth of 100 m increases through-out the entire bay, and an anticyclonic flow is generated around
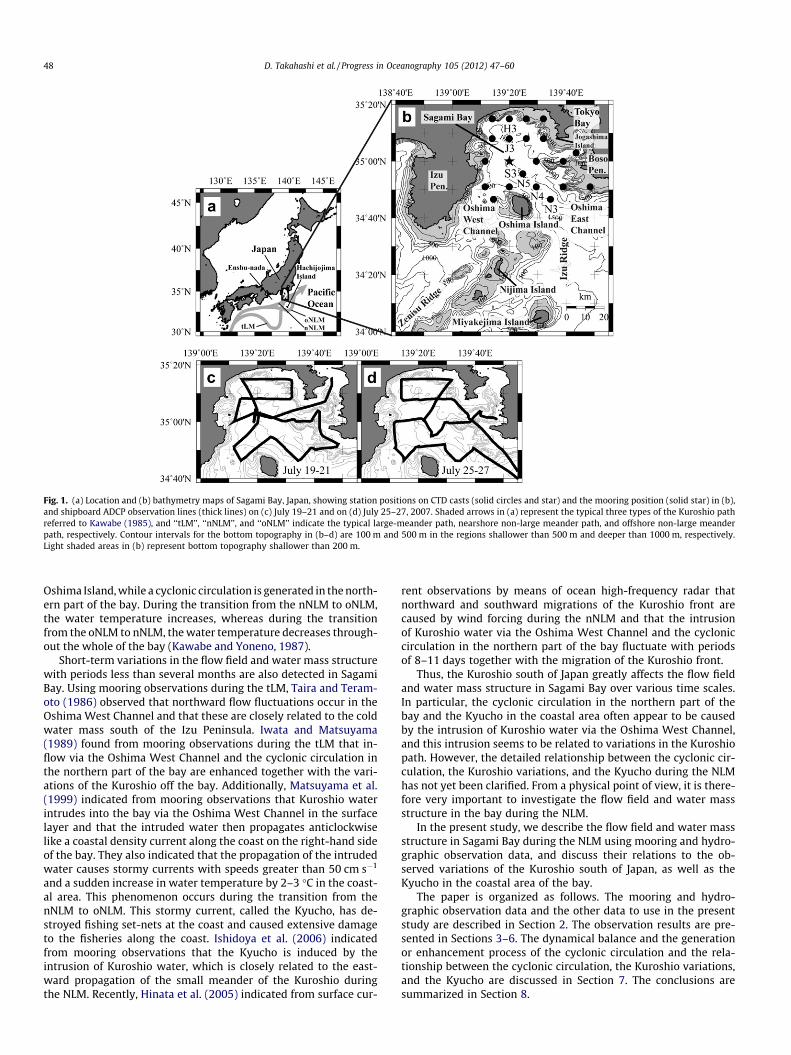
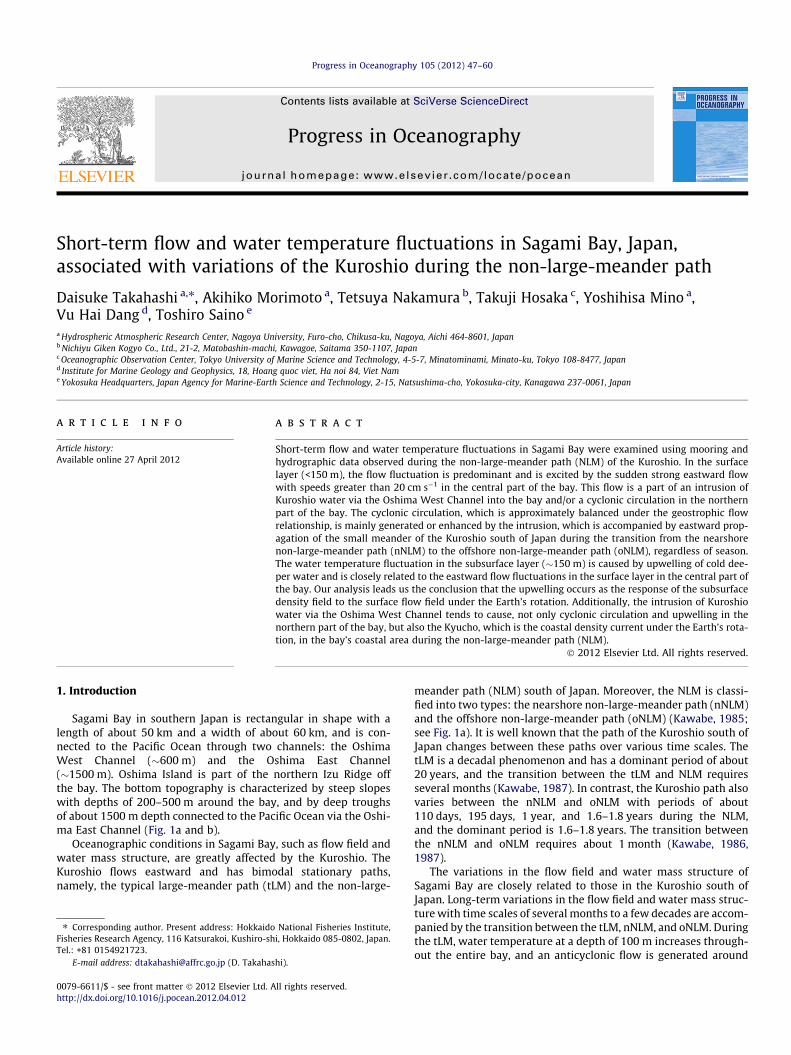
Fig. 1. (a) Location and (b) bathymetry maps of Sagami Bay, Japan, showing station positions on CTD casts (solid circles and star) and the mooring position (solid star) in (b),and shipboard ADCP observation lines (thick lines) on (c) July 19–21 and on (d) July 25–27, 2007. Shaded arrows in (a) represent the typical three types of the Kuroshio pathreferred to Kawabe (1985), and ‘‘tLM’’, ‘‘nNLM’’, and ‘‘oNLM’’ indicate the typical large-meander path, nearshore non-large meander path, and offshore non-large meanderpath, respectively. Contour intervals for the bottom topography in (b–d) are 100 m and 500 m in the regions shallower than 500 m and deeper than 1000 m, respectively.Light shaded areas in (b) represent bottom topography shallower than 200 m.
48 D. Takahashi et al. / Progress in Oceanography 105 (2012) 47–60
Oshima Island, while a cyclonic circulation is generated in the north-ern part of the bay. During the transition from the nNLM to oNLM,the water temperature increases, whereas during the transitionfrom the oNLM to nNLM, the water temperature decreases through-out the whole of the bay (Kawabe and Yoneno, 1987).
Short-term variations in the flow field and water mass structurewith periods less than several months are also detected in SagamiBay. Using mooring observations during the tLM, Taira and Teram-oto (1986) observed that northward flow fluctuations occur in theOshima West Channel and that these are closely related to the coldwater mass south of the Izu Peninsula. Iwata and Matsuyama(1989) found from mooring observations during the tLM that in-flow via the Oshima West Channel and the cyclonic circulation inthe northern part of the bay are enhanced together with the vari-ations of the Kuroshio off the bay. Additionally, Matsuyama et al.(1999) indicated from mooring observations that Kuroshio waterintrudes into the bay via the Oshima West Channel in the surfacelayer and that the intruded water then propagates anticlockwiselike a coastal density current along the coast on the right-hand sideof the bay. They also indicated that the propagation of the intrudedwater causes stormy currents with speeds greater than 50 cm s�1
and a sudden increase in water temperature by 2–3 �C in the coast-al area. This phenomenon occurs during the transition from thenNLM to oNLM. This stormy current, called the Kyucho, has de-stroyed fishing set-nets at the coast and caused extensive damageto the fisheries along the coast. Ishidoya et al. (2006) indicatedfrom mooring observations that the Kyucho is induced by theintrusion of Kuroshio water, which is closely related to the east-ward propagation of the small meander of the Kuroshio duringthe NLM. Recently, Hinata et al. (2005) indicated from surface cur-
rent observations by means of ocean high-frequency radar thatnorthward and southward migrations of the Kuroshio front arecaused by wind forcing during the nNLM and that the intrusionof Kuroshio water via the Oshima West Channel and the cycloniccirculation in the northern part of the bay fluctuate with periodsof 8–11 days together with the migration of the Kuroshio front.
Thus, the Kuroshio south of Japan greatly affects the flow fieldand water mass structure in Sagami Bay over various time scales.In particular, the cyclonic circulation in the northern part of thebay and the Kyucho in the coastal area often appear to be causedby the intrusion of Kuroshio water via the Oshima West Channel,and this intrusion seems to be related to variations in the Kuroshiopath. However, the detailed relationship between the cyclonic cir-culation, the Kuroshio variations, and the Kyucho during the NLMhas not yet been clarified. From a physical point of view, it is there-fore very important to investigate the flow field and water massstructure in the bay during the NLM.
In the present study, we describe the flow field and water massstructure in Sagami Bay during the NLM using mooring and hydro-graphic observation data, and discuss their relations to the ob-served variations of the Kuroshio south of Japan, as well as theKyucho in the coastal area of the bay.
The paper is organized as follows. The mooring and hydro-graphic observation data and the other data to use in the presentstudy are described in Section 2. The observation results are pre-sented in Sections 3–6. The dynamical balance and the generationor enhancement process of the cyclonic circulation and the rela-tionship between the cyclonic circulation, the Kuroshio variations,and the Kyucho are discussed in Section 7. The conclusions aresummarized in Section 8.
D. Takahashi et al. / Progress in Oceanography 105 (2012) 47–60 49
2. Experimental design
2.1. Mooring observation
The mooring observations were conducted from July 25, 2007 toFebruary 20, 2008 in the central part of Sagami Bay (station S3 at35�000N, 139�200E; solid star in Fig. 1b). The mooring system wasfitted with conductivity, temperature, and depth sensors (CTD;NXIC-CTD, Falmouth Science Inc.), which moved vertically from�200 m depth to the sea surface once per day (Saino, 2007) to givedaily vertical profiles of water temperature and salinity in theupper 200 m layer during the mooring period. The mooring instal-lation was also fitted with an acoustic Doppler current profiler(ADCP; Workhorse, RD Instruments; 76.8 kHz) at a depth of about500 m. The ADCP deployed in this study measured flows from adepth of approximately 450 m toward the sea surface at 72 depths(vertical interval: 8 m) at 1-h intervals. Low-quality current data(percent good <80%) were omitted from the analysis, and currentdata from depths shallower than 50 m were also excluded fromthe analysis because of the effect of side-lobe interference. Hourlycurrent data at depths from 50 m to about 450 m were resampledat 10-m intervals after depth correction, and then the resampledhourly currents were smoothed using a low-pass Gaussian filterwith an 81-h half-power point to remove high-frequency fluctua-tions such as tidal and inertial oscillations.
2.2. Hydrographic observation
Hydrographic observations were conducted from 23:00 July 19to 4:00 July 21, 2007 and from 20:30 July 25 to 1:30 July 27, 2007from R/V Tanseimaru of the Japan Agency for Marine-Earth Scienceand Technology (JAMSTEC). During each hydrographic observation,CTD (Integrated CTD, Falmouth Science Inc.) casts were conducted at21 stations (solid circles and star in Fig. 1b). On July 19–21, 2007, allthe CTD casts were conducted at depths shallower than 250 m. Onthe contrary, on July 25–27, 2007, the CTD casts along the transectH3–J3–S3–N5–N4–N3 (see Fig. 1b) were conducted to the sea bot-tom at stations H3 and J3 and to a depth of 1000 m at stations S3–N3, and the other casts were conducted to a depth of 250 m. Duringeach CTD observation, current vectors were also recorded using ashipboard ADCP (Workhorse, RD Instruments; 76.8 kHz) at 1-minintervals and 40 depths (vertical interval: 16 m). Poor-quality cur-rent data (union of three conditions with percent good <80%, errorvelocity >10 cm s�1, and vertical velocity >20 cm s�1) were excludedfrom the analysis. Since the current data became noisy when theship stopped and turned, these noisy data were also excluded fromthe analysis. The remaining data were then corrected as follows:to compensate for possible misalignment of the shipboard ADCPtransducers, the data were calibrated using the techniques de-scribed by Joyce (1989). The corrected data were gridded (10 � 10)using a Gaussian function (effective radius of 15 km). Tidal currentswere not eliminated because these are markedly weaker than thedensity current in the study area. The speed of the tidal current(sum of four tidal components K1, O1, M2, and S2) was about 2–6 cm s�1, as determined from the mooring current data during theshipboard ADCP current survey, which was considerably slowerthan typical density current (�40–50 cm s�1; see Figs. 2 and 7).
2.3. Position of the Kuroshio axis, sea surface temperature (SST), andsea level anomaly (SLA) data
To investigate the variations of the Kuroshio south of Japan, weused three data sets: position of the Kuroshio axis, sea surface tem-perature (SST), and sea level anomaly (SLA). The position of theKuroshio axis at about 1-day intervals, which was determined by
a synthesis of horizontal distributions of water temperature atthe sea surface and a depth of 200 m, surface currents, locationof the cold eddy south of Japan, and satellite-derived altimeter datain the region from the East China Sea to south of Japan, was pro-vided by the Marine Information Research Center (MIRC) of JapanHydrographic Association (http://www.mirc.jha.jp/products/KCP/). The 1-day interval SST data were downloaded from the AGROPE-DIA satellite image database of the Ministry of Agriculture, Forestryand Fisheries, Japan (http://www.affrc.go.jp/Agropedia/). The SLAdata, gridded (0.25� � 0.25�) at 7-day intervals, were acquired fromthe Archiving, Validation and Interpretation of Satellite Oceano-graphic data (AVISO) website (http://www.aviso.oceanobs.com/en/home/index.html).
3. Variability in flow and water temperature in the central partof Sagami Bay from July 26, 2007 to February 19, 2008
3.1. Flow variability in the central part of Sagami Bay
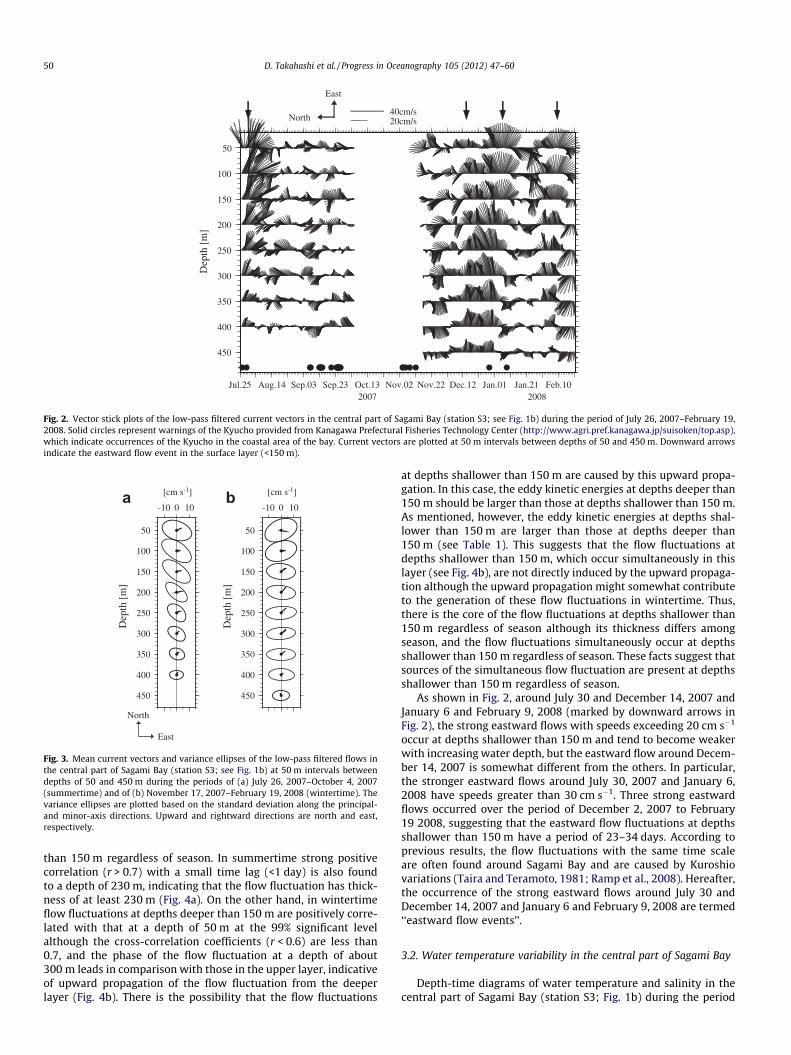
Fig. 2 shows vector stick plots of the low-pass filtered currentvectors at depths of 50–450 m in the central part of Sagami Bay(station S3; see Fig. 1b) during the period from July 26, 2007 toFebruary 19, 2008. Here, solid circles represent warnings of theKyucho provided from Kanagawa Prefectural Fisheries TechnologyCenter (http://www.agri.pref.kanagawa.jp/suisoken/top.asp),which indicate occurrences of the Kyucho in the coastal area ofthe bay. The occurrences of the Kyucho are identified from mooringcurrent data at Jogashima Island (see Fig. 1b), and the warnings ofthe Kyucho are announced when the occurrence frequency ofnorthward currents with speeds greater than 50 cm s�1 is largerthan 80% of the total occurrence frequency of currents during2 h. Fig. 3 shows the mean current vectors and variance ellipsesof the low-pass filtered flows at depths of 50–450 m during themooring period, and the statistics of the low-pass filtered flowsare presented in Table 1.
The flows in all layers exhibit low mean kinetic energy, KE, andhigh eddy kinetic energies, KE0; the ratios KE0=KE are greater than 1.The flow fluctuations are prominent in comparison with the meanflow in all layers, and the principal axes of these variance ellipsesdirected east-southeastward during the periods of July 26, 2007to October 4, 2007 (summertime) and eastward during the periodsof November 17, 2007 to February 19, 2008 (wintertime), respec-tively. There are larger flow fluctuations (KE0 > 80 cm2 s�2) atdepths shallower than 150 m regardless of season (Fig. 3 and Ta-ble 1). Over summertime, the flow fluctuations with amplitudeslarger than 10 cm s�1 are present at depths shallower than150 m, and the amplitude at depths deeper than 150 m becomessmaller with increasing water depth (Fig. 3a). In contrast, over win-tertime, the flow fluctuations with amplitudes larger than10 cm s�1 are also detected, but these fluctuations have a deeperstructure approaching 400 m (Fig. 3b).
Fig. 4 shows cross-correlation coefficients between the east-southeastward flow fluctuation at a depth of 50 m and that at eachdepth of 60–410 m during the period of July 26, 2007 to October 4,2007 (summertime), and between the eastward flow fluctuation ata depth of 50 m and that at each depth between 60–450 m duringthe period of November 17, 2007 to February 19, 2008 (winter-time). In these cases, magnitudes of cross-correlation coefficientat the 99% significant level are 0.05–0.07. This leads us to the con-clusion that most of the correlations are statistically significant atthe 99% level, whereas all the significant correlations are not al-ways physically meaningful. Here, we especially focus on strongcorrelations with magnitudes greater than 0.7.
During these periods, strong positive correlations with valuesgreater than 0.7 are detected without time lags at depths shallower
50
100
150
200
250
300
350
400
450
Dep
th [
m]
20cm/s40cm/s
North
East
Jul.25 Aug.14 Sep.03 Sep.23 Oct.13 Nov.02 Nov.22 Dec.12 Jan.01 Jan.21 Feb.102007 2008
Fig. 2. Vector stick plots of the low-pass filtered current vectors in the central part of Sagami Bay (station S3; see Fig. 1b) during the period of July 26, 2007–February 19,2008. Solid circles represent warnings of the Kyucho provided from Kanagawa Prefectural Fisheries Technology Center (http://www.agri.pref.kanagawa.jp/suisoken/top.asp),which indicate occurrences of the Kyucho in the coastal area of the bay. Current vectors are plotted at 50 m intervals between depths of 50 and 450 m. Downward arrowsindicate the eastward flow event in the surface layer (<150 m).
50
100
150
200
250
300
350
400
450
Dep
th [
m]
-10 0 10
[cm s-1]
East
North
50
100
150
200
250
300
350
400
450
Dep
th [
m]
-10 0 10
[cm s-1]a b
Fig. 3. Mean current vectors and variance ellipses of the low-pass filtered flows inthe central part of Sagami Bay (station S3; see Fig. 1b) at 50 m intervals betweendepths of 50 and 450 m during the periods of (a) July 26, 2007–October 4, 2007(summertime) and of (b) November 17, 2007–February 19, 2008 (wintertime). Thevariance ellipses are plotted based on the standard deviation along the principal-and minor-axis directions. Upward and rightward directions are north and east,respectively.
50 D. Takahashi et al. / Progress in Oceanography 105 (2012) 47–60
than 150 m regardless of season. In summertime strong positivecorrelation (r > 0.7) with a small time lag (<1 day) is also foundto a depth of 230 m, indicating that the flow fluctuation has thick-ness of at least 230 m (Fig. 4a). On the other hand, in wintertimeflow fluctuations at depths deeper than 150 m are positively corre-lated with that at a depth of 50 m at the 99% significant levelalthough the cross-correlation coefficients (r < 0.6) are less than0.7, and the phase of the flow fluctuation at a depth of about300 m leads in comparison with those in the upper layer, indicativeof upward propagation of the flow fluctuation from the deeperlayer (Fig. 4b). There is the possibility that the flow fluctuations
at depths shallower than 150 m are caused by this upward propa-gation. In this case, the eddy kinetic energies at depths deeper than150 m should be larger than those at depths shallower than 150 m.As mentioned, however, the eddy kinetic energies at depths shal-lower than 150 m are larger than those at depths deeper than150 m (see Table 1). This suggests that the flow fluctuations atdepths shallower than 150 m, which occur simultaneously in thislayer (see Fig. 4b), are not directly induced by the upward propaga-tion although the upward propagation might somewhat contributeto the generation of these flow fluctuations in wintertime. Thus,there is the core of the flow fluctuations at depths shallower than150 m regardless of season although its thickness differs amongseason, and the flow fluctuations simultaneously occur at depthsshallower than 150 m regardless of season. These facts suggest thatsources of the simultaneous flow fluctuation are present at depthsshallower than 150 m regardless of season.
As shown in Fig. 2, around July 30 and December 14, 2007 andJanuary 6 and February 9, 2008 (marked by downward arrows inFig. 2), the strong eastward flows with speeds exceeding 20 cm s�1
occur at depths shallower than 150 m and tend to become weakerwith increasing water depth, but the eastward flow around Decem-ber 14, 2007 is somewhat different from the others. In particular,the stronger eastward flows around July 30, 2007 and January 6,2008 have speeds greater than 30 cm s�1. Three strong eastwardflows occurred over the period of December 2, 2007 to February19 2008, suggesting that the eastward flow fluctuations at depthsshallower than 150 m have a period of 23–34 days. According toprevious results, the flow fluctuations with the same time scaleare often found around Sagami Bay and are caused by Kuroshiovariations (Taira and Teramoto, 1981; Ramp et al., 2008). Hereafter,the occurrence of the strong eastward flows around July 30 andDecember 14, 2007 and January 6 and February 9, 2008 are termed‘‘eastward flow events’’.
3.2. Water temperature variability in the central part of Sagami Bay
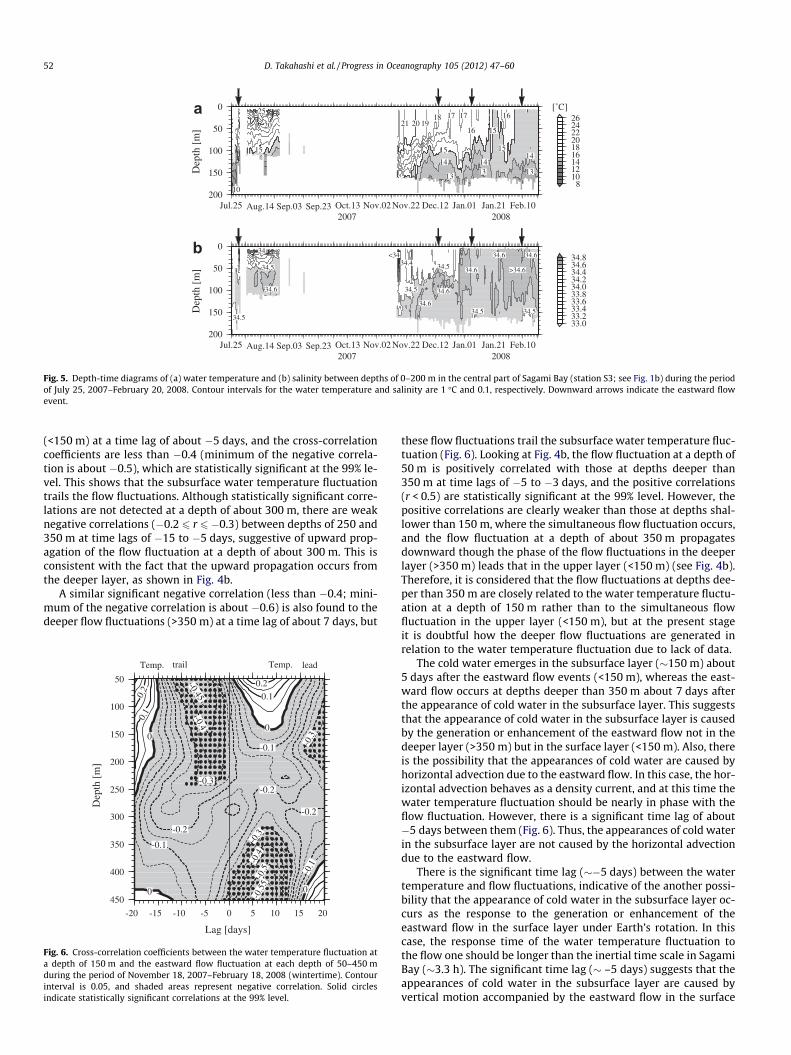
Depth-time diagrams of water temperature and salinity in thecentral part of Sagami Bay (station S3; Fig. 1b) during the period
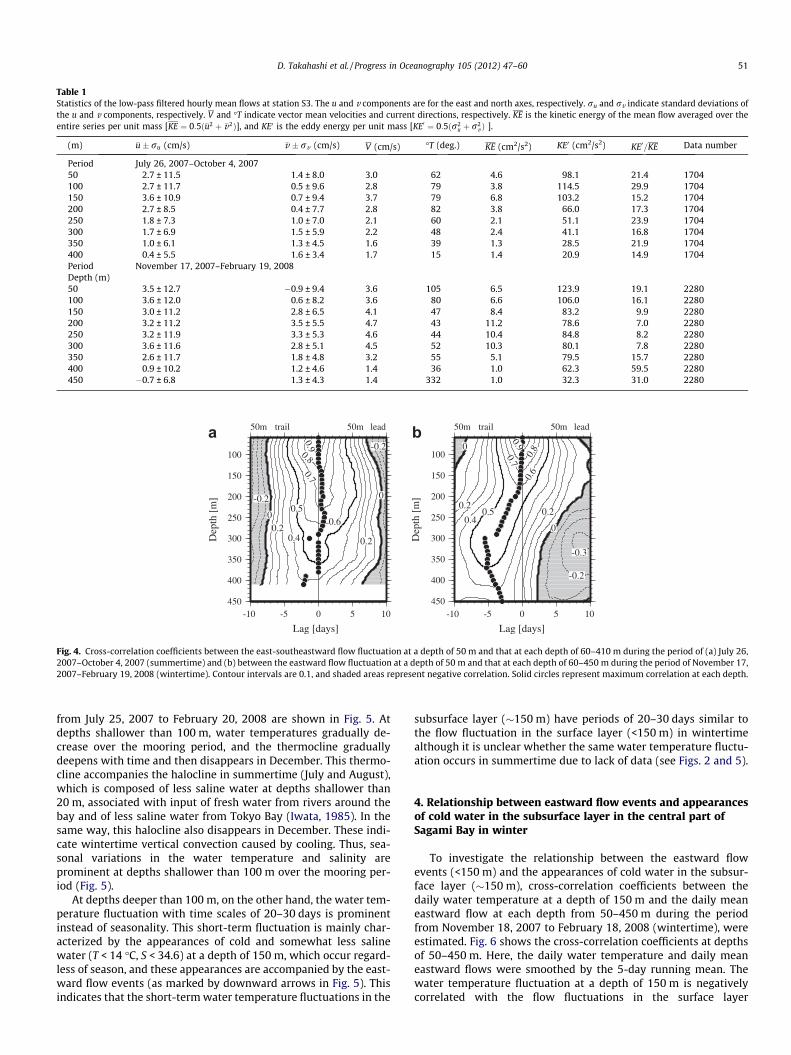
Table 1Statistics of the low-pass filtered hourly mean flows at station S3. The u and v components are for the east and north axes, respectively. ru and rv indicate standard deviations ofthe u and v components, respectively. V and �T indicate vector mean velocities and current directions, respectively. KE is the kinetic energy of the mean flow averaged over theentire series per unit mass [KE ¼ 0:5ð�u2 þ �v2Þ], and KE0 is the eddy energy per unit mass [KE0 ¼ 0:5ðr2
u þ r2v Þ ].
(m) �u� ru (cm/s) �v � rv (cm/s) V (cm/s) �T (deg.) KE (cm2/s2) KE0 (cm2/s2) KE0=KE Data number
Period July 26, 2007–October 4, 200750 2.7 ± 11.5 1.4 ± 8.0 3.0 62 4.6 98.1 21.4 1704100 2.7 ± 11.7 0.5 ± 9.6 2.8 79 3.8 114.5 29.9 1704150 3.6 ± 10.9 0.7 ± 9.4 3.7 79 6.8 103.2 15.2 1704200 2.7 ± 8.5 0.4 ± 7.7 2.8 82 3.8 66.0 17.3 1704250 1.8 ± 7.3 1.0 ± 7.0 2.1 60 2.1 51.1 23.9 1704300 1.7 ± 6.9 1.5 ± 5.9 2.2 48 2.4 41.1 16.8 1704350 1.0 ± 6.1 1.3 ± 4.5 1.6 39 1.3 28.5 21.9 1704400 0.4 ± 5.5 1.6 ± 3.4 1.7 15 1.4 20.9 14.9 1704Period November 17, 2007–February 19, 2008Depth (m)50 3.5 ± 12.7 �0.9 ± 9.4 3.6 105 6.5 123.9 19.1 2280100 3.6 ± 12.0 0.6 ± 8.2 3.6 80 6.6 106.0 16.1 2280150 3.0 ± 11.2 2.8 ± 6.5 4.1 47 8.4 83.2 9.9 2280200 3.2 ± 11.2 3.5 ± 5.5 4.7 43 11.2 78.6 7.0 2280250 3.2 ± 11.9 3.3 ± 5.3 4.6 44 10.4 84.8 8.2 2280300 3.6 ± 11.6 2.8 ± 5.1 4.5 52 10.3 80.1 7.8 2280350 2.6 ± 11.7 1.8 ± 4.8 3.2 55 5.1 79.5 15.7 2280400 0.9 ± 10.2 1.2 ± 4.6 1.4 36 1.0 62.3 59.5 2280450 �0.7 ± 6.8 1.3 ± 4.3 1.4 332 1.0 32.3 31.0 2280
-0.2
00.2
0.4
0.50.6
0.7
0.8
0.9
0.2
0
-0.2100
150
200
250
300
350
400
450
Dep
th [
m]
-10 -5 0 5 10
Lag [days]
50m trail 50m lead
0
0.2
0.40.5
0.6
0.7
0.8
0.9
0.2
0
-0.2
-0.3
100
150
200
250
300
350
400
450
Dep
th [
m]
-10 -5 0 5 10
Lag [days]
50m trail 50m leada b
Fig. 4. Cross-correlation coefficients between the east-southeastward flow fluctuation at a depth of 50 m and that at each depth of 60–410 m during the period of (a) July 26,2007–October 4, 2007 (summertime) and (b) between the eastward flow fluctuation at a depth of 50 m and that at each depth of 60–450 m during the period of November 17,2007–February 19, 2008 (wintertime). Contour intervals are 0.1, and shaded areas represent negative correlation. Solid circles represent maximum correlation at each depth.
D. Takahashi et al. / Progress in Oceanography 105 (2012) 47–60 51
from July 25, 2007 to February 20, 2008 are shown in Fig. 5. Atdepths shallower than 100 m, water temperatures gradually de-crease over the mooring period, and the thermocline graduallydeepens with time and then disappears in December. This thermo-cline accompanies the halocline in summertime (July and August),which is composed of less saline water at depths shallower than20 m, associated with input of fresh water from rivers around thebay and of less saline water from Tokyo Bay (Iwata, 1985). In thesame way, this halocline also disappears in December. These indi-cate wintertime vertical convection caused by cooling. Thus, sea-sonal variations in the water temperature and salinity areprominent at depths shallower than 100 m over the mooring per-iod (Fig. 5).
At depths deeper than 100 m, on the other hand, the water tem-perature fluctuation with time scales of 20–30 days is prominentinstead of seasonality. This short-term fluctuation is mainly char-acterized by the appearances of cold and somewhat less salinewater (T < 14 �C, S < 34.6) at a depth of 150 m, which occur regard-less of season, and these appearances are accompanied by the east-ward flow events (as marked by downward arrows in Fig. 5). Thisindicates that the short-term water temperature fluctuations in the
subsurface layer (�150 m) have periods of 20–30 days similar tothe flow fluctuation in the surface layer (<150 m) in wintertimealthough it is unclear whether the same water temperature fluctu-ation occurs in summertime due to lack of data (see Figs. 2 and 5).
4. Relationship between eastward flow events and appearancesof cold water in the subsurface layer in the central part ofSagami Bay in winter
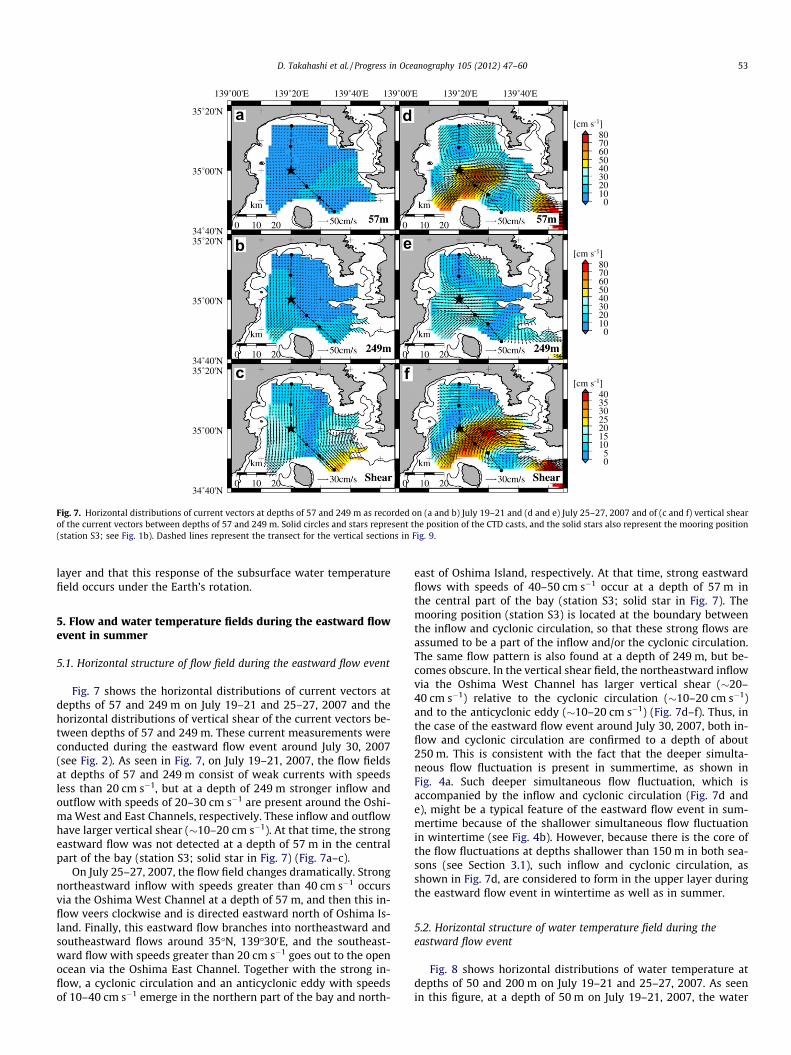
To investigate the relationship between the eastward flowevents (<150 m) and the appearances of cold water in the subsur-face layer (�150 m), cross-correlation coefficients between thedaily water temperature at a depth of 150 m and the daily meaneastward flow at each depth from 50–450 m during the periodfrom November 18, 2007 to February 18, 2008 (wintertime), wereestimated. Fig. 6 shows the cross-correlation coefficients at depthsof 50–450 m. Here, the daily water temperature and daily meaneastward flows were smoothed by the 5-day running mean. Thewater temperature fluctuation at a depth of 150 m is negativelycorrelated with the flow fluctuations in the surface layer
0
50
100
150
200D
epth
[m
]10
15
20
25
21 20 1918 17 17
16 15
15
16
15
14
13
1413
14
13
Jul.25 Aug.14 Sep.03 Sep.23 Oct.13 Nov.02 Nov.22 Dec.12 Jan.01 Jan.21 Feb.102007 2008
a
8101214161820222426
[˚C]
0
50
100
150
200
Dep
th [
m]
34.5
34.6
34.5
34<34
34.4
34.5
34.6
34.6
34.5 34.6
34.5
34.6
>34.6
34.5
34.6
Jul.25 Aug.14 Sep.03 Sep.23 Oct.13 Nov.02 Nov.22 Dec.12 Jan.01 Jan.21 Feb.102007 2008
b
33.033.233.433.633.834.034.234.434.634.8
Fig. 5. Depth-time diagrams of (a) water temperature and (b) salinity between depths of 0–200 m in the central part of Sagami Bay (station S3; see Fig. 1b) during the periodof July 25, 2007–February 20, 2008. Contour intervals for the water temperature and salinity are 1 �C and 0.1, respectively. Downward arrows indicate the eastward flowevent.
52 D. Takahashi et al. / Progress in Oceanography 105 (2012) 47–60
(<150 m) at a time lag of about �5 days, and the cross-correlationcoefficients are less than �0.4 (minimum of the negative correla-tion is about �0.5), which are statistically significant at the 99% le-vel. This shows that the subsurface water temperature fluctuationtrails the flow fluctuations. Although statistically significant corre-lations are not detected at a depth of about 300 m, there are weaknegative correlations (�0.2 6 r 6 �0.3) between depths of 250 and350 m at time lags of �15 to �5 days, suggestive of upward prop-agation of the flow fluctuation at a depth of about 300 m. This isconsistent with the fact that the upward propagation occurs fromthe deeper layer, as shown in Fig. 4b.
A similar significant negative correlation (less than �0.4; mini-mum of the negative correlation is about �0.6) is also found to thedeeper flow fluctuations (>350 m) at a time lag of about 7 days, but
50
100
150
200
250
300
350
400
450
Dep
th [
m]
-20 -15 -10 -5 0 5 10 15 20
Lag [days]
0
-0.1
-0.2
-0.3
-0.4-0.45
0
0.1
0.2
0
0.1
0.2
-0.1
-0.2
-0.3
-0.4
-0.5
-0.5
5
-0.3
-0.2
-0.1
0
Temp. trail Temp. lead
Fig. 6. Cross-correlation coefficients between the water temperature fluctuation ata depth of 150 m and the eastward flow fluctuation at each depth of 50–450 mduring the period of November 18, 2007–February 18, 2008 (wintertime). Contourinterval is 0.05, and shaded areas represent negative correlation. Solid circlesindicate statistically significant correlations at the 99% level.
these flow fluctuations trail the subsurface water temperature fluc-tuation (Fig. 6). Looking at Fig. 4b, the flow fluctuation at a depth of50 m is positively correlated with those at depths deeper than350 m at time lags of �5 to �3 days, and the positive correlations(r < 0.5) are statistically significant at the 99% level. However, thepositive correlations are clearly weaker than those at depths shal-lower than 150 m, where the simultaneous flow fluctuation occurs,and the flow fluctuation at a depth of about 350 m propagatesdownward though the phase of the flow fluctuations in the deeperlayer (>350 m) leads that in the upper layer (<150 m) (see Fig. 4b).Therefore, it is considered that the flow fluctuations at depths dee-per than 350 m are closely related to the water temperature fluctu-ation at a depth of 150 m rather than to the simultaneous flowfluctuation in the upper layer (<150 m), but at the present stageit is doubtful how the deeper flow fluctuations are generated inrelation to the water temperature fluctuation due to lack of data.
The cold water emerges in the subsurface layer (�150 m) about5 days after the eastward flow events (<150 m), whereas the east-ward flow occurs at depths deeper than 350 m about 7 days afterthe appearance of cold water in the subsurface layer. This suggeststhat the appearance of cold water in the subsurface layer is causedby the generation or enhancement of the eastward flow not in thedeeper layer (>350 m) but in the surface layer (<150 m). Also, thereis the possibility that the appearances of cold water are caused byhorizontal advection due to the eastward flow. In this case, the hor-izontal advection behaves as a density current, and at this time thewater temperature fluctuation should be nearly in phase with theflow fluctuation. However, there is a significant time lag of about�5 days between them (Fig. 6). Thus, the appearances of cold waterin the subsurface layer are not caused by the horizontal advectiondue to the eastward flow.
There is the significant time lag (��5 days) between the watertemperature and flow fluctuations, indicative of the another possi-bility that the appearance of cold water in the subsurface layer oc-curs as the response to the generation or enhancement of theeastward flow in the surface layer under Earth’s rotation. In thiscase, the response time of the water temperature fluctuation tothe flow one should be longer than the inertial time scale in SagamiBay (�3.3 h). The significant time lag (� –5 days) suggests that theappearances of cold water in the subsurface layer are caused byvertical motion accompanied by the eastward flow in the surface
139˚00'E 139˚20'E 139˚40'E
34˚40'N
35˚00'N
35˚20'N
34˚40'N
35˚00'N
35˚20'N
34˚40'N
35˚00'N
35˚20'N
139˚00'E 139˚20'E 139˚40'E
01020304050607080
[cm s-1]
01020304050607080
[cm s-1]
05
10152025303540
[cm s-1]
a
b
c
d
e
f
Fig. 7. Horizontal distributions of current vectors at depths of 57 and 249 m as recorded on (a and b) July 19–21 and (d and e) July 25–27, 2007 and of (c and f) vertical shearof the current vectors between depths of 57 and 249 m. Solid circles and stars represent the position of the CTD casts, and the solid stars also represent the mooring position(station S3; see Fig. 1b). Dashed lines represent the transect for the vertical sections in Fig. 9.
D. Takahashi et al. / Progress in Oceanography 105 (2012) 47–60 53
layer and that this response of the subsurface water temperaturefield occurs under the Earth’s rotation.
5. Flow and water temperature fields during the eastward flowevent in summer
5.1. Horizontal structure of flow field during the eastward flow event
Fig. 7 shows the horizontal distributions of current vectors atdepths of 57 and 249 m on July 19–21 and 25–27, 2007 and thehorizontal distributions of vertical shear of the current vectors be-tween depths of 57 and 249 m. These current measurements wereconducted during the eastward flow event around July 30, 2007(see Fig. 2). As seen in Fig. 7, on July 19–21, 2007, the flow fieldsat depths of 57 and 249 m consist of weak currents with speedsless than 20 cm s�1, but at a depth of 249 m stronger inflow andoutflow with speeds of 20–30 cm s�1 are present around the Oshi-ma West and East Channels, respectively. These inflow and outflowhave larger vertical shear (�10–20 cm s�1). At that time, the strongeastward flow was not detected at a depth of 57 m in the centralpart of the bay (station S3; solid star in Fig. 7) (Fig. 7a–c).
On July 25–27, 2007, the flow field changes dramatically. Strongnortheastward inflow with speeds greater than 40 cm s�1 occursvia the Oshima West Channel at a depth of 57 m, and then this in-flow veers clockwise and is directed eastward north of Oshima Is-land. Finally, this eastward flow branches into northeastward andsoutheastward flows around 35�N, 139�300E, and the southeast-ward flow with speeds greater than 20 cm s�1 goes out to the openocean via the Oshima East Channel. Together with the strong in-flow, a cyclonic circulation and an anticyclonic eddy with speedsof 10–40 cm s�1 emerge in the northern part of the bay and north-
east of Oshima Island, respectively. At that time, strong eastwardflows with speeds of 40–50 cm s�1 occur at a depth of 57 m inthe central part of the bay (station S3; solid star in Fig. 7). Themooring position (station S3) is located at the boundary betweenthe inflow and cyclonic circulation, so that these strong flows areassumed to be a part of the inflow and/or the cyclonic circulation.The same flow pattern is also found at a depth of 249 m, but be-comes obscure. In the vertical shear field, the northeastward inflowvia the Oshima West Channel has larger vertical shear (�20–40 cm s�1) relative to the cyclonic circulation (�10–20 cm s�1)and to the anticyclonic eddy (�10–20 cm s�1) (Fig. 7d–f). Thus, inthe case of the eastward flow event around July 30, 2007, both in-flow and cyclonic circulation are confirmed to a depth of about250 m. This is consistent with the fact that the deeper simulta-neous flow fluctuation is present in summertime, as shown inFig. 4a. Such deeper simultaneous flow fluctuation, which isaccompanied by the inflow and cyclonic circulation (Fig. 7d ande), might be a typical feature of the eastward flow event in sum-mertime because of the shallower simultaneous flow fluctuationin wintertime (see Fig. 4b). However, because there is the core ofthe flow fluctuations at depths shallower than 150 m in both sea-sons (see Section 3.1), such inflow and cyclonic circulation, asshown in Fig. 7d, are considered to form in the upper layer duringthe eastward flow event in wintertime as well as in summer.
5.2. Horizontal structure of water temperature field during theeastward flow event
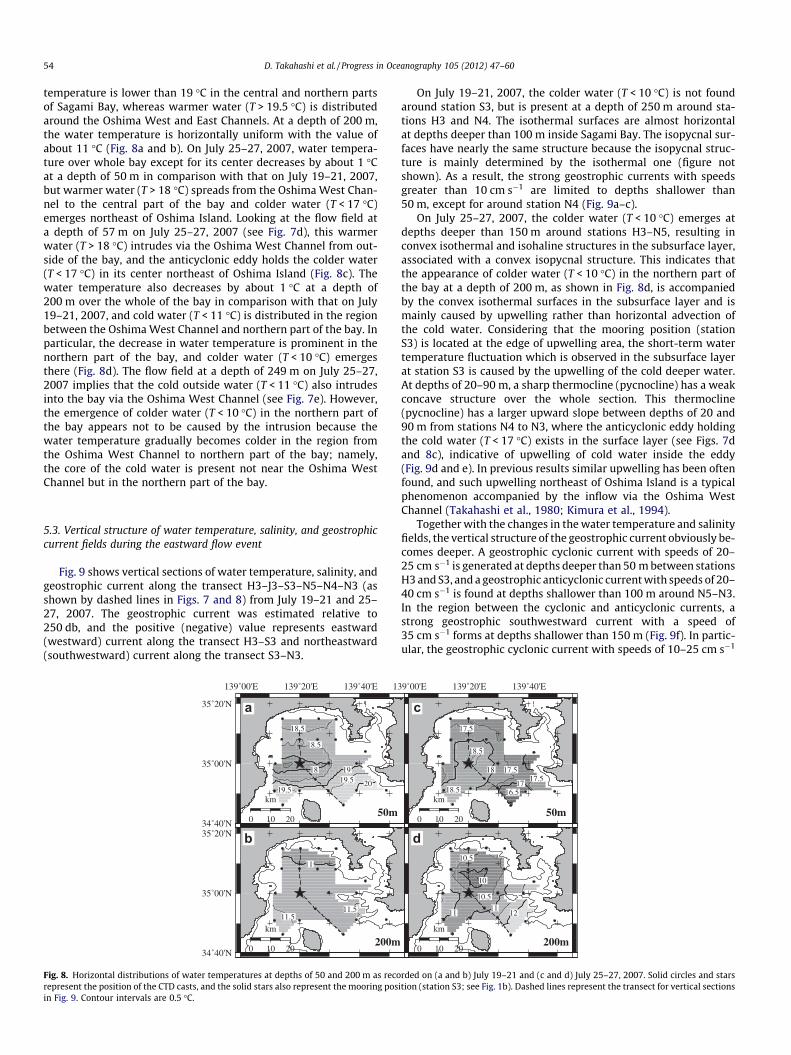
Fig. 8 shows horizontal distributions of water temperature atdepths of 50 and 200 m on July 19–21 and 25–27, 2007. As seenin this figure, at a depth of 50 m on July 19–21, 2007, the water
54 D. Takahashi et al. / Progress in Oceanography 105 (2012) 47–60
temperature is lower than 19 �C in the central and northern partsof Sagami Bay, whereas warmer water (T > 19.5 �C) is distributedaround the Oshima West and East Channels. At a depth of 200 m,the water temperature is horizontally uniform with the value ofabout 11 �C (Fig. 8a and b). On July 25–27, 2007, water tempera-ture over whole bay except for its center decreases by about 1 �Cat a depth of 50 m in comparison with that on July 19–21, 2007,but warmer water (T > 18 �C) spreads from the Oshima West Chan-nel to the central part of the bay and colder water (T < 17 �C)emerges northeast of Oshima Island. Looking at the flow field ata depth of 57 m on July 25–27, 2007 (see Fig. 7d), this warmerwater (T > 18 �C) intrudes via the Oshima West Channel from out-side of the bay, and the anticyclonic eddy holds the colder water(T < 17 �C) in its center northeast of Oshima Island (Fig. 8c). Thewater temperature also decreases by about 1 �C at a depth of200 m over the whole of the bay in comparison with that on July19–21, 2007, and cold water (T < 11 �C) is distributed in the regionbetween the Oshima West Channel and northern part of the bay. Inparticular, the decrease in water temperature is prominent in thenorthern part of the bay, and colder water (T < 10 �C) emergesthere (Fig. 8d). The flow field at a depth of 249 m on July 25–27,2007 implies that the cold outside water (T < 11 �C) also intrudesinto the bay via the Oshima West Channel (see Fig. 7e). However,the emergence of colder water (T < 10 �C) in the northern part ofthe bay appears not to be caused by the intrusion because thewater temperature gradually becomes colder in the region fromthe Oshima West Channel to northern part of the bay; namely,the core of the cold water is present not near the Oshima WestChannel but in the northern part of the bay.
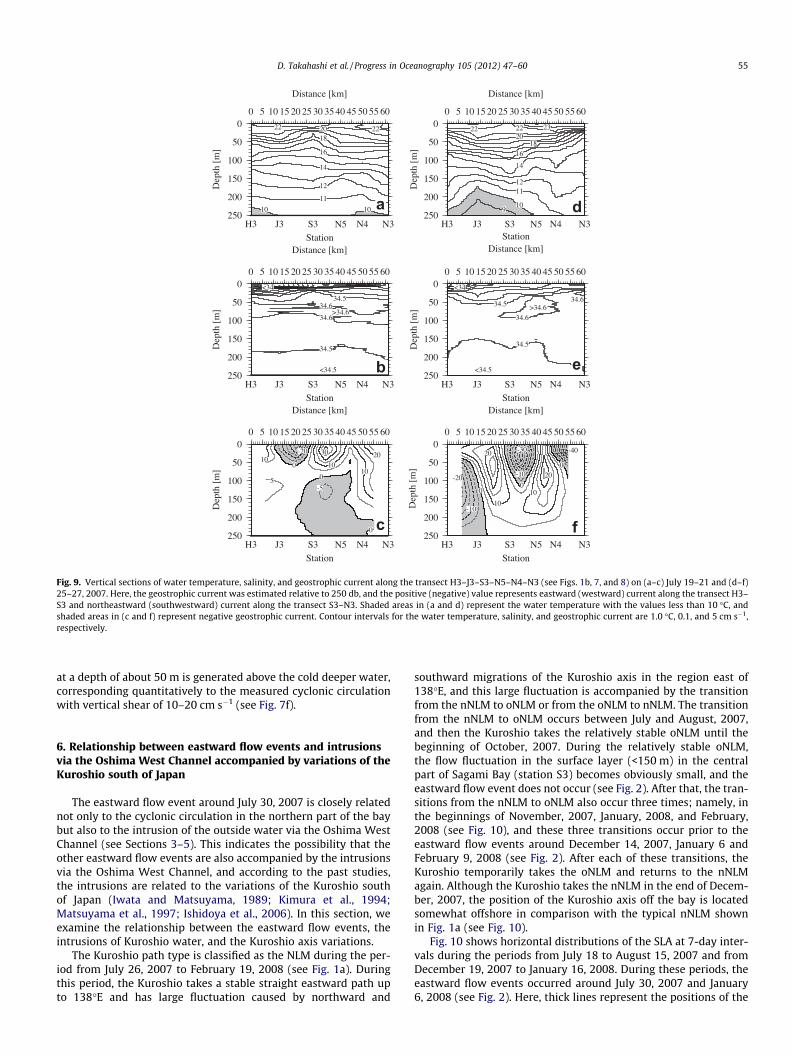
5.3. Vertical structure of water temperature, salinity, and geostrophiccurrent fields during the eastward flow event
Fig. 9 shows vertical sections of water temperature, salinity, andgeostrophic current along the transect H3–J3–S3–N5–N4–N3 (asshown by dashed lines in Figs. 7 and 8) from July 19–21 and 25–27, 2007. The geostrophic current was estimated relative to250 db, and the positive (negative) value represents eastward(westward) current along the transect H3–S3 and northeastward(southwestward) current along the transect S3–N3.
18.5
18.5
18 19
19.519.5 20
139˚00'E 139˚20'E 139˚40'E
34˚40'N
35˚00'N
35˚20'N
0 10 20
km
a
50m
11
11.511.5
34˚40'N
35˚00'N
35˚20'N
0 10 20
km
b
200m
13
Fig. 8. Horizontal distributions of water temperatures at depths of 50 and 200 m as recorepresent the position of the CTD casts, and the solid stars also represent the mooring posin Fig. 9. Contour intervals are 0.5 �C.
On July 19–21, 2007, the colder water (T < 10 �C) is not foundaround station S3, but is present at a depth of 250 m around sta-tions H3 and N4. The isothermal surfaces are almost horizontalat depths deeper than 100 m inside Sagami Bay. The isopycnal sur-faces have nearly the same structure because the isopycnal struc-ture is mainly determined by the isothermal one (figure notshown). As a result, the strong geostrophic currents with speedsgreater than 10 cm s�1 are limited to depths shallower than50 m, except for around station N4 (Fig. 9a–c).
On July 25–27, 2007, the colder water (T < 10 �C) emerges atdepths deeper than 150 m around stations H3–N5, resulting inconvex isothermal and isohaline structures in the subsurface layer,associated with a convex isopycnal structure. This indicates thatthe appearance of colder water (T < 10 �C) in the northern part ofthe bay at a depth of 200 m, as shown in Fig. 8d, is accompaniedby the convex isothermal surfaces in the subsurface layer and ismainly caused by upwelling rather than horizontal advection ofthe cold water. Considering that the mooring position (stationS3) is located at the edge of upwelling area, the short-term watertemperature fluctuation which is observed in the subsurface layerat station S3 is caused by the upwelling of the cold deeper water.At depths of 20–90 m, a sharp thermocline (pycnocline) has a weakconcave structure over the whole section. This thermocline(pycnocline) has a larger upward slope between depths of 20 and90 m from stations N4 to N3, where the anticyclonic eddy holdingthe cold water (T < 17 �C) exists in the surface layer (see Figs. 7dand 8c), indicative of upwelling of cold water inside the eddy(Fig. 9d and e). In previous results similar upwelling has been oftenfound, and such upwelling northeast of Oshima Island is a typicalphenomenon accompanied by the inflow via the Oshima WestChannel (Takahashi et al., 1980; Kimura et al., 1994).
Together with the changes in the water temperature and salinityfields, the vertical structure of the geostrophic current obviously be-comes deeper. A geostrophic cyclonic current with speeds of 20–25 cm s�1 is generated at depths deeper than 50 m between stationsH3 and S3, and a geostrophic anticyclonic current with speeds of 20–40 cm s�1 is found at depths shallower than 100 m around N5–N3.In the region between the cyclonic and anticyclonic currents, astrong geostrophic southwestward current with a speed of35 cm s�1 forms at depths shallower than 150 m (Fig. 9f). In partic-ular, the geostrophic cyclonic current with speeds of 10–25 cm s�1
16.517
17.5
17.517.5
18
18.5
18.5
9˚00'E 139˚20'E 139˚40'E
0 10 20
km
c
50m
12
10.5
11
10.5
11
10
0 10 20
km
d
200m
rded on (a and b) July 19–21 and (c and d) July 25–27, 2007. Solid circles and starsition (station S3; see Fig. 1b). Dashed lines represent the transect for vertical sections
0
50
100
150
200
250D
epth
[m
]
0 5 10 15 20 25 30 35 40 45 50 55 60
Distance [km]
10 10
11
12
14
16
1820 2222
aH3 J3 S3 N5 N4 N3
Station
0
50
100
150
200
250
Dep
th [
m]
0 5 10 15 20 25 30 35 40 45 50 55 60
Distance [km]
<34.5
34.5
34.6>34.6
34.634.5
<34
bH3 J3 S3 N5 N4 N3
Station
0
50
100
150
200
250
Dep
th [
m]
0 5 10 15 20 25 30 35 40 45 50 55 60
Distance [km]
0
-5
0
10
30 20
100
-2010
5
cH3 J3 S3 N5 N4 N3
Station
0
50
100
150
200
250
Dep
th [
m]
0 5 10 15 20 25 30 35 40 45 50 55 60
Distance [km]
910
1112
14
1618
202222 23
dH3 J3 S3 N5 N4 N3
Station
0
50
100
150
200
250
Dep
th [
m]
0 5 10 15 20 25 30 35 40 45 50 55 60
Distance [km]
<34.5
34.5
34.6>34.634.5
34.6
<34
eH3 J3 S3 N5 N4 N3
Station
0
50
100
150
200
250
Dep
th [
m]
0 5 10 15 20 25 30 35 40 45 50 55 60
Distance [km]
0
-10
-30 -40
0
20
10
0
-10
-20
10
20
fH3 J3 S3 N5 N4 N3
Station
Fig. 9. Vertical sections of water temperature, salinity, and geostrophic current along the transect H3–J3–S3–N5–N4–N3 (see Figs. 1b, 7, and 8) on (a–c) July 19–21 and (d–f)25–27, 2007. Here, the geostrophic current was estimated relative to 250 db, and the positive (negative) value represents eastward (westward) current along the transect H3–S3 and northeastward (southwestward) current along the transect S3–N3. Shaded areas in (a and d) represent the water temperature with the values less than 10 �C, andshaded areas in (c and f) represent negative geostrophic current. Contour intervals for the water temperature, salinity, and geostrophic current are 1.0 �C, 0.1, and 5 cm s�1,respectively.
D. Takahashi et al. / Progress in Oceanography 105 (2012) 47–60 55
at a depth of about 50 m is generated above the cold deeper water,corresponding quantitatively to the measured cyclonic circulationwith vertical shear of 10–20 cm s�1 (see Fig. 7f).
6. Relationship between eastward flow events and intrusionsvia the Oshima West Channel accompanied by variations of theKuroshio south of Japan
The eastward flow event around July 30, 2007 is closely relatednot only to the cyclonic circulation in the northern part of the baybut also to the intrusion of the outside water via the Oshima WestChannel (see Sections 3–5). This indicates the possibility that theother eastward flow events are also accompanied by the intrusionsvia the Oshima West Channel, and according to the past studies,the intrusions are related to the variations of the Kuroshio southof Japan (Iwata and Matsuyama, 1989; Kimura et al., 1994;Matsuyama et al., 1997; Ishidoya et al., 2006). In this section, weexamine the relationship between the eastward flow events, theintrusions of Kuroshio water, and the Kuroshio axis variations.
The Kuroshio path type is classified as the NLM during the per-iod from July 26, 2007 to February 19, 2008 (see Fig. 1a). Duringthis period, the Kuroshio takes a stable straight eastward path upto 138�E and has large fluctuation caused by northward and
southward migrations of the Kuroshio axis in the region east of138�E, and this large fluctuation is accompanied by the transitionfrom the nNLM to oNLM or from the oNLM to nNLM. The transitionfrom the nNLM to oNLM occurs between July and August, 2007,and then the Kuroshio takes the relatively stable oNLM until thebeginning of October, 2007. During the relatively stable oNLM,the flow fluctuation in the surface layer (<150 m) in the centralpart of Sagami Bay (station S3) becomes obviously small, and theeastward flow event does not occur (see Fig. 2). After that, the tran-sitions from the nNLM to oNLM also occur three times; namely, inthe beginnings of November, 2007, January, 2008, and February,2008 (see Fig. 10), and these three transitions occur prior to theeastward flow events around December 14, 2007, January 6 andFebruary 9, 2008 (see Fig. 2). After each of these transitions, theKuroshio temporarily takes the oNLM and returns to the nNLMagain. Although the Kuroshio takes the nNLM in the end of Decem-ber, 2007, the position of the Kuroshio axis off the bay is locatedsomewhat offshore in comparison with the typical nNLM shownin Fig. 1a (see Fig. 10).
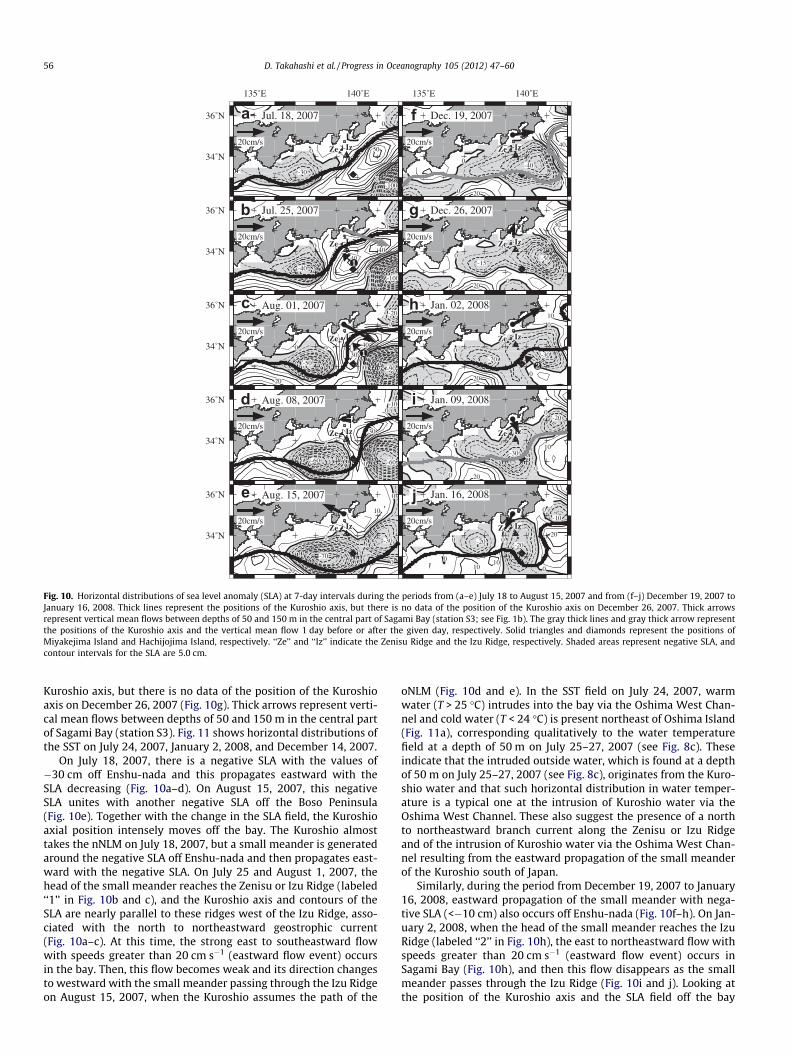
Fig. 10 shows horizontal distributions of the SLA at 7-day inter-vals during the periods from July 18 to August 15, 2007 and fromDecember 19, 2007 to January 16, 2008. During these periods, theeastward flow events occurred around July 30, 2007 and January6, 2008 (see Fig. 2). Here, thick lines represent the positions of the
Ze Iz
135˚E 140˚E
34˚N
36˚N
20cm/s0
-30
50
0
0-100
a Jul. 18, 2007
Ze Iz34˚N
36˚N
20cm/s0
-40
4040
0
0-100
b Jul. 25, 2007
Ze Iz34˚N
36˚N
20cm/s
20
0 0
-50
40
30
0
-20
0 -90
c Aug. 01, 2007
Ze Iz34˚N
36˚N
20cm/s
20
0
-60
30
0-10
0 -60
d Aug. 08, 2007
Ze Iz34˚N
36˚N
20cm/s
20
0
-70
10
0
0
-30
e Aug. 15, 2007
Ze Iz
135˚E 140˚E
20cm/s
0 20
0
40
0
-40
f Dec. 19, 2007
Ze Iz20cm/s
0 20
0
0
-15
30
0
-50
g Dec. 26, 2007
Ze Iz20cm/s
0 20
0
0
-20
100
-30
h Jan. 02, 2008
Ze Iz20cm/s
0 20
0
0
-30
0-20
10
i Jan. 09, 2008
Ze Iz20cm/s
010
10
0 -20 0-20
0
0-10
20
j Jan. 16, 2008
Fig. 10. Horizontal distributions of sea level anomaly (SLA) at 7-day intervals during the periods from (a–e) July 18 to August 15, 2007 and from (f–j) December 19, 2007 toJanuary 16, 2008. Thick lines represent the positions of the Kuroshio axis, but there is no data of the position of the Kuroshio axis on December 26, 2007. Thick arrowsrepresent vertical mean flows between depths of 50 and 150 m in the central part of Sagami Bay (station S3; see Fig. 1b). The gray thick lines and gray thick arrow representthe positions of the Kuroshio axis and the vertical mean flow 1 day before or after the given day, respectively. Solid triangles and diamonds represent the positions ofMiyakejima Island and Hachijojima Island, respectively. ‘‘Ze’’ and ‘‘Iz’’ indicate the Zenisu Ridge and the Izu Ridge, respectively. Shaded areas represent negative SLA, andcontour intervals for the SLA are 5.0 cm.
56 D. Takahashi et al. / Progress in Oceanography 105 (2012) 47–60
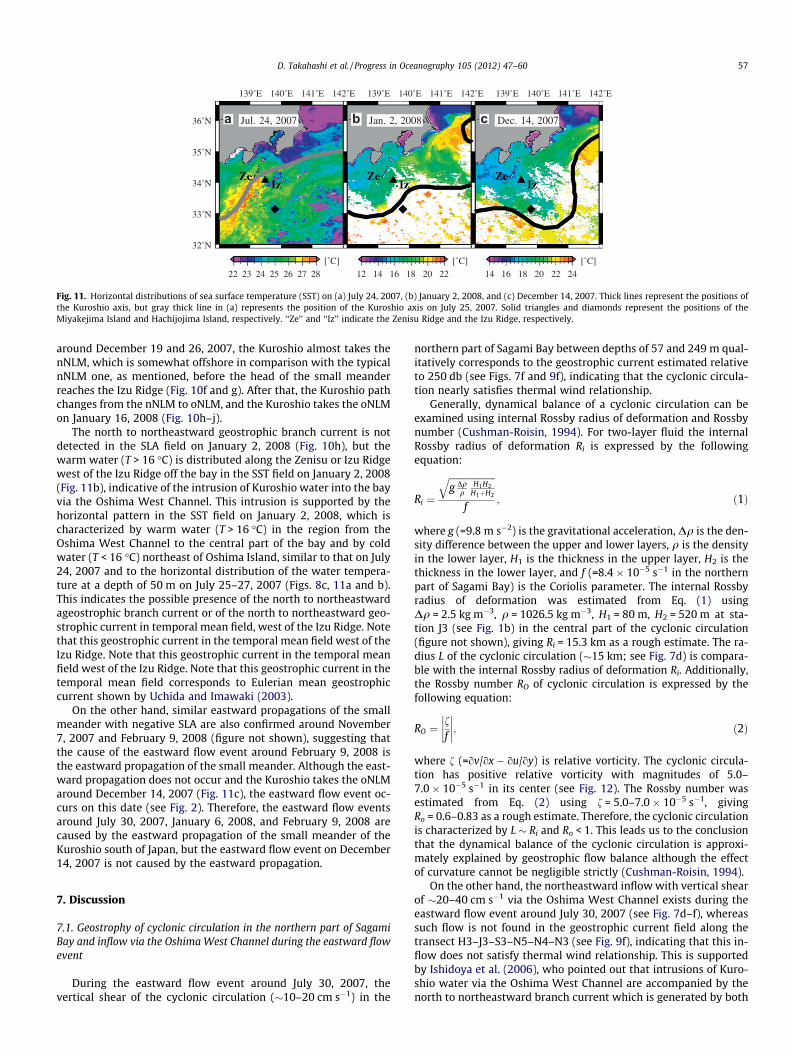
Kuroshio axis, but there is no data of the position of the Kuroshioaxis on December 26, 2007 (Fig. 10g). Thick arrows represent verti-cal mean flows between depths of 50 and 150 m in the central partof Sagami Bay (station S3). Fig. 11 shows horizontal distributions ofthe SST on July 24, 2007, January 2, 2008, and December 14, 2007.
On July 18, 2007, there is a negative SLA with the values of�30 cm off Enshu-nada and this propagates eastward with theSLA decreasing (Fig. 10a–d). On August 15, 2007, this negativeSLA unites with another negative SLA off the Boso Peninsula(Fig. 10e). Together with the change in the SLA field, the Kuroshioaxial position intensely moves off the bay. The Kuroshio almosttakes the nNLM on July 18, 2007, but a small meander is generatedaround the negative SLA off Enshu-nada and then propagates east-ward with the negative SLA. On July 25 and August 1, 2007, thehead of the small meander reaches the Zenisu or Izu Ridge (labeled‘‘1’’ in Fig. 10b and c), and the Kuroshio axis and contours of theSLA are nearly parallel to these ridges west of the Izu Ridge, asso-ciated with the north to northeastward geostrophic current(Fig. 10a–c). At this time, the strong east to southeastward flowwith speeds greater than 20 cm s�1 (eastward flow event) occursin the bay. Then, this flow becomes weak and its direction changesto westward with the small meander passing through the Izu Ridgeon August 15, 2007, when the Kuroshio assumes the path of the
oNLM (Fig. 10d and e). In the SST field on July 24, 2007, warmwater (T > 25 �C) intrudes into the bay via the Oshima West Chan-nel and cold water (T < 24 �C) is present northeast of Oshima Island(Fig. 11a), corresponding qualitatively to the water temperaturefield at a depth of 50 m on July 25–27, 2007 (see Fig. 8c). Theseindicate that the intruded outside water, which is found at a depthof 50 m on July 25–27, 2007 (see Fig. 8c), originates from the Kuro-shio water and that such horizontal distribution in water temper-ature is a typical one at the intrusion of Kuroshio water via theOshima West Channel. These also suggest the presence of a northto northeastward branch current along the Zenisu or Izu Ridgeand of the intrusion of Kuroshio water via the Oshima West Chan-nel resulting from the eastward propagation of the small meanderof the Kuroshio south of Japan.
Similarly, during the period from December 19, 2007 to January16, 2008, eastward propagation of the small meander with nega-tive SLA (<�10 cm) also occurs off Enshu-nada (Fig. 10f–h). On Jan-uary 2, 2008, when the head of the small meander reaches the IzuRidge (labeled ‘‘2’’ in Fig. 10h), the east to northeastward flow withspeeds greater than 20 cm s�1 (eastward flow event) occurs inSagami Bay (Fig. 10h), and then this flow disappears as the smallmeander passes through the Izu Ridge (Fig. 10i and j). Looking atthe position of the Kuroshio axis and the SLA field off the bay
139˚E 140˚E 141˚E 142˚E
32˚N
33˚N
34˚N
35˚N
36˚N a Jul. 24, 2007
22 23 24 25 26 27 28
[˚C]
139˚E 140˚E 141˚E 142˚E
b Jan. 2, 2008
12 14 16 18 20 22
[˚C]
139˚E 140˚E 141˚E 142˚E
c Dec. 14, 2007
14 16 18 20 22 24
[˚C]
Fig. 11. Horizontal distributions of sea surface temperature (SST) on (a) July 24, 2007, (b) January 2, 2008, and (c) December 14, 2007. Thick lines represent the positions ofthe Kuroshio axis, but gray thick line in (a) represents the position of the Kuroshio axis on July 25, 2007. Solid triangles and diamonds represent the positions of theMiyakejima Island and Hachijojima Island, respectively. ‘‘Ze’’ and ‘‘Iz’’ indicate the Zenisu Ridge and the Izu Ridge, respectively.
D. Takahashi et al. / Progress in Oceanography 105 (2012) 47–60 57
around December 19 and 26, 2007, the Kuroshio almost takes thenNLM, which is somewhat offshore in comparison with the typicalnNLM one, as mentioned, before the head of the small meanderreaches the Izu Ridge (Fig. 10f and g). After that, the Kuroshio pathchanges from the nNLM to oNLM, and the Kuroshio takes the oNLMon January 16, 2008 (Fig. 10h–j).
The north to northeastward geostrophic branch current is notdetected in the SLA field on January 2, 2008 (Fig. 10h), but thewarm water (T > 16 �C) is distributed along the Zenisu or Izu Ridgewest of the Izu Ridge off the bay in the SST field on January 2, 2008(Fig. 11b), indicative of the intrusion of Kuroshio water into the bayvia the Oshima West Channel. This intrusion is supported by thehorizontal pattern in the SST field on January 2, 2008, which ischaracterized by warm water (T > 16 �C) in the region from theOshima West Channel to the central part of the bay and by coldwater (T < 16 �C) northeast of Oshima Island, similar to that on July24, 2007 and to the horizontal distribution of the water tempera-ture at a depth of 50 m on July 25–27, 2007 (Figs. 8c, 11a and b).This indicates the possible presence of the north to northeastwardageostrophic branch current or of the north to northeastward geo-strophic current in temporal mean field, west of the Izu Ridge. Notethat this geostrophic current in the temporal mean field west of theIzu Ridge. Note that this geostrophic current in the temporal meanfield west of the Izu Ridge. Note that this geostrophic current in thetemporal mean field corresponds to Eulerian mean geostrophiccurrent shown by Uchida and Imawaki (2003).
On the other hand, similar eastward propagations of the smallmeander with negative SLA are also confirmed around November7, 2007 and February 9, 2008 (figure not shown), suggesting thatthe cause of the eastward flow event around February 9, 2008 isthe eastward propagation of the small meander. Although the east-ward propagation does not occur and the Kuroshio takes the oNLMaround December 14, 2007 (Fig. 11c), the eastward flow event oc-curs on this date (see Fig. 2). Therefore, the eastward flow eventsaround July 30, 2007, January 6, 2008, and February 9, 2008 arecaused by the eastward propagation of the small meander of theKuroshio south of Japan, but the eastward flow event on December14, 2007 is not caused by the eastward propagation.
7. Discussion
7.1. Geostrophy of cyclonic circulation in the northern part of SagamiBay and inflow via the Oshima West Channel during the eastward flowevent
During the eastward flow event around July 30, 2007, thevertical shear of the cyclonic circulation (�10–20 cm s�1) in the
northern part of Sagami Bay between depths of 57 and 249 m qual-itatively corresponds to the geostrophic current estimated relativeto 250 db (see Figs. 7f and 9f), indicating that the cyclonic circula-tion nearly satisfies thermal wind relationship.
Generally, dynamical balance of a cyclonic circulation can beexamined using internal Rossby radius of deformation and Rossbynumber (Cushman-Roisin, 1994). For two-layer fluid the internalRossby radius of deformation Ri is expressed by the followingequation:
Ri ¼
ffiffiffiffiffiffiffiffiffiffiffiffiffiffiffiffiffiffiffiffig Dq
qH1H2
H1þH2
q
f; ð1Þ
where g (=9.8 m s�2) is the gravitational acceleration, Dq is the den-sity difference between the upper and lower layers, q is the densityin the lower layer, H1 is the thickness in the upper layer, H2 is thethickness in the lower layer, and f (=8.4 � 10�5 s�1 in the northernpart of Sagami Bay) is the Coriolis parameter. The internal Rossbyradius of deformation was estimated from Eq. (1) usingDq = 2.5 kg m�3, q = 1026.5 kg m�3, H1 = 80 m, H2 = 520 m at sta-tion J3 (see Fig. 1b) in the central part of the cyclonic circulation(figure not shown), giving Ri = 15.3 km as a rough estimate. The ra-dius L of the cyclonic circulation (�15 km; see Fig. 7d) is compara-ble with the internal Rossby radius of deformation Ri. Additionally,the Rossby number RO of cyclonic circulation is expressed by thefollowing equation:
RO ¼ff
��������; ð2Þ
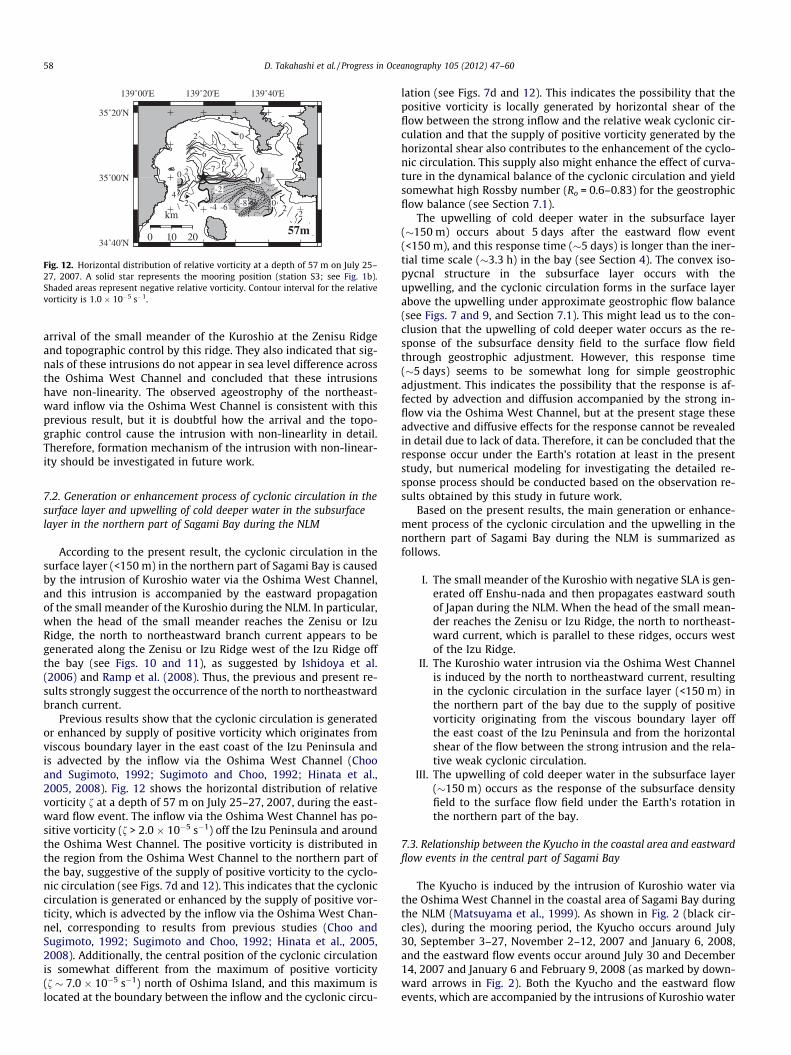
where f (=ov/ox � ou/oy) is relative vorticity. The cyclonic circula-tion has positive relative vorticity with magnitudes of 5.0–7.0 � 10�5 s�1 in its center (see Fig. 12). The Rossby number wasestimated from Eq. (2) using f = 5.0–7.0 � 10�5 s�1, givingRo = 0.6–0.83 as a rough estimate. Therefore, the cyclonic circulationis characterized by L � Ri and Ro < 1. This leads us to the conclusionthat the dynamical balance of the cyclonic circulation is approxi-mately explained by geostrophic flow balance although the effectof curvature cannot be negligible strictly (Cushman-Roisin, 1994).
On the other hand, the northeastward inflow with vertical shearof �20–40 cm s�1 via the Oshima West Channel exists during theeastward flow event around July 30, 2007 (see Fig. 7d–f), whereassuch flow is not found in the geostrophic current field along thetransect H3–J3–S3–N5–N4–N3 (see Fig. 9f), indicating that this in-flow does not satisfy thermal wind relationship. This is supportedby Ishidoya et al. (2006), who pointed out that intrusions of Kuro-shio water via the Oshima West Channel are accompanied by thenorth to northeastward branch current which is generated by both
139˚00'E 139˚20'E 139˚40'E
34˚40'N
35˚00'N
35˚20'N
0 10 20
km-8-6-4
-2
0
00
0
2
22
2
24
22
466
7
57m
Fig. 12. Horizontal distribution of relative vorticity at a depth of 57 m on July 25–27, 2007. A solid star represents the mooring position (station S3; see Fig. 1b).Shaded areas represent negative relative vorticity. Contour interval for the relativevorticity is 1.0 � 10�5 s�1.
58 D. Takahashi et al. / Progress in Oceanography 105 (2012) 47–60
arrival of the small meander of the Kuroshio at the Zenisu Ridgeand topographic control by this ridge. They also indicated that sig-nals of these intrusions do not appear in sea level difference acrossthe Oshima West Channel and concluded that these intrusionshave non-linearity. The observed ageostrophy of the northeast-ward inflow via the Oshima West Channel is consistent with thisprevious result, but it is doubtful how the arrival and the topo-graphic control cause the intrusion with non-linearlity in detail.Therefore, formation mechanism of the intrusion with non-linear-ity should be investigated in future work.
7.2. Generation or enhancement process of cyclonic circulation in thesurface layer and upwelling of cold deeper water in the subsurfacelayer in the northern part of Sagami Bay during the NLM
According to the present result, the cyclonic circulation in thesurface layer (<150 m) in the northern part of Sagami Bay is causedby the intrusion of Kuroshio water via the Oshima West Channel,and this intrusion is accompanied by the eastward propagationof the small meander of the Kuroshio during the NLM. In particular,when the head of the small meander reaches the Zenisu or IzuRidge, the north to northeastward branch current appears to begenerated along the Zenisu or Izu Ridge west of the Izu Ridge offthe bay (see Figs. 10 and 11), as suggested by Ishidoya et al.(2006) and Ramp et al. (2008). Thus, the previous and present re-sults strongly suggest the occurrence of the north to northeastwardbranch current.
Previous results show that the cyclonic circulation is generatedor enhanced by supply of positive vorticity which originates fromviscous boundary layer in the east coast of the Izu Peninsula andis advected by the inflow via the Oshima West Channel (Chooand Sugimoto, 1992; Sugimoto and Choo, 1992; Hinata et al.,2005, 2008). Fig. 12 shows the horizontal distribution of relativevorticity f at a depth of 57 m on July 25–27, 2007, during the east-ward flow event. The inflow via the Oshima West Channel has po-sitive vorticity (f > 2.0 � 10�5 s�1) off the Izu Peninsula and aroundthe Oshima West Channel. The positive vorticity is distributed inthe region from the Oshima West Channel to the northern part ofthe bay, suggestive of the supply of positive vorticity to the cyclo-nic circulation (see Figs. 7d and 12). This indicates that the cycloniccirculation is generated or enhanced by the supply of positive vor-ticity, which is advected by the inflow via the Oshima West Chan-nel, corresponding to results from previous studies (Choo andSugimoto, 1992; Sugimoto and Choo, 1992; Hinata et al., 2005,2008). Additionally, the central position of the cyclonic circulationis somewhat different from the maximum of positive vorticity(f � 7.0 � 10�5 s�1) north of Oshima Island, and this maximum islocated at the boundary between the inflow and the cyclonic circu-
lation (see Figs. 7d and 12). This indicates the possibility that thepositive vorticity is locally generated by horizontal shear of theflow between the strong inflow and the relative weak cyclonic cir-culation and that the supply of positive vorticity generated by thehorizontal shear also contributes to the enhancement of the cyclo-nic circulation. This supply also might enhance the effect of curva-ture in the dynamical balance of the cyclonic circulation and yieldsomewhat high Rossby number (Ro = 0.6–0.83) for the geostrophicflow balance (see Section 7.1).
The upwelling of cold deeper water in the subsurface layer(�150 m) occurs about 5 days after the eastward flow event(<150 m), and this response time (�5 days) is longer than the iner-tial time scale (�3.3 h) in the bay (see Section 4). The convex iso-pycnal structure in the subsurface layer occurs with theupwelling, and the cyclonic circulation forms in the surface layerabove the upwelling under approximate geostrophic flow balance(see Figs. 7 and 9, and Section 7.1). This might lead us to the con-clusion that the upwelling of cold deeper water occurs as the re-sponse of the subsurface density field to the surface flow fieldthrough geostrophic adjustment. However, this response time(�5 days) seems to be somewhat long for simple geostrophicadjustment. This indicates the possibility that the response is af-fected by advection and diffusion accompanied by the strong in-flow via the Oshima West Channel, but at the present stage theseadvective and diffusive effects for the response cannot be revealedin detail due to lack of data. Therefore, it can be concluded that theresponse occur under the Earth’s rotation at least in the presentstudy, but numerical modeling for investigating the detailed re-sponse process should be conducted based on the observation re-sults obtained by this study in future work.
Based on the present results, the main generation or enhance-ment process of the cyclonic circulation and the upwelling in thenorthern part of Sagami Bay during the NLM is summarized asfollows.
I. The small meander of the Kuroshio with negative SLA is gen-erated off Enshu-nada and then propagates eastward southof Japan during the NLM. When the head of the small mean-der reaches the Zenisu or Izu Ridge, the north to northeast-ward current, which is parallel to these ridges, occurs westof the Izu Ridge.
II. The Kuroshio water intrusion via the Oshima West Channelis induced by the north to northeastward current, resultingin the cyclonic circulation in the surface layer (<150 m) inthe northern part of the bay due to the supply of positivevorticity originating from the viscous boundary layer offthe east coast of the Izu Peninsula and from the horizontalshear of the flow between the strong intrusion and the rela-tive weak cyclonic circulation.
III. The upwelling of cold deeper water in the subsurface layer(�150 m) occurs as the response of the subsurface densityfield to the surface flow field under the Earth’s rotation inthe northern part of the bay.
7.3. Relationship between the Kyucho in the coastal area and eastwardflow events in the central part of Sagami Bay
The Kyucho is induced by the intrusion of Kuroshio water viathe Oshima West Channel in the coastal area of Sagami Bay duringthe NLM (Matsuyama et al., 1999). As shown in Fig. 2 (black cir-cles), during the mooring period, the Kyucho occurs around July30, September 3–27, November 2–12, 2007 and January 6, 2008,and the eastward flow events occur around July 30 and December14, 2007 and January 6 and February 9, 2008 (as marked by down-ward arrows in Fig. 2). Both the Kyucho and the eastward flowevents, which are accompanied by the intrusions of Kuroshio water
D. Takahashi et al. / Progress in Oceanography 105 (2012) 47–60 59
via the Oshima West Channel, occur around July 30, 2007 and Jan-uary 6, 2008, indicating that the Kyucho around July 30, 2007 andJanuary 6, 2008 are caused by the intrusions. Also, the Kyuchoaround November 2–12, 2007, when the mooring observation isnot conducted, is caused by the intrusion via the Oshima WestChannel accompanied by eastward propagation, which is con-firmed from the analysis of the position data of the Kuroshio axis,the SLA, and SST fields (figure not shown). In contrast, the Kyuchoaround September 3–27, 2007, when the Kuroshio takes the oNLM(figure not shown), does not occur with an eastward flow event(see Fig. 2), indicating that the cause of this Kyucho is not intrusionvia the Oshima West Channel. Matsuyama et al. (1997) and Igetaet al. (2003) indicated that the cause of the Kyucho is not onlythe intrusion via the Oshima West Channel but also meteorologicalforcing and that the Kyucho, which propagates like coastal-trappedwaves from the Boso Peninsula to the bay, is induced by a typhoonpassing near the bay. In fact, a typhoon passes south of the bayaround September 5–7, 2007 (figure not shown). Thus, the Kyuchoaround September 5–7, 2007 is considered to be caused by the ty-phoon passage. After that, however, the Kyucho often occurs with-out the typhoon passage during September. Considering thatinfluence of the typhoon passage does not persist so long, this indi-cates that there are other mechanisms inducing the Kyucho afterSeptember 7, 2007. During this period, intrusions of Kuroshiowater via the Oshima East Channel appear to occur (figure notshown). Sugimoto and Choo (1992) pointed out from the analysisof the satellite SST data that the Kuroshio water often intrudesvia the Oshima East Channel and that the intruded water behaveas a density current in the coastal area of the bay. Therefore, it isconsidered that the Kyucho after September 7, 2007 is related tothe intrusion of Kuroshio water via the Oshima East Channel. It ishowever necessary to confirming the detailed relationship be-tween the Kyucho and the intrusion of Kuroshio water via theOshima East Channel in the future work.
As shown in Fig. 2, eastward flow events occur around Decem-ber 14, 2007 and February 9, 2008, but the Kyucho is not inducedin the coastal area. Around December 14, 2007, the eastward flowsin the surface layer (<150 m) are weaker in comparison with thosein the other events. At this time, the Kuroshio takes the oNLM (seeSection 6), and the Kuroshio water (T > 19 �C) seems to intrude viathe Oshima East Channel into the bay (see Fig. 11c). This indicatesthe possible presence of the cyclonic circulation accompanied bythe intrusion via the Oshima East Channel, which is not strong en-ough to induce the Kyucho, during the oNLM. This is supported bySugimoto and Choo (1992). In contrast, the eastward flow eventaround February 9, 2008 is accompanied by the eastward propaga-tion of the small meander of the Kuroshio (figure not shown), butthe Kyucho is not also induced in the coastal area. This reasonmight be related to both the width and volume transport of theintrusion of Kuroshio water via the Oshima West Channel, becausethe generation of the Kyucho strongly depends on these intrusioncharacteristics (Sugimoto and Choo, 1992).
Therefore, it is concluded that the Kyucho in the coastal areatends to be induced by the intrusion of Kuroshio water via theOshima West Channel and is closely related to both the cycloniccirculation and the upwelling in the northern part of the bay dur-ing the NLM.
8. Summary
We investigated the short-term flow and water temperaturefluctuations in Sagami Bay associated with the variations of theKuroshio during the NLM using mooring and hydrographic obser-vation data. The short-term flow and water temperature fluctua-tions are closely related to the generation or enhancement of the
cyclonic circulation in the surface layer (<150 m) and the upwell-ing of cold deeper water in the subsurface layer (�150 m) in thenorthern part of the bay, respectively. The cyclonic circulation isgenerated or enhanced by the intrusion via the Oshima West Chan-nel regardless of season, and this intrusion is accompanied by theeastward propagation of the small meander of the Kuroshio southof Japan during the transition from the nNLM to oNLM. Togetherwith the generation or enhancement of the cyclonic circulation,the upwelling occurs as the response of the subsurface density fieldto the surface flow field under the Earth’s rotation.
The Kyucho in the coastal area, which is induced by the intru-sion via the Oshima West Channel, tends to occur not only withthe cyclonic circulation but also with upwelling in the northernpart of the bay. This indicates the possibility that the Kyucho isan indicator of upwelling and cyclonic circulation in the northernpart of the bay during the NLM. It should be noted, however, thatthis scenario is subject to some presumptions. It is therefore neces-sary to conduct simultaneous mooring observations in both thecentral part and coastal area of Sagami Bay and many hydrographicobservations during the NLM to confirming the detailed relation-ship between the cyclonic circulation, the upwelling, the Kyuchoin the future work.
Acknowledgments
The present study was supported by the Solution Oriented Re-search for Science and Technology (SORST) project of the Japan Sci-ence and Technology Agency (JST). The authors would like toacknowledge the crew and officers of R/V Tanseimaru of the JapanAgency for Marine-Earth Science and Technology (JAMSTEC). Theauthors also extend their gratitude to the staff and students ofthe Hydrospheric Atmospheric Research Center (HyARC) of NagoyaUniversity for their assistance in observations. Thanks are ex-tended to the guest editor and anonymous reviewers for their valu-able comments.
References
Choo, H.S., Sugimoto, T., 1992. Hydraulic model experiment on the circulation inSagami Bay (1) – dependency of the circulation pattern on Reynolds and Rossbynumbers in barotropic rotating model. Bulletin on Coastal Oceanography 29,179–189 (in Japanese with English Abstr.).
Cushman-Roisin, B., 1994. Introduction to Geophysical Fluid Dynamics. Prentice-Hall, Englewood Cliffs, 320 pp.
Hinata, H., Yanagi, T., Takano, T., Kawamura, H., 2005. Wind-induced Kuroshiowarm water intrusion into Sagami Bay. Journal of Geophysical Research 110(C3), C03023. http://dx.doi.org/10.1029/2004JC002300.
Hinata, H., Yanagi, T., Satoh, C., 2008. Sea level response to wind field fluctuationaround the tip of the Izu Peninsula. Journal of Oceanography 64, 605–620.
Igeta, Y., Kitade, Y., Matsuyama, M., 2003. Numerical experiments on the Kyuchocurrent in Sagami Bay associated with the coastal-trapped waves caused bytyphoon 8818. Oceanography in Japan 12, 603–617 (in Japanese with EnglishAbstr.).
Ishidoya, H., Kitade, Y., Matsuyama, M., Iwata, S., Ishii, M., Igeta, Y., 2006. TheKyucho current in Sagami Bay and at the mouth of Tokyo Bay induced by theeastward propagation of small meanders of the Kuroshio. Oceanography inJapan 15, 235–247 (in Japanese with English Abstr.).
Iwata, S., 1985. Physical Environments in Sagami Bay. Coastal Oceanography ofJapanese Islands. Tokai University Press, pp. 401–409 (in Japanese).
Iwata, S., Matsuyama, M., 1989. Surface circulation in Sagami Bay: the response tovariations of the Kuroshio axis. Journal of the Oceanographical Society of Japan45, 310–320.
Joyce, T.M., 1989. On in situ ‘‘calibration’’ on shipboard ADCPs. Journal ofAtmospheric and Oceanographic Technology 6, 169–172.
Kawabe, M., 1985. Sea level variations at the Izu islands and typical stable paths ofthe Kuroshio. Journal of the Oceanographical Society of Japan 41, 307–326.
Kawabe, M., 1986. Transition processes between the three typical paths of theKuroshio. Journal of the Oceanographical Society of Japan 42, 174–191.
Kawabe, M., 1987. Spectral properties of sea level and time scales of Kuroshio pathvariations. Journal of the Oceanographical Society of Japan 43, 111–123.
Kawabe, M., Yoneno, M., 1987. Water and flow variations in Sagami Bay under theinfluence of the Kuroshio path. Journal of the Oceanographical Society of Japan43, 283–294.

60 D. Takahashi et al. / Progress in Oceanography 105 (2012) 47–60
Kimura, S., Choo, H.S., Sugimoto, T., 1994. Characteristics of the eddy caused by Izu–Oshima Island and the Kuroshio branch current in Sagami Bay, Japan. Journal ofOceanography 50, 373–389.
Matsuyama, M., Iwata, S., Nagamatsu, H., 1997. Kyucho in Sagami Bay induced byTyphoon 8818. Journal of Oceanography 53, 199–205.
Matsuyama, M., Ishidoya, H., Iwata, S., Kitade, Y., 1999. Kyucho induced by intrusionof Kuroshio water in Sagami Bay, Japan. Continental Shelf Research 19, 1561–1575.
Ramp, S.V., Barrick, D.E., Ito, T., Cook, M.S., 2008. Variability of the Kuroshio currentsouth of Sagami Bay as observed using long-range coastal HF radars. Journal ofGeophysical Research 110 (C3), C06024. http://dx.doi.org/10.1029/2007JC004132.
Saino, T., 2007. Ocean primary productivity monitoring using an underwaterprofiling buoy system. Bulletin on Coastal Oceanography 45 (1), 17–28.
Sugimoto, T., Choo, H.S., 1992. Generation mechanism of the Kyucho event (asudden rapid coastal boundary current) in the coastal area of the Kuroshio.Bulletin on Coastal Oceanography 30, 45–57 (in Japanese with English Abstr.).
Taira, K., Teramoto, T., 1981. Velocity fluctuations of the Kuroshio near the Izu Ridgeand their relationship to current path. Deep-Sea Research 28, 1187–1197.
Taira, K., Teramoto, T., 1986. Path and volume transport of the Kuroshio current inSagami Bay and their relationship to cold water masses near Izu Peninsula.Journal of the Oceanographical Society of Japan 42, 221–223.
Takahashi, M., Koike, I., Ishimaru, T., Saino, T., Furuya, K., Fujita, Y., Hattori, A., Ichimura,S., 1980. Upwelling plumes in Sagami Bay and adjacent water around the IzuIslands, Japan. Journal of the Oceanographical Society of Japan 36, 209–216.
Uchida, H., Imawaki, S., 2003. Eulerian mean surface velocity field derived bycombining drifter and satellite altimeter data. Geophysical Research Letter 30(5), 1229. http://dx.doi.org/10.1029/2002GL016445.


![Meander dynamics: A nonlinear model without curvature ... · meander migration. 2.1.3. A Meander Morphology Submodel [15] Because the large‐scale one‐dimensional morphody-namic](https://img.pdfslide.us/doc/110x75/5f05de4d7e708231d4151de3/meander-dynamics-a-nonlinear-model-without-curvature-meander-migration-213.jpg)