Embed Size (px)
Citation preview

Short selling, subscription period price movements, and the attractiveness of rights issues to shareholders – a cross country study*
Peter K. Pham† and Cameron K.S. Yuen‡
April 4, 2017
Abstract
Rights issues are designed to safeguard shareholder interests, so it is puzzling that they tend to attract low small shareholder participation and have largely disappeared in some major markets like the US. We study a critical vulnerability faced by uninformed shareholders in a rights issue that arises from short selling activity. Using a comprehensive dataset of 10,952 rights issues in 43 countries, we document a significant decline in price and issue discount during rights subscription period that can be explained by firm-level and market-level proxies for short selling constraints. Short selling activity also increases before and unwinds sharply after the close of a rights issue. Our results are supported by an identification strategy based on a regression discontinuity design that exploits a naked short sale regulation in Australia. Overall, our evidence highlights the need for strengthening regulations of rights issues, especially in trading environments where short-sales related investor protection is still arbitrary.
* Preliminary version. Please do not cite. The authors would like to thank Espen Eckbo and Robert Turmakin for their suggestions. All errors are our own. † Corresponding author. UNSW Business School, UNSW Sydney, NSW 2052, [email protected] ‡ Commonwealth Bank of Australia.

1
1. Introduction
“In current market conditions, there is increased potential for market abuse through short
selling during rights issues. As a result there has been severe volatility in the shares of
companies conducting rights issues. This is potentially damaging not only to the issuers in
question but also to confidence in the overall fairness and quality of the UK market. It can be
particularly prejudicial to the interests of small investors.”
FSA Press Release, 13 June 2008
On the 13th June 2008, the Financial Services Authority (FSA) of the United Kingdom
introduced mandatory disclosure of short positions in stocks undertaking rights issues.
Although this directive is part of a suite of measures aimed at curbing excess volatility during
the Global Financial Crisis, it highlights that the FSA was particularly concerned about a
significant perceived risk in the rights offering process. Indeed, the situation around rights
offerings is a special one. These transactions often play out over a prolonged duration, adding
a degree of execution risk for the offeror and creating vulnerability for small uninformed
shareholders (Holderness and Pontiff, 2015). Short selling activity can complicate the rights
offering process by creating temporary excess volatility and making stock prices potentially
less informative. The possibility that short sales can distort the integrity of a seasoned equity
offer is modelled in Gerard and Nanda (1993) and in the specific context of a rights offering,
this risk is further exacerbated by the fact that the offer price is fixed at the announcement
date (Eckbo and Masulis, 1992).
These concerns over potential adverse effects of short selling activity directly
challenge the legal doctrines that historically created rights offerings as a way to safeguard
interests of minority shareholders. The conventional wisdom is that – due to their legal
structure – rights offerings provide a fair and equitable means for raising capital. This stems

2
from the “right of first refusal” principle, enshrined in company laws and corporate charters
around the world, which requires that, without a shareholder resolution to the contrary, a
seasoned equity offering (SEO) must be sold as a “rights offer” to existing shareholders
(Eckbo, 2008). Other important regulations include the transferability of rights, which
enables shareholders to trade their rights if they do not wish to partake in the offering, and
uniform offer schedules, which allow shareholders to have sufficient time to consider an
offer. Their general aim is to protect shareholders, particularly minority shareholders, from
wealth transfers and dilution that can occur when new shareholders subscribe to the offering
(Myners, 2005).
But do these mechanisms provide sufficient protection for shareholders in a rights
issue? The FSA’s action mentioned above suggests that this might not be the case. Further, a
number of recent corporate scandals4 seem to demonstrate that the rights offering process can
in fact be abused. Indeed, similar concerns have been raised in the existing academic
literature as an explanation for the demise of rights offers in the US. Holderness and Pontiff
(2015) explain the lack of US rights issues by arguing that they do not provide sufficient
protection to uninformed or irrational existing shareholders. They suggest that rights
offerings tend to transfer wealth to blockholders, insiders, and institutions at the expense of,
typically smaller, individual shareholders. Such findings are also mirrored by Kothare (1997)
who document that blockholder and insider ownership increases around rights offerings, and
the Finnish study by Rantapuska and Knupfer (2008) that shows that unsophisticated
shareholders are less willing to participate.
The wealth transfer hypothesis of Holderness and Pontiff (2015) and Kothare (1997) 4 For example, the £4 billion rights offer failure by HBOS in 2008 in the UK illustrates the substantial consequences of short selling during rights offers. Over the course of the two month offering, HBOS share price collapsed as it emerged that Harbinger Capital had naked short sold £300m-worth of HBOS shares. By the end of the offering, HBOS’s market price had dropped over 50 percent breaching its issue price in the process. A lack of shareholder subscription (8.3 percent take-up) forced underwriters Morgan Stanley and Desdner Kleinwort to take-up 1.375bn shares.

3
does not delve into how some market participants can take advantage of the rights offering
process at the expense of existing (small) shareholders, but it is well established in the
broader context of SEOs that short selling activity is a potential avenue. Safieddine and
Wilhelm (1996) documented that, in the US, it is common for traders to establish short
positions prior to seasoned equity offerings (SEOs) to create an artificial discount in the price
of new shares. It is often difficult to disentangle whether such trading was driven by
‘manipulation’ or ‘information’, but regardless, the gravity of the threat was enough for the
Securities and Exchange Commission (SEC) to adopt rule 10b-21 on August 25, 1988 in
response to short selling practices around SEOs.5
The rationale behind this concern is formalised in Gerard and Nanda (1993). Their
model predicts that, because the issue price of an equity offer is set (at a discount to the
market price) with consideration for secondary market order flows, a strategic informed
trader can conduct manipulative trading in a way that decreases the informativeness of order
flows, thereby worsening the winner’s curse problem and forcing a larger issue discount. This
means that even if an informed trader has positive information, he/she has an incentive to
(short) sell shares in the secondary market to conceal his/her information prior to the SEO.
It is important to point out that SEOs in the US (as the setting of the Gerard and
Nanda (1993) model), which are mainly underwritten firm-commitment offerings, differ quite
significantly from the traditionally understood ‘rights offering’ process in an international
context. Nevertheless, the characteristics of a rights issue are similar enough to potentially
lend itself to the same concerns over short selling activity raised by the SEC. Extending the
Gerard and Nanda (1993) theory, it is possible that informed investors in a rights offering
could plausibly use short selling to create pressure on stock prices and/or make it less
5 10b-21 prohibited the use of shares purchased at the offer price of an SEO to cover short positions established after the filing of a registration statement.

4
informative. By doing so, these short sellers may benefit from wealth transfers to the extent
that other (mainly uninformed) rights holders do not subscribe to their rights. When
uninformed shareholders sell their rights by themselves in the market, allow brokers to sell
rights on their behalf, or forfeit rights altogether, informed investors can potentially pick up
these shares/rights cheaply. In this regard, informed investors have an incentive to make
stock prices less informative.
Another non-information-asymmetry based explanation of short selling activity
around a right issue is raised by Eckbo and Mauslis (1992). They suggest that such activities
occur simply because the mechanical characteristics of rights offerings reduce the cost of
hedging short positions. As more short positions are opened during the offering, the resulting
sell orders reduce the market price making it less attractive for stockholders to exercise their
rights.
In light of the above theoretical explanations and the puzzling phenomenon of low
shareholder take-up in rights issues, our study investigates whether short selling activity
actually increases during the process of completing a right issue, making it less attractive for
existing shareholders. We measure the effect of such activity by analysing stock returns of
rights-issuing firms during the rights subscription period and whether proxies for short selling
incentives and constraints at the market and firm levels can explain such returns.
The majority of studies in the extant rights offering literature have focused on the
informational content released at the announcement date of an issue (for a review, see Eckbo,
Masulis and Norli, 2007). Our study differs as it focuses on the rights subscription period
that follows the announcement – from the ex-date to the close of the offer – a period
generally not characterised by new information events and one that has surprisingly been

5
neglected by the extant literature.6 To do this, we construct a dataset comprising 10,952
international rights offerings by 7,260 firms in 43 countries from 2002 to 2014 which, to the
best of our knowledge, is the most comprehensive international dataset on rights issues in the
extant literature.
The baseline finding of our study is that, around the world, there is a significant
decline in price and a corresponding erosion of issue discount over a rights subscription
period. Issuing firms experience, on average, a negative 4.1 percent abnormal return and a 6.2
percentage point erosion of issue discount from the ex-date of a rights offering to the
subscription end date.. We also find that the decline largely stops around the end of the
subscription period and in some cases reverts to a positive return after this date. This price
pattern that we document is highly perplexing, given that post the announcement date, the
closing of a rights issue should be a non-information event, and hence, from an efficient
market perspective, one should not expect any price trend.
Does short selling activity contribute to explaining this puzzling price phenomenon?
As a first step to address this question, we explore several firm and issue characteristics that
potentially explain the cross-sectional variations in subscription period price decline. We find
that the decline is more significant for firms that are illiquid, have less information
transparency, have more insider ownership, and have a greater stock price run-up prior to the
commencement of the offering. In addition, rights issues with larger discounts, more
generous offering ratios, and shorter durations tend to exhibit more negative subscription
period returns. We argue that these characteristics are related to short selling incentives. For
example, from a risk perspective, Eckbo and Masulis (1992), hedging short positions using
6 Technically, the ‘rights subscription period’ could also be considered as the period between the subscription start date and the subscription end date (i.e., the time period that rights holders can subscribe to their rights). In most cases, the ex-date and the subscription start date are very close together; thus, for the purposes of this paper, we consider the ‘rights subscription period’ as the ex-date to the subscription end date

6
rights is arguably more attractive when the issue is shorter, the company is more illiquid and
when the stock price has experienced a large run-up prior to the offering. With a
manipulation explanation, as raised by Gerard and Nanda (1993), short selling activities may
propagate in firm environments with a high level of information asymmetry and significant
scope for wealth transfers from uninformed investors.
Gerard and Nanda (1993) raise an important caveat in their theory that, empirically,
not all observed short selling activity in an SEO context is for the purpose to conceal real
information, but instead can be driven by private information (see e.g., Diamond and
Verrecchia, 1987; Aitken, Frino, McCorry and Swan 1998; Boehmer and Wu, 2013). Our
setting is based on the rights subscription period, which occurs well after the announcement
of a rights issue and therefore should not, on average, produce new information.
Nevertheless, this assumption may not always hold, and thus we also explore whether the
observed pattern in rights subscription period return reflects informed trading. If this is the
case, then one would not expect the negative prices during rights offerings to reverse after the
offering. However, we actually find evidence indicating such a reversal. In all specifications
that we examine, there is a strong negative correlation between returns during the
subscription period and returns after the offering.
Motivated by the above evidence, we conduct a number of analyses that examine the
role of short selling activity on the rights issue process more directly. We begin by examining
the efficacy of different short selling constraints, imposed by regulators around the world, in
mitigating the negative subscription period price pressure induced by short sales. In doing so,
we closely follow the works of Beber and Pagano (2013), Bris, Goetzmann and Zhu (2007),
and Jain, Jain, McInish and McKenzie (2013) among others, who all utilise the rich cross-
country and time-series variation in short selling legality and feasibility. Similar to these
studies, we construct a comprehensive set of measures related to market-level short sales

7
regulations that varies across countries and over time. Our results from this analysis support
our expectation that constraints on short selling lead to less negative returns during rights
offerings. Following Beber and Pagano (2013), we also examine variations in regulations
within a country. In particular, rights issues by financial firms, for which shares are protected
by temporary short selling bans during the global financial crisis, are less exposed to negative
price pressure during the subscription period than rights issues of other firms.
Whilst the above results indicate that short sales constraints help ease the negative
price pressure observed on average during rights subscription periods, they are not based on a
direct measure of the extent of short selling activity. In another set of analyses, we narrow in
on a more clinical setting – the Australian market – where short selling in Australian equities
is subject to a mandatory disclosure regime that encompasses both short volume and short
interest (Comerton-Forde et al., 2016). With these data, we document a sharp and immediate
decrease in both short volume and short interest at the subscription end date, despite the fact
that this date is not an information event. Following the methodology of Henry and Koski
(2008), we also find that the ability to short a firm, as proxied by normal short volume before
the issue, not only predicts negative returns during the subscription period, but also positive
returns immediately after it. The result again implies that short selling during rights issues is
unlikely to be informed.
While the ability to measure daily short selling activity is an advantage, it does not
fully address endogeneity problems. Firms that can be short sold are different to those that
cannot be in many unobservable ways. As an identification strategy, we employ a fuzzy
regression discontinuity design (RDD), which takes advantage of a unique historical
regulation in the Australian Securities Exchange (ASX) in relation to naked short sales.7 Prior
7 A naked short sale is where a participant enters an order in the market and does not have in place arrangements for delivery of the security.
8
to 22 September 2008, naked short selling was permitted only for companies classified by the
ASX as “approved instruments”, mainly based on whether a firm has a market value greater
than A$100 million. The fuzzy RDD design captures the impact of this regulation because the
cut-off is not sharp but subject to the ASX’s discretion. We find that around the discontinuity
point (i.e., A$100 million), rights issuers that are also in the “approved instruments” list tend
to have more negative returns during the subscription period, than those that are not. This
finding puts the spotlight on the possibility that rights offerings are highly susceptible to
naked short selling strategies, as suggested by Eckbo and Masulis (1992).8 However, we note
that similar implications apply to all types of short selling activities because the legality of
naked short selling should also create a competitive pressure that reduces the cost of covered
short selling.
This paper is one of the first comprehensive international studies of the rights offering
market.9 Our findings add to the debate that consider the benefits and costs of rights offerings
– a debate that started with Smith’s (1977) work on the disappearing rights phenomenon.
Existing studies on both SEOs and rights offerings have mostly been restricted to country
specific analysis, and their attention is predominantly on announcement effects. Our study
extends the extant literature by examining the price dynamic that ensues throughout the rights
subscription period – a time frame that has surprisingly been neglected – and shows that the
negative price effect is not only confined to just the announcement of an issue.
In an Australian context, a closely related study to ours is Balachandran et al. (2012),
which also documents a decline in price during rights subscription period. However, their
study and ours differ significantly in other aspects. We show that rights subscription period
price decline is a not specific to the Australian market but widely observed around the world.
8 Anecdotally, naked short selling was a key reason for HBOS’s £4 billion rights offering failure mentioned in Footnote 2. In that example, institutional investors naked short sold over £300m-worth of HBOS shares. 9 The working paper of Massa, Vermaelen and Xu (2013) is the only other international study of rights issues.

9
Unlike our study, Balachandran et al. (2012) focus on the correlation between shareholder
take-up and subscription period returns. The authors contend that the gradual revelation of
shareholder take-up drives the negative price adjustments over the subscription period. If this
explanation applies, the questions then become: “why does the market consistently
overestimate take-up?” and “why is the market so slow at incorporating this information?”
These questions are important given the theory in Eckbo and Masulis (1992) that the market
should be able to infer the expected take-up at the point when the offeror reveals its choice of
issuing method. After this point, no further information about take-up should be revealed, as
in the ‘slow release’ explanation of Balachandran et al. (2012). In contrast, we propose a
different explanation for the observed subscription period price decline based on short selling
activity – an idea that, to our knowledge, has not been examined.
Our analysis provides evidence important for the worldwide debate regarding the
optimal regulation of short selling by challenging the conventional wisdom that rights issues
are a fair and equitable means of raising capital. As the FSA remarked, it appears that rights
issues can indeed be, “prejudicial to the interests of small investors”, given the high
correlation between rights subscription period returns and shareholder participation
documented in Balachandran et al. (2012). To this end, our analysis mandates the need for
regulators to re-examine the rights offering process taking into consideration the potential
value of short sales bans, tick rules, and disclosure regimes, as ways to safeguard the integrity
and fairness of this equity raising method.
The structure of this paper is as follows. In Section 2 we explain the mechanics of
right issues and form our main research question. Section 3 describes the sample’s
construction and notable characteristics of the international rights offering market. Section 4
discusses the empirical setup and the results. Section 5 concludes this paper.

10
2. Hypotheses Development
2.1 Choice of Rights Issues Relative to Other SEOs
What determines a company’s equity capital raising choice? Starting with Smith
(1977), this question has been the focus of a number of researchers most predominantly
within the context of what is called the “disappearing rights phenomenon”. The phenomenon
describes the abandonment of rights offerings in the US post the 1950s and their eventual
rarity by the 1970s.10 This rarity is, in part, a puzzle given the finding of Smith (1977) that,
on average, rights issues involve substantially less direct flotation costs than underwritten
offers. In Eckbo and Masulis (1992), one explanation for this puzzle is that the implicit costs
of rights issues are actually high to the lack of underwriter certification. The substitute for an
underwriter’s certification benefits is the expected shareholder take-up, but as this can be
low, the use of an underwriter to certify the quality of the issue might be preferable.
Another reason raised in Eckbo and Masulis (1992) is more directly related to our
paper. They argue that rights offerings are out of favour because they decrease the cost of
hedging short sale positions in the offering company’s stock. On the subscription end date, if
the market price is above the offering price, then shareholders can exercise their rights and
use the subscribed shares to close out their positions. If the market price is below the offering
price, then shareholders can let their rights expire and buy the stock in the secondary market
to close out their short position. As additional short positions are opened between the
announcement of the offer and the close of the offer, the resulting short selling activity will
depress the stock price and reduce the attractiveness of exercising the rights for most
stockholders.
In a recent study, Holderness and Pontiff (2015) revisits the disappearing rights
10 Rights offerings were once the predominant method of raising equity by US public companies. Between 1935 and 1955, Stevenson (1957) shows that more than one-half of the 1,202 common stock issues with proceeds greater than US$1 million used rights offerings.

11
phenomenon and attributes such incidence to the lack of sufficient protection to uninformed
or irrational shareholders in the US. They document that less than two thirds of shareholders
participate in rights offerings (via selling or exercising their rights) which causes wealth
transfers of up to 7% of the offering between non-participants and participants. Moreover,
they find that rights offerings are more common in countries that have institutional practices
in place that limit non-participating shareholders’ wealth losses. Similarly, Rantapuska and
Knupfer (2008) also document low participation rates in Finland and that individual investors
larger portfolios are less likely to leave rights unexercised.
2.2 Short Selling Activity during Equity Offers
Whilst short sellers might be informed traders, they can have the incentive to hide
their private information and can engage in manipulative strategies (Boehmer and Wu, 2013).
Notably, and within an SEO context, such activity has always been a concern. For example,
the SEC has Rule 10b-21 to regulate short selling in seasoned public offerings. The rationale
for 10b-21 stems from the concern that short selling activity prior to SEOs may lower the
price of the security before the offering date and thereby reduce the offering price. The short
seller could then profit at the expense of the issuer by repurchasing their securities in the
distribution at the reduced price.
Gerard and Nanda (1993) provide a formal theoretical analysis of this relationship.
Their model predicts that issuers price their offering at a discount to the secondary market’s
closing price the day prior to the offering. Because the issue price is determined by order
flow in the secondary market, a strategic trader can influence the issue discount via his/her
own trades and net order flow. One important empirical prediction their model makes is that
manipulative trading decreases the informativeness of the secondary market net order flow,
thereby worsening the winner’s curse problem and increasing the issue discount. This means
that even if the shareholder has positive information, he/she has an incentive to sell shares in

12
the secondary market to conceal his/her information prior to the SEO.
A number of subsequent empirical studies have tested the Gerard and Nanda (1993)
model by examining short selling around SEOs. Safieddine and Wilhelm (1996) provide
evidence that short interest between the announcement of a SEO and the offer date is
approximately three times the level observed during the three months preceding the
announcement. They also find a positive correlation between short interest and size of the
issue discount, meaning that short sales activity leads to lower proceeds from the issuance of
new shares. Henry and Koski (2008) provide another test using daily short sales data. Their
main findings support the Gerard and Nanda (1993) model. There is no evidence of informed
short selling around SEO announcements. Instead, there is a strong positive relationship
between high levels of short selling prior to the offering and the issue discount.
2.3 Research Question
From the discussion above, all of SEO studies that examine short selling have focused
on firm-commitment offers in the US, and not rights issues. Nevertheless, the evidence from
these studies is clear that short selling has a tangible impact on the success of the offering,
and overall market fairness. In view of these studies, we relate the concerns of short selling in
SEOs to a rights offering context, specifically raising the following research question, “does
short selling increase during rights offerings making the process less attractive for existing
shareholders?”
We entertain two explanations for why rights issues in a trading environment with
low short sales constraints could become an unfair process. First, informed short sellers
benefit from wealth transfers when rights holders are discouraged from subscribing to their
rights. When uninformed shareholders sell their rights by themselves, allow brokers to sell
rights on their behalf, or forfeit rights altogether, informed investors (both existing and

13
outside) can pick up these shares/rights cheaply. Second, the offering price of a rights
issuance is fixed and known in advance which reduces the risk of short selling strategies.
When rights are in-the-money, investors can subscribe to the rights and use the offered shares
to close out their position.
Both of the above explanations have the effect of depressing stock prices during the
subscription period, making rights less attractive to current uninformed shareholders. What is
most important to note is the difference between the two. In a similar vein to the theoretical
predictions of Gerard and Nanda (1993), the first explanation assumes short sellers are
informed and manipulative. In contrast, the second explanation follows a theoretical
suggestion of Eckbo and Masulis (1992); in this case, no assumption is made regarding short
sellers’ motives or information. In other words, short sellers can introduce both information
revelation and negative price pressure noise.
3. Sample Construction
3.1 Rights and Entitlement Issuances Data
To examine the price dynamics in the rights offering process around the world, we
compile a dataset of rights offerings using a number of sources. Our main source is the
Bureau van Dijk Osiris database, which provides comprehensive information on international
rights and entitlement issues. Entitlement issues are similar to rights issues but do not provide
a tradable security (they can still be effectively made renounceable in certain cases). In our
study, we also refer to entitlement issues as “rights” for convenience. To ensure the largest
international coverage of rights offerings we further supplement our Osiris dataset with rights
and entitlement offerings from Bloomberg, Thomson Reuters’ SDC Platinum, and Thomson
Reuters’ Datastream.
To clean the data, we exclude cases that involve issues of options, dividend

14
reinvestment plans, non-equity securities, and equity securities outside primary listing venues
(e.g. ADRs). We only consider issues from developed and emerging countries as defined by
MSCI and remove all issues from frontier markets (Table 1 reports the full list of countries in
our sample). In addition, we conduct numerous data accuracy checks and cross-checks across
our data sources with respect to key variables such as offer schedule and offer price. Our final
sample includes 10,952 rights issues by 7,260 firms from 43 different countries during the
period January 2002 to December 2014.
3.2 Sample Statistics
Figure 1 illustrates the number and value of rights offerings that were conducted
during the years 2002 to 2014 in our international sample. From 2002 to 2007, the number of
rights offerings conducted increased over two-fold from 435 to 1,071 at an international
level. Whilst during the Global Financial Crisis that level decreased by 22.4% in 2008, the
following year saw the number of rights offerings reach a peak of 1,310. Post 2009, the
number of rights offerings conducted declined and appears to have hit a plateau, remaining
close to the mark of 1,000 offerings per year. Figure 1 also shows that the dollar value of all
rights offerings conducted each year increased from 2002 to 2007. Interestingly, whilst the
number of rights offering decreased in 2008, the value of such offerings increased indicating
fewer but larger offerings were conducted. This trend also continued throughout 2009 and
ended in 2010. One potential reason highlighted by Eckbo (2008) is the popularity of rights
offerings amongst large financial companies, especially during the distressed period of the
Global Financial Crisis.
[INSERT FIGURE 1 HERE]
With regards to individual countries, Table 1 illustrates the number of rights offerings
conducted for each country, in each year, during our sample period. Rights offerings have

15
continued to be the dominant method in Europe as well as Asia. The majority of rights
offerings tend to be dominated by only a hand-full of countries, with the top five countries
conducting 50 percent of the total number of rights issues worldwide: Australia (20.09
percent), South Korea (9.5 percent), Taiwan (8.47 percent), Hong Kong (6.52 percent) and
Germany (5.76 percent). With this country distribution, our international sample is generally
very comparable to that of the only other international study of rights offerings, Massa,
Vermaelen and Xu (2013).
With regard to country specific studies, our sample also confirms other notable trends
documented by the literature. In line with the findings around the disappearing rights
phenomenon in the US, we find less than 1 percent (102 offerings) of our international
sample of rights issues comprise offerings from the United States. Like the US, Canada also
experienced a sharp decline in the use of rights issues during the 1970s and 1980s. In the
Massa, Vermaelen and Xu (2013) sample, US and Canadian rights offerings also account for
only 2.7 percent and 0.97 percent of the total respectively. Eckbo, Masulis and Norli (2007)
also note a decline in the use of rights issues in Japan and our statistics confirm this trend.
[INSERT TABLE 1 HERE]
4. Empirical Analyses
4.1 Subscription Period Returns
In this section, we examine abnormal returns over the rights offering period. The
diagram below documents the typical timeline of a rights offering and characterises the event
windows relevant to our event studies. AN is the announcement date, and EX is the ex-date.
When a rights offering provides transferability privileges, then TS and TE are the trading
start and trading end dates respectively. SS and SE are the subscription start and subscription
end dates respectively. Our main event study is conducted with the subscription end date (SE)

16
as the event date (t = 0).
It is important to note that our event study results presented below are not driven by
the mechanical adjustment to stock prices that occur in a rights issue. On the ex-date, the
price of an issuing firm drops because its shares are no longer traded cum-rights. Without any
new information, the ex-date price should adjust to reflect the dilution that arises purely due
to the pro rata issue of new shares at a discount.11 To incorporate this adjustment, we use
Datastream adjusted prices that are adjusted for all dilution events.
In addition to the SE date, we also examine two other the event dates, the
announcement date (AN) and the ex-date (EX). We specifically examine the ex-date given
that theoretically, all mechanical adjustments (e.g., dilutive effects) of the rights offering are
complete by this date, and that, in some cases, rights issuers have until the day before the ex-
date to set the issue price. We can therefore assume that the market’s response to the rights
offering should be fully incorporated and from an efficient market perspective, there should
be no abnormal price reaction after this ex-date.
Our event study uses the market model with Scholes-Williams (1977) betas to address
non-synchronous trading issues. The market returns are computed using each country’s MSCI
index. We use the skewness-corrected transformed normal test (SC test) to evaluate means
11 The theoretical ex-rights price (E) for an existing share is calculated as: , where: C = cum-rights
price for an existing share; P = issue price for a new share; N = number of existing shares for an entitlement of 1 new share.
17
and the Wilcoxon signed-rank test (WSR test) to evaluate medians. In unreported robustness
checks, we also use the standardised cross-sectional test Boehmer, Musumeci and Poulsen
(1991) and the time-series standard deviation test from Brown and Warner (1985) but they do
not change our findings.
Figure 2 graphs the buy-and-hold abnormal returns (BHAR) that ensue over the rights
offering period for the entire international sample. The most notable feature of the graph is
the substantial decline in BHARs between day -19, which is one day prior to the ‘median ex-
date’, and the subscription end date (t = 0). In terms of magnitude, from the ex-date to the
subscription end date, the BHARs decline approximately four fold from -1.0% to -4.0%. The
subsequent decline in BHARs, post the offering, underlines a recommencement in selling
pressure which can plausibly arises when an offering is undersubscribed. In these cases, the
issuer can extend the timeline of the offer or, alternatively, the underwriter will purchase all
of the unsubscribed shares and subsequently sell them in the secondary market (for example,
in a rump offering). It should be noted that post the offering, the negative trajectory of
BHARs is not indefinite, rather a tapering occurs approximately 10 to 15 trading days after
the subscription closes.
[INSERT FIGURE 2 HERE]
To provide comparability with prior studies on rights issues, Table 2 documents
abnormal return statistics around the announcement date of an issue. We find a negative and
significant BHAR (mean and median), on the announcement date (t = 0) and for the two days
following the announcement (t = +1, t = +2). One caveat to this analysis is that we do not
have announcement dates for all rights issues. Utilising Bloomberg, Osiris, Datastream and
SDC databases, we are only able to obtain announcement dates for 5,346 rights issues.
[INSERT TABLE 2 HERE]

18
Our main analysis considers the BHARs centred around the subscription end date.
Table 3 documents the results and shows that the mean and median BHARs between the ex-
date and the subscription end date are -4.10% and -3.94% respectively. The results are the
same for various windows leading to the subscription end date, from up to 40 days earlier.
These windows encompass the following key period:
(i) The median announcement date relative to the event date, i.e., AN to SE, (-29, 0)
(ii) The median ex-date relative to the event date, i.e., EX to SE, (-18, 0)
(iii) The median subscription start date relative to the event date, i.e., SS to SE, (-11, 0)
The negative returns over the subscription period is a peculiar result given that rights
offerings are non-information events after the announcement date or by the very latest, the
ex-date. Given the non-information setting, the price decline is consistent with heightened
short selling during the subscription period. If short selling is not driven by information, then
we should expect a reversal in abnormal returns following the subscription end date.
[INSERT TABLE 3 HERE]
Two key observations are immediately noticeable about the post-subscription end
windows. They remain negative but most importantly, they are much smaller in magnitude
than their matching pre-subscription end windows. For example, the BHAR over the window
(+1, +40) is only -0.32%. Whilst the evidence does not point to a complete price reversion,
this result does suggest that rights offerings experience a negative and significant price
decline between the ex-date of the offering and the subscription end date, which is
subsequently followed by a gradual tapering in price after the offering ends.
It is also interesting to note that after the subscription end date, prices on average
decline further in the (+1, +10) window. This indicates that the subscription end date is not

19
necessarily a ‘sharp close’. Offerings can be extended for a number of reasons, for example,
if the offering is undersubscribed the issuer might engage an underwriter to sell the remaining
shares (e.g., in a rump-offering). Alternatively, if the offering is oversubscribed, or there is
significant demand for rights, the issuer can engage in an overallotment round where the
offeror issues additional shares. In both of these cases, the time frame of a rights offering
would be extended lending itself to additional selling pressure. Because these extensions are
not known at the announcement of the offering, the offering timeline is unclear and the
subscription end date is not always the end of the rights offering process.
A number of alternative explanations could potentially apply to the above observed
price decline. First, negative news could be released about the company causing a price drop.
We consider this unlikely given that companies avoid releasing negative news during rights
offerings since it would adversely affect the final level of subscription. Moreover, it does not
explain why negative returns stop, or at least taper off, around the subscription end date as
documented in the main results. Second, the price drop immediately post the ex-date could
simply be the slow information processing of the announcement date news. This is quite
unlikely. In a robustness check, we actually find that prices are stable, and in some cases
rising, between the announcement date and the ex-date.
A third alternative explanation arises from Balachandran et al. (2012). The authors
suggest that the negative returns over rights subscription period could be the result of
shareholders inferring information about take-up during the offering. We consider this
explanation unlikely in view of the studies by Eckbo and Masulis (1992) among others, who
contend that expected shareholder take-up is inferred from the flotation method (e.g.,
uninsured, standby and firm commitment) which is known on the announcement date of the
issue. This means that any negative price reaction to the expected take-up should be
experienced on the announcement date rather than during the offering. Moreover, in the case

20
of fully underwritten offerings, take-up is 100% guaranteed by the underwriter which, under
Balachandran et al.’s (2012) take-up theory, would mean that underwritten offerings should
have no negative price reaction during the offering. In contrast to this theory, we find in a
robustness check that price still declines significantly during fully underwritten offerings.
Finally, to ensure that the results reported in the previous section are not driven by a
particular section of the sample, we also conduct the same event studies for different
industries, developed and emerging nations, size quintiles, and for rights with transferability
privileges. Our finding of a significant price decline during an issue’s subscription period
remains robust across these sub-samples.
4.2 Issue Discount during the Offering
Next we quantify the discount that shareholders experience at the close of a rights
issue, given the evidence of subscription period price decline. Larger discounts reflect greater
value for rights holders and increase the likelihood of a successful offering. The success of
the offering is improved because when rights are in-the-money, then shareholders that do not
participate experience wealth transfers away from them (Holderness and Pontiff, 2015). In
this regard, issuers can use the discount as a tool to pressure shareholders to take action,
given that deep discounts make it costly for shareholders not to exercise their rights (Bøhren,
Eckbo and Michalsen, 1997). Any temporary or permanent price pressure that occurs during
rights offerings will reduce shareholder take-up and cause greater transfers of wealth between
rights holders (Rantapuska and Knupfer, 2008).
Figure 2 illustrates the trajectory of the issue price discount over the rights
subscription period. Again, we observe a significant decline in the issue discount over the
offering period. 21 trading days prior to the subscription end date, the median issue price
discount is at its deepest for the international sample at 20.0 percent. By the subscription end

21
date, the median issue price discount is 13.8 percent reflecting a 6.2 percentage point erosion
over the 21 day period. This result is larger than Holderness and Pontiff’s (2015) US result
where the discount dropped from 18 percent to 13 percent. Table 10 documents the results of
formal tests of differences in the discounts at various time points during the subscription
period. The differences are all statistically significant at the 1% level. Collectively, the
erosion of the issue price discount and the negative abnormal returns experienced over the
rights subscription period should be viewed as a concern to rights issuers given that it
decreases the success of the offering. Moreover, it should be a concern to financial regulators
given the potential for wealth transfers between shareholders.
4.3 Firm and Issue Characteristics Explaining Subscription Period Returns
In view of our previous two analyses, the natural question to ask is, “what explains
the decline in price during the rights subscription period?” In this section, we first examine
firm and issue characteristics that potentially explain buy-and-hold abnormal returns during
the rights subscription period. Driven by our primary research question, we are particularly
interested in the following factors that might play a role in incentivising market participants
to engage in short selling activity: namely, liquidity, information transparency, insider
ownership, rights characteristics and measures of risk.
Our expectation is that more illiquid companies will have negative BHARs during the
rights subscription period. This is based on two premises. First, the unique mechanics of
rights offerings (e.g., fixed offer price, ability to close out short sales positions using the
shares from the rights, and so on) reduce the costs of short selling illiquid companies. Second,
illiquid companies are also associated with greater information asymmetry, which is
potentially conducive to short selling activity.
We use bid-ask spreads are our main measure of liquidity. Following Fong, Holden

22
and Trzcinka (2016), we also consider some alternative proxies, Amihud, Trading Turnover,
and Zero Trading Days. All four measures of liquidity are calculated as the average for the
immediate six trading months (128 trading days) ending 62 trading days prior to the ex-date.
Given that not all rights offerings in our sample have data on the announcement date, the
choice of 62 trading days prior to the ex-date is specifically chosen given this is the
maximum distance between the ex-date and the announcement date in our sample.
Hereinafter, we use “estimated announcement” to mean ’62 trading days prior to the ex-date’.
The Closing Spread measure is the closing bid ask spread scaled by the average of the closing
bid and ask prices. Trading Turnover is computed as unadjusted trading volume scaled by the
total number of outstanding shares. Zero Trading Days represents the proportion of days with
zero returns. Amihud is calculated using the average absolute price change divided by the
average trading value over the estimation period.
Information Transparency Greater information transparency may have the effect of reducing short selling
activity. In this regard, we expect companies that are more transparent to experience positive
returns over the rights subscription period. Our primary proxy for information transparency is
Analyst Coverage; however, we also consider Company Size and Dividend Yield as potential
proxies. We construct Analyst Coverage as the maximum number of analysts issuing a
recommendation for the firm that conduct a rights issue, in the immediate 12 trading months
prior to the estimated announcement date of the issue. Company Size is the natural logarithm
of average market value in the immediate one trading month (21 trading days) prior to the
estimated announcement date. Dividend Yield is the dividend per share as a percentage of the
share price. It is calculated as an average over the immediate one trading month (21 trading
days) prior to the estimated announcement of the offering.
Insider Ownership

23
Regarding insider ownership, we use the level of Free Float as an inverse proxy for
the presence of insiders, since strategic block holders have greater access to private
information. In this regard, we expect an inverse relationship between Free Float and
information asymmetry, and thus a positive relationship with returns during the subscription
period. Free Float is constructed as the percentage of total shares in issue available to
ordinary investors on the ex-date of the offering, obtained from Datastream and based on the
total number of shares less the strategic blockholdings on the ex-date of the offering
company.
Pre-Issue Performance Drawing from Lucas and McDonald (1990), we consider the possibility that
companies with large price run-ups before their right issues are more likely to be overvalued
and in these cases contrarian strategies, such as short selling, are more appealing and less
risky. We construct the variable Run-up as the raw return starting six trading months (128
trading days) prior the estimated announcement date and ending one day prior to the
estimated announcement date. We expect that this variable has a negative correlation with the
returns over the subscription period.
Risk
Because short selling is a leveraged strategy, companies with higher risk are typically
less attractive for short sellers, some of who may be concerned about their own trading
solvency. Given that the mechanics of a rights offering reduce the risks of short selling (e.g.,
fixed offer price, ability to close out short sales positions using the shares from the rights, and
so on), the incentive to short sell issuing firms increase for all issuers, however, the marginal
increase in this incentive is potentially larger for risky firms. If this relationship is true, we
expect a negative correlation between the proxies for risk and returns during the rights

24
subscription period. We examine two measures related to a firm’s price volatility. The first is
Leverage, computed as the average ratio of total debt divided by total assets over the
immediate trading month (21 trading days) prior to the estimated announcement date for each
rights offering. The second is Idiosyncratic Risk computed as the root-mean squared error
obtained from the estimation of our Scholes-William market model used to produce abnormal
returns.
Issue Characteristics
We also consider other characteristics of rights issues: Discount, Duration,
Transferability, Offering Ratio, Oversubscription and Underwritten status. The most
important issue characteristic in our analysis is Discount, when the size of the discount falls,
then the value of the rights decreases and the cost of letting rights expire reduces. In these
cases, shareholder participation can decline (Balachandran et al. 2012) which increases
wealth transfers between participants and non-participants (Eckbo and Masulis, 1992;
Holderness and Pontiff, 2015). In this regard, traders wishing to accrue greater wealth
transfers have an incentive to impose negative price pressure to close this gap.
With respect to the other issue characteristics serving as control variables,
Transferability (Renounceability) is indicator variable that equals to one if the offering is
renounceable, and zero otherwise, Oversubscription is another a binary variable that is equal
to one if the offering has an oversubscription privilege, and zero otherwise. Duration is the
natural logarithm of the number of days between the ex-date and the subscription end date.
Offering Ratio is the number of new shares a rights holder receives for every one share that
he/she has of the issuer’s stock. Finally, Underwritten is an indicator variable that equals to
one if the offering is underwritten, and zero otherwise.
Dependent Variables

25
We use two alternative dependent variables: Buy-and-hold Abnormal Returns
(BHAR) over the windows of 10 (and 20) trading days prior to the subscription end date. If
the number of trading days between the ex-date and subscription end date is less than 10 and
20 respectively, then BHARs are constructed between the ex-date and subscription end date.
Regression Results
Table 4 documents the results. Consistent with our expectation, Closing Spread is
negative and significant for the BHAR (-10) measure, but not for the BHAR (-20). We do not
report the results for the other alternative liquidity measures, but they are also inconsistent.
The Zero Trading Days measure is negative and significant but the Amihud and Trading
Turnover are insignificant. Thus, the results with respect to liquidity are tentative, possibly
reflecting peculiarities of our international dataset. Regarding information transparency
proxies, we find that our primary measure of information transparency, Analyst Coverage, is
positive and significant at the 1% level across all four main specifications. Interestingly,
Company Size is negative and significant at the 10% level in models (1) and (2). One
explanation for this negative coefficient is that larger companies tend to be the focus of short
selling activity for institutional investors. For example, in Australia, the primary benchmark
for the market is the S&P/ASX200 which represents the investable universe for most
institutional investors (Comerton-Forde et al., 2016).
[INSERT TABLE 4 HERE]
With regards to pre-issue performance, the negative coefficient of Run-up is
consistent with our expectation and alludes to the fact that overvalued stock is less costly and
more appealing to short sell. We examine the variable Free Float in a separate regression
given that this variable reduces our sample size. This measure is significant and follows its
expected sign. Assessing the results from Table 4 together, we find strong and consistent

26
evidence which suggests that specific issue characteristics (i.e., Discount, Offering Ratio, and
Duration) strongly explain subscription period returns.
4.4 Relationship between Returns before and after Subscription Close
The previous analysis examines the relationship between buy-and-hold abnormal
returns during the rights subscription period and both firm factors and issue characteristics.
We contend that certain firm factors and issue characteristics might be conducive to short
selling which, in turn, might explain price pressure experienced during rights offerings. In
this analysis, we attempt to characterise the type of price pressure exhibited during rights
offering, specifically whether it is temporary or permanent.
In order for the temporary price pressure explanation to be plausible, there must
exhibit an inverse relationship between pre-offer returns and post-offer returns. If no reversal
is found, then this would resonate with information based hypotheses that predict permanent
price drops with no reversal.
Preliminary evidence of temporary price pressure is found in our event study
experiment. We find that, at an international level, returns post the subscription end date tend
to be substantially less negative than returns during the rights offering. Moreover, for
developed countries, underwritten issues and for the agriculture, mining and construction
industries, we find that BHARs in the event windows post (+1, +20) are all positive and
significant. In this section, we more formally characterise the type of price pressure by
examining the correlation between returns during the rights subscription period and returns
post the offering. To do this we regress three new independent variables “BHAR (+10)”,
“BHAR (+20)” and “BHAR (+30)” on two key independent variables BHAR (-10) and BHAR
(-20). BHAR (+10), BHAR (+20) and BHAR (+30) are the buy-and-hold abnormal returns in
the immediate 10, 20 and 30 trading days after the subscription end date respectively. In

27
conducting this analysis we follow a number of studies that examine the relationship between
post-offer date returns and pre-offer date returns of US SEOs (see e.g., Korajczyk, Lucas and
McDonald, 1991; Corwin, 2003).
If the price pressure is temporary, the expectation is that companies with negative
returns during the offering will outperform companies with positive returns during the
offering. That is, we expect a negative correlation between BHARs during the rights offering
and BHARs after the offering. The results are reported in Table 5. Across all six models we
find that this result holds. Specifically, the coefficient of BHAR (-10) and BHAR (-20) are
both negative and significant at the 1% level.
Overall, what is most important is the main result, that companies that experience
negative returns during the offering, tend to outperform stock that exhibit positive returns
during the offering. This result is consistent with the theoretical prediction of Gerard and
Nanda (1993) within an SEO context. It is, however, important to note that this is not
definitive evidence of manipulative short selling activity – as suggested by Gerard and Nanda
(1993) – it merely indicates that short sales during rights offerings are unlikely to be
informed. Indeed, Eckbo and Masulis (1992) suggest that short sellers can be speculative and
not fully informed, merely engaging in the practice given that rights offerings reduce the cost
of hedging short sale positions.
[INSERT TABLE 5 HERE]
4.5 Short Sales Restrictions, Tick and Disclosure Rules
The previous analyses provide indicative results that suggest short selling could
potential be driving negative price pressure during rights offerings. In this analysis we
attempt to measure short selling more directly through market-level short selling constraints.
Following the works of Beber and Pagano (2013), Bris, Goetzmann and Zhu (2007), and Jain,

28
Jain, McInish and McKenzie (2013), we manually construct a comprehensive set of measures
of short sales restrictions across countries: Restriction, Disclosure and Tick Rule.12
Restriction is constructed following a similar methodology to Jain, Jain, McInish and
McKenzie (2013), whose variable is equal to 0 when no restrictions on short selling are in
place, 1 if there is either an up-tick rule or a ban on naked short selling, 2 if both of these
restrictions are present and 3 when there is a complete ban. Two additional categories are also
considered, (a) complete bans on financial stocks and (b) naked short sales bans of financial
stocks. In this regard, at a country level, their variable ranges from 0 to 5.
In addition to Restriction, we construct Disclosure as an indicator variable that equals
to one if short sales disclosure regimes are in place in an issuer’s primary market and in the
same year as the issuer’s rights offering, and zero otherwise. Tick Rule as an indicator
variable that is equal to one if a tick rule is in place in the issuer’s primary market and in the
same year as the issuer’s rights offering, and zero otherwise.
The results are reported in Table 6. The Restriction variable is positive and significant
at the 10% and 1% level respectively under both BHAR (-10) and BHAR (-20), which
strongly confirms our expectation. Examining the Tick Rule, we find that the variable is
positive and significant at the 5% level under BHAR (-10) but insignificant with BHAR (-20).
The result provides tentative evidence that tick rules have an effect at minimising the
negative returns during rights offerings. Examining Disclosure in models (3) and (6), the
variable is positive in both models, and significant at the 1% when specified with BHAR (-20)
12 To construct this index, we start by reviewing the body of literature dedicated to international short selling (Bris, Goetzmann and Zhu, 2007; Beber and Pagano, 2013; Gruenewald, Wagner and Weber, 2010; Lecce et al., 2011; Jain et al., 2013; among others). Most of these international studies focus on short selling during the Global Financial Crisis (GFC). Since we also examine rights offerings before, and after this period, we also rely on country-specific studies, for example, Sharif et al. (2014) for China; Felix, Kraussl and Stork (2013) for selected EU nations. In addition, we use practitioners’ reports and briefings to verify these datasets (e.g., reports from Ashurst, Wilmer Hale, Morgan Stanley, J.P. Morgan, among others) as well as reports provided by regulatory bodies (e.g., ASX, European Securities and Markets Authority, the US SEC). Details with respect to our information sources are available on request.

29
only.
[INSERT TABLE 6 HERE]
Overall, the results in Table 6 are strong for the Restriction variable but tentative for
Disclosure and the Tick Rule. Nevertheless, the results generally support our expectations.
Regarding the Tick Rule, our analysis builds on the extant literature of Alexander and
Peterson (1997) and Diether, Lee and Werner (2009), who have all examined the costs and
benefits of the up-tick rule and other similar price tests. Regarding disclosure regimes, a
number of studies (see e.g., Boehmer et al., 2005; Madhavan et al., 2005) examine this form
of regulation on short selling activity, often with unclear results. Our evidence suggests that
stricter short-sales regulations may be important in the context of rights issues. It supports the
actions of the FSA who introduced mandatory disclosure of short sales during rights offerings
in 2008.
One caveat to these results is that countries may differ in ways that we cannot
observe. To overcome this problem, we conduct a robustness check using a difference-in-
differences analysis that exploits within country differences in short-sales regulations. The
specification is as follows:
∗
where is a binary variable that equals to one if the rights issuer i is a
financial company13, and zero otherwise. is a binary variable that equals to
one if the ex-date of the rights offering of company i falls within the time period when a short
selling ban on all financial companies is in place within company i's primary market, and
13 Financial companies are classified based on The Industry Classification Benchmark (ICB). The ICB is the merger of industry classifications of Dow Jones and FTSE. Data on the ICB for each rights issuer is acquired from Datastream.

30
zero otherwise. The key variable of interest is the interaction term ∗
. Our expectation is that this term will take a positive coefficient indicating
that short sales bans on financial companies mitigates price pressure and improves returns
during rights offerings of financial companies. We find that this is indeed the case for BHAR
(-10) but the results are insignificant with respect to BHAR (-20). Collectively, the cross-
country evidence provides credibility for the use of short sales regulation as a means to avert
downward price pressure potentially caused by short selling during rights offerings.
4.6 Short Selling Activity during Rights Offerings
In this analysis, we examine the level of short selling activity during Australian rights
issues by considering two measures, short volume and short interest. For a number of
reasons, empirical studies to date have typically been constrained by the availability of a
single short selling metric – typically either short flow (volume) or short interest. Even in
jurisdictions where both measures are available, the frequency with which they are collected
and reported is often mismatched.14 In this regard, our paper benefits significantly from
Australia’s daily reporting and disclosure regimes which are arguably the most
comprehensive and timely reporting of short sales data in the world (Comerton-Forde et al.,
2016). The current disclosure regime is comprised of two parts, the first part being short
transaction reporting (which is used to calculate short volume), and the second part being
short position reporting (which is used to calculate short interest).
Daily short transaction reporting has been mandated by Australian regulators since
July 2001. Brokers are required to report the total number of shares short sold for each
security to the Australian Securities Exchange (ASX) by 9 A.M. the following trading day by
the latest. The ASX publishes short sales volume as a percentage of the total number of
14 For example, Boehmer et al. (2010) compare the relative informativeness of short interest (using changes in publicly released short interest data from the previous month) and short flow (estimated from proprietary intraday data aggregated over the most recent five days).

31
shares on issue for each security. For our analysis, we take the percentage value as our main
measure of short volume. This measure is similar to those used by Boehmer et al. (2010),
Diether et al. (2009), Engelberg et al. (2012), Boehmer and Wu (2013), and Comerton-Forde
et al. (2016), but scaling by outstanding shares rather than seller initiated volume makes the
measure less volatile.
Daily short positions (short interests) reporting was implemented in June 2010 to
augment daily short transactions reporting. Under this regime, short sellers must report their
short positions to the Australian Securities and Investment Commission (ASIC) within three
business days of the trade, and each day thereafter until the position is covered. ASIC
aggregates individual short positions by security and publically discloses this information the
day following settlement (i.e., T + 4 days after the trade) in their “short positions report”.15
ASIC also publishes short interest as a percentage of the total number of shares on issue for
each security. We use this percentage as our formal measure of short interest to capture the
‘stock’ aspect of short selling, consistent with Boehmer et al. (2010), and Comerton-Forde et
al. (2016).
Using both measures of short volume and short interest, this analysis conducts two
event studies to document, (a) the change in short volume during rights offerings and, (b) the
level of short interest during rights offerings. We specifically examine the change in short
volume to clearly illustrate the additional short sales volume that occurs during rights
offerings and is above the average amount that occurs before the ex-date of an offering. This
change is calculated for each rights issue by first averaging the short sales volume in the 30
trading days immediately prior to the ex-date and subtracting this from the level of short sales
volume for each trading day in the event window. We examine the level of short interest,
15 For further explanations see http://asic.gov.au/regulatory-resources/markets/short-selling/short-selling-reporting-short-position-reporting/

32
rather than the change, because short interest represents the cumulative outstanding short
sales volume, thus subtracting the average does not change the pattern of this measure. In
both event studies we examine a 100 trading day window starting from 70 trading days
before the subscription end date and ending 30 trading days after the subscription end date.
Figure 3 illustrates a substantial increase in the change of short volume during
Australian rights issues. The increase clearly begins around after the median announcement
date. Importantly, the graph also illustrates a sharp and immediate decrease in short sales
volume on the subscription end date which implies a rapid unwinding of short selling activity
once the offering has ended. In Table 7, we confirm that the difference in the average change
in short volume between 10, 15, and 20 days before and after the subscription end date is
significant at the 1% level. Figure 3 also illustrates the average short interest for the
Australian rights issues sample. As expected, the graph of short interest follows a similar
pattern to the graph of short volume. One key difference is that the build-up of short interest
begins approximately 30 to 40 trading days prior the subscription end date which is earlier
than the median announcement date (t = -24). Consistent with our short volume study is the
significant drop in short interest positions close to immediately after the subscription end
date. Again, In Table 7, we confirm that average short positions 5, 10, 15 and 20 trading days
before the subscription end date are all significantly different than 5, 10, 15 and 20 trading
days after the subscription end date respectively.
[INSERT FIGURE 3 AND TABLE 7 HERE]
4.7 Short Selling Intensity and Subscription-Period Returns
In this analysis, we examine the ability of short selling activities to predict returns
both during rights offerings and after the offering. Specifically, we attribute short selling to
negative returns during rights offerings and positive returns after offerings in the same way
33
that Henry and Koski (2008) did within a US SEO (firm-commitment offer). Outside of the
equity offering context, strong empirical evidence exists regarding the negative relationship
between short selling metrics and future returns, which is consistent with the idea that short
selling contains value-relevant information (Comerton-Forde et al., 2016). For example,
short flow is found to be inversely related to future stock performance (Asquith et al., 2005;
Boehmer et al., 2010; Diether et al., 2009; Engelberger et al., 2012).
We follow a similar methodology employed by Henry and Koski (2008) by regressing
abnormal returns during the rights subscription period against measures of pre-issue short
sales intensity. An important note to make is that Henry and Koski (2008) examine
announcement returns of SEOs. In contrast, our analysis focuses on the non-information
period post the announcement of rights issues.
Implicit in this analysis is the assumption that the level of pre-issue short selling is an
accurate reflection of a firm’s typical daily short selling activity. In this regard, the amount of
pre-issue short selling intensity reflects how easy/difficult it is to short sell the company on a
normal day-to-day basis. Companies with high levels of pre-issue short selling intensity are
assumed to be easier to short sell, whilst companies with very low levels of pre-issue short
selling intensity are assumed to have constraints that impede short sellers. In this regard, and
forasmuch as short interest/volume have predictive ability, our expectation is that companies
that are easier to short sell (i.e., high levels of pre-issue short selling intensity) will
experience a negative correlation with abnormal returns during the rights subscription period
(reflecting an increase in short selling) but positive correlation with abnormal returns after the
offering (reflecting an unwinding of short selling).
We use the ASX short transaction data as this provides coverage for the entire sample
period. We create the following measure of pre-issue short selling intensity. Short Interest

34
(pre-offer) represents the average short volume scaled by the number of outstanding shares in
the immediate trading month (21 trading days) prior to the ex-date for each rights issue.
Table 8 contains the results of the regression where our key independent variable is
Short Volume (pre-offer). Consistent with our expectations, we find that Short Volume (pre-
offer) exhibits a negative and statistically significant correlation with BHAR (-10). In contrast,
we find no significant result for the specification with BHAR (-20). We consider the
relationship between pre-offering short volume and post-offering returns. Consistent with our
expectation, Short Volume (pre-offer) is positive and significant at the 5% level in model (4),
that is, when specified with BHAR (+10). When read alongside the result from model (1), it
suggests that companies that are easier to short sell experience negative returns in the 10
trading days prior to the subscription end date followed by a positive reversion in returns in
the 10 trading days after the subscription end date. Over a long term horizon, we find a
positive correlation between Short Volume (pre-offer) and both BHAR (+20) and BHAR
(+30), however, the relationships lack significance.
[INSERT TABLE 8 HERE]
Overall, given that rights offerings post the announcement date are non-information
events, the evidence regarding short volume highlights that price pressure during rights
offerings is unlikely to be from traders impounding information. In contrast, negative price
pressure is more likely to be either manipulative or driven by speculative short sellers without
precise information.
4.8 Short Selling and Subscription Period Returns – an Identification Strategy
Whilst the previous analyses directly measure short selling activity, they do not fully
address endogeneity. Firms that can be short sold are different to those that cannot be in
many unobservable ways. To overcome this problem employ a fuzzy regression discontinuity

35
design (RDD) to estimate the effects of naked short selling (NSS) bans on rights offerings.16
This strategy is also used by Lecce, Lepone, McKenzie and Segara (2011). It exploits a
unique ASX regulation in order to estimate of the effect of short selling constraints on returns
during rights offerings. In particular, prior to 22 September 2008, naked short selling (NSS)
was allowed for companies that had a market value (MV) greater than A$100 million. For
companies that were marginally on the other side of this discontinuity point (i.e., MV just
lower than A$100 million), their underlying characteristics would be very similar to the
companies that just made the cut off, but these companies would have had different short
sales constraints. In this regards, the difference in returns over the rights subscription period
would be driven primarily by having different short selling constraints. From 22 September
2008, naked short selling was completed banned by the ASX.
We use a fuzzy RDD rather than a sharp RDD in part because the discontinuity point
is not sharp. The A$100 million MV cut-off was not the only threshold that a company was
required to pass to be placed onto the approved NSS list. ASX market rules also required
securities to have over 50 million shares of issue, and possess ‘sufficient liquidity’. The ASX
could exercise discretion regarding the ‘sufficient liquidity’ criteria (Lecce, et al. 2011). In
this regard, the assignment to the treatment group (i.e. being assigned the status of ‘approved
SS instrument’) could be ambiguous. In addition, the ASX usually revised the NSS
eligibility list on a monthly basis yet the actual window used by the ASX to calculate A$100
million MV was not disclosed. Indeed, stock prices can change rapidly in response to news,
therefore stocks that were on the borderline of the A$100 million MV cut-off could plausibly
fall above and below the threshold frequently during the month.
An important issue when implementing regression discontinuity design is the choice
16 A naked short sale is where a participant, either proprietary or on behalf of a client, enters an order in the market and does not have in place arrangements for delivery of the security.

36
of bandwidth around the discontinuity point. A larger bandwidth yields more accurate
estimates since more observations are used to estimate the regression. However, with linear
specifications, larger bandwidths are less likely to be accurate because they can bias estimates
of the treatment group. In this analysis, we employ the methodology of Calonico, Cattaneo
and Titiunik (2014) to estimate the bandwidth. The authors propose confidence intervals for
regression discontinuity treatment effects that offer robustness to “large” bandwidths.
The first-stage of our two-stage least squares method is modelled below:
100
where, is an indicator variable that equals to one if company i is in the
ASX’s approved NSS list, and zero otherwise. 100 is a binary variable that
equals to one if company i has a market value greater than A$100 million on its ex-date, and
zero otherwise. is market value of company i on the ex-date of its rights issue.
is the function of the relationship between the market value of company i and the likelihood
of receiving treatment (i.e., being assigned the status of an approved short sales instrument by
the ASX).
From this stage we are able to assess whether the A$100 million MV threshold is a
relevant instrumental variable (IV) for naked short sales bans – i.e., whether the A$100
million MV criteria is accurate at separating out companies that were subject to NSS and
those that were protected by NSS bans. We input the predicted value of the
mediator, in the second-stage modelled below:
Our expectation is that the coefficient of is significant and negative
which would indicate that companies that were legal to naked short sell, exhibited negative

37
BHARs during the rights subscription period.
Table 9 documents the results of the fuzzy RDD with estimations based on local
linear regression. We also estimate the functions with higher order polynomials for
robustness and find that they do not impact our findings. The first-stage results confirm that
the A$100 million MV threshold is a relevant instrumental variable for naked short selling
bans as evidenced by the positive and statistically significant (5% level) coefficient on
100MV Dummy. Examining the second-stage regression, the coefficient of is
negative and significant which implies that companies that are legal to naked short sell,
experience negative BHARs during rights offerings. Examining the specification with BHAR
(-10) the coefficient of is negative but insignificant. In unreported results, this
coefficient is actually significant in specifications with higher order polynomials.
[INSERT TABLE 9 HERE]
To ensure the validity of the above findings, we conduct an unreported robustness test
imposing the ASX’s additional criteria that companies must have 50 million of shares in free
float to be an eligible member of the approved naked short sales list. Enforcing this constraint
does not change our results. In Table 9, we examine the discount measured at the end of the
subscription period, Discount (Sub-End), as an alternative measure of the outcome of the
price decline observed during the subscription period. Our expectation is that when specified
with Discount (Sub-End) the coefficient of will be positive given that the
Discount (Sub-End) is constructed as a negative (i.e., a 20% discount = -0.2). Consistent with
our expectation the coefficient in the second stage regression is positive and
significant.
Because naked short selling was permanently banned on all ASX listed stocks on the
22 September 2008, we conduct a falsification test by widening the time frame of our

38
analysis to consider rights issues in the period post 22 September 2008. Because the NSS
approved list was abolished during this period, we use a sharp RDD design using the $100
million MV cut-off as a deterministic discontinuity point. Panel A of Table 10 contains the
results, and indeed the coefficient is insignificant consistent with our expectations. In
undocumented results, we confirm that running higher order polynomial regressions does not
impact this finding. In another falsification test, we go back to the pre 22 September 2008
sample and consider different MV thresholds that act as placebos for the A$100 million MV
cut-off. We specifically examine the cut-offs: A$90 million and A$110 million, to check
whether the difference in BHARs is driven by the actual A$100 million threshold or,
alternatively, the functional form of BHARs around different market values of companies.
The results are reported in Panels B and C of Table 10. They show that the coefficients of
are all insignificant.
[INSERT TABLE 10 HERE]
Overall, the evidence provided in this section strongly supports the idea that short
selling induced price pressure can be alleviated with greater short selling restrictions.
Importantly, whilst we specifically test the efficacy of naked short selling bans in this
experiment, the ability to naked short sell a company has implications for the costs of covered
short selling strategies; thus, this experiment more broadly assesses the efficacy of short sales
constraint (in general) on subscription period returns. Specifically, the ability to naked short
sell a company should reduce the cost of covered short selling strategies through competition,
as a short seller would have different ways to short sell the stock up until the point where the
cost of failure of NSS (e.g., from penalty fees) equals the costs of covered short selling (i.e.,
borrowing costs). In addition to the above, this analysis also highlights the fact that naked
short selling could be a favoured strategy during rights issues. This was raised by Eckbo and
Masulis (1992) who suggest that short sellers need not cover their positions through

39
borrowing if they can use the shares from the offering instead. Anecdotally, a number of
corporate scandals regarding naked short selling have also highlighted the strategies
prominence among institutional investors during rights issues.
5. Conclusion
This paper poses the question, “does short selling increase during rights offerings and
make the process less attractive for existing shareholders?” Whilst rights issues are in
principal supposed to be fair, they force all shareholders (informed of uninformed) to make a
decision, rather than delegating the power to raise capital at an appropriate price to an agent
(underwriter) representing all shareholders. Because of this, there are opportunities for both
informed investors (existing shareholders and outside speculators) to exploit information
disadvantages of certain existing shareholders (e.g., small retail shareholders). To answer this
research question, we entertain two explanations for why short selling is problematic for the
rights offering process. The first explanation is grounded in the theoretical model of Gerard
and Nanda (1993), that informed investors use short selling to create pressure on stock price
and make it less informative which, in turn, discourages uninformed shareholder
participation. The second explanation follows Eckbo and Masulis (1992), who suggest that
because the issue price is set and known in advance, investors can use rights as warrants to
hedge their short positions.
Our study documents a novel and international finding that post the ex-date, rights
offerings experience a sharp and persistent decline in price and issue discount that ends on
the subscription end date. The importance of this finding stems from the fact that rights
offerings are non-information events post the announcement, in this regard, and from an
efficient market perspective, no price discovery should occur during this period. Given the
strong correlation between negative returns and low shareholder take-up (Balachandran et al.,

40
2012), the finding elucidates the phenomenon of low shareholder participation in rights issues
that has recently been highlighted by Holderness and Pontiff (2015) and Rantapuska and
Knupfer (2008).
We find that the presence of certain firm factors and issue characteristics that
potentially encourage short selling activity is negatively associated with returns during the
rights subscription period. We then characterise the nature of short selling and find a strong
negative correlation between pre- and post-subscription end returns which suggests that short
selling during rights issues is likely to be uninformed. In mitigating the price decline during
the rights subscription period, we find that right issues conducted in countries with more
short selling restrictions experience less negative returns. Using variations in short selling
regulations across time, we further show that temporary short sales bans on financial
companies help support prices of these companies when they issue rights during the
restriction period.
Using Australian data, we also document significant increases in both the change in
short volume and the level of short interest during rights issues and a subsequent rapid
unwinding of short selling activity immediately after the issue ends. Given that short selling
naturally induces negative price pressure this result strongly suggests that declines in price
are, in part, a factor of abnormal short selling during rights issues. We show that short selling
intensity is correlated with both returns during and after rights issues. As a final step, we
show that this is more than mere correlation. Employing a fuzzy regression discontinuity
design (RDD), we document that rights issuing companies with less binding short selling
constraints tend to have more negative returns during the subscription period.
Despite the conventional wisdom that rights issues are a fair and equitable means of
raising capital, rights issues can indeed be, “prejudicial to the interests of small investors”, as

41
noted by the FSA, unless such investors are given adequate protection against more informed
and potentially manipulative traders. Overall, our results highlight that short selling activity,
while important to the general market trading, may lead to adverse outcomes for rights
holders, especially if they are uninformed and are forced to make a subscription decision. To
this end, our analysis mandates the need for regulators around the world to follow the FSA’s
footsteps and re-examine their regulations of rights offerings taking into consideration the
potential value of strengthening short sales restrictions around these very important
transactions.

42
7. Bibliography
Aitken, M., Frino, A., McCorry, M. and Swan, P. (1998). Short Sales Are Almost Instantaneously Bad News: Evidence from the Australian Stock Exchange. The Journal of Finance, 53(6), pp.2205-2223.
Alexander, G. and Peterson, M. (1999). Short Selling on the New York Stock Exchange and the Effects of the Uptick Rule. Journal of Financial Intermediation, 8(1-2), pp.90-116.
Asquith, P., Pathak, P. and Ritter, J. (2005). Short interest, institutional ownership, and stock returns. Journal of Financial Economics, 78(2), pp.243-276.
Balachandran, B., Faff, R. and Theobald, M. (2008). Rights offerings, takeup, renounceability, and underwriting status. Journal of Financial Economics, 89(2), pp.328-346.
Balachandran, B., Faff, R., Theobald, M. and van Zijl, T. (2012). Rights Offerings, Subscription Period, Shareholder Takeup, and Liquidity. Journal of Financial and Quantitative Analysis, 47(01), pp.213-239.
Beber, A. and Pagano, M. (2013). Short-Selling Bans Around the World: Evidence from the 2007-09 Crisis. Journal of Finance, 68(1), pp.343-381.
Boehmer, E., Huszar, Z. and Jordan, B. (2010). The good news in short interest. Journal of Financial Economics, 96(1), pp.80-97.
Boehmer, E., Jones, C. and Zhang, X. (2013). Shackling Short Sellers: The 2008 Shorting Ban. Review of Financial Studies, 26(6), pp.1363-1400.
Boehmer, E., Musumeci, J. and Poulsen, A. (1991). Event-study methodology under conditions of event-induced variance. Journal of Financial Economics, 30(2), pp.253-272.
Boehmer, E. and Wu, J. (2013). Short Selling and the Price Discovery Process. Review of Financial Studies, 26(2), pp.287-322.
Boehmer, E., Saar, G. and Yu, L. (2005). Lifting the Veil: An Analysis of Pre-trade Transparency at the NYSE. The Journal of Finance, 60(2), pp.783-815.
Bøhren, Ø., Eckbo, B. and Michalsen, D. (1997). Why underwrite rights offerings? Some new evidence. Journal of Financial Economics, 46(2), pp.223-261.
Bris, A., Goetzmann, W. and Zhu, N. (2007). Efficiency and the Bear: Short Sales and Markets Around the World. Journal of Finance, 62(3), pp.1029-1079.
Calonico, S., Cattaneo, M. and Titiunik, R. (2014). Robust Nonparametric Confidence Intervals for Regression-Discontinuity Designs. Econometrica, 82(6), pp.2295-2326.
Comerton-Forde, C., Do, B., Gray, P. and Manton, T. (2016). Assessing the information content of short-selling metrics using daily disclosures. Journal of Banking & Finance, 64, pp.188-204.
Corwin, S. (2003). The Determinants of Underpricing for Seasoned Equity Offers. The Journal of Finance, 58(5), pp.2249-2279.
Diamond, D. and Verrecchia, R. (1987). Constraints on short-selling and asset price adjustment to private information. Journal of Financial Economics, 18(2), pp.277-311.
Diether, K., Lee, K. and Werner, I. (2008). Short-Sale Strategies and Return Predictability. Review of Financial Studies, 22(2), pp.575-607.
Diether, K., Lee, K. and Werner, I. (2009). It's SHO Time! Short-Sale Price Tests and Market Quality. Journal of Finance, 64(1), pp.37-73.
Eckbo, B. (2008). Equity Issues and the Disappearing Rights Offer Phenomenon. Journal of Applied Corporate Finance, 20(4), pp.72-85.
Eckbo, B. and Masulis, R. (1992). Adverse selection and the rights offer paradox. Journal of

43
Financial Economics, 32(3), pp.293-332.
Eckbo, B., Masulis, R. and Norli, Ø. (2000). Seasoned public offerings: resolution of the ‘new issues puzzle’. Journal of Financial Economics, 56(2), pp.251-291.
Eckbo, E., Masulis, R. and Norli, Ø. (2007). Security offerings. Handbook of Empirical Corporate Finance, E. Eckbo, ed., Amsterdam: Elsevier, pp.233-373.
Engelberg, J., Reed, A. and Ringgenberg, M. (2012). How are shorts informed? Journal of Financial Economics, 105(2), pp.260-278.
Felix, L., Kräussl, R. and Stork, P. (2016). The 2011 European Short Sale Ban on Financial Stocks: Cure or Curse? SSRN Electronic Journal.
Fong, K., Holden, C. and Trzcinka, C. (2017). What Are the Best Liquidity Proxies for Global Research? Review of Finance, forthcoming.
Gerard, B. and Nanda, V. (1993). Trading and Manipulation Around Seasoned Equity Offerings. The Journal of Finance, 48(1), p.213.
Henry, T. and Koski, J. (2010). Short Selling Around Seasoned Equity Offerings. Review of Financial Studies, 23(12), pp.4389-4418.
Holderness, C. and Pontiff, J. (2016). Shareholder nonparticipation in valuable rights offerings: New findings for an old puzzle. Journal of Financial Economics, 120(2), pp.252-268.
Jain, A., Jain, P., McInish, T. and McKenzie, M. (2013). Worldwide reach of short selling regulations. Journal of Financial Economics, 109(1), pp.177-197.
Korajczyk, R., Lucas, D. and McDonald, R. (1991). The Effect of Information Releases on the Pricing and Timing of Equity Issues. Review of Financial Studies, 4(4), pp.685-708.
Kothare, M. (1997). The effects of equity issues on ownership structure and stock liquidity: A comparison of rights and public offerings. Journal of Financial Economics, 43(1), pp.131-148.
Lecce, S., Lepone, A., McKenzie, M. and Segara, R. (2012). The impact of naked short selling on the securities lending and equity market. Journal of Financial Markets, 15(1), pp.81-107.
Lucas, D. and McDonald, R. (1990). Equity Issues and Stock Price Dynamics. The Journal of Finance, 45(4), pp.1019-43.
Madhavan, A., Porter, D. and Weaver, D. (2005). Should securities markets be transparent? Journal of Financial Markets, 8(3), pp.265-287.
Massa, M., Vermaelen, T. and Xu, M. (2013). Rights Offerings, Trading, and Regulation: A Global Perspective. SSRN Electronic Journal.
Parsons, J. and Raviv, A. (1985). Underpricing of seasoned issues. Journal of Financial Economics, 14(3), pp.377-397.
Rantapuska, E. and Knupfer, S. (2008). Which Investors Leave Money on the Table? Evidence from Rights Issues. Review of Finance, 12(4), pp.701-733.
Safieddine, A. and Wilhelm, W. (1996). An Empirical Investigation of Short-Selling Activity Prior to Seasoned Equity Offerings. The Journal of Finance, 51(2), p.729.
Sharif, S., Anderson, H. and Marshall, B. (2014). Against the tide: the commencement of short selling and margin trading in mainland China. Accounting & Finance, 54(4), pp.1319-1355.
Smith, C. (1977). Alternative methods for raising capital. Journal of Financial Economics, 5(3), pp.273-307.
Stevenson, H. (1959). Common-Stock Financing in 1955. Journal of Finance, 14(3), pp.433-434.
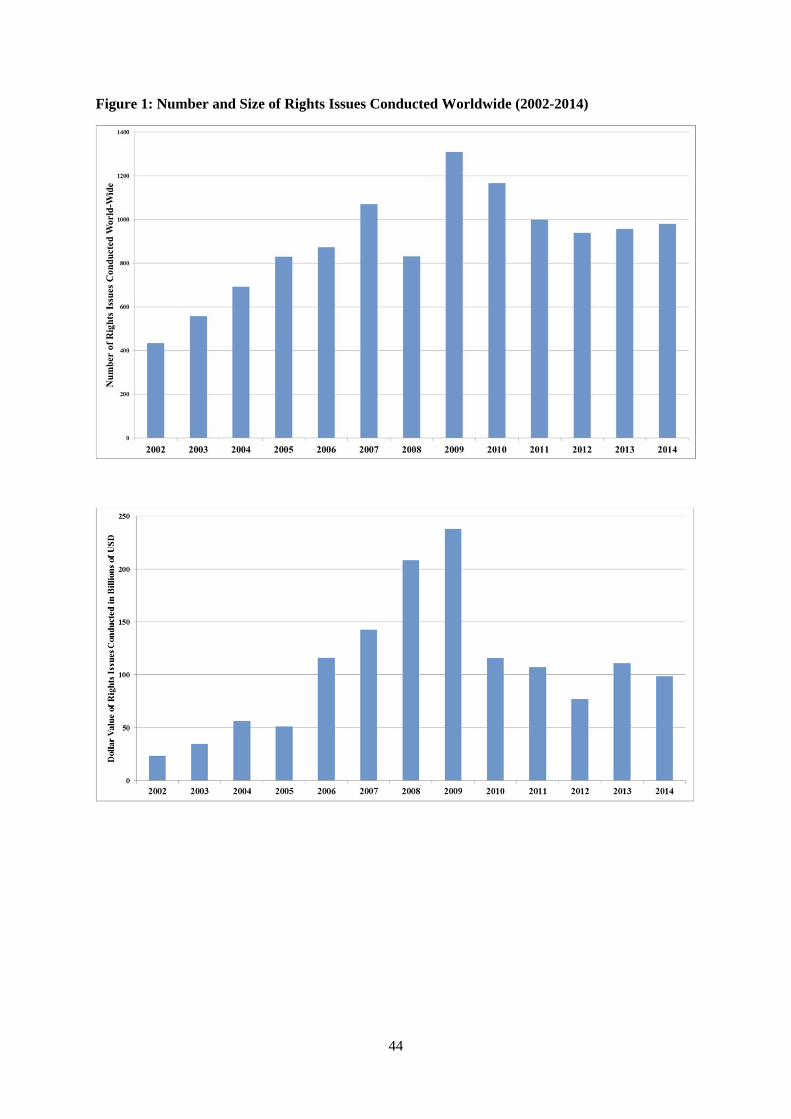
44
Figure 1: Number and Size of Rights Issues Conducted Worldwide (2002-2014)
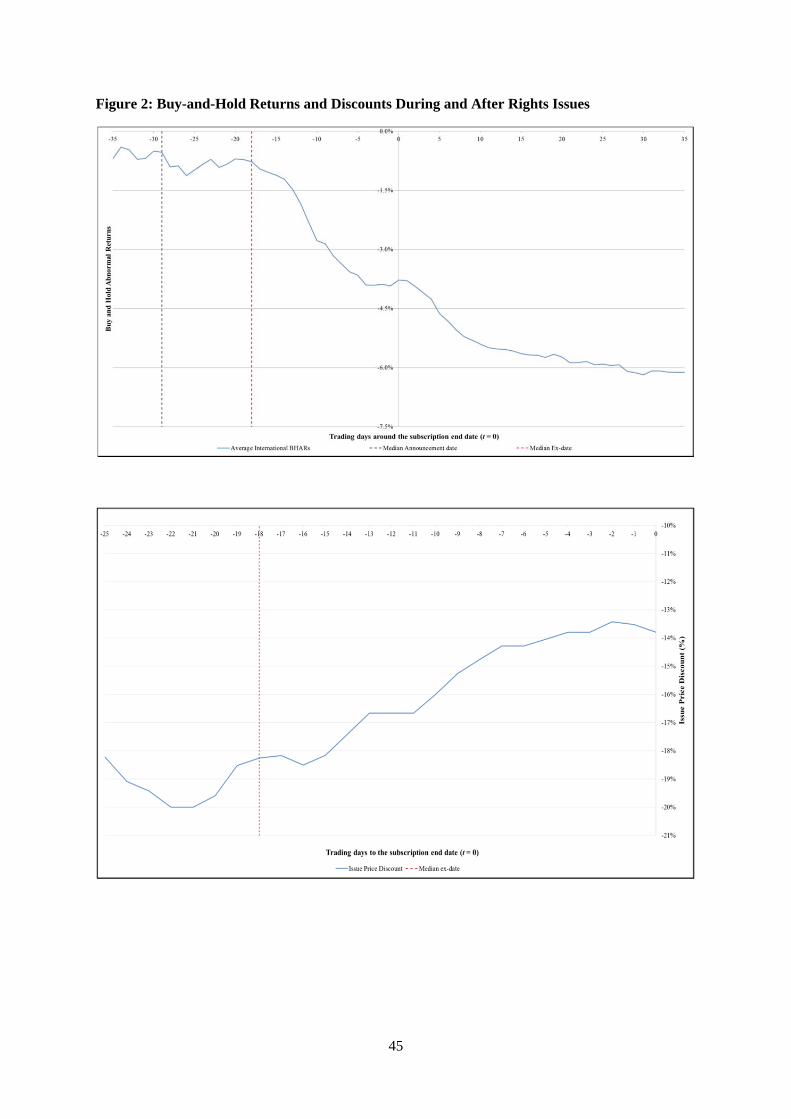
45
Figure 2: Buy-and-Hold Returns and Discounts During and After Rights Issues
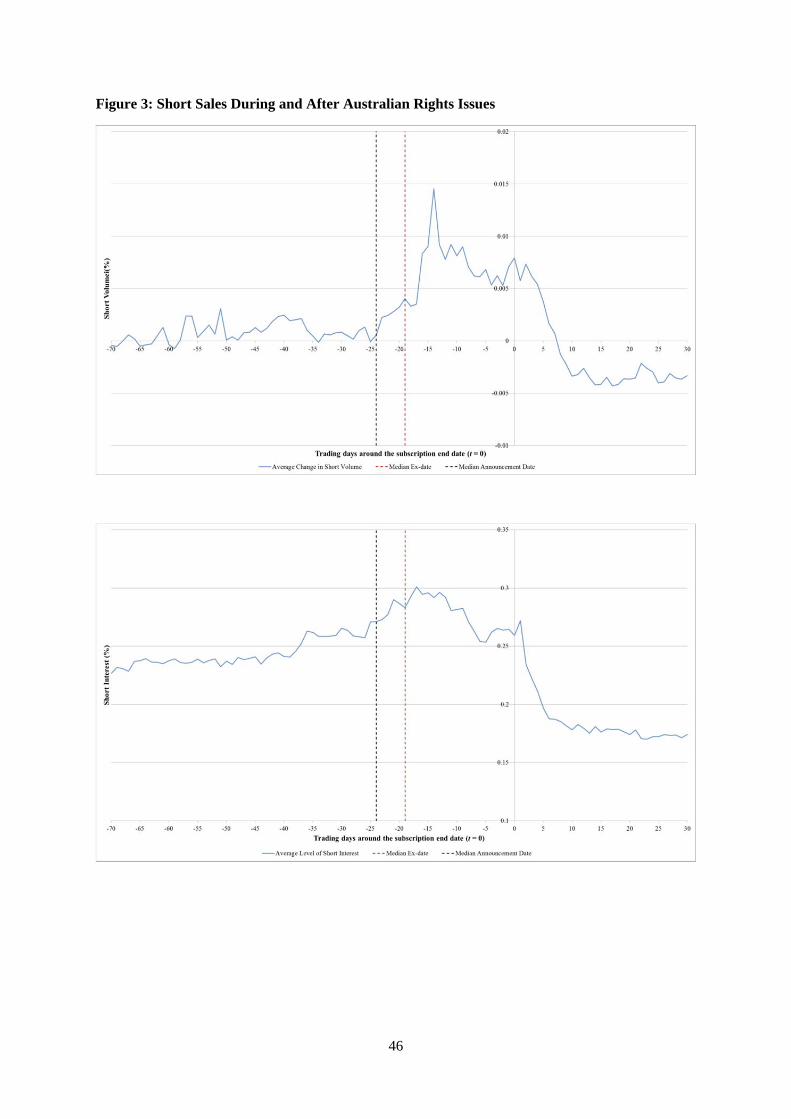
46
Figure 3: Short Sales During and After Australian Rights Issues

47
Table 1: Number of Rights Offerings Conducted per Country per Year
2002 2003 2004 2005 2006 2007 2008 2009 2010 2011 2012 2013 2014 Total %Australia 77 94 94 104 118 172 168 336 236 235 233 241 231 2,339 20.09%South Korea 24 76 62 139 116 142 102 132 88 57 49 53 66 1,106 9.50%Taiwan 45 20 38 52 65 88 37 79 135 104 92 108 123 986 8.47%Hong Kong 35 25 34 49 56 69 47 87 63 65 69 62 98 759 6.52%Germany 6 23 69 63 73 77 67 67 67 82 48 15 14 671 5.76%United Kingdom 58 61 65 61 38 20 24 85 33 28 28 42 47 590 5.07%Sweden 20 27 25 40 45 46 49 73 75 42 49 42 39 572 4.91%Singapore 3 10 9 13 28 66 26 44 48 17 27 31 28 350 3.01%Malaysia 21 42 27 17 1 28 21 15 30 29 28 35 39 333 2.86%France 13 17 20 23 27 32 13 41 33 25 29 21 26 320 2.75%Turkey 27 11 40 33 28 22 20 24 17 29 27 12 8 298 2.56%Brazil 5 10 21 22 15 26 27 29 28 30 33 28 20 294 2.53%Thailand 3 0 3 11 22 20 20 15 21 28 32 55 48 278 2.39%Indonesia 2 8 13 10 16 21 24 11 28 26 21 27 21 228 1.96%Italy 9 11 18 17 22 13 13 22 16 24 18 16 19 218 1.87%India 2 11 16 19 33 17 17 20 19 18 16 11 12 211 1.81%Israel 2 1 0 14 10 17 12 28 30 23 31 20 17 205 1.76%Norway 6 11 11 11 6 18 14 27 19 14 17 16 9 179 1.54%Canada 2 10 10 6 8 10 7 20 15 10 9 14 13 134 1.15%Pakistan 0 0 1 0 15 35 13 5 15 16 3 10 14 127 1.09%South Africa 8 8 5 5 5 4 13 13 16 12 9 8 17 123 1.06%Egypt 0 1 0 7 11 20 26 11 13 5 0 2 8 104 0.89%Greece 4 8 5 9 7 18 5 10 10 7 5 10 6 104 0.89%United States 3 2 5 3 8 5 9 5 16 9 14 13 10 102 0.88%New Zealand 8 8 7 10 7 10 8 14 9 7 3 2 5 98 0.84%Chile 4 4 5 16 10 2 11 13 2 1 6 12 10 96 0.82%China 23 25 22 2 1 2 0 2 5 3 3 3 1 92 0.79%Austria 3 6 14 18 10 5 4 7 4 6 1 4 1 83 0.71%Poland 2 7 6 6 22 10 0 3 7 5 8 2 0 78 0.67%Mexico 4 4 11 6 8 8 6 9 6 2 2 3 2 71 0.61%Denmark 0 0 3 4 5 6 5 9 17 7 5 6 0 67 0.58%Spain 0 0 3 12 7 7 1 9 8 4 5 4 3 63 0.54%Switzerland 1 2 8 5 4 4 1 9 7 7 4 8 2 62 0.53%Philippines 4 1 0 6 4 8 5 7 9 4 3 0 5 56 0.48%Finland 4 3 4 2 3 4 1 9 2 6 5 6 3 52 0.45%Belgium 3 3 0 1 4 5 1 7 7 2 1 2 5 41 0.35%Peru 2 4 3 3 3 2 6 2 2 1 2 6 2 38 0.33%Portugal 2 0 4 0 6 3 4 2 3 3 3 0 2 32 0.27%Netherlands 0 1 6 2 0 3 2 5 1 3 1 2 2 28 0.24%Japan 0 1 5 3 1 0 0 2 2 0 0 2 2 18 0.15%Argentina 0 0 0 4 4 3 2 0 2 0 0 0 0 15 0.13%Ireland 0 1 1 2 0 1 0 2 2 3 0 1 2 15 0.13%Russia 0 0 0 0 1 2 0 0 0 1 0 2 0 6 0.05%Total 435 557 693 830 873 1,071 831 1,310 1,166 1,000 939 957 980 11,642
3.74% 4.78% 5.95% 7.13% 7.50% 9.20% 7.14% 11.25% 10.02% 8.59% 8.07% 8.22% 8.42%

48
Table 2: Announcement Date Reaction to Rights Issues
The table reports daily market adjusted abnormal returns estimated with the Scholes-Williams market model around the announcement date of 5,346 rights issues of equity by international firms in 43 countries between 2002 and 2014. This event study is only conducted for rights issues with announcement date data. AN denotes the announcement date of a right issue. AN to EX (-10, 0) denotes the ‘special window’ which is calculated as the median number of days between the announcement and the ex-date for our international sample. The symbols ***, **, and * denote statistical significance at the 1%, 5% and 10% level respectively using a two-tail test for the Wilcoxon signed rank test (applicable for the Median BHAR), and skewness corrected test (applicable for the Mean BHAR).
Days Mean BHAR Median BHAR
-10 0.13% 0.02%
-9 -0.09%* 0.01%
-8 0.12%* 0.05%
-7 0.07% 0.00%
-6 0.05% 0.01%
-5 -0.02% 0.00%
-4 -0.12%** -0.01%**
-3 -0.04% 0.03%
-2 0.09% 0.06%
-1 0.05% 0.01%
0 (AN) -1.97%*** -0.23%***
+1 -1.57%*** -0.15%***
+2 -0.37%*** -0.05%***
+3 0.00% 0.02%
+4 -0.06%** 0.01%
+5 -0.07% 0.01%
AN to EX 0.82%** -0.38%

49
Table 3: Abnormal Returns Before and After the Subscription End Date
The table reports mean and median buy-and-hold abnormal returns employing the Scholes-Williams market model for various event windows centred around the subscription end (SE) date (t = 0). EX is the ex-date. The symbols ***, **, and * denote statistical significance at the 1%, 5% and 10% level respectively using either the Wilcoxon signed rank test (for the Median BHAR) or the skewness corrected test (for the Mean BHAR).
WindowMean BHAR
(%)Median BHAR
(%)
(-39, 0) -3.54*** -3.99***
(-29, 0) -2.65*** -2.97***
(-19, 0) -2.49*** -2.45***
(-9, 0) -1.53*** -1.02***
(-4, 0) -0.05 -0.05***
(+1,+5) -0.22 -0.18**
(+1,+10) -1.00*** -0.75***
(+1,+20) -0.68*** -0.87***
(+1,+30) -0.32*** -0.91***
(+1,+40) -0.29*** -0.78***
EX to SE -4.10*** -3.94***

50
Table 4: Firm Factors and Issue Characteristics Explaining Returns
The dependent variable, BHAR (-10) (or BHAR (-20)), is the buy-and-hold abnormal return in the shortest period of either: (a) 10 (or 20) trading days immediately prior to the subscription end date or (b) the ex-date and the subscription end date. Closing Spread is the average percentage bid-ask spread over 6 trading months ending 62 trading days before the ex-date. Free Float is the percentage of total shares in issue available to ordinary investors on the ex-date of the offering. Company Size is the natural logarithm of average market value over one trading month ending 62 trading days before the ex-date. Dividend Yield is the average dividend per share as a percentage of the share price over one trading month ending 62 trading days before the ex-date. Discount is the offering price on the ex-date divided by the unadjusted market price on the ex-date, subtract one. Duration is the natural logarithm of the number of days between the ex-date and the subscription end date. Offering Ratio is the number of new shares offered relative to one old share as specified by the terms and conditions of the rights. Transferability is a binary variable equal to one if the offering is transferable, and zero otherwise. Run-up is the raw return starting six trading months (128 trading days) prior the estimated announcement date and ending 63 trading days before the ex-date. Idiosyncratic Risk is the root-mean squared error obtained from the estimation of the market model used to produce abnormal returns. Leverage is the average ratio of total debt divided by total assets value over one trading month ending 62 days before the ex-date. The symbols ***, ** and * denote statistical significance at the 1%, 5% and 10% level respectively. t-statistics are adjusted for country-by-year clustering and are denoted in parentheses.
(1) (2) (3) (4)BHAR (-10) BHAR (-10) BHAR (-20) BHAR (-20)
Closing Spread -0.048* -0.060** -0.044 -0.048(-1.696) (-2.029) (-1.320) (-1.484)
Free Float 0.012* 0.020**(1.684) (2.187)
Analyst Coverage 0.008*** 0.007*** 0.013*** 0.013***(3.752) (3.410) (5.123) (4.668)
Company Size -0.002 -0.002 -0.003* -0.002(-1.414) (-1.429) (-1.885) (-1.365)
Dividend Yield 0.077 0.087 0.080 0.077(1.199) (1.263) (0.963) (0.855)
Discount 0.019*** 0.020*** 0.041*** 0.046***(3.428) (3.174) (4.028) (3.838)
Duration 0.033*** 0.031*** 0.031*** 0.028***(5.771) (4.974) (3.882) (3.062)
Offering Ratio -0.004* -0.003 -0.006*** -0.008***(-1.653) (-1.486) (-2.589) (-3.140)
Transferability 0.000 0.001 0.007 0.009*(0.084) (0.235) (1.526) (1.750)
Run-up -0.009*** -0.009*** -0.015*** -0.015***(-3.194) (-3.677) (-4.372) (-4.921)
Idiosyncratic Risk 0.088 0.115 0.036 0.055(0.741) (0.962) (0.238) (0.336)
Leverage -0.007 -0.015** -0.006 -0.010(-1.031) (-1.998) (-0.660) (-0.975)
Intercept -0.104*** -0.103*** -0.112*** -0.117***(-4.652) (-4.217) (-3.463) (-3.227)
Country-year FE Yes Yes Yes YesObservations 9,834 8,559 9,834 8,559R-squared 0.095 0.099 0.094 0.103

51
Table 5: Relationship between Returns before and after Subscription End
BHAR (-10) and BHAR (-20) are measures of subscription period returns, and are defined in Table 3 respectively. BHAR (+10), BHAR (+20) and BHAR (+30) are measures of post-offering returns, and are calculated as the buy-and-hold abnormal returns in the immediate 10, 20 and 30 trading days after the subscription end date respectively. All other independent variables are defined in Table 3. The symbols ***, ** and * denote statistical significance at the 1%, 5% and 10% level respectively. t-statistics are adjusted for country-by-year clustering and are denoted in parentheses.
(1) (2) (3) (4) (5) (6)BHAR (+10) BHAR (+20) BHAR (+30) BHAR (+10) BHAR (+20) BHAR (+30)
BHAR (-10) -0.110*** -0.139*** -0.105***(-5.946) (-5.715) (-3.836)
BHAR (-20) -0.069*** -0.095*** -0.074***(-5.062) (-4.728) (-3.104)
Closing Spread 0.020 0.087** 0.121** 0.021 0.091** 0.121**(0.721) (2.203) (2.243) (0.771) (2.355) (2.350)
Analyst Coverage 0.009*** 0.019*** 0.024*** 0.009*** 0.019*** 0.024***(4.018) (5.549) (5.582) (3.903) (5.562) (5.584)
Company Size -0.007*** -0.013*** -0.019*** -0.007*** -0.013*** -0.020***(-4.883) (-5.924) (-6.738) (-4.808) (-5.874) (-6.775)
Dividend Yield 0.086 0.113 0.095 0.086 0.104 0.091(1.430) (1.278) (0.846) (1.474) (1.166) (0.800)
Discount -0.004 -0.010 -0.005 -0.004 -0.010 -0.005(-0.579) (-1.128) (-0.477) (-0.528) (-1.068) (-0.429)
Duration 0.000 -0.009 -0.017 -0.001 -0.010 -0.017(0.066) (-1.031) (-1.615) (-0.181) (-1.095) (-1.577)
Offering Ratio -0.014*** -0.020*** -0.021*** -0.014*** -0.020*** -0.022***(-5.606) (-5.888) (-6.058) (-5.605) (-5.978) (-6.111)
Transferability 0.007 0.007 0.010 0.009 0.007 0.011(1.379) (1.103) (1.315) (1.611) (1.166) (1.417)
Run-up -0.012*** -0.026*** -0.037*** -0.013*** -0.027*** -0.038***(-5.521) (-7.635) (-9.052) (-5.548) (-7.619) (-8.988)
Idiosyncratic Risk -0.223* -0.235 -0.314 -0.242** -0.278* -0.352*(-1.944) (-1.612) (-1.512) (-2.223) (-1.947) (-1.733)
Leverage 0.007 0.001 -0.003 0.008 0.003 -0.002(0.736) (0.105) (-0.226) (0.766) (0.228) (-0.135)
Intercept 0.035* 0.099*** 0.163*** 0.039* 0.103*** 0.164***(1.669) (3.201) (4.204) (1.826) (3.204) (4.144)
Country-year FE Yes Yes Yes Yes Yes YesObservations 9,834 9,834 9,834 9,834 9,834 9,834R-squared 0.109 0.121 0.136 0.107 0.120 0.137

52
Table 6: Relationship between Returns and Short Sales Restrictions
Restriction is a variable that is the cumulative sum, based on the following criteria: equal to 0 if no restrictions on short selling are in place in the home country, 1 if an up-tick rule is in place, 1 if there is a ban on naked-short selling, 1 if there is a disclosure regime in place, 1 if there is a ban on all financial companies, 0.5 if there is a partial ban on financial companies, and 0.5 if there are other preventative measures in place (e.g., circuit breakers). Tick Rule is a binary variable equal to one if a tick rule is in place in the issuer’s primary market and in the same year as the issuer’s rights offering, and zero otherwise. Disclosure is a binary variable equal to one if short sales disclosure regimes are in place in the issuer’s primary market and in the same year as the issuer’s rights offering, and zero otherwise. All other independent variables are defined in Table 3. The symbols ***, ** and * denote statistical significance at the 1%, 5% and 10% level respectively. t-statistics are adjusted for industry clustering and are denoted in parentheses.
(1) (2) (3) (4) (5) (6)BHAR (-10) BHAR (-10) BHAR (-10) BHAR (-20) BHAR (-20) BHAR (-20)
Restriction 0.002* 0.003***(2.034) (4.280)
Tick Rule 0.009** 0.008(2.456) (1.095)
Disclosure 0.002 0.015***(0.440) (3.901)
Closing Spread -0.034** -0.083*** -0.079*** -0.007 -0.056 -0.068*(-3.098) (-6.053) (-3.547) (-0.295) (-1.527) (-2.350)
Analyst Coverage 0.012*** 0.012*** 0.010*** 0.011*** 0.011** 0.016**(9.938) (4.736) (4.641) (4.601) (2.420) (2.922)
Company Size -0.005*** -0.008*** -0.002 -0.002*** -0.005*** -0.003(-13.936) (-16.780) (-1.555) (-5.802) (-6.082) (-1.672)
Dividend Yield 0.081 0.154* 0.064 0.069 0.054 0.077(1.376) (2.018) (0.683) (1.070) (0.509) (0.923)
Discount 0.018* 0.016 0.029** 0.044*** 0.036** 0.062***(2.043) (1.368) (3.080) (4.131) (2.816) (7.704)
Duration 0.019*** 0.018* 0.031*** 0.006 0.017** 0.023***(4.866) (2.214) (6.742) (1.306) (2.456) (7.112)
Offering Ratio -0.005** -0.005 -0.008*** -0.006** -0.004 -0.011***(-2.617) (-1.834) (-3.657) (-2.697) (-1.104) (-3.962)
Transferability -0.005 0.002 -0.000 -0.007* 0.003 -0.006(-1.695) (0.381) (-0.057) (-1.896) (0.541) (-1.175)
Run-up -0.007*** -0.004** -0.012*** -0.012*** -0.016*** -0.016***(-7.794) (-2.686) (-6.468) (-6.256) (-6.863) (-7.517)
Idiosyncratic Risk 0.010 -0.020 0.158 -0.071 -0.147 -0.007(0.088) (-0.115) (0.850) (-0.543) (-0.872) (-0.045)
Leverage -0.008 0.002 -0.019 -0.006 -0.010 -0.017*(-0.906) (0.148) (-1.487) (-0.798) (-0.865) (-2.132)
Intercept -0.052 0.014 -0.072 -0.005 0.017 -0.010(-1.445) (1.025) (-1.452) (-0.078) (0.183) (-0.086)
Year FE Yes Yes Yes Yes Yes YesIndustry FE Yes Yes Yes Yes Yes YesObservations 9,437 4,540 5,818 9,437 4,540 5,818R-squared 0.032 0.045 0.038 0.038 0.040 0.062
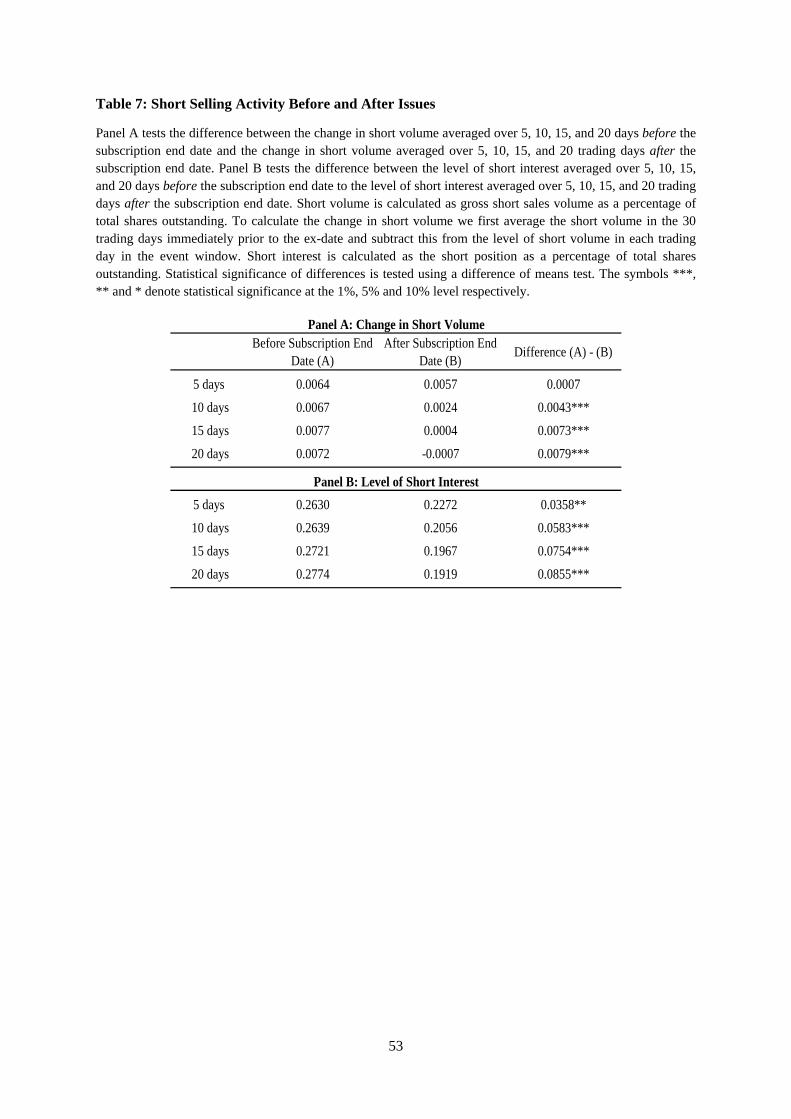
53
Table 7: Short Selling Activity Before and After Issues
Panel A tests the difference between the change in short volume averaged over 5, 10, 15, and 20 days before the subscription end date and the change in short volume averaged over 5, 10, 15, and 20 trading days after the subscription end date. Panel B tests the difference between the level of short interest averaged over 5, 10, 15, and 20 days before the subscription end date to the level of short interest averaged over 5, 10, 15, and 20 trading days after the subscription end date. Short volume is calculated as gross short sales volume as a percentage of total shares outstanding. To calculate the change in short volume we first average the short volume in the 30 trading days immediately prior to the ex-date and subtract this from the level of short volume in each trading day in the event window. Short interest is calculated as the short position as a percentage of total shares outstanding. Statistical significance of differences is tested using a difference of means test. The symbols ***, ** and * denote statistical significance at the 1%, 5% and 10% level respectively.
Panel A: Change in Short VolumeBefore Subscription End
Date (A)After Subscription End
Date (B)Difference (A) - (B)
5 days 0.0064 0.0057 0.0007
10 days 0.0067 0.0024 0.0043***
15 days 0.0077 0.0004 0.0073***
20 days 0.0072 -0.0007 0.0079***
Panel B: Level of Short Interest
5 days 0.2630 0.2272 0.0358**
10 days 0.2639 0.2056 0.0583***
15 days 0.2721 0.1967 0.0754***
20 days 0.2774 0.1919 0.0855***
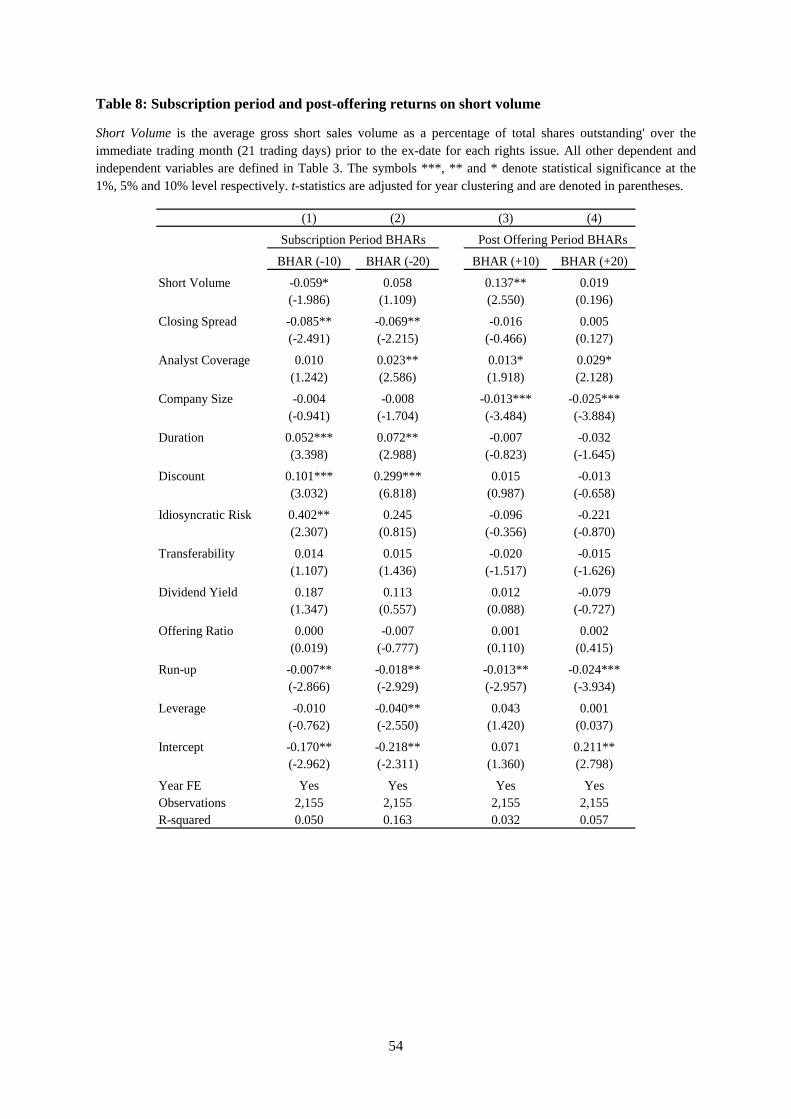
54
Table 8: Subscription period and post-offering returns on short volume
Short Volume is the average gross short sales volume as a percentage of total shares outstanding' over the immediate trading month (21 trading days) prior to the ex-date for each rights issue. All other dependent and independent variables are defined in Table 3. The symbols ***, ** and * denote statistical significance at the 1%, 5% and 10% level respectively. t-statistics are adjusted for year clustering and are denoted in parentheses.
(1) (2) (3) (4)
Subscription Period BHARs Post Offering Period BHARs
BHAR (-10) BHAR (-20) BHAR (+10) BHAR (+20)
Short Volume -0.059* 0.058 0.137** 0.019(-1.986) (1.109) (2.550) (0.196)
Closing Spread -0.085** -0.069** -0.016 0.005(-2.491) (-2.215) (-0.466) (0.127)
Analyst Coverage 0.010 0.023** 0.013* 0.029*(1.242) (2.586) (1.918) (2.128)
Company Size -0.004 -0.008 -0.013*** -0.025***(-0.941) (-1.704) (-3.484) (-3.884)
Duration 0.052*** 0.072** -0.007 -0.032(3.398) (2.988) (-0.823) (-1.645)
Discount 0.101*** 0.299*** 0.015 -0.013(3.032) (6.818) (0.987) (-0.658)
Idiosyncratic Risk 0.402** 0.245 -0.096 -0.221(2.307) (0.815) (-0.356) (-0.870)
Transferability 0.014 0.015 -0.020 -0.015(1.107) (1.436) (-1.517) (-1.626)
Dividend Yield 0.187 0.113 0.012 -0.079(1.347) (0.557) (0.088) (-0.727)
Offering Ratio 0.000 -0.007 0.001 0.002(0.019) (-0.777) (0.110) (0.415)
Run-up -0.007** -0.018** -0.013** -0.024***(-2.866) (-2.929) (-2.957) (-3.934)
Leverage -0.010 -0.040** 0.043 0.001(-0.762) (-2.550) (1.420) (0.037)
Intercept -0.170** -0.218** 0.071 0.211**(-2.962) (-2.311) (1.360) (2.798)
Year FE Yes Yes Yes YesObservations 2,155 2,155 2,155 2,155R-squared 0.050 0.163 0.032 0.057

55
Table 9: Fuzzy Regression Discontinuity Analysis – Naked Short Selling (NSS) Regulation
100MV Dummy is a binary variable equal to one if the issuer has a market value greater than A$100 million on its ex-date, and zero otherwise. NSS Dummy is a binary variable equal to one if the rights issuer is in the ASX’s approved NSS list. BHAR (-10) and BHAR (-20) are the same independent variables as defined in Table3. Discount (Sub-End) is calculated as the offering price on the ex-date divided by the unadjusted market price on the subscription end date, subtract one. The symbols ***, ** and * denote statistical significance at the 1%, 5% and 10% level respectively. t-statistics are denoted in parentheses.
(1) (2) (3) (4) (5) (6)First-Stage Second-Stage First-Stage Second-Stage First-Stage Second-Stage
NSS Dummy BHAR (-10) NSS Dummy BHAR (-20) NSS Dummy Discount (Sub-End)
100MV Dummy 0.337** 0.334** 0.327**(2.023) (2.021) (2.064)
NSS Dummy (estimate) -0.220 -0.364** 0.305*( -1.374) (-2.167) (-1.676)
Effective Observations (Left) 52 52 52 52 60 60Effective Observations (Right) 49 49 51 51 51 51Polynomial Linear Linear Linear Linear Linear Linear

56
Table 10: Placebo Tests using Hypothetical Naked Short Selling (NSS) Regulation
The definitions of 100MV Dummy and NSS Dummy are the same as Table 8. BHAR (-10), BHAR (-20) are defined in Table 3. The symbols ***, ** and * denote statistical significance at the 1%, 5% and 10% level respectively. t-statistics are denoted in parentheses.
(1) (2)BHAR (-10) BHAR (-20)
100MV Dummy -0.013 0.014(-0.271) (0.515)
Effective Observations (Left) 216 180Effective Observations (Right) 128 115Polynomial Linear Linear
Panel A: Hypothetical NSS Regulation (Post 22 September 2008 Period) - Sharp RDD
Panel B: Pre-2008 NSS Regulation using A$90 million as the placebo threshold(1) (2) (3) (4)
First-Stage Second-Stage First-Stage Second-StageNSS Dummy BHAR (-10) NSS Dummy BHAR (-20)
100MV Dummy 0.205 0.308( 1.121) (1.610)
NSS Dummy (estimate) 0.384 0.373(1.122) (-1.133)
Effective Observations (Left) 67 67 49 49Effective Observations (Right) 50 50 37 37Polynomial Linear Linear Linear Linear
Panel C: Pre-2008 NSS Regulation using A$110 million as the placebo threshold100MV Dummy 0.305 0.303
(1.585) (1.481)
NSS Dummy (estimate) -0.144 -0.029(-1.180) (-0.122)
Effective Observations (Left) 138 138 95 95Effective Observations (Right) 61 61 56 56Polynomial Linear Linear Linear Linear