Embed Size (px)
Citation preview

Short Range Transit Plan
For Manchester, NH FY 2018 – FY 2022
Prepared for the Manchester Transit Authority
By the Southern New Hampshire Planning Commission
August 2017
SHORT RANGE TRANSIT PLAN FOR MANCHESTER, NH
FY 2018 – FY 2022
Prepared for the Manchester Transit Authority
By the Southern New Hampshire Planning Commission
August 2017
The preparation of this report has been financed in part through grant[s] from the Federal Highway Administration and Federal Transit Administration, U.S. Department of Transportation, under the State Planning and Research Program, Section 505 [or Metropolitan Planning Program, Section 104(f)] of Title 23, U.S. Code. The contents of this report do not necessarily reflect the official views or policy of the U.S. Department of Transportation.

MTA Short Range Transit Plan – August 2017
TABLE OF CONTENTS INTRODUCTION………………………………………………………………………….……….. 1
Background 1
Goals and Objectives of the SRTP 1
Contents of this Report 2
PART 1: MTA TODAY…………………………………………………………………………... 3
Organization 3
Fixed-Route Services 5
Shopper Shuttle 6
System Map 7
Fares 9
Demand-Response Paratransit 10
Ridership 13
Revenues & Expenditures 16
Evaluation of Existing Service 19
Public Transportation Demand (including maps) 20
PART 2: MTA IN THE FUTURE……………………………………………………..…….. 34
Accomplishments 34
Monitoring System Performance 34
Service and Schedule Adjustments 35
Marketing Practices 35
Vehicle Replacement 36
Community Support Activities 37
System Amenities 37

MTA Short Range Transit Plan – August 2017
1
INTRODUCTION Background The FY 2018 – FY 2022 Short Range Transit Plan (SRTP) provides a five-year program for the continuing development of the Manchester Transit Authority’s (MTA) fixed-route bus and ADA complementary paratransit services. The document has been designed to provide MTA and Southern New Hampshire Planning Commission (SNHPC) with the necessary information to review all aspects of operation. The SNHPC Unified Planning Work Program (UPWP) includes funding for updates to the SRTP and the work is completed according to a September 26, 1995 agreement between SNHPC and MTA to maintain and update the SRTP. The SRTP includes a description and evaluation of existing transit service and formulates recommendations. The recommendations included in the SRTP will be re-assessed during the each subsequent version of the Plan. The MTA, in its present form, was established by the City of Manchester on May 1, 1973 for the purpose of providing mass transit service to the community. A five-member Commission appointed by the Board of Mayor and Aldermen governs the Authority. The SNHPC is the designated Metropolitan Planning Organization (MPO) for the area. Transit planning in the MPO area is the responsibility of the SNHPC as MTA operating and capital funding is administered through the SNHPC Transportation Improvement Program (TIP) and Regional Transportation Plan (RTP). In addition, the SNHPC provides planning services to the MTA and conducts short and long-range transit planning activities as included in the UPWP. Goals and Objectives of the SRTP It is generally agreed upon that the development and maintenance of a comprehensive public transit system is desirable to provide an attractive and viable transportation alternative to the single-occupant automobile. MTA and SNHPC are committed to the continuing development of public transit in this area to improve mobility, provide access to employment, medical care and other services as well as to improve the environment and promote livable and sustainable communities. In this regard, the following overall goal of the SRTP is “[T]o assist in the development and provision of an efficient, reliable and cost-effective public transit service that encourages increased use by representing a viable alternative to single-occupant automobile travel.”
EST. 1973

MTA Short Range Transit Plan – August 2017
2
The following objectives for the SRTP have been identified as necessary to attain this goal:
1. Collect and analyze data on transit system performance and urban development patterns to assess adequacy and efficiency of service and to identify opportunities for new or changed service design.
2. Encourage increased ridership and cost effective service by considering and analyzing input from current riders.
3. Evaluate MTA fare structure so as to encourage ridership while maintaining a minimum 10% farebox recovery rate.
4. Identify alternative sources of revenue in order to diversify MTA’s local match stream.
5. Develop specific strategies to encourage use amongst choice riders. Contents of this Report The document is divided into two parts, which are summarized below:
1. MTA Today: Organization/Management Structure Fixed-Route Service Fares Demand-Response Paratransit Ridership Trends Revenues & Expenditures Evaluation of Existing Service Public Transportation Demand
2. MTA Down the Road: Measurable Recommendations
A - Accomplishments B - Monitoring System Performance C – Service/Schedule Adjustments D – Marketing Practices E – Vehicle Replacement F – Community Support Activities G – System Amenities

MTA Short Range Transit Plan – August 2017
3
PART 1: MTA TODAY This section provides a comprehensive discussion of MTA transit services currently offered in the SNHPC region and beyond. The discussion includes administration, fixed-route and paratransit service features such as routes, fares, MTA facilities and capital, ridership data and revenues and expenditures. ORGANIZATION The Manchester Transit Authority was established by the City of Manchester on May 1, 1973 as a public non-profit agency designed to provide mass transit service for the community. Although the MTA also provides pupil transportation for the Manchester School District, public transit and school transportation funding, operations, and vehicles are administered as completely separate entities. MTA is governed by a five-member Board of Commissioners appointed by the Board of Mayor and Aldermen and a Chairman and Vice-Chairman are elected from the membership. An Executive Director is responsible for the financial and operational oversight of both Transit and School services. The MTA consists of three main departments.
Operations o Daily operations, including driver assignments, vehicle schedules, and
dispatching o Assistant Executive Director responsible for daily oversight
Maintenance o Plans and implements comprehensive programs for vehicle, equipment,
and facility maintenance o Maintenance Foreman responsible for oversight of maintenance functions
Administrative o Plans, directs, and performs the fiscal and administrative duties/activities
of the agency o Assistant Director of Finance responsible for daily oversight
The current employee roster includes 25 full fill-time drivers, 79 part-time school bus drivers, 9 maintenance workers, 3 dispatchers, 3.5 clerical personnel, 1 safety supervisor, 1 maintenance foreman, 1 assistant maintenance foreman, 1 information technology supervisor, 1 CFO, and 3 Managers. The MTA’s organizational structure is outlined in Exhibit 1.

MTA Short Range Transit Plan – August 2017
4

MTA Short Range Transit Plan – August 2017
5
FIXED-ROUTE SERVICES
The existing MTA fixed-route system (see Exhibit 2) consists of 14 routes providing scheduled service Monday through Friday to Manchester and limited portions of surrounding communities. Saturday service is provided on twelve of these routes, while no Sunday service is provided. Hours of operation on Weekdays are between 5:25 a.m. and 6:25 p.m., while on Saturdays they are reduced slightly to between 9:30 a.m. and 5:00 p.m. Comprehensive service is provided to the central business district, and routes extend outwards to serve other areas of the City. The fixed-route system is confined to the boundaries of the City of Manchester, except for limited service to the following surrounding towns: Bedford The Bedford Grove Plaza / Second St (Route 13) route extends less than a mile into the adjacent town of Bedford to serve commercial activities. Goffstown The Bremer St./Mast Rd. (Route 6) route extends 1.25 miles into Goffstown and serves St. Anselm College and a shopping center. Londonderry The Brown Ave./Airport (Route 3) route extends approximately one mile into Londonderry to serve Manchester Boston Regional Airport and immediate areas. Hooksett The Front St. / Hackett Hill Rd. (Route 11) route extends less than a mile into Hooksett immediately around Wal-Mart on NH 3A. Concord The Concord Express (Route 4) route offers express service to the Stickney Avenue Transportation Center in Concord, allowing connecting service to Concord Area Transit destinations as well as private inter-city operators. A second stop on Main Street provides connection with Downtown Concord. Nashua The Nashua Express (Route 9) route offers express service to the Nashua Mall. There, passengers may connect with Nashua Transit System for service throughout Nashua.

MTA Short Range Transit Plan – August 2017
6
Shopper Shuttle This free fare fixed-route service connects residents with area food shopping. The shuttle runs to Manchester grocery stores on Mondays, Wednesdays and Fridays, Goffstown on Tuesdays, and Hooksett on Thursdays. All of the MTA’s routes are linked together into “schedules” that are given schedule numbers. Drivers are then assigned to individual schedules. When a bus completes one outbound and inbound trip, it commences an outbound trip via another route, and so forth. There are 21 such “schedules”, each weekday. Frequency of service, or headway, varies with the time of day. Peak hours are defined as before 9:30 a.m. (morning) and after 1:30 p.m. (afternoon). The midday period runs from 9:30 a.m. to 1:30 p.m. Headways are sometimes shorter during peak hours and longer during midday periods. Headways do, however, vary by route, time of day, weekday, or Saturday.

MTA Short Range Transit Plan – August 2017
7
MTA Short Range Transit Plan – August 2017
8
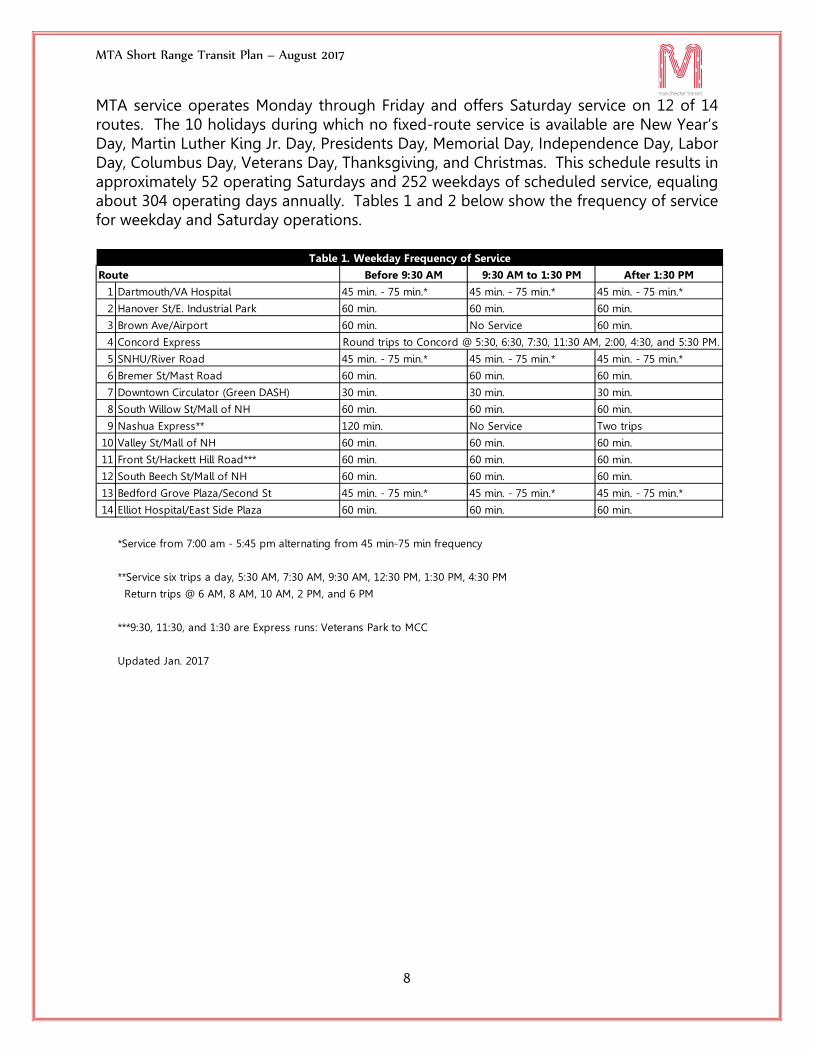
MTA service operates Monday through Friday and offers Saturday service on 12 of 14 routes. The 10 holidays during which no fixed-route service is available are New Year’s Day, Martin Luther King Jr. Day, Presidents Day, Memorial Day, Independence Day, Labor Day, Columbus Day, Veterans Day, Thanksgiving, and Christmas. This schedule results in approximately 52 operating Saturdays and 252 weekdays of scheduled service, equaling about 304 operating days annually. Tables 1 and 2 below show the frequency of service for weekday and Saturday operations.
Before 9:30 AM 9:30 AM to 1:30 PM After 1:30 PM
1 Dartmouth/VA Hospital 45 min. - 75 min.* 45 min. - 75 min.* 45 min. - 75 min.*
2 Hanover St/E. Industrial Park 60 min. 60 min. 60 min.
3 Brown Ave/Airport 60 min. No Service 60 min.
4 Concord Express
5 SNHU/River Road 45 min. - 75 min.* 45 min. - 75 min.* 45 min. - 75 min.*
6 Bremer St/Mast Road 60 min. 60 min. 60 min.
7 Downtown Circulator (Green DASH) 30 min. 30 min. 30 min.
8 South Willow St/Mall of NH 60 min. 60 min. 60 min.
9 Nashua Express** 120 min. No Service Two trips
10 Valley St/Mall of NH 60 min. 60 min. 60 min.
11 Front St/Hackett Hill Road*** 60 min. 60 min. 60 min.
12 South Beech St/Mall of NH 60 min. 60 min. 60 min.
13 Bedford Grove Plaza/Second St 45 min. - 75 min.* 45 min. - 75 min.* 45 min. - 75 min.*
14 Elliot Hospital/East Side Plaza 60 min. 60 min. 60 min.
*Service from 7:00 am - 5:45 pm alternating from 45 min-75 min frequency
**Service six trips a day, 5:30 AM, 7:30 AM, 9:30 AM, 12:30 PM, 1:30 PM, 4:30 PM
Return trips @ 6 AM, 8 AM, 10 AM, 2 PM, and 6 PM
***9:30, 11:30, and 1:30 are Express runs: Veterans Park to MCC
Updated Jan. 2017
Route
Table 1. Weekday Frequency of Service
Round trips to Concord @ 5:30, 6:30, 7:30, 11:30 AM, 2:00, 4:30, and 5:30 PM.

MTA Short Range Transit Plan – August 2017
9
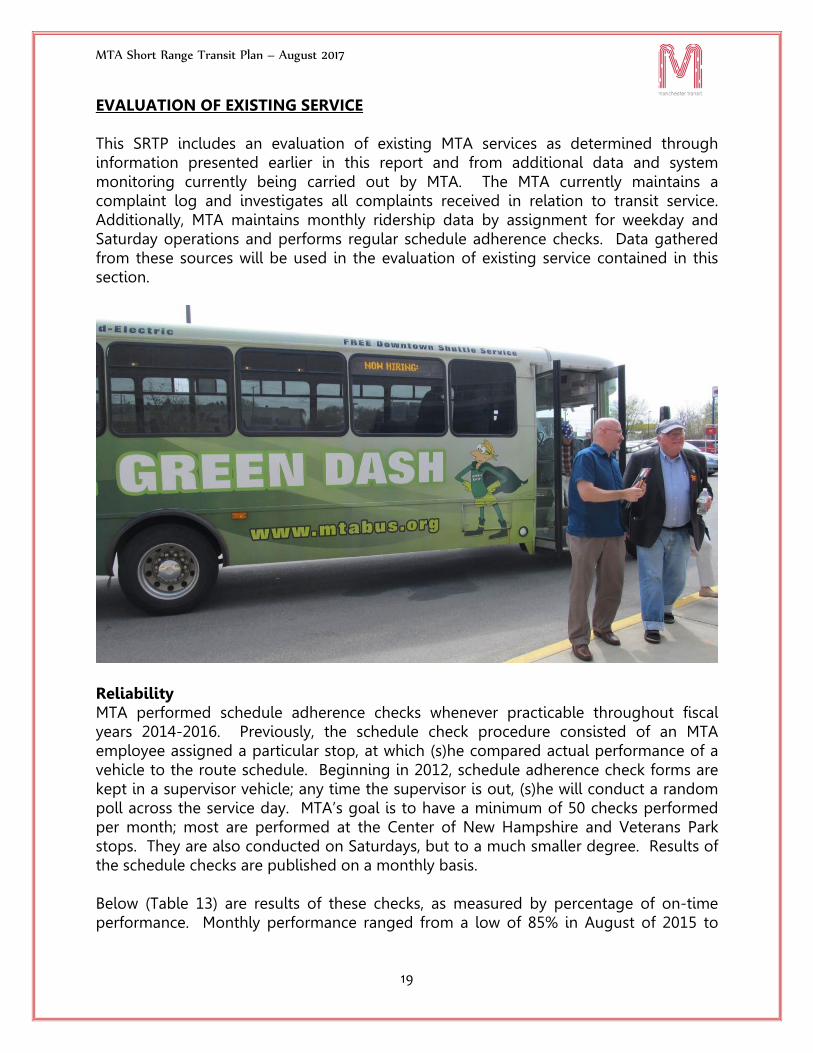
In July 2010, MTA initiated service on the “Green DASH” circulator service providing transportation throughout downtown and the Millyard in an area bounded by West Brook Street to the north, Granite Street to the south, Commercial Street to the west and Elm Street to the east. The service is operated as MTA Route #7 and has a 30-minute frequency from 9:20 AM – 4:50 PM. Service operates Monday through Friday using two hybrid electric buses, the first hybrid buses placed in service for public transportation in New Hampshire. Green DASH is an acronym for Green Downtown Area Shuttle. FARES A listing of MTA fares for fixed route service, last increased in July 2014, is shown below. Fares vary by age of rider and ticket type. MTA passes can be purchased in person or by mail at 110 Elm Street, Manchester NH, 03101. Day/week passes may be purchased directly from the bus driver and all MTA passes are available online at www.mtabus.org. To qualify for the senior discount passengers must be at least 65 years of age.
Frequency Hours
1 Dartmouth/VA Hospital 45 min. - 75 min.* 9:45a‐3:45p
2 Hanover St/E. Industrial Park 60 min. 9:30a-4:30p
4 Concord Express 10:00, 12:30, 4:30 10:00a-4:30p
5 SNHU/River Road 45 min. - 75 min.* 9:45a-3:45p
6 Bremer St/Mast Road 60 min. 9:30a-4:30p
8 South Willow St/Mall of NH 60 min. 9:30a-4:30p
9 Nashua Express 120 min. 9:30a-3:30p
10 Valley St/Mall of NH 60 min. 9:30a-4:30p
11 Front St/Hackett Hill Road 120 min. 10:30a-4:30p
12 South Beech St/Mall of NH 60 min. 10:00a-5:00p
13 Bedford Grove Plaza/Second St 45 min. - 75 min.* 10:30a-4:30p
14 Elliot Hospital/East Side Plaza 45 min. - 75 min.* 10:30a-4:30p
Updated Jan. 2017
Route
Table 2. Saturday Frequency of Service

MTA Short Range Transit Plan – August 2017
10
The farebox will not make cash change. An MTA fare card will be issued by the farebox as change for a future ride. Bus operators cannot make change and are prohibited from handling riders’ fares. Passengers must deposit cash into the farebox. A day pass is valid for all MTA routes, all day. Cash Fare (Fixed Route) Fare $2.00 Senior/Disabled Fare* $1.00 Cash Fares (Concord/Nashua to Manchester): Day Pass $5.00 Senior/Disabled Day Pass* $2.50 Weekly Passes (7 Days): Weekly $20.00 Senior/Disabled Weekly $10.00 Monthly Passes (31 Days): Monthly 60.00 Student (K-Grade 12) Monthly $45.00 Senior/Disabled Monthly $30.00 *Passengers 65 years of age or older as well as those with a Medicare or MTA Half Fare ID card are eligible. **The MTA is not responsible for lost or stolen tickets or monthly passes. Ticket Outlets: Day/Weekly Passes can be purchased:
on the bus (farebox) All passes can be purchased:
by MAIL at: MTA Tickets 110 Elm St. Manchester, NH 03101
IN PERSON at:
MTA- 110 Elm Street
ONLINE at: www.mtabus.org DEMAND-RESPONSE PARATRANSIT StepSaver Since November 1978, MTA has provided origin to destination service for individuals unable to use fixed-route transit service due to a disability. StepSaver is a

MTA Short Range Transit Plan – August 2017
11
transportation program offered by the MTA as required under the Americans with Disabilities Act (ADA) of 1990. ADA requires designated FTA recipients to provide a “complementary paratransit program” to individuals who are prevented from using the fixed route bus service due to their disability. Prospective StepSaver clients complete applications administered by the MTA in compliance with the ADA. Certification by a physician or health care agency is required to verify that an individual has a disability that prevents them from accessing the fixed route system. StepSaver provides transportation on an advance reservation basis. Customers eligible for the service may call the MTA dispatch office and schedule their rides up to a week in advance. Reservation hours are 5:25 am to 7:00 pm, Monday through Friday. Saturday reservation hours are 9:30 am to 5:30 pm and Sunday reservations may be left via voicemail for dispatch as MTA offices and service are closed on Sundays. Transportation is provided six days a week from 5:30 am to 6:30 pm Monday through Friday and from 9:30 am to 5:30 pm on Saturday. The StepSaver service area is limited to an area within .75 mile of existing fixed-route service. During FY2016, the MTA StepSaver Service carried 9,109 passengers, utilizing five lift-equipped vehicles. A fare of $4.00 is charged for each one-way trip. Current StepSaver service is operated on an origin to destination basis. More information on StepSaver can be found at: http://www.mtabus.org/services/stepsaver/ Goffstown Shuttle Since 2015 MTA has partnered with the Town of Goffstown to provide curb-to-curb transportation for its residents. The service is available every Monday, Wednesday, and Friday between the hours of 9:00 AM and 2:00 PM. There is no charge for rides. Priority Bookings will be provided to those passengers that are 62+ years old and for those going to medical appointments. Passenger destinations are permitted within Goffstown and for medical appointments in Goffstown, Manchester and Bedford only. This may require the MTA to call back passengers the day prior when a schedule conflict occurs with priority bookings. (Example: A passenger booking 7 days prior for grocery shopping may need to be cancelled or rescheduled when a passenger, even one day prior, books for a medical appointment or the passenger is 62+ years old.)

MTA Short Range Transit Plan – August 2017
12
The MTA will take reservations for those passengers looking to travel within Manchester for non-medical appointments (where space is available). The Goffstown Shuttle will transport passengers to the Shaw’s Plaza in Goffstown where passengers can board MTA’s #6 Bremer St. bus. This allows passengers to travel throughout Manchester. Facilities and Equipment The MTA offices, maintenance facilities, and bus storage complex is located at 110 Elm Street in Manchester. This facility, completed in January 1976, contains separate office, storage, and maintenance spaces. The office area provides space for supervisory and clerical personnel, a conference room, and an operators’ lounge with locker rooms. The bus storage section, consisting of seven lanes with overhead doors, contains enough space for 35 full-sized transit coaches. The maintenance area contains five bays with hydraulic lifts, a ventilated booth for spray painting and bodywork, machine shop area, and a spare parts storage room. An auxiliary building on the premises houses the automatic gantry-type washer used to clean bus exteriors. A fueling island with diesel and gasoline pumps and an overhead canopy is situated outside the main building.
Current MTA rolling stock (as of January 2017) includes 15 transit coaches, 8 lift-equipped StepSaver vehicles, 80 school buses, 3 supervisory vehicles, 1 pickup, 1 dump truck and 1 front-loader.
Quantity Year Make Model Seats
2 2004 Orion 7.502 35
6 2006 Gillig G29E102R2 28
3 2007 Gillig G29E102R2 28
3 2008 Gillig G29E102R2 28
2 2009 IC Bus Hybrid BOC 36
2 2010 Ford Aerotech 16
3 2011 StarTrans Senetor E-Lo 12
1 2014 Chevrolet Glaval LF 12
2 2014 Dodge Entervan 4
Quantity Year Make
1 1998 Caterpillar
1 2001 International
1 2003 Chevrolet
1 2003 Chevrolet
1 2010 Ford
1 2016 Ford
Updated May 2017
Table 3. MTA Bus and Van Inventory
Table 4. MTA Supervisory/Service Vehicle Inventory
Model
Explorer
Explorer
Astro
Silverado
4700 4x2
924F

MTA Short Range Transit Plan – August 2017
13
RIDERSHIP Table 5 indicates that since 2008, annual ridership on the MTA system has increased by approximately two percent. After a major increase in FY2009 due to the national recession, ridership dropped off sharply in FY2010; however, it then returned to levels above those of FY2004-08. FY2014 saw another considerable increase, largely due to the introduction of line instead of loop service. Ridership has remained steady at 483-492,000 riders per year since then.
FY Year Ridership % ChangeFY2008 475,210 15.42FY2009 531,961 11.94FY2010 446,902 -15.99FY2011 462,109 3.40FY2012 430,404 -7.37FY2013 442,233 2.67FY2014 483,959 8.62FY2015 491,571 10.04FY2016 484,474 -1.44
1.95Source: NTD, MTA
Table 5: MTA Yearly Fixed Route Ridership, FY 2008-2016
Change, 2008-2016
FY Year
FY2008 May 44,799 July 33,747FY2009 October 50,329 November 40,198FY2010 October 40,365 January 33,163FY2011 March 42,517 January 32,912FY2012 April* 39,613 July 32,425FY2013 April 40,673 November 33,261FY2014 October 44,665 February 34,633FY2015 October 46,345 February 35,250FY2016 October 45,755 January 35,402Source: Manchester Transit Authority
*Includes Public Specials/MTA Excursions
Table 6. High and Low Months for MTA Fixed Route Ridership, FY 2008-2016
Highest Month and Ridership
Lowest Month and Ridership

MTA Short Range Transit Plan – August 2017
14
Review of annual ridership statistics (Table 6) indicates that ridership tends to be highest in the fall (October) and spring (April/May). Ridership tends to be lowest in winter (November to February) or during summer (July). Every month, MTA gathers weekday and Saturday ridership data by run assignment. The data comes directly from the farebox reports on each run. Weekday ridership has increased slightly since FY 2008, as shown in Table 7. While Saturday ridership has declined since its FY 2008 peak, it has been steadily increasing again since FY 2012.
FY Year Ridership % ChangeFY2008 1,675 14.3FY2009 1,884 12.5FY2010 1,568 -16.8FY2011 1,621 3.4FY2012 1,672 3.1FY2013 1,607 -3.9FY2014 1,756 9.3FY2015 1,786 1.7FY2016 1,740 -2.6
3.9%Source: MTA
Table 7. MTA Average Weekday Ridership,
FY 2008-2016
Change, 2008-2016
Year Ridership % ChangeFY2008 929 9.6FY2009 1,034 11.3FY2010 890 -13.9FY2011 909 2.1FY2012 809 -11.0FY2013 778 -3.8FY2014 831 6.8FY2015 833 0.2FY2016 866 4.0
-6.8Source: MTA
Table 8. MTA Average Saturday Ridership,
FY 2008-2016
Change, 2008-2016

MTA Short Range Transit Plan – August 2017
15
StepSaver ridership increased annually until FY2011, when it began decreasing gradually until FY2014. In FY 2015, MTA began its travel training program, which enabled a considerable portion of StepSaver riders to transition to fixed-route service. This is reflected in a 32% decrease that year. Having reached diminishing returns, StepSaver ridership ticked up slightly in FY 2016. Overall, StepSaver ridership has decreased 25 percent from 12,160 riders in FY 2008 to 9,109 in FY 2016 as shown in Table 9.
Monthly ridership patterns for StepSaver are similar to those identified for MTA fixed route service. Since FY 2008, there is not much of a pattern to highest ridership months, as it has fallen in six of the 12 months. Lowest ridership, however, fairly predictably occurs during winter months. Monthly StepSaver ridership data is summarized in Table 10 below.
FY Year Ridership % ChangeFY2008 12,160 7.61FY2009 11,645 -4.24FY2010 13,709 17.72FY2011 14,544 6.09FY2012 13,663 -6.06FY2013 13,260 -2.95FY2014 13,049 -1.59FY2015 8,876 -31.98FY2016 9,109 2.63
-25.09%Source: NTD, MTA
Table 9. MTA StepSaver Ridership, FY 2008-2016
Change, 2008-2016
FY YearFY2008 October 1,187 December 911FY2009 April 1,162 August 806FY2010 April 1,347 August 915FY2011 September 1,335 February 1,060FY2012 March 1,263 February 1,035FY2013 November 1,631 January 737FY2014 October 1,206 February 959FY2015 June 861 February 519FY2016 June 933 January 658
Table 10. High and Low Months for MTA StepSaver Ridership, FY 2008-2016
Highest Month Lowest Month
Source: Manchester Transit Authority

MTA Short Range Transit Plan – August 2017
16
REVENUES & EXPENDITURES Major sources of revenues used by the MTA to provide transit service include FTA funding, local assistance, farebox revenues, advertising and other revenues from non-transportation sources. Non-transportation revenues include those derived from the sale of maintenance services, rental of buildings and other properties, investment income, and sale of vehicles. The MTA receives Section 5307 funding directly from the FTA for operating subsidies and for capital costs. Local match is a requirement for these funds, and the MTA receives its local share funding for Section 5307 funds and other programs primarily from an annual General Fund appropriation from the City of Manchester. The City currently provides a local match for capital maintenance funds and for operation of the MTA’s StepSaver service at a rate of 80% Federal and 20% City. The City also provides the required 50 percent match for operating subsidies. In addition, the City contributes to the local 20% match for the system’s bus-related capital costs. Table 11 shows the local match funding contributed by the City of Manchester for the period FY 2008- FY 2016.
Expenditure and Revenue Trends Data describing system revenues and expenditures for the years FY 2008 to FY 2016 is presented in Exhibits 3 and 4. Exhibit 3 shows variations in the individual sources of transit revenue for this period. As a percentage of total revenues, Federal funding varied from a low of 44 percent in FY 2010 to a high of 52 percent from FY 2013 to FY 2015, while local funding varied from a low of 25 percent in FY 2011 to a high of 37 percent in FY 2008. As a percentage of total revenues, fares varied from a high of 16 percent in FY 2010 and FY 2015 to a low of 11 percent in FY 2008.
FY Year City Contributions
FY2008 $1,176,714
FY2009 $900,000
FY2010 $900,000FY2011 $886,500
FY2012 $1,073,825
FY2013 $1,073,825
FY2014 $1,080,536
FY2015 $1,108,560
FY2016 $1,153,560Source: MTA
Table 11. Source of Local Contribution FY08-FY16

MTA Short Range Transit Plan – August 2017
17
Exhibit 3
A detailed breakdown of fare revenues for FY 2016 is shown in Exhibit 4. For FY 2016, 51 percent of total fare revenue came from farebox revenue, 24 percent came from purchase of adult fares, and 8 percent came from adult monthly fares. Disabled rider fares accounted for 7 percent of the total fare revenue.
Exhibit 4
Exhibit 5 shows annual variations in the level of the various sources of operating expenses for the period FY 2008 to FY 2016. Salary, wages and benefits, which, as a percentage of total operating expenses, represent the most significant portion, varied from a low of 56 percent in FY 2011 to a high of 75 percent in FY 2008. For the period FY 2008 to FY 2016, total operating expenses increased by 20 percent from $3,389,493 to $4,064,491. By comparison, materials and supplies, which represented the next highest single component of total operating expenses, accounted for only 12 percent of the total for FY 2016.
0%
10%
20%
30%
40%
50%
60%
FY08 FY09 FY10 FY11 FY12 FY13 FY14 FY15 FY16
Sources of Transit Revenues Expended, FY2008-2016
Fare Revenue
Local
Federal
Pub/Priv Partnerships
51%
24%
8%
7%
4%5%
1%
Fare Revenue Sources, FY 2016Farebox Revenue
Adult Fares
Adult Monthly Fares
Disabled Rider Fares
Senior CitizenMonthly FaresSenior Citizens Fares
Student Fares

MTA Short Range Transit Plan – August 2017
18
Exhibit 5
StepSaver expenditures and revenues have seen an overall increase since FY 2008. In 2008, StepSaver total operating expenses were $441,983 and for FY 2016 these operating expenses were $560,091, representing an increase of roughly 27%. However, these expenses have decreased by roughly 20% in the last two fiscal years. Table 12 depicts StepSaver operating expenses and fare revenues for the period FY 2008- FY 2016.
The MTA also provides other specialized fixed route services. Shopper Shuttle services transport riders to grocery stores in Manchester, Goffstown, and Hooksett.
FY YearOperating Expense Fare Revenue
FY2008 $441,983 $23,214
FY2009 $508,277 $29,013
FY2010 $473,828 $40,158FY2011 $630,459 $41,955
FY2012 $623,682 $34,938
FY2013 $597,684 $37,737
FY2014 $703,226 $28,500
FY2015 $612,403 $32,796
FY2016 $560,091 $36,364Source: MTA
Table 12. StepSaver Operating Expense vs. Fare Revenue
MTA Short Range Transit Plan – August 2017
19
EVALUATION OF EXISTING SERVICE This SRTP includes an evaluation of existing MTA services as determined through information presented earlier in this report and from additional data and system monitoring currently being carried out by MTA. The MTA currently maintains a complaint log and investigates all complaints received in relation to transit service. Additionally, MTA maintains monthly ridership data by assignment for weekday and Saturday operations and performs regular schedule adherence checks. Data gathered from these sources will be used in the evaluation of existing service contained in this section.
Reliability MTA performed schedule adherence checks whenever practicable throughout fiscal years 2014-2016. Previously, the schedule check procedure consisted of an MTA employee assigned a particular stop, at which (s)he compared actual performance of a vehicle to the route schedule. Beginning in 2012, schedule adherence check forms are kept in a supervisor vehicle; any time the supervisor is out, (s)he will conduct a random poll across the service day. MTA’s goal is to have a minimum of 50 checks performed per month; most are performed at the Center of New Hampshire and Veterans Park stops. They are also conducted on Saturdays, but to a much smaller degree. Results of the schedule checks are published on a monthly basis. Below (Table 13) are results of these checks, as measured by percentage of on-time performance. Monthly performance ranged from a low of 85% in August of 2015 to

MTA Short Range Transit Plan – August 2017
20
100% in June 2015 and June 2016. Overall on-time performance has remained consistently over 92% in each of the last three fiscal years.
Table 13
PUBLIC TRANSPORTATION DEMAND The purpose of this section is to identify potential demand for public transportation in the MTA service area. The SRTP has identified patterns of current ridership on existing MTA fixed-route and StepSaver paratransit systems. This section, in attempting to identify potential demand for MTA services in excess of current ridership levels, will evaluate MTA services relative to the following criteria: 1) Service Coverage Those areas of Manchester in excess of one quarter (.25) mile from existing fixed-route transit are identified, including the number of dwelling units and population within these areas. This is completed using Census 2010 block level data. 2) Service in Relation to Transit-Dependent Populations Geographic areas in Manchester having significant numbers of elderly residents, low income populations, low rates of automobile ownership, and areas of high density housing is identified and a comparative analysis with MTA routes is completed. 3) Service in Relation to Major Trip Attractors/Development Factors Existing MTA routes are analyzed in relation to factors related to demand for transit service. In an effort to determine the adequacy of general accessibility to transit services, each portion of the City as defined by traffic analysis zones (TAZ) from the SNHPC regional travel demand model is compared with current MTA routes. 4) StepSaver Service While demand for StepSaver Service is somewhat unpredictable, there have been significant decreases in ridership since FY 2008. In FY 2015, MTA began its travel
Jul Aug Sep Oct Nov Dec Jan Feb Mar Apr May Jun Avg
On time 120 93 41 48 72 92 84 117 108 121 94 21 1011
Sampled 138 94 47 52 75 98 89 125 120 122 105 23 1088
Percentage 0.87 0.99 0.87 0.92 0.96 0.94 0.94 0.94 0.90 0.99 0.90 0.91 92.92%
On time 208 122 108 93 186 180 172 68 168 178 26 62 1571
Sampled 223 134 111 105 197 186 195 72 181 183 28 62 1677
Percentage 0.93 0.91 0.97 0.89 0.94 0.97 0.88 0.94 0.93 0.97 0.93 1.00 93.68%
On time 108 52 89 51 66 106 41 126 73 115 53 63 943
Sampled 110 61 98 55 72 111 44 133 76 123 59 63 1005
Percentage 0.98 0.85 0.91 0.93 0.92 0.95 0.93 0.95 0.96 0.93 0.90 1.00 93.83%
MTA On-time performance rate, FY2014-FY2016
FY2014
FY2015
FY2016

MTA Short Range Transit Plan – August 2017
21
training program, which enabled a considerable portion of StepSaver riders to transition to fixed-route service. This is reflected in a 32% decrease that year. Having reached diminishing returns, StepSaver ridership ticked up slightly in FY 2016. Service CoverageCorridors for transit service are considered to extend one-quarter mile from each established route, thereby limiting a resident’s walk to four blocks, or approximately between five (5) and eight (8) minutes. Upon inspection of MTA’s routes, it was has been calculated that MTA routes are accessible, on foot, to approximately eighty-five (85) percent of the population. Some areas of the city lie beyond existing transit service; they are located in the northwest, northeast, and southeast fringe areas of Manchester. These areas are indicated in Exhibit 6. StepSaver Service During FY 2016, the MTA StepSaver Service carried 9,109 passengers, utilizing five lift-equipped vehicles. Population estimates and projections developed by SNHPC for the City of Manchester were utilized to determine the estimated ADA paratransit population. Two distinct demographic categories, citizens under the age of 65 and citizens age 65 or older, exhibit different paratransit trip making patterns. Elderly persons have a much higher incidence of transportation disability than the rest of the population; therefore, a higher percentage of senior citizens are eligible for paratransit service. Effective coverage of StepSaver routes is shown in Exhibit 6a. In an effort to more accurately measure the community not served by current MTA fixed-route service (lying more than .25 mile from bus routes), population and dwelling unit estimates for traffic analysis zones (TAZ) not well-served by transit were identified. Traffic Analysis Zones 3, 13, 22, 52, 55, 119, 265, and 269 were recognized as not well-served by transit. Exhibit 7 shows the location of Traffic Analysis Zones in Manchester.

Bedford
Auburn
Londonderry
Hooksett
Goffstown
MerrimackLitchfield
!"b#$
%&d'(
QÍ
Qå
UrV
Q̧
Qº
Qv
%&d'(
Ij
Q̧
MTA Bus Routes.25 Mile MTA Route BufferTown BoundariesStreamsLake/Pond
RoadsHighwaysPrincipal ArterialsMinor Arterials
Data Sources:NH GRANIT Digital Data (1:24,000)US Census Bureau 2010Manchester Transit Authority (MTA)Southern New Hampshire Planning CommissionNH Department of Transportation
The individual municipalities represented on thismap and the SNHPC make no representationsor guarantees to the accuracy of the featuresand designations of this map. This map is forplanning purposes only. It is not to be used forlegal boundary determinations or for regulatorypurposes.
0 10.5Miles
:
Ij
Ij
Qä
QÍ
Q̧
Ij
Q¹
QÍ
!"b#$
!"b#$
Q¹Qº
Qí
Qv
%&d'(
Exhibit # 6 Effective Coverage
of MTA Routes City of Manchester
NewHampshireLocationMap

Bedford
Auburn
Londonderry
Hooksett
Goffstown
Merrimack
Candia
Litchfield
Derry
!"b#$
%&d'(
QÍ
Qå
UrV
Q̧
Qº
Qv
%&d'(
Ij
Q̧
MTA Bus Routes3/4 Mile MTA Route BufferTown BoundariesStreamsLake/Pond
RoadsHighwaysPrincipal ArterialsMinor Arterials
Data Sources:NH GRANIT Digital Data (1:24,000)US Census Bureau 2010Manchester Transit Authority (MTA)Southern New Hampshire Planning CommissionNH Department of Transportation
The individual municipalities represented on thismap and the SNHPC make no representationsor guarantees to the accuracy of the featuresand designations of this map. This map is forplanning purposes only. It is not to be used forlegal boundary determinations or for regulatorypurposes.
0 10.5Miles
:
Ij
Ij
Qä
QÍ
Q̧
Ij
Q¹
QÍ
!"b#$
!"b#$
Q¹
Qº
Qí
Qv
%&d'(
Exhibit # 7Step Saver
Effective Coverageof MTA Routes
City of Manchester
NewHampshireLocationMap

Bedford
Auburn
Londonderry
Hooksett
Goffstown
MerrimackLitchfield
7
18
55
54
9
6
4
119
40
56
52
2
53
63
118
120
11
60
57
64M
58
117
39
272
116
61
1314
62
1241
3
46
270
59
15
51
269
267
5
38
273
17
42
115
266
29
22
30
50
16
47 49
37
43
271
261
45 263
48
31
265
36
44
35
28
32
21
34260
259
33
19
258
!"b#$
%&d'(
QÍ
Qå
UrV
Q̧
Qº
Qv
%&d'(
Ij
Q̧
17
9
22
29
31 30
35
28
16
24
36
32
21
27
34
265
25
46
33
20
23
19
254256
26
248
45
258
250
249
251
260
255
271
44
8 247
43
253
252
Traffic Analysis ZonesMTA Bus RoutesTown BoundariesStreamsLake/Pond
RoadsHighwaysPrincipal ArterialsMinor Arterials
Data Sources:NH GRANIT Digital Data (1:24,000)US Census Bureau 2010Manchester Transit Authority (MTA)Southern New Hampshire Planning CommissionNH Department of Transportation
The individual municipalities represented on thismap and the SNHPC make no representationsor guarantees to the accuracy of the featuresand designations of this map. This map is forplanning purposes only. It is not to be used forlegal boundary determinations or for regulatorypurposes.
0 10.5Miles :
Ij
Ij
Qä
QÍ
Q̧
Ij
Q¹
QÍ
!"b#$
!"b#$
Q¹Qº
Qí
Qv
%&d'(
Exhibit # 8Traffic Analysis Zones (TAZs)
City of Manchester

MTA Short Range Transit Plan – August 2017
25
Service in Relation to Elderly Concentrations The 2010 U.S. Census reported that 11.8% (12,955 persons) of Manchester’s population are aged 65 years or older, in comparison to 12.9% (13,825 persons) from the 2000 U.S. Census. Exhibit 9 indicates by 2010 Census Tracts the proportion of the elderly population.
Collectively, the six above tracts contain 29.39% of Manchester’s population aged 65 years or older. The Census Tracts with concentrations of elderly population generally border the downtown area or are on the West Side; both of these areas tend to be well served by MTA routes. Access to shopping centers, recreational facilities, parks, cultural centers, hospitals, and other medical facilities is excellent. Some of the tracts contain public housing sites for the elderly, which are managed and operated by the Manchester Housing Authority. Five such high-rise developments are discussed in the following paragraphs. The Kalivas and O’Malley buildings are located on Chestnut Street, between Central and Spruce Streets (Census Tract 14). These buildings contain 200 units with approximately 250 residents. Access to all MTA routes is readily available on Elm Street, which is two blocks west of these buildings; these buildings are served directly by the South Willow route (Route 8). The Pariseau Building is located at 55 Amory Street (Census Tract 3). It has 100 units and approximately 130 residents. This building is served by the Bremer St./ Mast Rd. route (Route 6). Weekday service is provided on an hourly basis. The Reverend Burns high-rise apartment complex is located at Granite Square, which is the intersection of Granite and Main Streets (Census Tract 20). The building contains 120 units and has approximately 150 residents. The Bremer St./ Mast Rd. route (Route 6) and Bedford/ Bedford Grove route (Route 13) directly serve the complex.
Tract Desciption % 65+
2.03 Vicinity of NH 3A between I‐293 & Merrimack R. 24.1%
12 Between Bridge St, Belmont St, Lake Ave, Mammoth Rd 18.8%
8 Between Harrison St, Union St, Bridge St, Belmont St 17.9%
25 Between Cilley Rd, railroad, I‐293, Mammoth Rd 17.1%
11 Between Wellington Rd, Mammoth Rd, I‐293, I‐93 16.5%
22 Between Piscataquog R, Milford St, Goffstown/Bedford TL 16.1%

MTA Short Range Transit Plan – August 2017
26
The Governor Hugh J. Gallen apartments are located at 200 Hanover Street (Census Tract 14). They consist of 94 units and have approximately 120 residents. The Hanover St./ East Industrial Park route (Route 2) provides direct service to the site. Access to all other MTA routes is readily available on Elm Street, which lies two blocks to the west. The travel needs of the elderly have been documented in the Coordinated Public Transit – Human Services Transportation Plan for the SNHPC Region. Factors that play a significant role in the use and non-use of transit by the elderly population include income level, automobile availability, and physical ability. Seniors generally tend to use the bus for shopping purposes as well as for other personal business (medical appointments, etc.). Senior citizens tend to be more dependent on public transportation due to economics (low incomes) and physical impairments, both of which make owning and operating an automobile more difficult. The marital status (widow, widower, etc.) also factors into this transit dependency for senior citizens. Reduced fares on the fixed-route service ($1.00 per ride) are available every day to senior citizens and disabled individuals who possess an approved MTA identification card showing that they are age 65+. MTA fixed-route service is completely accessible, i.e. lift-equipped. StepSaver service is available for mobility-impaired persons who are unable to use the regular fixed-route service due to disability. This service is available Monday through Friday with departures between 5:25AM and 7:00PM, and on Saturday with departures between 9:30AM and 5:30PM. A fare of $4 is charged for each one-way StepSaver trip.
Service in Relation to Low Income Populations Previous rider surveys have concluded that the average MTA rider is of relatively low income. Upon an examination of Manchester’s census tracts, it is evident that the census tracts which exhibit high poverty rates and low median income are relatively well served by transit. These areas tend to be concentrated close to downtown as shown in Exhibits 10 and 11.
Service in Relation to Population Density Fixed-route transit service is most viable when it serves areas of high population density. Manchester’s densest neighborhoods (i.e. those with relatively high numbers of housing units per acre) are close to downtown and on the West Side. Those downtown areas are well-served, while those on the West Side have a slightly lesser level of service (see Exhibit 12).
Service in Relation to Vehicle Ownership Again, the central neighborhoods are lower than the norm in terms of vehicles per household and vehicles per person (see Exhibit 13). All of these analyses exhibit the importance of properly and adequately serving the downtown population.

10
26
2.04
11
25
24
9.02
1.02
7
23
22
2.02
9.01
21
19
1.01
18
2.03
2004
83
6
9801.01
12
1617
20
13
1415
Bedford
Auburn
Londonderry
Hooksett
Goffstown
MerrimackLitchfield
!"b#$
%&d'(
QÍ
Qå
UrV
Q̧
Qº
Qv
%&d'(
Ij
Q̧
Percent Elderly Population0% - 9%10% - 13%14% - 17%18% - 25%MTA Bus Routes
RoadsHighwaysPrincipal ArterialsMinor ArterialsTown BoundariesStreamsLake/Pond
Data Sources:NH GRANIT Digital Data (1:24,000)US Census Bureau 2010Manchester Transit Authority (MTA)Southern New Hampshire Planning CommissionNH Department of Transportation
The individual municipalities represented on thismap and the SNHPC make no representationsor guarantees to the accuracy of the featuresand designations of this map. This map is forplanning purposes only. It is not to be used forlegal boundary determinations or for regulatorypurposes.
0 10.5Miles :
Ij
Ij
Qä
QÍ
Q̧
Ij
Q¹
QÍ
!"b#$
!"b#$
Q¹Qº
Qí
Qv
%&d'(
Exhibit # 9Percent of Elderly Population
by 2010 Census TractCity of Manchester
NewHampshireLocationMap

10
26
2.04
11
25
24
9.02
1.02
7
23
22
2.02
9.01
21
19
1.01
18
2.03
2004
83
6
9801.01
12
1617
20
13
1415
Bedford
Auburn
Londonderry
Hooksett
Goffstown
Merrimack
Candia
Litchfield
!"b#$
%&d'(
QÍ
Qå
UrV
Q̧
Qº
Qv
%&d'(
Ij
Q̧
Median Income$18,371 - $26,333$26,333 - $40,461$40,461 - $54,081$54,081 - $60,917$60,917 - $83,804MTA Bus Routes
RoadsHighwaysPrincipal ArterialsMinor ArterialsTown BoundariesStreamsLake/Pond
Data Sources:NH GRANIT Digital Data (1:24,000)US Census Bureau 2010Manchester Transit Authority (MTA)Southern New Hampshire Planning CommissionNH Department of Transportation
The individual municipalities represented on thismap and the SNHPC make no representationsor guarantees to the accuracy of the featuresand designations of this map. This map is forplanning purposes only. It is not to be used forlegal boundary determinations or for regulatorypurposes.
0 10.5Miles
:
Ij
Ij
Qä
QÍ
Q̧
Ij
Q¹
QÍ
!"b#$
!"b#$
Q¹Qº
Qí
Qv
%&d'(
Exhibit # 10Median Income
by 2010 Census TractCity of Manchester
NewHampshireLocationMap

10
26
2.04
11
25
24
9.02
1.02
7
23
22
2.02
9.01
21
19
1.01
18
2.03
2004
83
6
9801.01
12
1617
20
13
1415
Bedford
Auburn
Londonderry
Hooksett
Goffstown
Merrimack
Candia
Litchfield
!"b#$
%&d'(
QÍ
Qå
UrV
Q̧
Qº
Qv
%&d'(
Ij
Q̧
PerCapita$0 - $20,000$20,000.01 - $25,000$25,000.01 - $30,000$30,000.01 - $35,000$35,000.01 - $41,000MTA Bus Routes
RoadsHighwaysPrincipal ArterialsMinor ArterialsTown BoundariesStreamsLake/Pond
Data Sources:NH GRANIT Digital Data (1:24,000)US Census Bureau 2010Manchester Transit Authority (MTA)Southern New Hampshire Planning CommissionNH Department of Transportation
The individual municipalities represented on thismap and the SNHPC make no representationsor guarantees to the accuracy of the featuresand designations of this map. This map is forplanning purposes only. It is not to be used forlegal boundary determinations or for regulatorypurposes.
0 10.5Miles
:
Ij
Ij
Qä
QÍ
Q̧
Ij
Q¹
QÍ
!"b#$
!"b#$
Q¹Qº
Qí
Qv
%&d'(
Exhibit #Per Capita Annual
Income by 2010 Census TractCity of Manchester
NewHampshireLocationMap
11

1,069
1,141
1,388
0
2,734
2,838
2,778
3,069
4,244
2,043
3,246
2,962
3,454
4,617
4,131
4,0817,799
5,564 9,862
6,425
6,040
8,449
11,58214,482
11,699
14,968
10,868
16,184
11,96620,136
Bedford
Auburn
Londonderry
Hooksett
Goffstown
MerrimackLitchfield
!"b#$
%&d'(
QÍ
Qå
UrV
Q̧
Qº
Qv
%&d'(
Ij
Q̧
Population per Square Mile0 - 2,0432,044 - 4,6174,618 - 8,4498,450 - 11,96611,967 - 20,136MTA Bus Routes
RoadsHighwaysPrincipal ArterialsMinor ArterialsTown BoundariesStreamsLake/Pond
Data Sources:NH GRANIT Digital Data (1:24,000)US Census Bureau 2010Manchester Transit Authority (MTA)Southern New Hampshire Planning CommissionNH Department of Transportation
The individual municipalities represented on thismap and the SNHPC make no representationsor guarantees to the accuracy of the featuresand designations of this map. This map is forplanning purposes only. It is not to be used forlegal boundary determinations or for regulatorypurposes.
0 10.5Miles
:
Ij
Ij
Qä
QÍ
Q̧
Ij
Q¹
QÍ
!"b#$
!"b#$
Q¹Qº
Qí
Qv
%&d'(
Exhibit # 12 Population Density by
2010 Census Tract City of Manchester
NewHampshireLocationMap

Bedford
Auburn
Londonderry
Hooksett
Goffstown
MerrimackLitchfield
!"b#$
%&d'(
QÍ
Qå
UrV
Q̧
Qº
Qv
%&d'(
Ij
Q̧
Percent with no Vehicles0% - 4.9%5% - 8.9%9% - 13.9%14% - 19.9%20% - 29.9%30% - 40%MTA Bus Routes
RoadsHighwaysPrincipal ArterialsMinor ArterialsTown BoundariesStreamsLake/Pond
Data Sources:NH GRANIT Digital Data (1:24,000)US Census Bureau 2010Manchester Transit Authority (MTA)Southern New Hampshire Planning CommissionNH Department of Transportation
The individual municipalities represented on thismap and the SNHPC make no representationsor guarantees to the accuracy of the featuresand designations of this map. This map is forplanning purposes only. It is not to be used forlegal boundary determinations or for regulatorypurposes.
0 10.5Miles :
Ij
Ij
Qä
QÍ
Q̧
Ij
Q¹
QÍ
!"b#$
!"b#$
Q¹Qº
Qí
Qv
%&d'(
Exhibit # 13Percent of Households
with no VehicleCity of Manchester
NewHampshireLocationMap

MTA Short Range Transit Plan – August 2017
32
Service in Relation to Major Trip Attractors/Development Factors Available fixed-route service was analyzed to determine the extent to which it meets current demands created by the following: Major shopping facilities Government facilities Major employers (200 or more employees) Population density Employment density Social and medical services
In order to identify unmet needs, each of Manchester’s 95 Traffic Analysis Zones was studied to determine the existence of the above trip generators and/or attractors and access to public transit. Please refer to Exhibit 8 for a display of the Traffic Analysis Zones (TAZs) in relation to the coverage of the existing transit service. Overall, Manchester’s main origin and destination points are well-covered by existing fixed-route transit service. There are two TAZs however, that are completely unserved by existing fixed route transit service (55 and 119). Apart from the fully-served and fully-unserved TAZs, there are several areas in which TAZs are only partially-served by transit. These TAZs are as follows: 2, 8, 13, 52, 56, 117, and 269; these zones’ deficiencies are noted as follows: Traffic Analysis Zone 2 is served by Route 1 – Healthcare Shuttle/ East Side Plaza, but only along Mammoth and Smyth Roads. Transit service is inconvenient for most of the residences in this zone, which are located outside of .25 mile from the transit route. Traffic Analysis Zone 8 is served by Route 11 – Front Street/ Hackett Hill Road. The majority of residences are located in the central portion of TAZ 8 which is located beyond the .25 mile of the route. Route 11 travels in the area of the Amoskeag Traffic Circle but hardly serves the remaining portion of TAZ 8. Traffic Analysis Zone 13 is served by Route 6 – Bremer Street/ Mast Road and Route 13 – Bedford Grove Plaza/ Second Street. Both Route 6 and Route 13 for the most part serve the outlying portions of TAZ 13. There is a significant amount of housing located to the north and south of Boynton Street in TAZ 13 that is unserved by transit and also a significant amount of residences outside of the .25 mile buffer.

MTA Short Range Transit Plan – August 2017
33
Traffic Analysis Zone 52 is served by Route 2 – Hanover Street/E. Industrial Park. This route runs along a portion of Candia Road in the northeast portion of TAZ 52. Aside from this very small portion of Candia Road, TAZ 52 is unserved by the MTA. The majority of the housing in this TAZ is low-density.
Traffic Analysis Zone 56 is served by Routes 3- Brown Ave/ Airport and 10- Valley St/ Mall of NH. The unserved residential area in this TAZ is along Mammoth Road. For the most part there is not a large concentration of housing in this TAZ. Additionally, there are no major zone attractors that are unserved. Traffic Analysis Zone 117 is served by Route 5- SNHU/ River Road. The majority of residences in this TAZ is unserved by transit and lie outside of .25 mile of transit. Route 5 runs along River Road which serves as the border of TAZ 117. Besides this portion of TAZ 117 there is no other transit service located within a reasonable distance. Traffic Analysis Zone 269 is served by Route 5 SNHU/ River Road. Similar to TAZ 117, TAZ 269 is relatively underserved by transit. Route 5 runs along W. Clarke Street which serves as the border for TAZ 269. The northern and western portions of TAZ 269 are beyond a reasonable distance to transit.

MTA Short Range Transit Plan – August 2017
34
PART 2: MTA IN THE FUTURE Transportation system management, capital improvement and operation recommendations for the FY 2018 – FY 2022 Short Range Transit Plan are summarized in this section. System management recommendations cover the following categories:
A) Accomplishments B) Monitoring System Performance C) Service/Schedule Adjustments D) Marketing Practices E) Vehicle Replacement F) Community Support Activities G) System Amenities
Recommendations for each category are listed below. Recommendations for some of the categories are provided in additional detail through a listing of individual action items.
A) Accomplishments Recommendation - Develop a community outreach program designed to increase awareness of recent accomplishments. In future SRTP, this first section should be used to highlight successful action item implementation from the previous plan. Action Items
Publicize the MTA’s transition from Cents A Bill fareboxes to Odyssey fareboxes and the greater functionality afforded riders. Publicize the change beginning with 2017 vehicle deliveries from Odyssey to FastFare fareboxes, an even more robust and passenger-friendly system
Continue efforts to expand the U-Pass program, building on the success with UNH and SNHU
Increase advertising availability on rolling stock vehicles through design and capital purchase criteria. Incorporate considerations for advertising into vehicle selection as appropriate.
B) Monitoring System Performance
Recommendation - Continue to generate regular ridership statistics by run and route and evaluate ridership statistics on a regular basis. Utilize data to measure and evaluate system performance and determine the impacts of service changes on ridership and on the system as a whole.
MTA Short Range Transit Plan – August 2017
35
Action Items Combine more detailed, period study (i.e. 100% load counts) with the data
inputs necessary to constructing individual route profiles and assess ridership on a trip-by-trip basis.
Analyze each route for productivity to identify low ridership and base recommendations for service changes on this analysis.
Complete a cost-revenue analysis for each route. Perform regular schedule adherence checks (minimum of fifty per month)
to ensure reliability of service, publish the data on a monthly basis and provide the data to SNHPC for inclusion in the Congestion Management Process. Transition away from physical observation and towards use of the onboard tablet/GPS functionality to greatly increase sample size while holding cost steady.
Obtain feedback on service quality and gain input on system expansion and improvements by administering regular surveys to MTA riders to coincide with future SRTP updates.
Evaluate StepSaver ride time for individual trips, comparing each to the time required to travel between the same destinations via fixed route
C) Service and Schedule Adjustments
Recommendation - Actively elicit input from a wide variety of individuals or parties to identify system deficiencies and make changes. Action Items
Reorganize fixed route numbering system to more clearly illustrate which routes are considered Zone 1, 2, or 3.
Continue to encourage and consider driver input in routing and scheduling.
Encourage suggestions from the public on routing and scheduling. Continue expansion of regional transit such as the expansion of the
Shopper Shuttle program including surrounding communities. Strong candidates for service expansion are Bedford and Hooksett though other possibilities also exist.
Develop a plan for expansion of service hours later during the day. Last buses currently depart Downtown at 5:30 PM on weekdays, this is too early for a City the size of Manchester. Identify strongest routes and begin with one or two to demonstrate demand and learn any lessons needed for running evening service.
D) Marketing Practices Recommendation – Update the design, look, and feel of the fixed route system to create a modern, inviting and easy-to-understand transportation option.

MTA Short Range Transit Plan – August 2017
36
Action Items Rebrand the fixed route buses as part of the approaching fleet
replacement. Design new colors and vehicle design and then apply that look to all other outreach materials from literature to bus stop signs in an effort to create a unified system aesthetic. Aim to replicate the success of rebranding the downtown circulator into the Green DASH.
Develop a new logo to replace the current one which has been used since 1973. Approach area colleges/universities to see if students would work on the project to save costs of design consultants.
E) Vehicle Replacement Recommendation - Ensure the maintenance of the fleet by adhering to the capital replacement program outlined in the FY 2018 – FY 2027 Ten Year Highway Plan. Action Items Replace aging fixed route fleet with 30’ New Flyer Midi vehicles incorporating a
new color scheme and design. Evaluate opportunities to make the riding experience more comfortable and enjoyable.
Replace and expand the low floor cutaway fleet to provide more accessible vehicles for paratransit as well as vehicles capable of operating on fixed route service in order to reduce spare vehicle needs.

MTA Short Range Transit Plan – August 2017
37
F) Community Support Activities Recommendation – MTA should seek out ways to participate in the community in an effort to be a positive impact on their service area as well as to expand support for public transportation to people who may never ride a bus themselves. Action Items Partner with Bike Manchester to implement bike racks at major transit stops Participate in community initiatives to broaden public support. These should
include a broad array of industries from the Chamber of Commerce to public health and social service agencies.
Seek out opportunities to participate on a State and National level to develop new skills and learn successful tips from other areas as well as to shape policy and funding decisions likely to affect MTA.
G) System Amenities Recommendation – In an effort to attract more choice riders, targeted investment of time and resources should be made in improving system amenities. Action Items Provide Bus route name(s) and number(s) on signs at several key stops,
preferably where multiple routes pass and post individual route maps and schedules for the route(s) in proximity to these bus signs.
Maintain a positive image, ensure system visibility and clearly signify community presence, 1) continue to update placement of all bus stop signs so that they accurately reflect current routes and 2) continuously replace missing /or damaged bus stop signs incorporating a new design and brand.
Now that MTA owns the former Signal shelters, evaluate placement and potential improvements like lighting and electronic displays.
Develop single route timetables and maps for electronic availability. Enhance electronic capabilities for passenger through design of an MTA app.