Embed Size (px)
Citation preview
Addressing the Livelihood Crisis of FarmersWeather & Climate Services
WMO
Short, Medium and Extended Range Forecasting
B. Mukhopadhyay
Overview…………..
• Relevance of Weather prediction to agriculture
• Spatial and Temporal Scales of weather phenomena
• Predictability
• Conventional methods of forecast
• Global and Regional NWP Models
• Climate models
• Integrated Agro advisory services
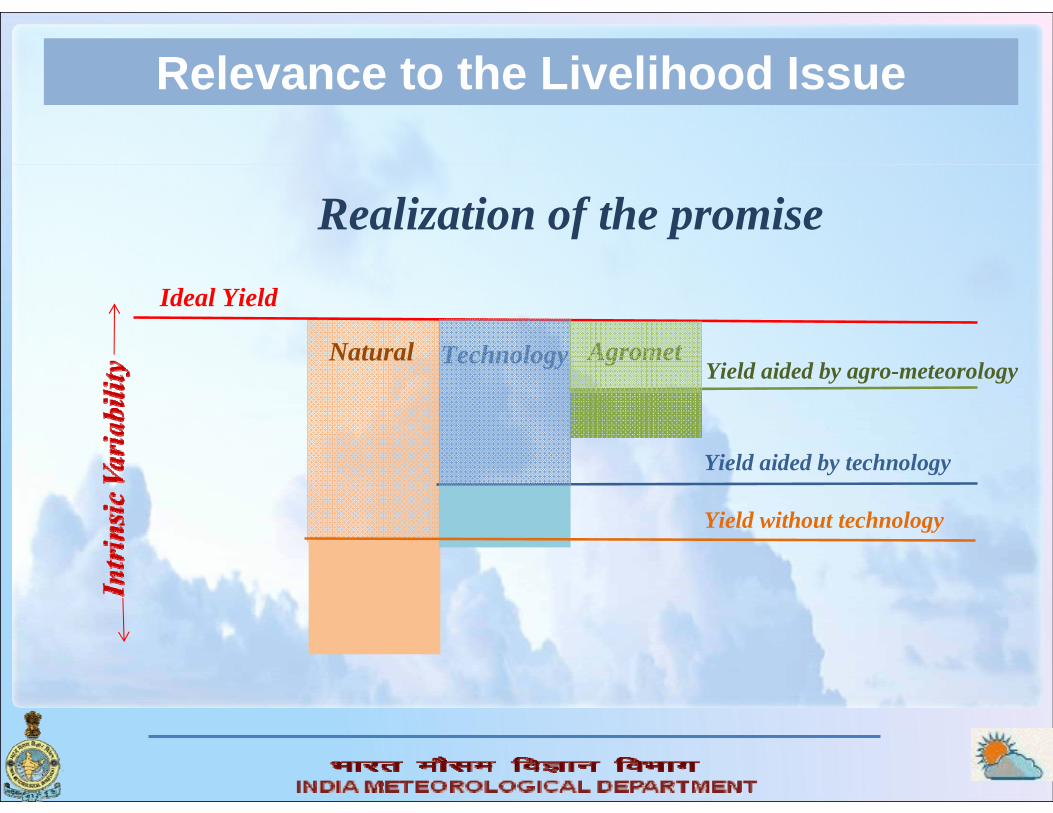
Relevance to the Livelihood Issue
Yield without technology
AgrometTechnology
Ideal Yield
Yield aided by technology
Yield aided by agro-meteorologyNatural
Realization of the promise
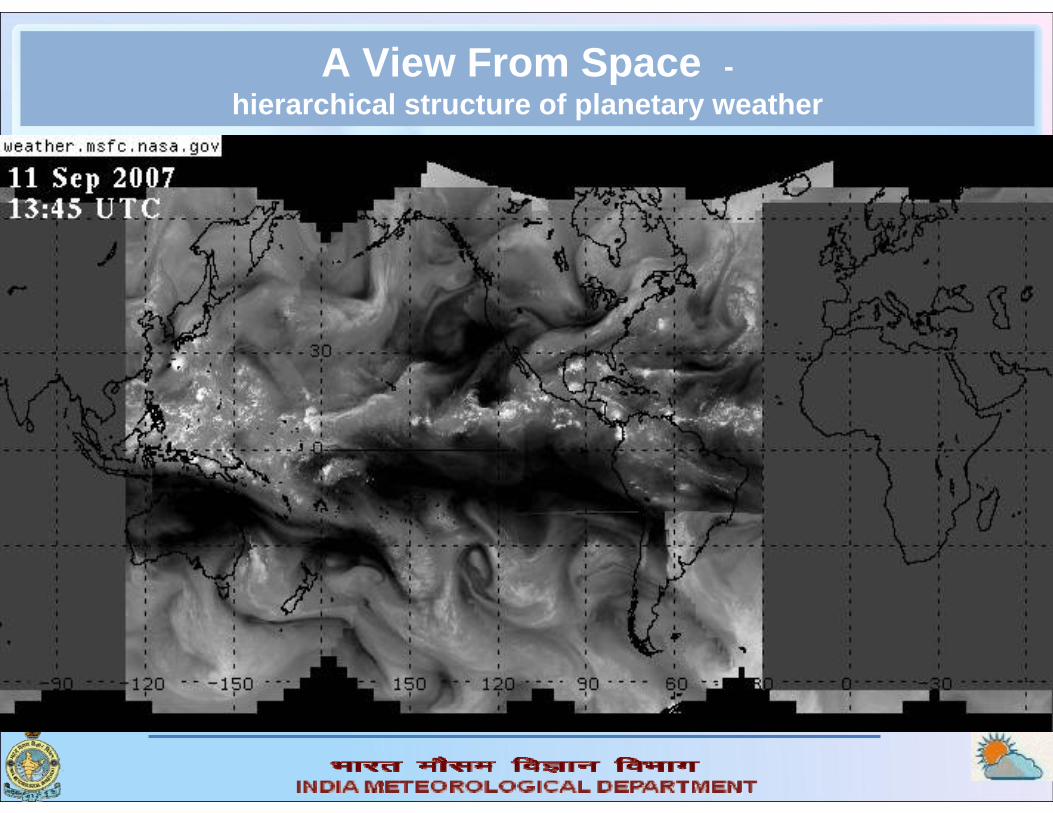
A View From Space -hierarchical structure of planetary weather
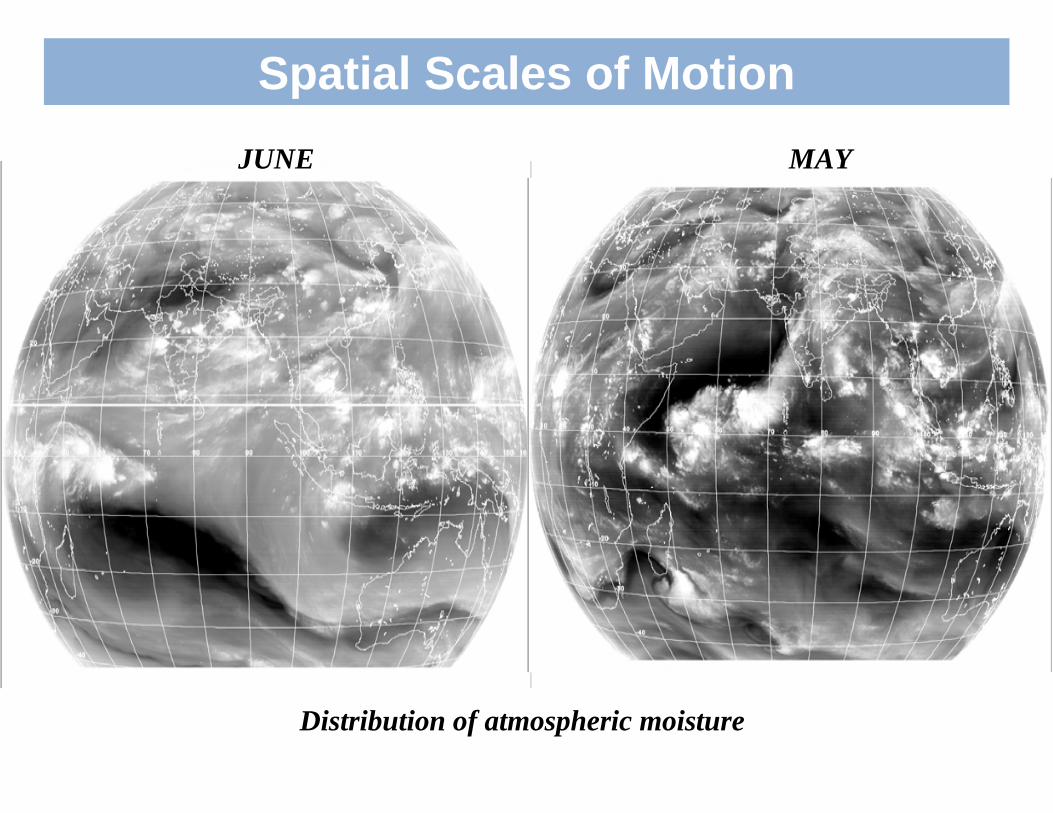
Spatial Scales of Motion
Distribution of atmospheric moisture
JUNE MAY
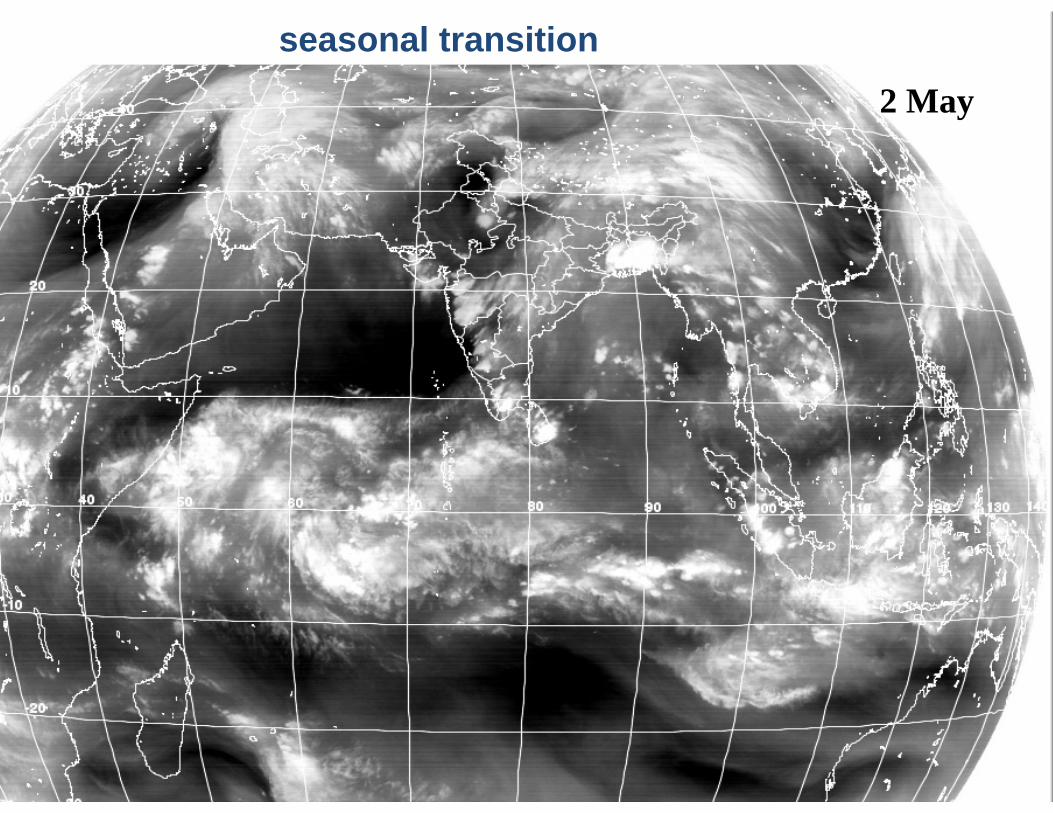
2 May
seasonal transition
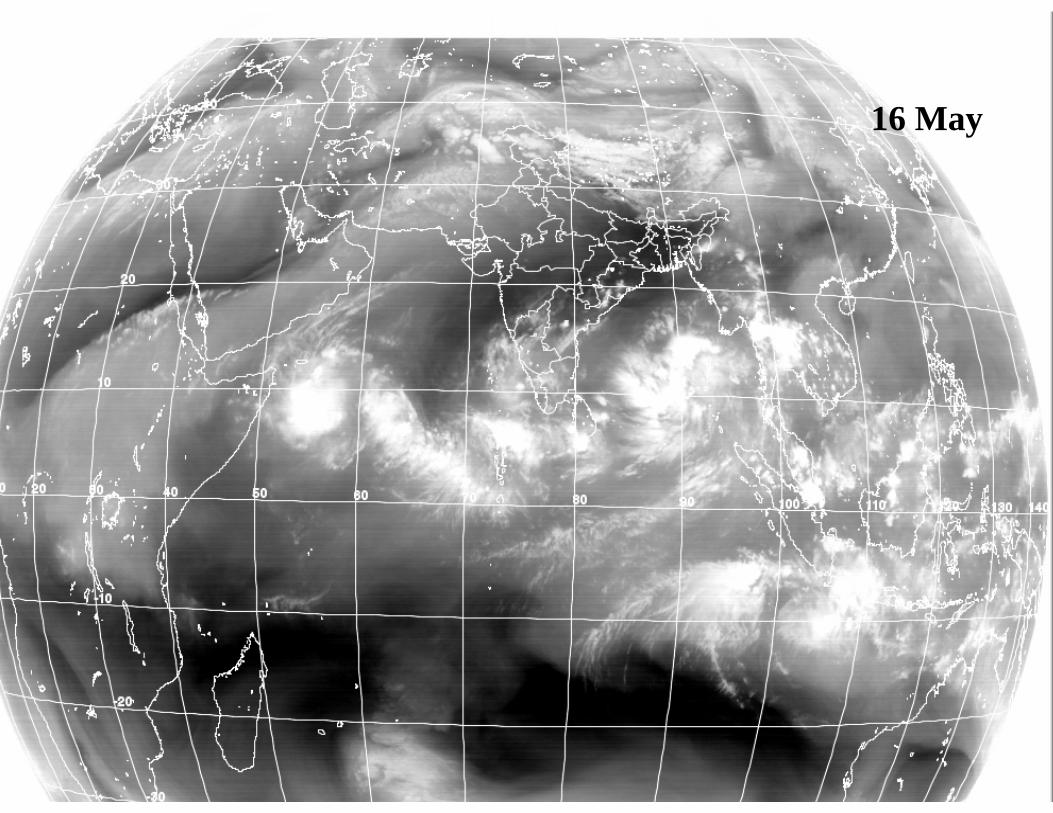
16 May
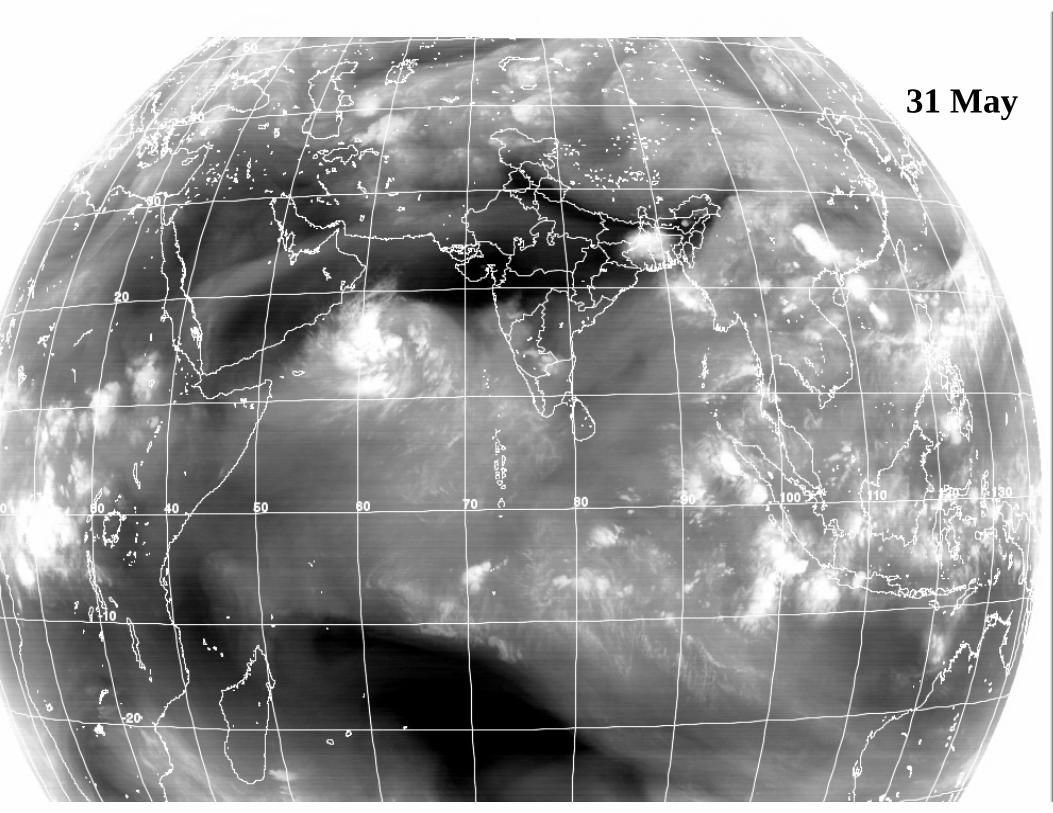
31 May
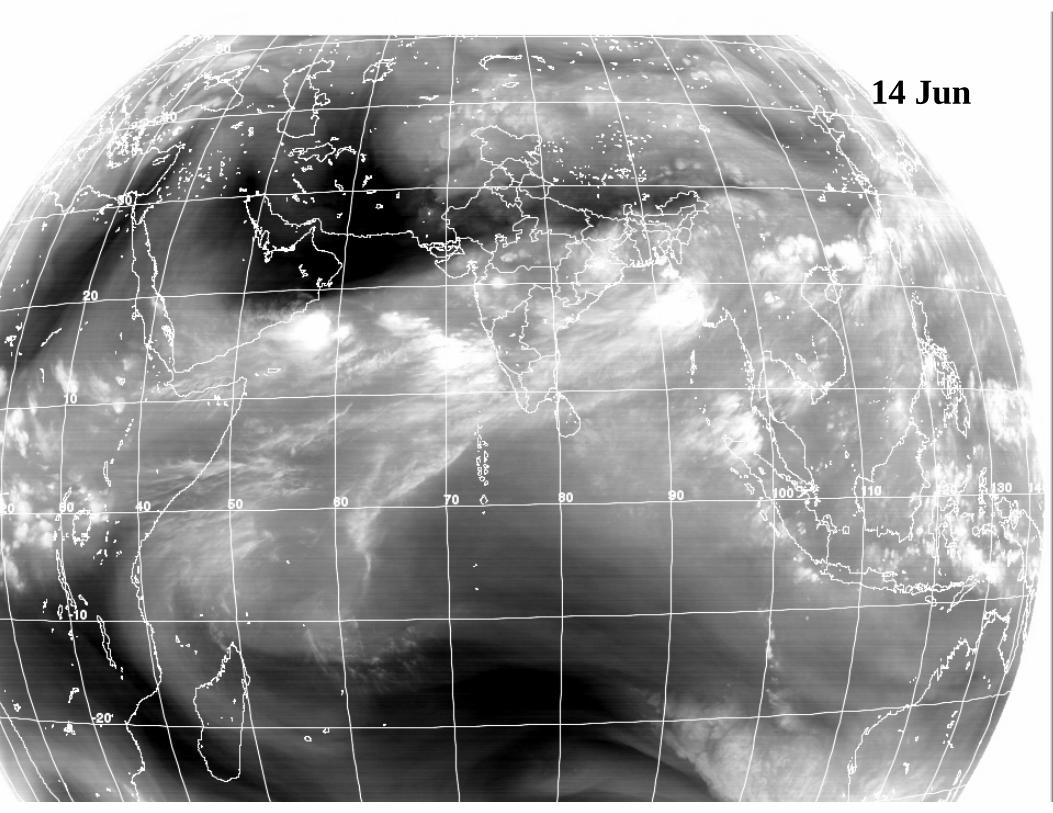
14 Jun
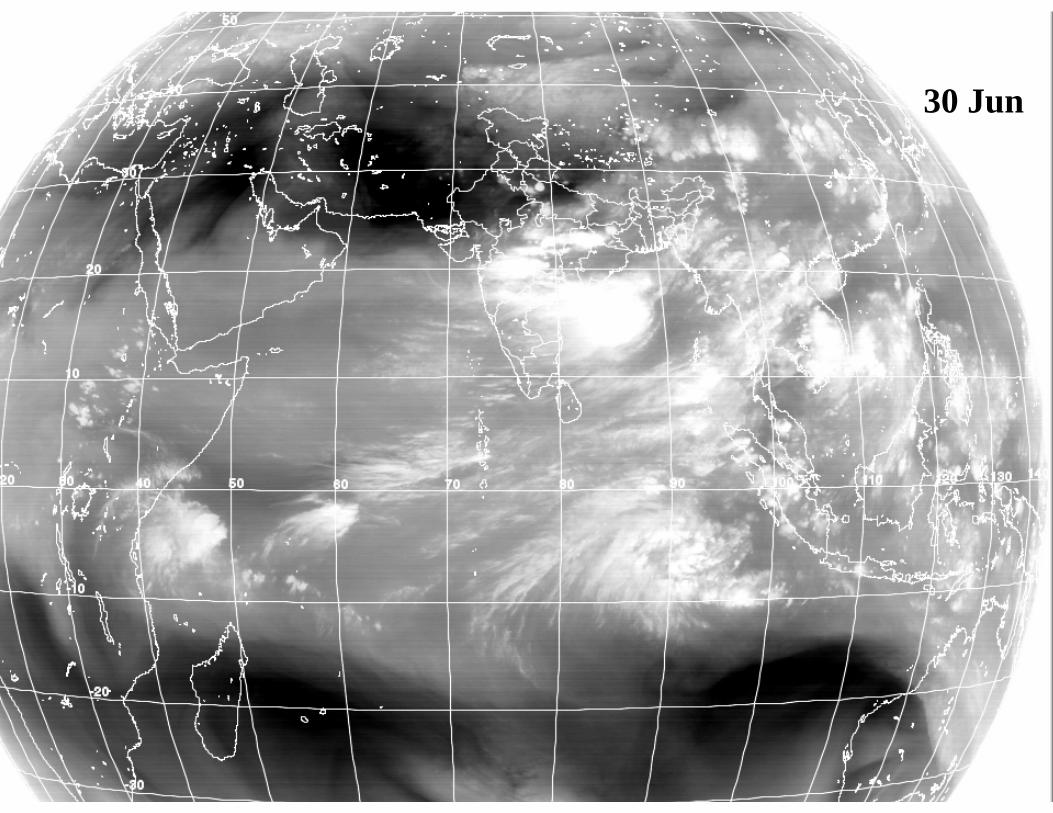
30 Jun
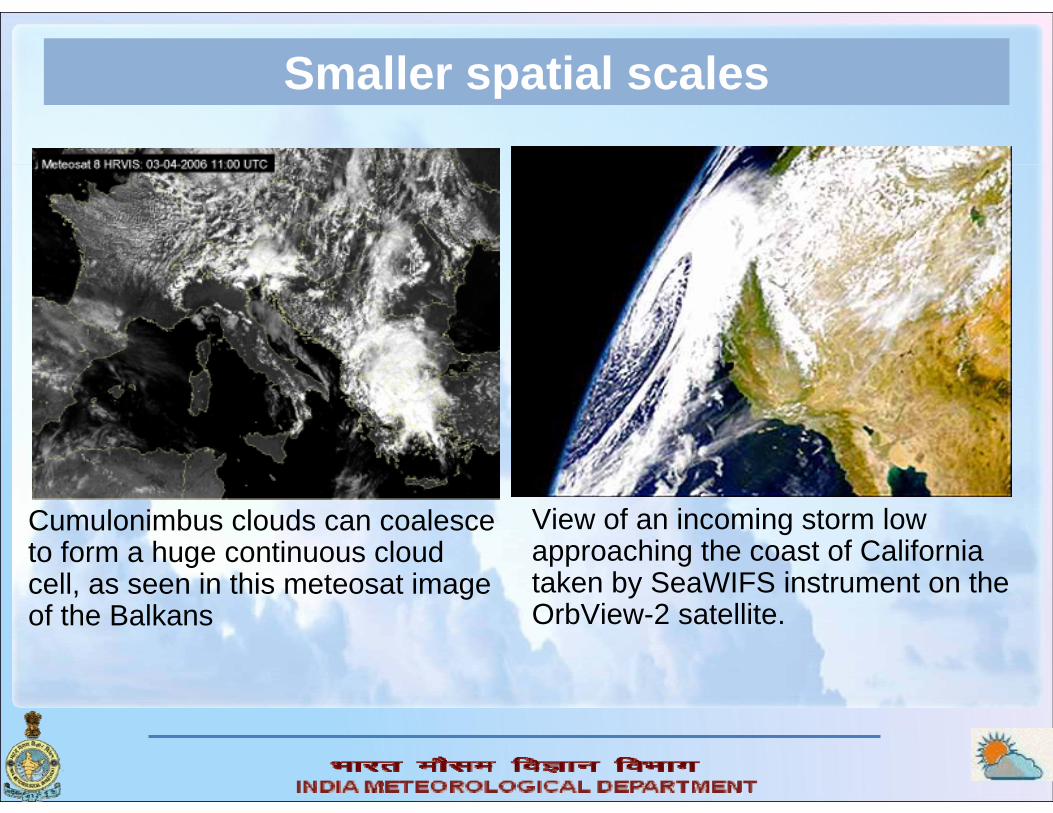
Cumulonimbus clouds can coalesce to form a huge continuous cloud cell, as seen in this meteosat image of the Balkans
View of an incoming storm low approaching the coast of California taken by SeaWIFS instrument on the OrbView-2 satellite.
Smaller spatial scales
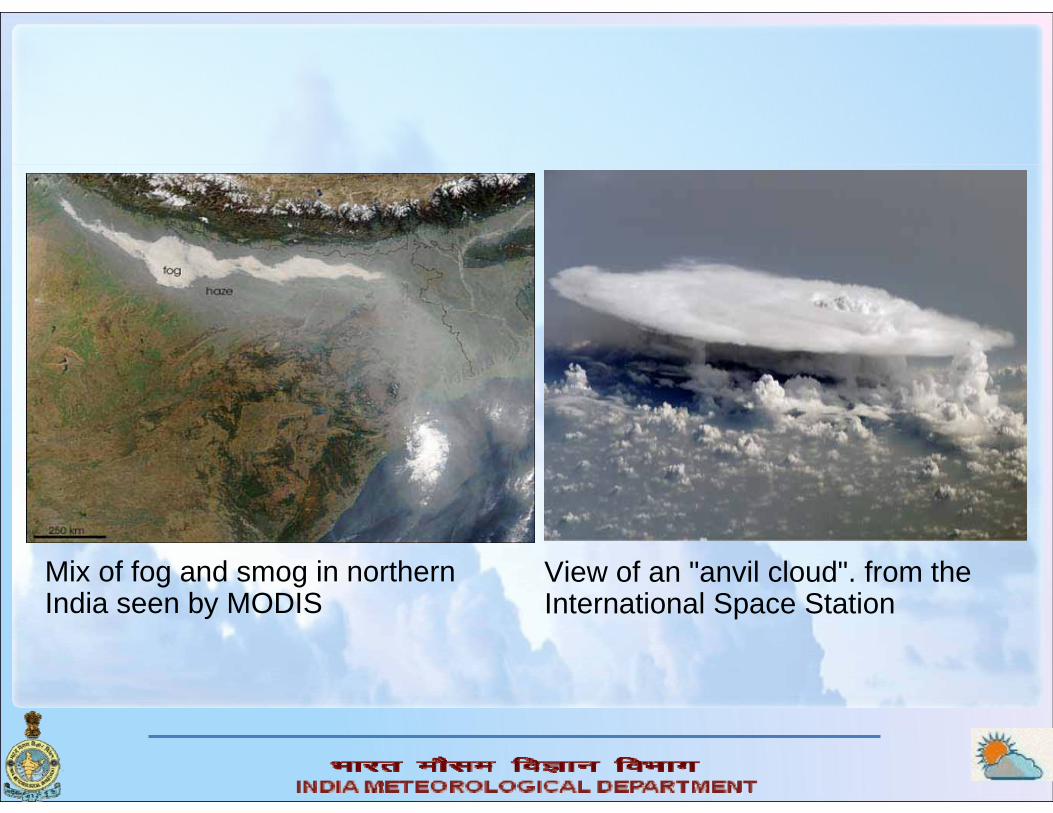
Mix of fog and smog in northern India seen by MODIS
View of an "anvil cloud". from the International Space Station
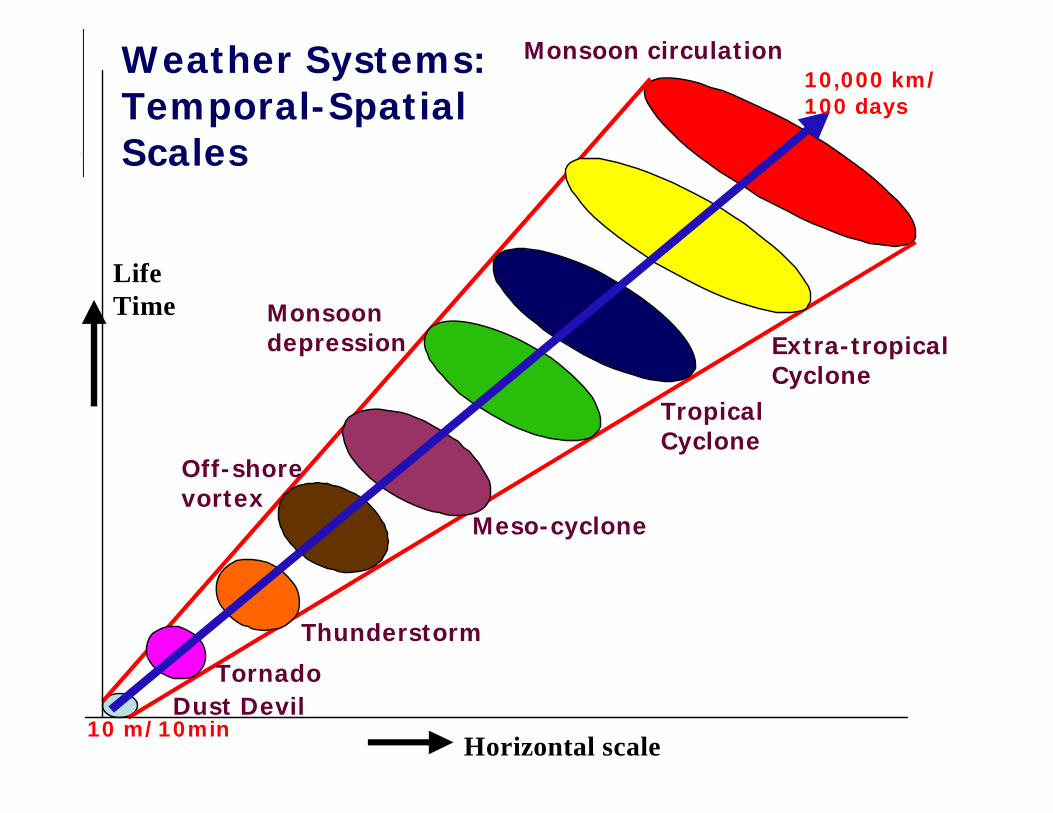
Horizontal scale
LifeTime
Dust DevilTornado
Thunderstorm
Off-shore vortex
Meso-cyclone
Monsoon depression
TropicalCyclone
Extra-tropical Cyclone
Monsoon circulation
10 m/10min
10,000 km/100 days
Weather Systems:Temporal-Spatial Scales
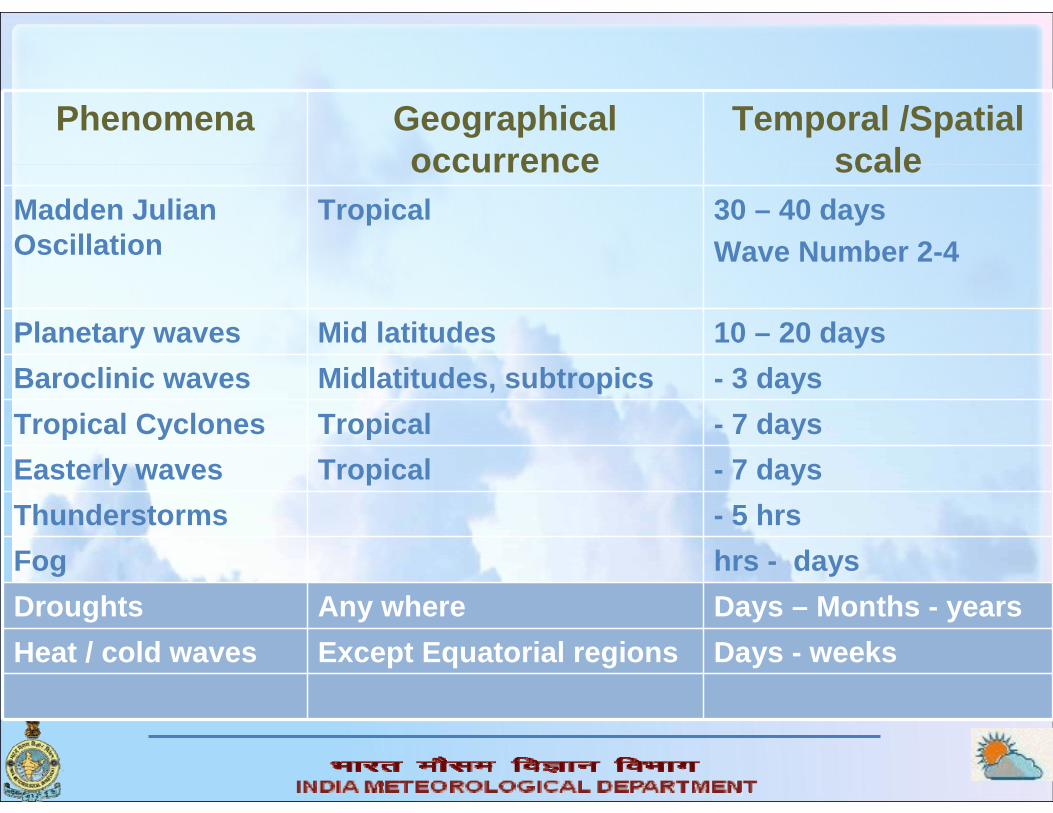
Phenomena Geographical occurrence
Temporal /Spatial scale
Madden Julian Oscillation
Tropical 30 – 40 daysWave Number 2-4
Planetary waves Mid latitudes 10 – 20 daysBaroclinic waves Midlatitudes, subtropics - 3 daysTropical Cyclones Tropical - 7 daysEasterly waves Tropical - 7 daysThunderstorms - 5 hrsFog hrs - daysDroughts Any where Days – Months - yearsHeat / cold waves Except Equatorial regions Days - weeks
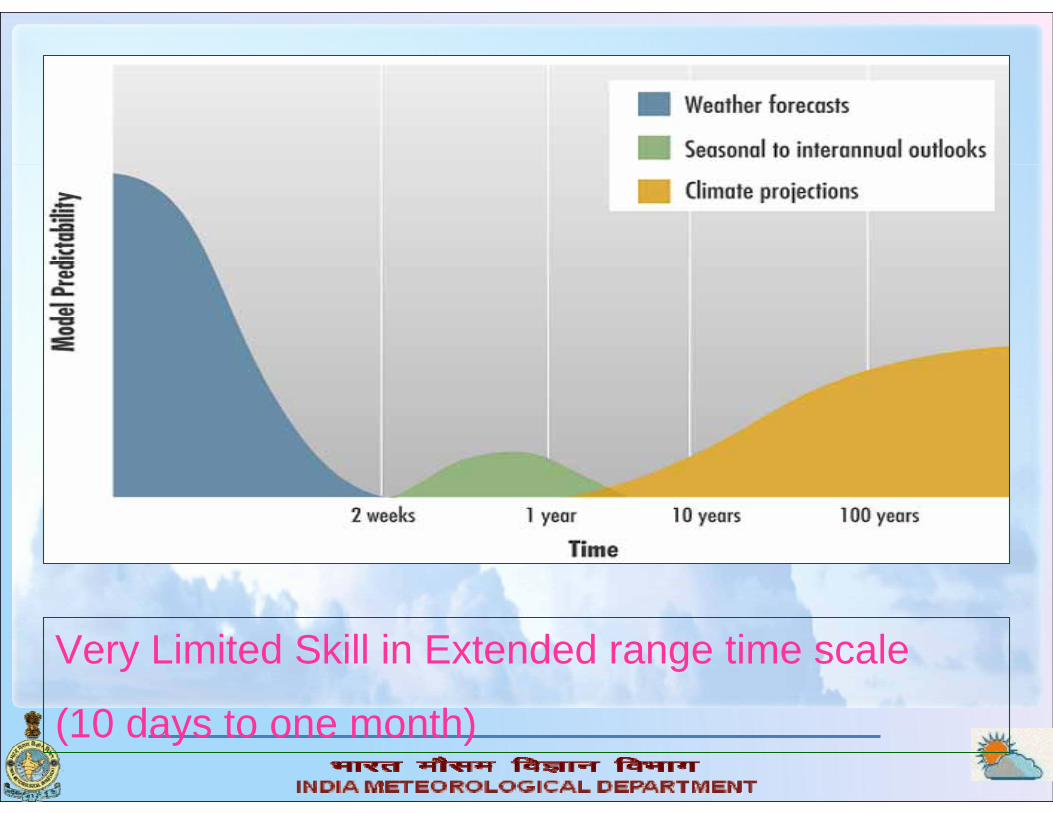
Very Limited Skill in Extended range time scale
(10 days to one month)
Time Series of Solution
-30
-20
-10
0
10
20
30
Time t
Variable X
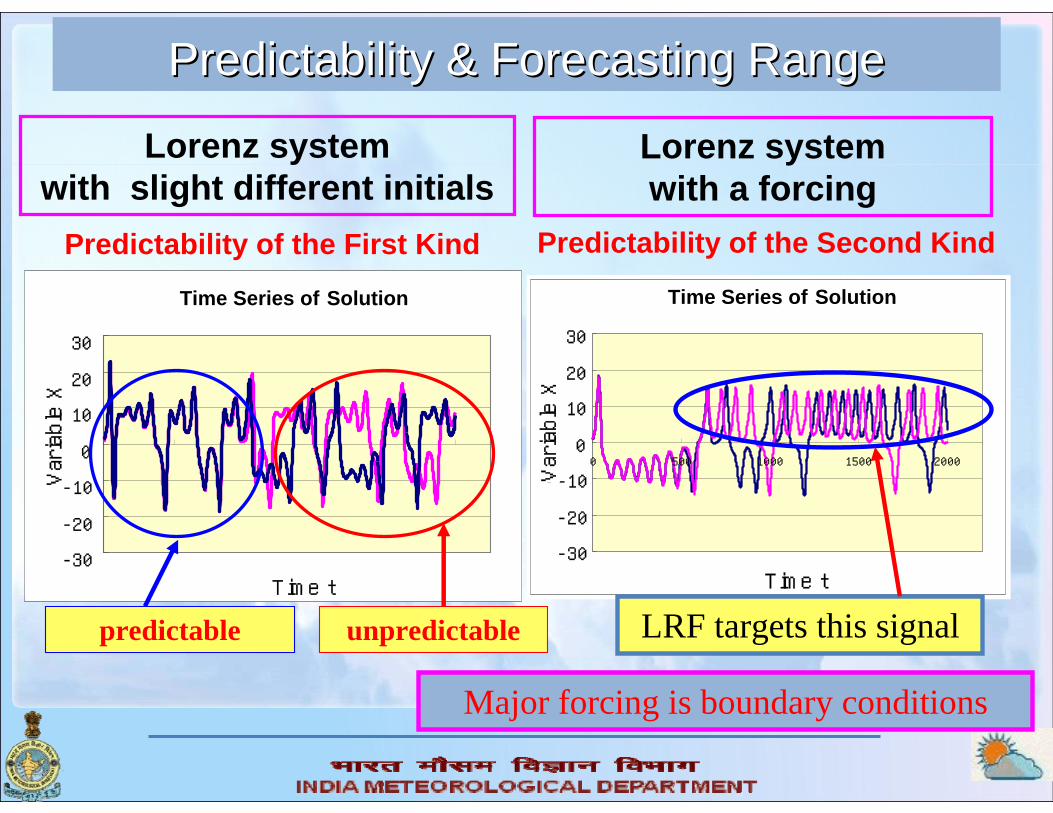
Predictability & Forecasting RangePredictability & Forecasting Range
unpredictablepredictable
Predictability of the First Kind
Lorenz systemwith slight different initials
Tim e Series of Solution X
-30
-20
-10
0
10
20
30
0 500 1000 1500 2000
Tim e t
variable X
Time Series of Solution
-30
-20
-10
0
10
20
30
Time t
Variable X
Predictability of the Second Kind
LRF targets this signal
Lorenz systemwith a forcing
Major forcing is boundary conditions
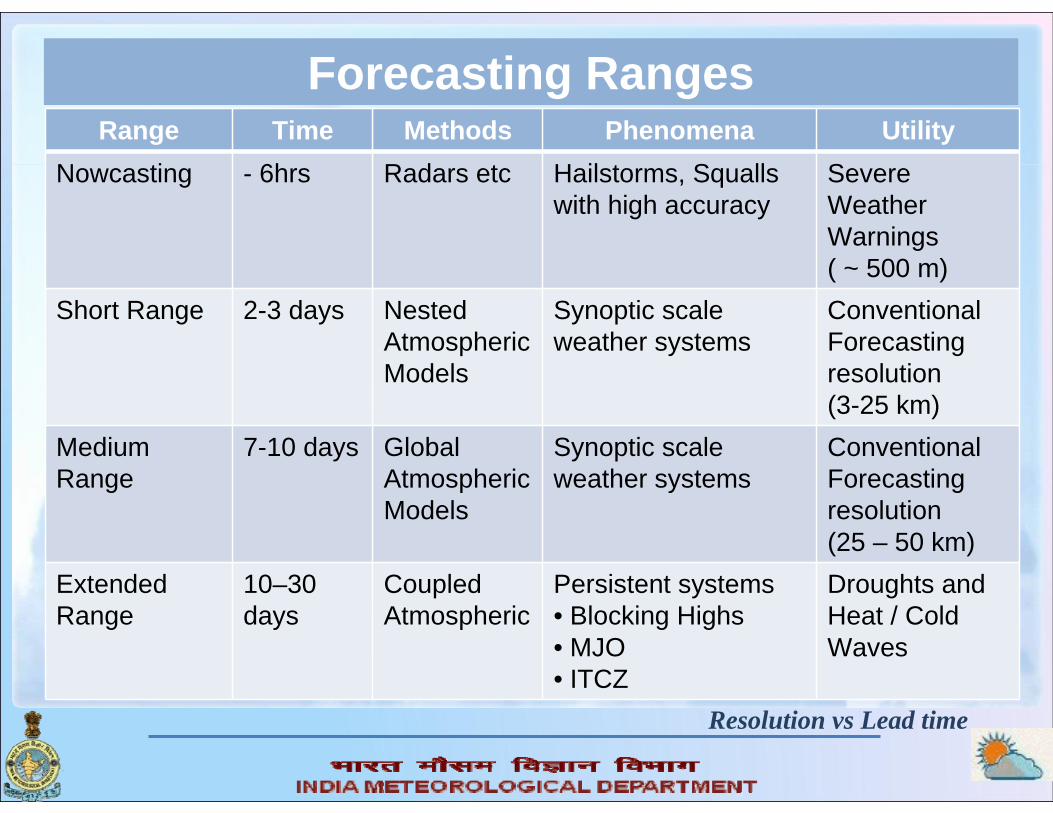
Forecasting RangesRange Time Methods Phenomena Utility
Nowcasting - 6hrs Radars etc Hailstorms, Squalls with high accuracy
Severe Weather Warnings ( ~ 500 m)
Short Range 2-3 days Nested AtmosphericModels
Synoptic scale weather systems
Conventional Forecasting resolution (3-25 km)
Medium Range
7-10 days Global Atmospheric Models
Synoptic scale weather systems
Conventional Forecasting resolution(25 – 50 km)
Extended Range
10–30 days
Coupled Atmospheric
Persistent systems• Blocking Highs• MJO• ITCZ
Droughts and Heat / Cold Waves
Resolution vs Lead time
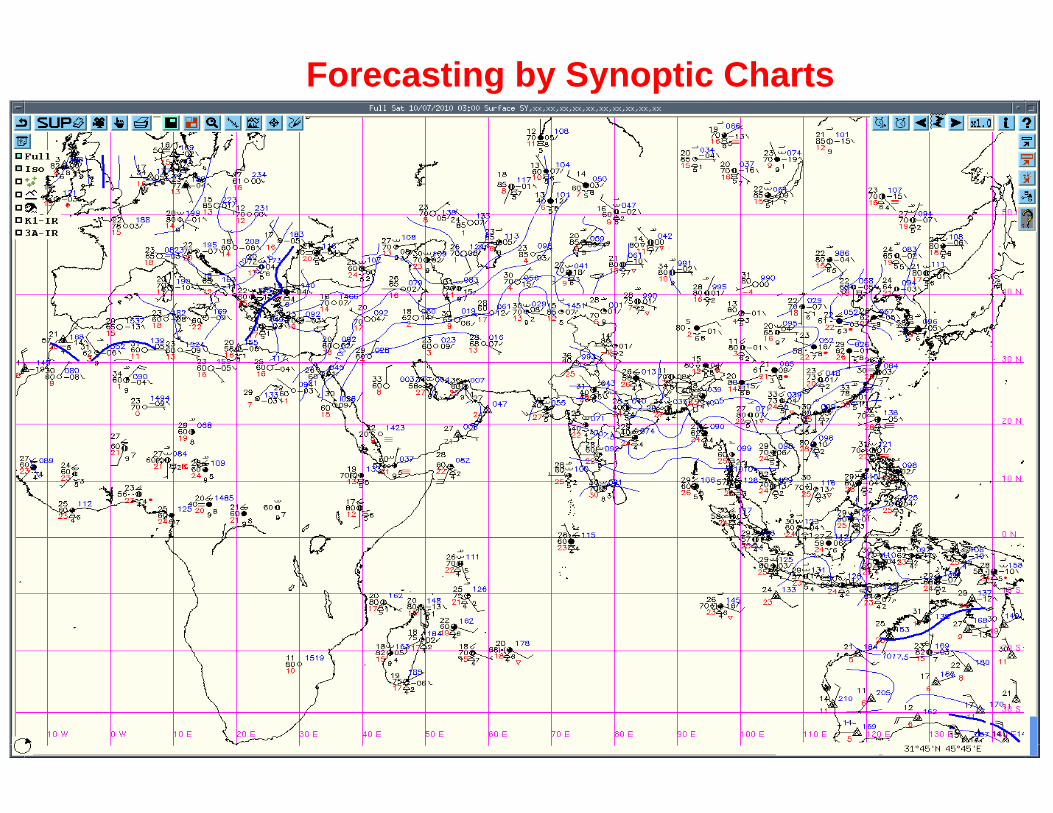
Forecasting by Synoptic Charts
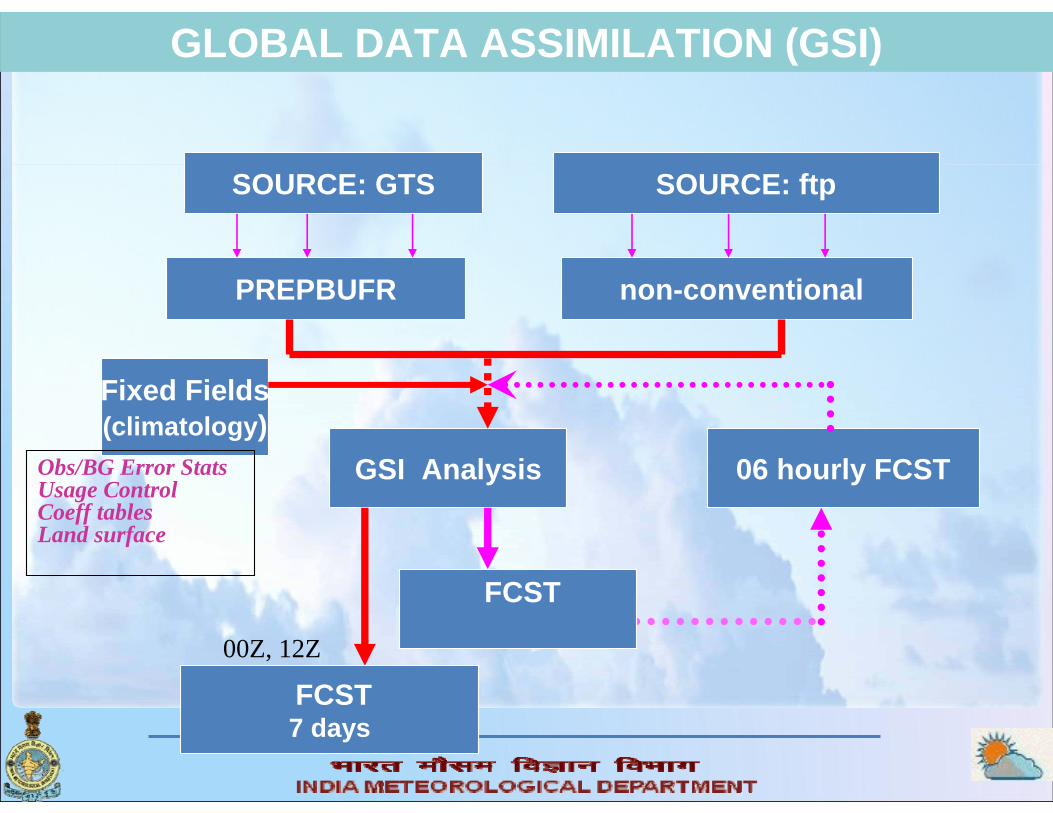
PREPBUFR non-conventional
SOURCE: GTS SOURCE: ftp
GSI Analysis
FCST
06 hourly FCST
FCST7 days
Fixed Fields(climatology)
GLOBAL DATA ASSIMILATION (GSI)
00Z, 12Z
Obs/BG Error StatsUsage Control Coeff tablesLand surface
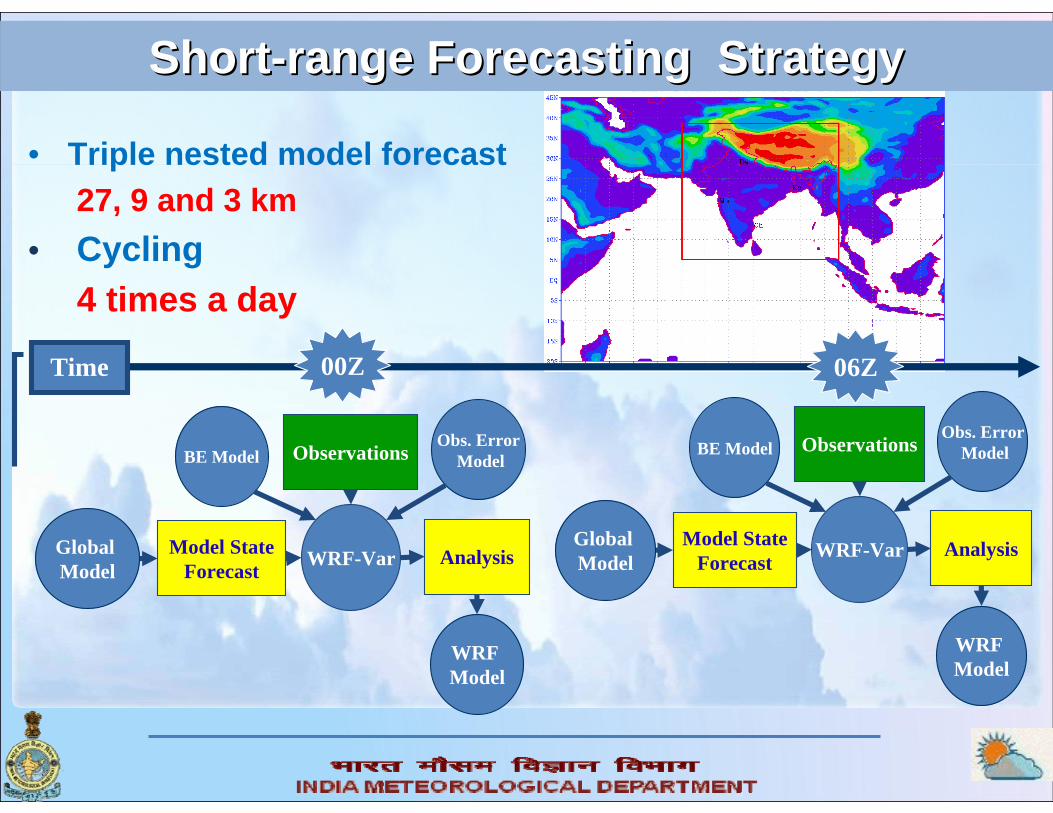
ShortShort--range Forecasting Strategy range Forecasting Strategy
• Triple nested model forecast27, 9 and 3 km
• Cycling4 times a day
Analysis
00Z 06ZTime
Model StateForecast
Global Model WRF-Var
ObservationsBE ModelObs. Error
Model
WRF Model
Model StateForecast
Global Model WRF-Var
ObservationsBE ModelObs. Error
Model
WRF Model
Analysis
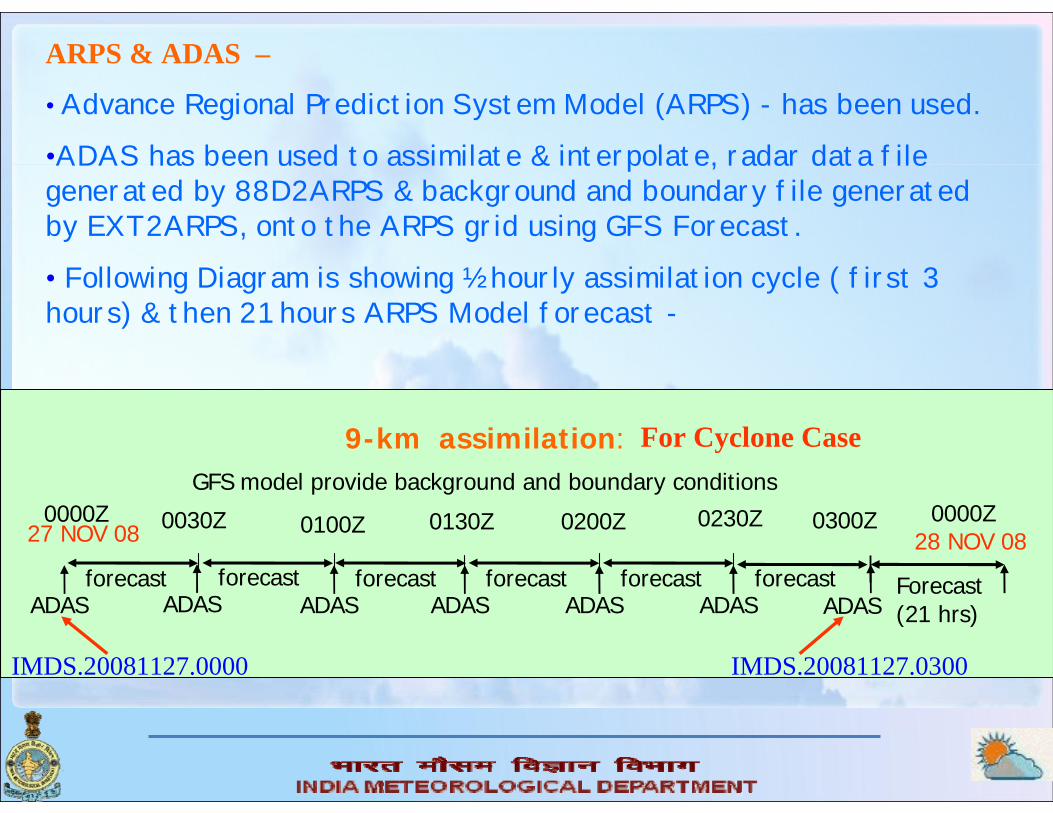
ARPS & ADAS –
• Advance Regional Prediction System Model (ARPS) - has been used.•ADAS has been used to assimilate & interpolate, radar data file generated by 88D2ARPS & background and boundary file generated by EXT2ARPS, onto the ARPS grid using GFS Forecast.
• Following Diagram is showing ½ hourly assimilation cycle ( first 3 hours) & then 21 hours ARPS Model forecast -
9-km assimilation:GFS model provide background and boundary conditions
ADAS
0000Z 27 NOV 08 0100Z 0200Z 0300Z 0130Z
forecast
0030Z 0230Z
ADASforecast
ADASforecast
ADASforecast
ADASforecast
ADASforecast
ADASForecast (21 hrs)
0000Z28 NOV 08
IMDS.20081127.0000 IMDS.20081127.0300
For Cyclone Case
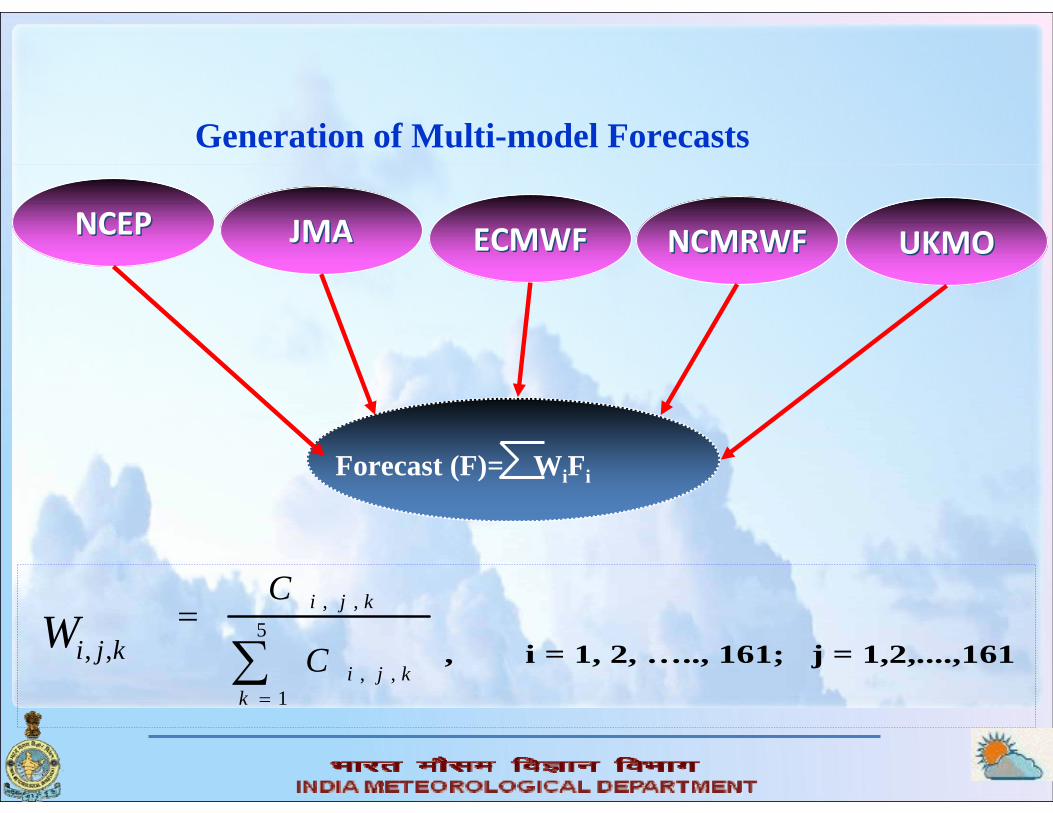
Generation of Multi-model Forecasts
Forecast (F)= WiFi
NCEPNCEP JMAJMA ECMWFECMWF NCMRWFNCMRWF UKMOUKMO
kjiW ,, ∑=
= 5
1,,
,,
kkji
kji
C
C
, i = 1, 2, ….., 161; j = 1,2,....,161
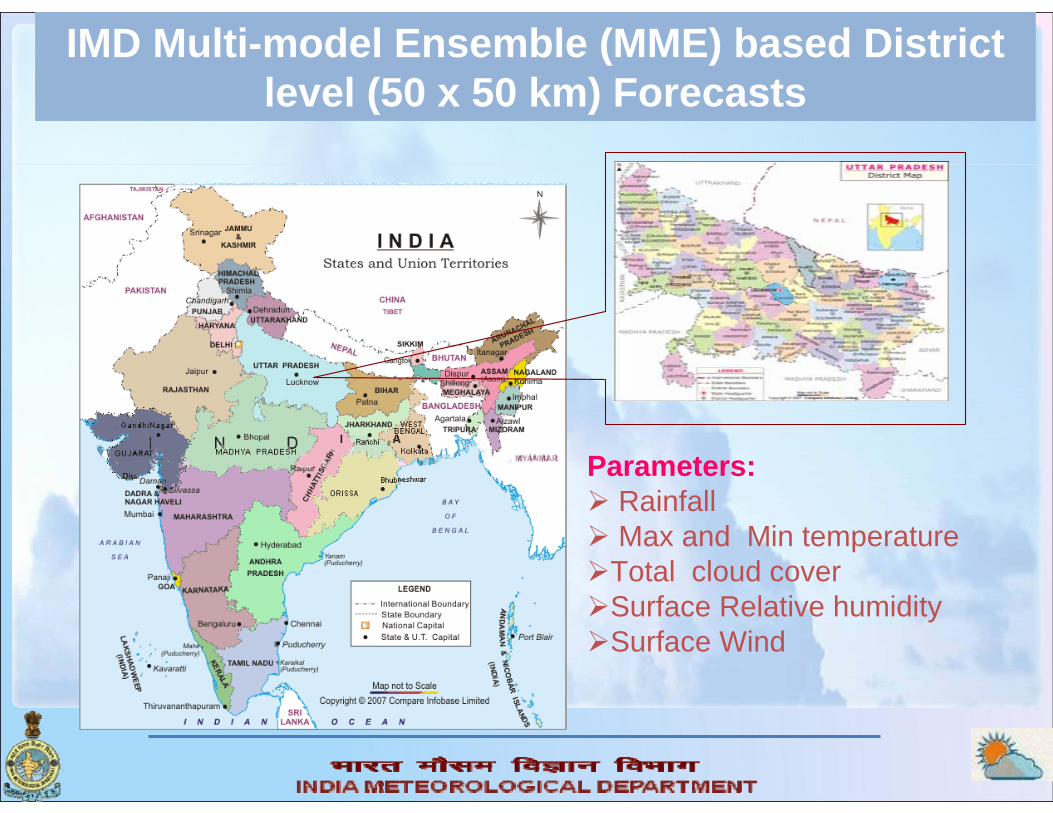
Parameters:RainfallMax and Min temperature
Total cloud cover Surface Relative humidity Surface Wind
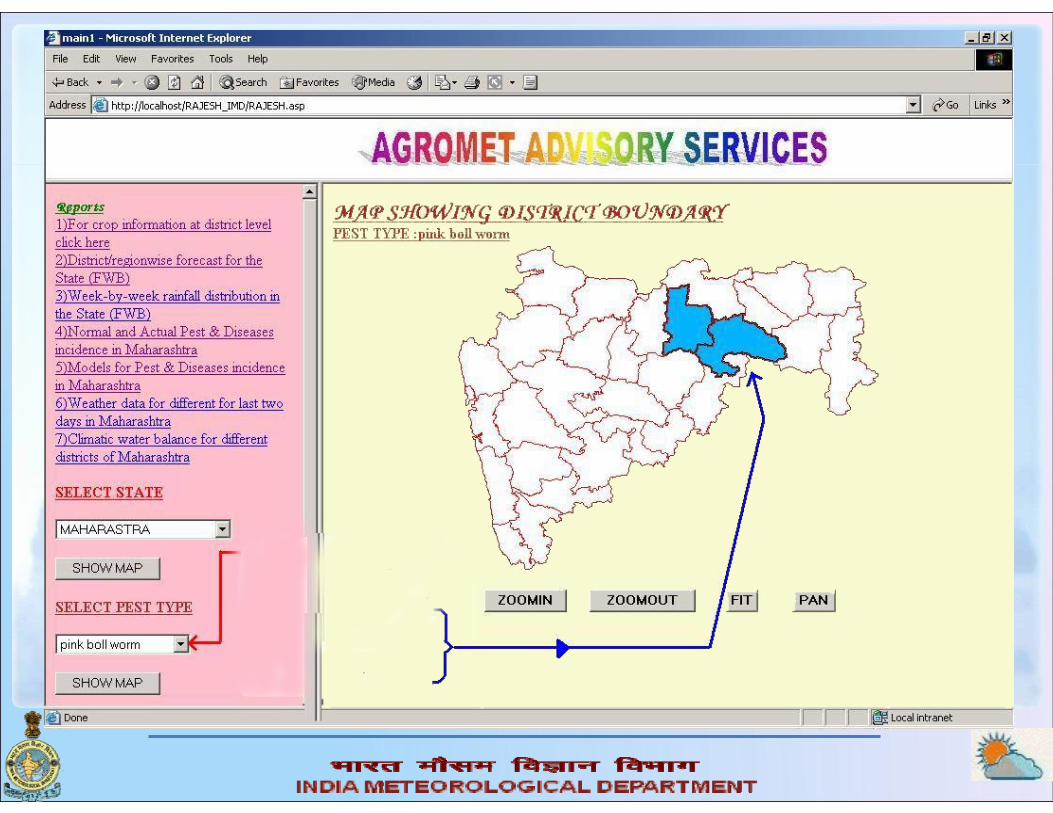
IMD Multi-model Ensemble (MME) based District level (50 x 50 km) Forecasts
Model Performance
Spatial Distribution RainfallRoot Mean Square ErrorsMean Errors
Categorical Skill scores PODTSBS
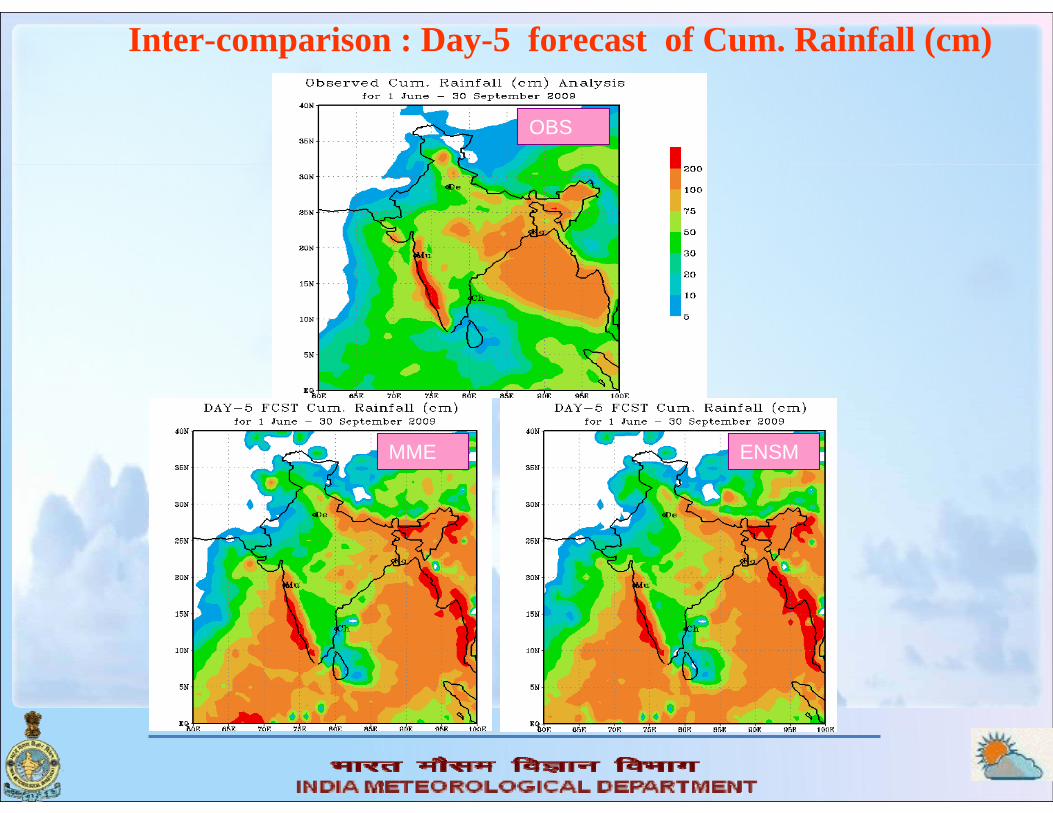
Inter-comparison : Day-5 forecast of Cum. Rainfall (cm)
OBS
MME ENSM
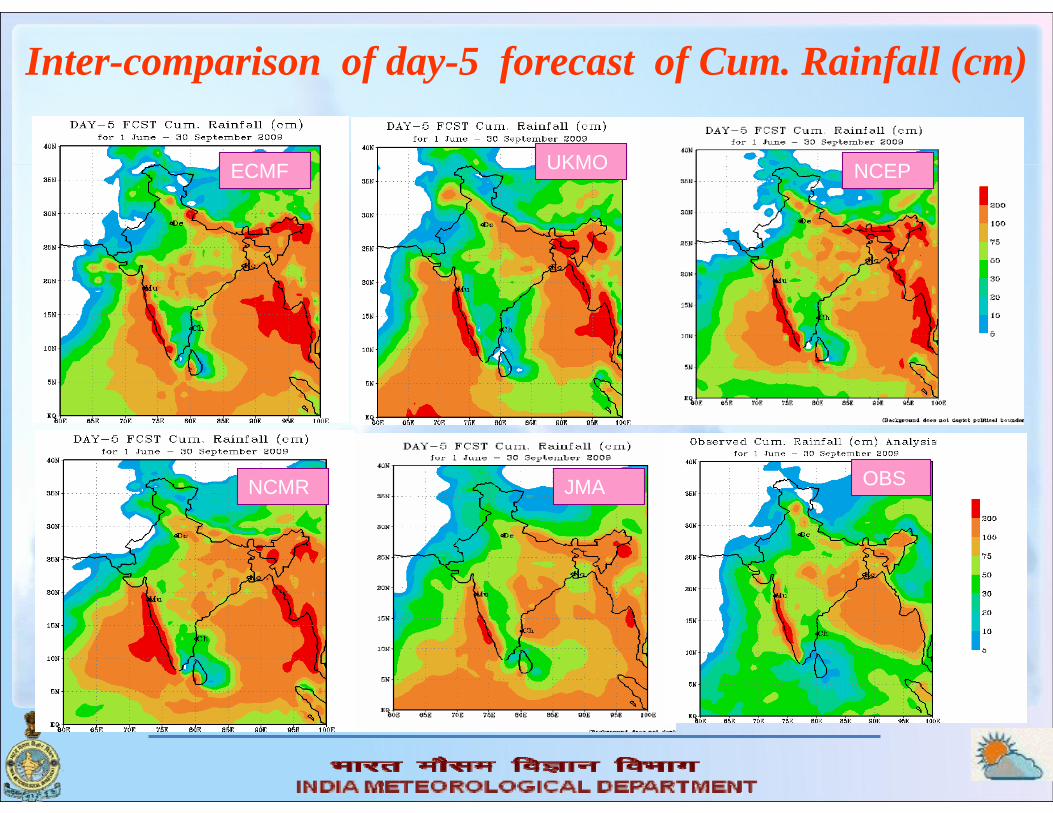
Inter-comparison of day-5 forecast of Cum. Rainfall (cm)
ECMF UKMO
JMANCMR
NCEP
OBS
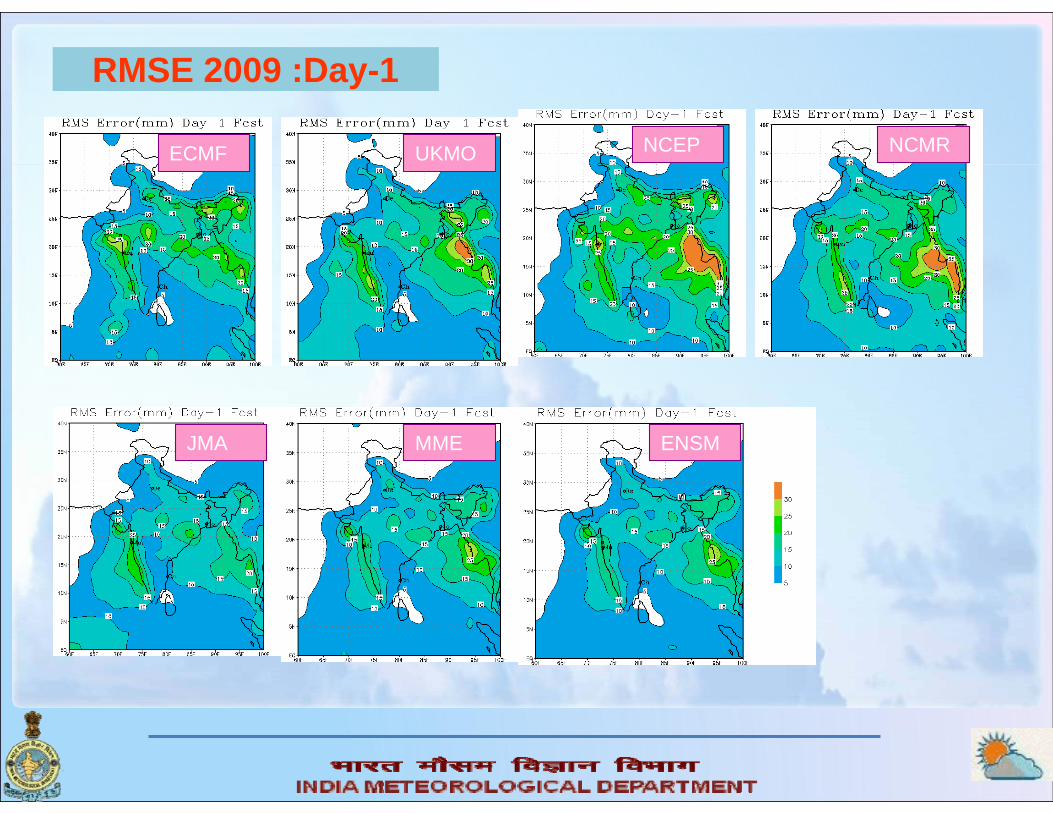
RMSE 2009 :Day-1
ECMF NCMRNCEPUKMO
JMA MME ENSM
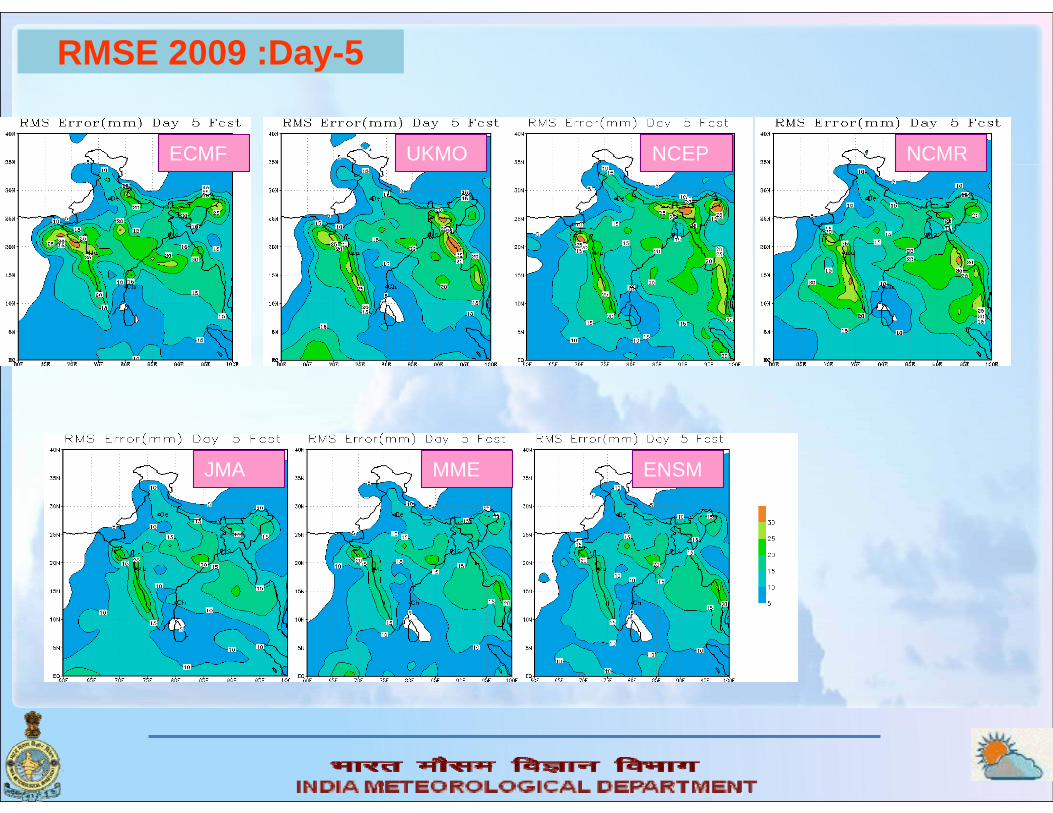
RMSE 2009 :Day-5
ECMF NCMRUKMO NCEP
JMA MME ENSM
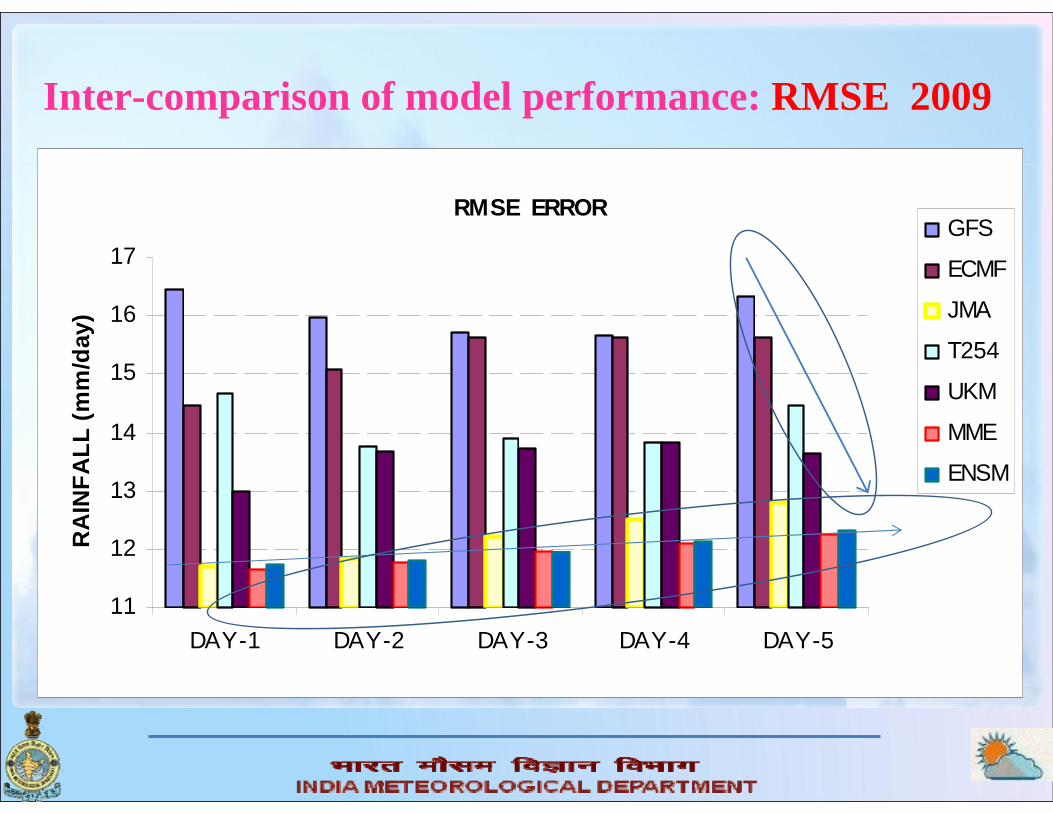
RMSE ERROR
11
12
13
14
15
16
17
DAY-1 DAY-2 DAY-3 DAY-4 DAY-5
RA
INFA
LL (m
m/d
ay)
GFS
ECMF
JMA
T254
UKM
MME
ENSM
Inter-comparison of model performance: RMSE 2009
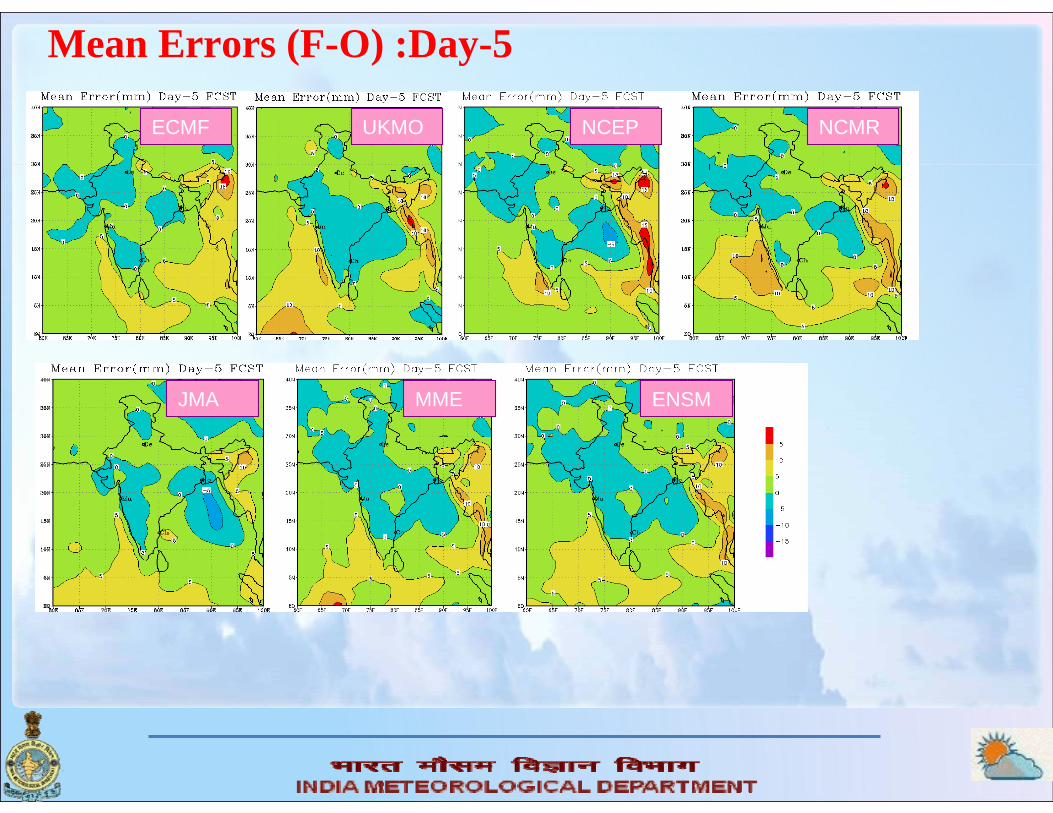
Mean Errors (F-O) :Day-5
ECMF NCMRNCEPUKMO
JMA MME ENSM
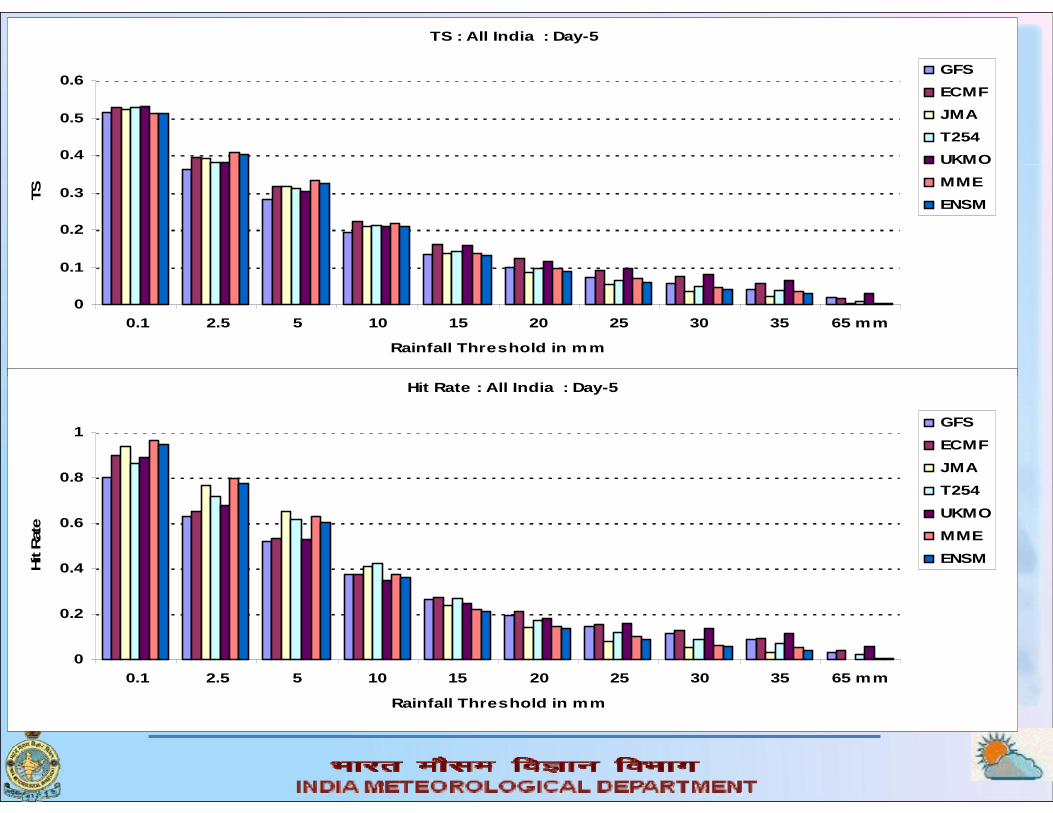
TS : All India : Day-5
0
0.1
0.2
0.3
0.4
0.5
0.6
0.1 2.5 5 10 15 20 25 30 35 65 mm
Rainfall Threshold in mm
TS
GFSECMFJMAT254UKMOMMEENSM
Hit Rate : All India : Day-5
0
0.2
0.4
0.6
0.8
1
0.1 2.5 5 10 15 20 25 30 35 65 mm
Rainfall Threshold in mm
Hit
Rat
e
GFS
ECMFJMAT254
UKMOMMEENSM
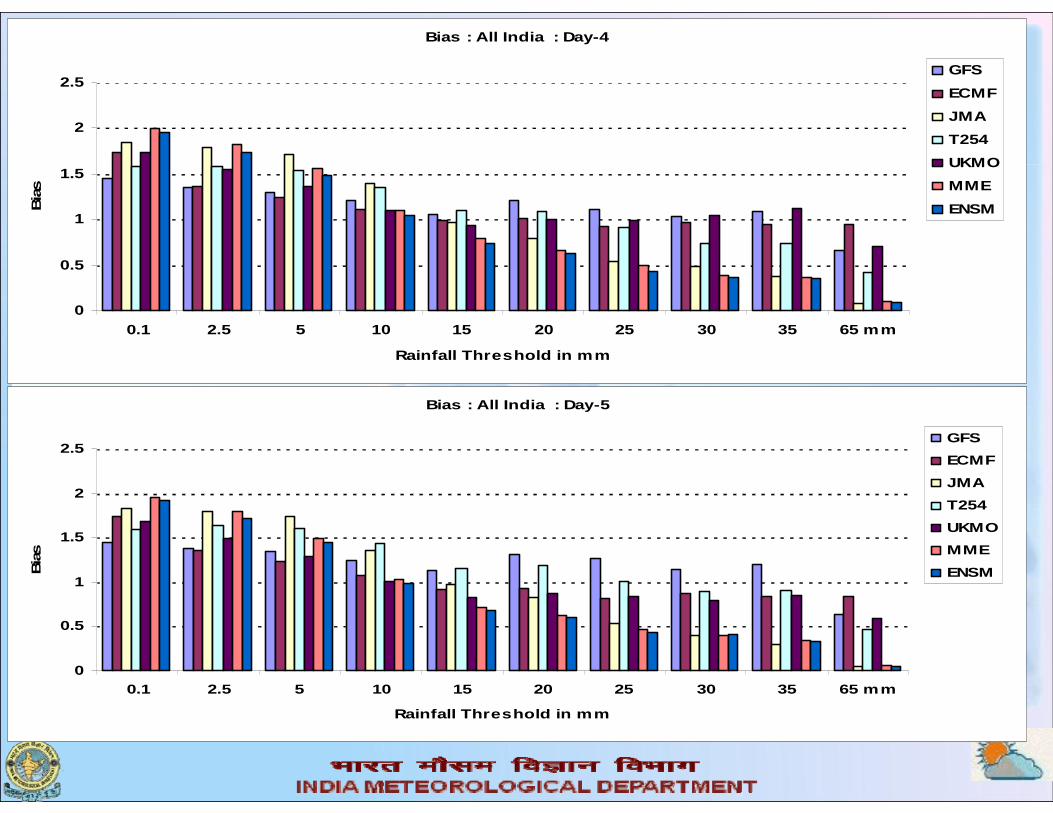
Bias : All India : Day-5
0
0.5
1
1.5
2
2.5
0.1 2.5 5 10 15 20 25 30 35 65 mm
Rainfall Threshold in mm
Bia
s
GFSECMF
JMAT254
UKMOMME
ENSM
Bias : All India : Day-4
0
0.5
1
1.5
2
2.5
0.1 2.5 5 10 15 20 25 30 35 65 mm
Rainfall Threshold in mm
Bia
s
GFS
ECMFJMAT254UKMOMME
ENSM
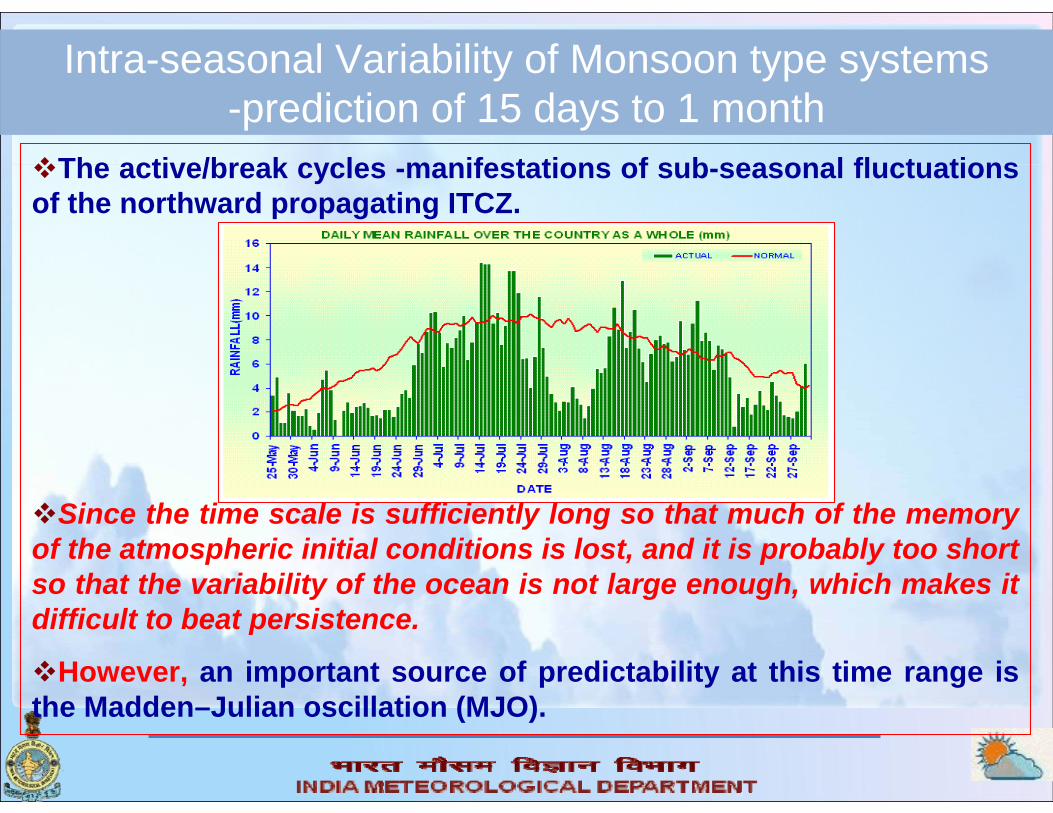
Intra-seasonal Variability of Monsoon type systems-prediction of 15 days to 1 month
The active/break cycles -manifestations of sub-seasonal fluctuations of the northward propagating ITCZ.
Since the time scale is sufficiently long so that much of the memory of the atmospheric initial conditions is lost, and it is probably too short so that the variability of the ocean is not large enough, which makes it difficult to beat persistence.
However, an important source of predictability at this time range is the Madden–Julian oscillation (MJO).

• Intraseasonal Time Scale: ~40-60 days• Planetary-Scale: Zonal Wavenumbers 1-3• Baroclinic Wind Structure• Eastward Propagation
E. Hem: ~5 m/s, Surf.+Conv.+Circ. InteractionsW. Hem: ~ > 10 m/s, ~Free Tropospheric Wave
• Tendency to be Equatorially Trapped• Strong Seasonal Dependence:
NH Winter: Eastward Propagation NH Summer: ~Northeast Propagation
• Significant Interannual Variability• Potential Role of Ocean/SST Feedback• Convection Has Multi-Scale Structure• Significant Remote and Extra-Tropical Impacts
U200
U850
CloudyLow OLR
ClearHigh OLR
Rainfall
Typical Variables Used for MJO Analysis
MaddenMadden--Julian Oscillation (MJO)Julian Oscillation (MJO)
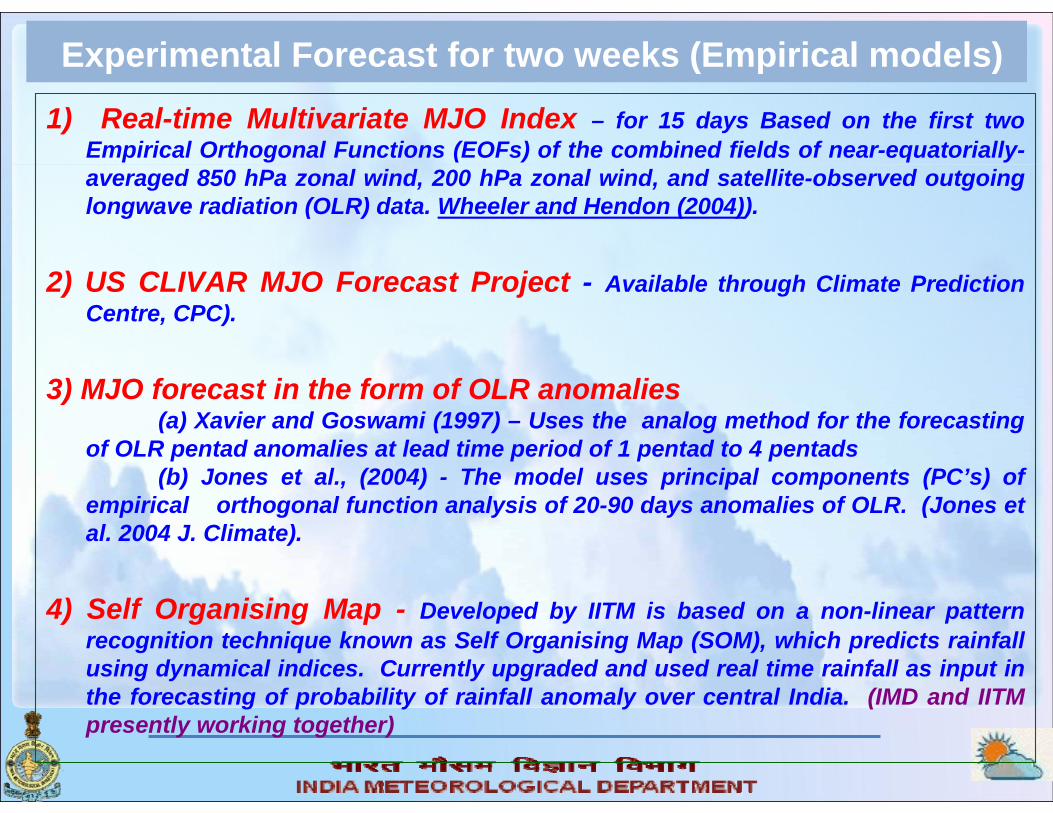
Experimental Forecast for two weeks (Empirical models)
1) Real-time Multivariate MJO Index – for 15 days Based on the first two Empirical Orthogonal Functions (EOFs) of the combined fields of near-equatorially-averaged 850 hPa zonal wind, 200 hPa zonal wind, and satellite-observed outgoing longwave radiation (OLR) data. Wheeler and Hendon (2004)).
2) US CLIVAR MJO Forecast Project - Available through Climate Prediction Centre, CPC).
3) MJO forecast in the form of OLR anomalies (a) Xavier and Goswami (1997) – Uses the analog method for the forecasting
of OLR pentad anomalies at lead time period of 1 pentad to 4 pentads(b) Jones et al., (2004) - The model uses principal components (PC’s) of
empirical orthogonal function analysis of 20-90 days anomalies of OLR. (Jones et al. 2004 J. Climate).
4) Self Organising Map - Developed by IITM is based on a non-linear pattern recognition technique known as Self Organising Map (SOM), which predicts rainfall using dynamical indices. Currently upgraded and used real time rainfall as input in the forecasting of probability of rainfall anomaly over central India. (IMD and IITM presently working together)
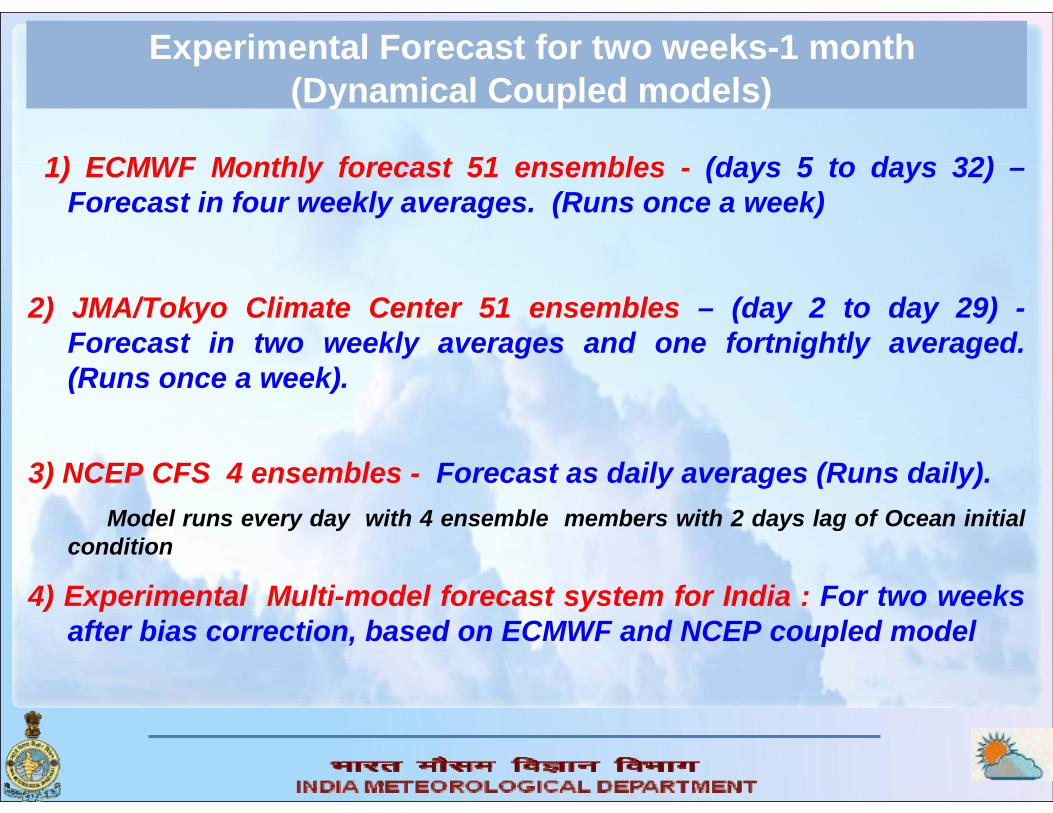
1) ECMWF Monthly forecast 51 ensembles - (days 5 to days 32) –Forecast in four weekly averages. (Runs once a week)
2) JMA/Tokyo Climate Center 51 ensembles – (day 2 to day 29) -Forecast in two weekly averages and one fortnightly averaged. (Runs once a week).
3) NCEP CFS 4 ensembles - Forecast as daily averages (Runs daily). Model runs every day with 4 ensemble members with 2 days lag of Ocean initial
condition
4) Experimental Multi-model forecast system for India : For two weeks after bias correction, based on ECMWF and NCEP coupled model
Experimental Forecast for two weeks-1 month(Dynamical Coupled models)
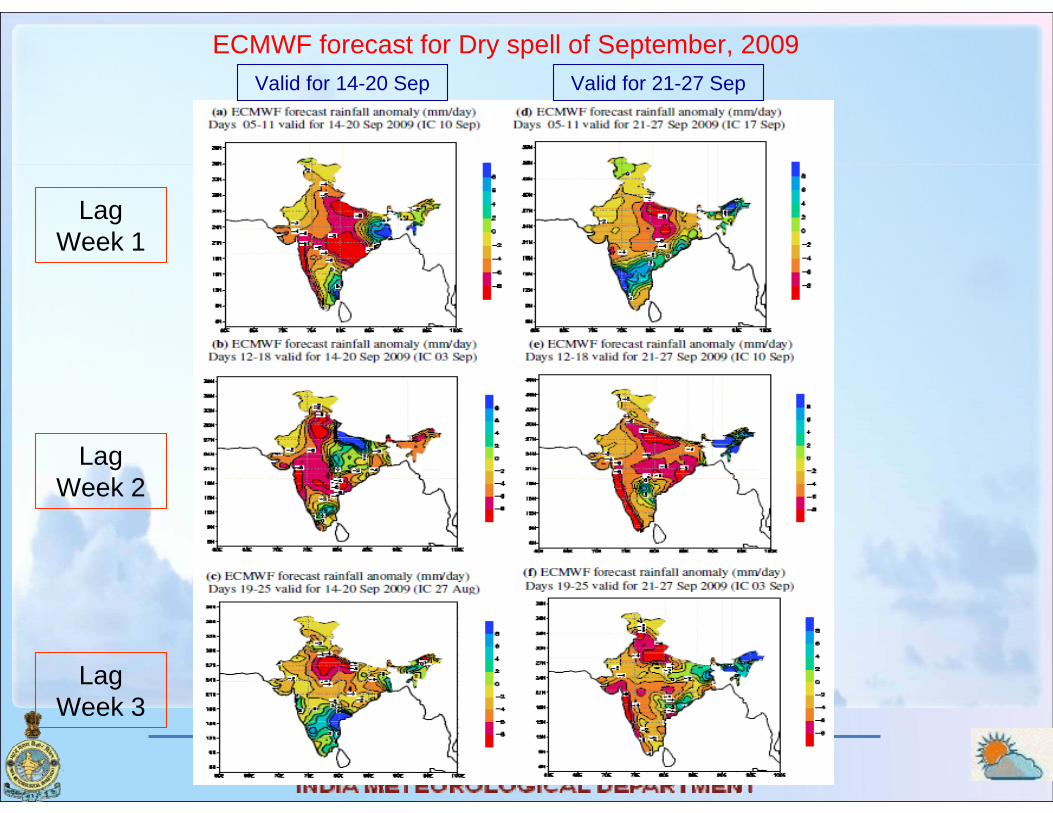
ECMWF forecast for Dry spell of September, 2009Valid for 14-20 Sep Valid for 21-27 Sep
Lag Week 1
Lag Week 2
Lag Week 3
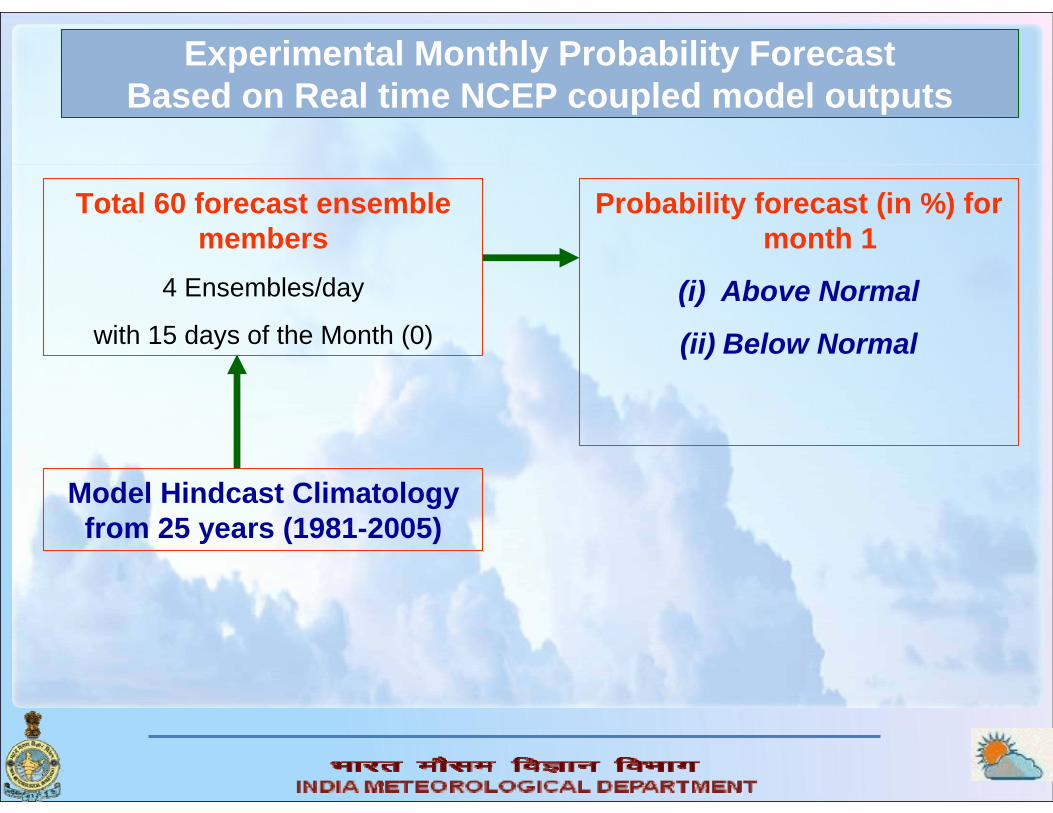
Experimental Monthly Probability ForecastBased on Real time NCEP coupled model outputs
Total 60 forecast ensemble members
4 Ensembles/day
with 15 days of the Month (0)
Model Hindcast Climatology from 25 years (1981-2005)
Probability forecast (in %) for month 1
(i) Above Normal
(ii) Below Normal
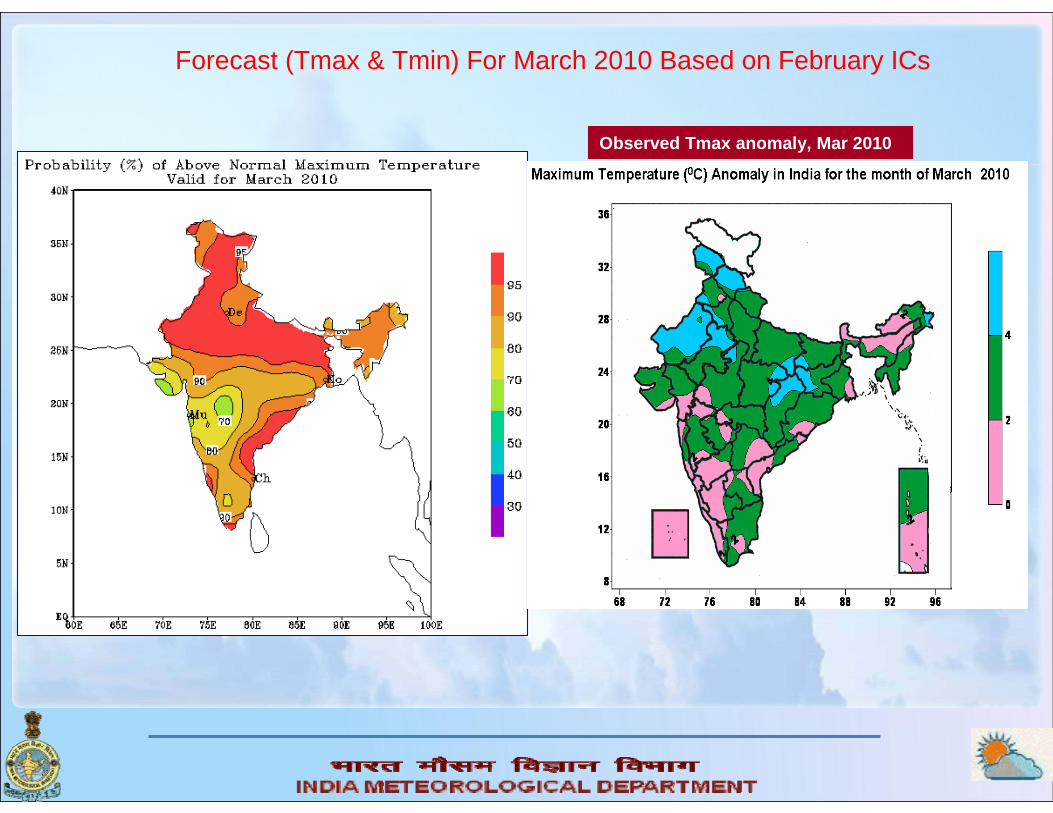
Forecast (Tmax & Tmin) For March 2010 Based on February ICs
Observed Tmax anomaly, Mar 2010
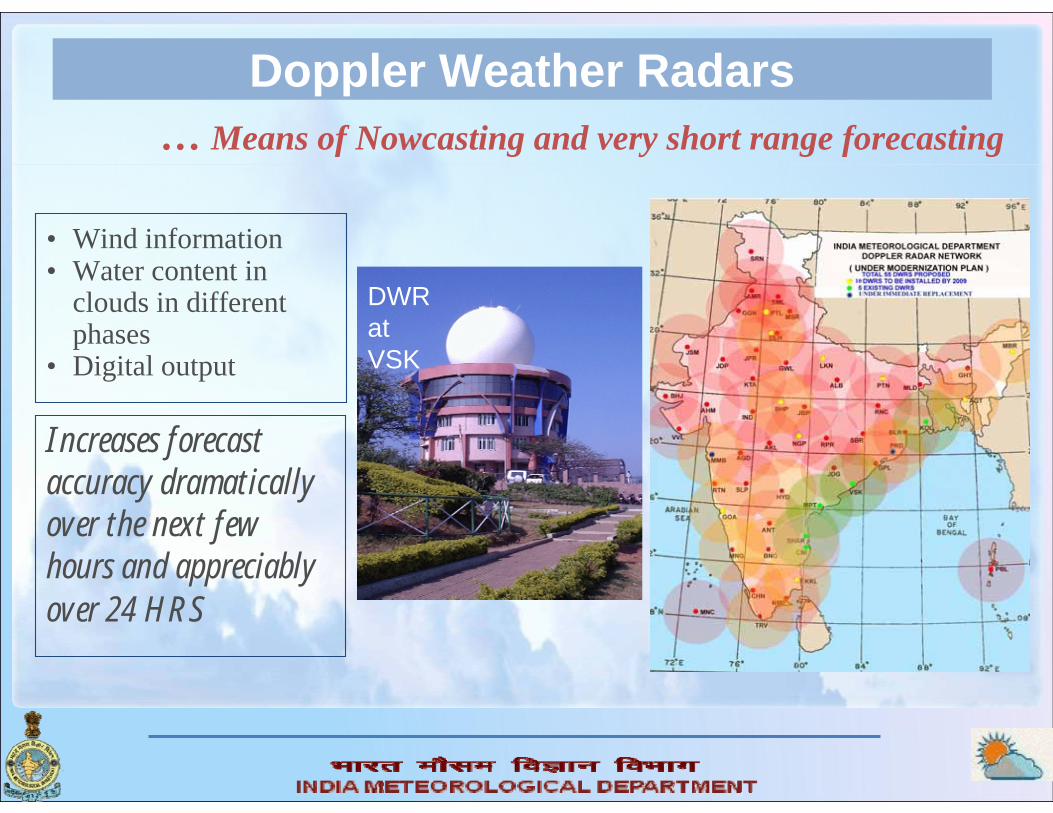
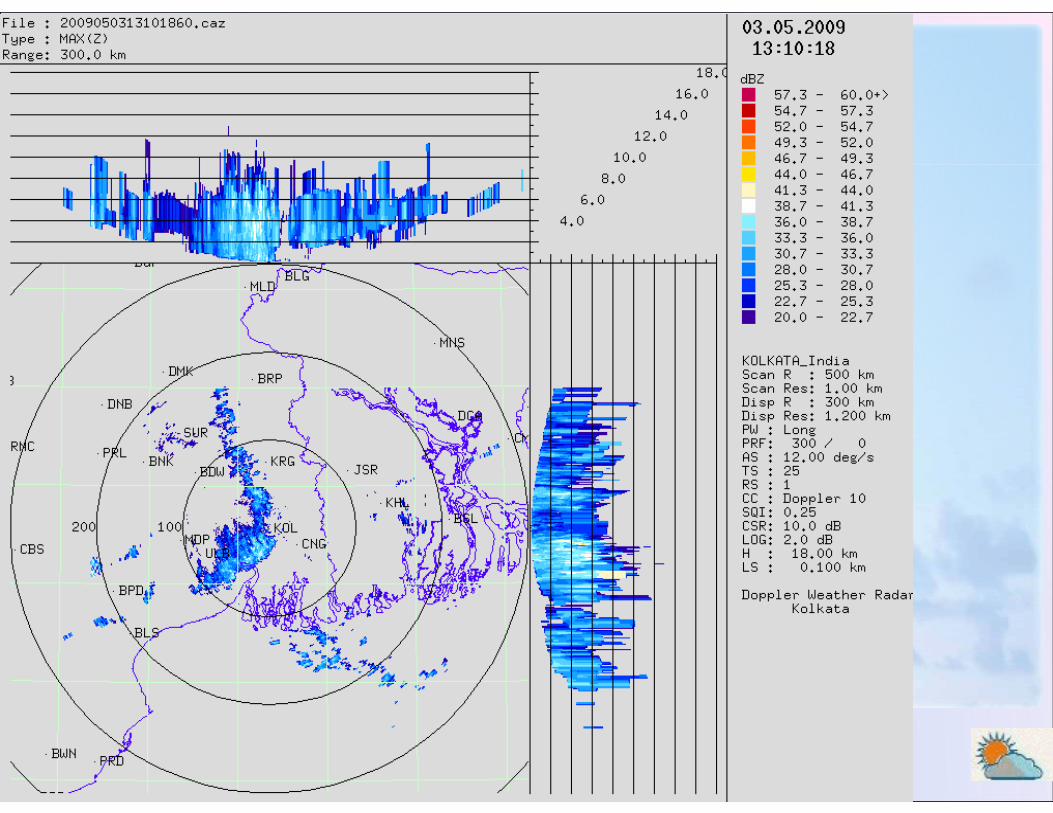
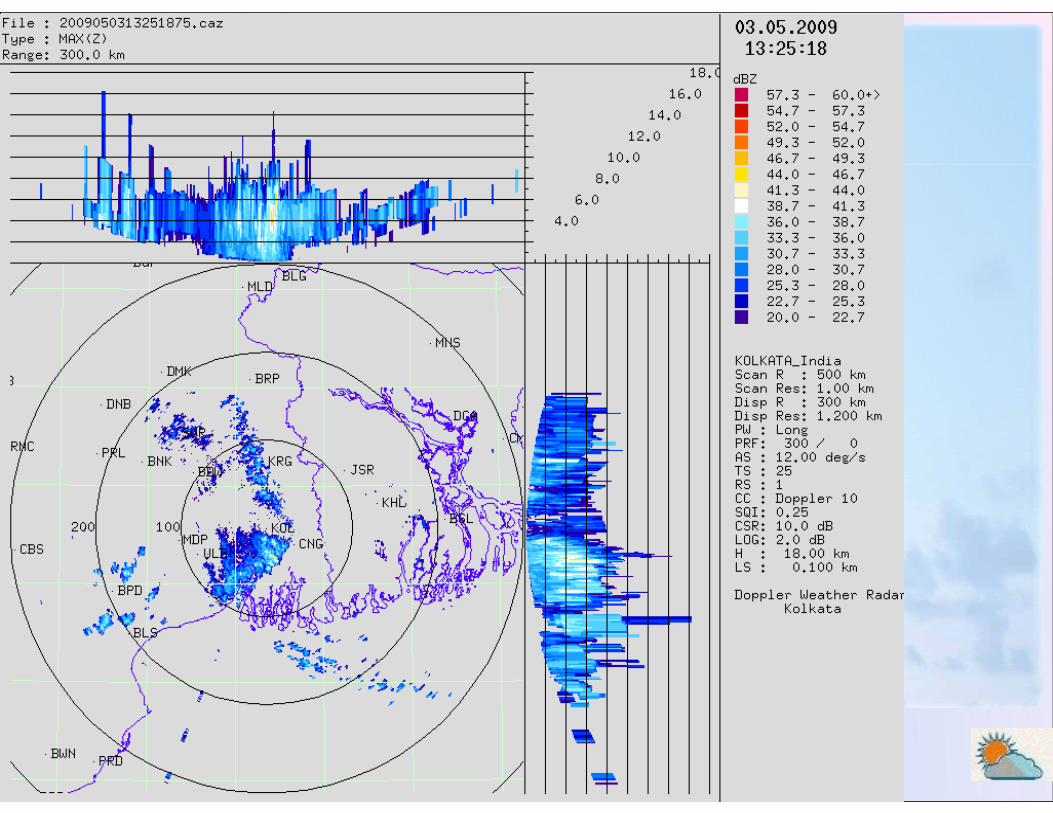
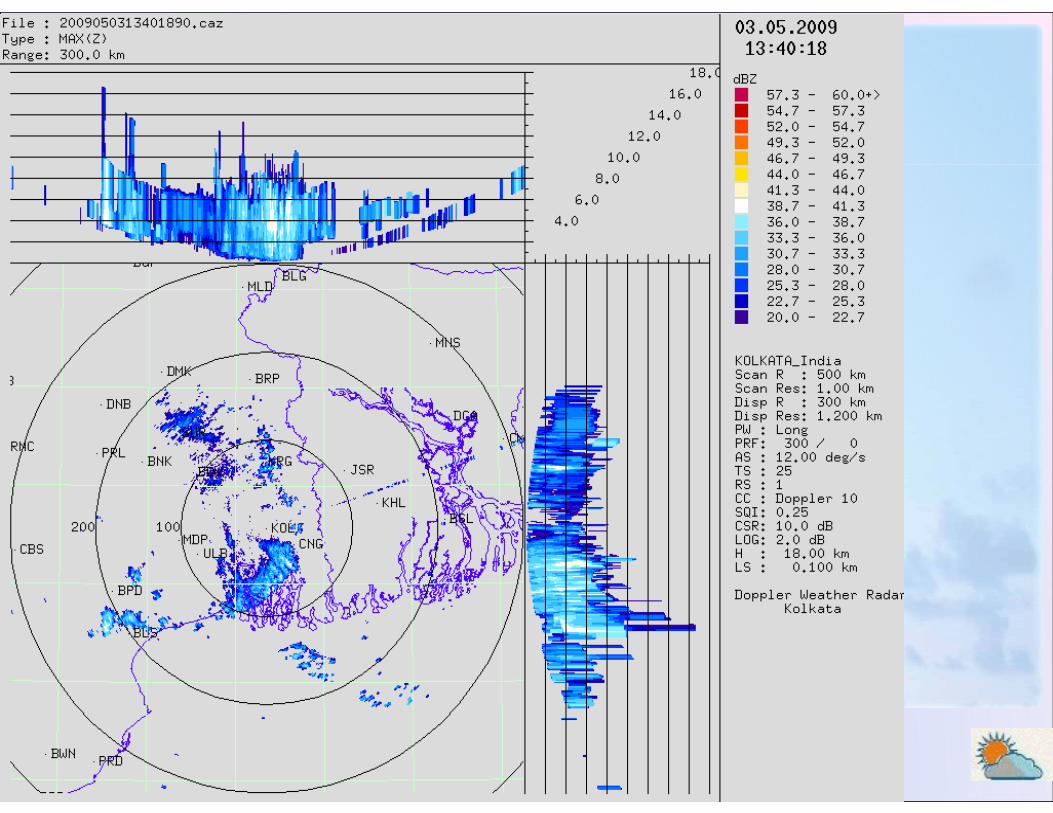
Doppler Weather Radars
DWR at VSK
• Wind information• Water content in
clouds in different phases
• Digital output
Increases forecast accuracy dramatically over the next few hours and appreciably over 24 HRS
… Means of Nowcasting and very short range forecasting
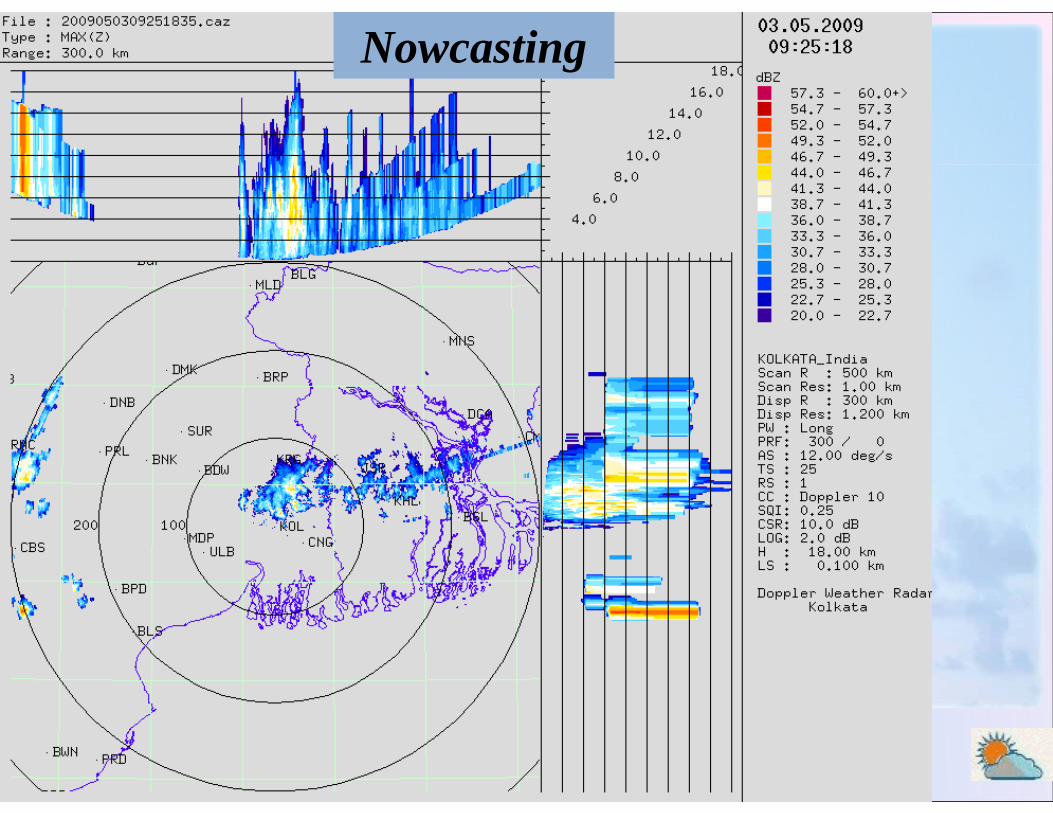
Nowcasting
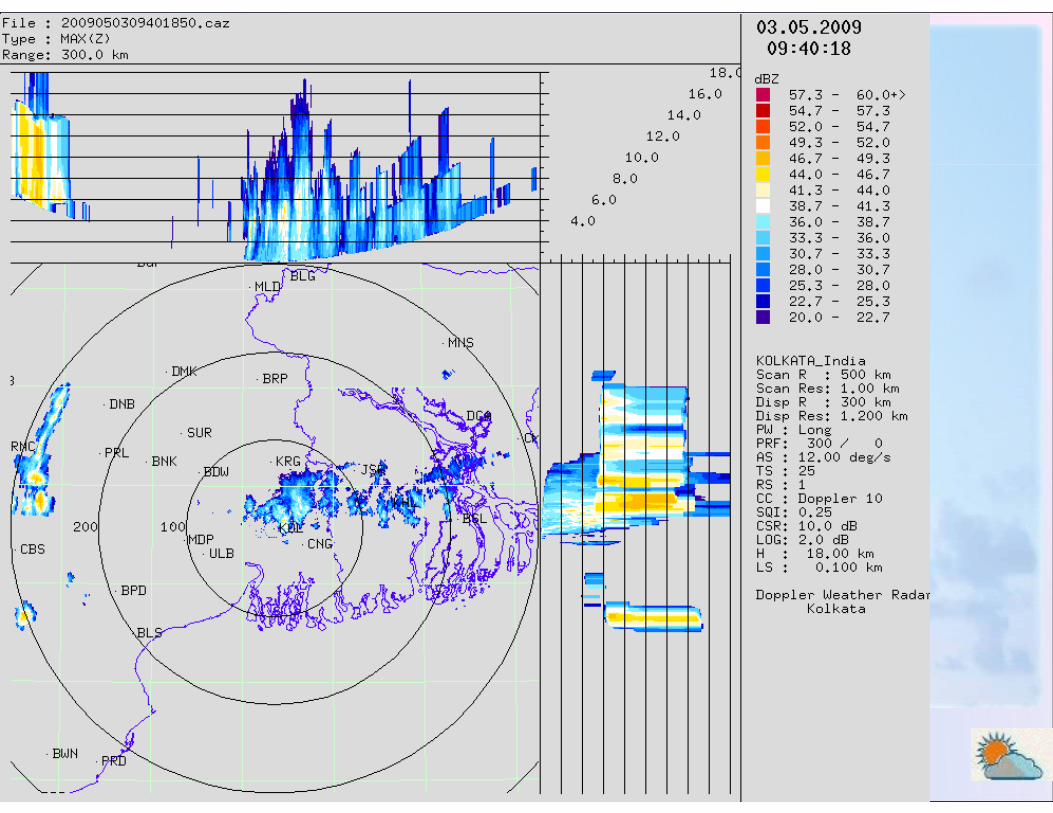
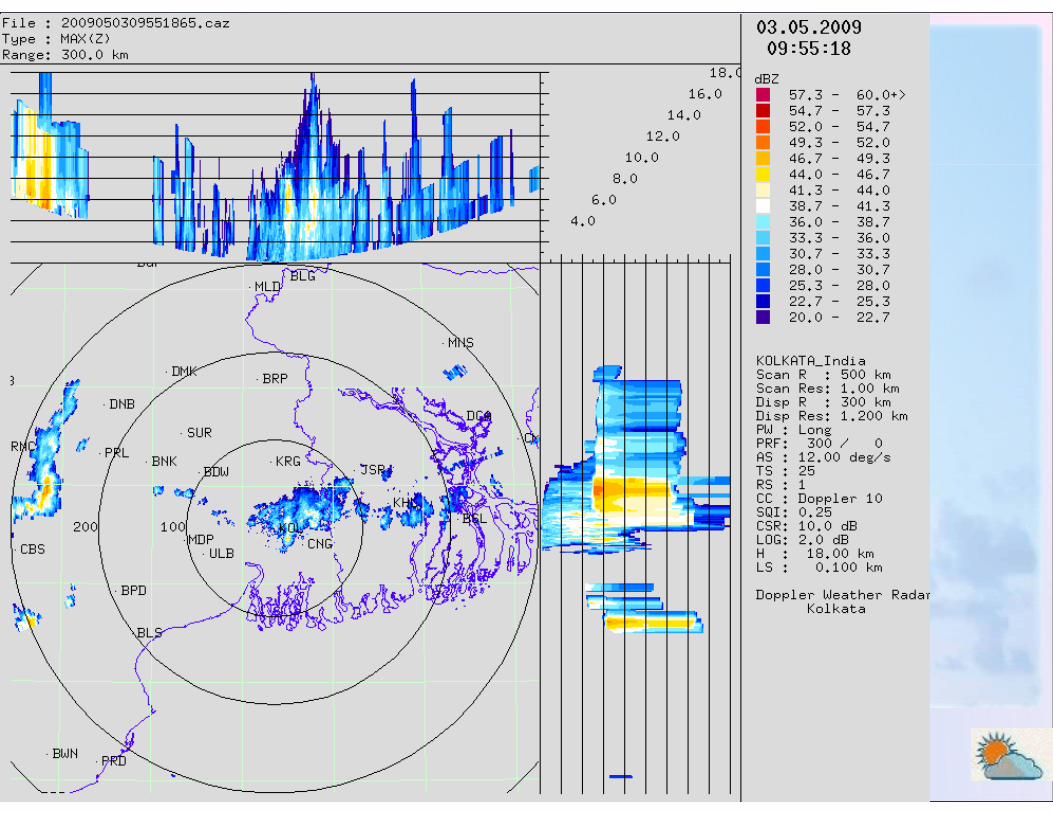
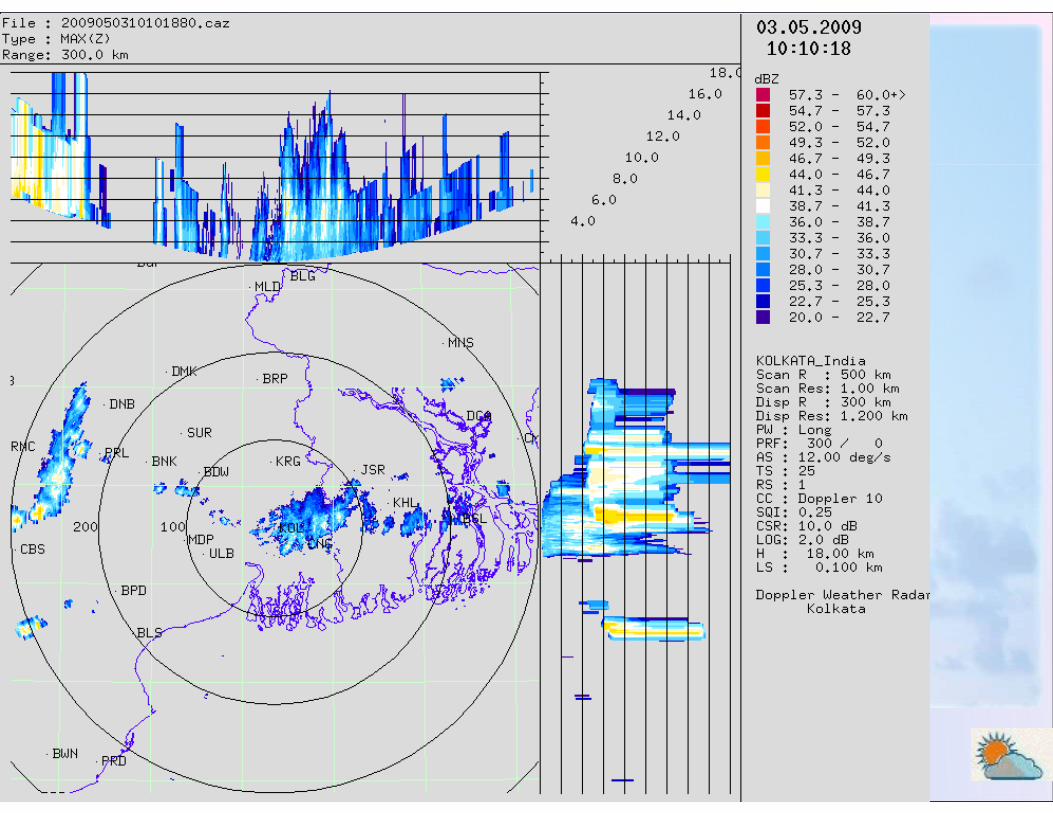
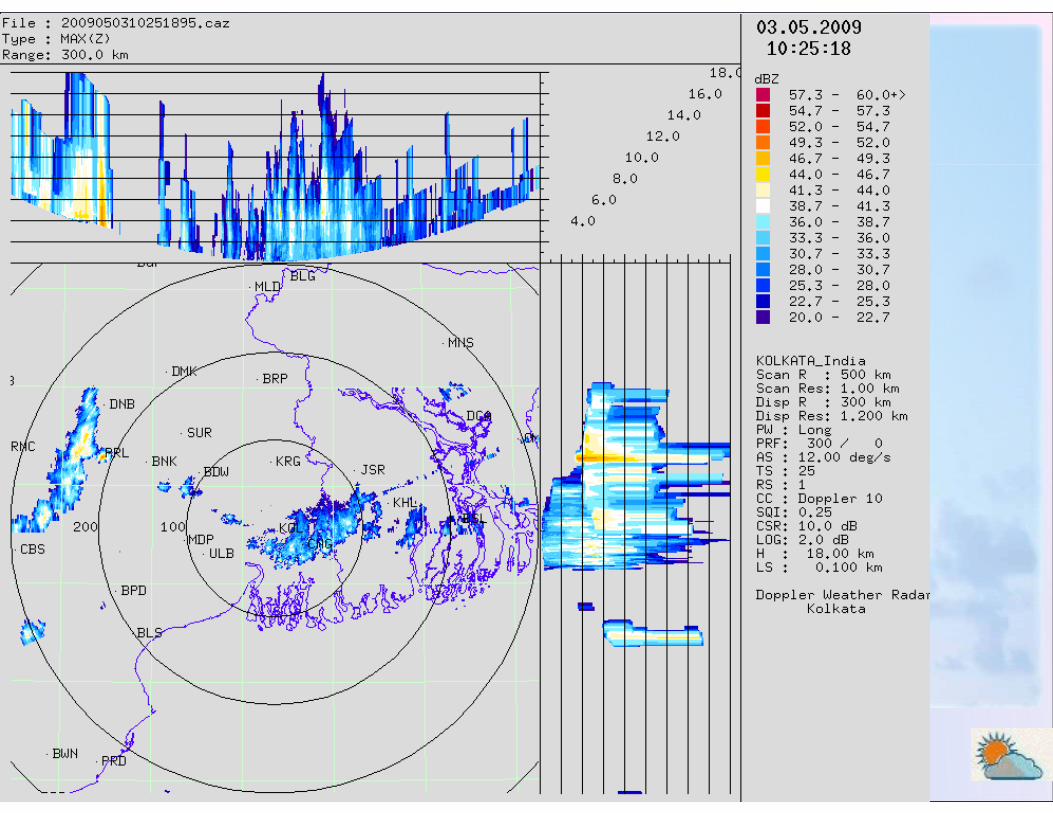
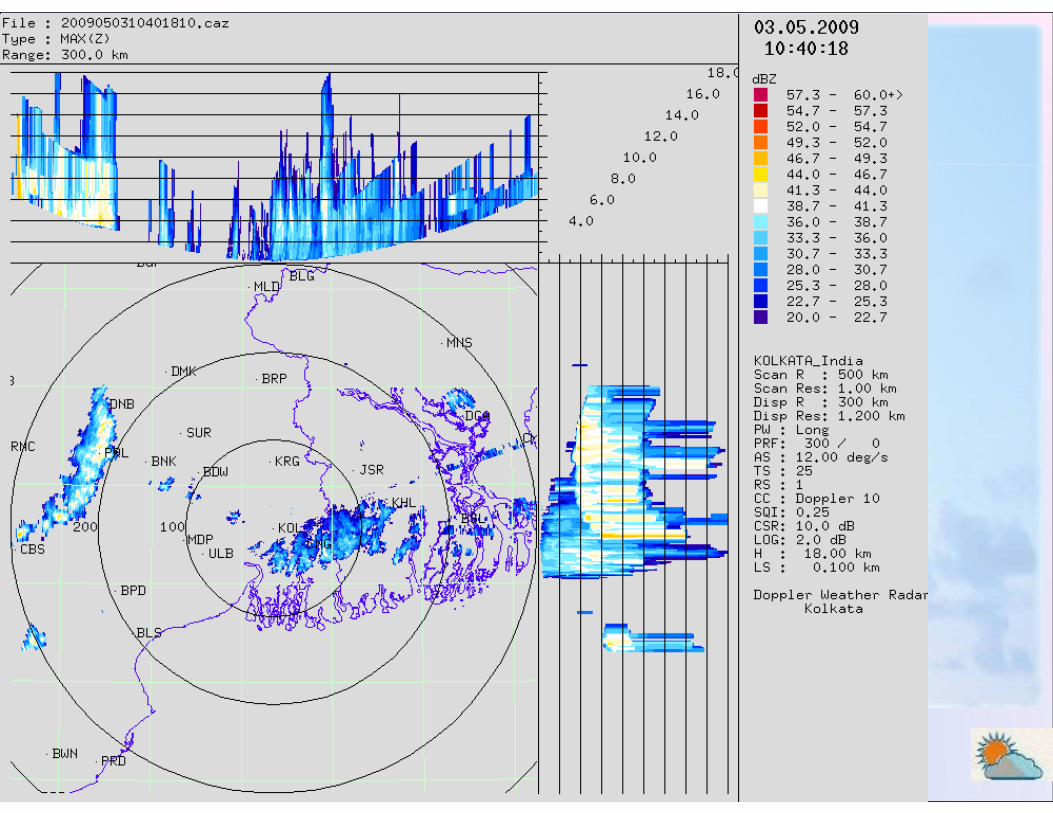
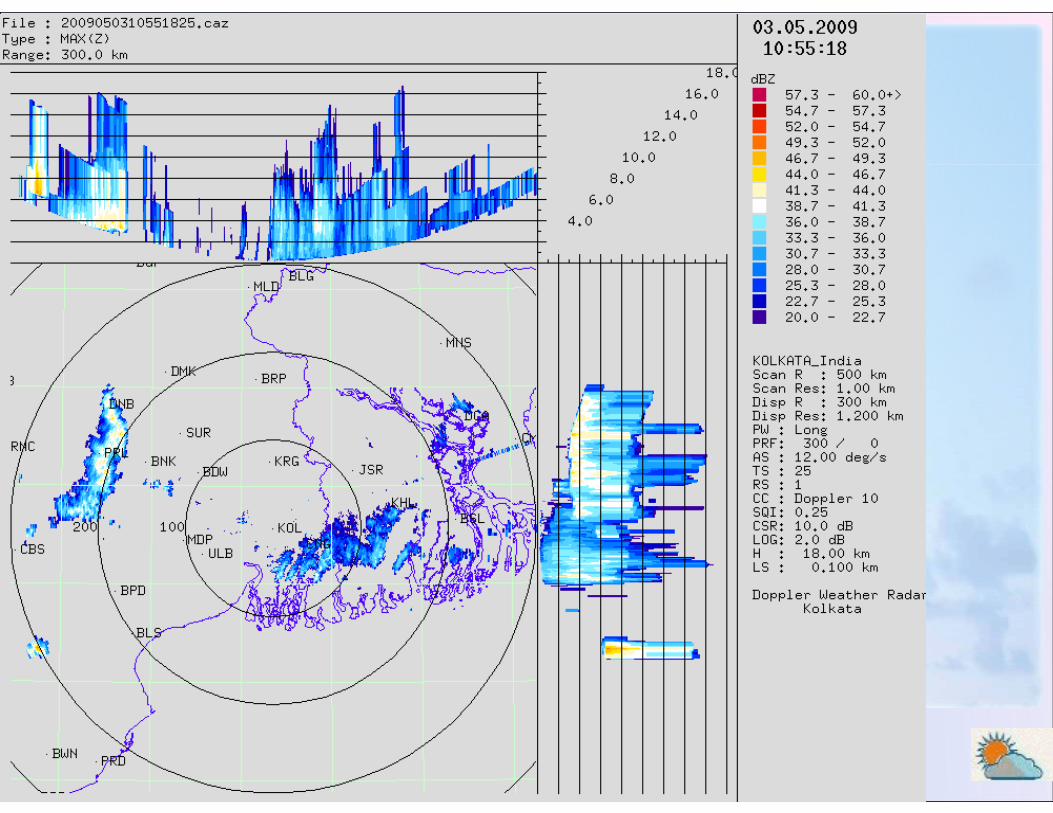
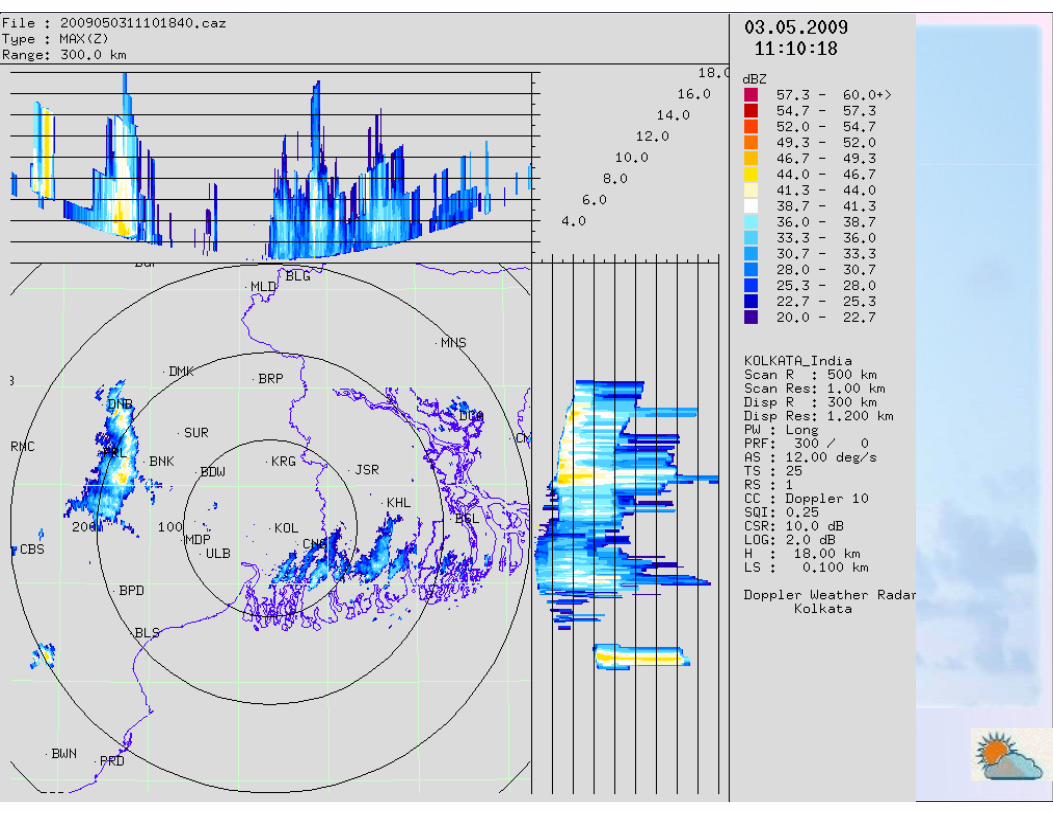
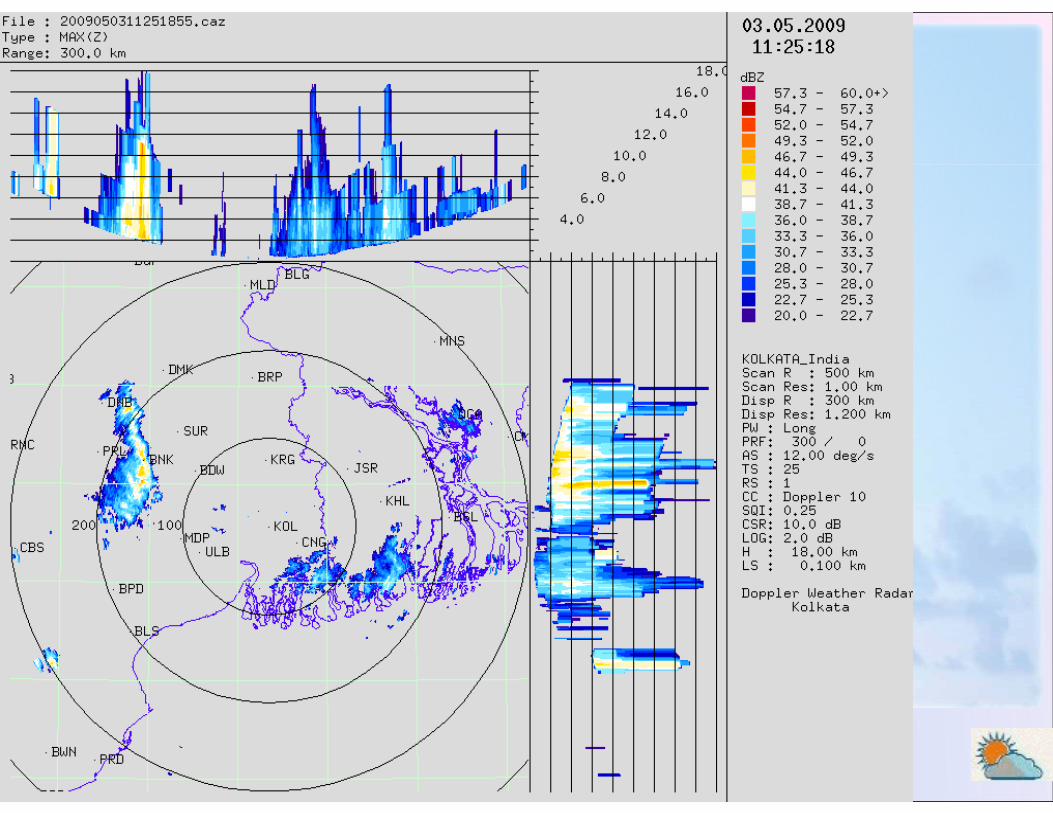
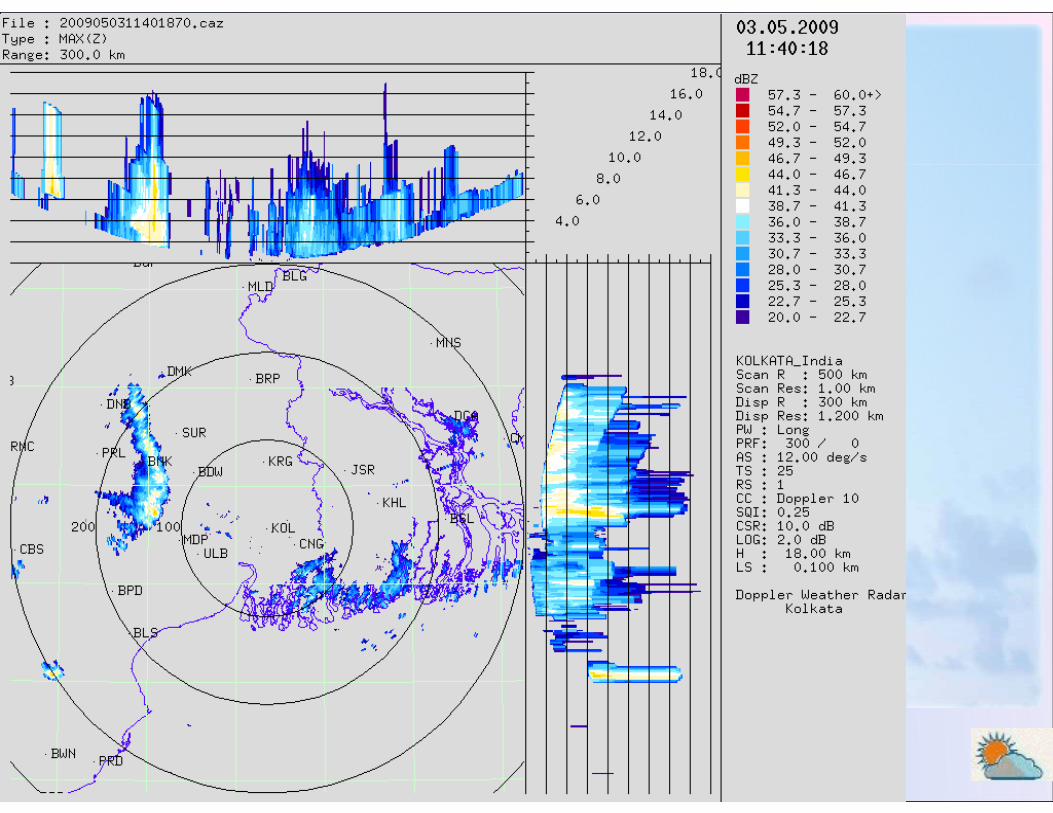
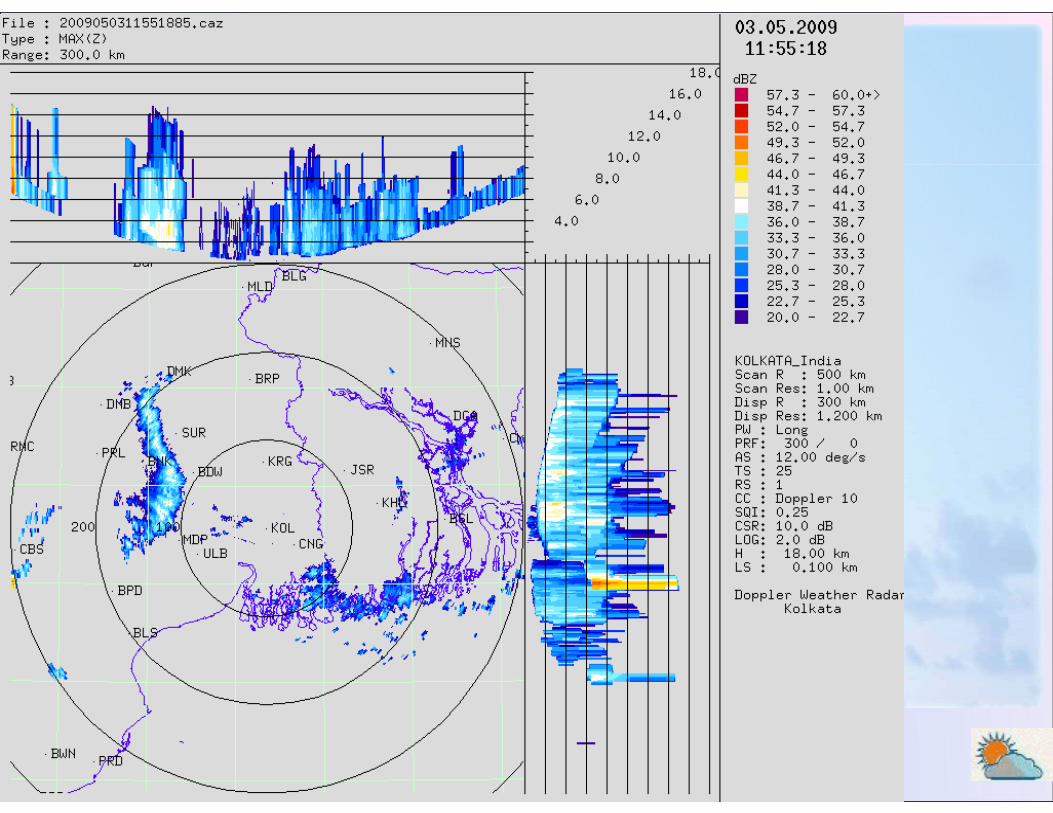
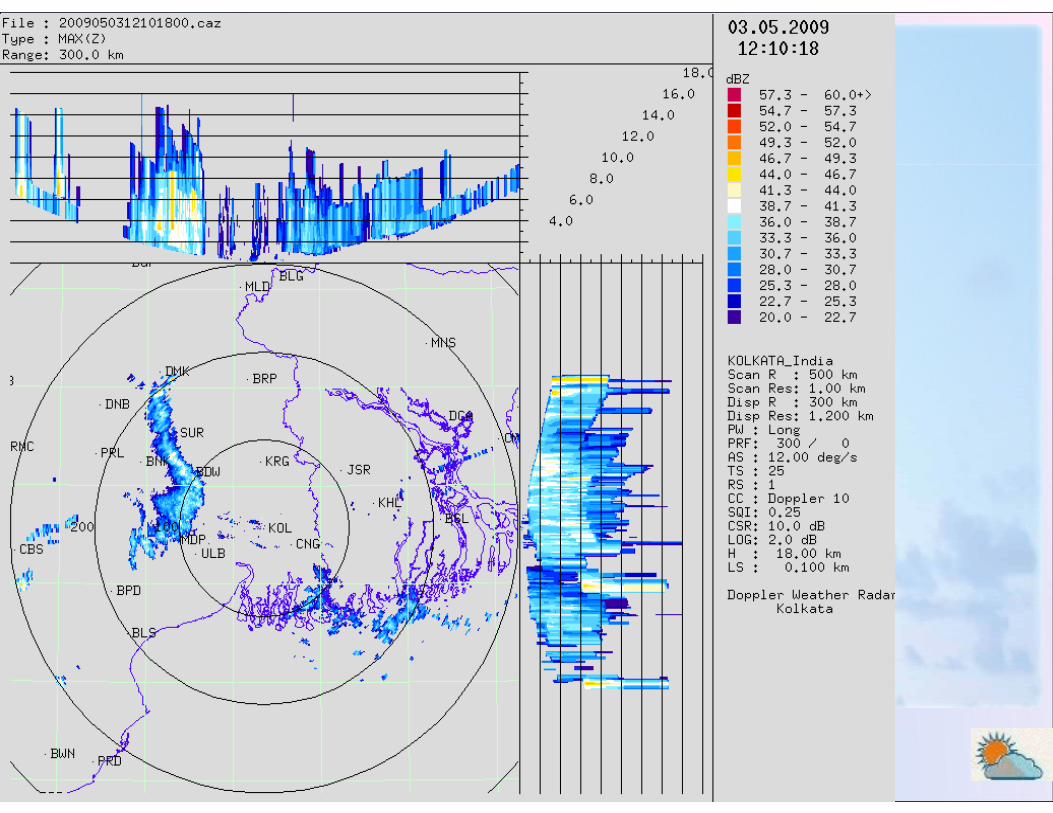
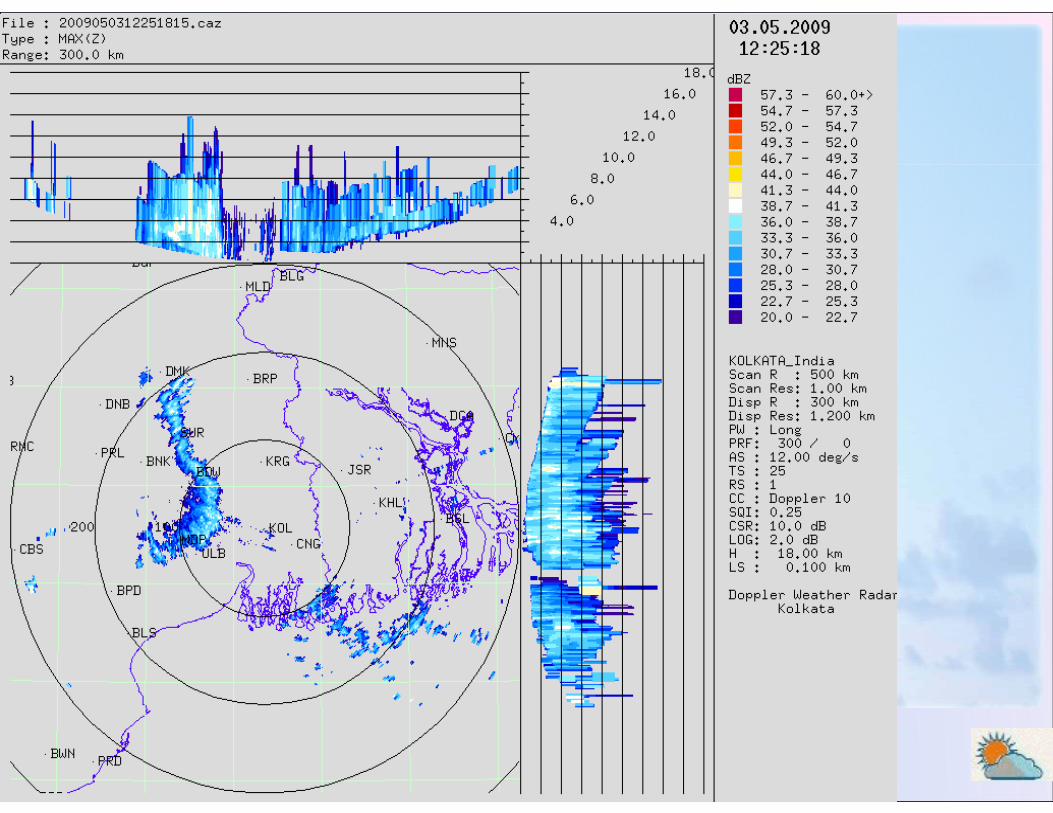
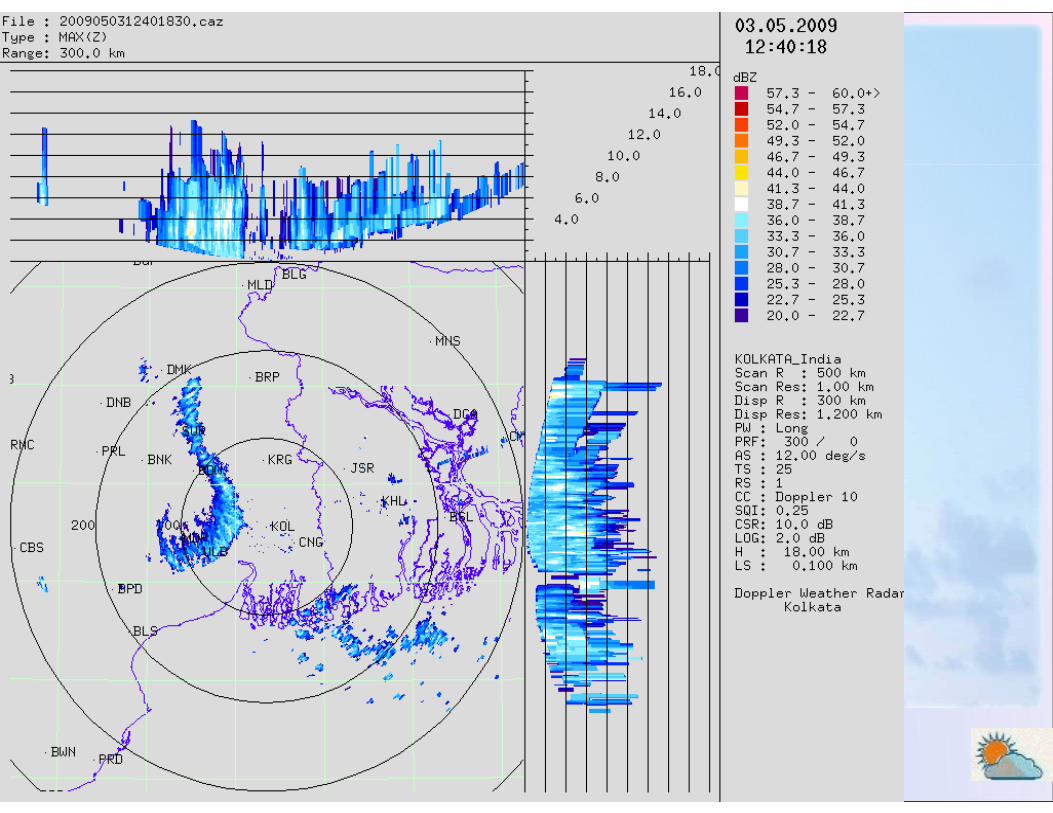
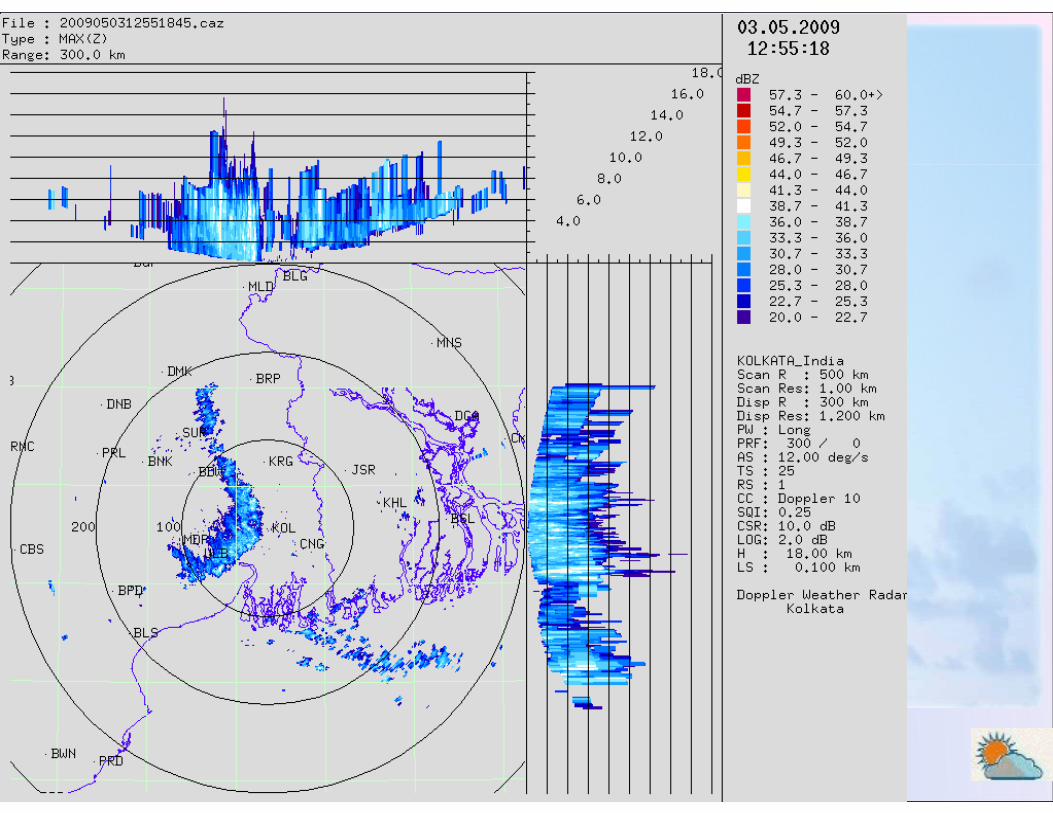
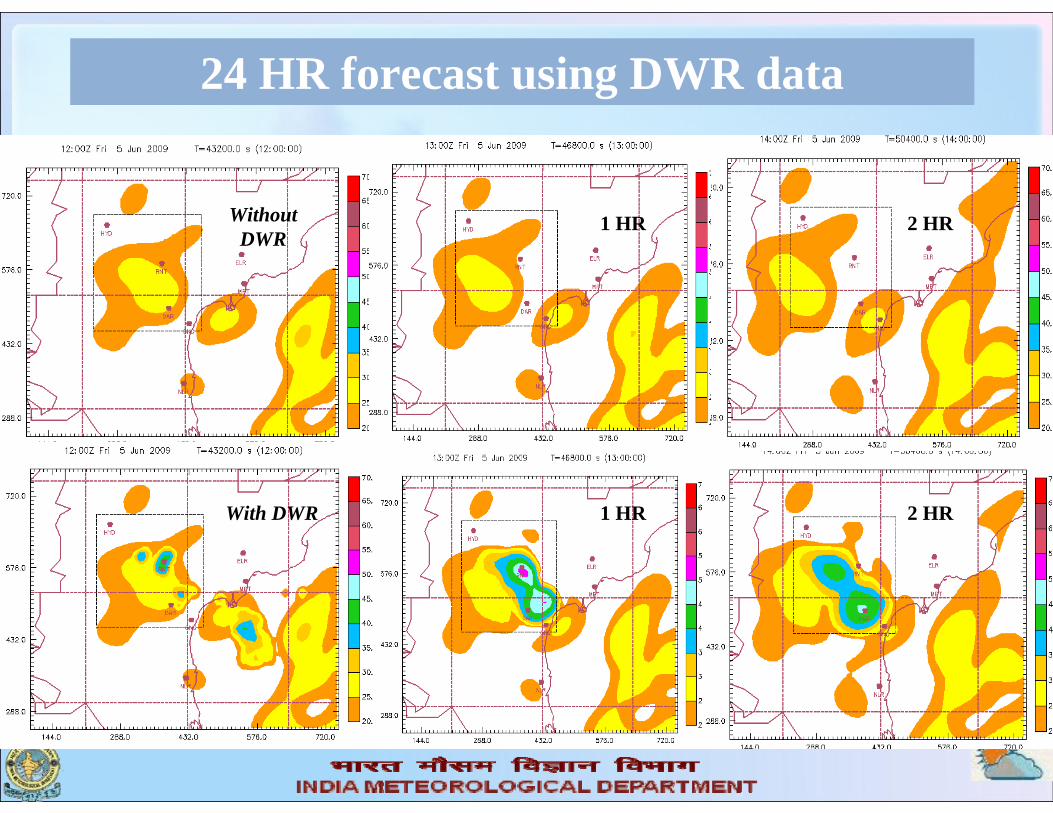
24 HR forecast using DWR data
1 HR 2 HR
1 HR 2 HR
Without DWR
With DWR
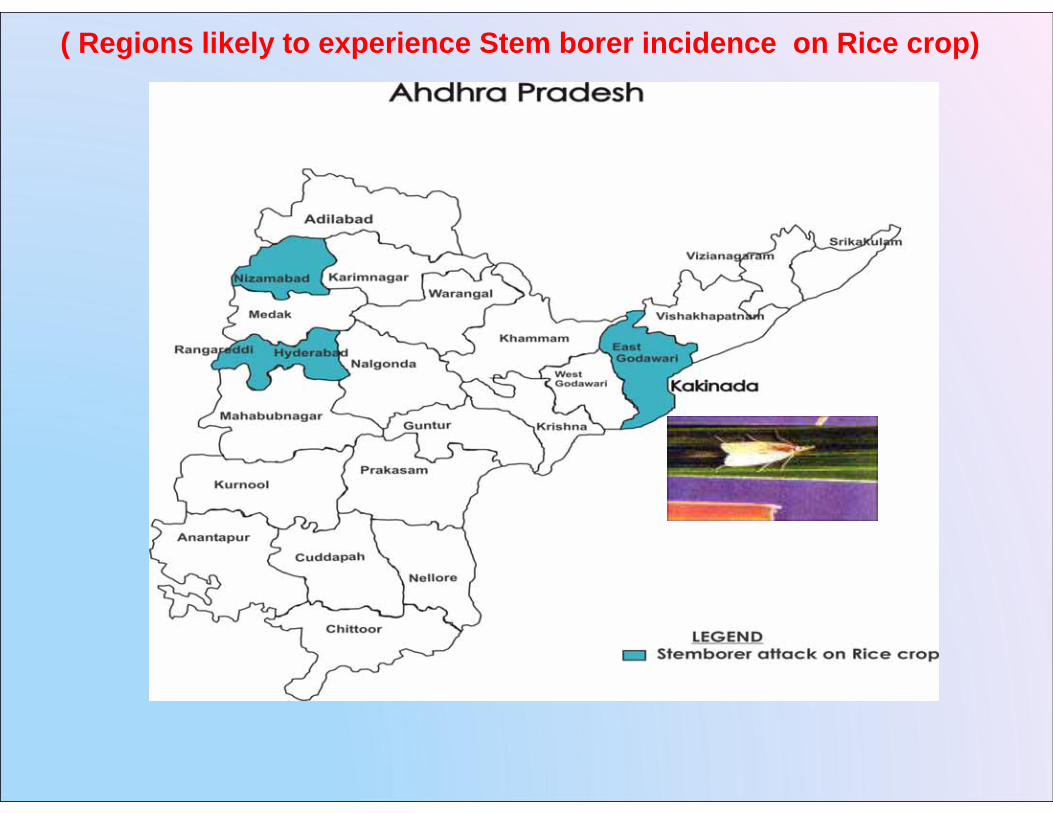
( Regions likely to experience Stem borer incidence on Rice crop)
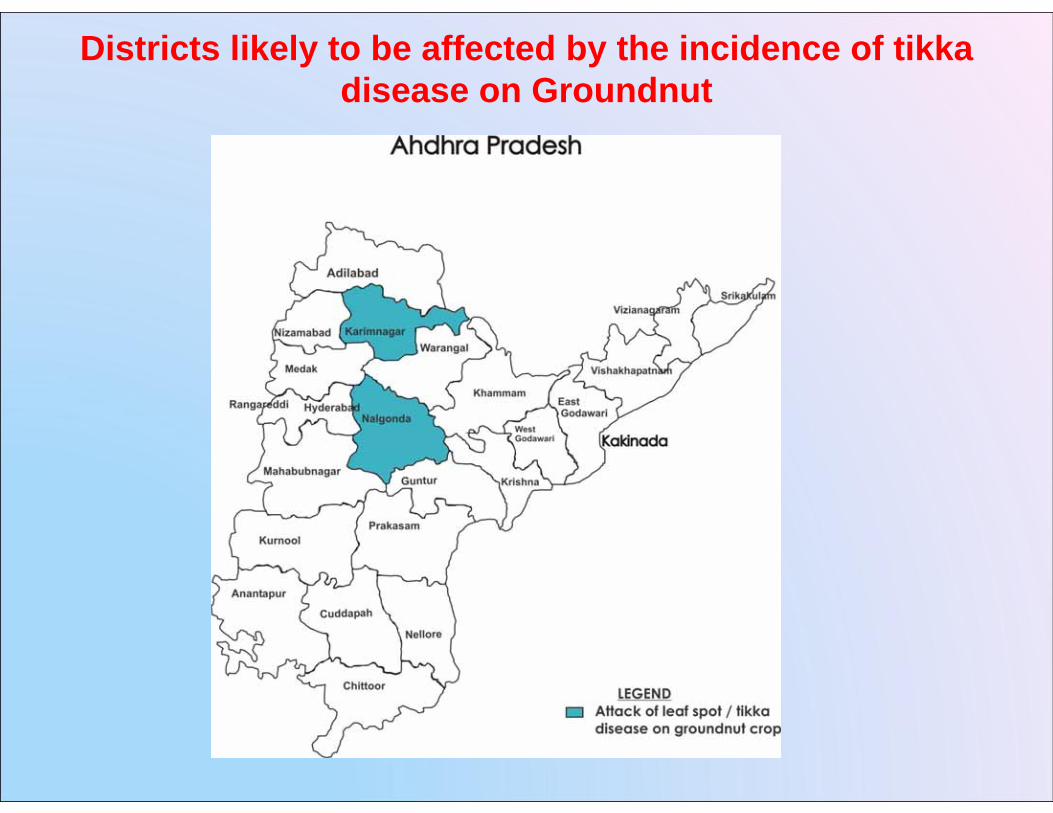
Districts likely to be affected by the incidence of tikkadisease on Groundnut
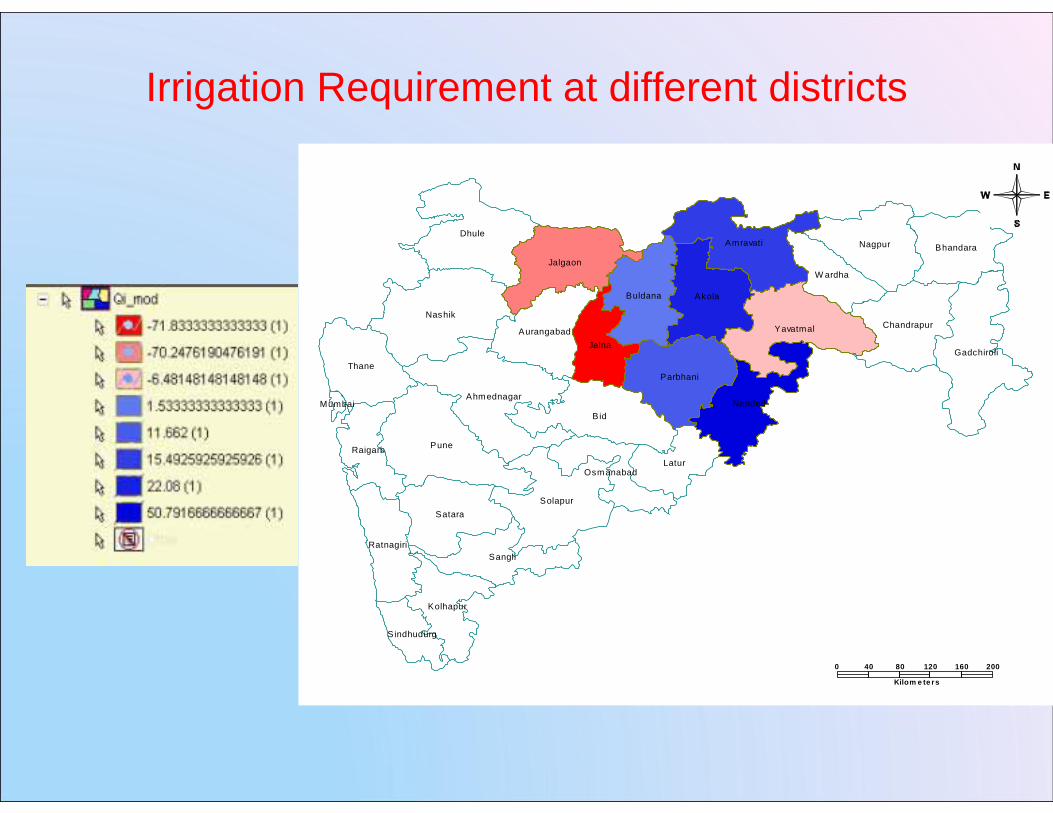
Irrigation Requirement at different districts
Ratnagiri
Kolhapur
Dhule
Raigarh
Satara
Pune
Sangli
Solapur
Osmanabad
Mumbai
Thane
Ahmednagar
Sindhudurg
Nashik
Bid
JalnaAurangabad
Jalgaon
Buldana
Latur
Parbhani
Nanded
Akola
Yavatmal
Amravati
Gadchiroli
W ardha
Nagpur
Chandrapur
Bhandara
0 40 80 120 160 200
Kilom e te rs
.
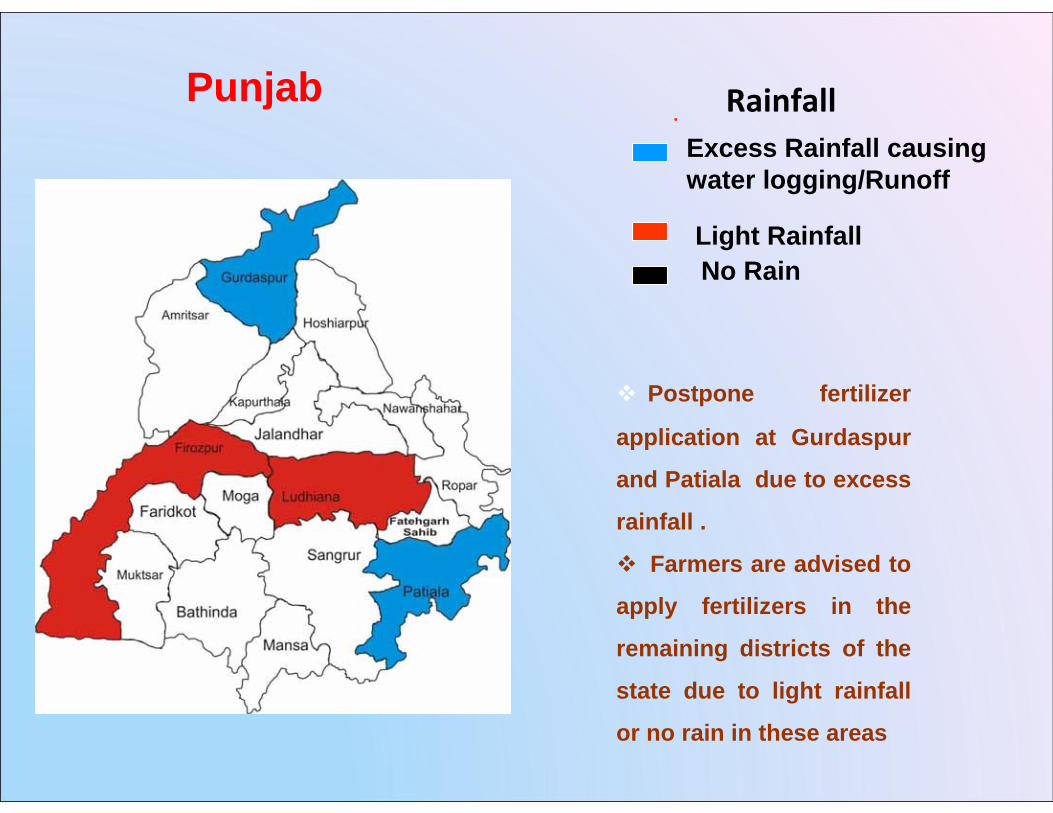
Light Rainfall
Excess Rainfall causing water logging/Runoff
Punjab
No Rain
Postpone fertilizer
application at Gurdaspur
and Patiala due to excess
rainfall .
Farmers are advised to
apply fertilizers in the
remaining districts of the
state due to light rainfall
or no rain in these areas
Rainfall
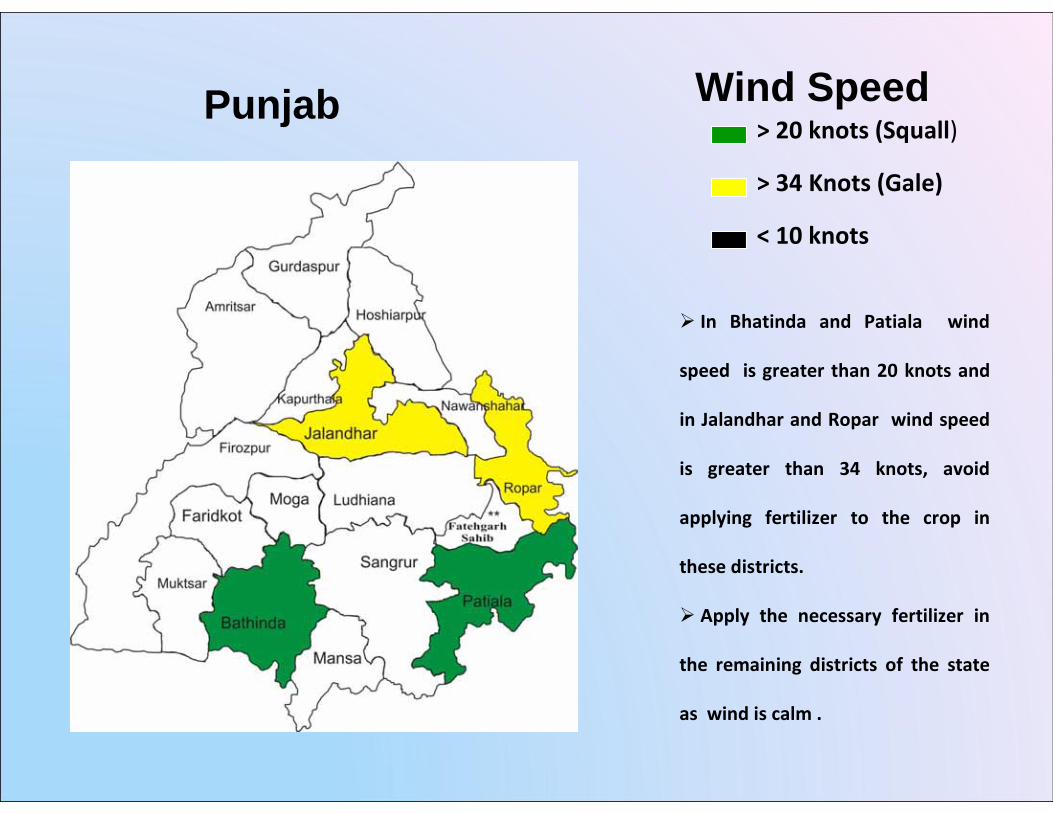
> 20 knots (Squall)
> 34 Knots (Gale)
< 10 knots
Wind SpeedPunjab
In Bhatinda and Patiala wind
speed is greater than 20 knots and
in Jalandhar and Ropar wind speed
is greater than 34 knots, avoid
applying fertilizer to the crop in
these districts.
Apply the necessary fertilizer in
the remaining districts of the state
as wind is calm .
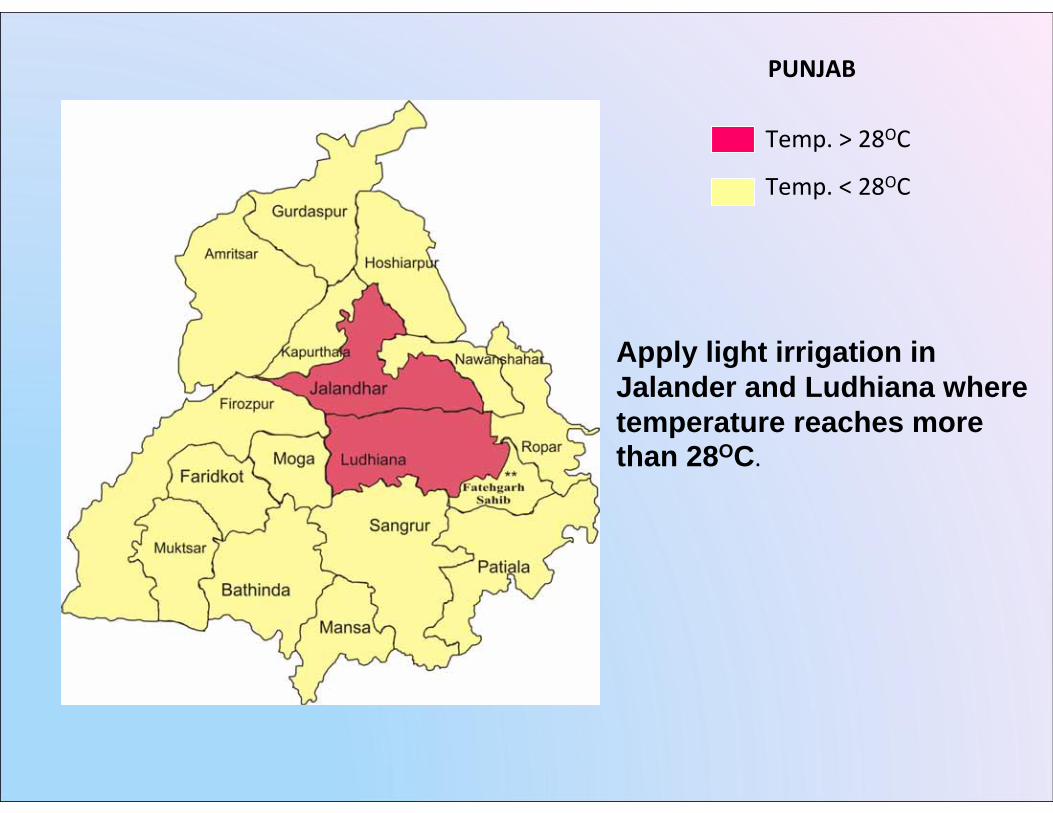
Temp. > 28OC
Temp. < 28OC
PUNJAB
Apply light irrigation in Jalander and Ludhiana where temperature reaches more than 28OC.
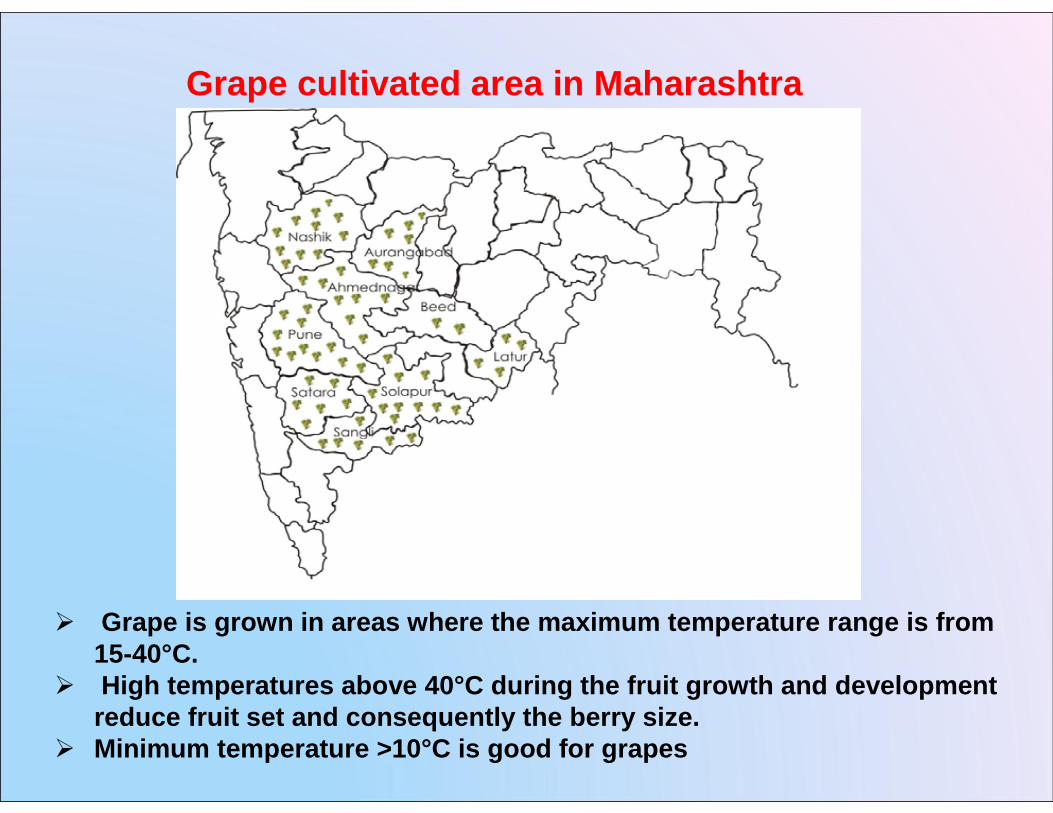
Grape cultivated area in Maharashtra
Grape is grown in areas where the maximum temperature range is from 15-40°C. High temperatures above 40°C during the fruit growth and development
reduce fruit set and consequently the berry size.Minimum temperature >10°C is good for grapes
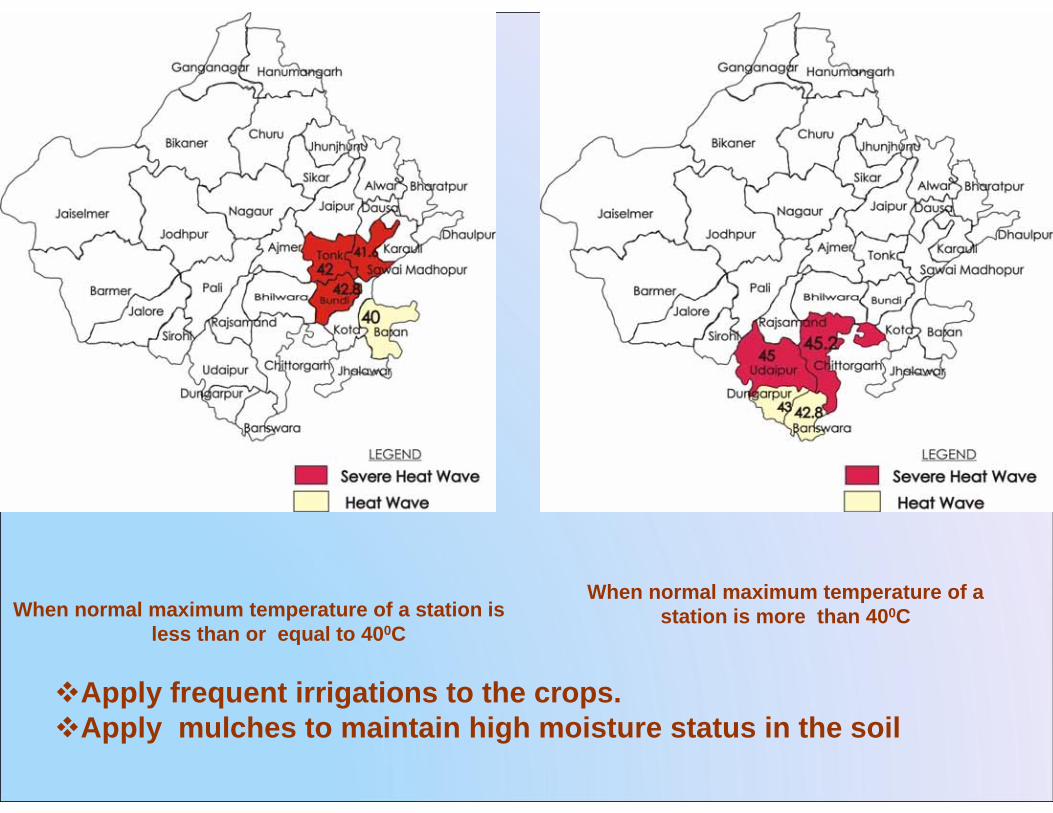
When normal maximum temperature of a station is less than or equal to 400C
When normal maximum temperature of a station is more than 400C
Apply frequent irrigations to the crops.Apply mulches to maintain high moisture status in the soil
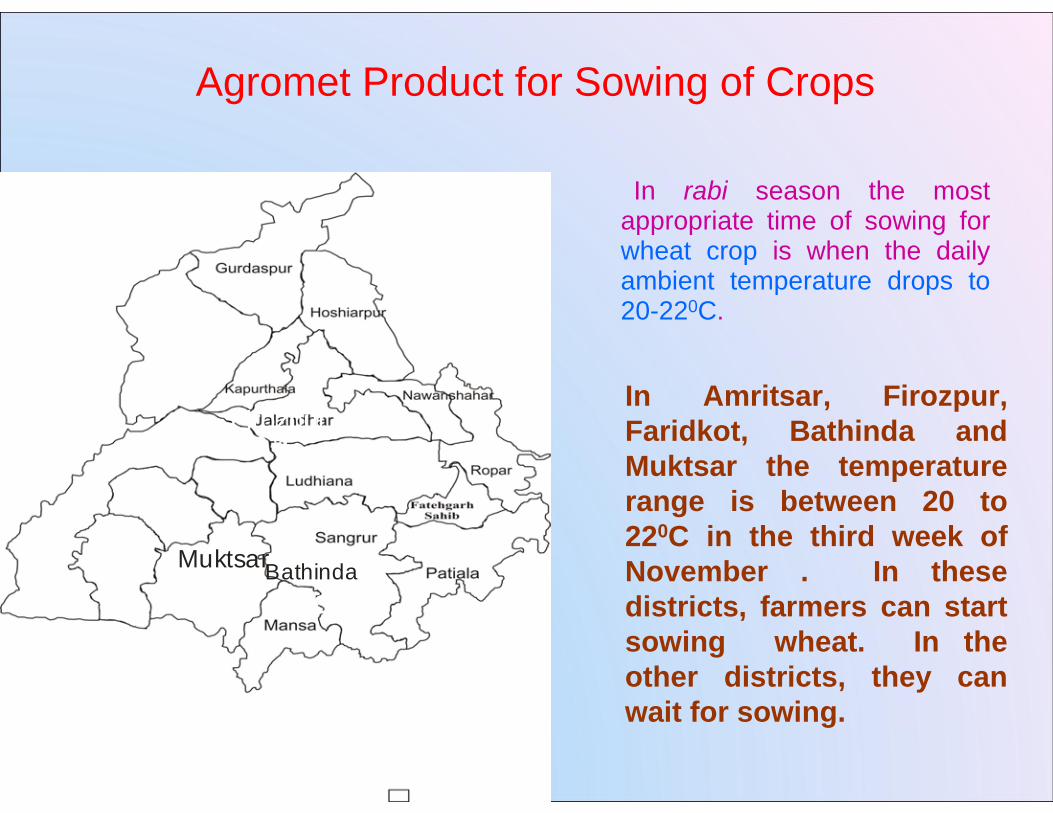
In rabi season the most appropriate time of sowing for wheat crop is when the daily ambient temperature drops to 20-220C.
In Amritsar, Firozpur, Faridkot, Bathinda and Muktsar the temperature range is between 20 to 220C in the third week of November . In these districts, farmers can start sowing wheat. In the other districts, they can wait for sowing.
Bathinda220C
Muktsar200C
Firozpur21.2 0C
Agromet Product for Sowing of Crops
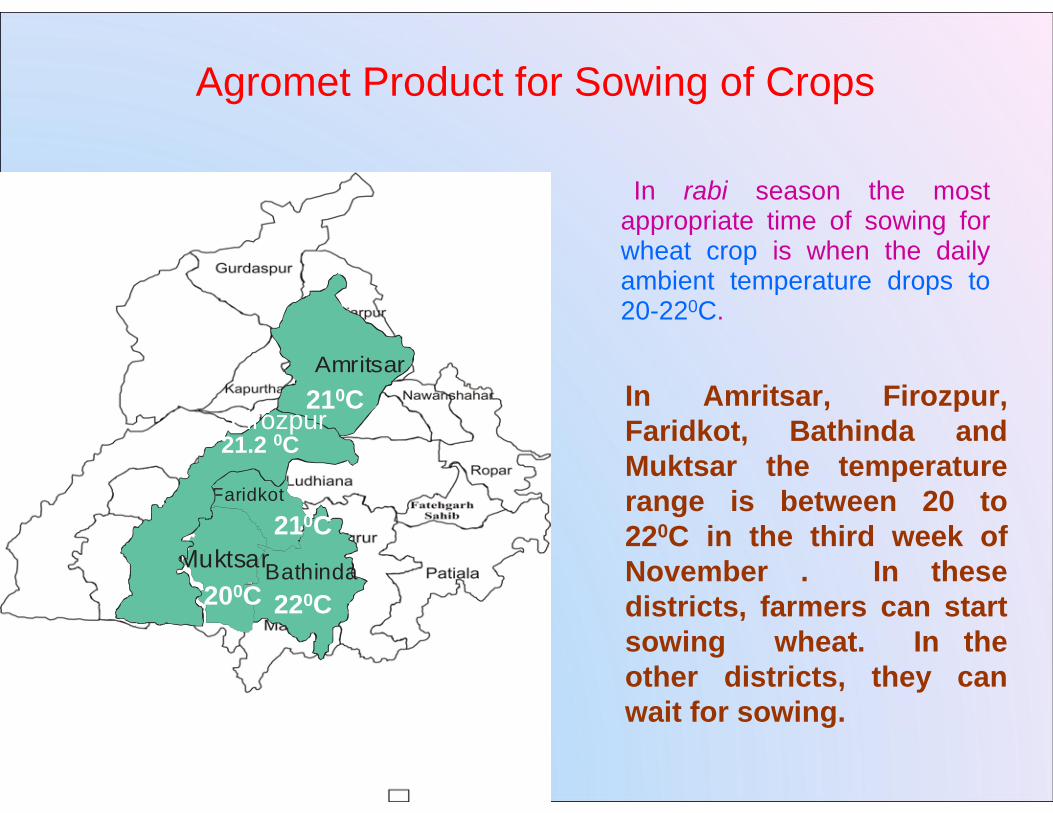
In rabi season the most appropriate time of sowing for wheat crop is when the daily ambient temperature drops to 20-220C.
In Amritsar, Firozpur, Faridkot, Bathinda and Muktsar the temperature range is between 20 to 220C in the third week of November . In these districts, farmers can start sowing wheat. In the other districts, they can wait for sowing.
Amritsar210C
Bathinda220C
Faridkot
210CMuktsar
200C
Firozpur21.2 0C
Agromet Product for Sowing of Crops
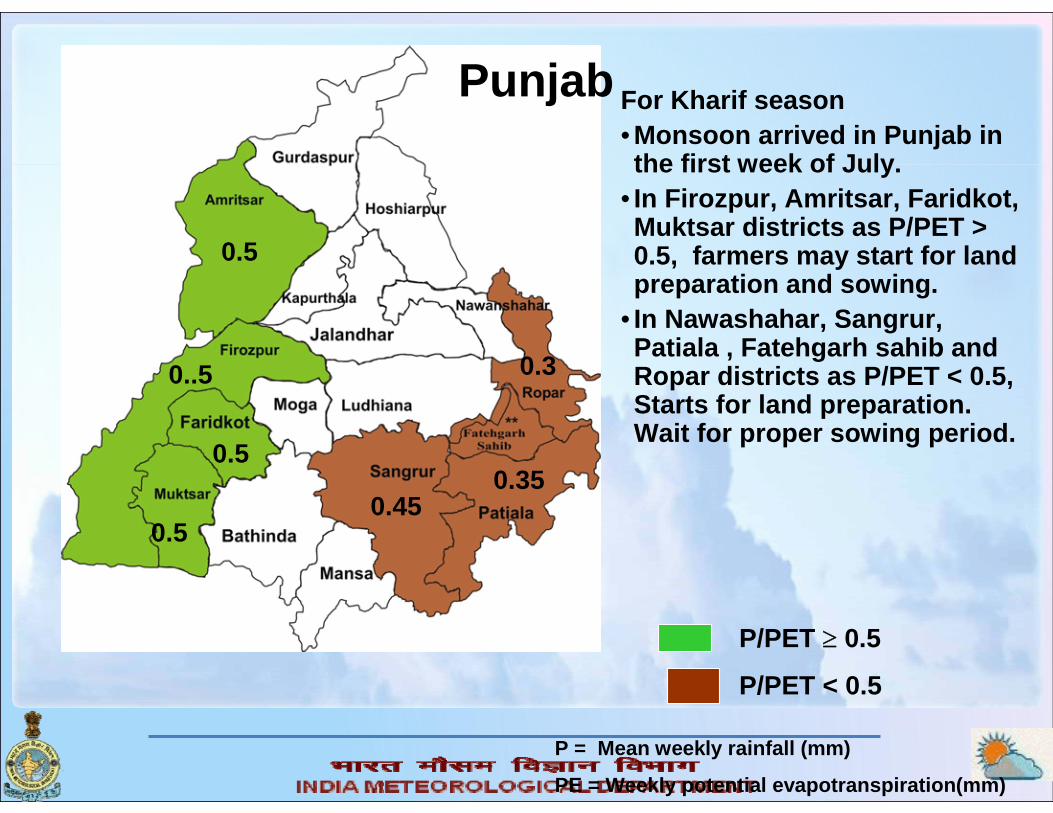
P/PET ≥ 0.5
P/PET < 0.5
0.35
0.3
0.45
0.5
0..5
0.5
0.5
P = Mean weekly rainfall (mm)
PE = Weekly potential evapotranspiration(mm)
Punjab For Kharif season• Monsoon arrived in Punjab in the first week of July.
• In Firozpur, Amritsar, Faridkot, Muktsar districts as P/PET > 0.5, farmers may start for land preparation and sowing.
• In Nawashahar, Sangrur, Patiala , Fatehgarh sahib and Ropar districts as P/PET < 0.5, Starts for land preparation. Wait for proper sowing period.
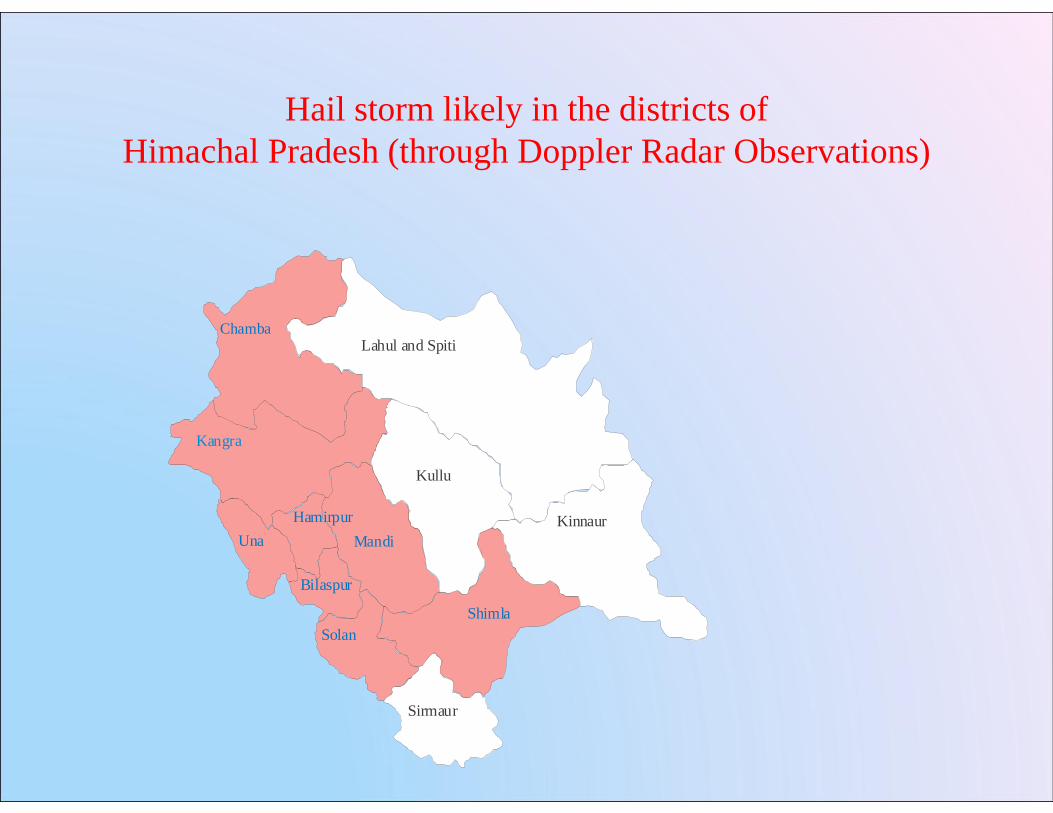
Hail storm likely in the districts of Himachal Pradesh (through Doppler Radar Observations)
Chamba
Kangra
Una
Solan
Sirmaur
Kinnaur
Shimla
Mandi
Kullu
Lahul and Spiti
Hamirpur
Bilaspur