Embed Size (px)
Citation preview
Short-Circuit Modeling and
System Strength
Mohamed Osman, Lead Engineer System Analysis
WECC SCMWG Meeting
May 08, 2018
RELIABILITY | ACCOUNTABILITY2
• Introduction
• Short-Circuit Sources and Modeling
• Short-Circuit Model Verification
• Short-Circuit Ratio Calculation Methods
• NERC’s ERS Measure 10 – System Strength
• Summary
• Questions and Answers
Short-Circuit Webinar Overview
RELIABILITY | ACCOUNTABILITY3
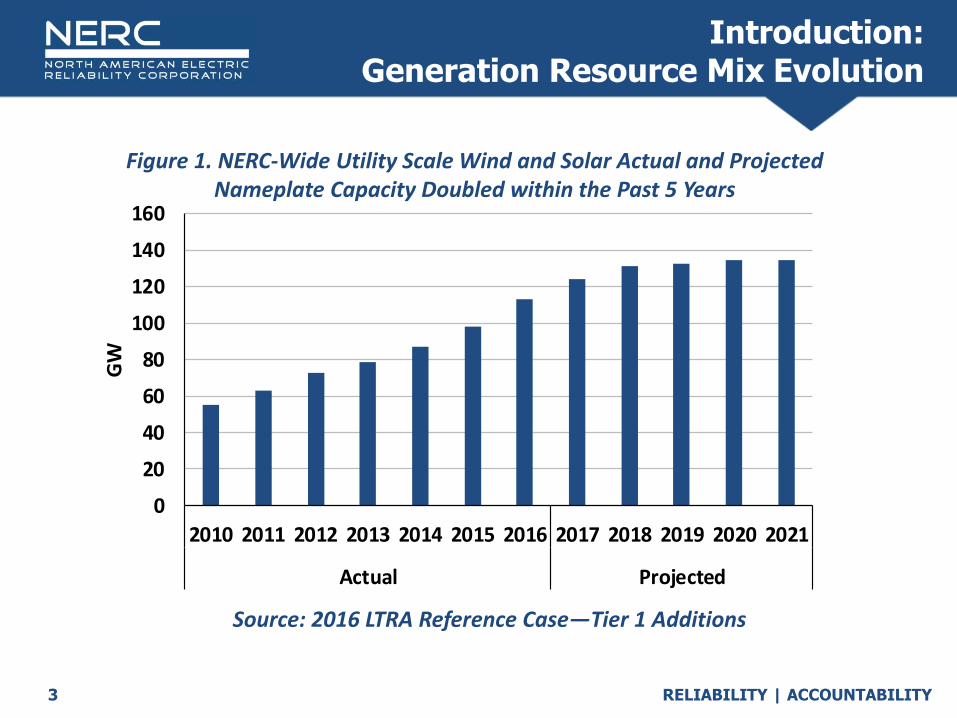
Introduction: Generation Resource Mix Evolution
0
20
40
60
80
100
120
140
160
2010 2011 2012 2013 2014 2015 2016 2017 2018 2019 2020 2021
Actual Projected
GW
Figure 1. NERC-Wide Utility Scale Wind and Solar Actual and Projected Nameplate Capacity Doubled within the Past 5 Years
Source: 2016 LTRA Reference Case—Tier 1 Additions
RELIABILITY | ACCOUNTABILITY4
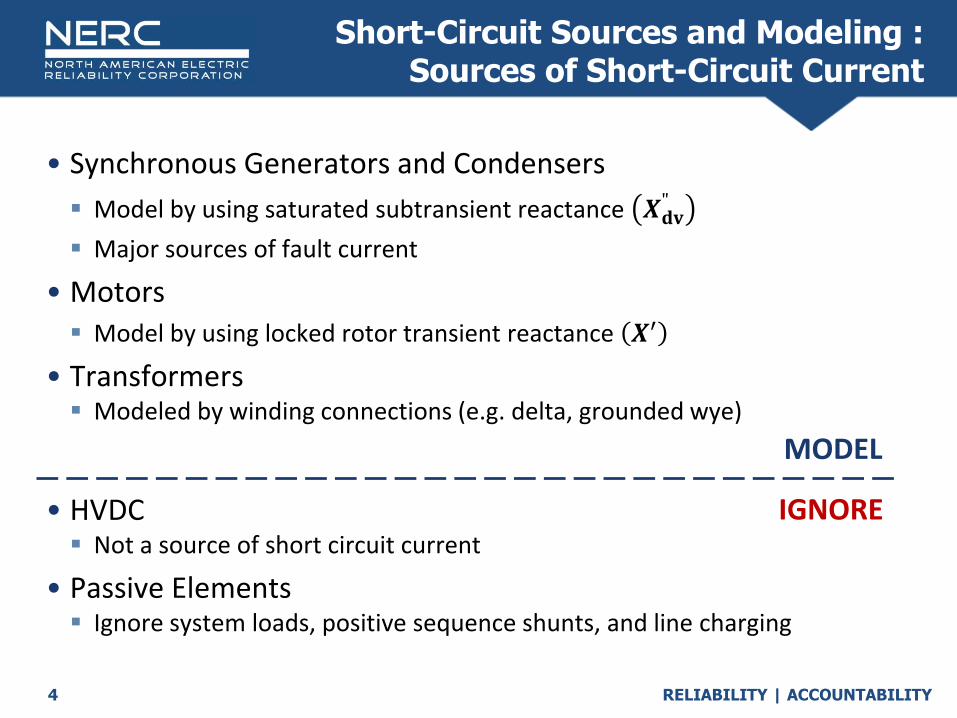
• Synchronous Generators and Condensers
▪ Model by using saturated subtransient reactance 𝑿𝐝𝐯"
▪ Major sources of fault current
• Motors▪ Model by using locked rotor transient reactance 𝑿′
• Transformers▪ Modeled by winding connections (e.g. delta, grounded wye)
• HVDC▪ Not a source of short circuit current
• Passive Elements ▪ Ignore system loads, positive sequence shunts, and line charging
Short-Circuit Sources and Modeling : Sources of Short-Circuit Current
MODEL
IGNORE
RELIABILITY | ACCOUNTABILITY5
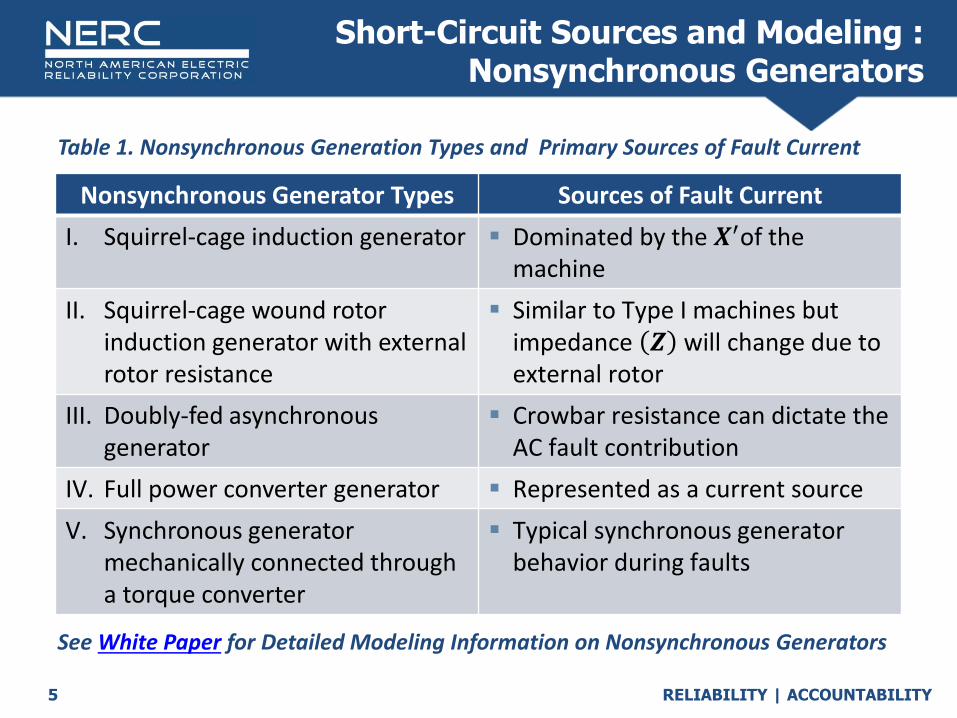
Short-Circuit Sources and Modeling : Nonsynchronous Generators
Nonsynchronous Generator Types Sources of Fault Current
I. Squirrel-cage induction generator ▪ Dominated by the 𝑿′of the machine
II. Squirrel-cage wound rotor induction generator with external rotor resistance
▪ Similar to Type I machines but impedance 𝒁 will change due to external rotor
III. Doubly-fed asynchronous generator
▪ Crowbar resistance can dictate the AC fault contribution
IV. Full power converter generator ▪ Represented as a current source
V. Synchronous generator mechanically connected through a torque converter
▪ Typical synchronous generator behavior during faults
Table 1. Nonsynchronous Generation Types and Primary Sources of Fault Current
See White Paper for Detailed Modeling Information on Nonsynchronous Generators
RELIABILITY | ACCOUNTABILITY6
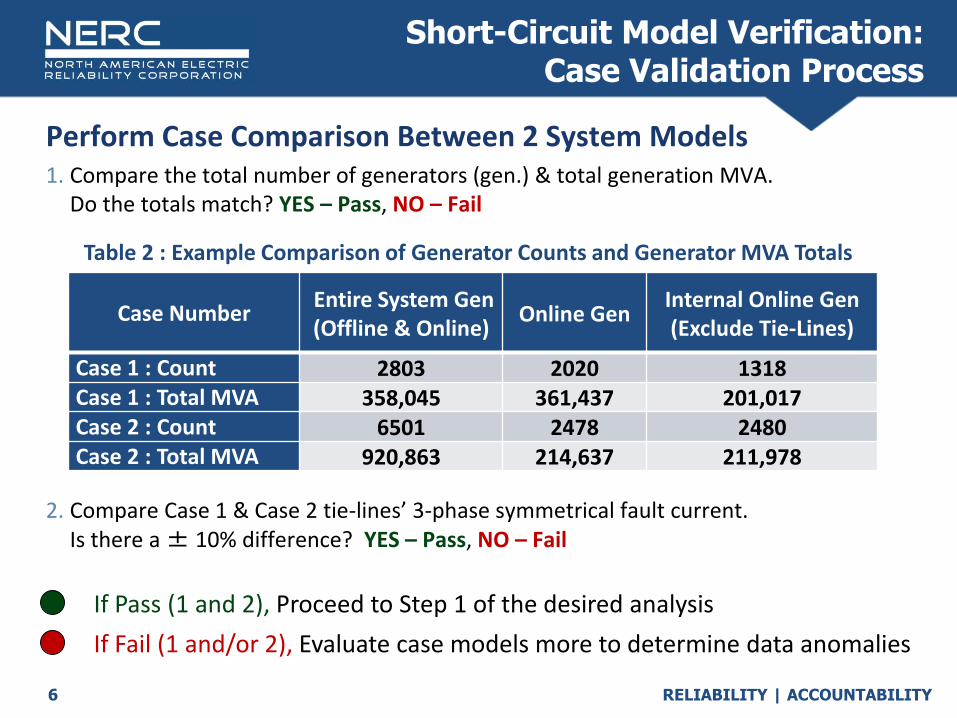
Perform Case Comparison Between 2 System Models 1. Compare the total number of generators (gen.) & total generation MVA.
Do the totals match? YES – Pass, NO – Fail
Short-Circuit Model Verification: Case Validation Process
Case NumberEntire System Gen (Offline & Online)
Online GenInternal Online Gen(Exclude Tie-Lines)
Case 1 : Count 2803 2020 1318Case 1 : Total MVA 358,045 361,437 201,017Case 2 : Count 6501 2478 2480Case 2 : Total MVA 920,863 214,637 211,978
2. Compare Case 1 & Case 2 tie-lines’ 3-phase symmetrical fault current. Is there a ± 10% difference? YES – Pass, NO – Fail
▪ If Pass (1 and 2), Proceed to Step 1 of the desired analysis
▪ If Fail (1 and/or 2), Evaluate case models more to determine data anomalies
Table 2 : Example Comparison of Generator Counts and Generator MVA Totals
RELIABILITY | ACCOUNTABILITY7
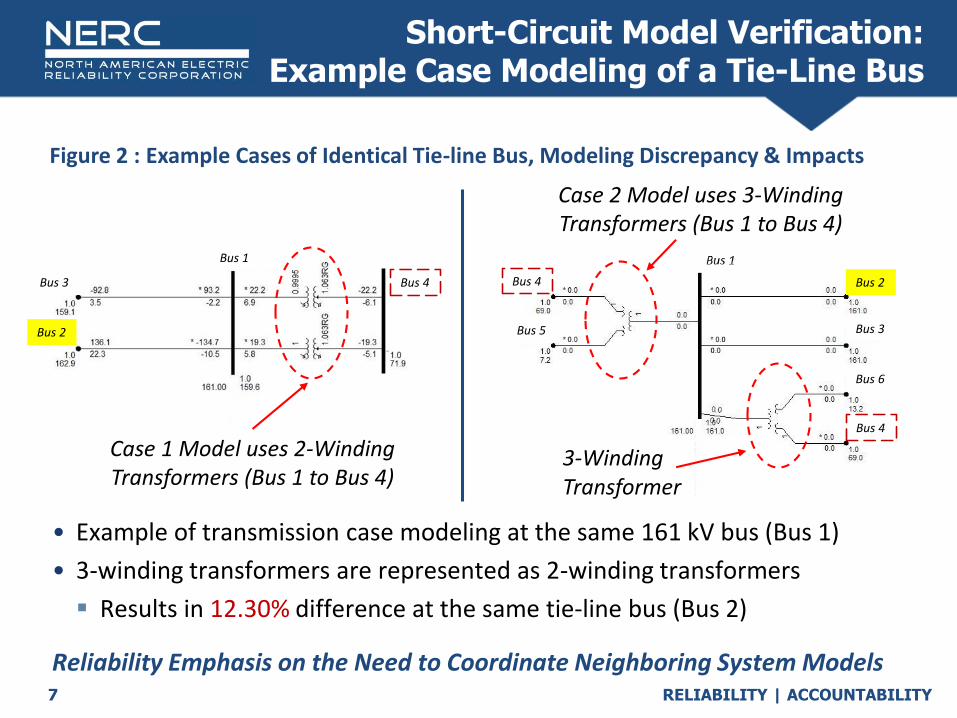
Short-Circuit Model Verification: Example Case Modeling of a Tie-Line Bus
• Example of transmission case modeling at the same 161 kV bus (Bus 1)
• 3-winding transformers are represented as 2-winding transformers
▪ Results in 12.30% difference at the same tie-line bus (Bus 2)
Reliability Emphasis on the Need to Coordinate Neighboring System Models
Figure 2 : Example Cases of Identical Tie-line Bus, Modeling Discrepancy & Impacts
Case 2 Model uses 3-Winding Transformers (Bus 1 to Bus 4)
Bus 1
Bus 2
Bus 3 Bus 2
Bus 3
Bus 4
Bus 5
Bus 6
Bus 4Bus 4
Case 1 Model uses 2-Winding Transformers (Bus 1 to Bus 4)
3-Winding Transformer
RELIABILITY | ACCOUNTABILITY8
Short-Circuit Model Verification: Network Reduction/Equivalent Network
• Purpose: To minimize the difference (± 10%) in fault current observed at study buses by performing network reduction using three buses away criteria▪ Replace a portion of the network with an equivalent circuit that contains
boundary buses with equivalent lines, generators, loads, and shunts from the external system which has been eliminated.
▪ Equivalent circuit is created such that the current-voltage relationship at the load of the original network is unchanged.
o See White Paper for recommendations on how to perform network equivalents at a tie bus and Sub-transmission bus (230 kV> bus kV > 100 kV)
• Different software platforms use different algorithms to create network equivalents
RELIABILITY | ACCOUNTABILITY9
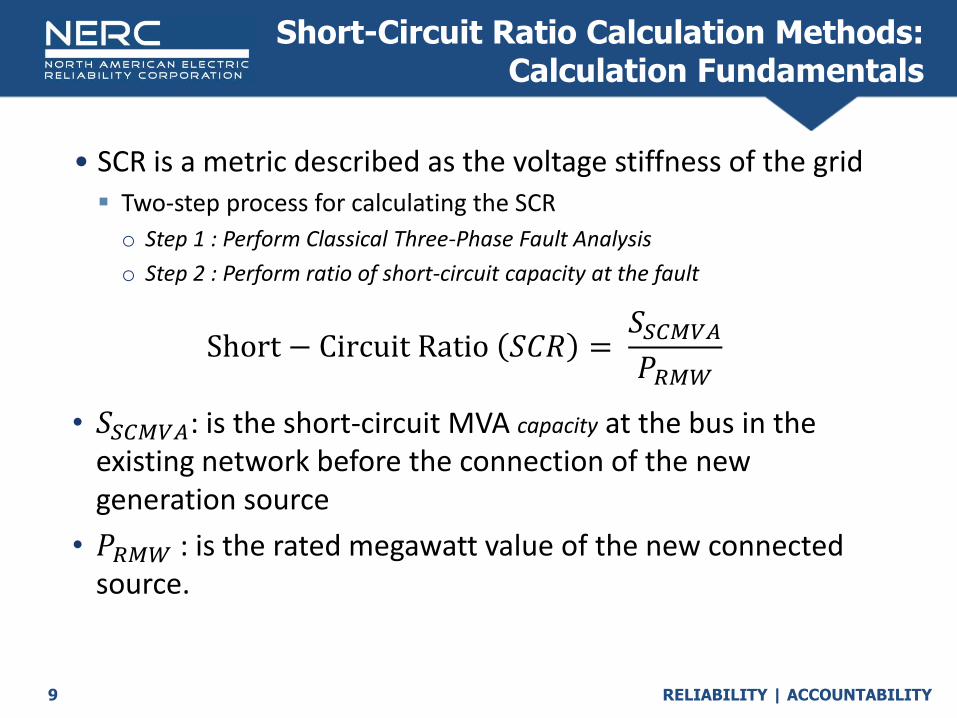
Short-Circuit Ratio Calculation Methods: Calculation Fundamentals
• 𝑆𝑆𝐶𝑀𝑉𝐴: is the short-circuit MVA capacity at the bus in the existing network before the connection of the new generation source
• 𝑃𝑅𝑀𝑊 : is the rated megawatt value of the new connected source.
Short − Circuit Ratio 𝑆𝐶𝑅 =𝑆𝑆𝐶𝑀𝑉𝐴
𝑃𝑅𝑀𝑊
• SCR is a metric described as the voltage stiffness of the grid▪ Two-step process for calculating the SCR
o Step 1 : Perform Classical Three-Phase Fault Analysis
o Step 2 : Perform ratio of short-circuit capacity at the fault

RELIABILITY | ACCOUNTABILITY10
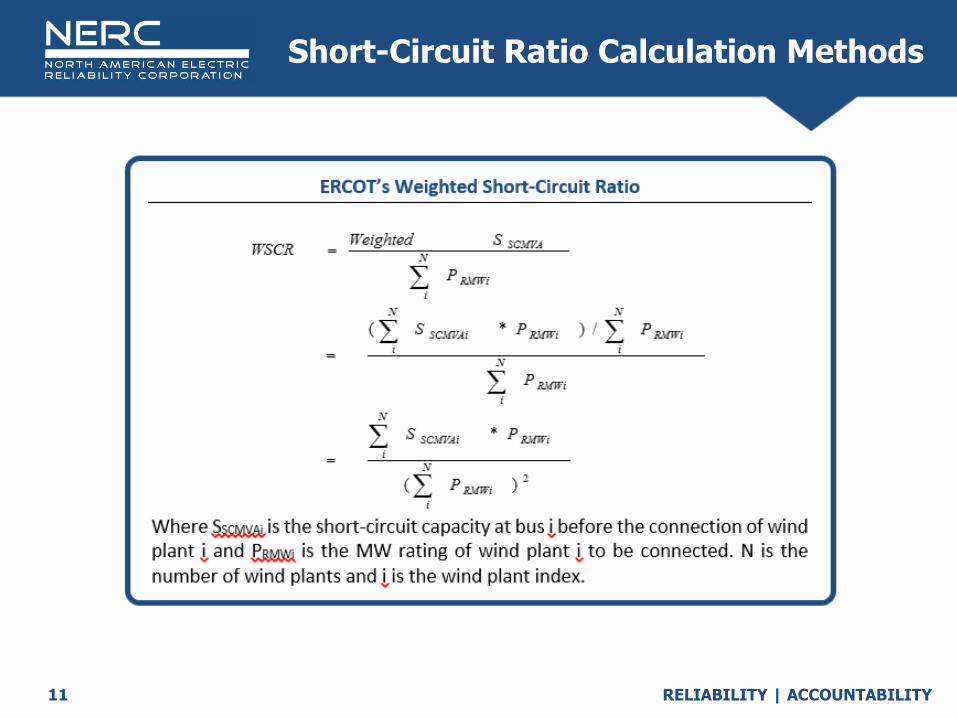
Short-Circuit Ratio Calculation Methods
RELIABILITY | ACCOUNTABILITY11
Short-Circuit Ratio Calculation Methods
RELIABILITY | ACCOUNTABILITY12
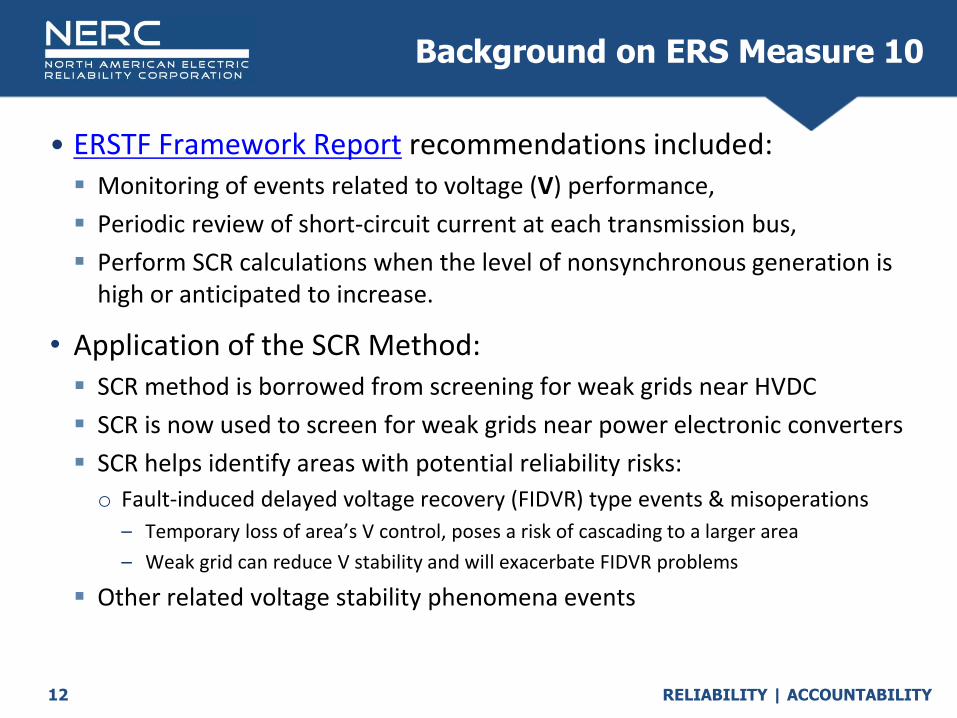
• ERSTF Framework Report recommendations included: ▪ Monitoring of events related to voltage (V) performance,
▪ Periodic review of short-circuit current at each transmission bus,
▪ Perform SCR calculations when the level of nonsynchronous generation is high or anticipated to increase.
• Application of the SCR Method:▪ SCR method is borrowed from screening for weak grids near HVDC
▪ SCR is now used to screen for weak grids near power electronic converters
▪ SCR helps identify areas with potential reliability risks:
o Fault-induced delayed voltage recovery (FIDVR) type events & misoperations
– Temporary loss of area’s V control, poses a risk of cascading to a larger area
– Weak grid can reduce V stability and will exacerbate FIDVR problems
▪ Other related voltage stability phenomena events
Background on ERS Measure 10
RELIABILITY | ACCOUNTABILITY13
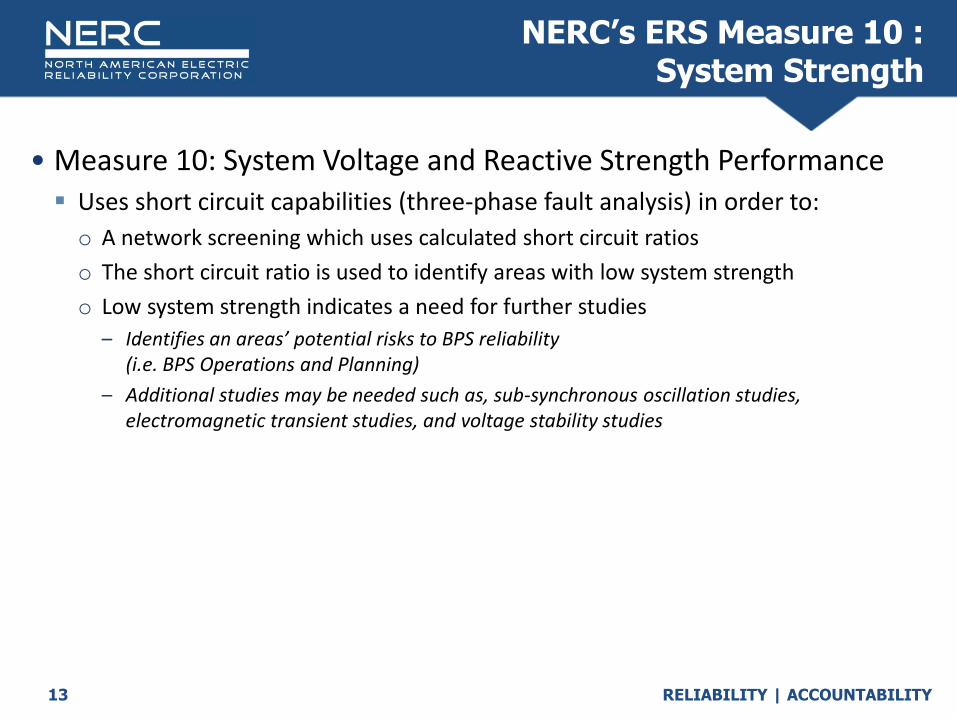
NERC’s ERS Measure 10 : System Strength
• Measure 10: System Voltage and Reactive Strength Performance▪ Uses short circuit capabilities (three-phase fault analysis) in order to:
o A network screening which uses calculated short circuit ratios
o The short circuit ratio is used to identify areas with low system strength
o Low system strength indicates a need for further studies
– Identifies an areas’ potential risks to BPS reliability (i.e. BPS Operations and Planning)
– Additional studies may be needed such as, sub-synchronous oscillation studies, electromagnetic transient studies, and voltage stability studies
RELIABILITY | ACCOUNTABILITY14
Recommendations
• Benchmark planning cases against operations dynamic events or steady-state operating conditions
• Where possible, create criteria to compare common characteristics between various cases, such as:▪ total current at faulted tie-lines buses between neighboring cases,
▪ Count of network components and the network’s physical characteristics (e.g. line impedances, total generation MVA, etc.),
▪ generating resources availability (lengthy maintenance outages, mothballed, retirements and planned additions),
▪ transformer type, configuration (winding representation) and impedances
• When partitioning an area, the network equivalent should be done three buses away from the short-circuit bus under study
RELIABILITY | ACCOUNTABILITY15