Embed Size (px)
Citation preview

Short- and long-term impacts of PIT
tags on hatchery Fall and Spring
Chinook salmon
Curtis Knudsen1, Steve Schroder2, Mark Johnston3,
Todd Pearson2 and Dave Fast3
1Oncorh Consulting
2Washington Department of Fish and Wildlife
3Yakama Indian Nation

In-river Survival of PIT
Tagging Hatchery Fall Chinook
________________________________
Effects of PIT Tags on Smolt-to-Adult
Recruit Survival, Growth, and Behavior of
Hatchery Spring Chinook Salmon

In-river Survival of PIT
Tagging Bingham Creek
Hatchery Fall Chinook
Curtis Knudsen and Steve Schroder (WDFW)
Acknowledgments
• Debbie Frost (NOAA/NMFS) PIT tagging
• Earl Prentice (NOAA/NMFS) provided PIT
tags
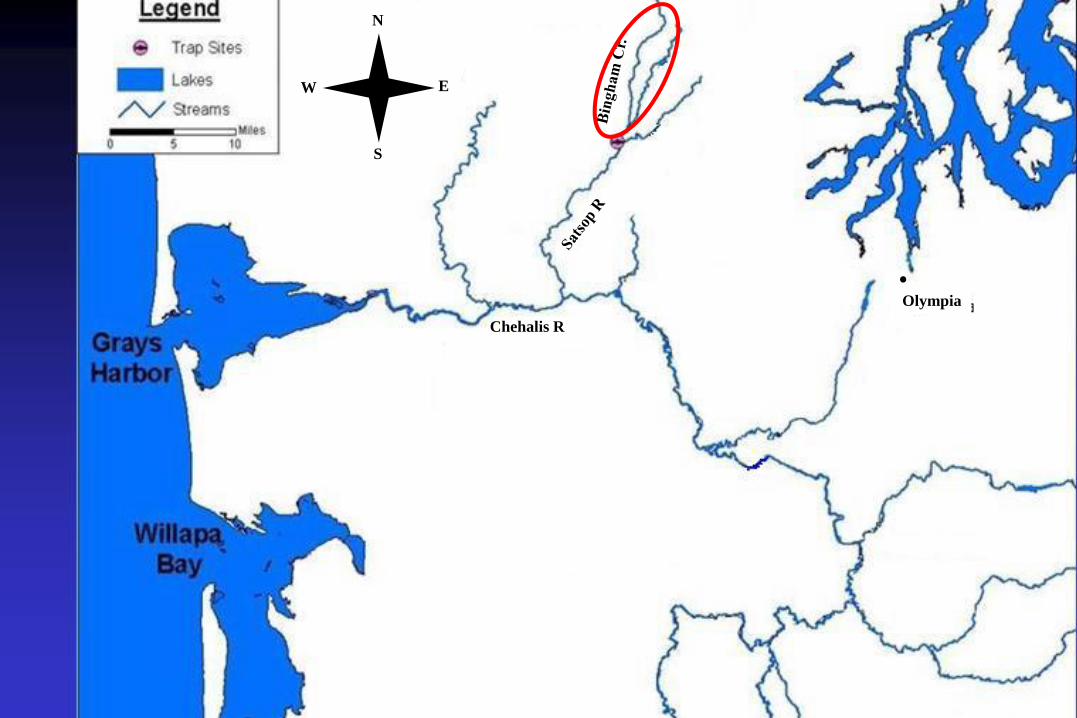
Olympia
Chehalis R
N
W E
S

Purpose: Compare PIT tagged fish survival rates to
Control group survival rates
– PIT tagged group
– Two control groups
• Unhandled Control
– During tagged left undisturbed
• Handled Control
– Netted, transferred, and anesthetized without being
marked
Two releases of each - a total of 6 groups
released
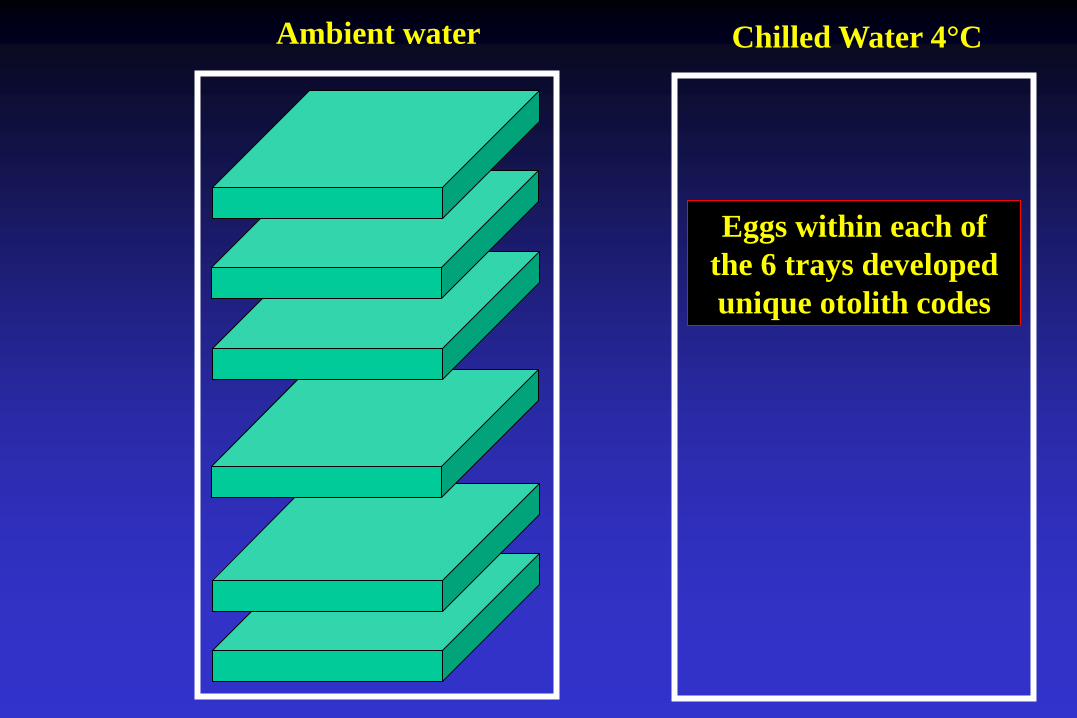
Ambient water
Eggs within each of
the 6 trays developed
unique otolith codes
Chilled Water 4°C
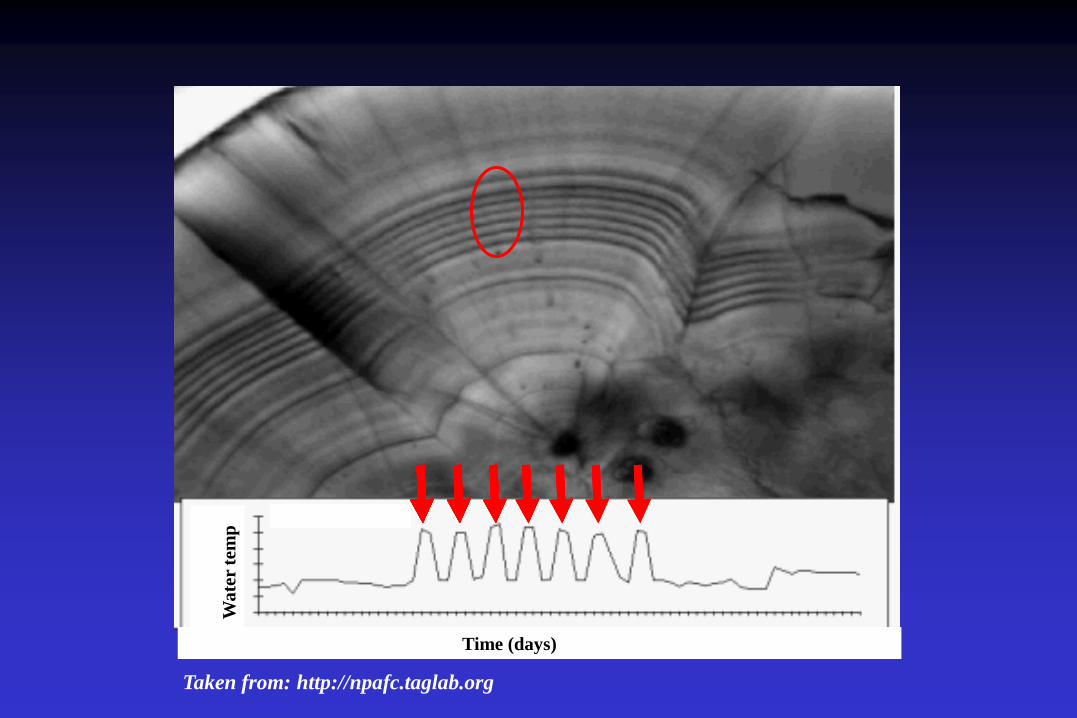
Taken from: http://npafc.taglab.org
Wa
ter
tem
p
Time (days)
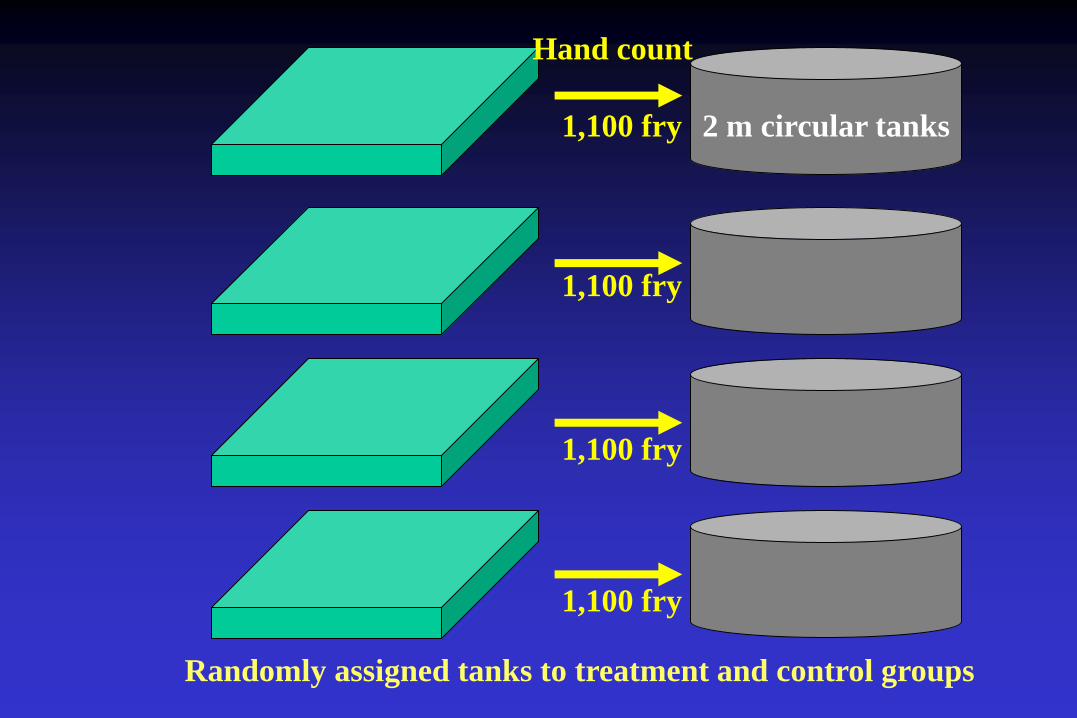
1,100 fry
1,100 fry
1,100 fry
1,100 fry
Hand count
2 m circular tanks
Randomly assigned tanks to treatment and control groups
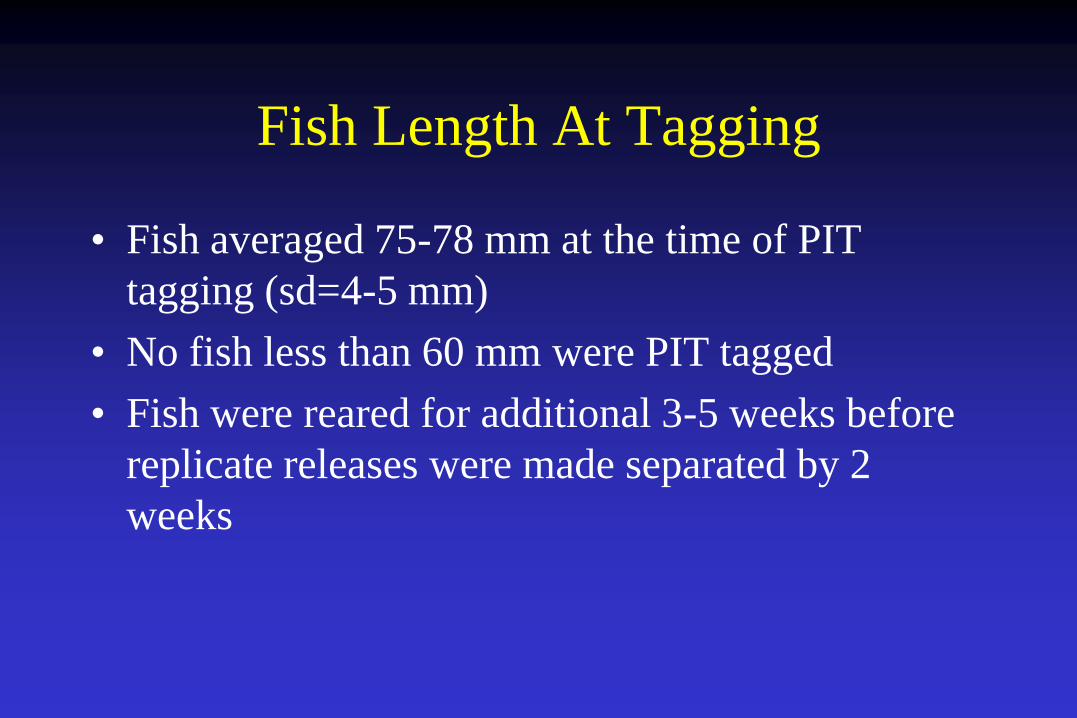
Fish Length At Tagging
• Fish averaged 75-78 mm at the time of PIT
tagging (sd=4-5 mm)
• No fish less than 60 mm were PIT tagged
• Fish were reared for additional 3-5 weeks before
replicate releases were made separated by 2
weeks
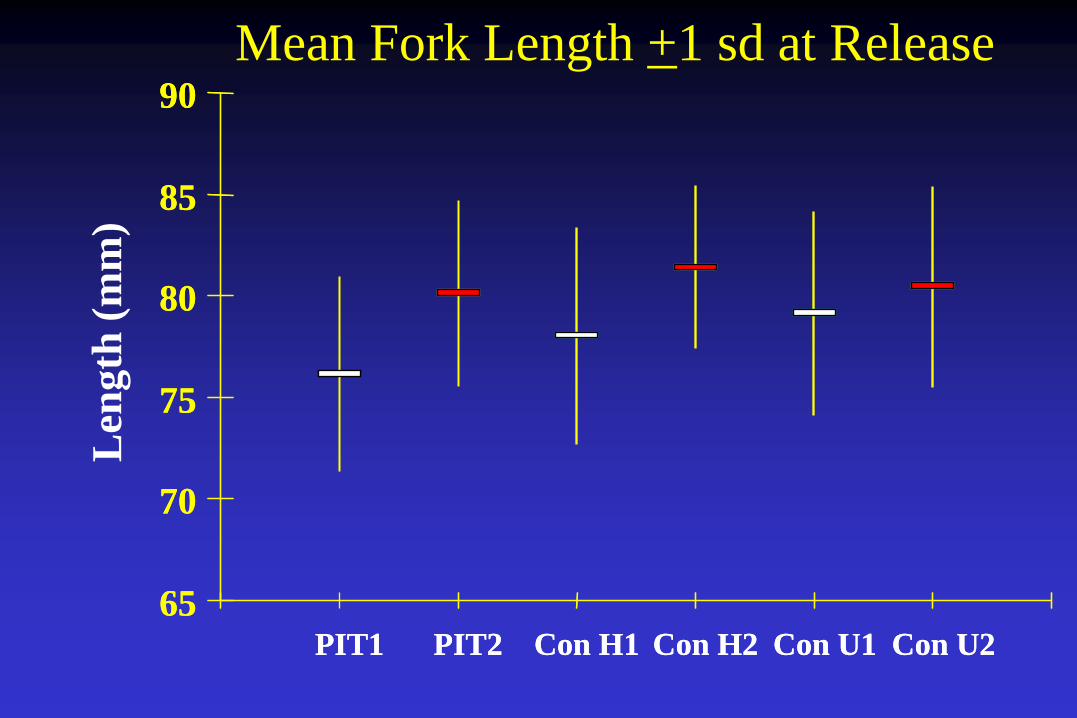
Mean Fork Length +1 sd at Release
65
70
75
80
85
90
PIT1 PIT2 Con H1 Con H2 Con U1 Con U2
65
70
75
80
85
90
PIT1 PIT2 Con H1 Con H2 Con U1 Con U2
Len
gth
(m
m)
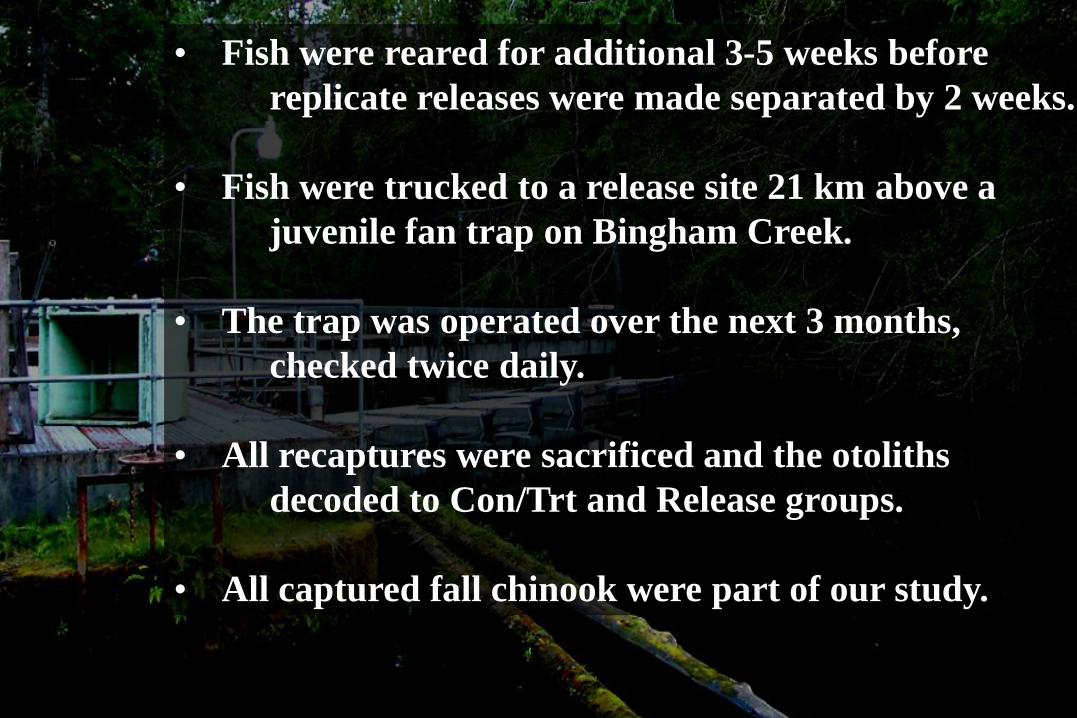
• Fish were reared for additional 3-5 weeks before
replicate releases were made separated by 2 weeks.
• Fish were trucked to a release site 21 km above a
juvenile fan trap on Bingham Creek.
• The trap was operated over the next 3 months,
checked twice daily.
• All recaptures were sacrificed and the otoliths
decoded to Con/Trt and Release groups.
• All captured fall chinook were part of our study.

Bingham Creek Fan Traps
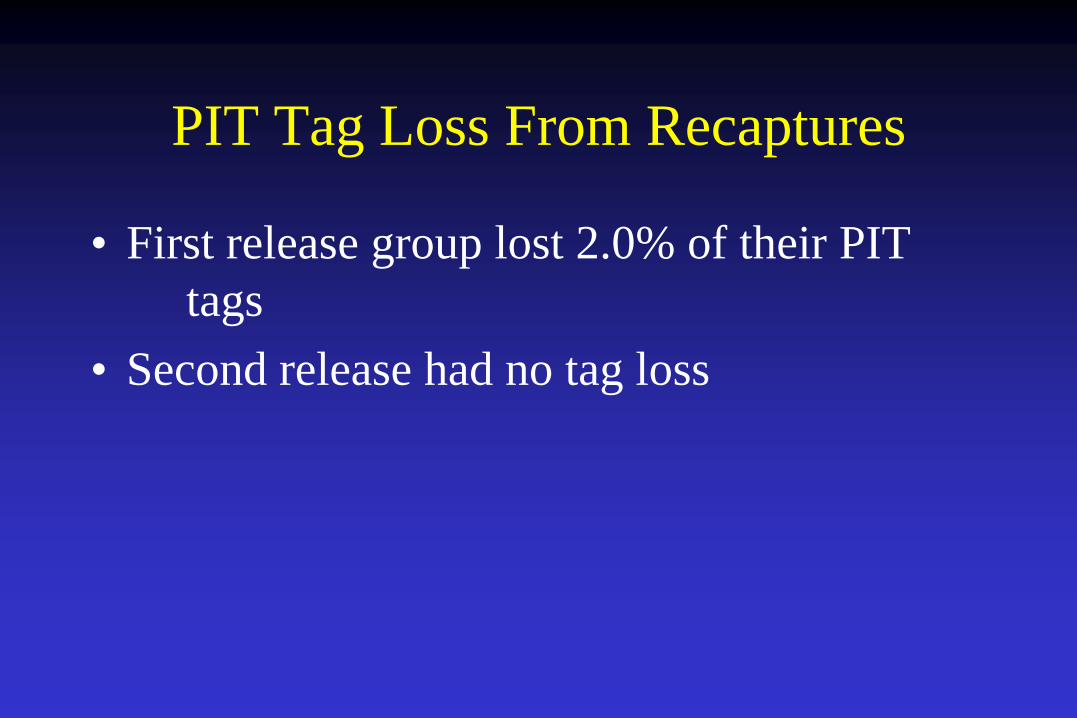
PIT Tag Loss From Recaptures
• First release group lost 2.0% of their PIT
tags
• Second release had no tag loss
% d
evia
tio
n f
rom
Co
n U
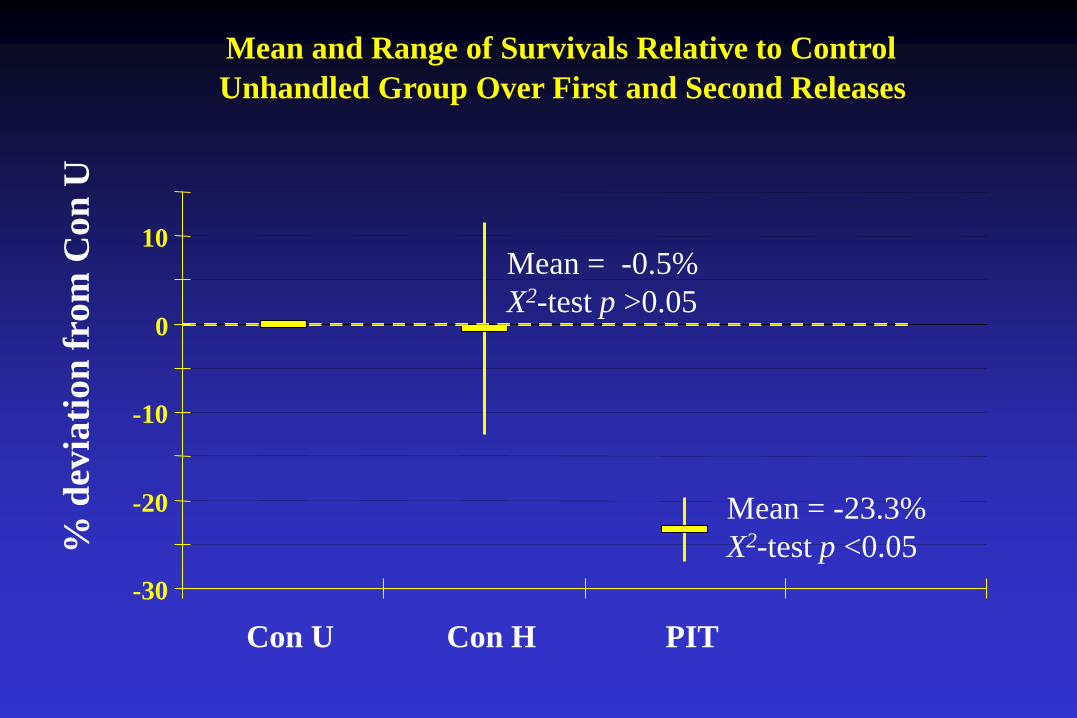
Mean = -23.3%
X2-test p <0.05
Mean and Range of Survivals Relative to Control
Unhandled Group Over First and Second Releases
-30
-20
-10
0
10
Con U Con H PIT
Mean = -0.5%
X2-test p >0.05

Conclusions
• Marked fish were held long enough to recovery from general handling stress (ConU=ConH post-release survival)
• PIT tag loss was <2% over the 90 days trapping
• PIT tagged groups showed significantly higher post-release mortality (mean 23%) relative to the Control Unhandled group over the 90 days of trapping
Effects of PIT Tags on Smolt-to-Adult
Recruit Survival, Growth,
and Behavior of Hatchery Spring
Chinook Salmon
Knudsen, C., M. Johnston, S. Schroder, W. Bosch, D. Fast and C.
Strom. 2009. Effects of Passive Integrated Transponder Tags on
Smolt-to-Adult Recruit Survival, Growth, and Behavior of
Hatchery Spring Chinook Salmon. NAJFM 29:658–669.

Acknowledgments
• Tagging of juveniles and recovery of adults was
by Yakama Nation personnel
• BPA for providing the funding through the YKFP
Monitoring and Evaluation Program
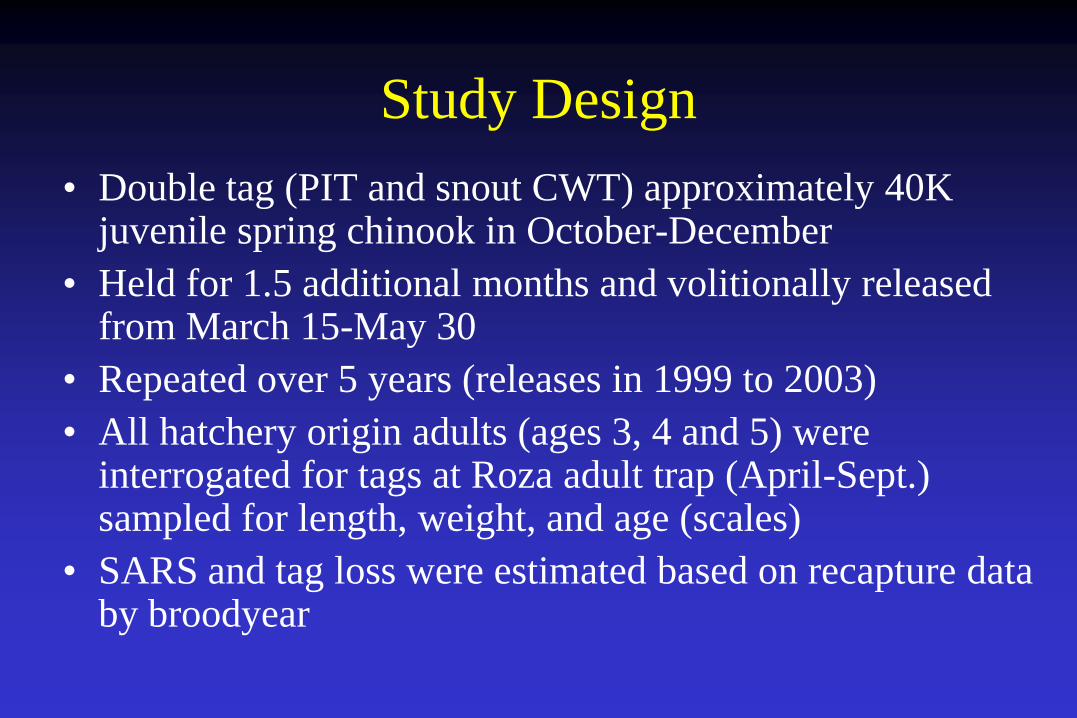
Study Design
• Double tag (PIT and snout CWT) approximately 40K juvenile spring chinook in October-December
• Held for 1.5 additional months and volitionally released from March 15-May 30
• Repeated over 5 years (releases in 1999 to 2003)
• All hatchery origin adults (ages 3, 4 and 5) were interrogated for tags at Roza adult trap (April-Sept.) sampled for length, weight, and age (scales)
• SARS and tag loss were estimated based on recapture data by broodyear
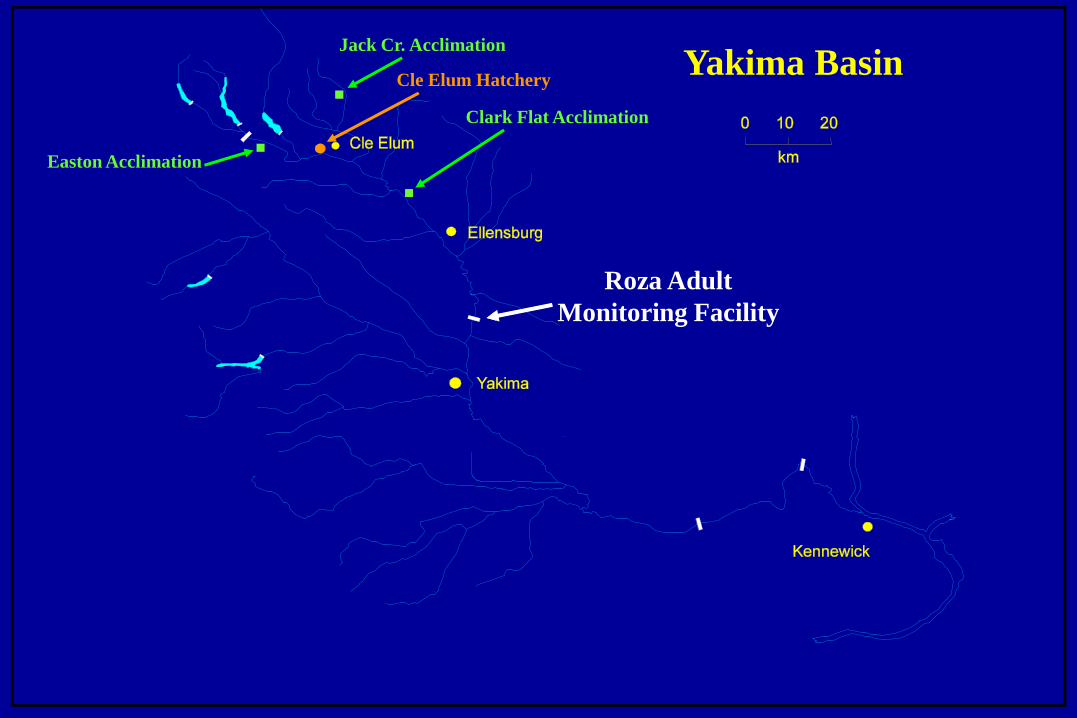
Easton Acclimation
Jack Cr. Acclimation
Clark Flat Acclimation
Cle Elum Hatchery
Roza Adult
Monitoring Facility
Yakima Basin
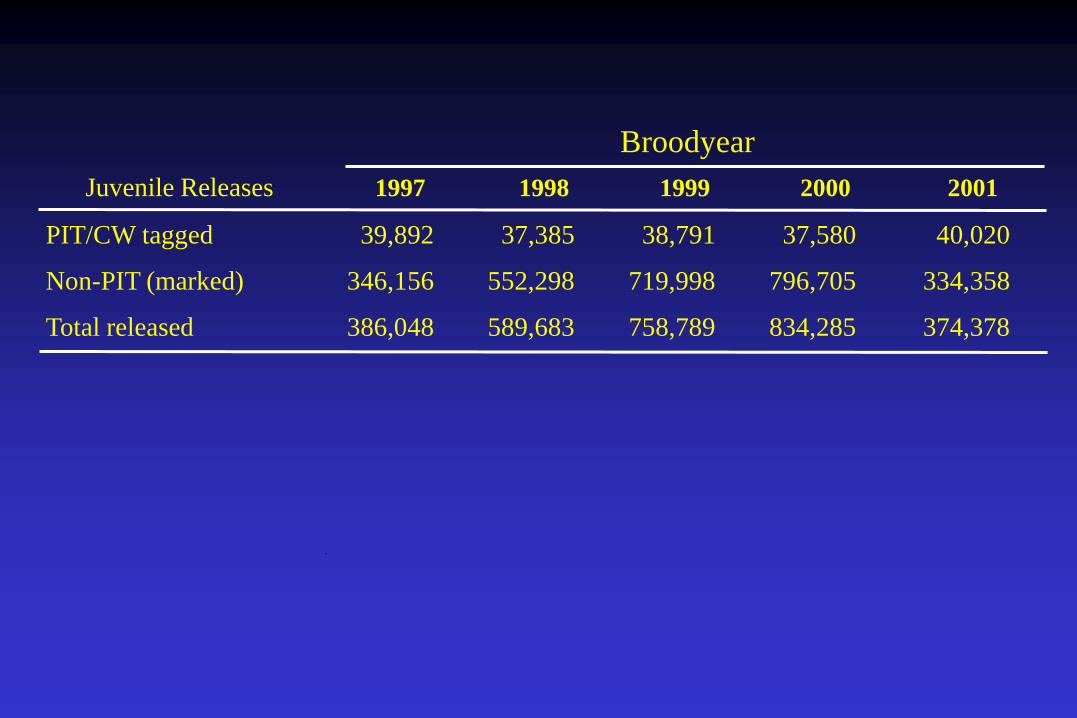
Broodyear
Juvenile Releases 1997 1998 1999 2000 2001
PIT/CW tagged 39,892 37,385 38,791 37,580 40,020
Non-PIT (marked) 346,156 552,298 719,998 796,705 334,358
Total released 386,048 589,683 758,789 834,285 374,378
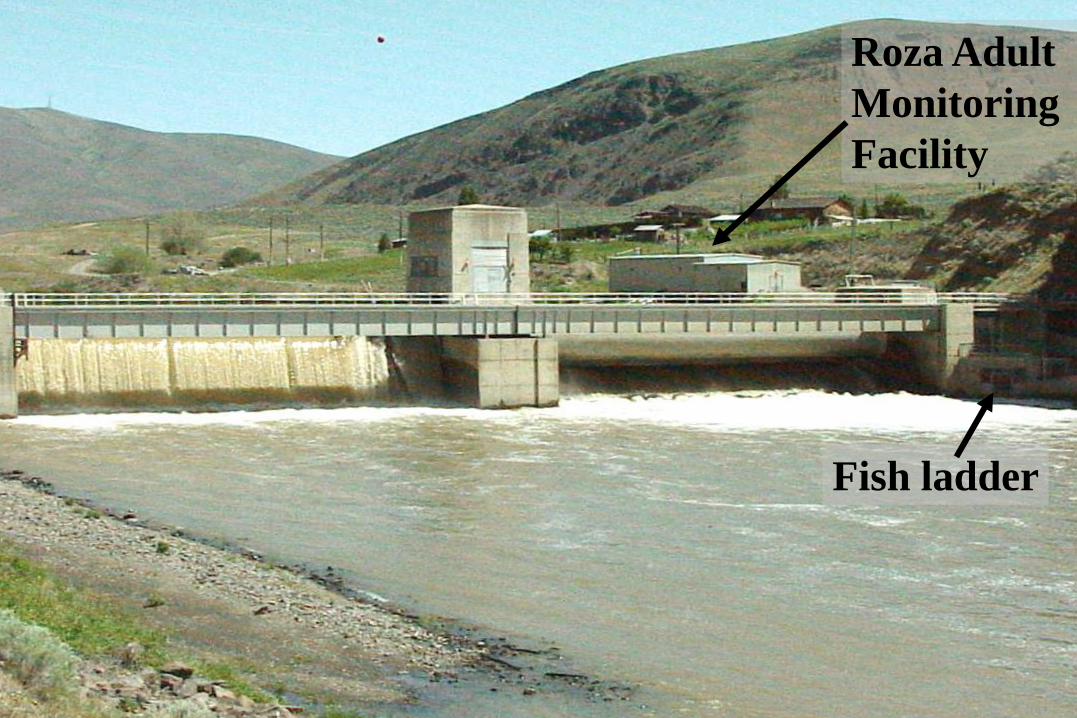
Fish ladder
Roza Adult
Monitoring
Facility
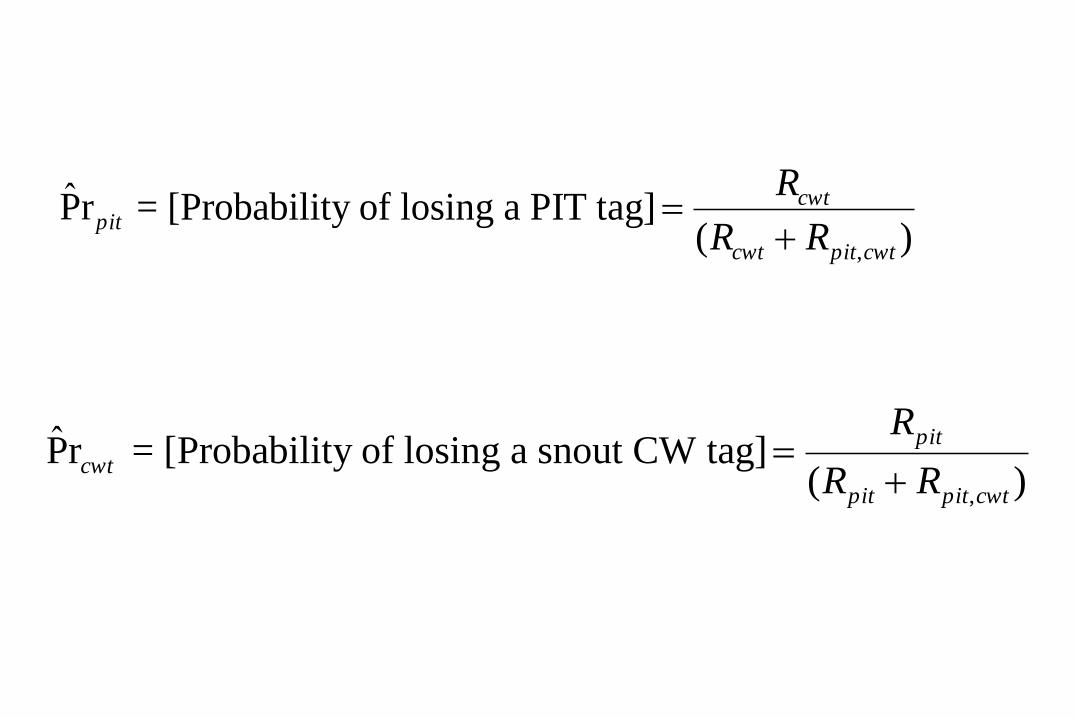
pitrP̂ = [Probability of losing a PIT tag])( ,cwtpitcwt
cwt
RR
R
1
cwtrP̂ = [Probability of losing a snout CW tag])( ,cwtpitpit
pit
RR
R
1
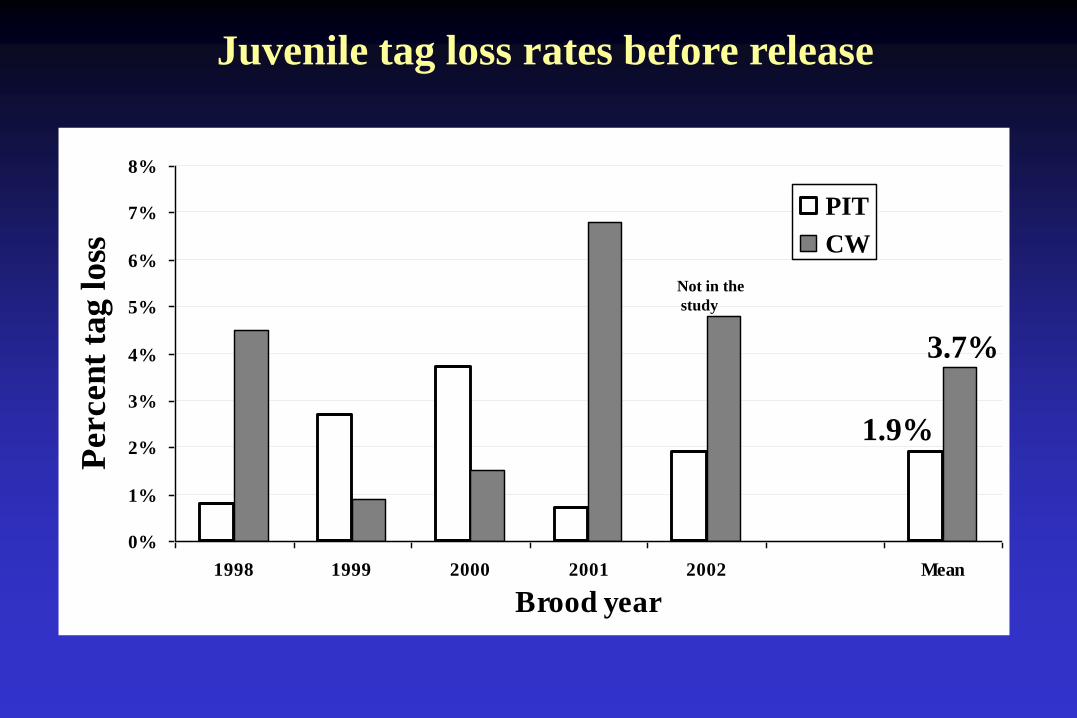
0%
1%
2%
3%
4%
5%
6%
7%
8%
1998 1999 2000 2001 2002 Mean
Brood year
Percen
t ta
g l
oss
PIT
CW
Juvenile tag loss rates before release
1.9%
3.7%
Not in the
study
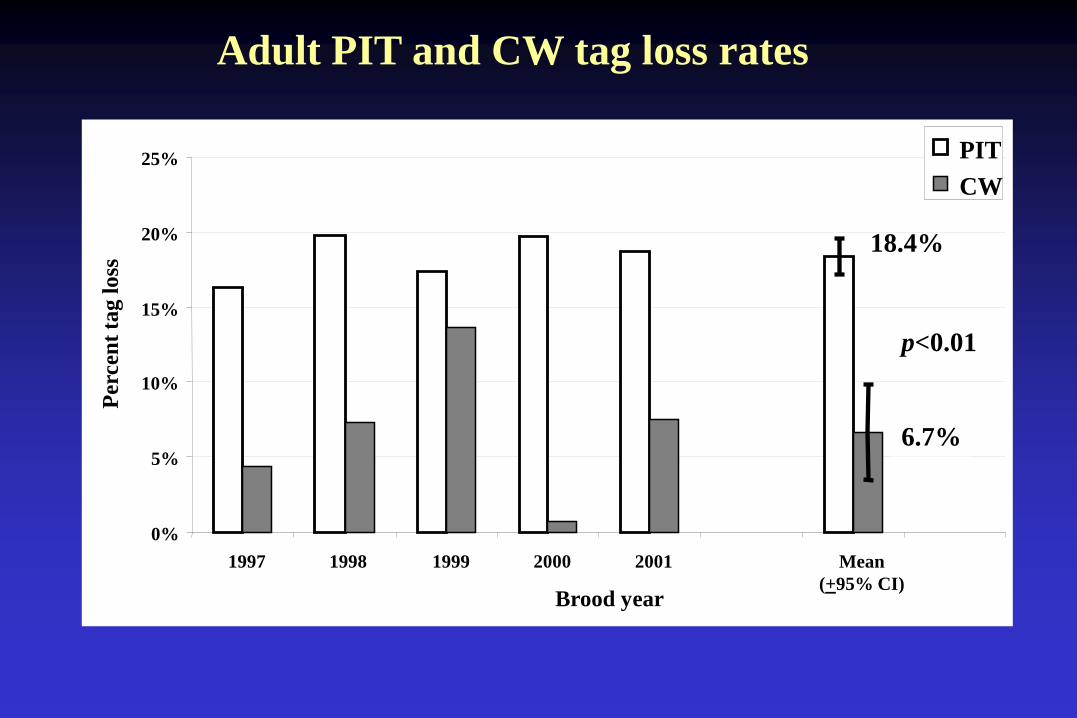
Adult PIT and CW tag loss rates
0%
5%
10%
15%
20%
25%
1997 1998 1999 2000 2001 Mean
(+95% CI)Brood year
Per
cen
t ta
g l
oss
PIT
CW
6.7%
18.4%
p<0.01
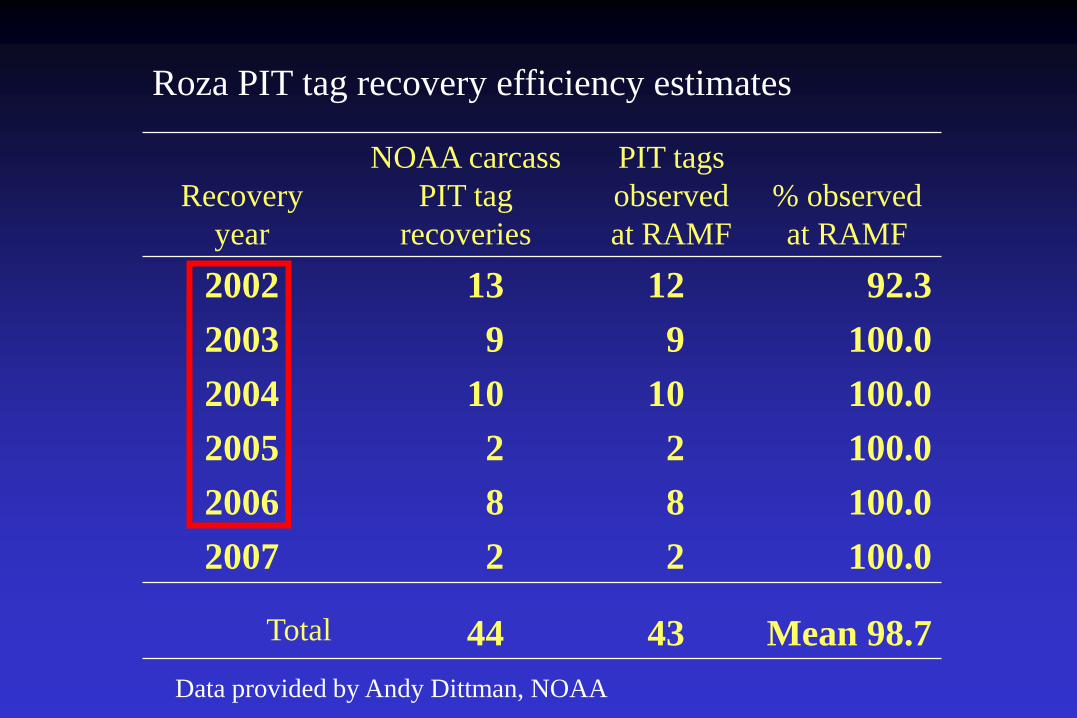
Roza PIT tag recovery efficiency estimates
Recovery
year
NOAA carcass
PIT tag
recoveries
PIT tags
observed
at RAMF
% observed
at RAMF
2002 13 12 92.3
2003 9 9 100.0
2004 10 10 100.0
2005 2 2 100.0
2006 8 8 100.0
2007 2 2 100.0
Total 44 43 Mean 98.7
Data provided by Andy Dittman, NOAA
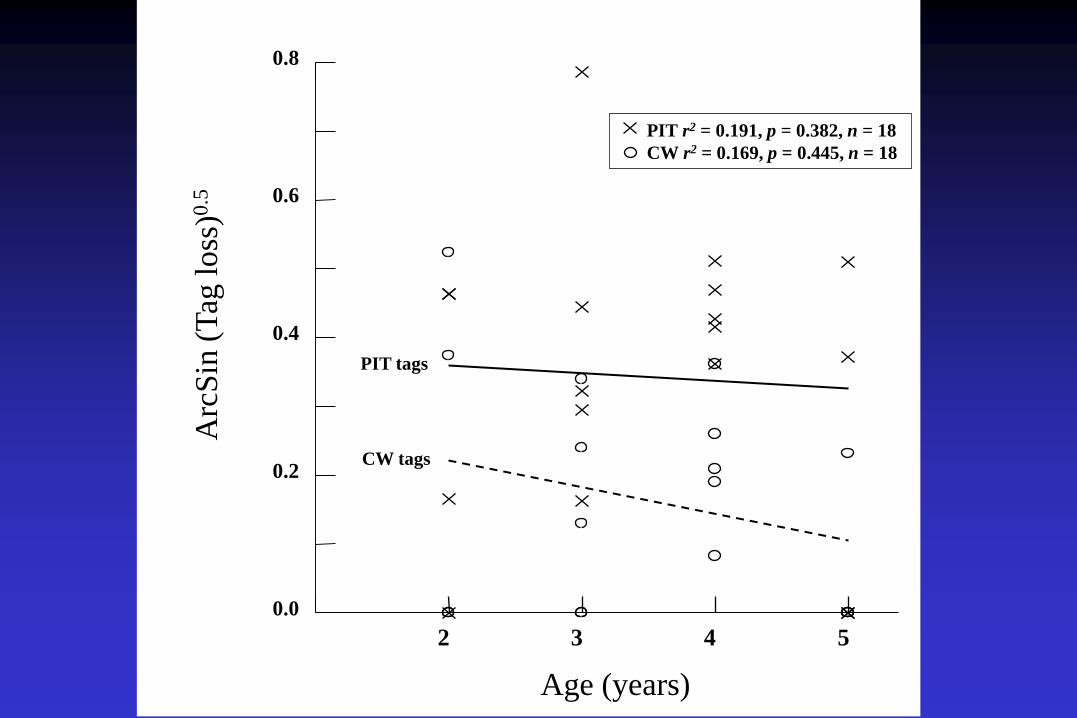
2 3 4 5
Age (years)
0.0
0.2
0.4
0.6
0.8
Arc
Sin
(T
ag l
oss
)0.5
PIT tags
CW tags
PIT r2 = 0.191, p = 0.382, n = 18
CW r2 = 0.169, p = 0.445, n = 18
1
,, ))((1
cwtpitpitcwtpitcwt
pitcwt
RRRR
RRc
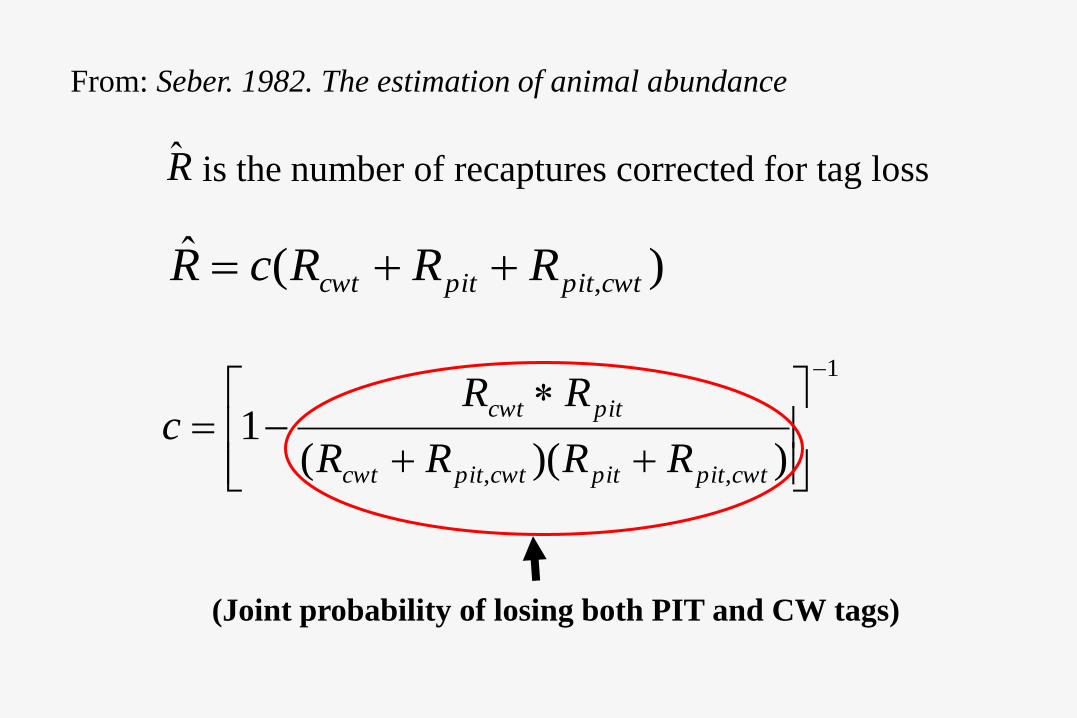
)(ˆ,cwtpitpitcwt RRRcR
From: Seber. 1982. The estimation of animal abundance
R̂ is the number of recaptures corrected for tag loss
(Joint probability of losing both PIT and CW tags)
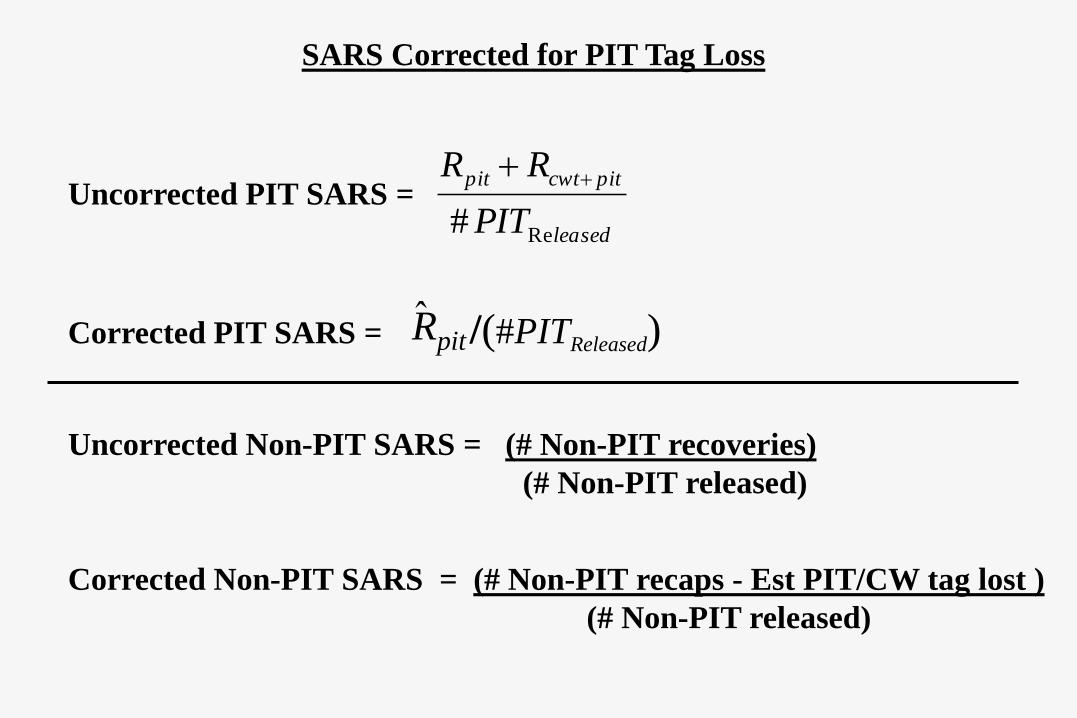
Uncorrected Non-PIT SARS = (# Non-PIT recoveries)
(# Non-PIT released)
Uncorrected PIT SARS =
Corrected Non-PIT SARS = (# Non-PIT recaps - Est PIT/CW tag lost )
(# Non-PIT released)
leased
pitcwtpit
PIT
RR
Re#
Corrected PIT SARS = /(#PITReleased)Rpitˆ
SARS Corrected for PIT Tag Loss
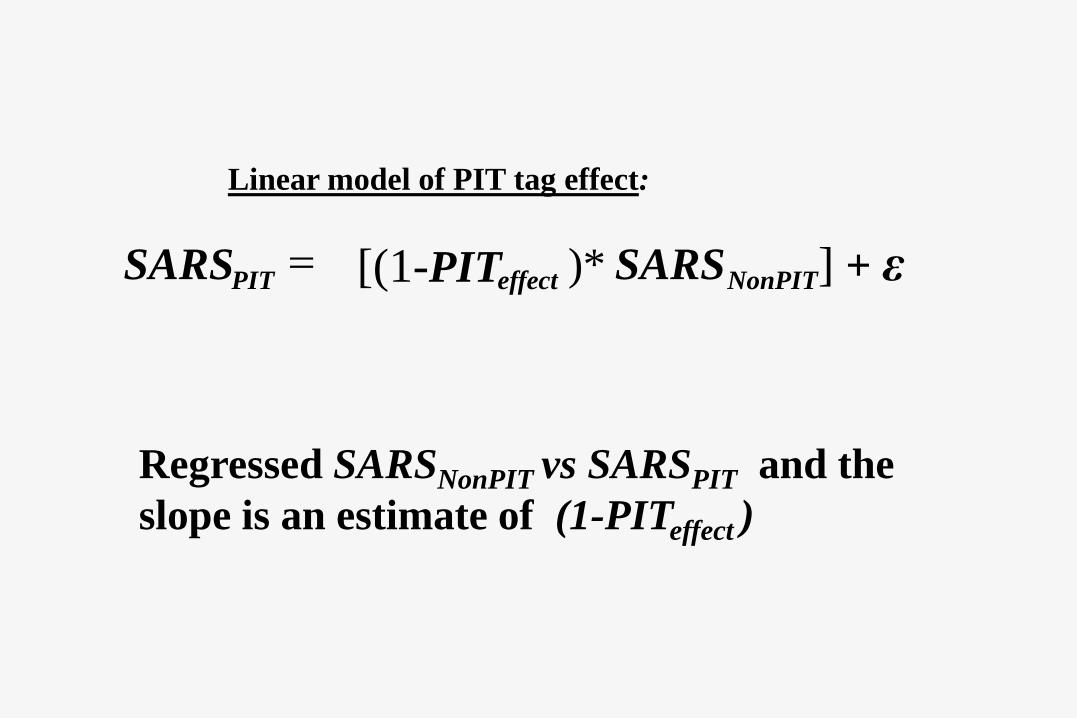
NonPITeffect SARS[(1-PIT )* ] + ε
Linear model of PIT tag effect:
PITSARS
Regressed SARSNonPIT vs SARSPIT and the
slope is an estimate of (1-PITeffect )
0.00
0.01
0.01
0.02
0.02
0.03
0.000 0.005 0.010 0.015 0.020 0.025
SARSNon-PIT
SA
RS
PIT
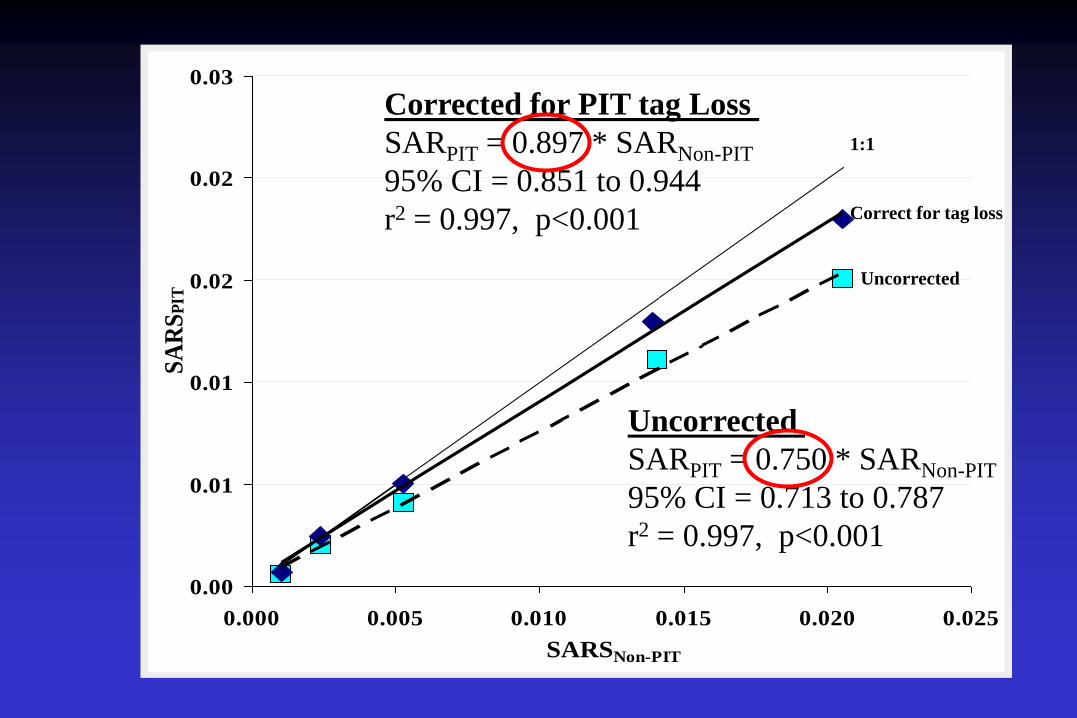
Corrected for PIT tag Loss
SARPIT = 0.897 * SARNon-PIT
95% CI = 0.851 to 0.944
r2 = 0.997, p<0.001
1:1
Correct for tag loss
Uncorrected
Uncorrected
SARPIT = 0.750 * SARNon-PIT
95% CI = 0.713 to 0.787
r2 = 0.997, p<0.001

• PIT Tag Loss + Mortality → 25% mean reduction in
adults SARS
• PIT tag mortality → 10% mean after correcting for
PIT tag loss
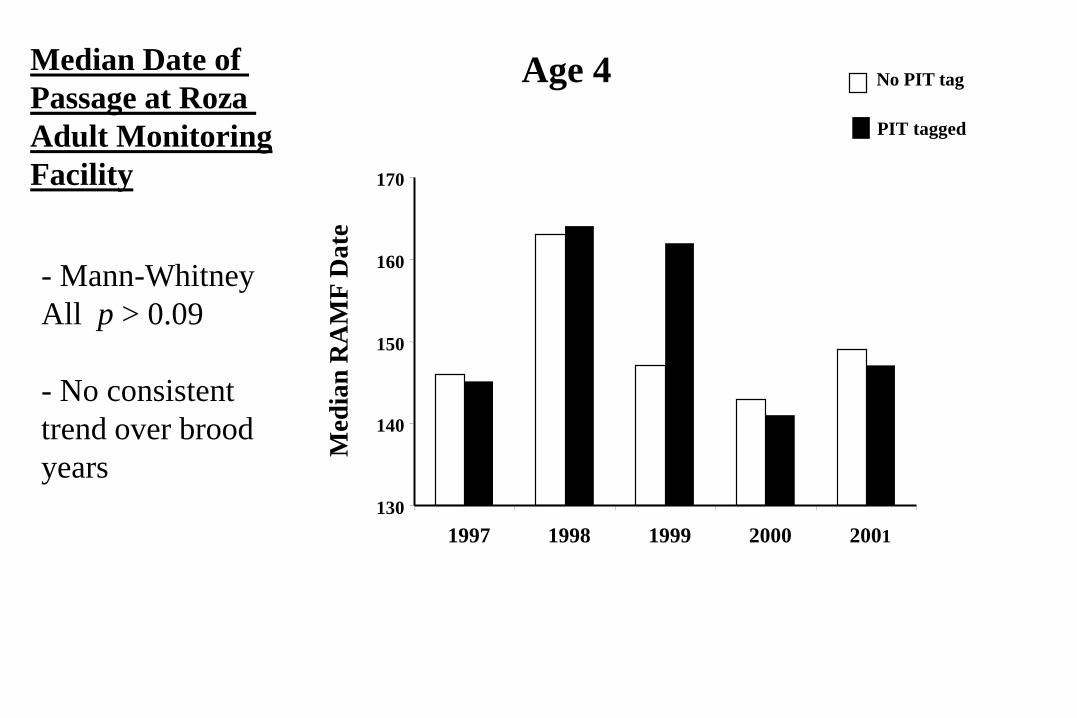
1997 1998 1999 2000 2001
130
140
150
160
170
Med
ian
RA
MF
Da
te
No PIT tag
PIT tagged
- Mann-Whitney
All p > 0.09
- No consistent
trend over brood
years
Median Date of
Passage at Roza
Adult Monitoring
Facility
Age 4
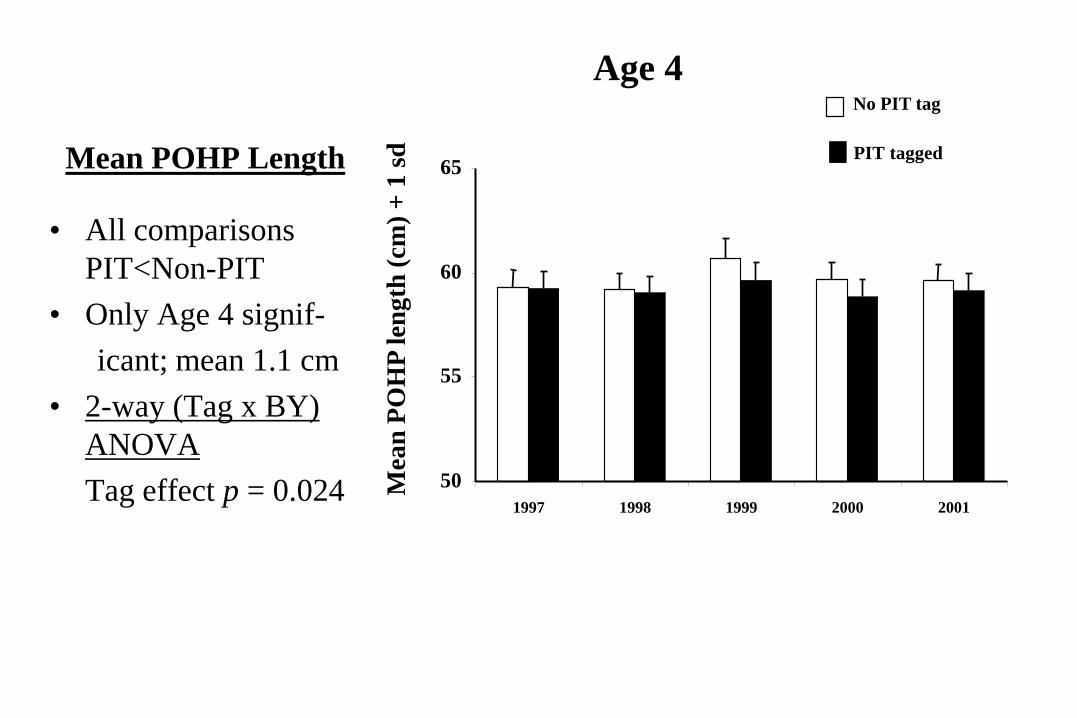
50
55
60
65
1997 1998 1999 2000 2001
No PIT tag
PIT tagged
Mea
n P
OH
P l
eng
th (
cm)
+ 1
sdMean POHP Length
• All comparisons
PIT<Non-PIT
• Only Age 4 signif-
icant; mean 1.1 cm
• 2-way (Tag x BY)
ANOVA
Tag effect p = 0.024
Age 4
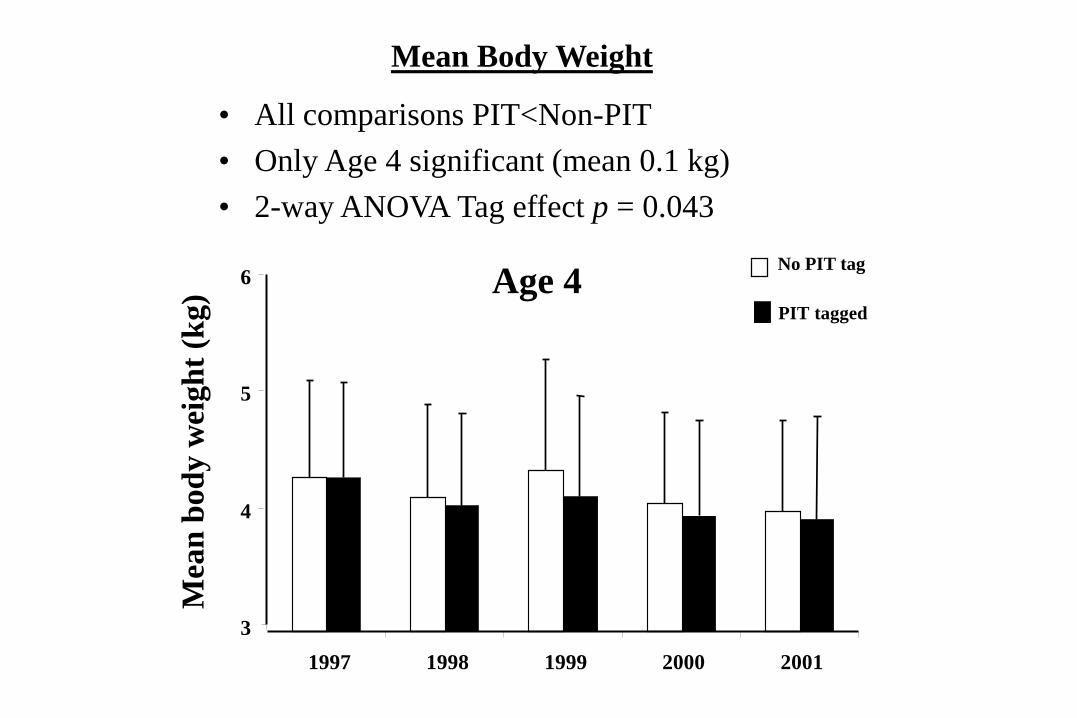
No PIT tag
PIT tagged
3
4
5
6
1997 1998 1999 2000 2001
Mea
n b
od
y w
eigh
t (k
g)
• All comparisons PIT<Non-PIT
• Only Age 4 significant (mean 0.1 kg)
• 2-way ANOVA Tag effect p = 0.043
Mean Body Weight
Age 4
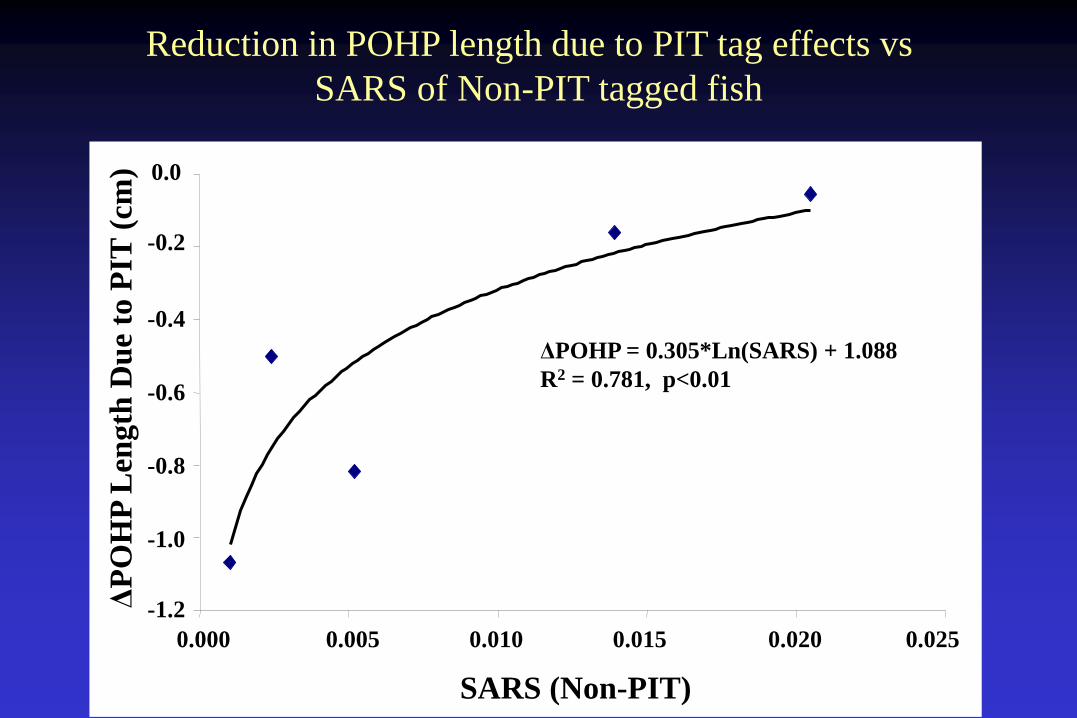
ΔPOHP = 0.305*Ln(SARS) + 1.088
R2 = 0.781, p<0.01
SARS (Non-PIT)
ΔP
OH
P L
ength
Du
e to
PIT
(cm
) 0.0
-0.2
-0.4
-0.6
-0.8
-1.0
-1.2
0.000 0.005 0.010 0.015 0.020 0.025
Reduction in POHP length due to PIT tag effects vs
SARS of Non-PIT tagged fish
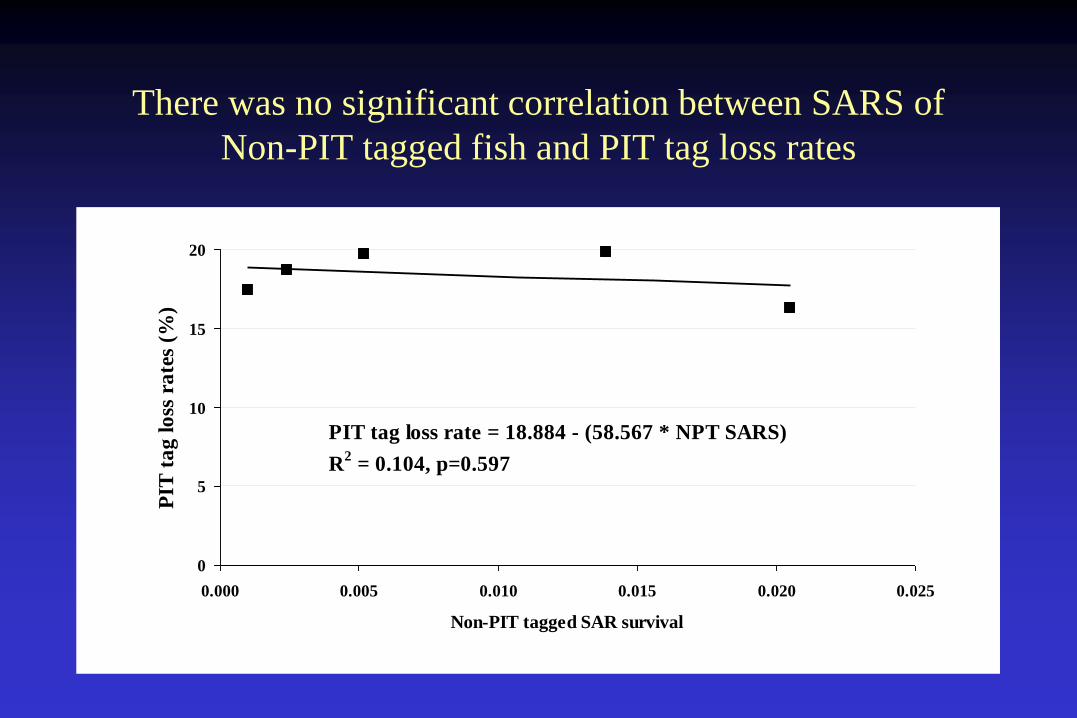
There was no significant correlation between SARS of
Non-PIT tagged fish and PIT tag loss rates
PIT tag loss rate = 18.884 - (58.567 * NPT SARS)
R2 = 0.104, p=0.597
0
5
10
15
20
0.000 0.005 0.010 0.015 0.020 0.025
Non-PIT tagged SAR survival
PIT
ta
g l
oss
ra
tes
(%)
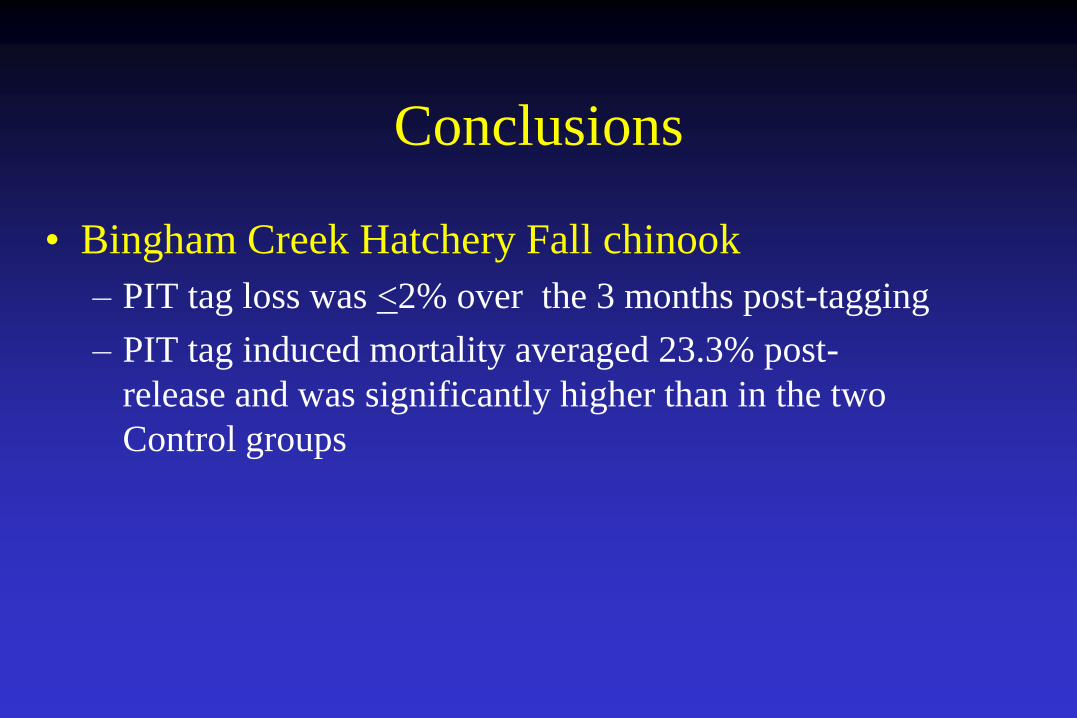
Conclusions
• Bingham Creek Hatchery Fall chinook
– PIT tag loss was <2% over the 3 months post-tagging
– PIT tag induced mortality averaged 23.3% post-
release and was significantly higher than in the two
Control groups
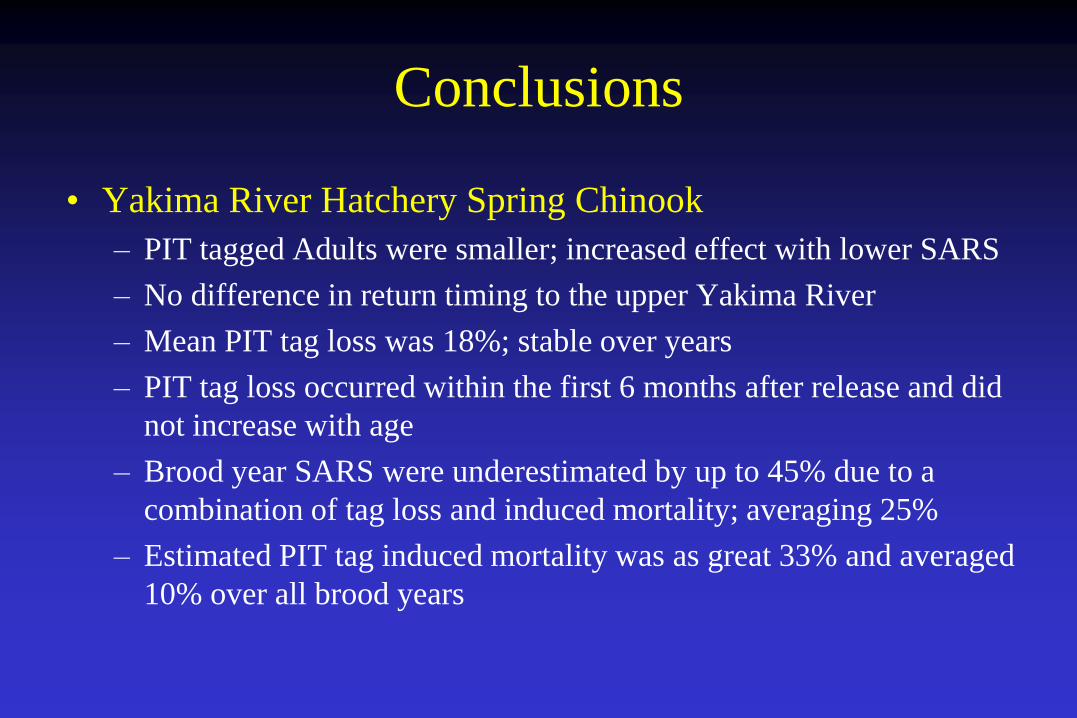
Conclusions
• Yakima River Hatchery Spring Chinook
– PIT tagged Adults were smaller; increased effect with lower SARS
– No difference in return timing to the upper Yakima River
– Mean PIT tag loss was 18%; stable over years
– PIT tag loss occurred within the first 6 months after release and did
not increase with age
– Brood year SARS were underestimated by up to 45% due to a
combination of tag loss and induced mortality; averaging 25%
– Estimated PIT tag induced mortality was as great 33% and averaged
10% over all brood years

Big Picture Points
• PIT tags can have a significant impact on study fish
• Different species, basins and ecological circumstances will result in different tag effects
• Design studies to include double-tagged fish to assess tag loss
• Include non-PIT tagged fish to assess PIT tag effects on survival

QUESTIONS?

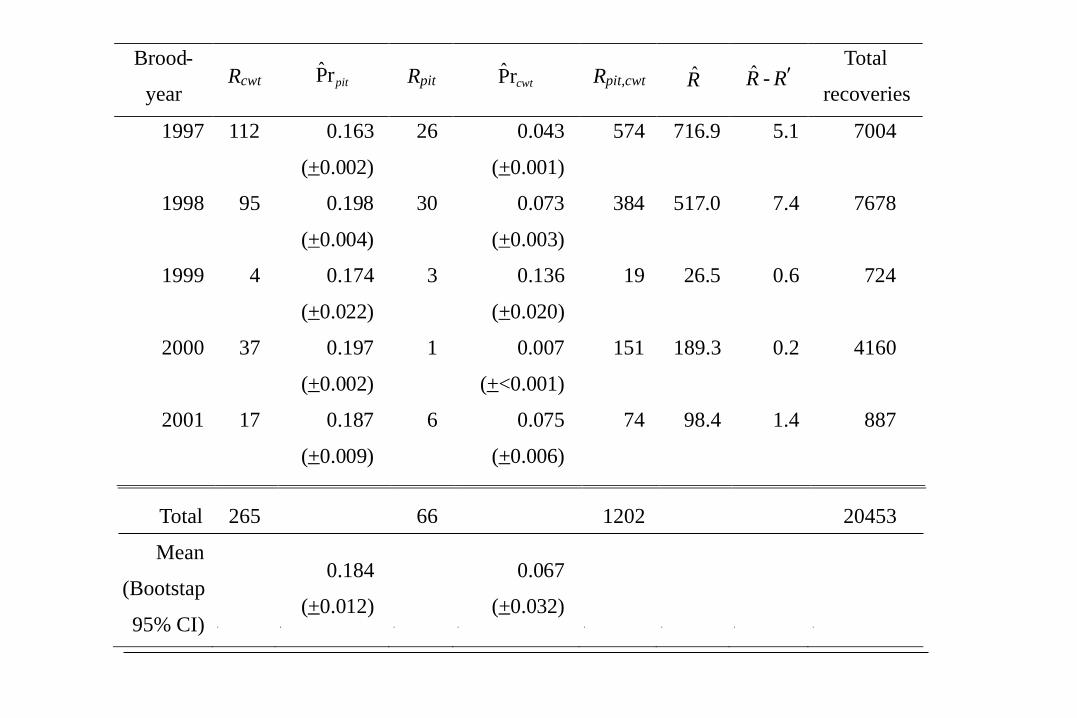
Brood-
yearRcwt pitrP̂ Rpit cwtrP̂ Rpit,cwt R̂ R̂ - R
Total
recoveries
1997 112 0.163
(+0.002)
26 0.043
(+0.001)
574 716.9 5.1 7004
1998 95 0.198
(+0.004)
30 0.073
(+0.003)
384 517.0 7.4 7678
1999 4 0.174
(+0.022)
3 0.136
(+0.020)
19 26.5 0.6 724
2000 37 0.197
(+0.002)
1 0.007
(+<0.001)
151 189.3 0.2 4160
2001 17 0.187
(+0.009)
6 0.075
(+0.006)
74 98.4 1.4 887
Total 265 66 1202 20453
Mean
(Bootstap
95% CI)
0.184
(+0.012)
0.067
(+0.032)