Embed Size (px)
Citation preview
1 1
2 2
Disclaimer
Certain statements in this release concerning our future growth prospects are forward-looking statements
within the meaning of applicable securities laws and regulations , and which involve a number of risks and
uncertainties,beyond the control of the Company, that could cause actual results to differ materially from those in such
forward-looking statements. The risks and uncertainties relating to these statements include, but are not limited to, risks
and uncertainties regarding fluctuations in earnings, our ability to manage growth, intense competition including those
factors which may affect our cost advantage, wage increases, our ability to attract and retain highly skilled professionals,
political instability, legal restrictions on raising capital or acquiring companies outside India, and unauthorized use of our
intellectual property and general economic conditions affecting our industry. Shopper’s Stop Ltd. may, from time to time,
make additional written and oral forward looking statements, including our reports to shareholders. The Company does
not undertake to update any forward-looking statement that may be made from time to time by or on behalf of the
company.The Company also expects the media to have access to all or parts of this release and the management’s
commentaries and opinions thereon, based on which the media may wish to comment and/or report on the same. Such
comments and/or reporting maybe made only after taking due clearance and approval from the Company’s authorized
personnel.The Company does not take any responsibility for any interpretations/ views/commentaries/reports which may
be published or expressed by any media agency,without the prior authorization of the Company’s authorized personnel.
3 3
New Stores
2 Departmental stores opened at Agra and Vadodara. 2 MAC Stand Alone stores at Amritsar and Bangalore opened
during this quarter taking the total to 31 stores
2 Clinique Stand Alone stores at Amritsar and Malad opened during this quarter taking the total to 18 stores.
Store Closure
1 store at Nucleus Mall , Pune closed during this quarter.
Loyalty Programme First Citizen members club has now reached 30.87 lacs
members. Their contribution to sales was 71%
Business Overview
3
4
AWARDS & RECOGNITION
Business World Magazine – Chose Shoppers Stop Ltd. As “India’s Most Respected Retail Company “ for the second time in succession.
“RETAIL SUPPLY CHAIN EXCELLENCE AWARD” at the 7th Express Logistics and Supply Chain Conclave.
IRF 2013 has awarded :-
The Most Admired Retailer - Department Store “ Shoppers Stop “
The Most Admired Retailer - Home and Office improvement “ Home Stop “
The Most Admired Retailer – Effective Technology Usage for our Solutions and
Technology Team.
4
5 5
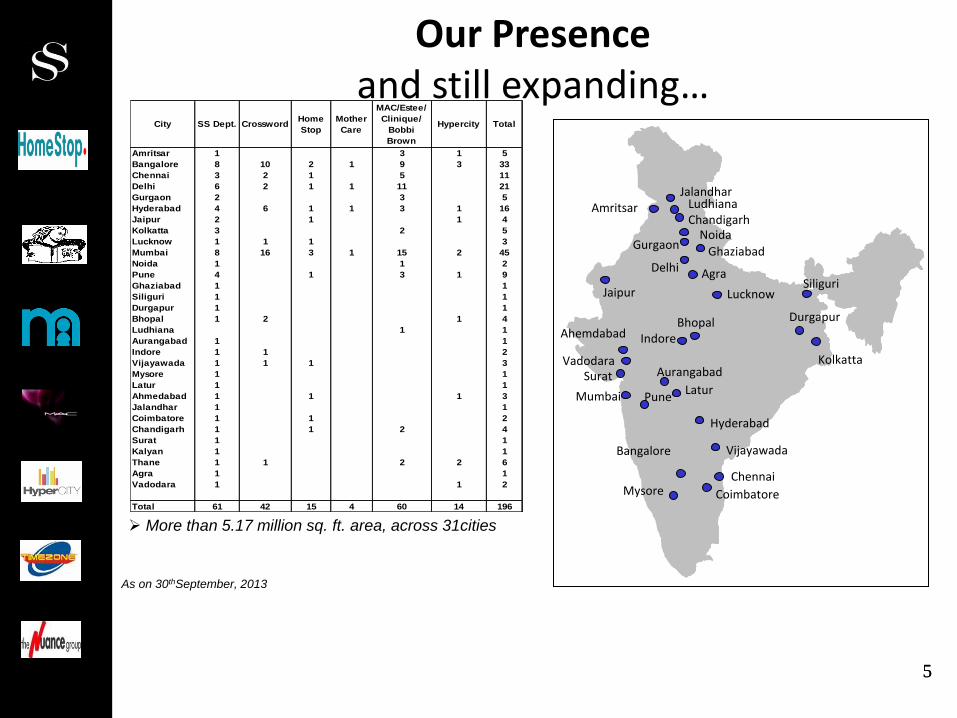
Our Presence and still expanding…
Kolkatta
Delhi
Jaipur
Mumbai
Hyderabad
Bangalore
Chennai
Gurgaon Ghaziabad
Pune
Noida
Amritsar
As on 30thSeptember, 2013
Bhopal
Aurangabad
Siliguri
Durgapur
Lucknow
Ludhiana Chandigarh
More than 5.17 million sq. ft. area, across 31cities
Indore
Vijayawada
Ahemdabad
Mysore
Latur
Jalandhar
Coimbatore
Surat
City SS Dept. CrosswordHome
Stop
Mother
Care
MAC/Estee/
Clinique/
Bobbi
Brown
Hypercity Total
Amritsar 1 3 1 5
Bangalore 8 10 2 1 9 3 33
Chennai 3 2 1 5 11
Delhi 6 2 1 1 11 21
Gurgaon 2 3 5
Hyderabad 4 6 1 1 3 1 16
Jaipur 2 1 1 4
Kolkatta 3 2 5
Lucknow 1 1 1 3
Mumbai 8 16 3 1 15 2 45
Noida 1 1 2
Pune 4 1 3 1 9
Ghaziabad 1 1
Siliguri 1 1
Durgapur 1 1
Bhopal 1 2 1 4
Ludhiana 1 1
Aurangabad 1 1
Indore 1 1 2
Vijayawada 1 1 1 3
Mysore 1 1
Latur 1 1
Ahmedabad 1 1 1 3
Jalandhar 1 1
Coimbatore 1 1 2
Chandigarh 1 1 2 4
Surat 1 1
Kalyan 1 1
Thane 1 1 2 2 6
Agra 1 1
Vadodara 1 1 2
Total 61 42 15 4 60 14 196
Vadodara
Agra
6 6
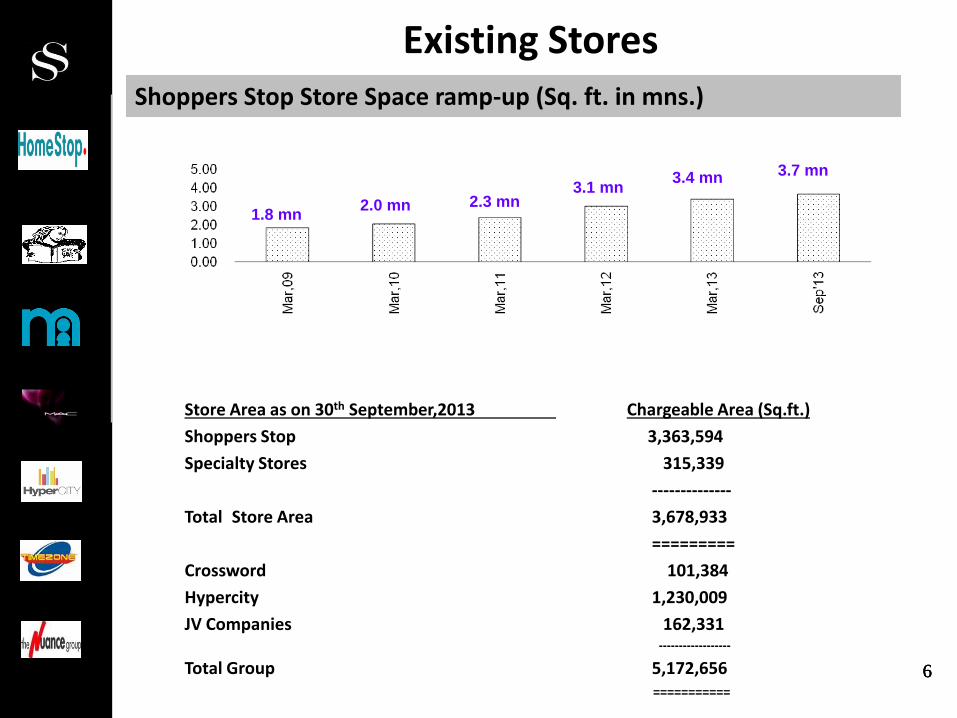
Store Area as on 30th September,2013 Chargeable Area (Sq.ft.)
Shoppers Stop 3,363,594
Specialty Stores 315,339
--------------
Total Store Area 3,678,933
=========
Crossword 101,384
Hypercity 1,230,009
JV Companies 162,331 ------------------
Total Group 5,172,656 ===========
Shoppers Stop Store Space ramp-up (Sq. ft. in mns.)
Existing Stores
6
1.8 mn 2.0 mn 2.3 mn
3.1 mn 3.4 mn 3.7 mn
7
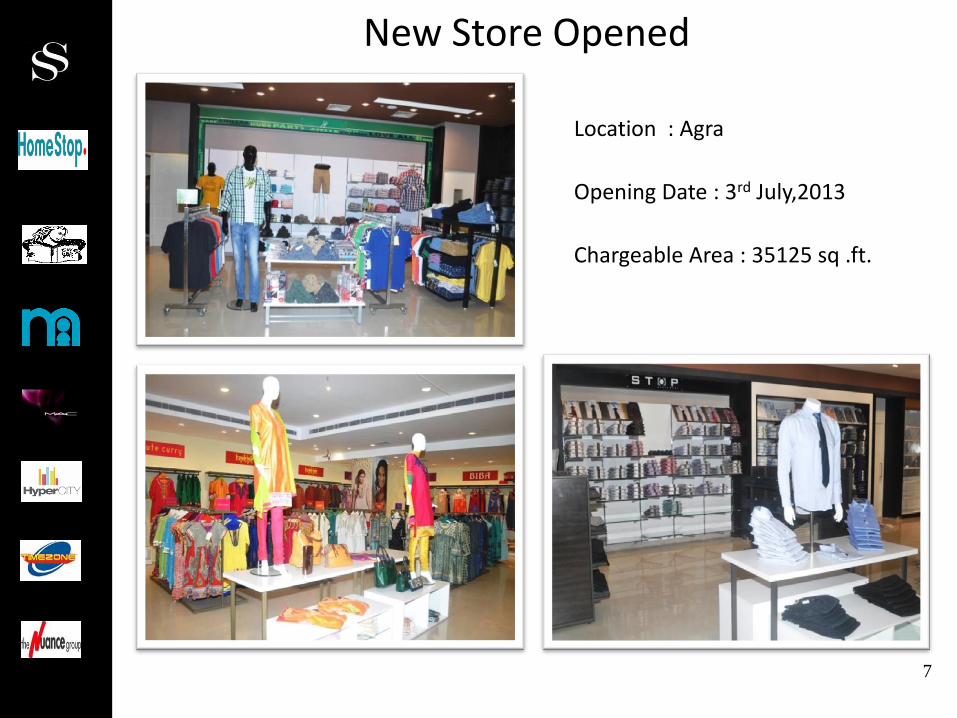
Location : Agra
Opening Date : 3rd July,2013
Chargeable Area : 35125 sq .ft.
New Store Opened
8
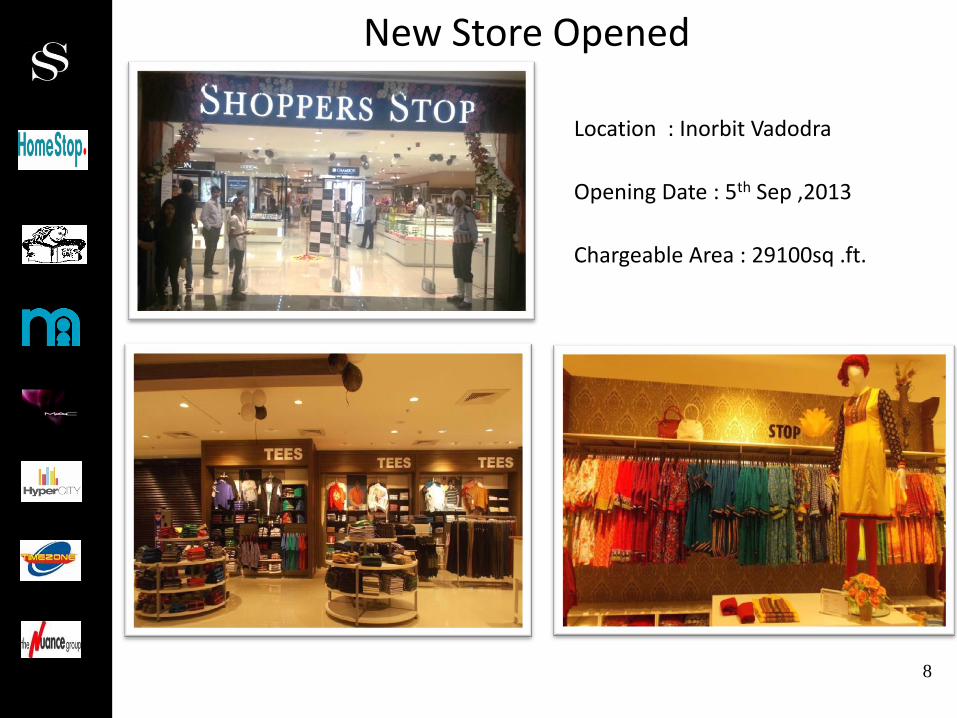
Location : Inorbit Vadodra
Opening Date : 5th Sep ,2013
Chargeable Area : 29100sq .ft.
New Store Opened
9 9
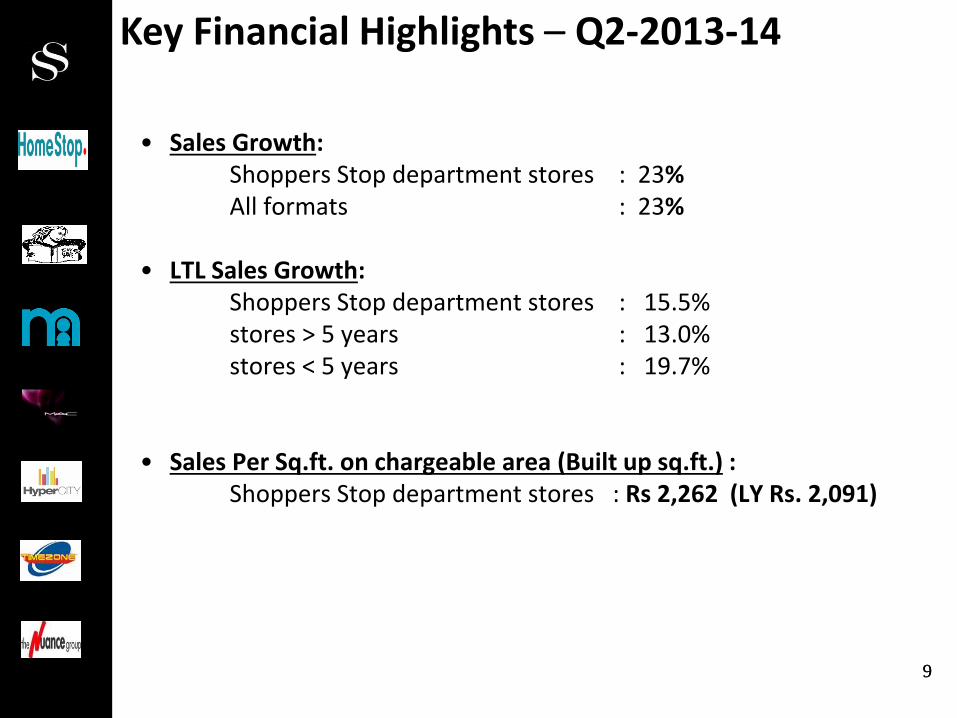
• Sales Growth: Shoppers Stop department stores : 23% All formats : 23%
• LTL Sales Growth: Shoppers Stop department stores : 15.5% stores > 5 years : 13.0% stores < 5 years : 19.7% • Sales Per Sq.ft. on chargeable area (Built up sq.ft.) : Shoppers Stop department stores : Rs 2,262 (LY Rs. 2,091)
Key Financial Highlights – Q2-2013-14
10 10
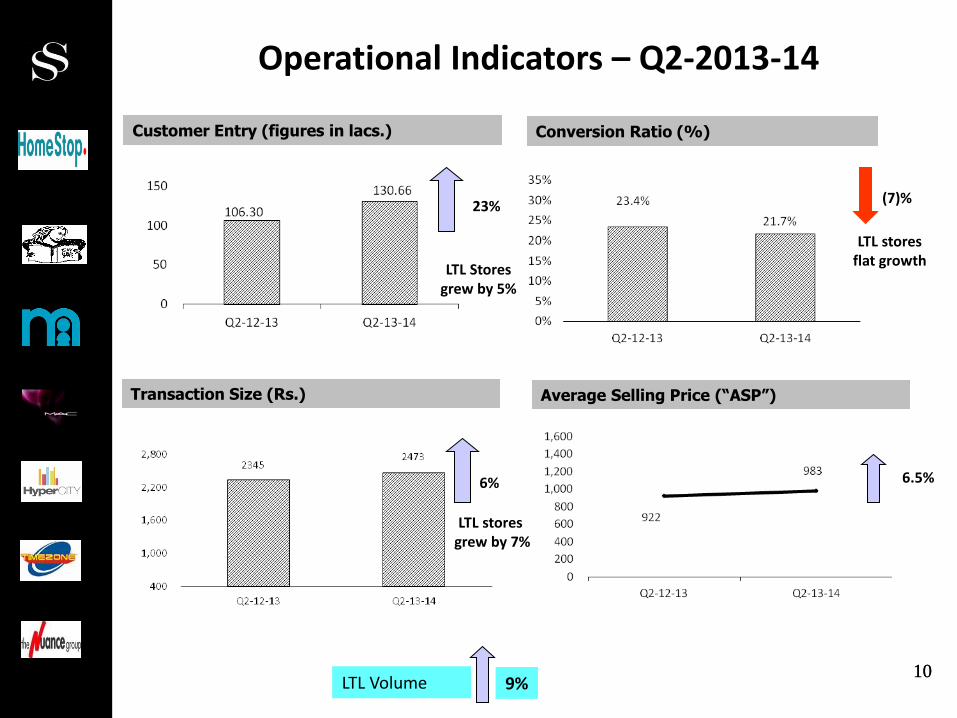
Operational Indicators – Q2-2013-14
Average Selling Price (“ASP”)
Conversion Ratio (%) Customer Entry (figures in lacs.)
6%
9% LTL Volume
23%
LTL Stores grew by 5%
LTL stores flat growth
LTL stores grew by 7%
(7)%
Transaction Size (Rs.)
6.5%
11 11
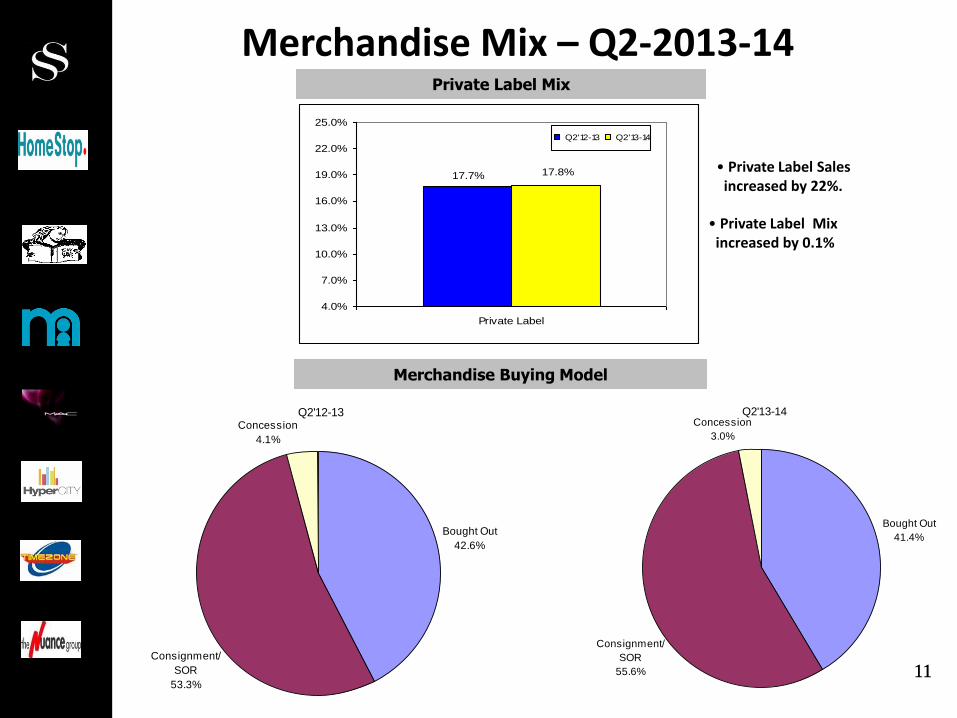
Merchandise Mix – Q2-2013-14
• Private Label Mix increased by 0.1%
Private Label Mix
Merchandise Buying Model
• Private Label Sales increased by 22%.
17.7% 17.8%
4.0%
7.0%
10.0%
13.0%
16.0%
19.0%
22.0%
25.0%
Private Label
Q2'12-13 Q2'13-14
Q2'12-13
Bought Out
42.6%
Consignment/
SOR
53.3%
Concession
4.1%
Q2'13-14
Bought Out
41.4%
Concession
3.0%
Consignment/
SOR
55.6%
12 12
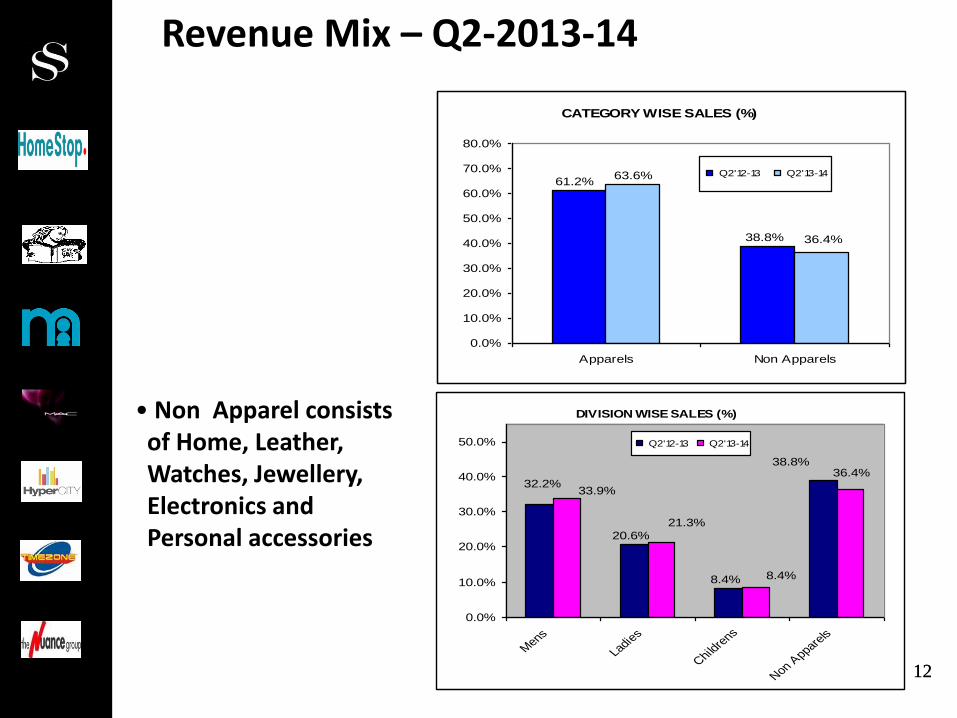
• Non Apparel consists of Home, Leather, Watches, Jewellery, Electronics and Personal accessories
Revenue Mix – Q2-2013-14
CATEGORY WISE SALES (%)
61.2%
38.8%
63.6%
36.4%
0.0%
10.0%
20.0%
30.0%
40.0%
50.0%
60.0%
70.0%
80.0%
Apparels Non Apparels
Q2'12-13 Q2'13-14
DIVISION WISE SALES (%)
32.2%
20.6%
8.4%
38.8%
33.9%
21.3%
8.4%
36.4%
0.0%
10.0%
20.0%
30.0%
40.0%
50.0%
Mens
Ladies
Childre
ns
Non Appare
ls
Q2'12-13 Q2'13-14
13 13
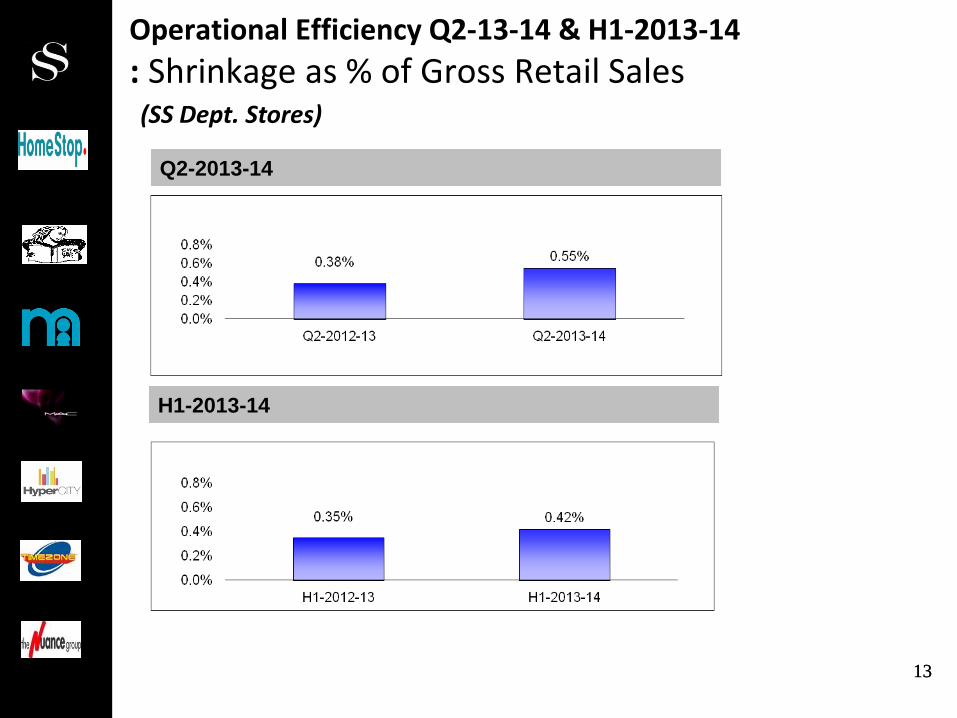
Operational Efficiency Q2-13-14 & H1-2013-14
: Shrinkage as % of Gross Retail Sales
Q2-2013-14
(SS Dept. Stores)
H1-2013-14
14 14
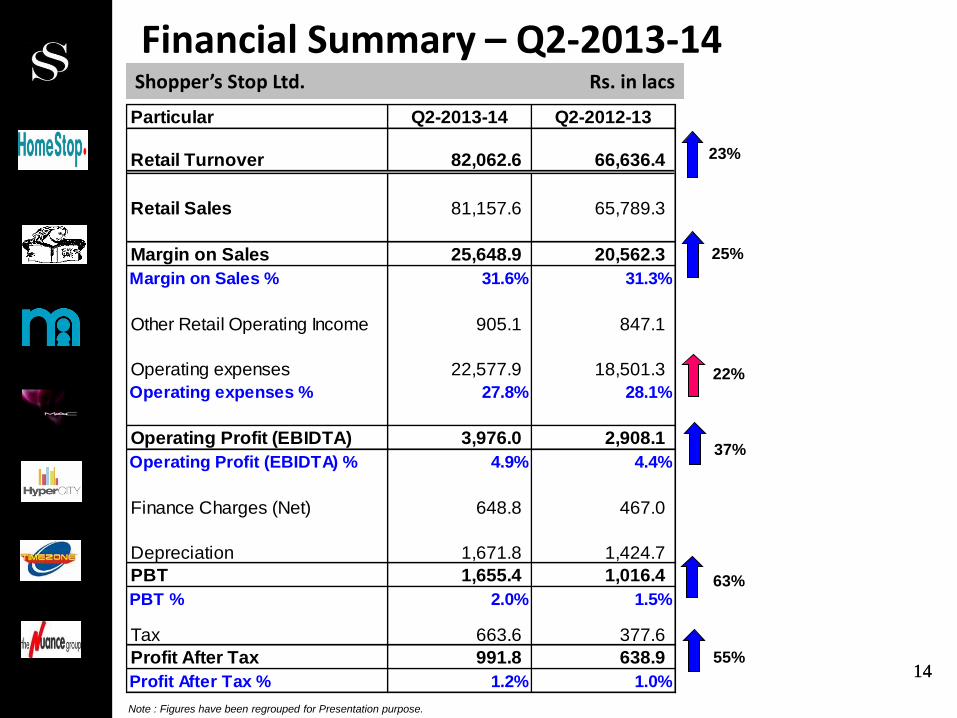
Financial Summary – Q2-2013-14 Shopper’s Stop Ltd. Rs. in lacs
23%
25%
63%
55%
37%
22%
Note : Figures have been regrouped for Presentation purpose.
Particular Q2-2013-14 Q2-2012-13
Retail Turnover 82,062.6 66,636.4
Retail Sales 81,157.6 65,789.3
Margin on Sales 25,648.9 20,562.3
Margin on Sales % 31.6% 31.3%
Other Retail Operating Income 905.1 847.1
Operating expenses 22,577.9 18,501.3
Operating expenses % 27.8% 28.1%
Operating Profit (EBIDTA) 3,976.0 2,908.1
Operating Profit (EBIDTA) % 4.9% 4.4%
Finance Charges (Net) 648.8 467.0
Depreciation 1,671.8 1,424.7
PBT 1,655.4 1,016.4
PBT % 2.0% 1.5%
Tax 663.6 377.6
Profit After Tax 991.8 638.9
Profit After Tax % 1.2% 1.0%
15 15
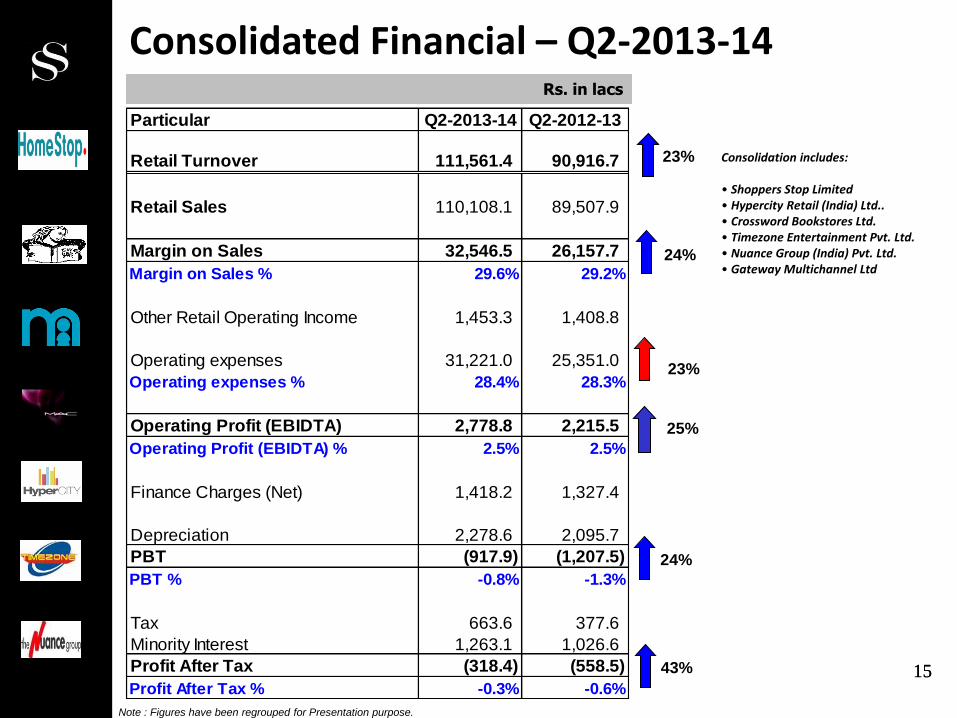
Consolidated Financial – Q2-2013-14 Rs. in lacs
24%
25%
23% Consolidation includes: • Shoppers Stop Limited • Hypercity Retail (India) Ltd.. • Crossword Bookstores Ltd. • Timezone Entertainment Pvt. Ltd. • Nuance Group (India) Pvt. Ltd. • Gateway Multichannel Ltd
23%
Note : Figures have been regrouped for Presentation purpose.
43%
Particular Q2-2013-14 Q2-2012-13
Retail Turnover 111,561.4 90,916.7
Retail Sales 110,108.1 89,507.9
Margin on Sales 32,546.5 26,157.7
Margin on Sales % 29.6% 29.2%
Other Retail Operating Income 1,453.3 1,408.8
Operating expenses 31,221.0 25,351.0
Operating expenses % 28.4% 28.3%
Operating Profit (EBIDTA) 2,778.8 2,215.5
Operating Profit (EBIDTA) % 2.5% 2.5%
Finance Charges (Net) 1,418.2 1,327.4
Depreciation 2,278.6 2,095.7
PBT (917.9) (1,207.5)
PBT % -0.8% -1.3%
Tax 663.6 377.6
Minority Interest 1,263.1 1,026.6
Profit After Tax (318.4) (558.5)
Profit After Tax % -0.3% -0.6%
24%
16 16
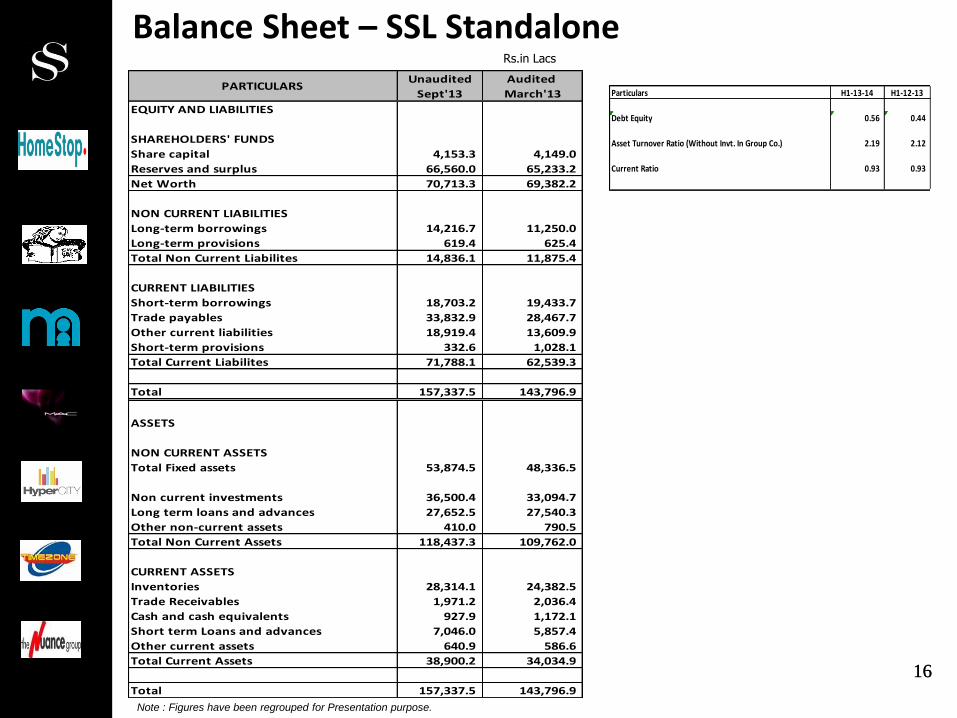
Rs.in Lacs
Balance Sheet – SSL Standalone
Note : Figures have been regrouped for Presentation purpose.
Unaudited Audited
Sept'13 March'13
EQUITY AND LIABILITIES
SHAREHOLDERS' FUNDS
Share capital 4,153.3 4,149.0
Reserves and surplus 66,560.0 65,233.2
Net Worth 70,713.3 69,382.2
NON CURRENT LIABILITIES
Long-term borrowings 14,216.7 11,250.0
Long-term provisions 619.4 625.4
Total Non Current Liabilites 14,836.1 11,875.4
CURRENT LIABILITIES
Short-term borrowings 18,703.2 19,433.7
Trade payables 33,832.9 28,467.7
Other current liabilities 18,919.4 13,609.9
Short-term provisions 332.6 1,028.1
Total Current Liabilites 71,788.1 62,539.3
Total 157,337.5 143,796.9
ASSETS
NON CURRENT ASSETS
Total Fixed assets 53,874.5 48,336.5
Non current investments 36,500.4 33,094.7
Long term loans and advances 27,652.5 27,540.3
Other non-current assets 410.0 790.5
Total Non Current Assets 118,437.3 109,762.0
CURRENT ASSETS
Inventories 28,314.1 24,382.5
Trade Receivables 1,971.2 2,036.4
Cash and cash equivalents 927.9 1,172.1
Short term Loans and advances 7,046.0 5,857.4
Other current assets 640.9 586.6
Total Current Assets 38,900.2 34,034.9
Total 157,337.5 143,796.9
PARTICULARSParticulars H1-13-14 H1-12-13
Debt Equity 0.56 0.44
Asset Turnover Ratio (Without Invt. In Group Co.) 2.19 2.12
Current Ratio 0.93 0.93
17 17
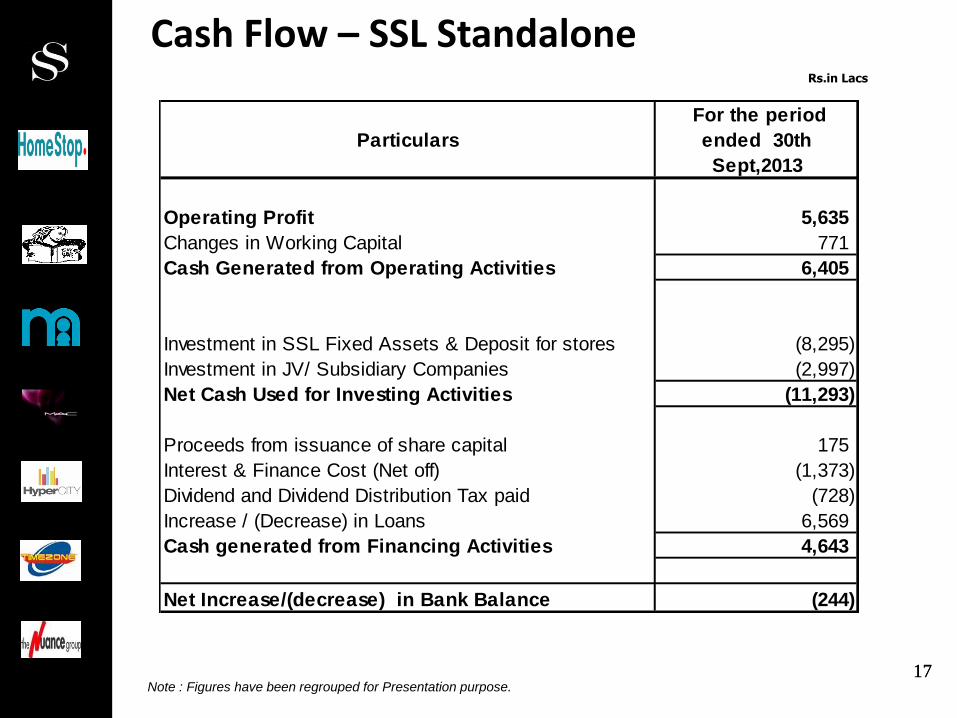
Cash Flow – SSL Standalone Rs.in Lacs
Note : Figures have been regrouped for Presentation purpose.
Particulars
For the period
ended 30th
Sept,2013
Operating Profit 5,635
Changes in Working Capital 771
Cash Generated from Operating Activities 6,405
Investment in SSL Fixed Assets & Deposit for stores (8,295)
Investment in JV/ Subsidiary Companies (2,997)
Net Cash Used for Investing Activities (11,293)
Proceeds from issuance of share capital 175
Interest & Finance Cost (Net off) (1,373)
Dividend and Dividend Distribution Tax paid (728)
Increase / (Decrease) in Loans 6,569
Cash generated from Financing Activities 4,643
Net Increase/(decrease) in Bank Balance (244)
18
H1-2013-14 Financials
18
19 19
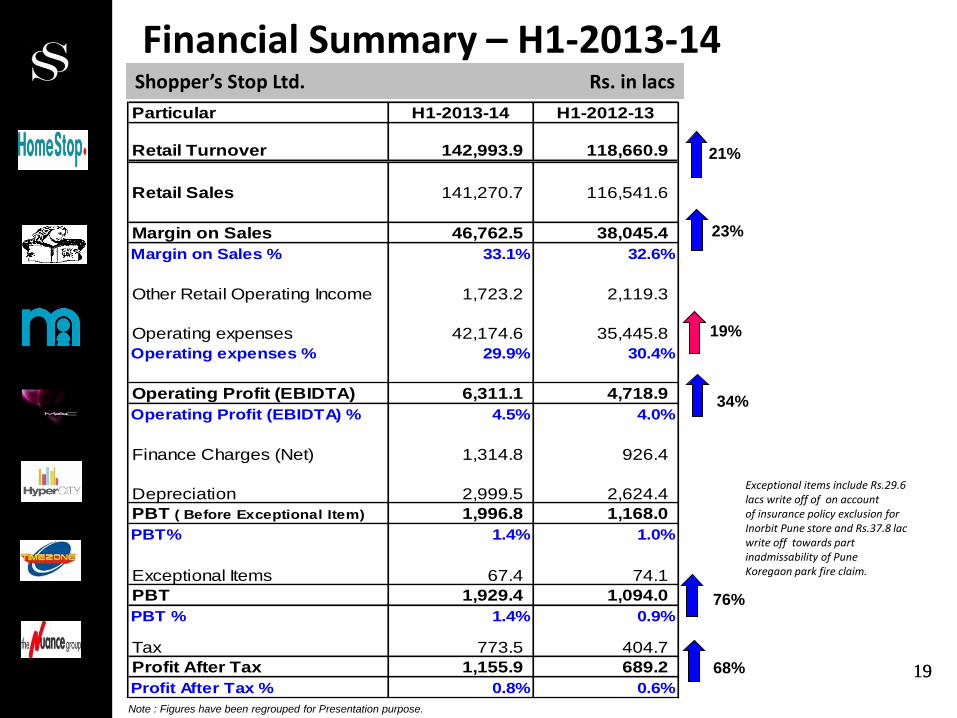
Financial Summary – H1-2013-14 Shopper’s Stop Ltd. Rs. in lacs
21%
23%
76%
68%
34%
19%
Note : Figures have been regrouped for Presentation purpose.
Particular H1-2013-14 H1-2012-13
Retail Turnover 142,993.9 118,660.9
Retail Sales 141,270.7 116,541.6
Margin on Sales 46,762.5 38,045.4
Margin on Sales % 33.1% 32.6%
Other Retail Operating Income 1,723.2 2,119.3
Operating expenses 42,174.6 35,445.8
Operating expenses % 29.9% 30.4%
Operating Profit (EBIDTA) 6,311.1 4,718.9
Operating Profit (EBIDTA) % 4.5% 4.0%
Finance Charges (Net) 1,314.8 926.4
Depreciation 2,999.5 2,624.4
PBT ( Before Exceptional Item) 1,996.8 1,168.0
PBT% 1.4% 1.0%
Exceptional Items 67.4 74.1
PBT 1,929.4 1,094.0
PBT % 1.4% 0.9%
Tax 773.5 404.7
Profit After Tax 1,155.9 689.2
Profit After Tax % 0.8% 0.6%
Exceptional items include Rs.29.6 lacs write off of on account of insurance policy exclusion for Inorbit Pune store and Rs.37.8 lac write off towards part inadmissability of Pune Koregaon park fire claim.
20 20
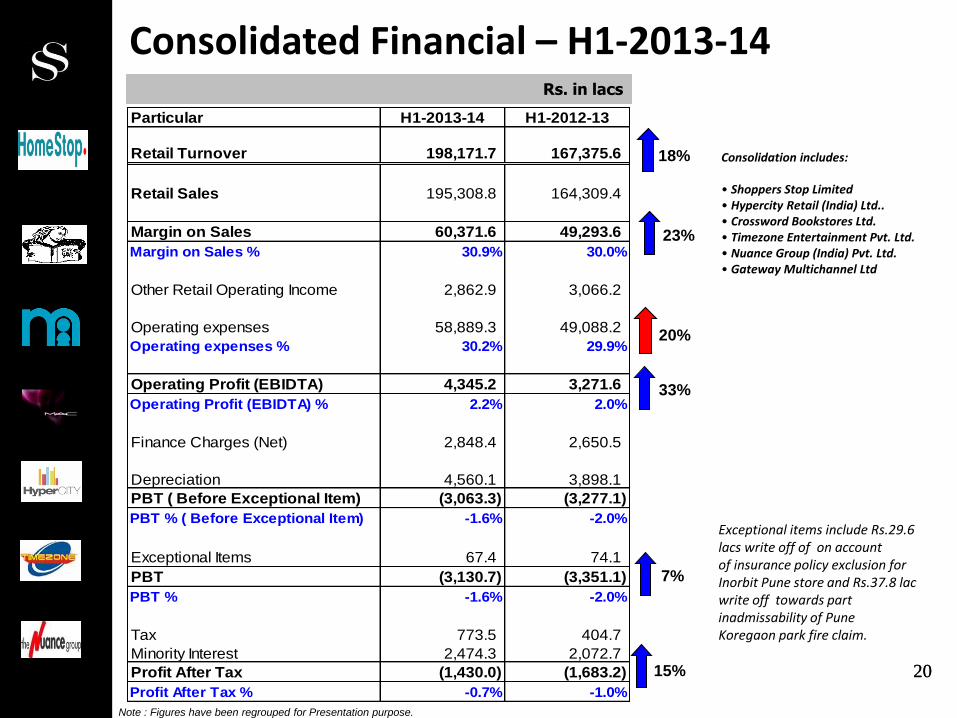
Consolidated Financial – H1-2013-14 Rs. in lacs
23%
20%
18% Consolidation includes: • Shoppers Stop Limited • Hypercity Retail (India) Ltd.. • Crossword Bookstores Ltd. • Timezone Entertainment Pvt. Ltd. • Nuance Group (India) Pvt. Ltd. • Gateway Multichannel Ltd
33%
Note : Figures have been regrouped for Presentation purpose.
Exceptional items include Rs.29.6 lacs write off of on account of insurance policy exclusion for Inorbit Pune store and Rs.37.8 lac write off towards part inadmissability of Pune Koregaon park fire claim.
15%
Particular H1-2013-14 H1-2012-13
Retail Turnover 198,171.7 167,375.6
Retail Sales 195,308.8 164,309.4
Margin on Sales 60,371.6 49,293.6
Margin on Sales % 30.9% 30.0%
Other Retail Operating Income 2,862.9 3,066.2
Operating expenses 58,889.3 49,088.2
Operating expenses % 30.2% 29.9%
Operating Profit (EBIDTA) 4,345.2 3,271.6
Operating Profit (EBIDTA) % 2.2% 2.0%
Finance Charges (Net) 2,848.4 2,650.5
Depreciation 4,560.1 3,898.1
PBT ( Before Exceptional Item) (3,063.3) (3,277.1)
PBT % ( Before Exceptional Item) -1.6% -2.0%
Exceptional Items 67.4 74.1
PBT (3,130.7) (3,351.1)
PBT % -1.6% -2.0%
Tax 773.5 404.7
Minority Interest 2,474.3 2,072.7
Profit After Tax (1,430.0) (1,683.2)
Profit After Tax % -0.7% -1.0%
7%
21
Investor Presentation – Q2 FY14
21
22
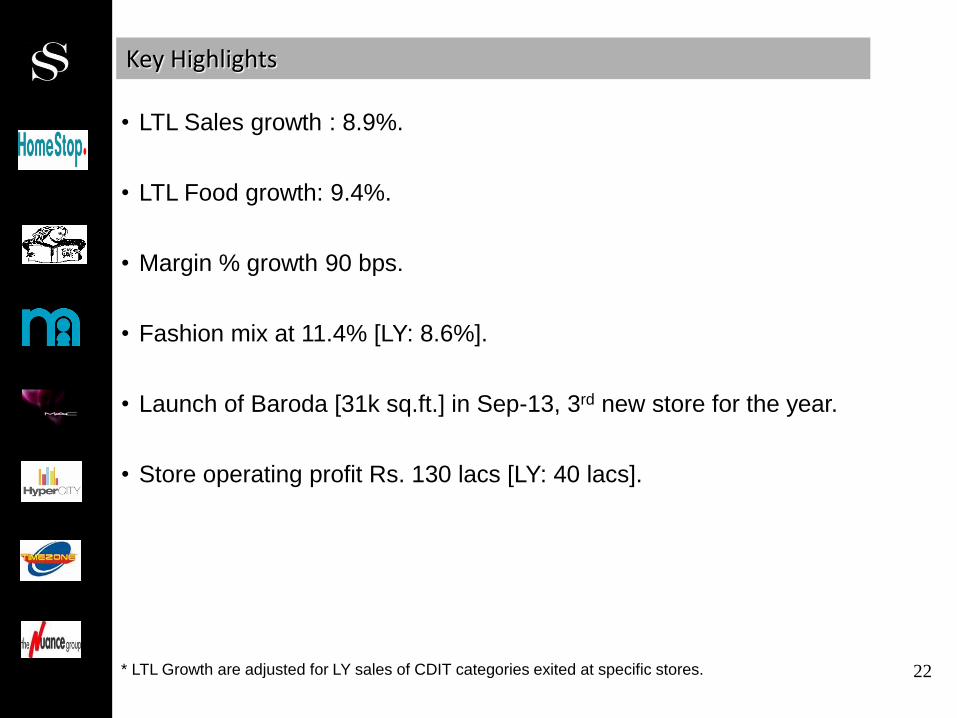
Key Highlights
• LTL Sales growth : 8.9%.
• LTL Food growth: 9.4%.
• Margin % growth 90 bps.
• Fashion mix at 11.4% [LY: 8.6%].
• Launch of Baroda [31k sq.ft.] in Sep-13, 3rd new store for the year.
• Store operating profit Rs. 130 lacs [LY: 40 lacs].
* LTL Growth are adjusted for LY sales of CDIT categories exited at specific stores.
23
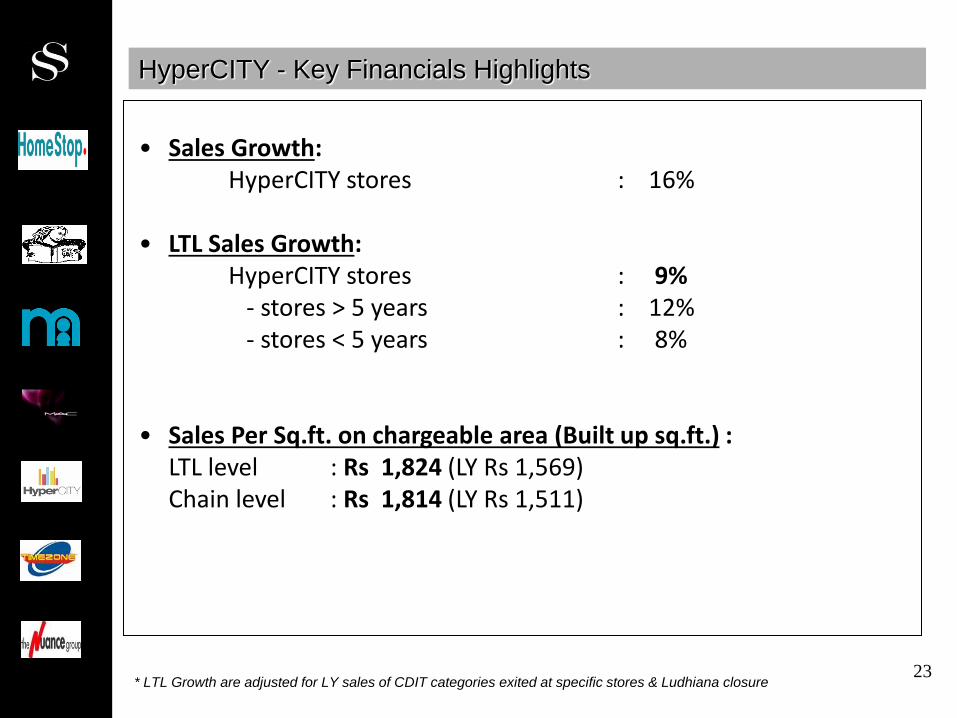
HyperCITY - Key Financials Highlights
• Sales Growth: HyperCITY stores : 16%
• LTL Sales Growth: HyperCITY stores : 9% - stores > 5 years : 12% - stores < 5 years : 8% • Sales Per Sq.ft. on chargeable area (Built up sq.ft.) : LTL level : Rs 1,824 (LY Rs 1,569) Chain level : Rs 1,814 (LY Rs 1,511)
* LTL Growth are adjusted for LY sales of CDIT categories exited at specific stores & Ludhiana closure
24
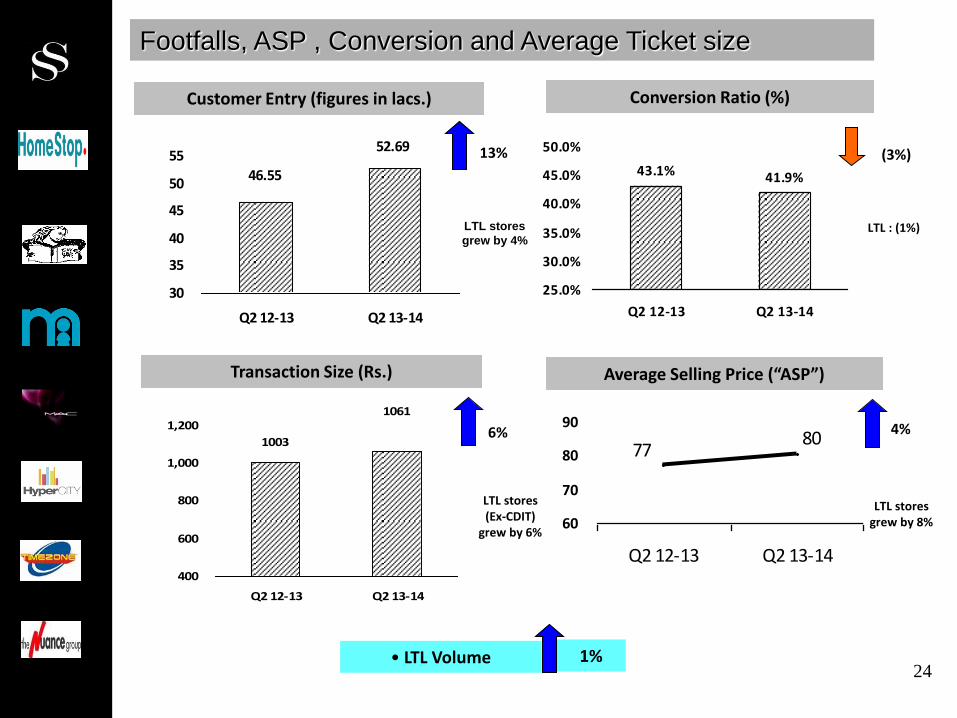
Footfalls, ASP , Conversion and Average Ticket size
7780
60
70
80
90
Q2 12-13 Q2 13-14
46.55
52.69
30
35
40
45
50
55
Q2 12-13 Q2 13-14
1003
1061
400
600
800
1,000
1,200
Q2 12-13 Q2 13-14
43.1% 41.9%
25.0%
30.0%
35.0%
40.0%
45.0%
50.0%
Q2 12-13 Q2 13-14
Average Selling Price (“ASP”) Transaction Size (Rs.)
Conversion Ratio (%) Customer Entry (figures in lacs.)
1% • LTL Volume
4%
(3%) 13%
6%
LTL stores
grew by 4% LTL : (1%)
LTL stores (Ex-CDIT)
grew by 6%
LTL stores grew by 8%
25
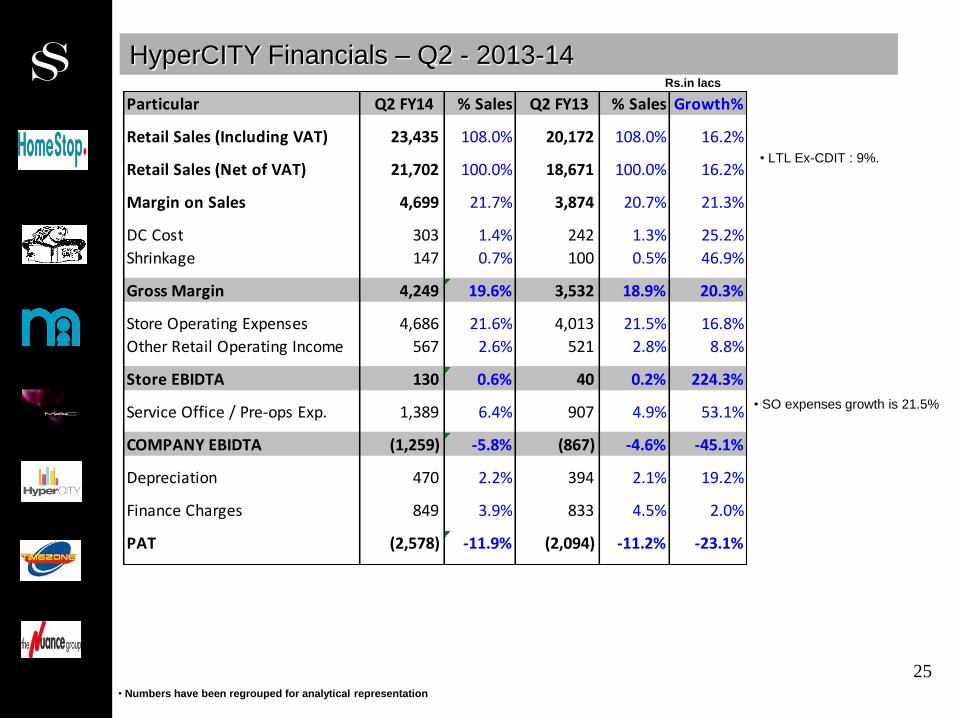
HyperCITY Financials – Q2 - 2013-14 Rs.in lacs
• Numbers have been regrouped for analytical representation
Particular Q2 FY14 % Sales Q2 FY13 % Sales Growth%
Retail Sales (Including VAT) 23,435 108.0% 20,172 108.0% 16.2%
Retail Sales (Net of VAT) 21,702 100.0% 18,671 100.0% 16.2%
Margin on Sales 4,699 21.7% 3,874 20.7% 21.3%
DC Cost 303 1.4% 242 1.3% 25.2%
Shrinkage 147 0.7% 100 0.5% 46.9%
Gross Margin 4,249 19.6% 3,532 18.9% 20.3%
Store Operating Expenses 4,686 21.6% 4,013 21.5% 16.8%
Other Retail Operating Income 567 2.6% 521 2.8% 8.8%
Store EBIDTA 130 0.6% 40 0.2% 224.3%
Service Office / Pre-ops Exp. 1,389 6.4% 907 4.9% 53.1%
COMPANY EBIDTA (1,259) -5.8% (867) -4.6% -45.1%
Depreciation 470 2.2% 394 2.1% 19.2%
Finance Charges 849 3.9% 833 4.5% 2.0%
PAT (2,578) -11.9% (2,094) -11.2% -23.1%
• SO expenses growth is 21.5%
• LTL Ex-CDIT : 9%.
26
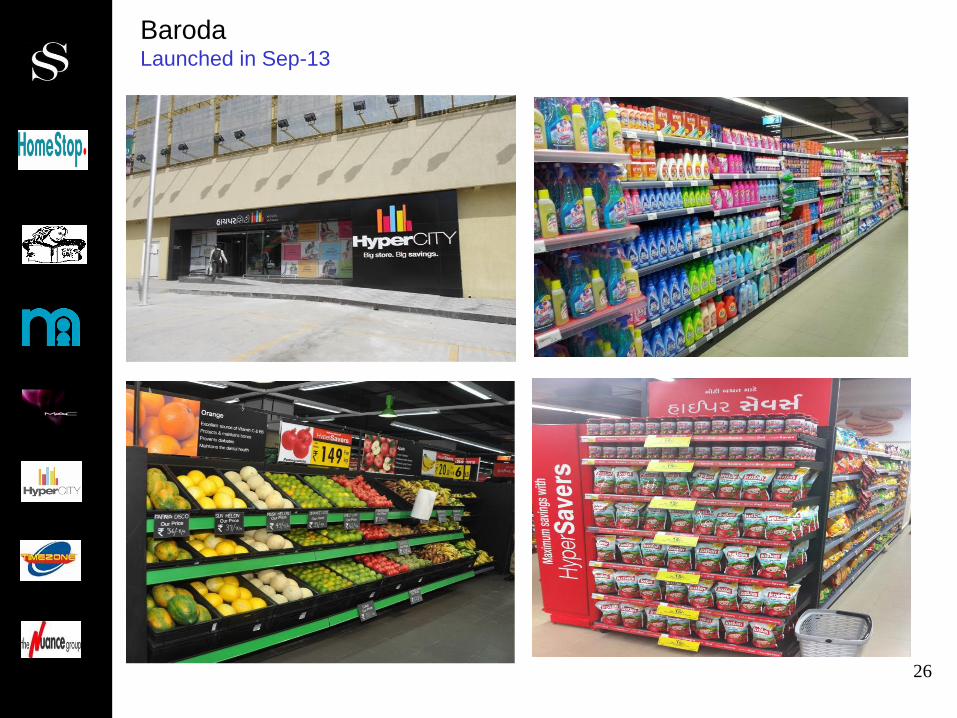
Baroda Launched in Sep-13

27
Baroda Launched in Sep-13
28
H1 - FY14
29
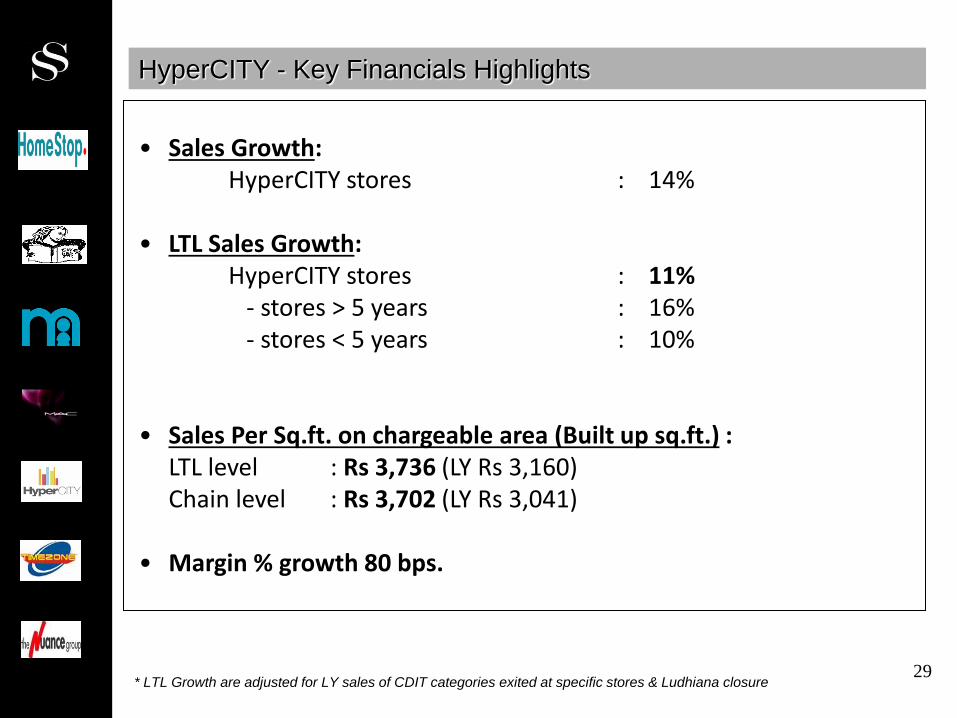
HyperCITY - Key Financials Highlights
• Sales Growth: HyperCITY stores : 14%
• LTL Sales Growth: HyperCITY stores : 11% - stores > 5 years : 16% - stores < 5 years : 10% • Sales Per Sq.ft. on chargeable area (Built up sq.ft.) : LTL level : Rs 3,736 (LY Rs 3,160) Chain level : Rs 3,702 (LY Rs 3,041) • Margin % growth 80 bps.
* LTL Growth are adjusted for LY sales of CDIT categories exited at specific stores & Ludhiana closure
30
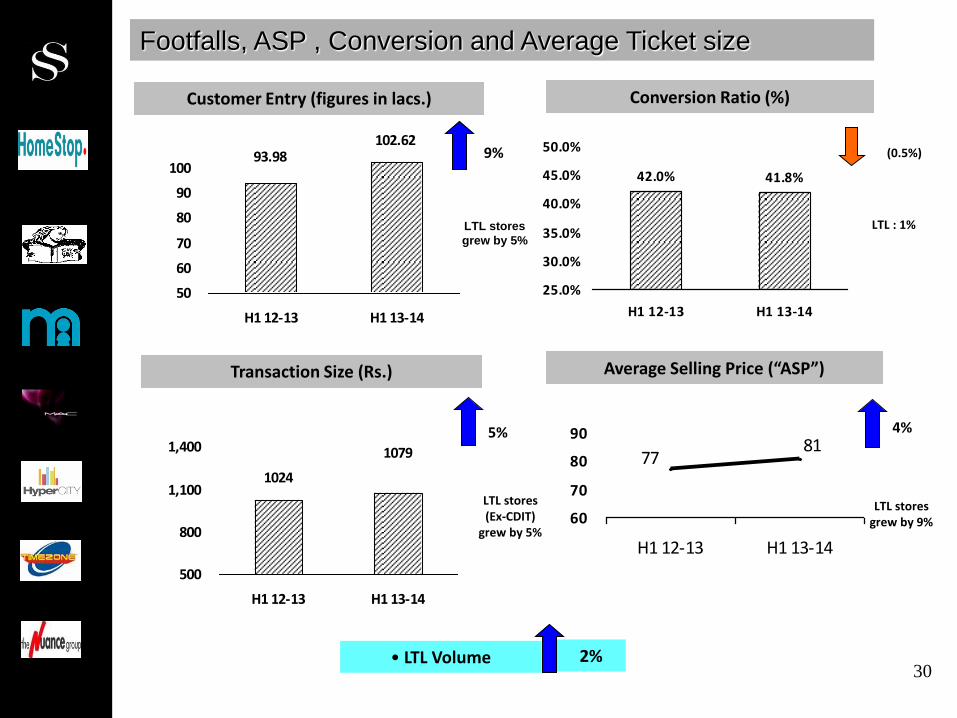
Footfalls, ASP , Conversion and Average Ticket size
7781
60
70
80
90
H1 12-13 H1 13-14
93.98102.62
50
60
70
80
90
100
H1 12-13 H1 13-14
1024
1079
500
800
1,100
1,400
H1 12-13 H1 13-14
42.0% 41.8%
25.0%
30.0%
35.0%
40.0%
45.0%
50.0%
H1 12-13 H1 13-14
Average Selling Price (“ASP”) Transaction Size (Rs.)
Conversion Ratio (%) Customer Entry (figures in lacs.)
2% • LTL Volume
4%
(0.5%) 9%
5%
LTL stores
grew by 5%
LTL : 1%
LTL stores (Ex-CDIT)
grew by 5%
LTL stores grew by 9%
31
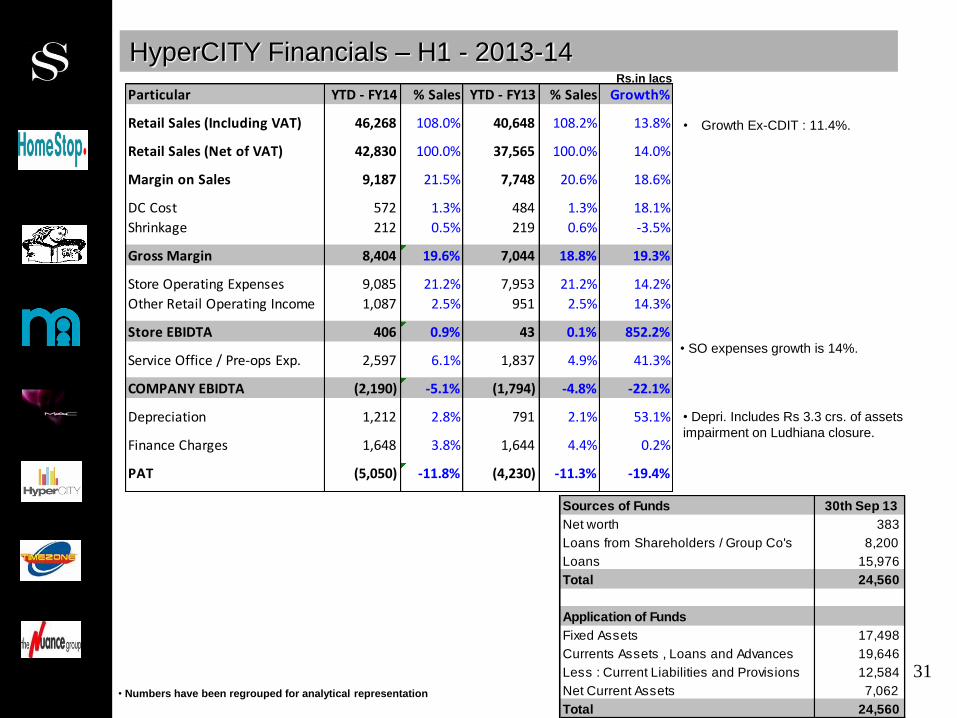
HyperCITY Financials – H1 - 2013-14 Rs.in lacs
• Numbers have been regrouped for analytical representation
Particular YTD - FY14 % Sales YTD - FY13 % Sales Growth%
Retail Sales (Including VAT) 46,268 108.0% 40,648 108.2% 13.8%
Retail Sales (Net of VAT) 42,830 100.0% 37,565 100.0% 14.0%
Margin on Sales 9,187 21.5% 7,748 20.6% 18.6%
DC Cost 572 1.3% 484 1.3% 18.1%
Shrinkage 212 0.5% 219 0.6% -3.5%
Gross Margin 8,404 19.6% 7,044 18.8% 19.3%
Store Operating Expenses 9,085 21.2% 7,953 21.2% 14.2%
Other Retail Operating Income 1,087 2.5% 951 2.5% 14.3%
Store EBIDTA 406 0.9% 43 0.1% 852.2%
Service Office / Pre-ops Exp. 2,597 6.1% 1,837 4.9% 41.3%
COMPANY EBIDTA (2,190) -5.1% (1,794) -4.8% -22.1%
Depreciation 1,212 2.8% 791 2.1% 53.1%
Finance Charges 1,648 3.8% 1,644 4.4% 0.2%
PAT (5,050) -11.8% (4,230) -11.3% -19.4%
Sources of Funds 30th Sep 13
Net worth 383
Loans from Shareholders / Group Co's 8,200
Loans 15,976
Total 24,560
Application of Funds
Fixed Assets 17,498
Currents Assets , Loans and Advances 19,646
Less : Current Liabilities and Provisions 12,584
Net Current Assets 7,062
Total 24,560
• Growth Ex-CDIT : 11.4%.
• SO expenses growth is 14%.
• Depri. Includes Rs 3.3 crs. of assets
impairment on Ludhiana closure.