Embed Size (px)
Citation preview
Shock Metamorphism in Ordinary Chondrites:
Constraining Pressure and Temperature History
by
Jinping Hu
A Dissertation Presented in Partial Fulfillment of the Requirements for the Degree
Doctor of Philosophy
Approved July 2016 by the Graduate Supervisory Committee:
Thomas Sharp, Chair
James Tyburczy Kurt Leinenweber
Meenakshi Wadhwa Mikhail Zolotov
ARIZONA STATE UNIVERISTY
August 2016
i
ABSTRACT
Shock metamorphism in meteorites constrains the impact histories of asteroids
and planets. Shock-induced high-pressure (HP) minerals can provide more precise
estimates of shock conditions than shock-induced deformation effects. In this research, I
use shock features, particularly HP minerals, in ordinary-chondrite samples to constrain
not only shock pressures but also the pressure-temperature-time (P-T-t) paths they
experienced.
Highly shocked L5/6 chondrites Acfer 040, Mbale, NWA 091 and Chico and LL6
chondrite NWA 757 were used to investigate a variety of shock pressures and post-shock
annealing histories. NWA 757 is the only highly shocked LL chondrite that includes
abundant HP minerals. The assemblage of ringwoodite and majoritic garnet indicates an
equilibration shock pressure of ~20 GPa, similar to many strongly shocked L chondrites.
Acfer 040 is one of the only two chondrite samples with bridgmanite (silicate perovskite),
suggesting equilibration pressure >25 GPa. The bridgmanite, which is unstable at low-
pressure, was mostly vitrified during post-shock cooling. Mbale demonstrates an example
of elevated post-shock temperature resulting in back-transformation of ringwoodite to
olivine. In contrast, majoritic garnet in Mbale survives as unambiguous evidence of
strong shock. In these two samples, HP minerals are exclusively associated with shock
melt, indicating that elevated shock temperatures are required for rapid mineral
transformations during the transient shock pulse. However, elevated post-shock
temperatures can destroy HP minerals: in temperature sequence from bridgmanite to
ringwoodite then garnet. NWA 091 and Chico are impact melt breccias with pervasive
melting, blackening of silicates, recrystallization of host rock but no HP minerals. These
ii
features indicate near whole-rock-melting conditions. However, the elevated post-shock
temperatures of these samples has annealed out HP signatures. The observed shock
features result from a complex P-T-t path and may not directly reflect the peak shock
pressure. Although HP minerals provide robust evidence of high pressure, their
occurrence also requires high shock temperatures and rapid cooling during the shock
pulse. The most highly shocked samples lack HP signatures but have abundant high-
temperature features formed after pressure release.
iii
TABLE OF CONTENTS
Page
LIST OF TABLES………………………………………………......................................vi
LIST OF FIGURES…………………………………………………………………...…vii
CHAPTER
1 DISSERTATION INTRODUCTION………………………………….…………..1
1.1 Significance of Shock Metamorphism in Meteorites……………………....1
1.2 Shock Stage Classification of Ordinary Chondrite………………………...2
1.3 Shock Recovery Experiments………………………………………….......6
1.4 High-Pressure Minerals in Shocked Chondrites.…………………………10
1.5 Impact History from Shock Metamorphism………………………………13
1.6 Impact of This Research……………………………..……………………14
1.7 Organization of the Dissertation………………………..…………..……..14
2 HIGH-PRESSURE PHASES IN SHOCK-INDUCED MELT OF THE UNIQUE
HIGHLY SHOCKED LL6 CHONDRITE NORTHWEST AFRICA 757………27
2.1 Introduction………………………………………………………………27
2.2 Sample and Methods………......................................................................30
2.3 Results……………………………………………………………………32
iv
CHAPTER Page
2.4 Discussion………………………………………………………………..39
2.5 Conclusion…………………………………...………….……………….51
3 SHOCK TRANSFORAMTION OF ENSTATITE TO BRIDGMAITE,
RINGWOODITE, MAGNESIOWUSTITE AND STISHOVITE IN THE L
CHODNRITE ACFER 040……………………………………………………...65
3.1 Introduction………………………………………………………………65
3.2 Sample and Methods……………………………………………………..65
3.3 Results……………………………………………………………………67
3.4 Discussion………………………………………………………………..71
3.5 Conclusion……………………………………………………………….75
4 BACK-TRANSFORMATION OF HIGH-PRESSURE MINERALS IN THE
MBALE L CHONDRITE: LOW-PRESSURE MINERALS REVEAL A HIGH
SHOCK PRESSURE……………………………………………………….…....81
4.1 Introduction……………………………………………………………..81
4.2 Samples and Methods……………………………………………....…...81
4.3 Results……………………………………………………………....…..83
4.4 Discussion…………………...………………………….……………....88
4.5 Conclusion…………………..…………………………………………102
v
CHAPTER Page
5 PRESSURE-TEMPERATURE PATH IN SHOCK METAMORPHISM AND
SHOCK STAGE CLASSIFICATION………………………………………….115
5.1 Introduction…………………………………………………………...115
5.2 Impact Melt Breccia NWA 091 and Chico…………...………………119
5.3 Pressure-Temperature Paths of Shock-features……..………………..121
5.4 Revision to the Shock Stage Classification………….……………….132
REFERENCE…………………………………………………………………………...140
vi
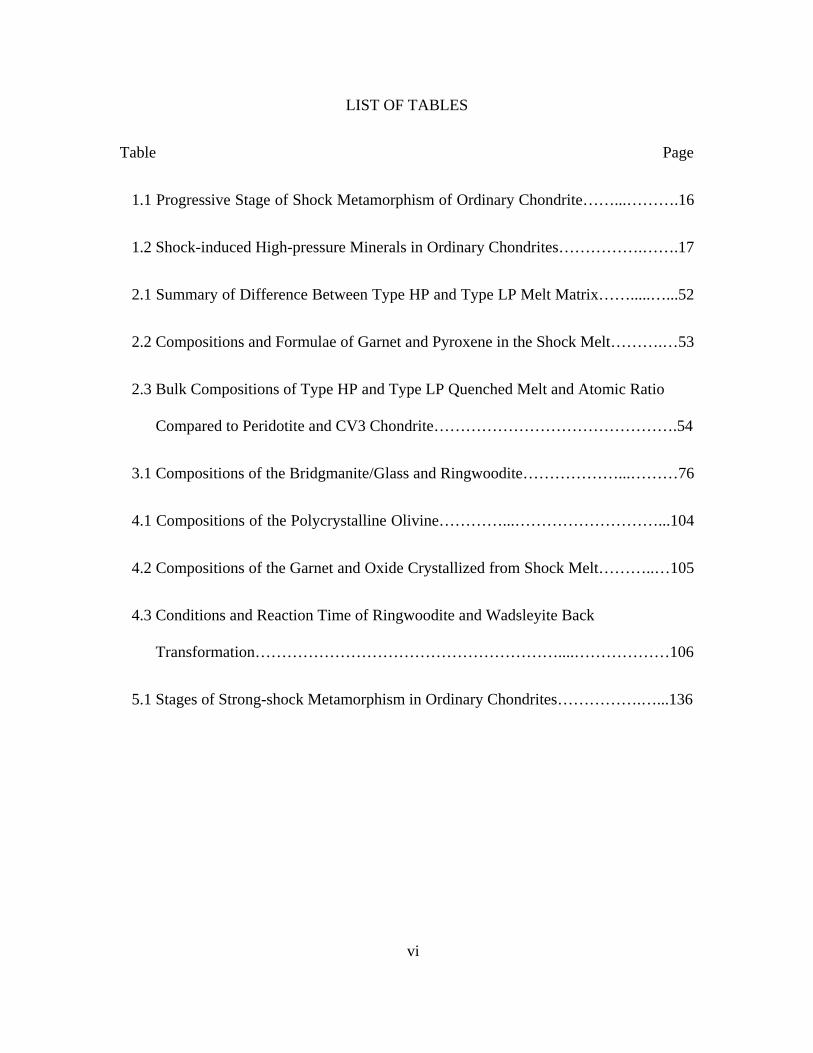
LIST OF TABLES
Table Page
1.1 Progressive Stage of Shock Metamorphism of Ordinary Chondrite……...……….16
1.2 Shock-induced High-pressure Minerals in Ordinary Chondrites…………….…….17
2.1 Summary of Difference Between Type HP and Type LP Melt Matrix…….....…...52
2.2 Compositions and Formulae of Garnet and Pyroxene in the Shock Melt……….…53
2.3 Bulk Compositions of Type HP and Type LP Quenched Melt and Atomic Ratio
Compared to Peridotite and CV3 Chondrite……………………………………….54
3.1 Compositions of the Bridgmanite/Glass and Ringwoodite………………...………76
4.1 Compositions of the Polycrystalline Olivine…………...………………………...104
4.2 Compositions of the Garnet and Oxide Crystallized from Shock Melt………..…105
4.3 Conditions and Reaction Time of Ringwoodite and Wadsleyite Back
Transformation…………………………………………………....………………106
5.1 Stages of Strong-shock Metamorphism in Ordinary Chondrites…………….…...136
vii
LIST OF FIGURES
Figure Page
1.1 Shock Features in Meteorites and Terrestrial Impact Structure…….……………...18
1.2 Shock Pressure for Deformational and Melting Features in Olivine………….…...19
1.3 Simplified Sample Assembly of Shock Recovery Experiment………………...….20
1.4 Shock Loading of Recovery Experiments on Albite…………………...………….21
1.5 Pressure-volume Diagram of Shocked Material………………..………………….22
1.6 Volume Fraction of Minerals in a Peridotite Mantle………………..……………..23
1.7 Phase Diagram of Allende CV3 Chondrite………………...………………………24
1.8 Phase Diagrams of Mg1.8Fe0.2SiO4 and MgSiO3………...…………………………25
1.9 An Impact Model for S6 Chondrite Parent Body…………….……………………26
2.1 Petrology and Shock Metamorphism in Host Rock of NWA 757…………………55
2.2 Optical Images of NWA 757………………………………………………………56
2.3 Raman Spectra of Clasts in Shock Melt…………………………………………...57
2.4 BSE Images of High-pressure Minerals…………………………………………...58
2.5 BSE Images of Normal Glass and Lingunite………………………………………60
2.6 Micro-XRD Pattern of Metl Matrix………………………………………………..61
2.7 TEM Micrographs of Shock Melt………………………………………………….62
viii
Figure Page
2.8 Phases Diagram of Allende CV3 Chondrite……………………………………….63
2.9 Formation Mechanism of Melt Matrices…………………………………………..64
3.1 BSE Images of High-pressure Minerals…………………………………………...77
3.2 TEM Images of Enstatite Dissociation…………………………………………….78
3.3 Micro-XRD of HP minerals………………………………………………………..79
3.4 Phase Diagram for Enstatite………………………………………………………..80
4.1 Optical Images of Shock Melt…………………………………………………..107
4.2 Raman Spectra of HP Minerals………………………………………………….108
4.3 BSE Images of Shock Melt……………………………………………………..109
4.4 Micro-XRD of Olivine Aggregate………………………..…………………….110
4.5 TEM Images of Melt Matrix……………………………………………………...111
4.6 Phase Diagram of Allende CV3 Chondrite……………………………………….112
4.7 Thermal Models of the Shock Melt………………………………………………113
5.1 BSE Images of NWA 091 and Chico…………………………………………….137
5.2 P-T Paths of Shocked Ordinary Chondrites………………………………………138
1
Chapter 1
Dissertation Introduction
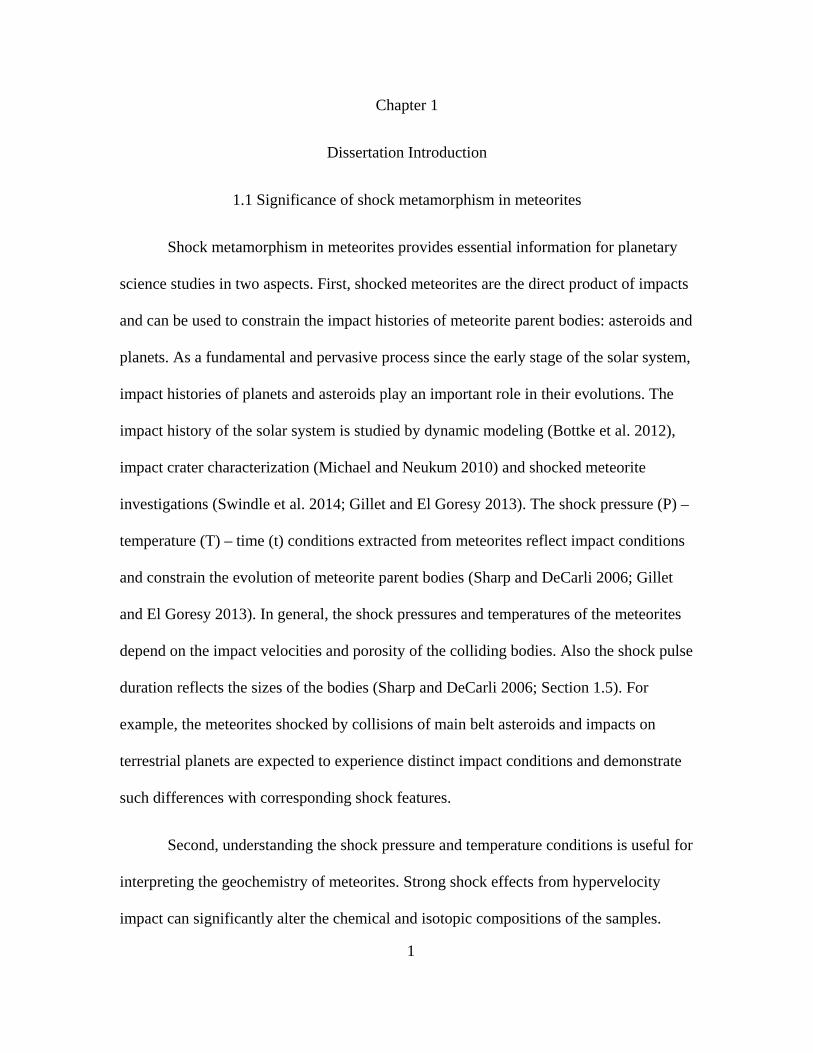
1.1 Significance of shock metamorphism in meteorites
Shock metamorphism in meteorites provides essential information for planetary
science studies in two aspects. First, shocked meteorites are the direct product of impacts
and can be used to constrain the impact histories of meteorite parent bodies: asteroids and
planets. As a fundamental and pervasive process since the early stage of the solar system,
impact histories of planets and asteroids play an important role in their evolutions. The
impact history of the solar system is studied by dynamic modeling (Bottke et al. 2012),
impact crater characterization (Michael and Neukum 2010) and shocked meteorite
investigations (Swindle et al. 2014; Gillet and El Goresy 2013). The shock pressure (P) –
temperature (T) – time (t) conditions extracted from meteorites reflect impact conditions
and constrain the evolution of meteorite parent bodies (Sharp and DeCarli 2006; Gillet
and El Goresy 2013). In general, the shock pressures and temperatures of the meteorites
depend on the impact velocities and porosity of the colliding bodies. Also the shock pulse
duration reflects the sizes of the bodies (Sharp and DeCarli 2006; Section 1.5). For
example, the meteorites shocked by collisions of main belt asteroids and impacts on
terrestrial planets are expected to experience distinct impact conditions and demonstrate
such differences with corresponding shock features.
Second, understanding the shock pressure and temperature conditions is useful for
interpreting the geochemistry of meteorites. Strong shock effects from hypervelocity
impact can significantly alter the chemical and isotopic compositions of the samples.
2
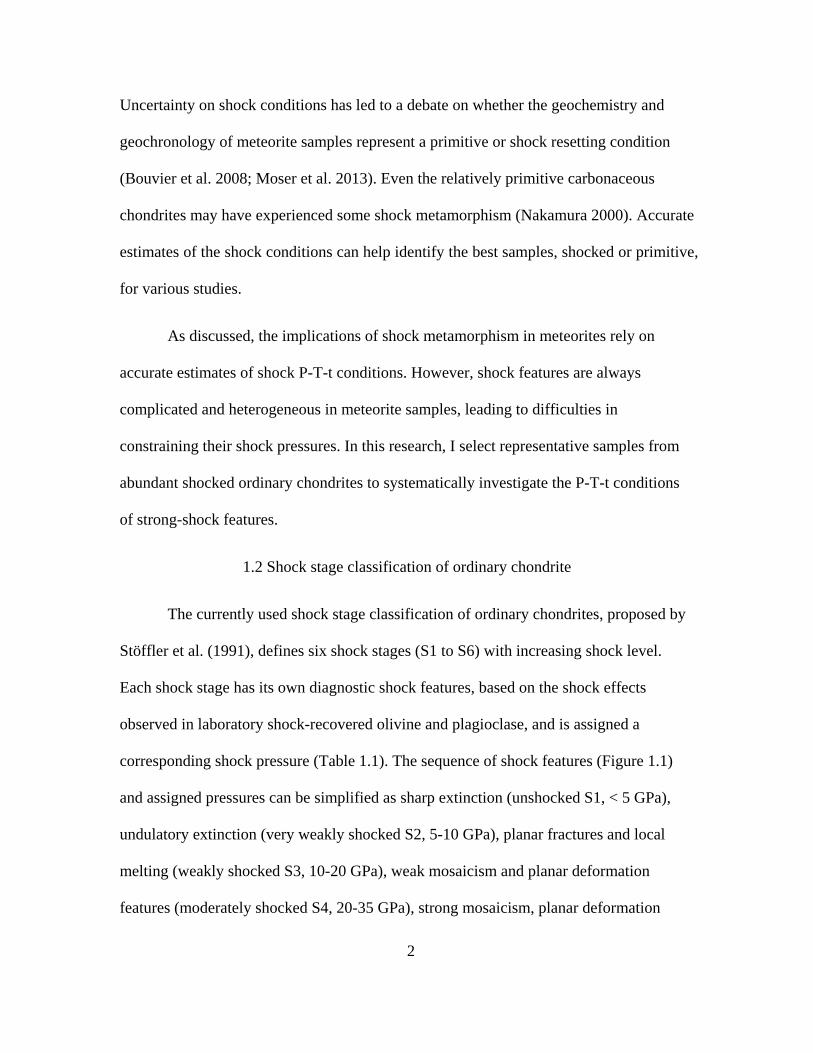
Uncertainty on shock conditions has led to a debate on whether the geochemistry and
geochronology of meteorite samples represent a primitive or shock resetting condition
(Bouvier et al. 2008; Moser et al. 2013). Even the relatively primitive carbonaceous
chondrites may have experienced some shock metamorphism (Nakamura 2000). Accurate
estimates of the shock conditions can help identify the best samples, shocked or primitive,
for various studies.
As discussed, the implications of shock metamorphism in meteorites rely on
accurate estimates of shock P-T-t conditions. However, shock features are always
complicated and heterogeneous in meteorite samples, leading to difficulties in
constraining their shock pressures. In this research, I select representative samples from
abundant shocked ordinary chondrites to systematically investigate the P-T-t conditions
of strong-shock features.
1.2 Shock stage classification of ordinary chondrite
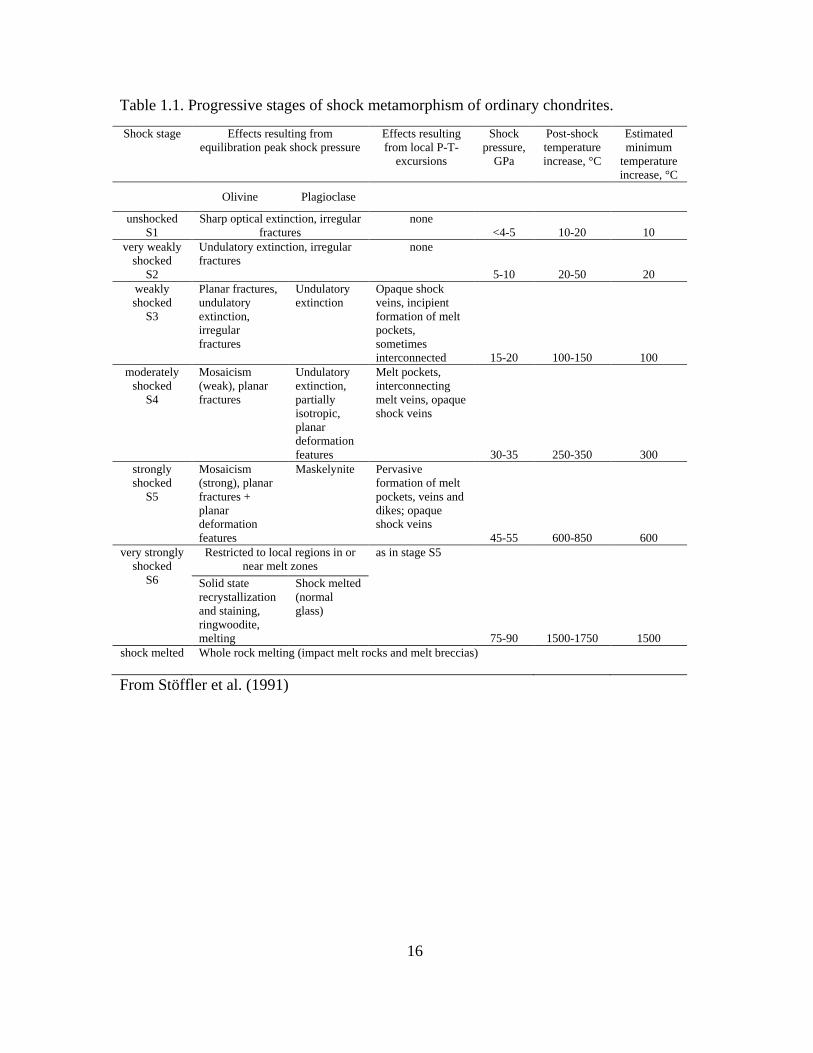
The currently used shock stage classification of ordinary chondrites, proposed by
Stöffler et al. (1991), defines six shock stages (S1 to S6) with increasing shock level.
Each shock stage has its own diagnostic shock features, based on the shock effects
observed in laboratory shock-recovered olivine and plagioclase, and is assigned a
corresponding shock pressure (Table 1.1). The sequence of shock features (Figure 1.1)
and assigned pressures can be simplified as sharp extinction (unshocked S1, < 5 GPa),
undulatory extinction (very weakly shocked S2, 5-10 GPa), planar fractures and local
melting (weakly shocked S3, 10-20 GPa), weak mosaicism and planar deformation
features (moderately shocked S4, 20-35 GPa), strong mosaicism, planar deformation
3
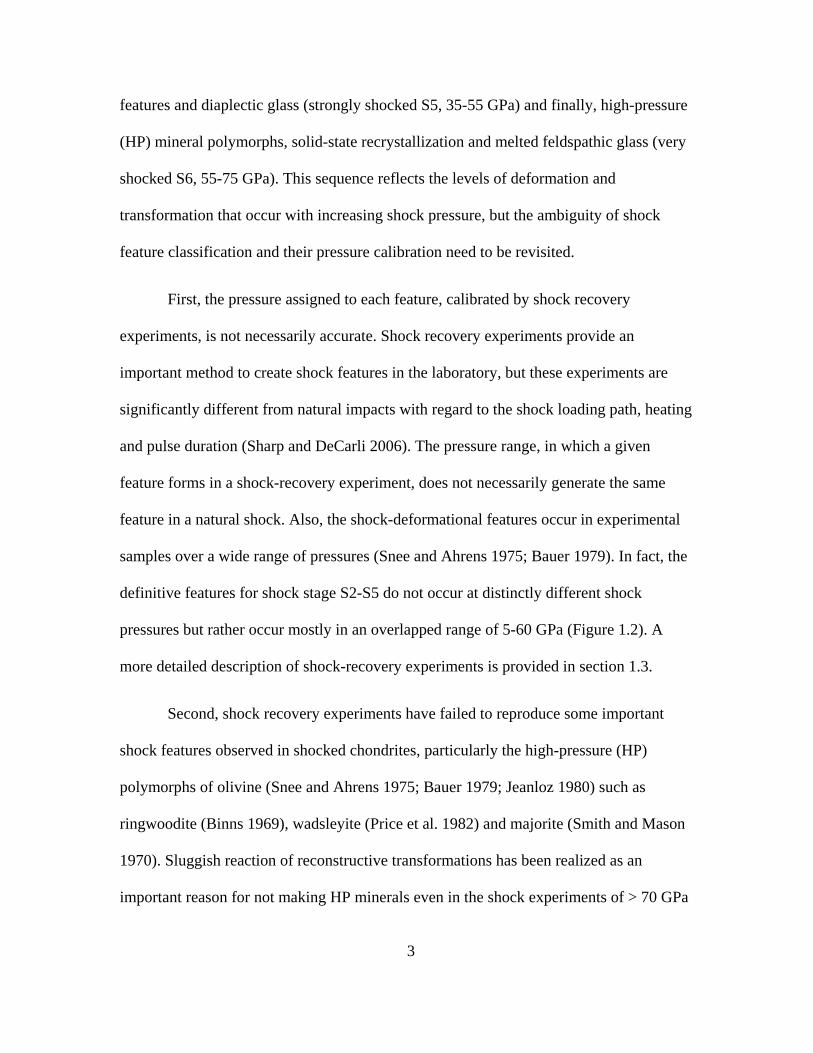
features and diaplectic glass (strongly shocked S5, 35-55 GPa) and finally, high-pressure
(HP) mineral polymorphs, solid-state recrystallization and melted feldspathic glass (very
shocked S6, 55-75 GPa). This sequence reflects the levels of deformation and
transformation that occur with increasing shock pressure, but the ambiguity of shock
feature classification and their pressure calibration need to be revisited.
First, the pressure assigned to each feature, calibrated by shock recovery
experiments, is not necessarily accurate. Shock recovery experiments provide an
important method to create shock features in the laboratory, but these experiments are
significantly different from natural impacts with regard to the shock loading path, heating
and pulse duration (Sharp and DeCarli 2006). The pressure range, in which a given
feature forms in a shock-recovery experiment, does not necessarily generate the same
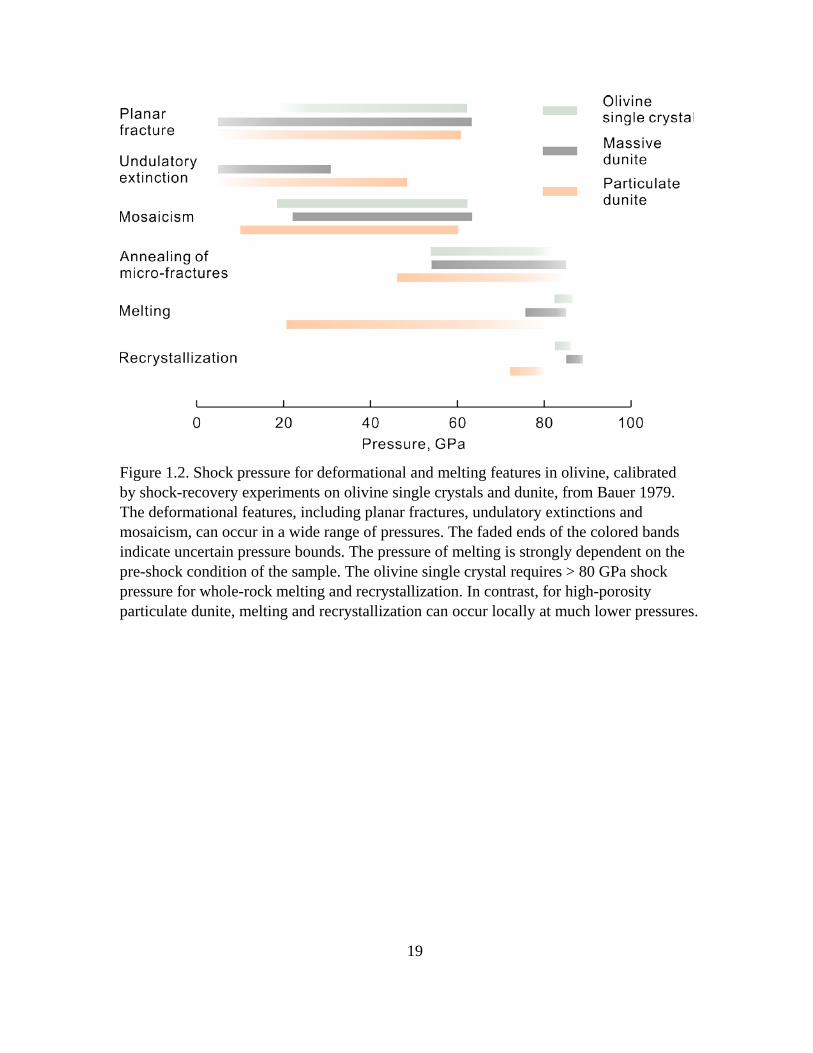
feature in a natural shock. Also, the shock-deformational features occur in experimental
samples over a wide range of pressures (Snee and Ahrens 1975; Bauer 1979). In fact, the
definitive features for shock stage S2-S5 do not occur at distinctly different shock
pressures but rather occur mostly in an overlapped range of 5-60 GPa (Figure 1.2). A
more detailed description of shock-recovery experiments is provided in section 1.3.
Second, shock recovery experiments have failed to reproduce some important
shock features observed in shocked chondrites, particularly the high-pressure (HP)
polymorphs of olivine (Snee and Ahrens 1975; Bauer 1979; Jeanloz 1980) such as
ringwoodite (Binns 1969), wadsleyite (Price et al. 1982) and majorite (Smith and Mason
1970). Sluggish reaction of reconstructive transformations has been realized as an
important reason for not making HP minerals even in the shock experiments of > 70 GPa
4
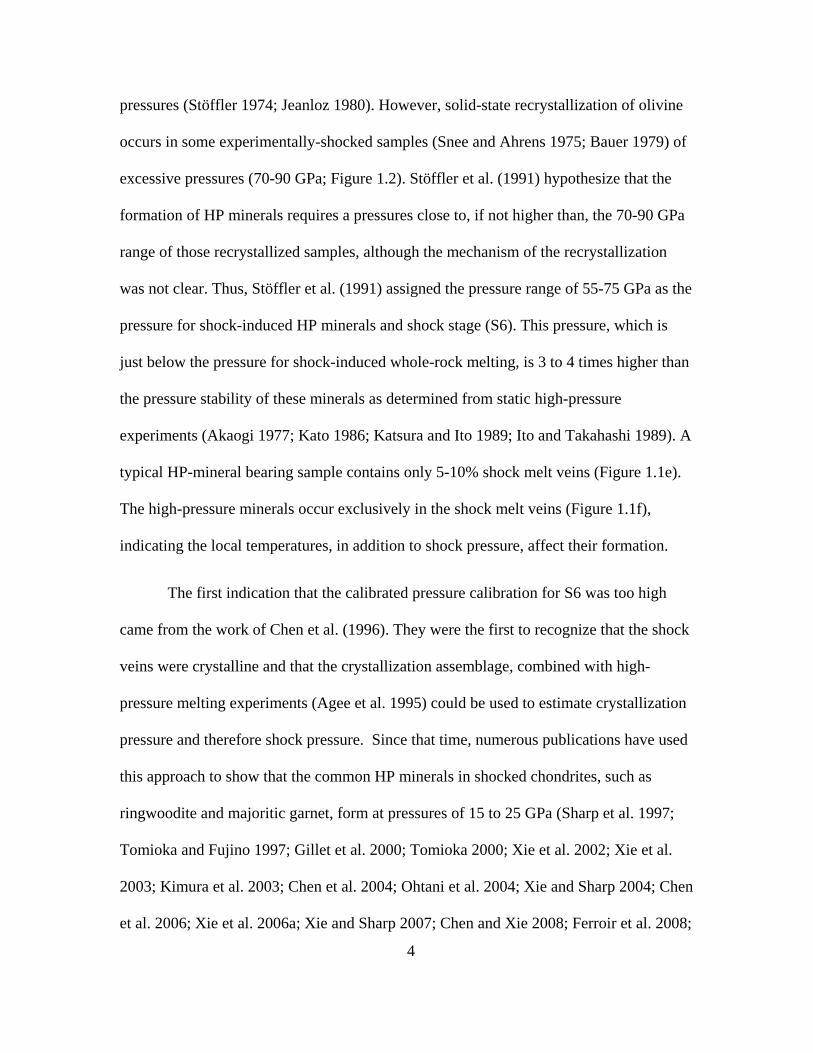
pressures (Stöffler 1974; Jeanloz 1980). However, solid-state recrystallization of olivine
occurs in some experimentally-shocked samples (Snee and Ahrens 1975; Bauer 1979) of
excessive pressures (70-90 GPa; Figure 1.2). Stöffler et al. (1991) hypothesize that the
formation of HP minerals requires a pressures close to, if not higher than, the 70-90 GPa
range of those recrystallized samples, although the mechanism of the recrystallization
was not clear. Thus, Stöffler et al. (1991) assigned the pressure range of 55-75 GPa as the
pressure for shock-induced HP minerals and shock stage (S6). This pressure, which is
just below the pressure for shock-induced whole-rock melting, is 3 to 4 times higher than
the pressure stability of these minerals as determined from static high-pressure
experiments (Akaogi 1977; Kato 1986; Katsura and Ito 1989; Ito and Takahashi 1989). A
typical HP-mineral bearing sample contains only 5-10% shock melt veins (Figure 1.1e).
The high-pressure minerals occur exclusively in the shock melt veins (Figure 1.1f),
indicating the local temperatures, in addition to shock pressure, affect their formation.
The first indication that the calibrated pressure calibration for S6 was too high
came from the work of Chen et al. (1996). They were the first to recognize that the shock
veins were crystalline and that the crystallization assemblage, combined with high-
pressure melting experiments (Agee et al. 1995) could be used to estimate crystallization
pressure and therefore shock pressure. Since that time, numerous publications have used
this approach to show that the common HP minerals in shocked chondrites, such as
ringwoodite and majoritic garnet, form at pressures of 15 to 25 GPa (Sharp et al. 1997;
Tomioka and Fujino 1997; Gillet et al. 2000; Tomioka 2000; Xie et al. 2002; Xie et al.
2003; Kimura et al. 2003; Chen et al. 2004; Ohtani et al. 2004; Xie and Sharp 2004; Chen
et al. 2006; Xie et al. 2006a; Xie and Sharp 2007; Chen and Xie 2008; Ferroir et al. 2008;
5
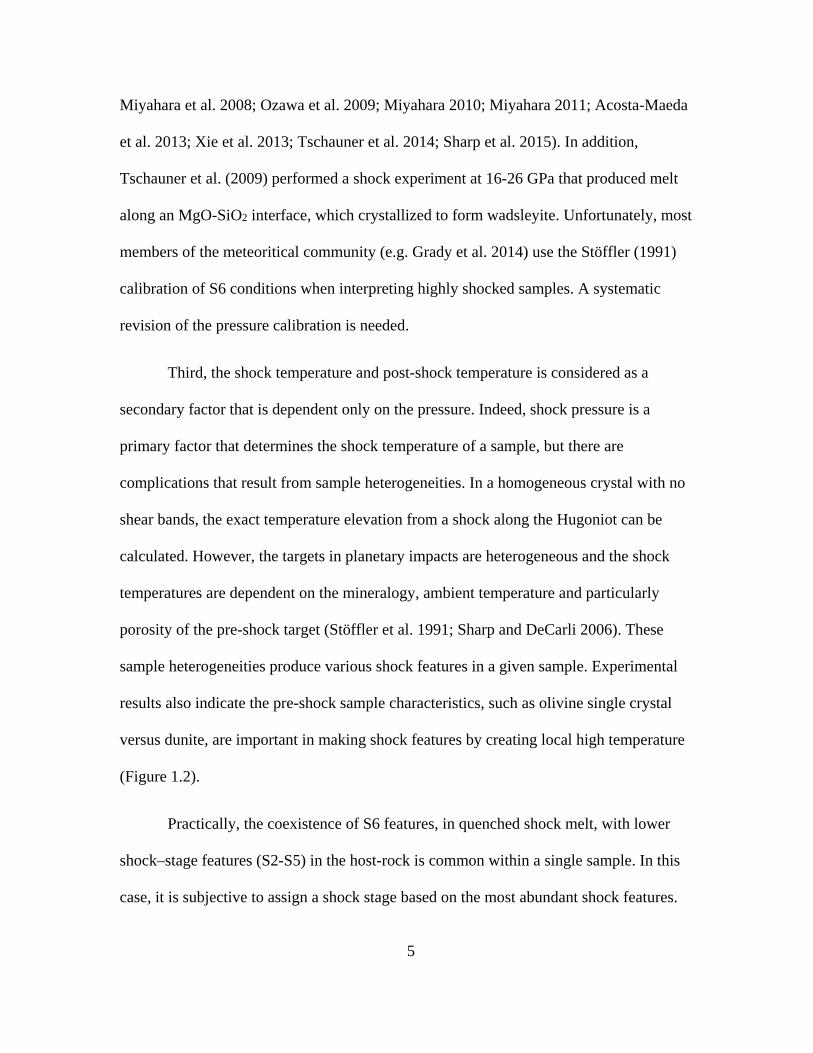
Miyahara et al. 2008; Ozawa et al. 2009; Miyahara 2010; Miyahara 2011; Acosta-Maeda
et al. 2013; Xie et al. 2013; Tschauner et al. 2014; Sharp et al. 2015). In addition,
Tschauner et al. (2009) performed a shock experiment at 16-26 GPa that produced melt
along an MgO-SiO2 interface, which crystallized to form wadsleyite. Unfortunately, most
members of the meteoritical community (e.g. Grady et al. 2014) use the Stöffler (1991)
calibration of S6 conditions when interpreting highly shocked samples. A systematic
revision of the pressure calibration is needed.
Third, the shock temperature and post-shock temperature is considered as a
secondary factor that is dependent only on the pressure. Indeed, shock pressure is a
primary factor that determines the shock temperature of a sample, but there are
complications that result from sample heterogeneities. In a homogeneous crystal with no
shear bands, the exact temperature elevation from a shock along the Hugoniot can be
calculated. However, the targets in planetary impacts are heterogeneous and the shock
temperatures are dependent on the mineralogy, ambient temperature and particularly
porosity of the pre-shock target (Stöffler et al. 1991; Sharp and DeCarli 2006). These
sample heterogeneities produce various shock features in a given sample. Experimental
results also indicate the pre-shock sample characteristics, such as olivine single crystal
versus dunite, are important in making shock features by creating local high temperature
(Figure 1.2).
Practically, the coexistence of S6 features, in quenched shock melt, with lower
shock–stage features (S2-S5) in the host-rock is common within a single sample. In this
case, it is subjective to assign a shock stage based on the most abundant shock features.
6
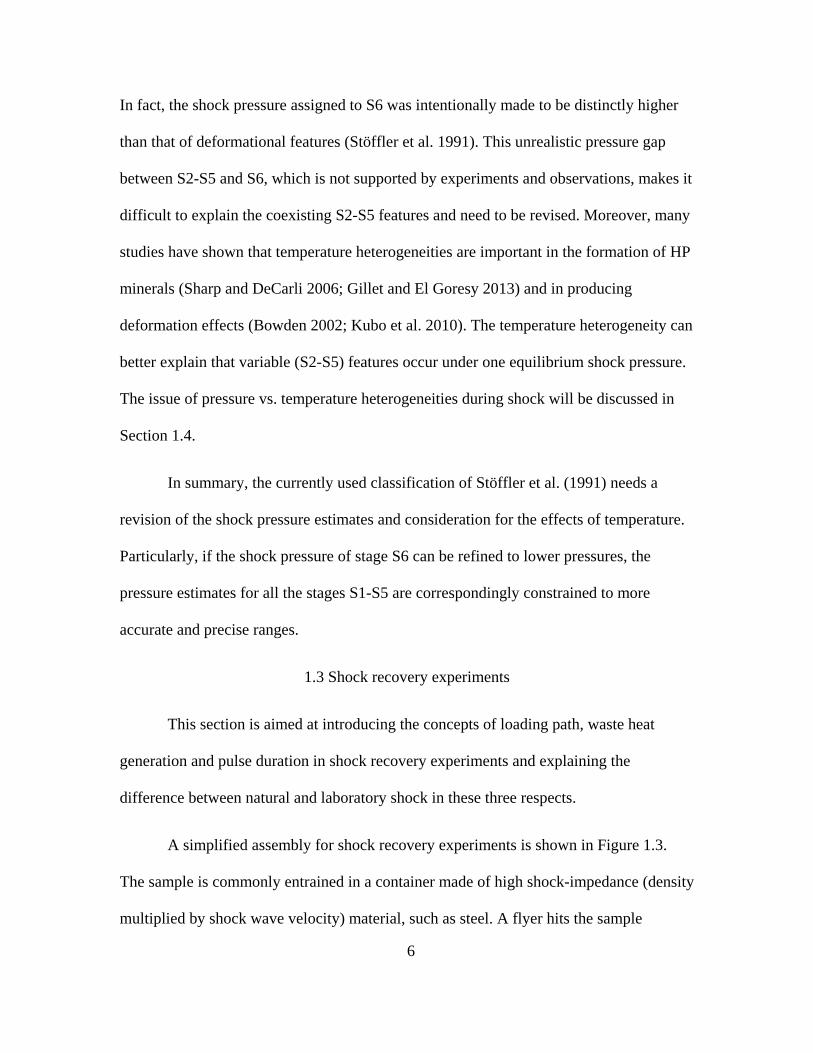
In fact, the shock pressure assigned to S6 was intentionally made to be distinctly higher
than that of deformational features (Stöffler et al. 1991). This unrealistic pressure gap
between S2-S5 and S6, which is not supported by experiments and observations, makes it
difficult to explain the coexisting S2-S5 features and need to be revised. Moreover, many
studies have shown that temperature heterogeneities are important in the formation of HP
minerals (Sharp and DeCarli 2006; Gillet and El Goresy 2013) and in producing
deformation effects (Bowden 2002; Kubo et al. 2010). The temperature heterogeneity can
better explain that variable (S2-S5) features occur under one equilibrium shock pressure.
The issue of pressure vs. temperature heterogeneities during shock will be discussed in
Section 1.4.
In summary, the currently used classification of Stöffler et al. (1991) needs a
revision of the shock pressure estimates and consideration for the effects of temperature.
Particularly, if the shock pressure of stage S6 can be refined to lower pressures, the
pressure estimates for all the stages S1-S5 are correspondingly constrained to more
accurate and precise ranges.
1.3 Shock recovery experiments
This section is aimed at introducing the concepts of loading path, waste heat
generation and pulse duration in shock recovery experiments and explaining the
difference between natural and laboratory shock in these three respects.
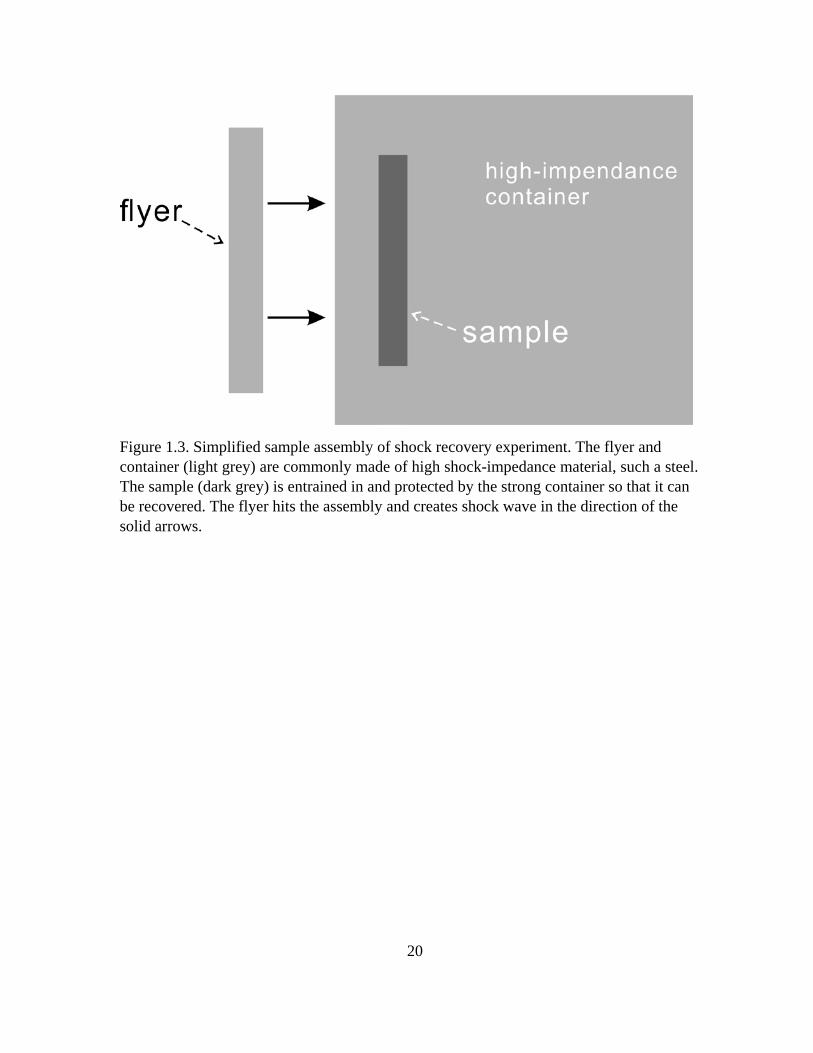
A simplified assembly for shock recovery experiments is shown in Figure 1.3.
The sample is commonly entrained in a container made of high shock-impedance (density
multiplied by shock wave velocity) material, such as steel. A flyer hits the sample

7
assembly at certain velocity and creates shock wave perpendicular to the interface. The
shock-wave equation of states of the assembly materials are provided by their Hugoniots.
A Hugoniot can be presented in many forms, such as shock pressure vs. specific volume,
shock velocity vs. particle velocity or shock pressure vs. particle velocity. To illustrate
the pressure rise in shock experiments, I start with the shock pressure vs. particles
velocity plot (Figure 1.4). Two equations are involved in the plot.
Us = C0 + sUp (1.1)
P = ρ0UsUp (1.2)
Where Us is shock velocity [km/s], C0 is approximately the bulk sound speed of the
material [km/s], s is a factor related to Grüneisen parameter, Up is the particle velocity
[km/s], ρ0 is the density of the material at standard pressure and temperature [kg/m3], P is
the shock pressure [GPa]. As mentioned, equation 1.1 is another form of the Hugoniot.
The two equations relate shock pressure to the particle velocity and other material-
dependent factors.
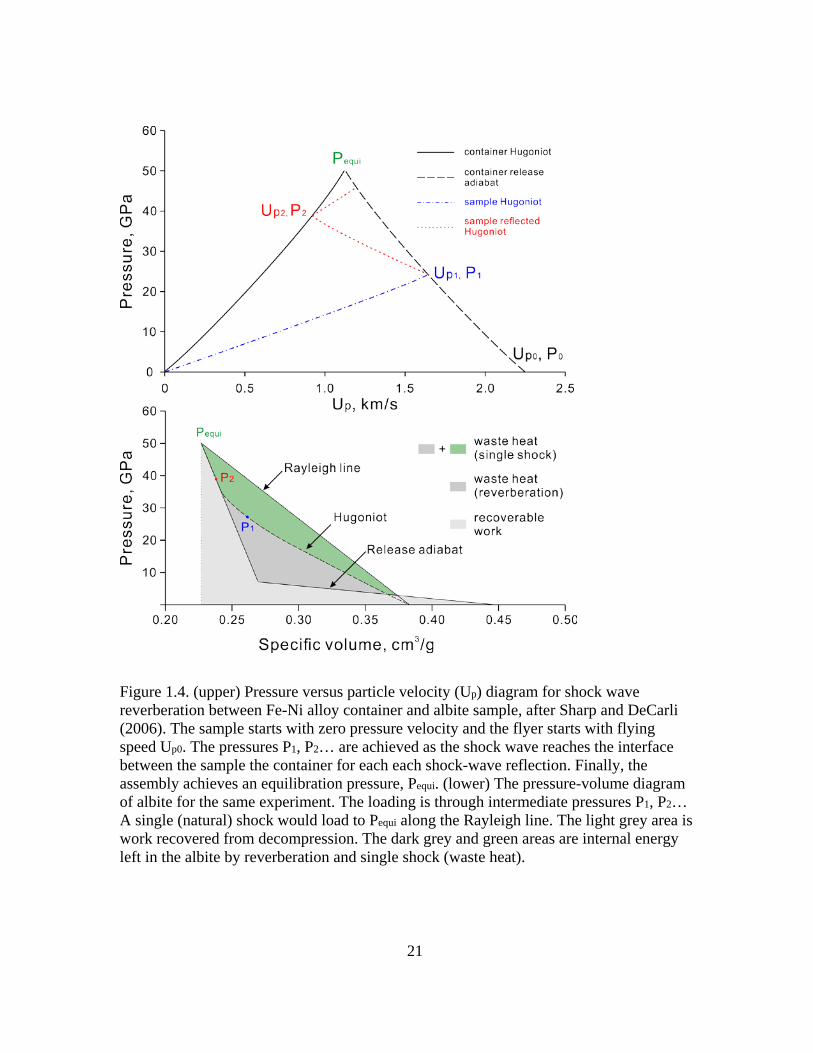
Figure 1.4 illustrates the shock loading by shock-wave reverberation, as used in
shock recovery experiments. In this example, the flyer and container are made of Fe-Ni
alloy and the sample is albite, both with known Hugoniot data (Sharp and DeCarli 2006).
At starting time t0, the flyer has a particle velocity Up0, which equals its speed. Before the
flyer hits the target, the pressure is ambient pressure (use zero for convenience) shown as
the (Up0,P0) point for the flyer and the (0,0) point for the sample assembly in Figure 1.4.
As the flyer contacts the sample assembly, it creates shock wave in the container and
reflected wave in itself of the opposite direction. At this moment, the container reaches
8
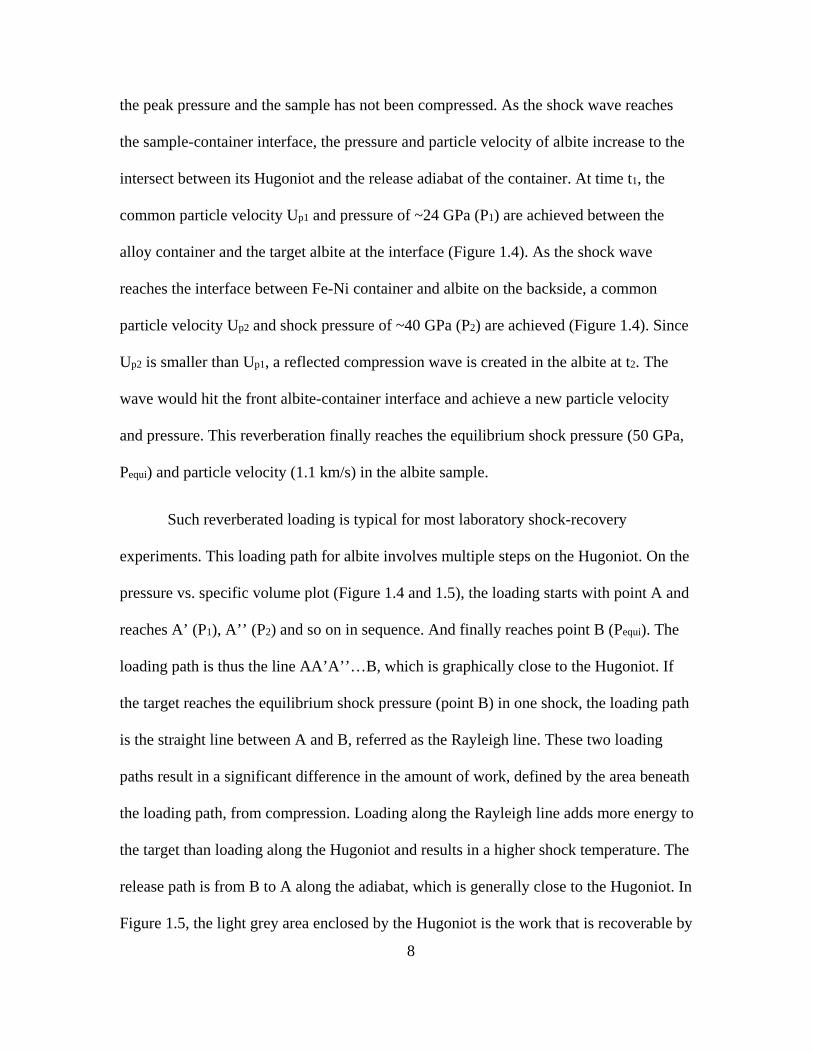
the peak pressure and the sample has not been compressed. As the shock wave reaches
the sample-container interface, the pressure and particle velocity of albite increase to the
intersect between its Hugoniot and the release adiabat of the container. At time t1, the
common particle velocity Up1 and pressure of ~24 GPa (P1) are achieved between the
alloy container and the target albite at the interface (Figure 1.4). As the shock wave
reaches the interface between Fe-Ni container and albite on the backside, a common
particle velocity Up2 and shock pressure of ~40 GPa (P2) are achieved (Figure 1.4). Since
Up2 is smaller than Up1, a reflected compression wave is created in the albite at t2. The
wave would hit the front albite-container interface and achieve a new particle velocity
and pressure. This reverberation finally reaches the equilibrium shock pressure (50 GPa,
Pequi) and particle velocity (1.1 km/s) in the albite sample.
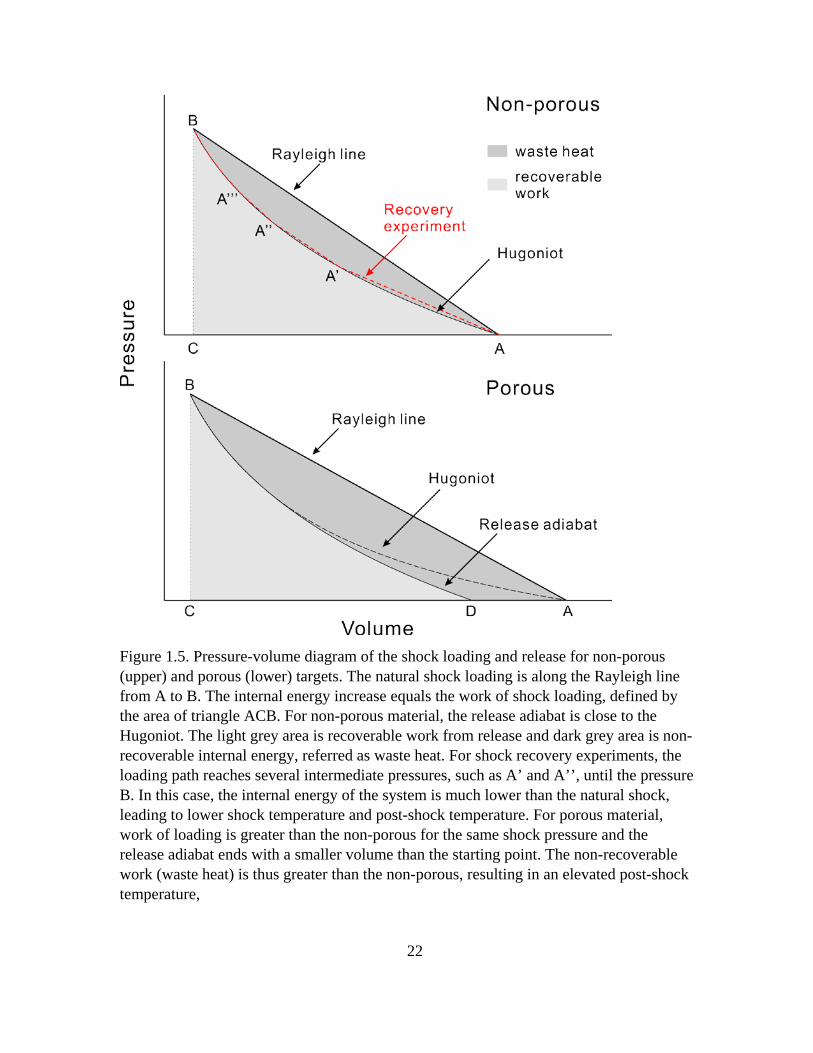
Such reverberated loading is typical for most laboratory shock-recovery
experiments. This loading path for albite involves multiple steps on the Hugoniot. On the
pressure vs. specific volume plot (Figure 1.4 and 1.5), the loading starts with point A and
reaches A’ (P1), A’’ (P2) and so on in sequence. And finally reaches point B (Pequi). The
loading path is thus the line AA’A’’…B, which is graphically close to the Hugoniot. If
the target reaches the equilibrium shock pressure (point B) in one shock, the loading path
is the straight line between A and B, referred as the Rayleigh line. These two loading
paths result in a significant difference in the amount of work, defined by the area beneath
the loading path, from compression. Loading along the Rayleigh line adds more energy to
the target than loading along the Hugoniot and results in a higher shock temperature. The
release path is from B to A along the adiabat, which is generally close to the Hugoniot. In
Figure 1.5, the light grey area enclosed by the Hugoniot is the work that is recoverable by
9
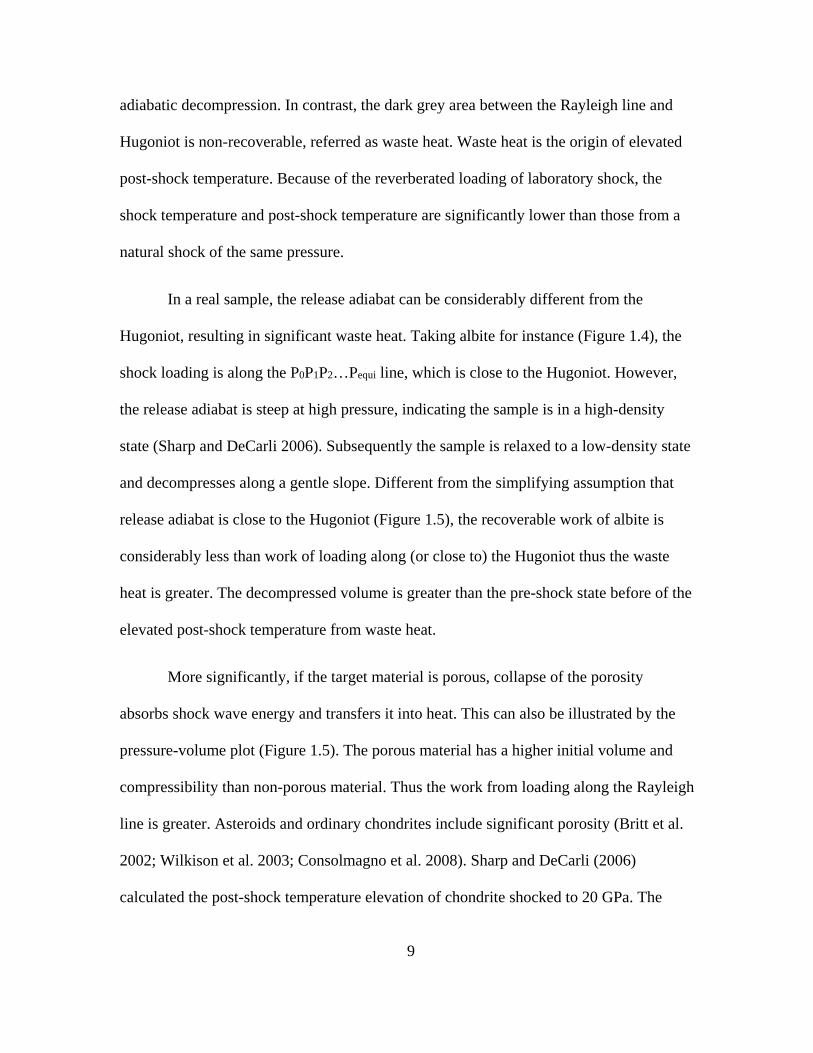
adiabatic decompression. In contrast, the dark grey area between the Rayleigh line and
Hugoniot is non-recoverable, referred as waste heat. Waste heat is the origin of elevated
post-shock temperature. Because of the reverberated loading of laboratory shock, the
shock temperature and post-shock temperature are significantly lower than those from a
natural shock of the same pressure.
In a real sample, the release adiabat can be considerably different from the
Hugoniot, resulting in significant waste heat. Taking albite for instance (Figure 1.4), the
shock loading is along the P0P1P2…Pequi line, which is close to the Hugoniot. However,
the release adiabat is steep at high pressure, indicating the sample is in a high-density
state (Sharp and DeCarli 2006). Subsequently the sample is relaxed to a low-density state
and decompresses along a gentle slope. Different from the simplifying assumption that
release adiabat is close to the Hugoniot (Figure 1.5), the recoverable work of albite is
considerably less than work of loading along (or close to) the Hugoniot thus the waste
heat is greater. The decompressed volume is greater than the pre-shock state before of the
elevated post-shock temperature from waste heat.
More significantly, if the target material is porous, collapse of the porosity
absorbs shock wave energy and transfers it into heat. This can also be illustrated by the
pressure-volume plot (Figure 1.5). The porous material has a higher initial volume and
compressibility than non-porous material. Thus the work from loading along the Rayleigh
line is greater. Asteroids and ordinary chondrites include significant porosity (Britt et al.
2002; Wilkison et al. 2003; Consolmagno et al. 2008). Sharp and DeCarli (2006)
calculated the post-shock temperature elevation of chondrite shocked to 20 GPa. The
10
elevation is ~ 100 K for non-porous target and 300 K for 7% porous target. With
increasing shock pressure, the temperature elevation is more significant on porous
material. Although shock experiments can be performed on porous starting material, most
shock recovery experiments used to calibrate shock pressures involved single crystals and
non-porous mono-mineralic rocks (Reimold and Stöffler 1978; Bauer 1979; Jeanloz 1980;
Ostertag 1983).
Finally, the shock pulse of the laboratory shock is limited by the size of the target
and projectile. The shock wave, which travels at several kilometers per second and
traverses the sample in nano- to micro-seconds. Asteroid collisions can make shock pulse
for seconds (Chen et al. 2004; Ohtani et al. 2004; Sharp et al. 2015). For the shock
features that are sensitive to kinetics, such as the transformation of silicates to their HP
polymorphs, shock-pulse duration and shock temperature are very important factors.
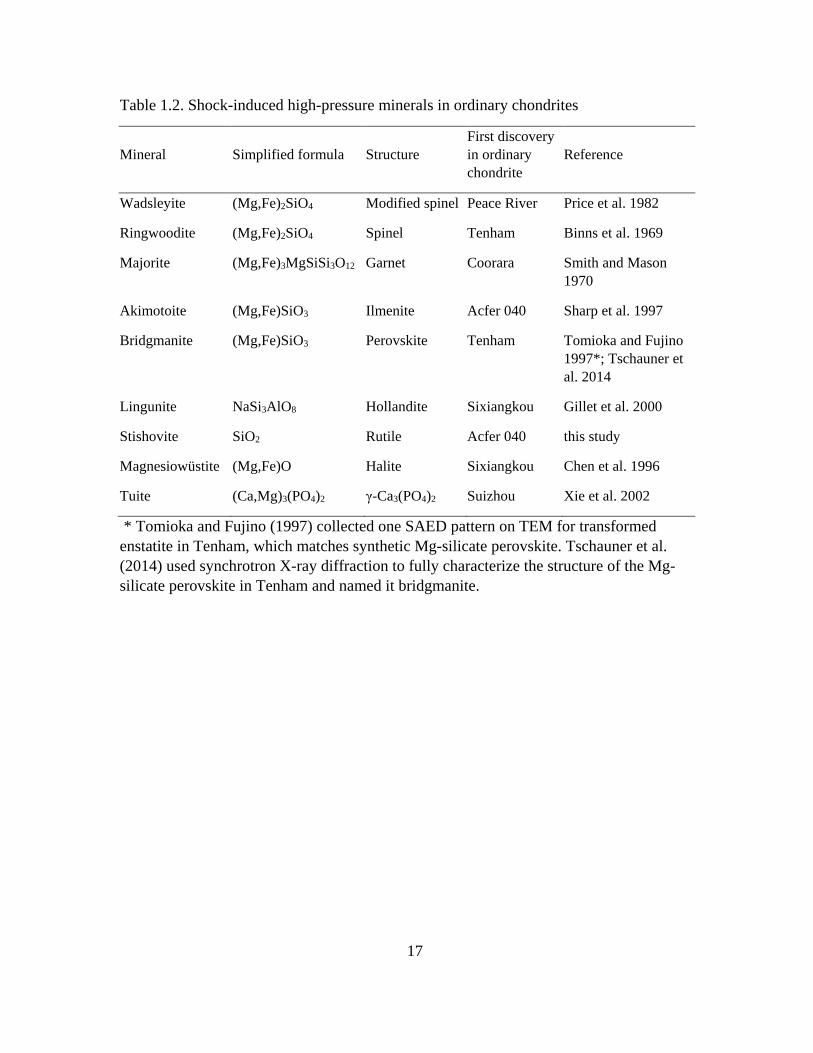
1.4 High-pressure minerals in shocked chondrites
The high-pressure (HP) polymorphs of rock-forming minerals in shocked
ultramafic meteorites are of great interest because they provide material that is assumed
to occur in the in the deep Earth. The first discovery of a mafic high-pressure mineral was
olivine’s polymorph with an inverse-spinel structure in L6 Tenham (Binns 1969). The
mineral was named ringwoodite after Australian mineral physicist A. E. Ringwood, who
was the first to synthesize it by static high-pressure experiments. Enstatite’s high-pressure
polymorph, majorite, was discovered soon after by Smith and Mason (1970). The
transformation from olivine to ringwoodite and wadsleyite in chondrites was studied in
detail to better understand the mineralogical composition and geophysical properties of
11
the mantle transition zone (Putnis and Price 1979; Price et al. 1982; Price 1983). Other
high-pressure minerals in chondrites include akimotoite (ilmenite structure MgSiO3;
Sharp et al. 1997), bridgmanite (perovskite structure MgSiO3; Tomioka and Fujino 1997;
Tschauner et al. 2014), lingunite (hollandite structure NaSi3AlO8; Gillet et al. 2000), tuite
(γ-Ca3(PO4)2; Xie et al. 2003). The HP minerals in ordinary chondrites are summarized in
Table 1.2.
The improvement of high-pressure apparatus (Graham 1986) has allowed
synthesis of the HP minerals commonly found in shocked chondrites. Since then, mineral
physicists have relied less on shocked meteorites to study the deep Earth but rather
provide accurate constraints on the P-T stabilities of the HP minerals in meteorites.
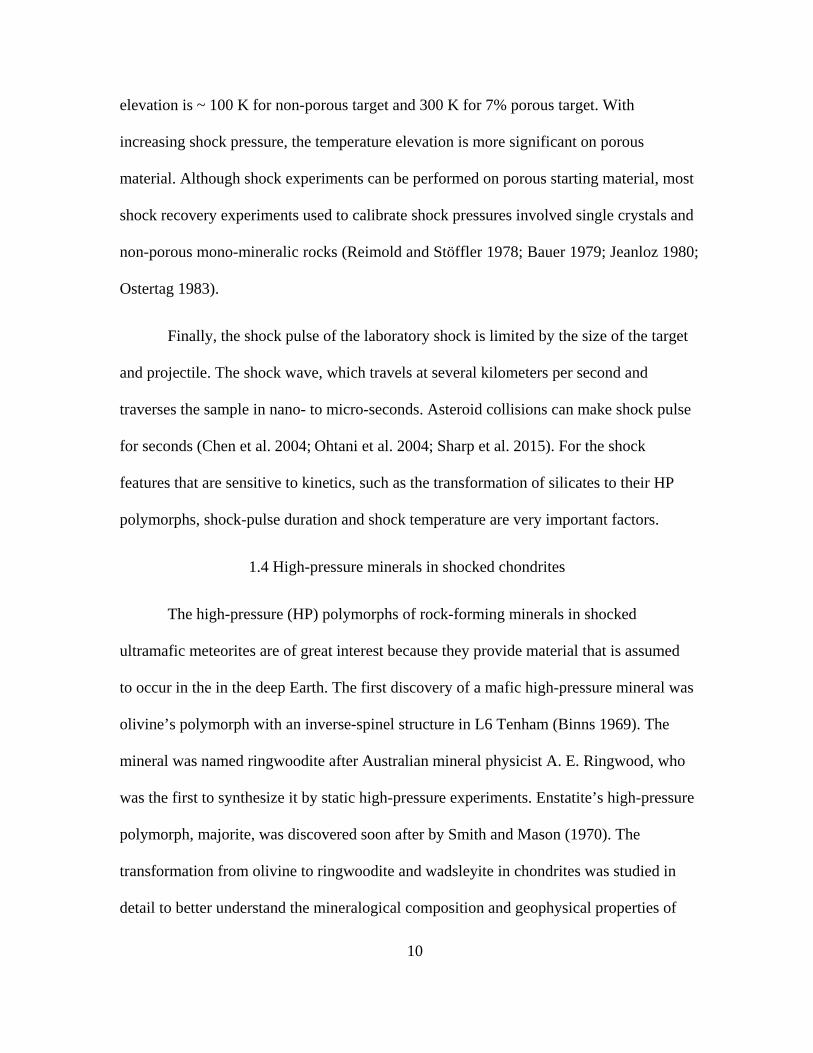
Figure 1.6 shows the mineralogical composition of Earth’s mantle as a function of depth
and shows the same HP minerals as those found in shocked chondrites. At 15-23 GPa,
ringwoodite, wadsleyite and majorite are predominantly. At higher pressure, bridgmanite
is the major constituent.
The shock induced high-pressure minerals in meteorites form either from solid-
state transformation in host-rock fragments entrained in the shock melt or from
crystallization of the shock melt. The shock melt, which quenches and crystallizes
quickly, produces a fine-grained assemblage that is relatively difficult to characterize.
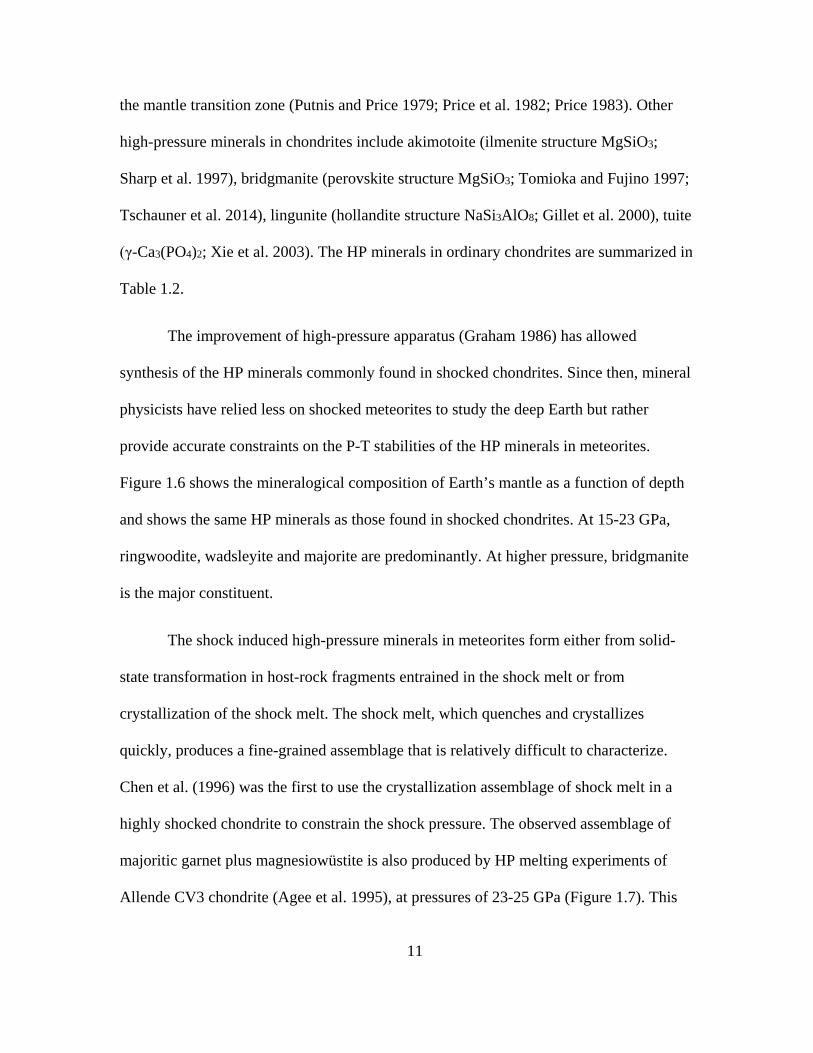
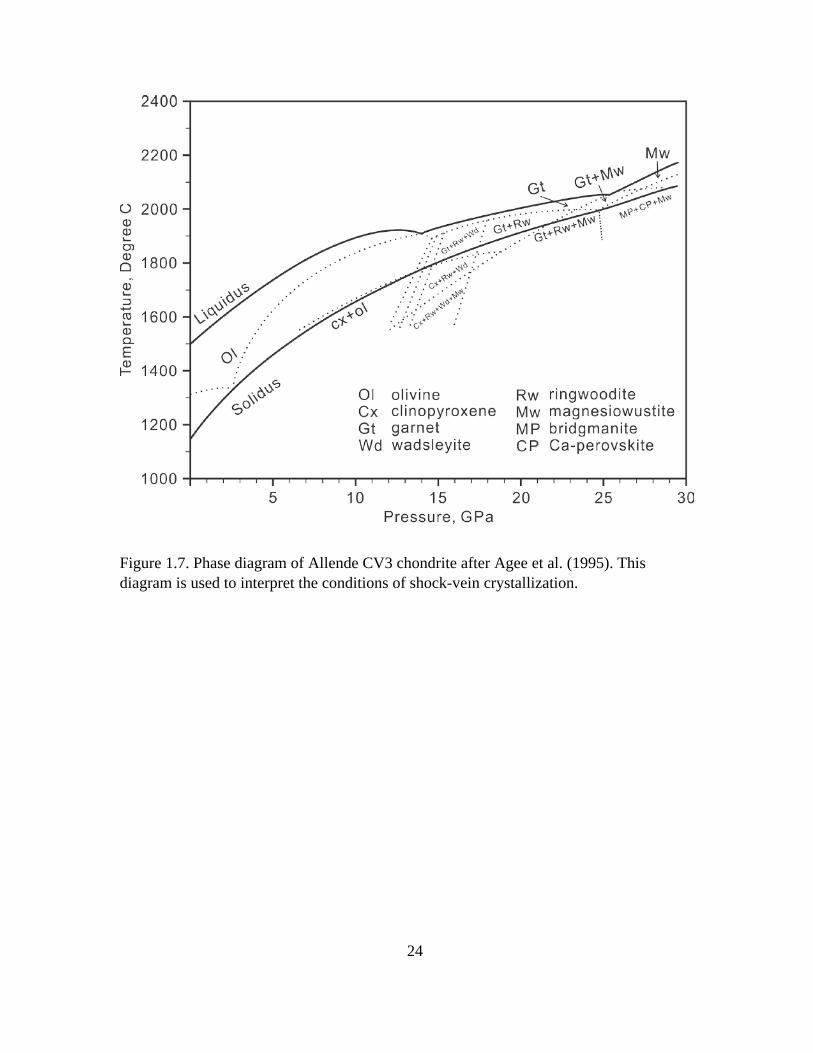
Chen et al. (1996) was the first to use the crystallization assemblage of shock melt in a
highly shocked chondrite to constrain the shock pressure. The observed assemblage of
majoritic garnet plus magnesiowüstite is also produced by HP melting experiments of
Allende CV3 chondrite (Agee et al. 1995), at pressures of 23-25 GPa (Figure 1.7). This
12
technique is advantageous for chondritic meteorites because chondritic (ultramafic) melts
crystallize rapidly at high pressure and preserve the crystallization history (Xie et al.
2006a).
The solid-state transformation of mafic minerals in shocked meteorite occurs
exclusively in association with shock melt. Besides high pressure, the transformation is
strongly dependent on temperature and therefore the temperature heterogeneities that
develop during shock. Because of the short duration of shock-induced high-pressure
pulse (milliseconds to seconds) in a hypervelocity planetary impact (Beck et al. 2005),
the reconstructive phase transformations of the mineral constituents of meteorites, to their
HP polymorphs, must occur very quickly. Local melting and the very high temperatures
associated with melting are required to create the reaction rates necessary to transform
minerals to their HP polymorphs during the shock pulse (Xie and Sharp 2007). Even for
the clasts entrained in the shock melt, temperature may not be sufficient to create
observable transformation. For example, the transformation of enstatite is more sluggish
than the olivine (Hogrefe et al. 1994; Kerschhofer et al. 2000) and enstatite clasts
commonly occur within shock melt without observable transformation where nearby
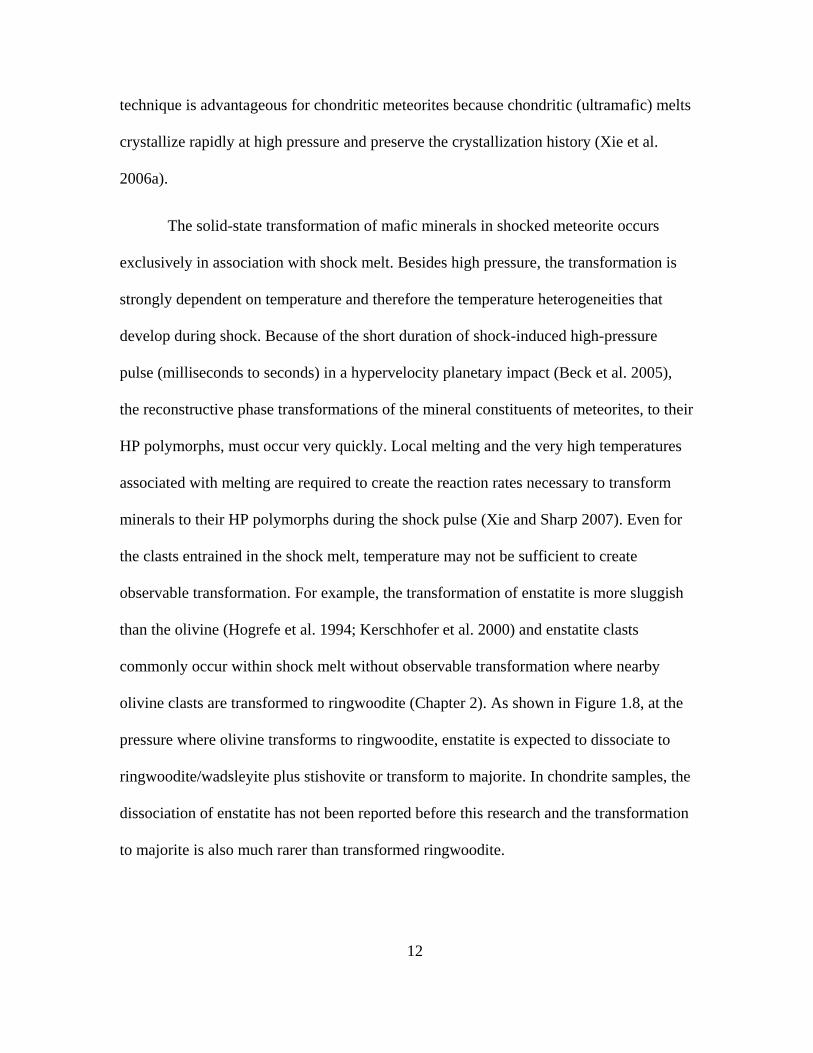
olivine clasts are transformed to ringwoodite (Chapter 2). As shown in Figure 1.8, at the
pressure where olivine transforms to ringwoodite, enstatite is expected to dissociate to
ringwoodite/wadsleyite plus stishovite or transform to majorite. In chondrite samples, the
dissociation of enstatite has not been reported before this research and the transformation
to majorite is also much rarer than transformed ringwoodite.
13
High pressure and high shock temperature are necessary but not fully sufficient to
result in observable HP minerals in shocked meteorites. Cooling of the meteorite after
pressure release is equally important for the occurrence of HP phases in shocked
meteorites (Chapter 4). The HP phases formed during the initial shock pulse are
metastable at low pressure and will transform back to low-density structures if
temperatures are sufficiently high. If the sample cools through a critical temperature
before becoming metastable, the HP phases are preserved. The critical temperature for
breakdown of a HP mineral is dependent on the thermodynamic stability of the mineral
and reaction rates (Chapter 3 and 4).
1.5 Impact history from shock metamorphism
As the shock temperature is controlled by the shock loading path and pre-shock
porosity, the shock pressure and pulse duration are dependent on the impact velocity and
size of the projectile, for a given target material. For shocked meteorites, the constraints
on shock pressure are provided by the HP mineral assemblage. The shock pulse duration
can be constrained by the growth kinetics of the HP minerals during transformation
(Chen et al. 2004; Xie and Sharp 2007; Miyahara et al. 2010), diffusion profiles in HP
minerals (Beck et al. 2005) and by the solidification time of a high-pressure melt
(Langenhorst and Poirier 2000; Ohtani et al. 2004; Xie et al. 2006a; Walton et al. 2014;
Sharp et al. 2015). All these estimates are based on the processes that occur only at high
pressure. Multiple studies agree that the shock pulse of typical S6 L chondrite is on the
order of seconds.
14
Ohtani et al. (2004) determined the shock pulse in L6 Y-791384 is ~ 20 GPa for 4
s. The authors used a simple planar-impact approximation to calculate the impact velocity
of 2 km/s (the calculation is also based on equation 1.1 and 1.2). In this approximation,
the 4 s duration is time for the shock wave and a rarefaction wave to traverse the
thickness of the projectile. The size of projectile, which is an estimate of colliding
asteroid on the L chondrite parent body, is then calculated and constrained to 10-15 km.
DeCarli et al. (2012) performed hydrocode simulations to reproduce the shock condition
of S6 chondrites and conclude that a colliding body of tens of kilometers in diameter is
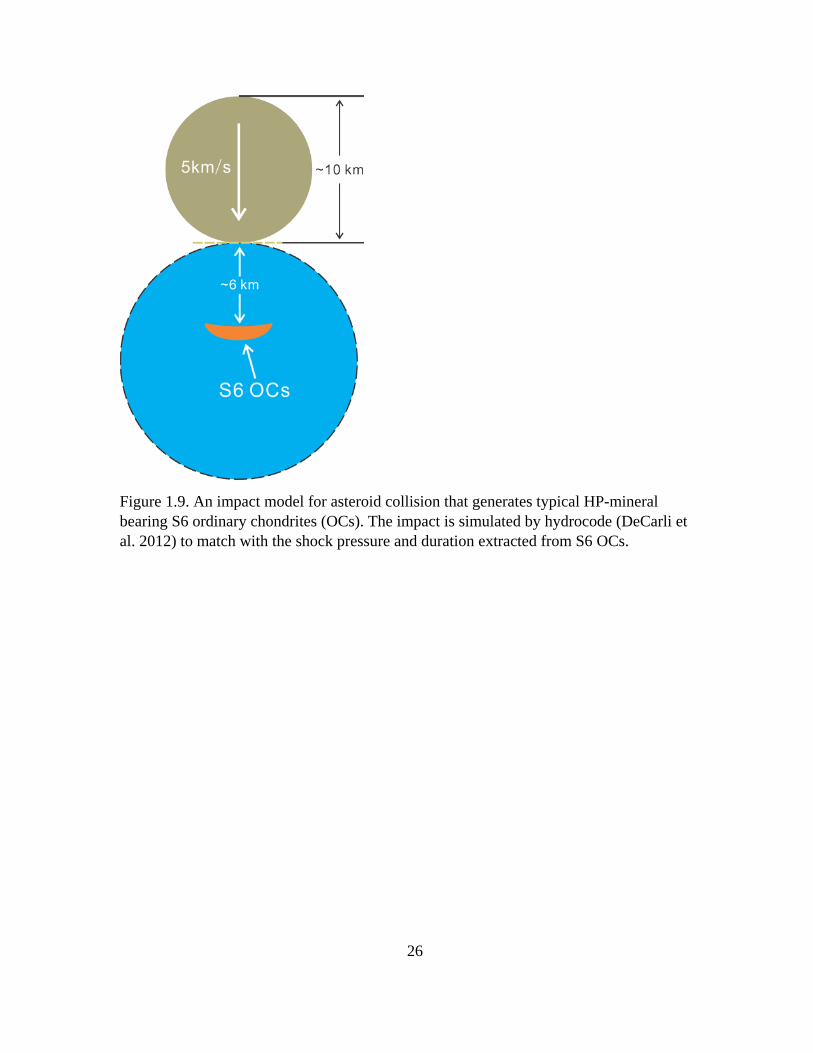
the most plausible (Figure 1.9). For the average impact velocity of 4.4-5.2 km/s between
main belt asteroids (Bottke et al. 1994), the parent bodies of S6 chondrites need to be tens
of kilometers to achieve the shock pulse of seconds. In contrast, the shock features in
Martian meteorites indicate high-pressures and short (micro- to mili-seconds) pulse
durations (Langenhorst and Poirier 2000), resulting from a hypervelocity (at least 5 km/s)
impact of a small near-Mars asteroid (Walton et al. 2014).
1.6 Impact of this research
In this study, I investigate the shock features in ordinary chondrite as a result of a
pressure – temperature – time path in addition to the peak shock pressure. With this
perspective, I explain the absence of high-pressure minerals and other shock signatures in
certain highly shocked chondrites (mostly melt breccias), the discrepancy between
coexisting shock features that suggest various shock stages in one sample, and the
mismatched pressure calibrations between static high-pressure and shock recovery
15
experiments. I also propose a revision to the currently used shock stage classification,
which reconsiders more of the estimates and effects of temperatures in shock.
1.7 Organization of the dissertation
Chapter 2, 3, 4 were written as journal articles. Each chapter is based on one
representative shocked ordinary chondrite sample. Chapter 5 includes some initial data
but is mostly a summary of all the samples and a proposal for revisions to the currently
used shock stage classification. The techniques used in this research include optical
microscopy, Raman spectroscopy, field-emission scanning electron microscopy, energy
dispersive X-ray spectroscopy, microprobe, focused ion beam lift-out technique,
analytical transmission electron microscopy, and synchrotron micro X-ray diffraction.
Each chapter has a detailed description of the techniques used for that article.
16
Table 1.1. Progressive stages of shock metamorphism of ordinary chondrites.
Shock stage Effects resulting from equilibration peak shock pressure
Effects resulting from local P-T-
excursions
Shock pressure,
GPa
Post-shock temperature increase, °C
Estimated minimum
temperature increase, °C
Olivine Plagioclase unshocked
S1 Sharp optical extinction, irregular
fractures none
<4-5 10-20 10 very weakly
shocked S2
Undulatory extinction, irregular fractures
none
5-10 20-50 20 weakly shocked
S3
Planar fractures, undulatory extinction, irregular fractures
Undulatory extinction
Opaque shock veins, incipient formation of melt pockets, sometimes interconnected 15-20 100-150 100
moderately shocked
S4
Mosaicism (weak), planar fractures
Undulatory extinction, partially isotropic, planar deformation features
Melt pockets, interconnecting melt veins, opaque shock veins
30-35 250-350 300 strongly shocked
S5
Mosaicism (strong), planar fractures + planar deformation features
Maskelynite Pervasive formation of melt pockets, veins and dikes; opaque shock veins
45-55 600-850 600 very strongly
shocked S6
Restricted to local regions in or near melt zones
as in stage S5
Solid state recrystallization and staining, ringwoodite, melting
Shock melted (normal glass)
75-90 1500-1750 1500 shock melted Whole rock melting (impact melt rocks and melt breccias)
From Stöffler et al. (1991)
17
Table 1.2. Shock-induced high-pressure minerals in ordinary chondrites
Mineral Simplified formula Structure First discovery in ordinary chondrite
Reference
Wadsleyite (Mg,Fe)2SiO4 Modified spinel Peace River Price et al. 1982
Ringwoodite (Mg,Fe)2SiO4 Spinel Tenham Binns et al. 1969
Majorite (Mg,Fe)3MgSiSi3O12 Garnet Coorara Smith and Mason 1970
Akimotoite (Mg,Fe)SiO3 Ilmenite Acfer 040 Sharp et al. 1997
Bridgmanite (Mg,Fe)SiO3 Perovskite Tenham Tomioka and Fujino 1997*; Tschauner et al. 2014
Lingunite NaSi3AlO8 Hollandite Sixiangkou Gillet et al. 2000
Stishovite SiO2 Rutile Acfer 040 this study
Magnesiowüstite (Mg,Fe)O Halite Sixiangkou Chen et al. 1996
Tuite (Ca,Mg)3(PO4)2 γ-Ca3(PO4)2 Suizhou Xie et al. 2002
* Tomioka and Fujino (1997) collected one SAED pattern on TEM for transformed enstatite in Tenham, which matches synthetic Mg-silicate perovskite. Tschauner et al. (2014) used synchrotron X-ray diffraction to fully characterize the structure of the Mg-silicate perovskite in Tenham and named it bridgmanite.
18
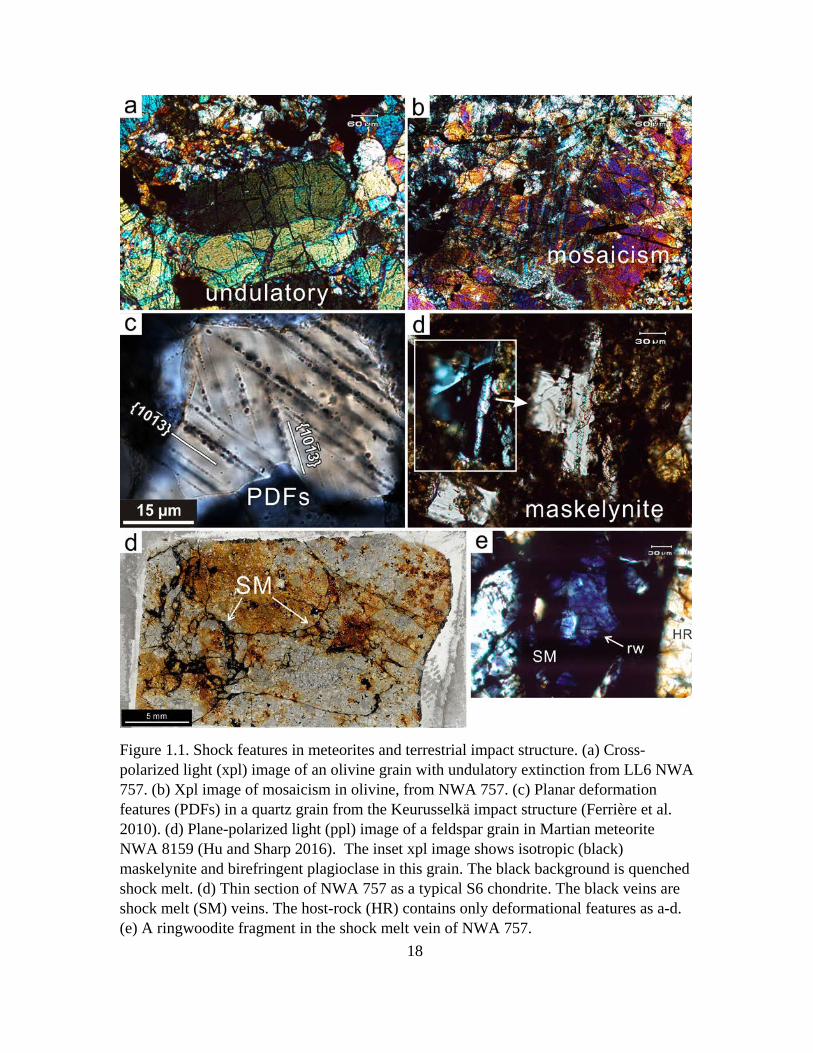
Figure 1.1. Shock features in meteorites and terrestrial impact structure. (a) Cross-polarized light (xpl) image of an olivine grain with undulatory extinction from LL6 NWA 757. (b) Xpl image of mosaicism in olivine, from NWA 757. (c) Planar deformation features (PDFs) in a quartz grain from the Keurusselkä impact structure (Ferrière et al. 2010). (d) Plane-polarized light (ppl) image of a feldspar grain in Martian meteorite NWA 8159 (Hu and Sharp 2016). The inset xpl image shows isotropic (black) maskelynite and birefringent plagioclase in this grain. The black background is quenched shock melt. (d) Thin section of NWA 757 as a typical S6 chondrite. The black veins are shock melt (SM) veins. The host-rock (HR) contains only deformational features as a-d. (e) A ringwoodite fragment in the shock melt vein of NWA 757.
19
Figure 1.2. Shock pressure for deformational and melting features in olivine, calibrated by shock-recovery experiments on olivine single crystals and dunite, from Bauer 1979. The deformational features, including planar fractures, undulatory extinctions and mosaicism, can occur in a wide range of pressures. The faded ends of the colored bands indicate uncertain pressure bounds. The pressure of melting is strongly dependent on the pre-shock condition of the sample. The olivine single crystal requires > 80 GPa shock pressure for whole-rock melting and recrystallization. In contrast, for high-porosity particulate dunite, melting and recrystallization can occur locally at much lower pressures.
20
Figure 1.3. Simplified sample assembly of shock recovery experiment. The flyer and container (light grey) are commonly made of high shock-impedance material, such a steel. The sample (dark grey) is entrained in and protected by the strong container so that it can be recovered. The flyer hits the assembly and creates shock wave in the direction of the solid arrows.
21
Figure 1.4. (upper) Pressure versus particle velocity (Up) diagram for shock wave reverberation between Fe-Ni alloy container and albite sample, after Sharp and DeCarli (2006). The sample starts with zero pressure velocity and the flyer starts with flying speed Up0. The pressures P1, P2… are achieved as the shock wave reaches the interface between the sample the container for each each shock-wave reflection. Finally, the assembly achieves an equilibration pressure, Pequi. (lower) The pressure-volume diagram of albite for the same experiment. The loading is through intermediate pressures P1, P2… A single (natural) shock would load to Pequi along the Rayleigh line. The light grey area is work recovered from decompression. The dark grey and green areas are internal energy left in the albite by reverberation and single shock (waste heat).
22
Figure 1.5. Pressure-volume diagram of the shock loading and release for non-porous (upper) and porous (lower) targets. The natural shock loading is along the Rayleigh line from A to B. The internal energy increase equals the work of shock loading, defined by the area of triangle ACB. For non-porous material, the release adiabat is close to the Hugoniot. The light grey area is recoverable work from release and dark grey area is non-recoverable internal energy, referred as waste heat. For shock recovery experiments, the loading path reaches several intermediate pressures, such as A’ and A’’, until the pressure B. In this case, the internal energy of the system is much lower than the natural shock, leading to lower shock temperature and post-shock temperature. For porous material, work of loading is greater than the non-porous for the same shock pressure and the release adiabat ends with a smaller volume than the starting point. The non-recoverable work (waste heat) is thus greater than the non-porous, resulting in an elevated post-shock temperature,

23
Figure 1.6 Volume fraction of minerals in a peridotite mantle (from Ito and Takahashi 1987). The grey areas are mixed olivine (α), wadsleyite (β) and ringwoodite (γ). Garnet (gnt), clinopyroxene (cpx) and orthopyroxene (opx) occur in the upper mantle. Stishovite (st), calcium (Ca-P) and aluminum (Al-P) rich phases occur in small amount in the lower mantle. Magnesiowüstite (MW) and bridgmanite are major constituents of the lower mantle.
24
Figure 1.7. Phase diagram of Allende CV3 chondrite after Agee et al. (1995). This diagram is used to interpret the conditions of shock-vein crystallization.

25
Figure 1.8. Phase diagrams of Mg1.8Fe0.2SiO4 (left; after Katsura and Ito 1989; Ito and Takahashi 1989) and MgSiO3 (right; after Fei and Bertka 1999), showing the pressure-temperature stability of olivine and enstatite polymorphs. The dissociation of enstatite to ringwoodite (rwd), wadsleyite (wads) plus stishovite (st) has not been reported in shocked meteorite before this research.
26
Figure 1.9. An impact model for asteroid collision that generates typical HP-mineral bearing S6 ordinary chondrites (OCs). The impact is simulated by hydrocode (DeCarli et al. 2012) to match with the shock pressure and duration extracted from S6 OCs.
27
Chapter 2
High-Pressure Phases in Shock-induced Melt of the Unique Highly Shocked LL6
Chondrite Northwest Africa 757
2.1 Introduction
Hypervelocity impact has been a fundamental process affecting planets and
asteroids through the evolution of the solar system. As a direct product of planetary
collisions, shock metamorphism in meteorites provides important material to study the
impact histories of their parent bodies. High-pressure minerals are useful indicators of
shock pressure, temperature and pulse duration (Sharp and DeCarli 2006), which are
critical for estimating the impact conditions such as the impact velocity, projectile size
and composition (Melosh 1989). Two major issues need to be addressed to better
understand the correlation between meteorite shock features and planetary impact
conditions. First, the pre-shock condition of the parent body, even on a microscopic scale,
has a strong influence on the resulting shock features. The chemical composition,
mineralogy, fracture density, porosity and grain size of the pre-shocked sample all
determine the way that a shock wave interacts with the material (Melosh 1989). Shock-
induced melting on a millimeter-scale can cause high local temperatures that facilitate the
formation of shock indicators, particularly high-pressure minerals (Langenhorst and
Poirier 2000). However, the pre-shock conditions for shocked samples are poorly
constrained on a microscopic scale. Second, shock wave propagation is a dynamic
process that can produce a variety of shock features in a single shock event. Co-existence
of different shock features, forming under varying shock pressure might suggest different
28
shock levels (Xie et al. 2006a; Sharp and DeCarli 2006). For example, in the highly
shocked shergottite Tissint, olivine fragments transformed to ringwoodite are surrounded
by shock melt that crystallized olivine and pyroxene (Walton et al. 2014). These features,
which respectively correspond to pressures > 17 GPa and < 14 GPa, record pressure
evolution during decompression (Walton et al. 2014). To better understand these issues, it
is important to investigate a variety of meteorite samples with different pre-shock
conditions and shock histories. However, the availability of highly-shocked meteorites is
limited to several groups. The large population of ordinary chondrites contains many
highly shocked samples, but primarily in the L group (Stöffler et al. 1991). On the
contrary, there are very few highly shocked samples in the LL chondrite group to
constrain the impact history of the LL parent body.
Many highly shocked L chondrites have been investigated in detail (Chen et al.
1996; Ferroir et al. 2008; Miyahara et al. 2009; Ohtani et al. 2004; Ozawa et al. 2009;
Sharp et al. 1997; Tomioka and Fujino 1997; Tschauner et al. 2014; Xie et al. 2006a,
2006b). These studies have provided fundamental knowledge about the nature of shock
metamorphism in meteorites. The high-pressure assemblages in L chondrites commonly
include ringwoodite, wadsleyite, garnet, akimotoite, vitrified bridgmanite and
magnesiowüstite plus magnetite. Thermodynamic properties of these minerals indicate a
shock pressure up to ~ 25 GPa (Sharp et al. 1997; Tschauner et al. 2014). Moreover, the
shock-pulse durations in L chondrites have been estimated, by shock-melt quench history
(Sharp et al. 2015), high-pressure transformation kinetics (Chen et al. 2004; Miyahara et
al. 2010) and element diffusion (Beck et al. 2005), to be hundreds of milliseconds to
several seconds. The shock pressure (P)-temperature (T)-time (t) history extracted from
29
meteorites reflects the impact velocity and projectile size on the meteorite parent body.
Ohtani et al. (2004) and DeCarli et al. (2012) used the estimates of shock duration to
constrain the size of the impactor on the L parent body, employing a planar impact
approximation and hydrocode simulations, respectively. These two studies both
concluded that the L chondrite parent body was impacted by a projectile > 10 km in
diameter. Noble gas age dating of many shocked L chondrites records a large impact at
~470 Ma (Turner 1969; McConville et al. 1988; Bogard 1995; Korochantseva et al. 2007;
Weirich et al. 2012), which is consistent with evidence for a long shock duration.
Although the L chondrites provide useful material for understanding shock effects,
their origin in a relatively young catastrophic impact event may not be representative of
asteroid impact histories. It is essential to investigate shock metamorphism in other types
of chondrites to learn more about broader asteroid impact histories. Unlike the shocked L
chondrites, H chondrites record diverse impact ages older than 3.5 Ga and younger than
1.0 Ga (Bogard 1995; Swindle et al. 2014). The older ages record early accretion (> 4400
Ma) and late heavy bombardment (3500-4100 Ma). The diverse ages younger than 1000
Ma suggest either several impact events or partial resetting by at least one young impact
at ~280 Ma (Swindle et al. 2014). The same high-pressure assemblages that occur in
highly shocked L chondrites have been reported for H chondrites but in fewer samples
(Kimura et al. 2000, 2003). Distinct from L and H ordinary chondrites, shock effects in
LL chondrites have not been extensively observed or studied. Except for those in NWA
757, jadeite, reported in LL5 chondrite Y-8410 (Kimura et al. 2001) and in the
Chelyabinsk LL5 chondrite (Ozawa et al. 2014), is the only high-pressure mineral
reported in LL chondrites. Both of these studies interpret a lower shock pressure and a
30
shorter shock duration than those of highly shocked L chondrites and they infer a less
intense impact event on the LL source body. The paucity of highly shocked LL
chondrites suggests that either the LL-chondrite parent body did not experience intense
asteroid impacts, or highly shocked materials from the LL parent body have not been
stochastically captured by the Earth. NWA 757 is a unique high-pressure mineral bearing
LL chondrite that provides new information about impacts on its parent body.
Bischoff (2002) reported olivine transformation to ringwoodite in the LL6
chondrite NWA 757. It is the only report of high-pressure mineral in LL chondrites. In
this study, I investigated the high-pressure minerals in NWA 757, formed by solid-state
transformation and by shock-melt crystallization, to determine shock conditions. The P-
T-t history is compared with those from highly shocked L chondrites. I use the shock
features in NWA 757 to discuss possible impact conditions and history of LL chondrite
parent bodies.
2.2 Sample and Methods
NWA 757 is an ordinary chondrite that was purchased in Rissani, Morocco and
classified as petrologic type LL6, shock stage S4 and weathering grade W2 (Bischoff
2002). The thin section PL01135 in this study was provided by the Institut für
Planetologie /ICEM. The petrologic microscope was used to document melt-vein
thickness and internal textures and to identify mineral fragments transformed to high-
pressure minerals such as ringwoodite. Transformed fragments were confirmed by
Raman spectroscopy, using a 532 nm unpolarized laser with power of 1.3-6.5 mW. The
laser is focused by a 50X objective lens with 1 cm focal length. The laser spot size on the
31
sample is 0.5 µm. Spectra were collected from 100 to 2200 cm-1 for 20-60 seconds.
Detailed shock vein textures were investigated by scanning electron microscopy (SEM)
using an FEI XL30 with a field-emission gun and energy dispersive X-ray spectroscopy
(EDS). The typical SEM operating conditions included an accelerating voltage of 20 keV,
a working distance of 5 to 11 mm, and a probe current of 3 to 10 nA. EDS with an EDAX
SiLi EDS X-ray detector was employed to acquire chemical compositions of mineral
phases of interest. The setup used a process time of 4-10 μs for count rates greater than
1000 counts per second and up to 30% dead time. Absorption and fluorescence effects
were corrected with a ZAF model. Raman spectroscopy and SEM were done in the
LeRoy-Eyring Center for Solid State Science (LE-CSSS) at Arizona State University.
Shock-vein mineralogy and microstructures were investigated with Transmission
Electron Microscopy (TEM) using an FEI CM200-FEG in the LE-CSSS. TEM samples
were prepared by focused-ion beam (FIB) lift-out techniques with an FEI Nova200
NanoLab. The CM200 was operated at 200 kV. Bright-field TEM imaging was used to
investigate melt-vein textures, mineral intergrowths and defects. Mineral phases were
identified by selected area electron diffraction (SAED), accompanied by EDS chemical
analysis using an EDAX SiLi EDS X-ray detector. Quantitative EDS data processing was
performed with an Emispec Vision system.
Synchrotron micro X-ray diffraction was performed on the thin section at GSE-
CARS at the Advanced Photon Source, Argonne National Lab, using the sector 13BM-D
bending magnet, which has a 5 x 12µm focused X-ray beam. An X-ray energy of 30 keV
(λ=0.4137Å) was used for the analysis. Refinement was performed with GSAS software
32
(Larsen and Von Dreele 1994; Toby 2001) with initial peak shape defined by the 13BM-
D instrumental parameter file. Cell parameters, intensity scaling and peak shape were
refined in the software.
2.3 Results
2.3.1 Petrography
The host-rock of NWA 757 consists of olivine, enstatite, diopside, plagioclase
plus minor Fe-Ni alloy, troilite, and chromite. The host rock is mostly recrystallized
overall. However, several chondrules can still be delineated in the thin section and they
show metamorphosed barred olivine or porphyritic olivine textures. Bischoff (2002)
analyzed compositions of olivine and low-Ca pyroxene as 28.1±0.7 mole% fayalite and
23.4±0.8 mole% ferrosilite. The host-rock olivine and pyroxene grains, up to a few
hundred microns in size, have abundant irregular and planar fractures. Some olivine
grains (less than 10%) show strong mosaicism or undulatory extinction (Figure 2.1a)
while most of the grains (more than 50%) have weak undulatory or sharp extinction
under cross polarized light. Plagioclase grains are commonly larger than 100 µm. Some
poorly recrystallized plagioclase aggregates with grain size below 10 μm (Figure 2.1e)
suggest heterogeneous thermal metamorphism. Maskelynite co-exists with crystalline
plagioclase throughout the thin section (Figure 2.1c). Based on the fact that more than 25%
of the feldspar is crystalline plagioclase (Stöffler et al. 1991), Bischoff (2002) classified
the shock stage as S4. However, the high-pressure minerals associated with the shock
melt indicate shock stage S6. The S6 features and high-pressure phases are characterized
in the next section. Secondary oxide veins and calcium-rich veins are inferred to be a
33
result of weathering. These secondary veins cut through the shock-induced melt veins,
suggesting a late epigenetic origin. Dark orange staining of the host rock through the thin
section (Figure 2.2a) is mostly from terrestrial oxidation. Most iron-sulfide grains are
fresh, which is consistent with weathering grade W2.
The shock-induced melt in NWA 757 occurs as a complex network of shock veins
and melt pockets (Figure 2.2a). The shock vein widths vary from 1 mm to several
microns. The shock melt consists of quenched immiscible silicate plus metal/sulfide
liquids. Finely disseminated metal/sulfide droplets (Figure 2.2e) and aggregates make the
shock melt opaque in thin section (Figure 2.2d). The host-rock fragments included in the
shock veins and melt pockets range from 10 to 500 µm in size. Abundant high-pressure
minerals in the shock melt indicate a shock stage of S6. The apparent inconsistency
between S6 shock melt and the S4 host rock is discussed in following sections.
2.3.2 Solid-state transformation
In the shock melt, the host-rock fragments of olivine-composition are completely
or partially polycrystalline ringwoodite aggregates. The ringwoodite varies in color from
dark blue to light blue, light green and colorless in plane polarized light. Continuous
variation in color is visible in large individual fragments (Figure 2.2b, c & d). Raman
spectral characteristics of ringwoodite vary with color. All the ringwoodite spectra have
the broad 230 cm-1 peak with a strong background from fluorescence (Figure 2.3). The
relative intensity of the fluorescent background is lower in colorless ringwoodite. Spectra
of blue and green ringwoodite show diagnostic 799 and 842 cm-1 peaks (Figure 2.3)
while these peaks are weaker in colorless ringwoodite. Most ringwoodite fragments are
34
uniform with no distinguishable reaction textures or chemical heterogeneity visible in
back-scattered electron (BSE) images, indicating that most olivine fragments within the
shock vein were completely transformed to fine-grained ringwoodite aggregates. The
homogeneous ringwoodite aggregates in BSE images suggest that the reaction was
interface controlled, with no iron segregation between ringwoodite and olivine during the
transformation (Kerschhofer et al. 1998). However, several unusual fragments have the
two olivine Raman peaks, at 824 cm-1 and 853 cm-1, combined with the broad
ringwoodite peak at 232 cm-1. Inferred from the contrast variation in the BSE images and
Raman spectra, these are partially transformed olivine fragments with lamellar
ringwoodite intergrowths (Figure 2.4a). These ringwoodite lamellae have variable
orientations and thicknesses. Nano-scale lamellae of two predominant directions cross
with an angle of approximately 60°/120°. Thicker lamellae (1 µm) are less regularly
oriented. These lamellar features are similar to those reported in Sixiangkou and Y-
791384 L6 chondrites (Chen et al. 2004; Miyahara et al. 2010). Future work is needed to
confirm the crystallographic and interface relationships between olivine and ringwoodite.
In these partially transformed fragments, the ringwoodite is most abundant at the edges in
contact with the shock melt (Figure 2.2c & d).
In the shock melt, both low-Ca and high-Ca pyroxene fragments are common.
Raman spectroscopy shows that they are clinoenstatite and diopside (Figure 2.3). No
evidence for pyroxene transformation to high-pressure polymorphs has been found in this
sample. The pyroxene fragments in melt veins are homogeneous in both PPL and BSE
images. They commonly have sharp extinction and a low density of irregular fractures
(Figure 2.2b).
35
Ca-phosphate in the shock melt occurs as small accessory clasts. Raman spectra
indicate that they are tuite (high-pressure γ-Ca3(PO4)2; Figure 2.3). The diagnostic peaks
match well with tuite from shocked chondrites and γ-Ca3(PO4)2 synthesized by high-
pressure experiments (Xie et al. 2013). The tuite clasts are commonly smaller than 10 µm
in size and homogeneous in BSE images.
Polymorphic phases of feldspar include shocked plagioclase, maskelynite, normal
glass and lingunite. Apart from shock-melt veins, the feldspar is either crystalline
plagioclase or maskelynite (diaplectic glass). Locally maskelynite and plagioclase coexist
in one grain (Figure 2.1c). The Raman spectrum from maskelynite shows broad peaks at
490 and 594 cm-1 (Figure 2.3). The maskelynite is optically isotropic and surrounded by
radial fractures that indicate a large expansion during decompression. The feldspar near
the melt veins has optical isotropy, flow features and silicate fragment inclusions (Figure
2.5a). These grains are inferred to be normal glass quenched from feldspar melt. Some
plagioclase fragments within shock veins have Raman spectra (Figure 2.3) consistent
with lingunite, the high-pressure polymorph of plagioclase with the hollandite structure.
Lingunite fragments occur exclusively in shock melt and coexists with ringwoodite and
enstatite clasts, entrained in one of the thickest melt pockets (Figure 2.5b).
2.3.3 Shock-melt crystallization
The melt-vein matrix consists of silicate plus oxide minerals and metal-alloy plus
iron-sulfide droplets. As in other shocked chondrites (Chen et al. 1996), this mixture is
inferred to represent immiscible silicate and metal-sulfide liquids that are rapidly
quenched during shock to preserve high-pressure phases. In this sample, there are two
36
distinct shock-vein quench textures and assemblages (Table 2.1), Type HP (higher
pressure) and Type LP (lower pressure), which are distinguishable by XRD, SEM and
TEM observations.
Type HP quenched melt. The Type HP melt matrix occurs mostly in the thick melt
veins and pockets. This matrix consists of equant-subhedral silicate crystals and two
interstitial phases with lighter BSE-contrast as well as disseminated metal-sulfide
droplets or veins (Figure 2.4b). Synchrotron X-ray diffraction patterns indicate the
occurrence of garnets, troilite and metallic iron (Figure 2.6). Refinement of the XRD
patterns gives the garnet space group Ia-3d and unit cell parameter 11.53Å. The space
group and unit cell parameters of troilite are P-62c, a=5.98 Å and c=11.70 Å. TEM
SAED patterns show that the equant silicates in BSE images are garnets and the two
bright phases in between are ringwoodite and magnetite. EDS analysis of the garnet
(Na0.15Ca0.23Fe0.96Cr0.02Mg2.4Al0.36Si0.88Si3O12) indicates a large majorite component
(majoritic garnet) with 0.88 pfu excess silicon in the octahedral site (Table 2.2). Previous
studies described the garnet crystallized from shock melt in chondrites as majorite-pyrope
solid solution (Chen et al. 1996; Miyahara et al. 2010). However, my and previous data
commonly indicate the garnet has a grossular component as well as sodium. The sodium
endmember MgNa2Si5O12 has not been named (Grew et al. 2013). Therefore, I use
majoritic garnet to describe the garnet with a high majorite fraction and other components
in addition to pyrope.
The ringwoodite (Fd-3m) crystals are anhedral and full of dislocations and localized
strain (Figure 2.7b). Although magnesiowüstite is the oxide phase expected from
37
chondritic melt crystallization at high pressure, magnetite occurs in the Type HP
assemblage. Previous studies have interpreted topotaxially intergrown magnetite and
magnesiowüstite, with the crystallographic relationship <110>Mw||<110>Mag, to be a result
of exsolution from a ferric-iron bearing magnesiowüstite (Chen et al. 1996; Xie et al.
2006a). The magnetite-wüstite in NWA 757 shock melt occurs either as triangular
interstitial crystals between garnets (Figure 2.7a), or in association with wadsleyite
(Figure 2.7c). The contrast in the images indicates local strain that is likely associated
with intergrown magnetite and wüstite. Wadsleyite (Imma) occurs locally and in
association with magnetite. SADP shows the wadsleyite-magnetite assemblage has an
orientation relationship such that <110>Mag||<212>Wads. The overlapping diffraction spots
in this zone axis pattern indicate parallel planes {111}Mag||{101}Wads and
{004}Mag||{240}Wads (Figure 2.7c). This crystallographic relationship is the same as the
wadsleyite-magnetite association from the shock melt in L6 chondrite Roosevelt County
106 (Sharp et al. 2015). The crystal size in the matrix is typically 1µm for the garnet, 300
nm for the ringwoodite and 100 nm for the magnetite. The silicate minerals are all finer
than 100 nm at the edge of the vein (Figure 2.4b).
Polycrystalline weathering products (Figure 2.7f) commonly occur next to the iron-
oxide grains and are inferred to result from terrestrial weathering of residual silicate glass
left by fractional crystallization of garnet and magnesiowüstite. The texture of the
weathering phases is similar to the clay minerals from weathered glass in L6 chondrite
RC 106 (Sharp et al. 2015). The very low contrast materials between garnet crystals in
the BSE images correspond to the residual glass or clays (Figure 2.4b). The soft clay may
also be polished out in sample preparation, leaving dark contrast voids in BSE images.
38
The abundance and morphology of metal-sulfide varies throughout the Type HP
matrix. In a melt pocket of 100 µm width, the sulfide occurs as well defined spheroidal
droplets up to 10 μm in diameter near the pocket edge (Figure 2.4c). The droplets are
mixtures of troilite and round particles of Fe-Ni metal. Synchrotron XRD indicates the
co-existence of both face-centered cubic and body centered cubic iron alloy (Figure 2.6).
For the melt pocket interior, the quenched sulfide melt forms a network of veins (Figure
2.4c). Many silicate inclusions are entrained in the sulfide veins. The metal particles are
much less common in the sulfide veins than in the droplets, indicating a heterogeneous
composition of the metal-sulfide melt (Figure 2.4b & c). In another melt pocket, the
quenched sulfide does not preserve the shape of immiscible droplets (Figure 2.4f).
Anhedral sulfide, enriched in iron-nickel particles, fills interstices between the garnet
crystals (Figure 2.4f).
Type LP quenched melt. The other type of quenched melt matrix is distinctively
different in texture and mineralogy from Type HP. It occurs in both thin and thick melt
veins. Two fine-grained silicate phases with round sulfide droplets are predominant in
matrix Type LP (Figure 2.4d). TEM SAED indicates the dark BSE contrast phase is
clinopyroxene (P21/c). EDS analysis indicates the pyroxene is sodium-bearing pigeonite
(Table 2.2). The elongated bright contrast phases are wadsleyite and trace ringwoodite.
Common <010> stacking faults occur in the wadsleyite and their resulting stacking
disorder is indicated by the streaks along b* in the diffraction pattern (Figure 2.7e). The
silicates are typically 200-500 nm in size at the melt vein interior, grading into finer-
grained crystals at the melt-vein edge. Sulfide droplets in the Type LP matrix are
consistently round and vary in size from sub-micron to 10 microns.
39
I measured the bulk compositions of Type HP and LP matrices by SEM-EDS.
Each analysis is a raster on at least 5×5 µm2 area (Table 2.3), targeted to exclude the
sulfide droplets from these analyses. This is confirmed by the lack of detectable sulfur.
However, a small amount of phosphate is detected in the Type HP matrix analysis. The
two matrix types are not significantly different in most major elements. The Type LP
matrix is slightly more enriched in iron and depleted in silicon. The major difference is
that the concentration of sodium in Type LP is about twice of that in Type HP.
The two matrix types occur mostly in separate melt veins but they are in contact
locally in several melt pockets (Figure 2.4e & f). Their contact boundaries are not
generally well defined (Figure 2.4e). Both matrices are relatively fine-grained on the
boundary. Sulfide droplets commonly have similar sizes and textures through the two
melts (Figure 2.4e). The melt pocket in Figure 2.4f shows a better-defined boundary
between the two matrices. The different shapes and abundance of sulfide make the matrix
type transition appear sharp. The Type LP matrix clearly becomes fine grained towards
the host-rock. In contrast, the Type HP matrix has less grain-size variation. Figure 2.4f
shows what appears to be Type HP matrix crosscutting the Type LP matrix. However, my
focused ion beam section from this area shows a gradual transition of the silicate
assemblage between the two types. The lack of consistent sharp boundaries and clear
crosscutting relationships (Figure 2.4e) makes the timing of the two vein-forming events
unclear.
2.4 Discussion
2.4.1 Melt crystallization pressure and shock pressure
40
The shock-melt crystallization assemblage provides constraints on the shock
pressure conditions during the quench of the shock-melt. The high-pressure assemblages
in chondrite shock veins are generally consistent with the liquidus phase relations derived
from static high-pressure experiments, such as those in Sixiangkou, Tenham and Y-
791384 L6 chondrites (Chen et al. 1996; Ohtani et al. 2004; Xie et al. 2006a). I do not
imply that the rapid quench of a shock-induced melt represents thermodynamic or
chemical equilibrium. However, the crystallization assemblages can provide useful and
consistent estimates of P-T-t histories during shock. The chondritic shock melts in small
veins quench quickly after their formation and record the pressure-temperature conditions
during shock (Langenhorst and Poirier 2000; Sharp and DeCarli 2006). Because shock
veins quench primarily by conduction of heat into the surrounding solid host rock, the
quench time is dependent on the volume and initial temperature of the melt and the
temperature of the host rock. The edge of a melt vein in contact with the host rock
quenches faster than the vein center. This is advantageous because thin veins and vein
edges can quench rapidly enough to record the peak shock pressure by the crystallization
assemblage. In contrast, thick veins and larger melt pockets quench more slowly and may
record lower pressures if the crystallization occurs during decompression (Xie et al.
2006a; Miyahara et al. 2011). For a thick vein with a constant high-pressure assemblage,
it can be inferred that the crystallization pressure and the corresponding shock pressure
remained high throughout the duration of the shock-vein quench.
Minerals such as ringwoodite, lingunite and tuite, which form by solid-state
transformation of minerals entrained in shock veins, can also constrain shock pressure
estimates. However, high-pressure transformations, such as olivine to ringwoodite, can
41
occur metastably well below the wadsleyite-ringwoodite equilibrium phase boundary that
defines the stability field of ringwoodite (Sharp and DeCarli 2006; Walton et al. 2014). In
contrast, pyroxene fragments are commonly preserved metastably at high pressure
because of the slow rates of transformation (Hogrefe et al. 1994). Thus temperature and
reaction kinetics are as important as pressure in controlling the transformation products.
In some large olivine fragments (Figure 2.2c & d), the ringwoodite transformation occurs
exclusively along the boundary with shock melt, indicating that very high temperatures
are required for the transformation. Therefore, solid-state transformation of silicates in
and adjacent to shock melt generally provides only loose constraints on shock pressure.
The apparent discrepancy of shock stages between the shock melt veins (S6) and
the host rock (< S5) is unlikely a result of local pressure excursions because the pressure
variations only occur during shock loading and rapidly ring out to an equilibrium shock
pressure. The crystallization of shock melt occurs after shock-pressure equilibration
(Sharp and DeCarli, 2006). I suggest that in samples that have S6 melt veins in a matrix
of lower shock-stage indicators, the classification should be S6.
The two types of melt matrix in the sample indicate different crystallization
pressures. Matrix Type HP consists of majoritic garnet, ringwoodite, magnetite, clay plus
metal-sulfide. The magnetite and clay are formed by post-shock exsolution and alteration
of magnesiowüstite and weathering of residual-melt glass (Chen et al. 1996). Based on
the liquidus phase diagram of Allende CV3 chondrite (Agee et al. 1995; Asahara et al.
2004), the assemblage is consistent with a pressure of approximately 20-25 GPa (Figure
2.8). Unlike the garnet plus magnesiowüstite assemblage of S6 L6 chondrite Sixiangkou
42
(Chen et al. 1996), NWA 757 matrix Type HP also contains ringwoodite, which suggests
a somewhat lower crystallization pressure than that of Sixiangkou. The interstitial
occurrence of ringwoodite and oxide between garnets is consistent with garnet being the
liquidus phase.
The mineral assemblage in Type LP matrix complicates the interpretation of
crystallization pressure. This assemblage consists of clinopyroxene, wadsleyite, minor
ringwoodite plus metal-sulfide droplets. None of the phase diagrams from either
chondrite, peridotite or basalt indicates a liquidus assemblage of clinopyroxene plus
wadsleyite that excludes garnet and olivine (Agee et al. 1995; Hirose et al. 1999; Zhang
and Herzberg 1994). Olivine and garnet are the liquidus phases at pressures below
approximately 14 GPa and between 14 and 22 GPa, respectively (Figure 2.8). The slight
difference in composition of Type LP matrix cannot account for the lack of garnet as a
liquidus phase. The clinopyroxene and wadsleyite in the Type LP matrix are likely sub-
solidus phases that crystallized from a super-cooled melt. Both minerals are subhedral
and nanocrystalline (~200 nm; Figure 2.7d & e). Super-cooling of the Type LP melt to
below the solidus could result in metastable crystallization of sub-solidus phases. The
consistent round sulfide droplets throughout the Type LP matrix are also evidence for a
fast quench. However, the cooling rate of Type LP matrix was not rapid enough to
quench to a glass.
Based on the Allende phase diagram, clinoenstatite can occur at pressures of 14-
17 GPa under high temperature close to the solidus (Figure 2.8). This pressure range is
compatible with the stability field of the wadsleyite and ringwoodite. Nevertheless, the
43
slight compositional difference between the Type LP matrix and Allende may influence
the pressure estimation. Compared with Allende and KLB-1, the Type LP melt matrix is
slightly depleted in aluminum and calcium, but much more enriched in sodium (Table
2.3). The relatively low magnesium concentration of the silicate in Type LP matrix is
affected by the Fe distribution in silicate, oxide, sulfide and metal. Previous high-pressure
experiments suggest pure Na-Mg pyroxene (NaMg0.5Si0.5Si2O6) can survive through high
pressure before the transformation to sodium-rich majorite (Dymshits et al. 2010). The
Clapeyron slope for the Na-enstatite to Na-majorite transition is positive. At temperatures
near the solidus, the boundary pressure can be as high as 18 GPa. I am not suggesting that
the crystallization pressure of a phase is exactly the same as its stability field in solid state.
However, the experimental data indicate that the sodium-bearing clinopyroxene (Table
2.2) can be a high-pressure phase. The assemblage of clinopyroxene and wadsleyite in
Type LP melt thus are consistent with static high-pressure experiments and a
crystallization pressure of approximately 15 GPa.
In summary, I suggest the shock pressure of NWA 757 is indicated by the Type
HP melt matrix at 20-25GPa. If the shock pressure was significantly higher than this, I
would expect the crystallization of bridgmanite and/or akimotoite in fast-quenched melt
veins and post-spinel transformation in olivine, like those seen in L chondrite Tenham,
Acfer 040 and shergottites DaG 735 and Tissint (Miyahara et al. 2011; Sharp et al. 1997;
Tomioka and Fujino 1997; Walton et al. 2014; Tschauner et al. 2014). The origin of the
Type LP matrix is discussed in the following section.
2.4.2 Formation of two crystallization assemblages
44
In the previous sections I showed that the two types of melt are distinct in
mineralogy, micro-texture and crystallization pressure. The origin of the two types of
quenched melt might be explained by i) two vein-forming events in a single shock, ii)
differences in chemical compositions or iii) two shock events with different shock
pressures.
Type HP matrix contains coarse-grained liquidus-phase garnet with interstitial
ringwoodite and magnetite. In contrast, Type LP matrix consists of fine-grained
subhedral clinopyroxene and wadsleyite. A simple interpretation of the difference in
crystallization pressure (20-25 GPa vs.15 GPa) is that Type LP matrix quenched at lower
pressure during decompression. For example, in the S6 L6 chondrite Tenham, the
crystallization assemblage changes at the melt vein edge through the vein interior
(Tomioka and Fujino 1997; Xie et al. 2006a). In Tenham, because the shock melt cools
by conducting heat into the colder host rock, the edge of the melt vein quenches faster
than the vein interior and crystallizes the assemblage of fine-grained akimotoite and
bridgmanite. The vein interior then experiences a longer quench time and later
crystallization. The pressure decreases during quench resulting in coarse-grained majorite
in the vein interior. However, in NWA 757 the high-pressure Type HP matrix does not
exclusively occur along the vein margins and/or thin veins. On the contrary, Type HP
matrix crystallizes coarse-grained garnet in thick melt pockets and vein centers. This
texture cannot be explained by a single melt-vein quench from high to low pressure.
Different melt-formation mechanisms and timing must be considered.
45
Shock vein formation involves localized pore collapse, comminution and friction
on fractures and grain boundaries (Spray 1995, 1998; Langenhorst and Poirier 2000;
Sharp and DeCarli 2006). The collapse of pores behind the shock front significantly
increases the bulk and localized shock temperature as well as the post-shock temperature
(Sharp and DeCarli 2006). Friction on fractures and grain boundaries during
compression-decompression generates partially to fully melted pseudotachylitic zones. In
principal, shearing can occur during decompression when the confining pressure
decreases more rapidly than the deviatoric component of the stress tensor (Langenhorst
and Poirier 2000). Langenhorst et al. (2002) performed a shock-shearing experiment on a
single crystal of olivine. The frictional melting was inferred to occur as the rarefaction
wave traversed during decompression. Evidence of frictional melting by shock
compression-decompression is observed in terrestrial impact structures (Spray 1998).
These previous studies suggest that the shear veining can occur throughout the shock
from compression to release. In realistic planetary impacts, the localized shock pressure
history is dependent on the geometry of the colliding bodies as well as the small scale
heterogeneities in shock impedance (Stöffler et al. 1991; Melosh et al. 1992). If multiple
shear veining events occur during shock, the crystallization assemblages would therefore
reflect varying shock pressure versus time rather than an ideal equilibrium shock pressure
before decompression. Specifically, for NWA 757, pores collapse and shear and friction
lead to melt veins and pockets during compression. This shock melt quenches at the peak
shock pressure to crystallize garnet plus Fe-Mg oxides, but may leave residual silicate
melt plus sulfide melt droplets. If the solidification of the melt matrix proceeds without
local disturbance, the spherical shape of sulfide droplets would be preserved (Figure 2.4b
46
& Figure 2.9a). Locally, secondary shear leads to new melt veins and deforms the
partially solidified Type HP melt veins, as well as smears the sulfide droplets inside the
veins (Figure 2.9b). The new melt vein subsequently quenches at slightly lower pressure,
likely resulting from decompression, and crystallizes the pyroxene-predominate matrix.
Significantly, this scenario does not necessarily require the higher-pressure matrix to
quench faster than the lower pressure matrix. The partial crystallization of Type HP melt
can occur before the formation of Type LP melt. The secondary veining event preserves a
record of lower shock pressure conditions.
The composition of silicate in the two types of melt is different primarily in
sodium content. Although sodium can increase the pressure stability of pyroxene
(Dymshits et al. 2010), the crystallization pressures of Type HP matrix of 20-25 GPa is
still well above the range for sodic pyroxenes in Type LP matrix. The higher iron content
in Type LP matrix might make a small difference because ferrous iron is slightly
preferred in garnet compared to clinoenstatite (Irifune and Isshiki 1998). However, this is
a minor effect when magnesiowüstite and ringwoodite/wadsleyite co-exist in the
assemblage. Therefore, the small compositional variation between Type HP and Type LP
matrix cannot account for their distinct mineral assemblages.
From my characterization, I cannot rule out the possibility that multiple shock
events formed the two melts. Chen and Xie (2008) reported co-existing melt veins of
different mineralogy and texture in the Sixiangkou L6 chondrite. They used cross-cutting
relations and sharp boundaries between the shock veins to conclude that a second shock
event was needed to explain the two veins. The authors also discussed the possibility of
47
successive shear melting in one shock event, but ruled it out based on the sharp edges and
consistent crosscutting relationship between the early and late vein. In my sample, the
diffuse boundary (Figure 2.4e) between the two matrices suggests that the Type LP
veining event occurred while the Type HP veins were still partially molten. In local areas,
the boundaries between the two veins can be sharp and well defined by variations in
metal sulfide textures (Figure 2.4f). However, metal-sulfide textures vary depending
more on the initial sulfide abundance in the melt and shearing stress during shock-vein
quench. Spherical sulfide droplets are preserved by fast quench of melt under relatively
low shear stresses. FIB-TEM does not indicate a sharp transition between crystallized
silicates in these areas. Moreover, the Type LP matrix occurring together with Type HP
matrix (Figure 2.4f) could be the result of the LP veining event occurring over the pre-
existing HP vein. My sample also lacks a consistent crosscutting relationship between the
two matrices (Figure 2.4e). The textures in my sample are ambiguous, but they are not
clearly indicative of two shock events.
2.4.3 Impact on LL chondrite parent body
In order to constrain the impact history of the LL chondrite parent body,
information from shock metamorphism and impact age dating of meteorite samples are
needed. Previous studies of shock metamorphism in L chondrites help reveal the shock
conditions on the L chondrite parent body. Particularly, the shock melt crystallization
assemblage can constrain both the shock pressure and the pulse duration (Sharp and
DeCarli 2006). The Type HP matrix of majoritic garnet plus magnesiowüstite-magnetite
suggests a crystallization pressure up to 25 GPa. The same crystallization assemblage has
48
been reported in L6 chondrites of shock stage S6, such as Sixiangkou and Tenham (Chen
et al. 1996; Xie et al. 2006a). Although higher pressure phases, including bridgmanite, in
Acfer 040 and Tenham indicate excessive shock pressure in some S6 L chondrites (Sharp
et al. 1997; Tomioka and Fujino 1997; Tschauner et al. 2014), NWA 757 likely
experienced a shock pressure similar to most S6 L chondrites. Another important factor
to constrain the impact conditions is the shock-pulse duration. A lower bound of shock-
pulse duration is set by the quench time of a melt vein that contains a consistent high-
pressure assemblage. The quench time is dependent on the thermal conductivity, specific
heat and density of the material as well as the temperature gradient around the hot spot
(Sharp et al. 2015). Qualitatively, a melt pocket with other adjacent melt veins has a
smaller temperature gradient and therefore quenches slower than the same pocket
surrounded by cooler host rock, given the same initial melt temperature. Shaw and
Walton (2013) modeled the temperature history of shock melt in several meteorites. Their
model suggests that the melt veins with ~1 mm thickness require a time scale of about 1
second to quench to the high-pressure solidus. In NWA 757, connected melt veins and
pockets thicker than 1 mm are common (Figure 2.2a). The quench time of the veins are
therefore on the order of 1 second. Taking 1 second as the lower bound of the shock pulse,
this time scale is close to the shock pulse of L chondrites estimated from heat flow
modeling (DeCarli et al. 2012), crystallization kinetics (Ohtani et al. 2004) and diffusion
profiles (Beck et al. 2005). The shock pressure and pulse duration reflect the velocity and
size of the impact (Melosh 1989). Hydrocode simulations and flat impact approximations
both suggest that the typical highly shocked L chondrites result from the impact of a
projectile-target larger than 10 km (DeCarli et al. 2012; Ohtani et al. 2004). Therefore,
49
similarly NWA 757 was probably shocked by an impact between bodies larger than 10
km diameter.
The impact ages of meteorites provide important constraints on the impact
histories of parent bodies. 39Ar/40Ar dating of many L chondrite melt breccias show
several impact events with a major spike at ~470 Ma suggesting a catastrophic impact
(Turner 1969; McConville et al. 1988; Bogard 1995; Korochantseva et al. 2007; Weirich
et al. 2012; Swindle et al. 2014). Although not all L chondrites have been age dated, the
shock metamorphic features of L chondrites, combined with collisional models and age
dating results, are consistent with a recent large impact event on the L parent body.
Previous studies of LL chondrites do not suggest a single catastrophic collision. The Ar-
Ar ages of LL chondrites show a spike between 4175 and 4340 Ma, suggesting a distinct
early impact history on the parent body (Swindle et al. 2014). Some LL chondrites also
have impact ages less than 1200 Ma. However, the data are not sufficient to extract the
ages of a single or several events (Swindle et al. 2014). In contrast to highly shocked L
chondrites, highly shocked S5-6 LL chondrites have been missing from meteorite
collections (Stöffler et al. 1991). Kimura et al. (2001) reported jadeite coexisting with
olivine and orthopyroxene in a shock melt from LL chondrite Y-8410 and conclude a
lower pressure and shorter duration shock on the LL chondrite parent body than those of
L chondrites. The distinct difference between the impact age and degree of shock
metamorphism between L and LL chondrites can result from either distinct impact
histories on the parent bodies or stochastic sampling of shocked materials. The shock
features reported here in NWA 757 suggest that at least a portion of LL chondrite parent
body was intensely shocked in a relatively large impact similar to those on the L
50
chondrite parent body. However, the resulting highly-shocked material is rarely captured
by the earth. The hypothesis of stochastic rather than continuous sampling of LL
chondrites is consistent with the cosmic-ray exposure age. Marti and Graf (1992)
summarized the cosmic ray exposure age distribution of 44 LL chondrites. A well-
concentrated peak at 15 Ma suggests a major meteoroid or major meteoroids that brought
the LL material to the earth. These meteoroids are likely from the weakly shocked
portion of the parent body. Although the relatively high proportion of shocked samples
among L chondrites is probably biased by a single impact event, NWA 757 suggests that
a similarly intense impact also occurred on the LL parent body. This result implies that
large impacts may have been common among chondrite asteroids. Further work on
impact age(s) and cosmic ray exposure age(s) are needed to better understand the space
history of NWA 757.
The recent Chelyabinsk airburst event provided abundant fresh LL material.
Ozawa et al. (2014) report jadeite crystallized from feldspar melt in one Chelyabinsk
meteorite sample. They conclude a moderate pressure of shock (3-12 GPa) and low-
velocity impact on the Chelyabinsk asteroid. Rb-Sr, Sm-Nd and Ar-Ar ages of the
Chelyabinsk meteorites suggests a complicated impact history of the parent body
(Righter et al. 2015; Lindsay et al. 2015). The argon ages are diverse from 32 Ma to
~2800 Ma. The diversity of impact age as well as less intense shock metamorphism is
similar to the other LL chondrites, which represent weakly shocked source meteoroids.
Further study of LL material is needed to better understanding the history of its parent
body.
51
2.5 Conclusion
NWA 757 is a unique highly shocked LL chondrite that includes high-pressure
minerals ringwoodite, tuite and lingunite formed by solid-state transformation. Quenched
shock melt resulted in two shock-melt assemblages: i) majoritic garnet, ringwoodite plus
magnetite-magnesiowüstite and ii) clinopyroxene plus wadsleyite. The former
assemblage indicates veining and melt crystallization at a shock pressures of 20-25 GPa
while the latter represents successive shear veining and quench at ~15 GPa. The presence
of lower-pressure melt matrix suggests that secondary shearing and veining can occur in
one shock event. The high-pressure minerals in this LL chondrite are more similar to
those in highly shocked L chondrites than those in other LL chondrites. The similarity
between shock-vein mineralogy and melt-vein thickness in NWA 757 and those of highly
shocked L chondrites suggests that the impact event that shocked NWA 757 is likely
comparable to the catastrophic impact events on the L parent body. It appears that NWA
757 represents a highly shocked portion of the LL chondrite parent body.
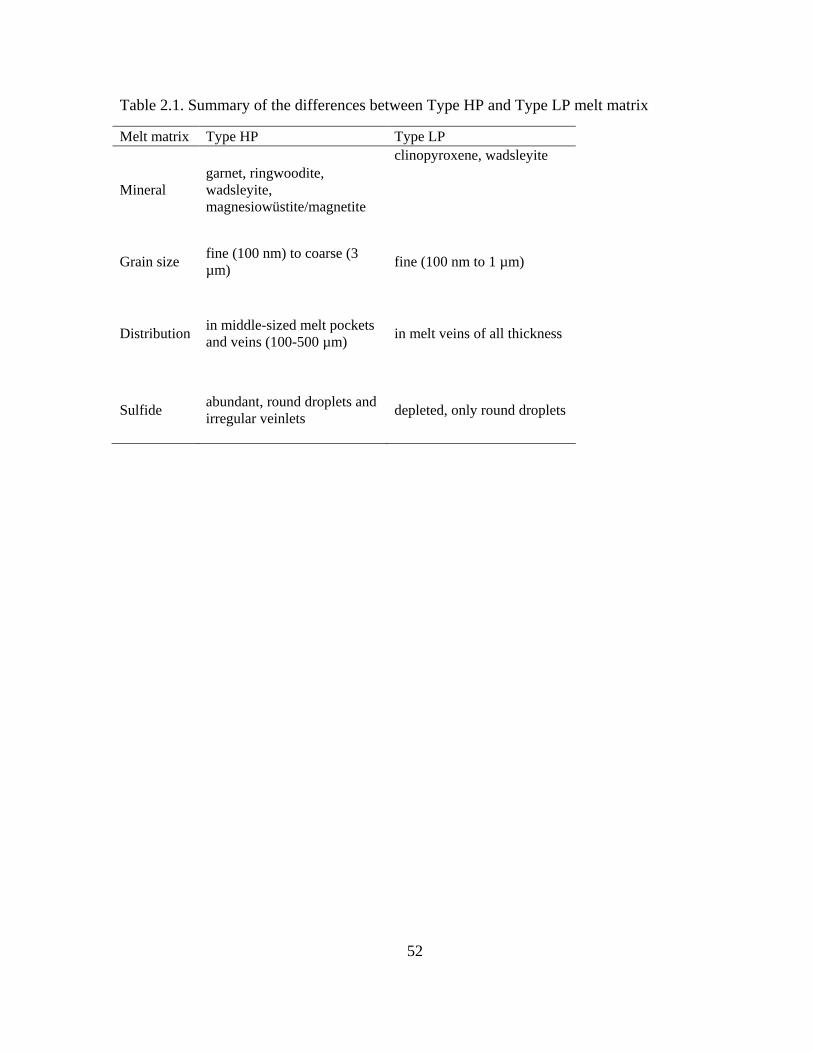
52
Table 2.1. Summary of the differences between Type HP and Type LP melt matrix
Melt matrix Type HP Type LP
Mineral garnet, ringwoodite, wadsleyite, magnesiowüstite/magnetite
clinopyroxene, wadsleyite
Grain size fine (100 nm) to coarse (3 µm) fine (100 nm to 1 µm)
Distribution in middle-sized melt pockets and veins (100-500 µm) in melt veins of all thickness
Sulfide abundant, round droplets and irregular veinlets depleted, only round droplets
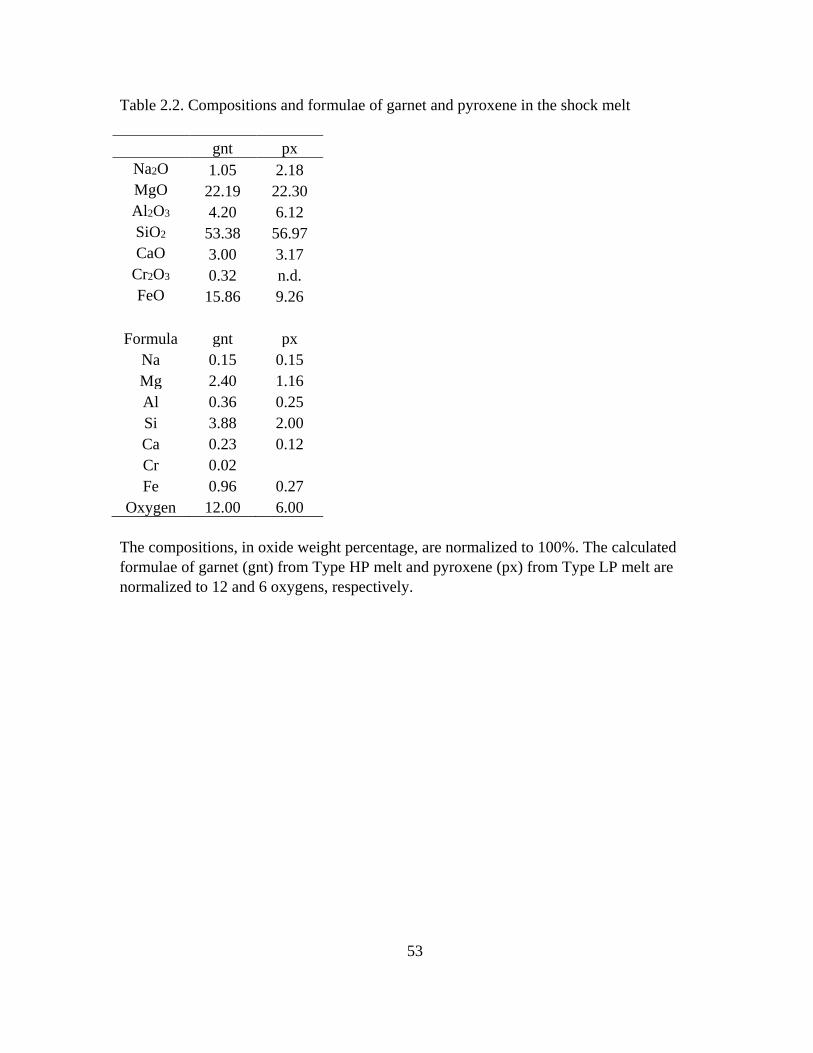
53
Table 2.2. Compositions and formulae of garnet and pyroxene in the shock melt
The compositions, in oxide weight percentage, are normalized to 100%. The calculated formulae of garnet (gnt) from Type HP melt and pyroxene (px) from Type LP melt are normalized to 12 and 6 oxygens, respectively.
gnt px
Na2O 1.05 2.18 MgO 22.19 22.30 Al2O3 4.20 6.12 SiO2 53.38 56.97 CaO 3.00 3.17
Cr2O3 0.32 n.d. FeO 15.86 9.26
Formula gnt px Na 0.15 0.15 Mg 2.40 1.16 Al 0.36 0.25 Si 3.88 2.00 Ca 0.23 0.12 Cr 0.02 Fe 0.96 0.27
Oxygen 12.00 6.00
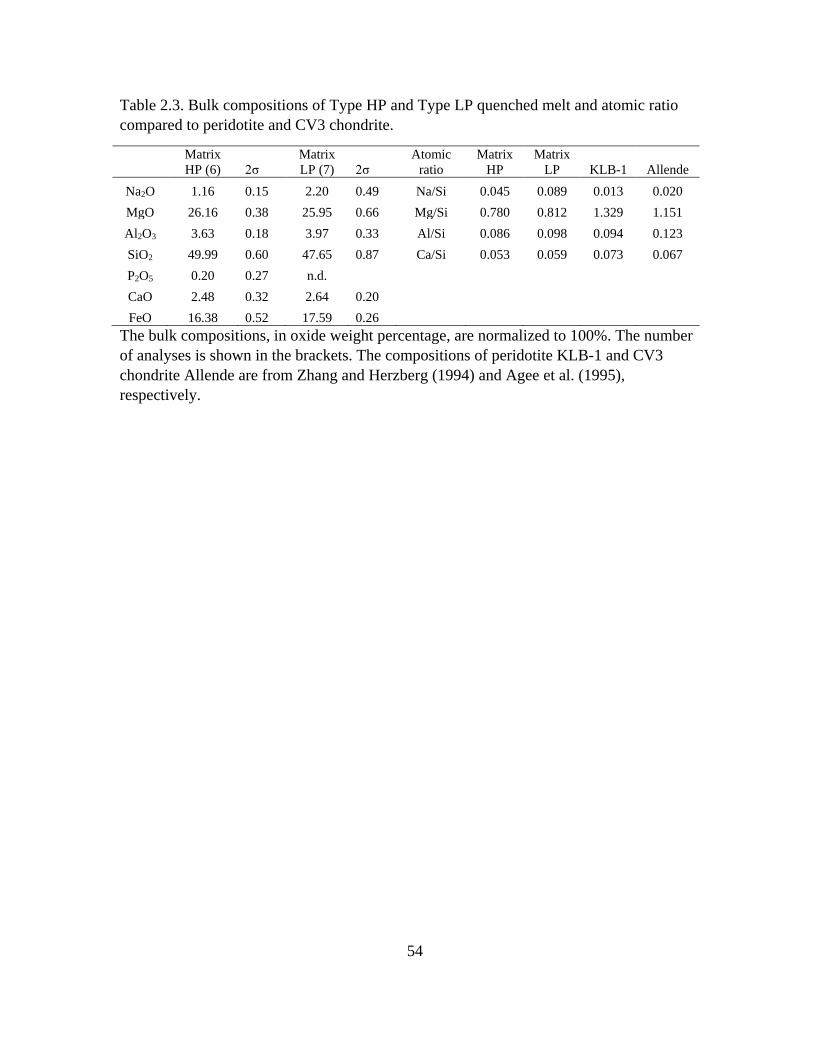
54
Table 2.3. Bulk compositions of Type HP and Type LP quenched melt and atomic ratio compared to peridotite and CV3 chondrite.
Matrix HP (6) 2σ
Matrix LP (7) 2σ
Atomic ratio
Matrix HP
Matrix LP KLB-1 Allende
Na2O 1.16 0.15 2.20 0.49 Na/Si 0.045 0.089 0.013 0.020 MgO 26.16 0.38 25.95 0.66 Mg/Si 0.780 0.812 1.329 1.151 Al2O3 3.63 0.18 3.97 0.33 Al/Si 0.086 0.098 0.094 0.123 SiO2 49.99 0.60 47.65 0.87 Ca/Si 0.053 0.059 0.073 0.067 P2O5 0.20 0.27 n.d.
CaO 2.48 0.32 2.64 0.20 FeO 16.38 0.52 17.59 0.26 The bulk compositions, in oxide weight percentage, are normalized to 100%. The number
of analyses is shown in the brackets. The compositions of peridotite KLB-1 and CV3 chondrite Allende are from Zhang and Herzberg (1994) and Agee et al. (1995), respectively.
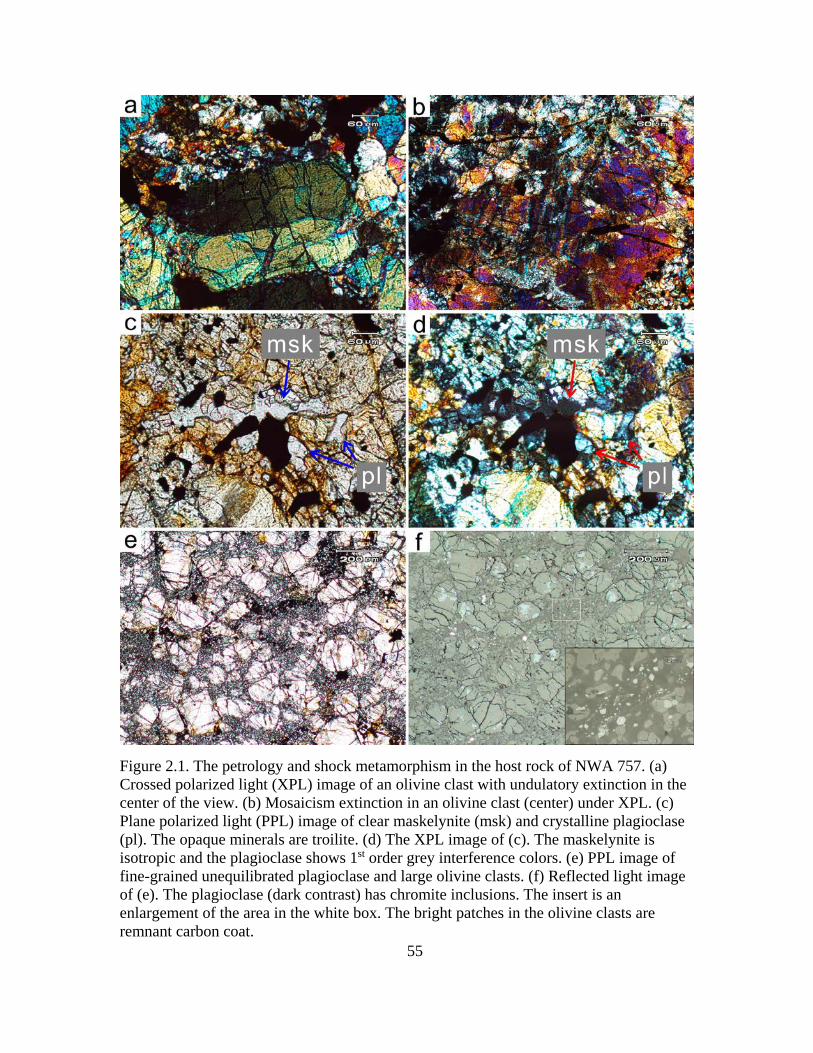
55
Figure 2.1. The petrology and shock metamorphism in the host rock of NWA 757. (a) Crossed polarized light (XPL) image of an olivine clast with undulatory extinction in the center of the view. (b) Mosaicism extinction in an olivine clast (center) under XPL. (c) Plane polarized light (PPL) image of clear maskelynite (msk) and crystalline plagioclase (pl). The opaque minerals are troilite. (d) The XPL image of (c). The maskelynite is isotropic and the plagioclase shows 1st order grey interference colors. (e) PPL image of fine-grained unequilibrated plagioclase and large olivine clasts. (f) Reflected light image of (e). The plagioclase (dark contrast) has chromite inclusions. The insert is an enlargement of the area in the white box. The bright patches in the olivine clasts are remnant carbon coat.
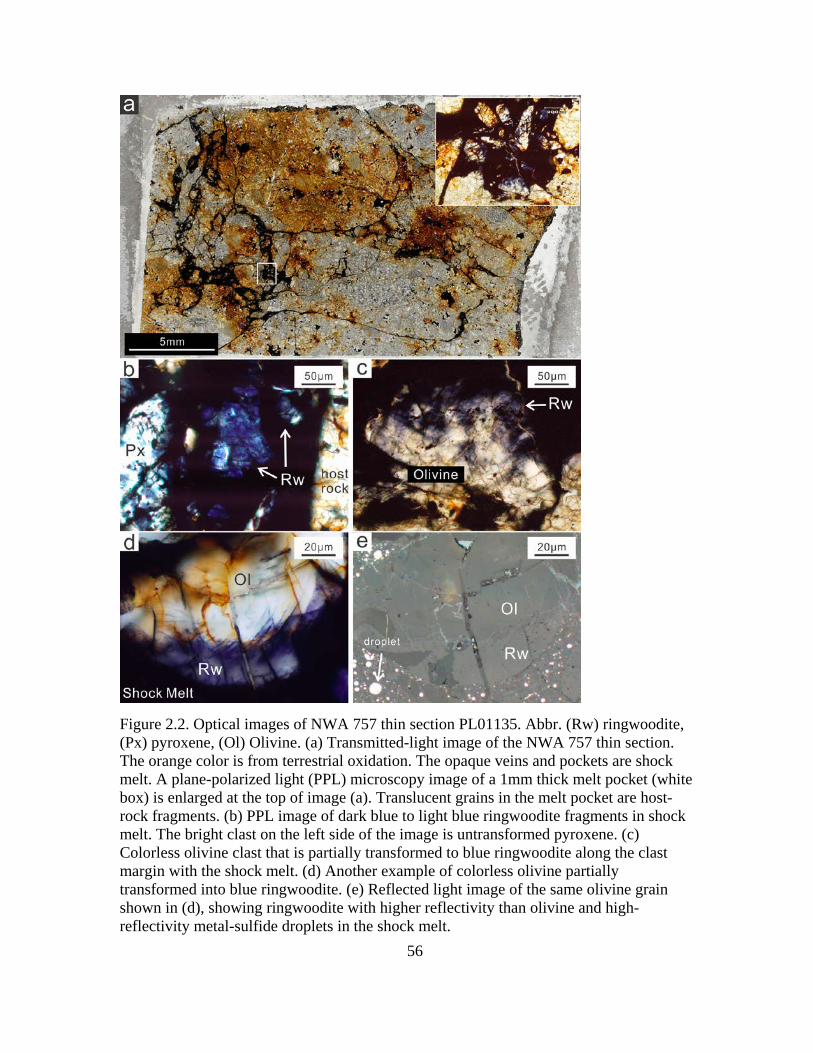
56
Figure 2.2. Optical images of NWA 757 thin section PL01135. Abbr. (Rw) ringwoodite, (Px) pyroxene, (Ol) Olivine. (a) Transmitted-light image of the NWA 757 thin section. The orange color is from terrestrial oxidation. The opaque veins and pockets are shock melt. A plane-polarized light (PPL) microscopy image of a 1mm thick melt pocket (white box) is enlarged at the top of image (a). Translucent grains in the melt pocket are host-rock fragments. (b) PPL image of dark blue to light blue ringwoodite fragments in shock melt. The bright clast on the left side of the image is untransformed pyroxene. (c) Colorless olivine clast that is partially transformed to blue ringwoodite along the clast margin with the shock melt. (d) Another example of colorless olivine partially transformed into blue ringwoodite. (e) Reflected light image of the same olivine grain shown in (d), showing ringwoodite with higher reflectivity than olivine and high-reflectivity metal-sulfide droplets in the shock melt.
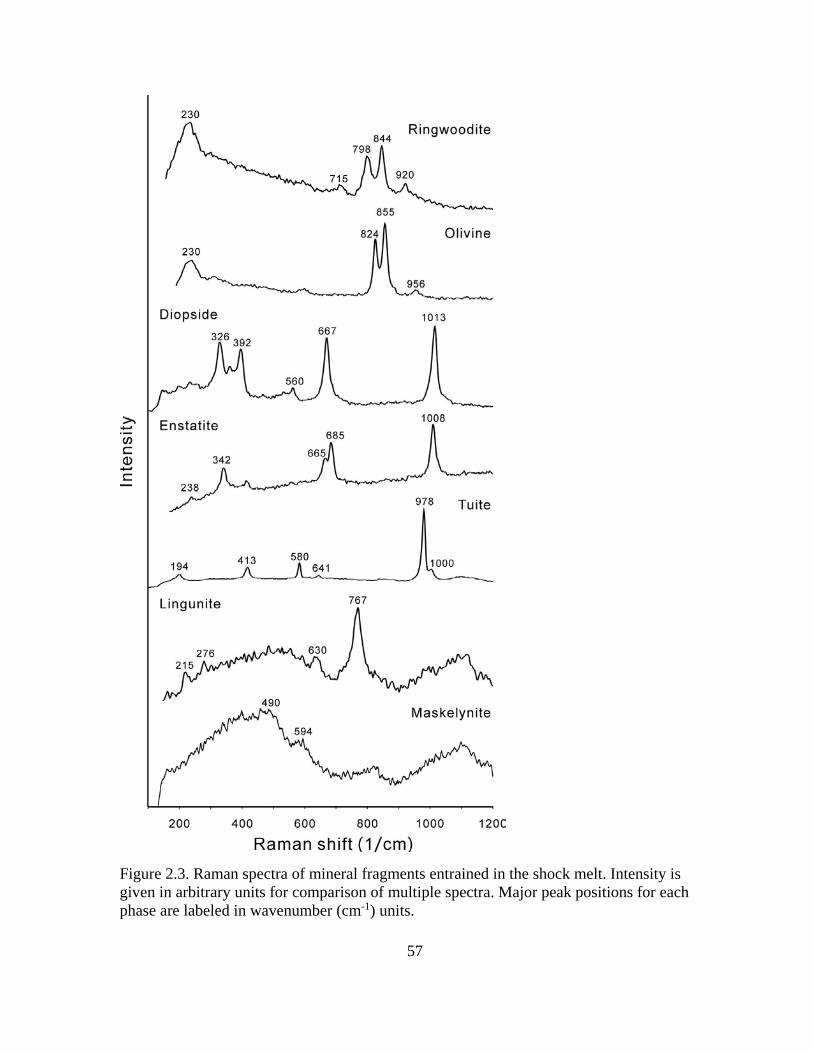
57
Figure 2.3. Raman spectra of mineral fragments entrained in the shock melt. Intensity is given in arbitrary units for comparison of multiple spectra. Major peak positions for each phase are labeled in wavenumber (cm-1) units.
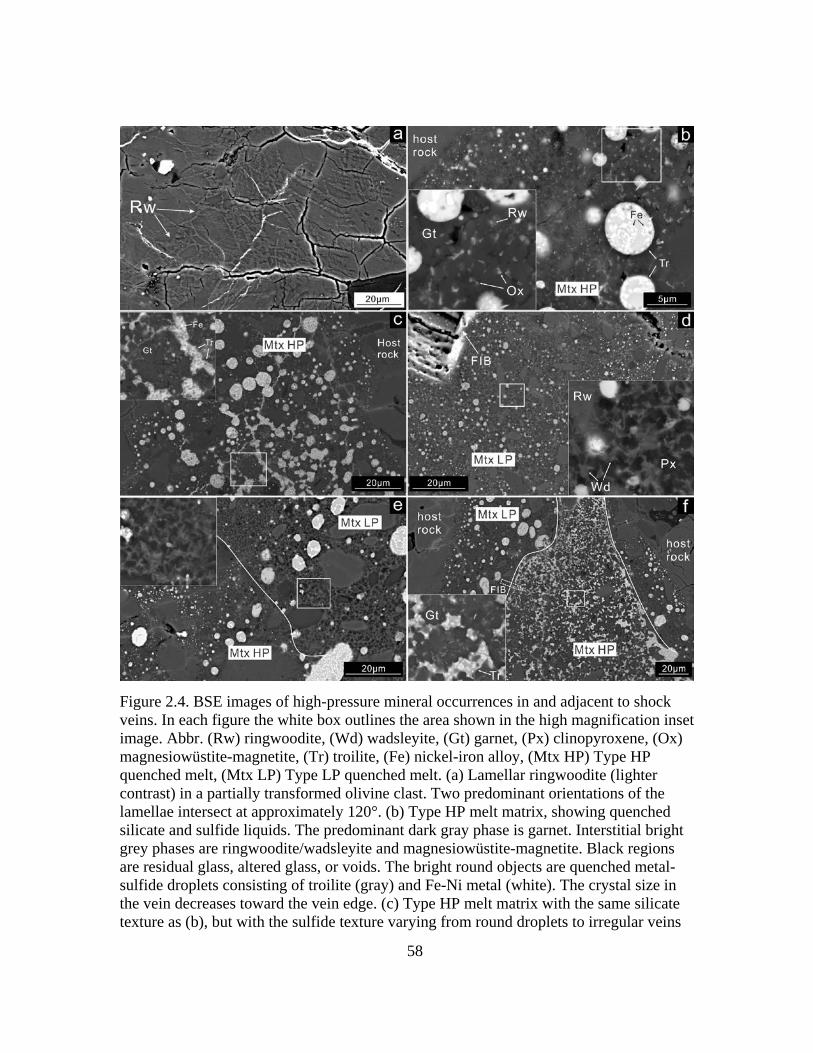
58
Figure 2.4. BSE images of high-pressure mineral occurrences in and adjacent to shock veins. In each figure the white box outlines the area shown in the high magnification inset image. Abbr. (Rw) ringwoodite, (Wd) wadsleyite, (Gt) garnet, (Px) clinopyroxene, (Ox) magnesiowüstite-magnetite, (Tr) troilite, (Fe) nickel-iron alloy, (Mtx HP) Type HP quenched melt, (Mtx LP) Type LP quenched melt. (a) Lamellar ringwoodite (lighter contrast) in a partially transformed olivine clast. Two predominant orientations of the lamellae intersect at approximately 120°. (b) Type HP melt matrix, showing quenched silicate and sulfide liquids. The predominant dark gray phase is garnet. Interstitial bright grey phases are ringwoodite/wadsleyite and magnesiowüstite-magnetite. Black regions are residual glass, altered glass, or voids. The bright round objects are quenched metal-sulfide droplets consisting of troilite (gray) and Fe-Ni metal (white). The crystal size in the vein decreases toward the vein edge. (c) Type HP melt matrix with the same silicate texture as (b), but with the sulfide texture varying from round droplets to irregular veins
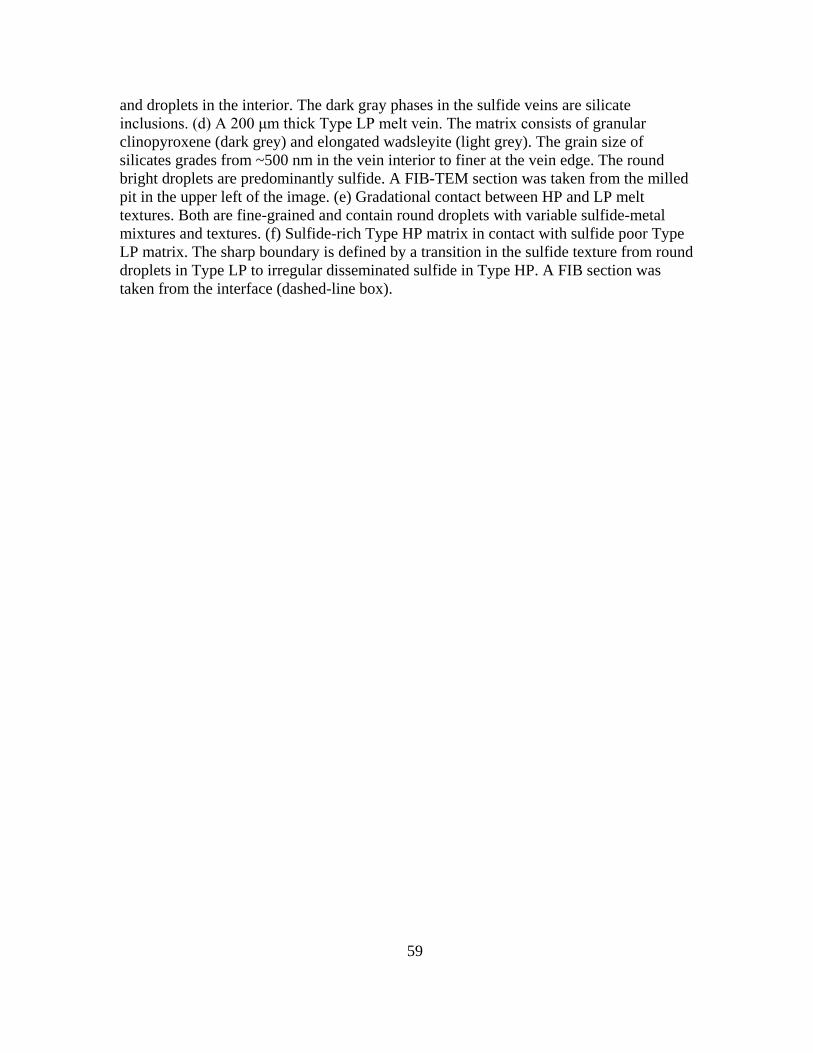
59
and droplets in the interior. The dark gray phases in the sulfide veins are silicate inclusions. (d) A 200 μm thick Type LP melt vein. The matrix consists of granular clinopyroxene (dark grey) and elongated wadsleyite (light grey). The grain size of silicates grades from ~500 nm in the vein interior to finer at the vein edge. The round bright droplets are predominantly sulfide. A FIB-TEM section was taken from the milled pit in the upper left of the image. (e) Gradational contact between HP and LP melt textures. Both are fine-grained and contain round droplets with variable sulfide-metal mixtures and textures. (f) Sulfide-rich Type HP matrix in contact with sulfide poor Type LP matrix. The sharp boundary is defined by a transition in the sulfide texture from round droplets in Type LP to irregular disseminated sulfide in Type HP. A FIB section was taken from the interface (dashed-line box).
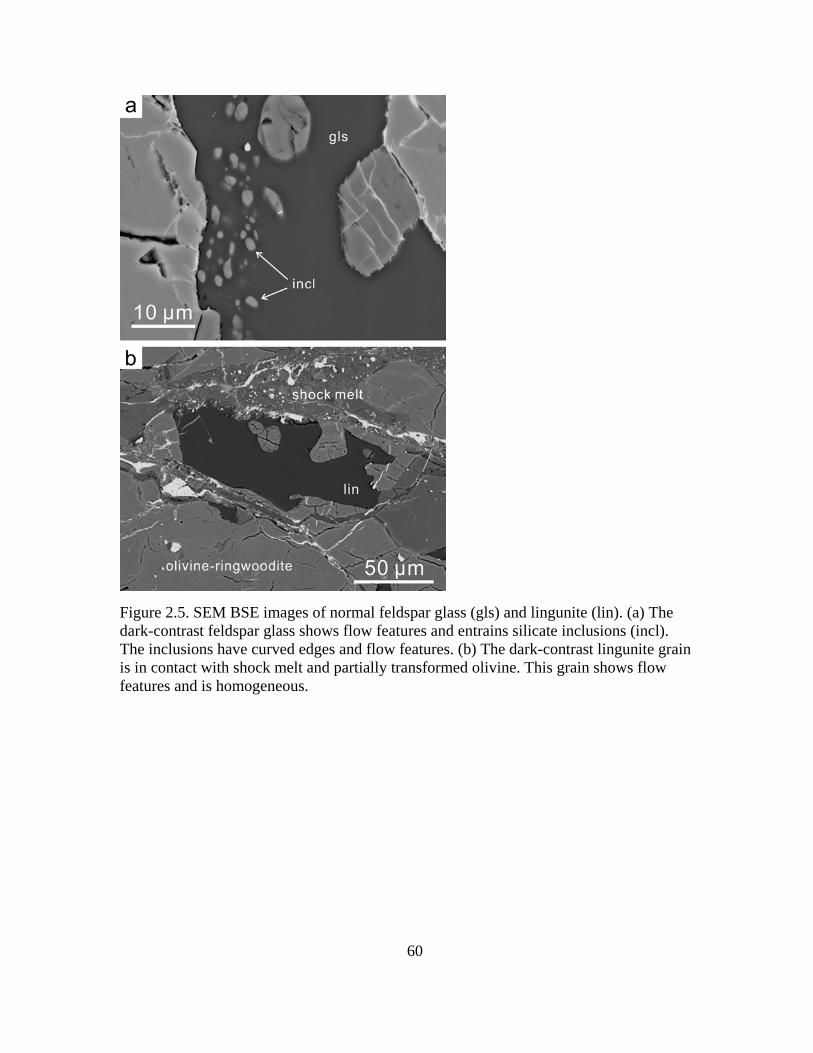
60
Figure 2.5. SEM BSE images of normal feldspar glass (gls) and lingunite (lin). (a) The dark-contrast feldspar glass shows flow features and entrains silicate inclusions (incl). The inclusions have curved edges and flow features. (b) The dark-contrast lingunite grain is in contact with shock melt and partially transformed olivine. This grain shows flow features and is homogeneous.
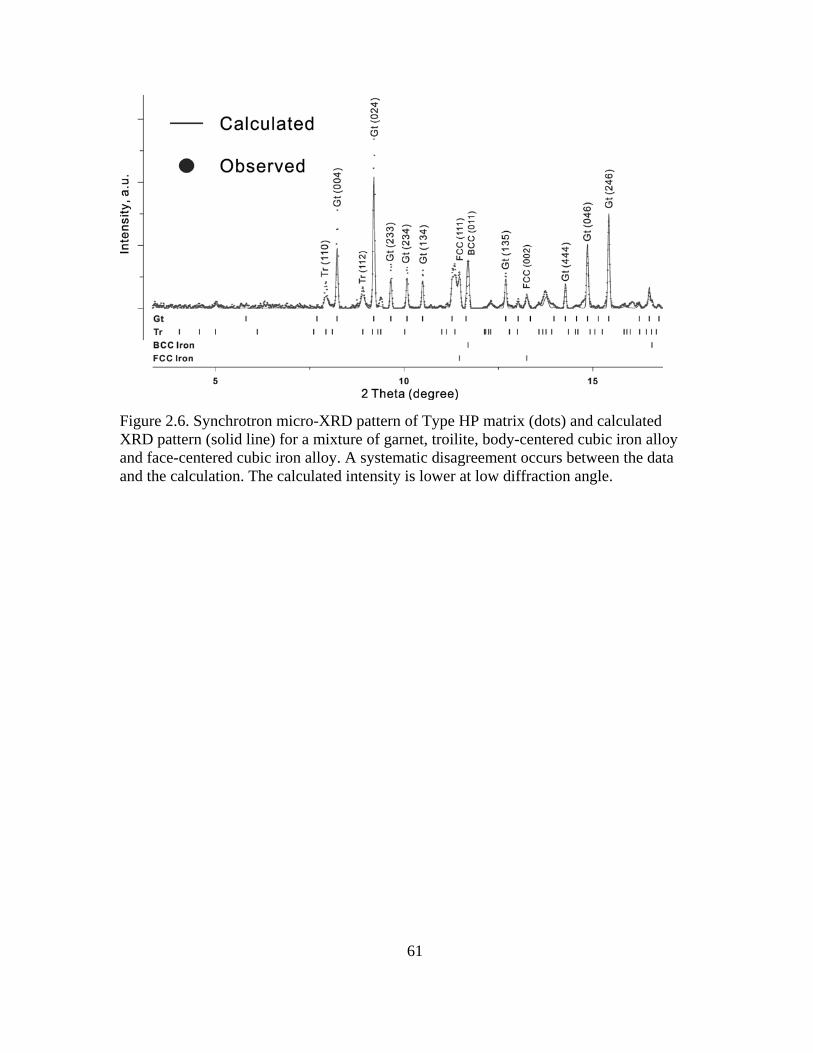
61
Figure 2.6. Synchrotron micro-XRD pattern of Type HP matrix (dots) and calculated XRD pattern (solid line) for a mixture of garnet, troilite, body-centered cubic iron alloy and face-centered cubic iron alloy. A systematic disagreement occurs between the data and the calculation. The calculated intensity is lower at low diffraction angle.
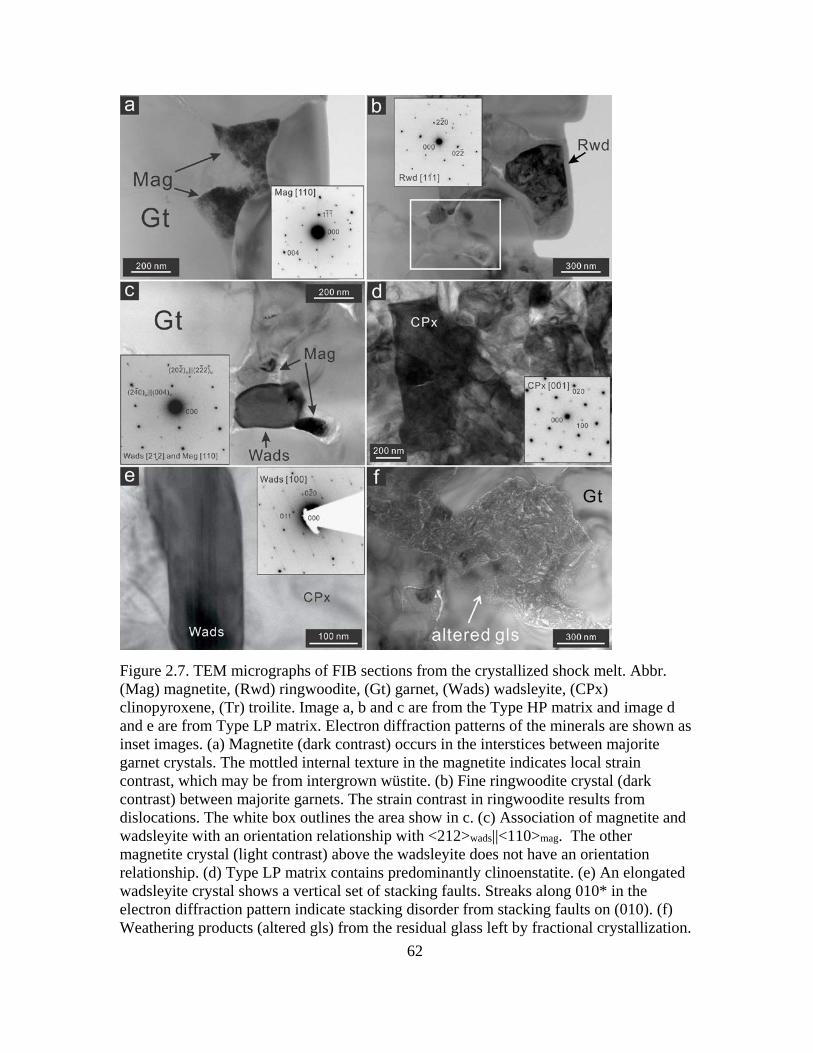
62
Figure 2.7. TEM micrographs of FIB sections from the crystallized shock melt. Abbr. (Mag) magnetite, (Rwd) ringwoodite, (Gt) garnet, (Wads) wadsleyite, (CPx) clinopyroxene, (Tr) troilite. Image a, b and c are from the Type HP matrix and image d and e are from Type LP matrix. Electron diffraction patterns of the minerals are shown as inset images. (a) Magnetite (dark contrast) occurs in the interstices between majorite garnet crystals. The mottled internal texture in the magnetite indicates local strain contrast, which may be from intergrown wüstite. (b) Fine ringwoodite crystal (dark contrast) between majorite garnets. The strain contrast in ringwoodite results from dislocations. The white box outlines the area show in c. (c) Association of magnetite and wadsleyite with an orientation relationship with <212>wads||<110>mag. The other magnetite crystal (light contrast) above the wadsleyite does not have an orientation relationship. (d) Type LP matrix contains predominantly clinoenstatite. (e) An elongated wadsleyite crystal shows a vertical set of stacking faults. Streaks along 010* in the electron diffraction pattern indicate stacking disorder from stacking faults on (010). (f) Weathering products (altered gls) from the residual glass left by fractional crystallization.
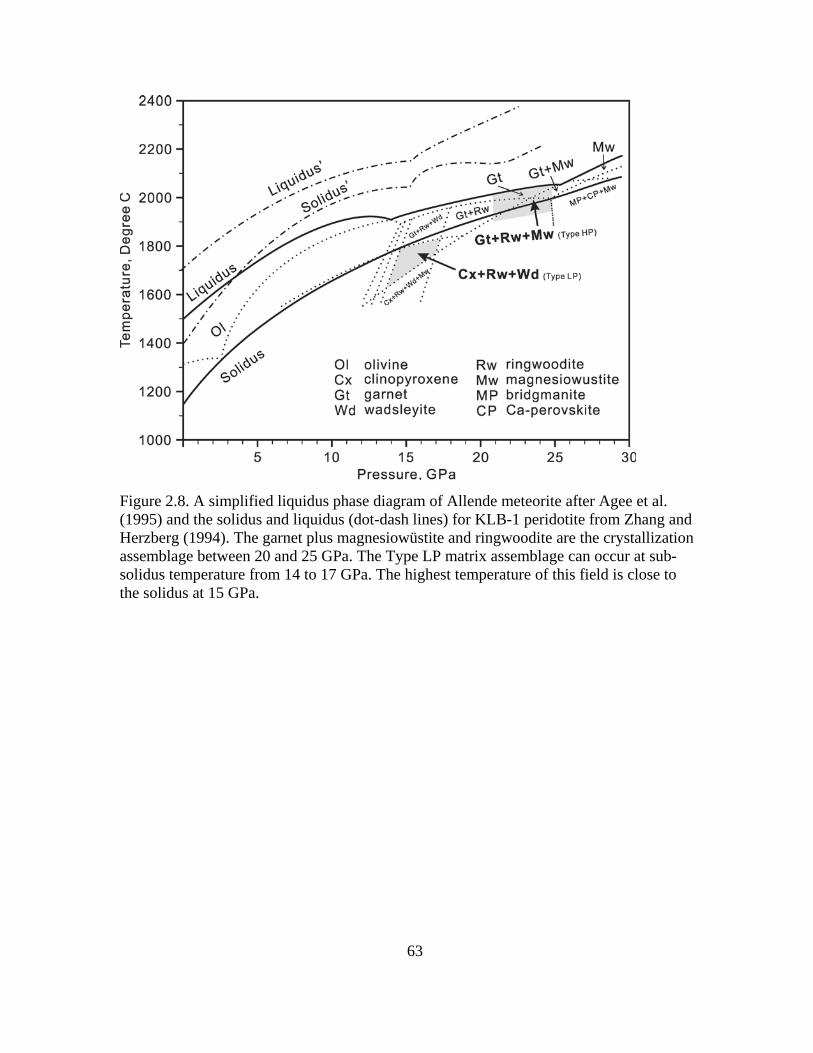
63
Figure 2.8. A simplified liquidus phase diagram of Allende meteorite after Agee et al. (1995) and the solidus and liquidus (dot-dash lines) for KLB-1 peridotite from Zhang and Herzberg (1994). The garnet plus magnesiowüstite and ringwoodite are the crystallization assemblage between 20 and 25 GPa. The Type LP matrix assemblage can occur at sub-solidus temperature from 14 to 17 GPa. The highest temperature of this field is close to the solidus at 15 GPa.
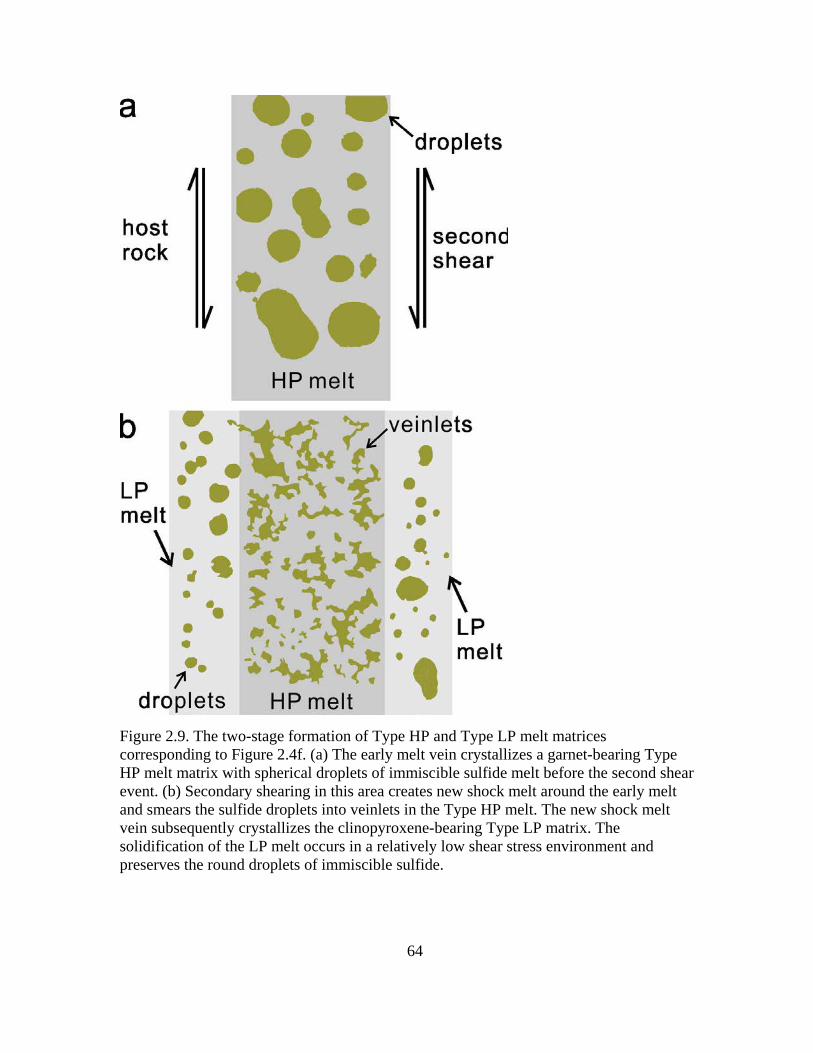
64
Figure 2.9. The two-stage formation of Type HP and Type LP melt matrices corresponding to Figure 2.4f. (a) The early melt vein crystallizes a garnet-bearing Type HP melt matrix with spherical droplets of immiscible sulfide melt before the second shear event. (b) Secondary shearing in this area creates new shock melt around the early melt and smears the sulfide droplets into veinlets in the Type HP melt. The new shock melt vein subsequently crystallizes the clinopyroxene-bearing Type LP matrix. The solidification of the LP melt occurs in a relatively low shear stress environment and preserves the round droplets of immiscible sulfide.
65
Chapter 3
Shock transformations of enstatite to bridgmanite, ringwoodite, magnesiowüstite plus
stishovite in the L chondrite Acfer 040
3.1 Introduction
For the majority of highly shocked chondrites, the high-pressure (HP)
assemblages are dominated by ringwoodite, majoritic garnet and magnesiowüstite,
indicating a shock pressure up to about 24 GPa (Agee et al. 1995; Chen et al. 1996; Sharp
et al. 2015). At higher pressure, olivine would transform to bridgmanite plus
magnesiowüstite and enstatite would transform to bridgmanite, which are referred as
post-spinel transformations (Liu 1975; Ito and Takahashi 1989). However, the post-spinel
transformation of olivine and pyroxene is rare in shocked meteorites. Besides vitrified
bridgmanite observed on the edge of a shock melt vein in Tenham (Xie et al. 2006a),
Acfer 040 is the only sample with abundant vitrified bridgmanite in shock melt matrix
(Sharp et al. 1997). In this research, I report a comprehensive investigation of the
enstatite transformation as well as shock-melt crystallization in Acfer 040 and provide an
estimate of the shock conditions. These results provide insights into impact processes on
the parent bodies and a better understanding of the highest pressures associated with
shock stage S6 for HP-mineral bearing samples.
3.2 Sample and Methods
My thin section of Acfer 040 (PL90341) was provided by Institut für Planetologie
/ICEM. Detailed shock vein textures were investigated by scanning electron microscopy
66
(SEM) using an FEI XL30 with a field-emission gun (FEG), operated at 20 keV and 10
mm working distance, and EDAX SiLi energy dispersive X-ray spectroscopy (EDS)
detector achieving 4-10 µs process time, 30% dead time and 1000 cps signal.
Transmission electron microscopy (TEM) samples were prepared by focused-ion beam
(FIB) lift-out techniques with an FEI Nova200 NanoLab and analyzed using an FEI
CM200-FEG, operated at 200 kV, with an EDAX SiLi EDS X-ray detector. Electron
microscopy work was done in the LeRoy-Eyring Center for Solid State Science (LE-
CSSS) at Arizona State University.
Synchrotron micro X-ray diffraction was performed on the thin section at GSE-
CARS at the Advanced Photon Source, Argonne National Lab, at the sector 13BM-D
bending magnet using a 12 x 6 µm focused X-ray beam (λ=0.3771Å) and an imaging
plate (MAR345) detector. Refinement was performed with GSAS software (Larsen and
Von Dreele 1994; Toby 2001) with initial peak shape defined by the instrumental
parameter file. The diffuse background from the glass section was corrected by
subtracting a pattern of a maskelynite from the patterns of interest. The maskelynite is
~200 µm away from the area of interest and exhibits a pure diffuse amorphous pattern.
The intensity of the maskelynite diffuse ring seems slightly higher than the background
from the glass section and created a negative hump at d = 3.7 Å (2θ = 5.8°) in the
background-subtracted patterns. This hump does not interfere with the HP mineral peaks
of interest and was removed before refinement.
The phase diagram for Mg0.8Fe0.2SiO3 composition was calculated with PerpleX
software (Connolly 2009) using the thermodynamic models and parameters from
67
Stixrude and Lithgow-Bertelloni (2011). This composition was selected based on the
composition of enstatite (Fs21.6) in the host-rock of Acfer 040 (Wlotzka 1991).
3.3 Results
The shock melt in Acfer 040 occurs as a complex network of melt veins and
pockets that vary from 10 µm to 2 mm in thickness. High-pressure minerals are
ubiquitous, but they are exclusively associated with the shock melt. Olivines are partially
to completely transformed to ringwoodite and all of the pyroxenes entrained in shock
melt are transformed. The enstatite and diopside clasts in the shock melt show a variety
of transformation textures that suggest a variety of high-pressure pyroxene polymorphs.
The enstatite clasts entrained in the thick melt pocket have a smooth cellular
texture with domains defined by interstitial material with a higher brightness in BSE
images (Figure 3.1a). These domains occur up to 2 µm in size and have a similar BSE
contrast to enstatite. The interstitial material consists of two phases that occur as
submicron particles and strings of material (Figure 3.1a). A FIB section was taken from
the transformed enstatite clast (Figure 3.2a) for TEM analysis. TEM and selected area
electron diffraction (SAED) indicate that the section is predominantly glass and EDS
analyses (Table 3.1) show that the glass has a pyroxene composition (15 mole% FeSiO3)
that is depleted in iron compared to the enstatite (Fs21.6) in the host-rock (Wlotzka 1991).
The phases between the domains of glass are crystalline and have distinct contrast
and morphologies in TEM images (Figure 3.2). The prismatic crystals (Figure 3.2a) are
stishovite (P42/mnm) elongated along <001>. The cross section of crystals viewed along
or near <001> have a square to slightly rhombic shape as expected for the tetragonal

68
symmetry of stishovite (Figure 3.2b). The contrast of the fine-grained stishovite in BSE
images is not strong enough to stand out. SAED indicates that the other two interstitial
phases (Figure 3.2c) are coherently intergrown ringwoodite (Fd-3m) and
magnesiowüstite (Fm-3m), which correspond to the bright contrast phases in the BSE
images. They occur in close spatial association with a topotaxial crystallographic
relationship where {400} and {220} planes of ringwoodite are parallel to the {200} and
{220} planes of magnesiowüstite. Bright-field TEM images of ringwoodite show a
mottled contrast from local strain and defects. The streaks on the SAED patterns of
ringwoodite in are inferred to be from the stacking faults. The magnesiowüstite also has
mottled contrast, probably from intergrown magnetite, but SAED does not show evidence
of magnetite. The composition of ringwoodite is consistently around 50 mole% Fe2SiO4
(Table 3.1). The stishovite is commonly associated with intergrown ringwoodite and
magnesiowüstite but does not have a crystallographic relationship with either.
Magnesiowüstite, ringwoodite and stishovite are interpreted to be the dissociation
products of enstatite. There are approximately equal amounts of ringwoodite and
magnesiowüstite. Thus the reaction would be 3(Mg,Fe)SiO3 = (Mg,Fe)O + (Mg,Fe)2SiO4
+ 2SiO2.
Synchrotron micro X-ray diffraction on the enstatite clast in Figure 3.1a includes
diffraction from ringwoodite, stishovite, akimotoite, troilite, Fe-Ni alloy and bridgmanite.
The strongest diffraction comes from troilite and metal, which occur as either inclusions
in the transformed pyroxene or in the surrounding crystallized melt matrix. Similarly, the
signal of akimotoite (R-3) might come from the surrounding melt matrix or partial
transformation of the enstatite, although akimotoite does not occur in the FIB section.
69
The ringwoodite has the cell parameter of a = 8.152 Å. The size of the unit cell is
consistent with the measured (50 mole%) Fe2SiO4 content (Ma et al. 2016). With troilite,
metal, stishovite, akimotoite and ringwoodite refined, there is a residual set of diffraction
peaks that are not matched by the calculated pattern. These peaks correspond to d-
spacings of 2.511, 2.401, 2.079, 2.069, 1.738 and 1.728 Å and are modeled assuming a
perovskite structure (Pbnm) with the starting cell parameters of a = 4.81 Å, b = 5.02 Å
and c= 6.9 Å from the bridgmanite in Tenham (Tschauner et al. 2014). Refinement
indicates that the residual peaks can be the diffraction from bridgmanite with indices 200,
002, 103, 211, 220 and 023. The cell parameters of bridgmanite (Pbnm) are a = 4.806 Å,
b = 5.031 Å and c= 6.914 Å. The unit cell volume is 167.2 Å3, which is in range of ferric-
iron-bearing bridgmanite (Hummer and Fei 2012; Tschauner et al. 2014), although the
TEM-EDS analysis gives a reasonable enstatite formula assuming all ferrous iron (Table
3.1). The low intensity of these peaks indicates that there is only a trace of crystalline
bridgmanite.
Another type of enstatite transformation occurs in the clasts associated with the
melt veins of 200-500 µm thickness (Figure 3.1c). This enstatite clast is partially
transformed to pure akimotoite. The akimotoite domain has local contrast variations in
BSE images, corresponding to variations in iron-content from 19 to 26 mole% FeSiO3, as
measured by SEM-EDS analyzes. Bright particles and troilite inclusions also occur in the
clast. However, the high contrast particles are randomly distributed instead of occurring
on grain boundaries, as in the bridgmanite bearing clasts. In the partially transformed
clast (Figure 3.1c), the enstatite domain is birefringent and fractured whereas the
akimotoite domain is smooth and fine-grained. Micro-XRD on the transformed clast
70
shows a pattern of pure akimotoite with completely random crystallite orientations
(Figure 3.3b). The refined cell parameters of akimotoite are a = 4.853 Å and c = 13.941 Å.
Clasts of high-Ca pyroxene composition in the melt show a different
transformation texture (Figure 3.1b) that includes granular domains with high contrast.
These domains occur in irregular angular shapes and are birefringent under cross
polarized light. The rest of the clast are homogenous and darker in contrast. The micro-
XRD pattern from the homogeneous part is identical to that of the surrounding melt
matrix. No diopside or perovskite structure can be identified from the pattern, suggesting
that part of the clast is amorphous.
The melt matrix consists of three silicate phases plus metal-troilite droplets
(Figure 3.1d). The equant granular phase is a ubiquitous constituent of the melt matrix
and has a composition of sodium-aluminum rich pyroxene (Table 3.1). The composition
is close to the amorphous grains analyzed by TEM-EDS (Sharp et al. 1997). Elongated
crystals with similar dark grey BSE contrast are intergrown with an anhedral light grey
phase. The round droplets with grey to white contrast are troilite and Fe-Ni metal. An
area clear of these droplets was selected for micro-XRD. The diffraction pattern includes
the signal from ringwoodite, akimotoite and bridgmanite (Figure 3.3c). The light grey
anhedral phase in the BSE images is inferred to be ringwoodite. Its cell parameter is a =
8.120 Å. The unit cell volume of the crystallized ringwoodite is smaller than the iron-rich
ringwoodite from the dissociation of enstatite. Based on the crystal morphologies and
previous work (Sharp et al. 1997), the granular and elongated grains in the BSE image
correspond to bridgmanite and akimotoite, respectively. Refinement of the XRD data
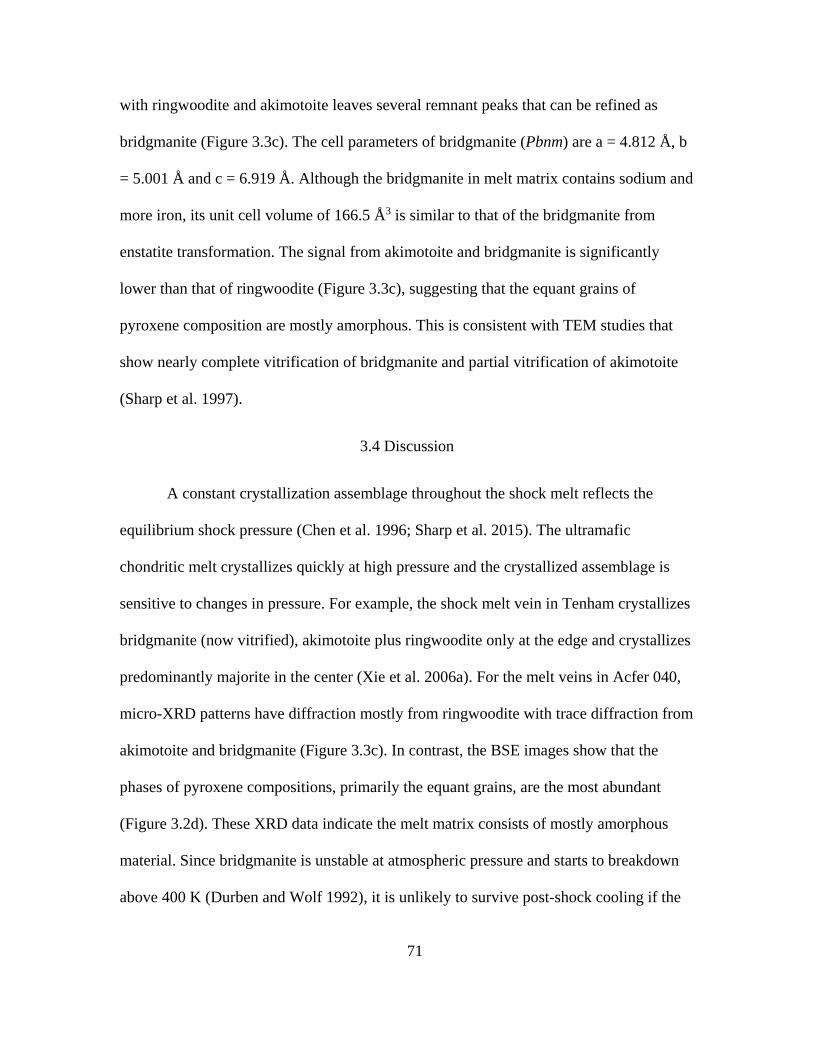
71
with ringwoodite and akimotoite leaves several remnant peaks that can be refined as
bridgmanite (Figure 3.3c). The cell parameters of bridgmanite (Pbnm) are a = 4.812 Å, b
= 5.001 Å and c = 6.919 Å. Although the bridgmanite in melt matrix contains sodium and
more iron, its unit cell volume of 166.5 Å3 is similar to that of the bridgmanite from
enstatite transformation. The signal from akimotoite and bridgmanite is significantly
lower than that of ringwoodite (Figure 3.3c), suggesting that the equant grains of
pyroxene composition are mostly amorphous. This is consistent with TEM studies that
show nearly complete vitrification of bridgmanite and partial vitrification of akimotoite
(Sharp et al. 1997).
3.4 Discussion
A constant crystallization assemblage throughout the shock melt reflects the
equilibrium shock pressure (Chen et al. 1996; Sharp et al. 2015). The ultramafic
chondritic melt crystallizes quickly at high pressure and the crystallized assemblage is
sensitive to changes in pressure. For example, the shock melt vein in Tenham crystallizes
bridgmanite (now vitrified), akimotoite plus ringwoodite only at the edge and crystallizes
predominantly majorite in the center (Xie et al. 2006a). For the melt veins in Acfer 040,
micro-XRD patterns have diffraction mostly from ringwoodite with trace diffraction from
akimotoite and bridgmanite (Figure 3.3c). In contrast, the BSE images show that the
phases of pyroxene compositions, primarily the equant grains, are the most abundant
(Figure 3.2d). These XRD data indicate the melt matrix consists of mostly amorphous
material. Since bridgmanite is unstable at atmospheric pressure and starts to breakdown
above 400 K (Durben and Wolf 1992), it is unlikely to survive post-shock cooling if the
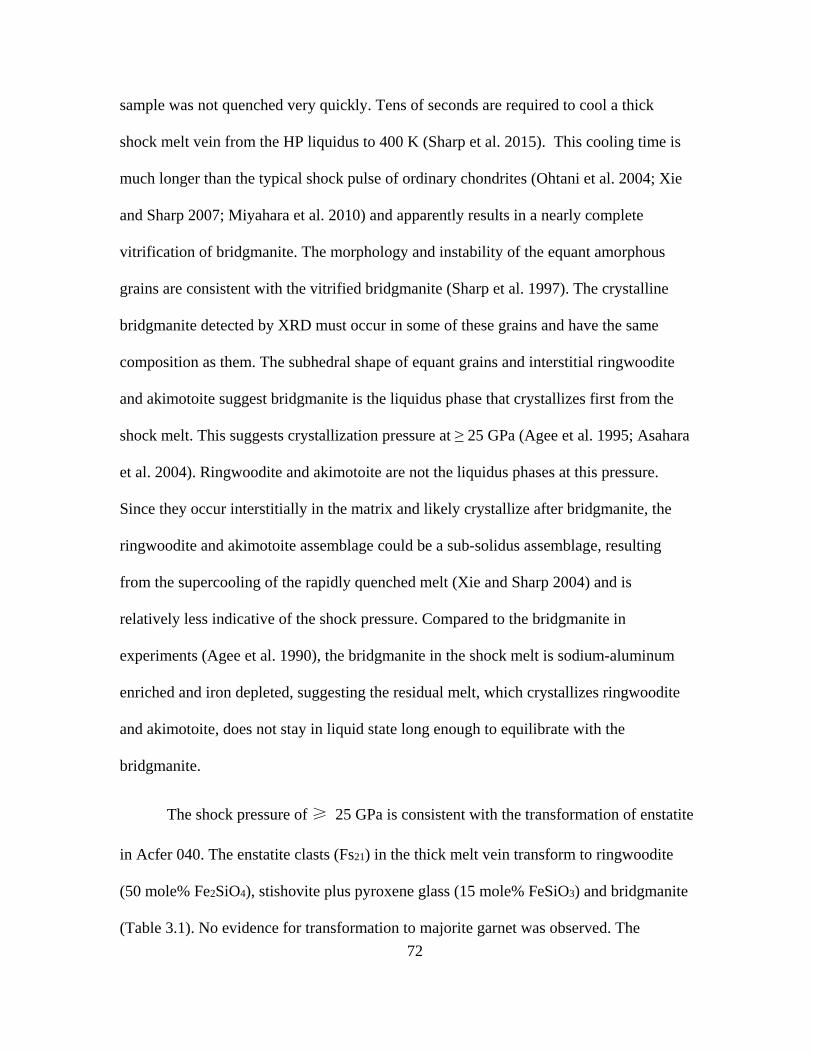
72
sample was not quenched very quickly. Tens of seconds are required to cool a thick
shock melt vein from the HP liquidus to 400 K (Sharp et al. 2015). This cooling time is
much longer than the typical shock pulse of ordinary chondrites (Ohtani et al. 2004; Xie
and Sharp 2007; Miyahara et al. 2010) and apparently results in a nearly complete
vitrification of bridgmanite. The morphology and instability of the equant amorphous
grains are consistent with the vitrified bridgmanite (Sharp et al. 1997). The crystalline
bridgmanite detected by XRD must occur in some of these grains and have the same
composition as them. The subhedral shape of equant grains and interstitial ringwoodite
and akimotoite suggest bridgmanite is the liquidus phase that crystallizes first from the
shock melt. This suggests crystallization pressure at ≥ 25 GPa (Agee et al. 1995; Asahara
et al. 2004). Ringwoodite and akimotoite are not the liquidus phases at this pressure.
Since they occur interstitially in the matrix and likely crystallize after bridgmanite, the
ringwoodite and akimotoite assemblage could be a sub-solidus assemblage, resulting
from the supercooling of the rapidly quenched melt (Xie and Sharp 2004) and is
relatively less indicative of the shock pressure. Compared to the bridgmanite in
experiments (Agee et al. 1990), the bridgmanite in the shock melt is sodium-aluminum
enriched and iron depleted, suggesting the residual melt, which crystallizes ringwoodite
and akimotoite, does not stay in liquid state long enough to equilibrate with the
bridgmanite.
The shock pressure of ≥ 25 GPa is consistent with the transformation of enstatite
in Acfer 040. The enstatite clasts (Fs21) in the thick melt vein transform to ringwoodite
(50 mole% Fe2SiO4), stishovite plus pyroxene glass (15 mole% FeSiO3) and bridgmanite
(Table 3.1). No evidence for transformation to majorite garnet was observed. The
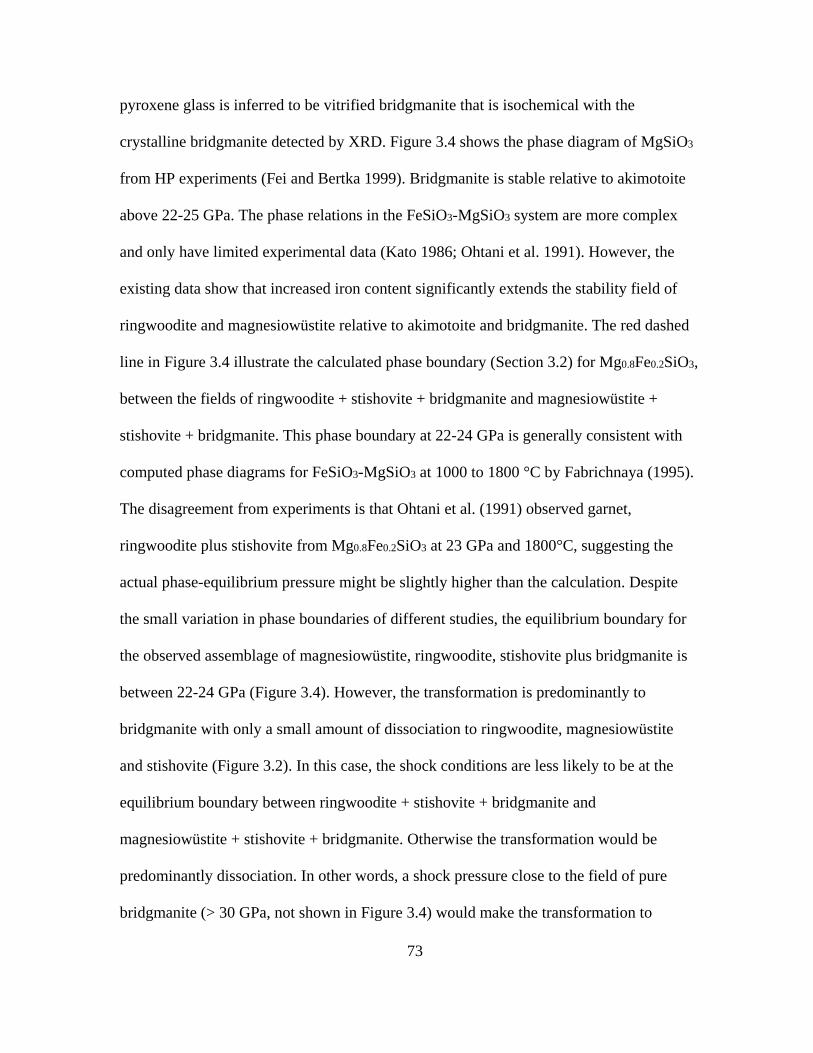
73
pyroxene glass is inferred to be vitrified bridgmanite that is isochemical with the
crystalline bridgmanite detected by XRD. Figure 3.4 shows the phase diagram of MgSiO3
from HP experiments (Fei and Bertka 1999). Bridgmanite is stable relative to akimotoite
above 22-25 GPa. The phase relations in the FeSiO3-MgSiO3 system are more complex
and only have limited experimental data (Kato 1986; Ohtani et al. 1991). However, the
existing data show that increased iron content significantly extends the stability field of
ringwoodite and magnesiowüstite relative to akimotoite and bridgmanite. The red dashed
line in Figure 3.4 illustrate the calculated phase boundary (Section 3.2) for Mg0.8Fe0.2SiO3,
between the fields of ringwoodite + stishovite + bridgmanite and magnesiowüstite +
stishovite + bridgmanite. This phase boundary at 22-24 GPa is generally consistent with
computed phase diagrams for FeSiO3-MgSiO3 at 1000 to 1800 °C by Fabrichnaya (1995).
The disagreement from experiments is that Ohtani et al. (1991) observed garnet,
ringwoodite plus stishovite from Mg0.8Fe0.2SiO3 at 23 GPa and 1800°C, suggesting the
actual phase-equilibrium pressure might be slightly higher than the calculation. Despite
the small variation in phase boundaries of different studies, the equilibrium boundary for
the observed assemblage of magnesiowüstite, ringwoodite, stishovite plus bridgmanite is
between 22-24 GPa (Figure 3.4). However, the transformation is predominantly to
bridgmanite with only a small amount of dissociation to ringwoodite, magnesiowüstite
and stishovite (Figure 3.2). In this case, the shock conditions are less likely to be at the
equilibrium boundary between ringwoodite + stishovite + bridgmanite and
magnesiowüstite + stishovite + bridgmanite. Otherwise the transformation would be
predominantly dissociation. In other words, a shock pressure close to the field of pure
bridgmanite (> 30 GPa, not shown in Figure 3.4) would make the transformation to
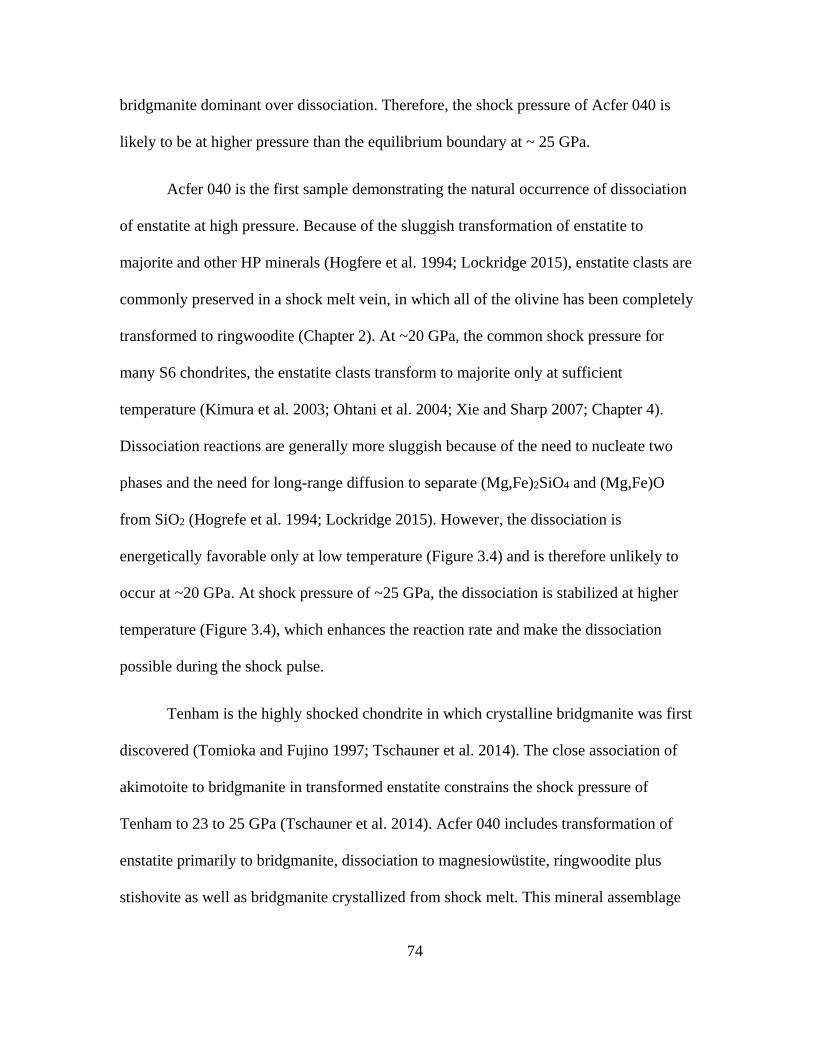
74
bridgmanite dominant over dissociation. Therefore, the shock pressure of Acfer 040 is
likely to be at higher pressure than the equilibrium boundary at ~ 25 GPa.
Acfer 040 is the first sample demonstrating the natural occurrence of dissociation
of enstatite at high pressure. Because of the sluggish transformation of enstatite to
majorite and other HP minerals (Hogfere et al. 1994; Lockridge 2015), enstatite clasts are
commonly preserved in a shock melt vein, in which all of the olivine has been completely
transformed to ringwoodite (Chapter 2). At ~20 GPa, the common shock pressure for
many S6 chondrites, the enstatite clasts transform to majorite only at sufficient
temperature (Kimura et al. 2003; Ohtani et al. 2004; Xie and Sharp 2007; Chapter 4).
Dissociation reactions are generally more sluggish because of the need to nucleate two
phases and the need for long-range diffusion to separate (Mg,Fe)2SiO4 and (Mg,Fe)O
from SiO2 (Hogrefe et al. 1994; Lockridge 2015). However, the dissociation is
energetically favorable only at low temperature (Figure 3.4) and is therefore unlikely to
occur at ~20 GPa. At shock pressure of ~25 GPa, the dissociation is stabilized at higher
temperature (Figure 3.4), which enhances the reaction rate and make the dissociation
possible during the shock pulse.
Tenham is the highly shocked chondrite in which crystalline bridgmanite was first
discovered (Tomioka and Fujino 1997; Tschauner et al. 2014). The close association of
akimotoite to bridgmanite in transformed enstatite constrains the shock pressure of
Tenham to 23 to 25 GPa (Tschauner et al. 2014). Acfer 040 includes transformation of
enstatite primarily to bridgmanite, dissociation to magnesiowüstite, ringwoodite plus
stishovite as well as bridgmanite crystallized from shock melt. This mineral assemblage
75
represents the highest shock pressure (≥ 25 GPa) recorded by high-pressure minerals in a
chondrite. At considerably higher shock pressure (≥ 30 or 35 GPa), bridgmanite would be
more predominant in the HP assemblage during the shock pulse. However, the post-shock
temperature also increases with shock pressure. In this case, bridgmanite might be
completely vitrified or recrystallize to pyroxene, leaving no mineralogical indicator of
high pressure.
3.5 Conclusion
The enstatite clasts in the shock melt of Acfer 040 transformed to
magnesiowüstite, ringwoodite, stishovite and bridgmanite. The shock melt crystallized
ringwoodite, akimotoite and bridgmanite. Although micro-XRD indicates trace
crystalline bridgmanite in transformed enstatite and quenched shock melt, TEM results
indicate the bridgmanite is mostly vitrified to a glass of pyroxene composition in the
shock melt. Both the transformation and crystallization of bridgmanite suggest a shock
pressure ≥ 25 GPa, which is the highest pressure recorded by high-pressure minerals in
chondrites.
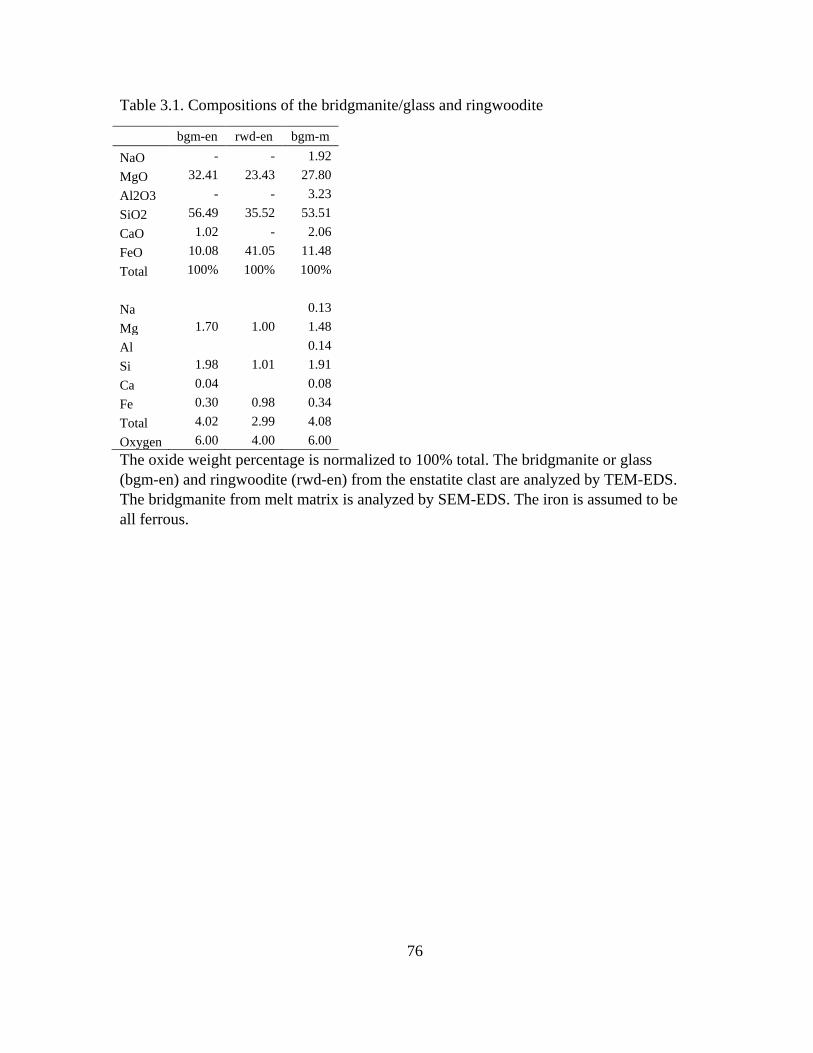
76
Table 3.1. Compositions of the bridgmanite/glass and ringwoodite
bgm-en rwd-en bgm-m NaO - - 1.92 MgO 32.41 23.43 27.80 Al2O3 - - 3.23 SiO2 56.49 35.52 53.51 CaO 1.02 - 2.06 FeO 10.08 41.05 11.48 Total 100% 100% 100%
Na 0.13 Mg 1.70 1.00 1.48 Al 0.14 Si 1.98 1.01 1.91 Ca 0.04 0.08 Fe 0.30 0.98 0.34 Total 4.02 2.99 4.08 Oxygen 6.00 4.00 6.00 The oxide weight percentage is normalized to 100% total. The bridgmanite or glass (bgm-en) and ringwoodite (rwd-en) from the enstatite clast are analyzed by TEM-EDS. The bridgmanite from melt matrix is analyzed by SEM-EDS. The iron is assumed to be all ferrous.
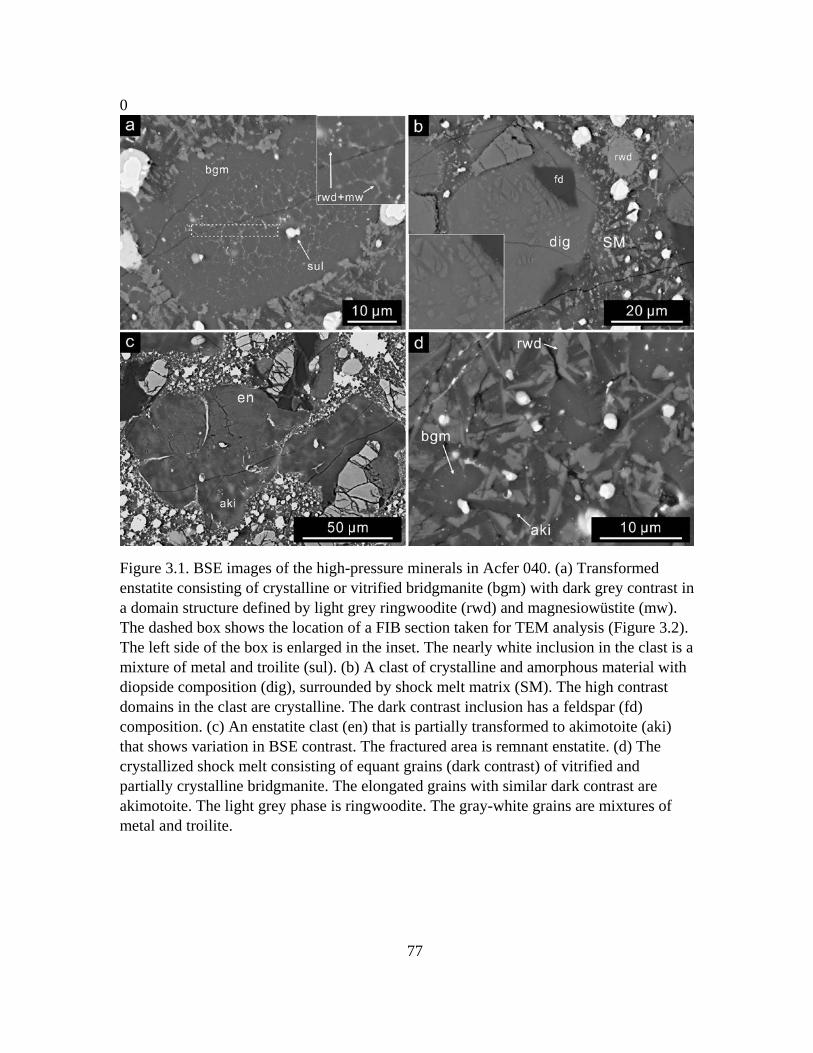
77
0
Figure 3.1. BSE images of the high-pressure minerals in Acfer 040. (a) Transformed enstatite consisting of crystalline or vitrified bridgmanite (bgm) with dark grey contrast in a domain structure defined by light grey ringwoodite (rwd) and magnesiowüstite (mw). The dashed box shows the location of a FIB section taken for TEM analysis (Figure 3.2). The left side of the box is enlarged in the inset. The nearly white inclusion in the clast is a mixture of metal and troilite (sul). (b) A clast of crystalline and amorphous material with diopside composition (dig), surrounded by shock melt matrix (SM). The high contrast domains in the clast are crystalline. The dark contrast inclusion has a feldspar (fd) composition. (c) An enstatite clast (en) that is partially transformed to akimotoite (aki) that shows variation in BSE contrast. The fractured area is remnant enstatite. (d) The crystallized shock melt consisting of equant grains (dark contrast) of vitrified and partially crystalline bridgmanite. The elongated grains with similar dark contrast are akimotoite. The light grey phase is ringwoodite. The gray-white grains are mixtures of metal and troilite.
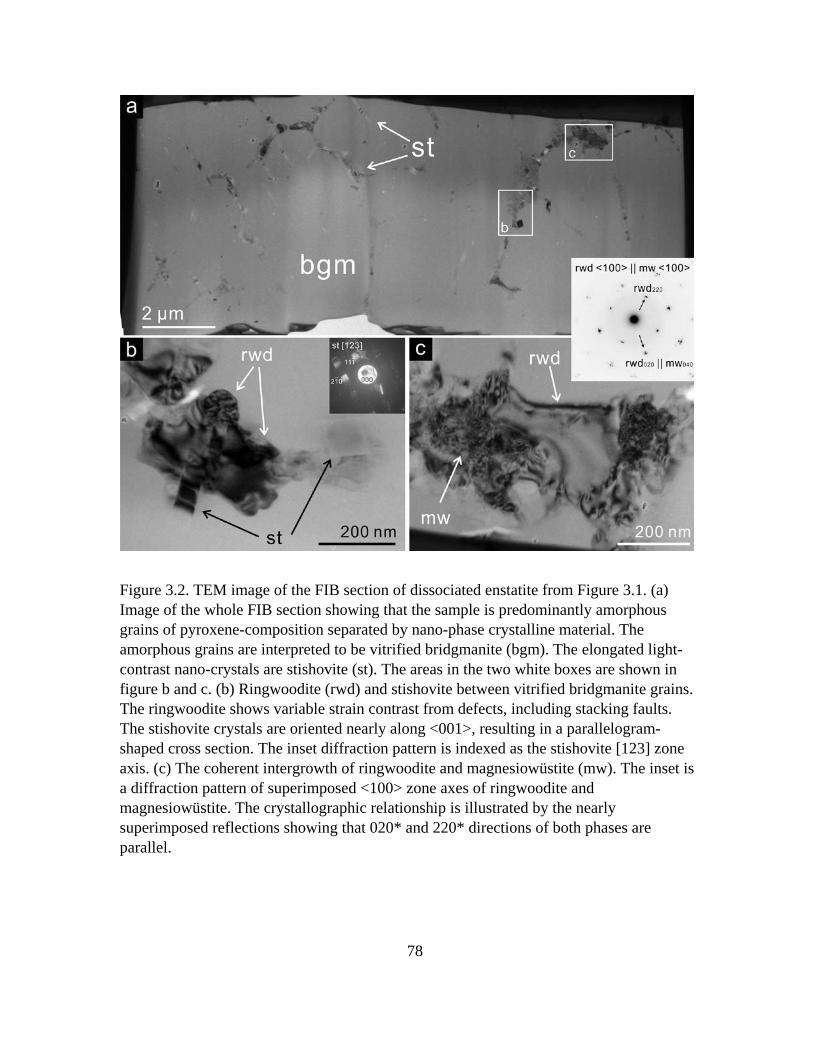
78
Figure 3.2. TEM image of the FIB section of dissociated enstatite from Figure 3.1. (a) Image of the whole FIB section showing that the sample is predominantly amorphous grains of pyroxene-composition separated by nano-phase crystalline material. The amorphous grains are interpreted to be vitrified bridgmanite (bgm). The elongated light-contrast nano-crystals are stishovite (st). The areas in the two white boxes are shown in figure b and c. (b) Ringwoodite (rwd) and stishovite between vitrified bridgmanite grains. The ringwoodite shows variable strain contrast from defects, including stacking faults. The stishovite crystals are oriented nearly along <001>, resulting in a parallelogram-shaped cross section. The inset diffraction pattern is indexed as the stishovite [123] zone axis. (c) The coherent intergrowth of ringwoodite and magnesiowüstite (mw). The inset is a diffraction pattern of superimposed <100> zone axes of ringwoodite and magnesiowüstite. The crystallographic relationship is illustrated by the nearly superimposed reflections showing that 020* and 220* directions of both phases are parallel.
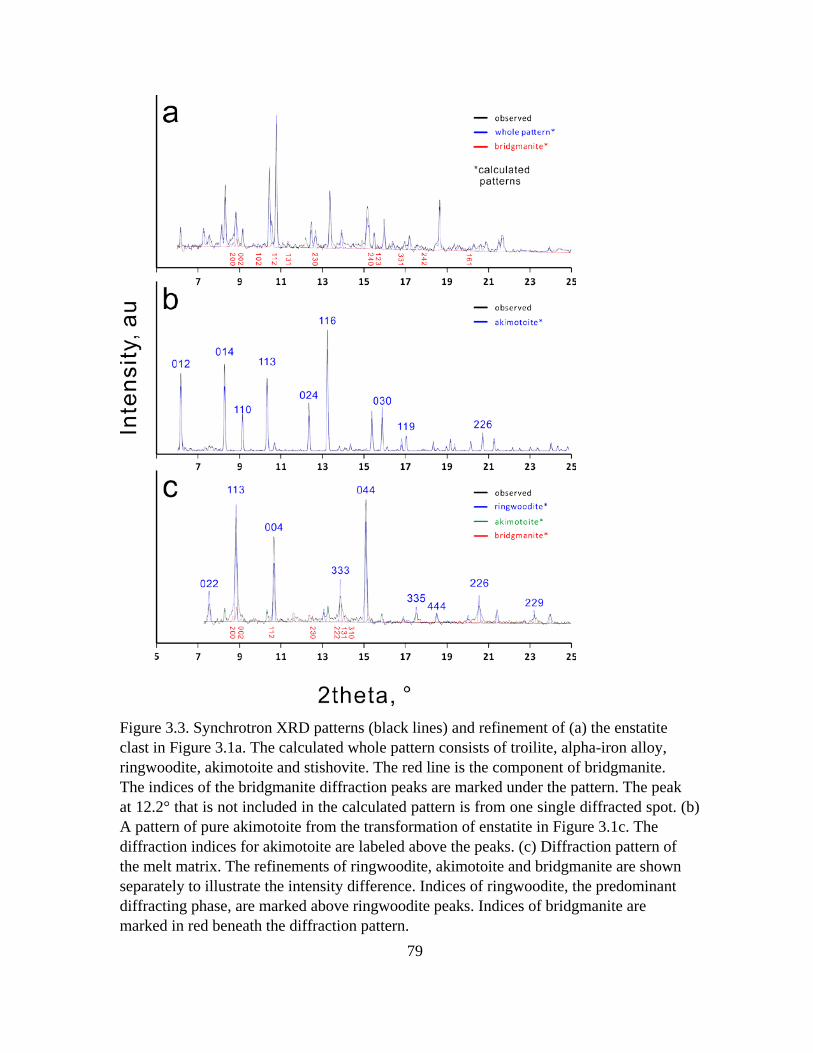
79
Figure 3.3. Synchrotron XRD patterns (black lines) and refinement of (a) the enstatite clast in Figure 3.1a. The calculated whole pattern consists of troilite, alpha-iron alloy, ringwoodite, akimotoite and stishovite. The red line is the component of bridgmanite. The indices of the bridgmanite diffraction peaks are marked under the pattern. The peak at 12.2° that is not included in the calculated pattern is from one single diffracted spot. (b) A pattern of pure akimotoite from the transformation of enstatite in Figure 3.1c. The diffraction indices for akimotoite are labeled above the peaks. (c) Diffraction pattern of the melt matrix. The refinements of ringwoodite, akimotoite and bridgmanite are shown separately to illustrate the intensity difference. Indices of ringwoodite, the predominant diffracting phase, are marked above ringwoodite peaks. Indices of bridgmanite are marked in red beneath the diffraction pattern.
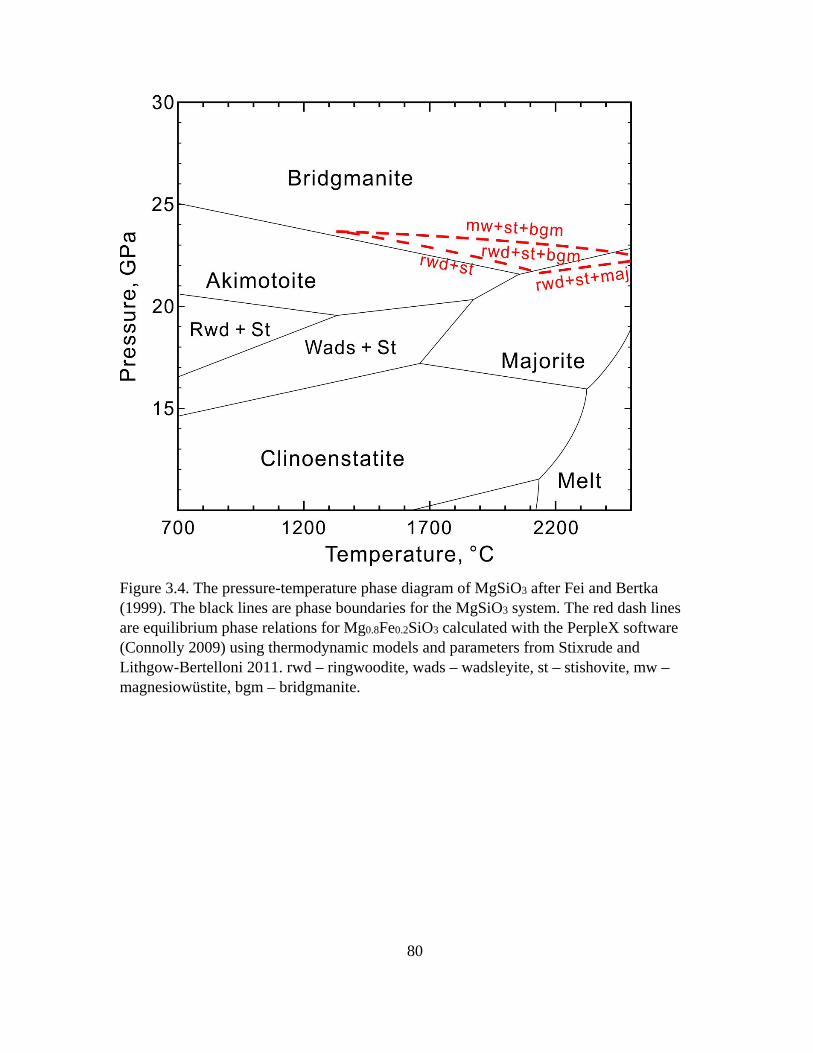
80
Figure 3.4. The pressure-temperature phase diagram of MgSiO3 after Fei and Bertka (1999). The black lines are phase boundaries for the MgSiO3 system. The red dash lines are equilibrium phase relations for Mg0.8Fe0.2SiO3 calculated with the PerpleX software (Connolly 2009) using thermodynamic models and parameters from Stixrude and Lithgow-Bertelloni 2011. rwd – ringwoodite, wads – wadsleyite, st – stishovite, mw – magnesiowüstite, bgm – bridgmanite.
81
Chapter 4
Back-transformation of high-pressure minerals in the Mbale L chondrite: low-pressure
minerals reveal a high shock pressure
4.1 Introduction
The link between shock pressure and shock-induced transformation features in
meteorites is complicated by post-shock annealing. Shock-induced high-pressure
transformation are driven by pressure and enabled by the local high temperatures
associated with melting. However, high temperatures after decompression can result in
back-transformation of the high-pressure phases, leading to discrepancies in the
estimation of shock stage from coexisting shock features. Mbale is a highly shocked L5-6
chondrite that contains clasts of polycrystalline olivine, ringwoodite and wadsleyite in its
shock melt veins. I characterized the mineralogy of shock veins to investigate the origin
of polycrystalline olivine aggregates and used thermal modeling to reveal the post-shock
condition that enables back-transformation.
4.2 Sample and Methods
Mbale is an L5/6 ordinary chondrite recovered from a meteorite shower in
Uganda in 1992 (Wlotzka 1993). Two investigated thin sections were made from material
provided by P.M. Jenniskens. The third thin section (#ASU1410-2-A-1) was provided by
the Center for Meteorite Studies, Arizona State University. The petrologic microscope
was used to document melt-vein thickness and internal textures and to identify mineral
fragments transformed to high-pressure minerals such as ringwoodite. Transformation to
high-pressure phases was confirmed by Raman spectroscopy, using a 532-nm
82
unpolarized laser with power of 0.7-6 mW. The laser was focused onto the sample using
a 50× long working-distance Mitutoyo objective with a numerical aperture of 0.42. The
laser spot size on sample is 0.5 µm. The data were collected using an Acton 300i
spectrograph and a back thinned Princeton Instruments liquid nitrogen cooled CCD
detector. Spectra were collected in the wavenumber range of 100 to 2200 cm-1 for 20-60
seconds. The spectra are not background-subtracted or baseline-corrected. The spectra are
smoothed by a Savitzky-Golay filter of third-order polynomial in Spekwin32 software.
Detailed shock-vein textures were investigated by scanning electron microscopy (SEM)
using an FEI XL30 with a field-emission gun and energy dispersive X-ray spectroscopy
(EDS). The typical SEM operating conditions included an accelerating voltage of 15-20
keV, a working distance of 6 to 11 mm, and a probe current of 3 to 10 nA. EDS with an
EDAX SiLi detector was employed to measure chemical compositions. Quantitative
results were obtained using the k-factor method (Cliff and Lorimer 1975). Analyses used
4-10 μs process time to achieve signal greater than 1000 counts per second (CPS) and ~
30% dead time. Absorption and fluorescence effects were corrected with a ZAF model.
Chemical analyses were also performed on JEOL JXA-8530F microprobe with a silicon-
drift EDS detector. The microprobe was operated at 15 keV, 40 nA beam current and 10
mm working distance. The analyses achieved 30% dead time and signal of 15,000 CPS.
Raman spectroscopy, SEM and microprobe were performed in the LeRoy-Eyring Center
for Solid State Science (LE-CSSS) at Arizona State University.
Shock-vein mineralogy and microstructures were investigated with Transmission
Electron Microscopy (TEM) using an FEI CM200-FEG in the LE-CSSS. TEM samples
were prepared by focused-ion beam (FIB) lift-out techniques with an FEI Nova200
83
NanoLab in the LE-CSSS. The CM200 was operated at 200 keV. Bright-field imaging
was used to investigate melt-vein textures, mineral intergrowths and defects. Mineral
phases were identified by selected area electron diffraction (SAED), accompanied by
EDS chemical analysis using an EDAX SiLi detector. Quantitative EDS data processing
was performed with the Emispec Vision system.
Synchrotron micro X-ray diffraction was performed on the thin sections at GSE-
CARS at the Advanced Photon Source, Argonne National Lab, using the sector 13ID-C
insertion device beamline. I used a 2 × 2 µm size focused X-ray beam of 20 keV (λ =
0.6199 Å) for the analysis. Refinement was performed with GSAS software (Larsen and
Von Dreele 1994; Toby 2001) with initial peak shape defined by the 13ID instrumental
parameter file. Cell parameter, intensity scaling and peak shape were refined in the
software.
Thermal modeling was performed by Finite Element Heat Transfer (FEHT) software
(Incropera et al. 2006) to simulate the cooling of the melt vein and host rock. The
thermodynamic parameters used for the chondritic material are similar to those for
Tenham and RC 106 L chondrite (Xie et al. 2006; Sharp et al. 2015; see also section
4.4.3). Cooling histories of the melt, the olivine clast in the melt vein and the host rock
are investigated in the models.
4.3 Results
4.3.1 Petrology of the chondrite
The host chondrite of Mbale mainly consists of olivine, low-Ca pyroxene, high-
Ca pyroxene, feldspar, iron sulfide, chromite and iron-nickel alloy. The compositions of
84
olivine and low-Ca pyroxene are Fa25 and Fs21 (Wlotzka 1993; Jenniskens et al. 1994),
which agrees well with my SEM-EDS analyses. Recrystallized plagioclase
(commonly >100 µm in grain size) in the host chondrite indicates a petrologic type above
type 5. Isotropic feldspar grains are inferred to be shock induced diaplectic glass from
plagioclase. In local areas, primary micro-polycrystalline plagioclase aggregates (Figure
4.1b) suggest a petrologic type 5-6. Chondrules that can still be delineated (Figure 4.1a)
are consistent with the petrologic type between 5 and 6 (Wlotzka 1993). The light color
of the host chondrite indicates freshness of the sample without terrestrial oxidation
(Figure 4.1a). Shock-induced melt forms blackened veins with entrained translucent
clasts of host chondrite (Figure 4.1a & b). The shock melt in two sections occurs as
straight and isolated veins (Figure 4.1a), varying in thickness from ~100 to 2000 µm. In
the other section, the melt forms a network of veins and pockets with similar thickness
variation. Disseminated metal-sulfide droplets cause the shock vein to be opaque.
However, the crystallized silicate matrix can still be translucent (Figure 4.1c).
4.3.2 Solid-state transformation
Clasts of rock-forming minerals in the shock melt undergo shock metamorphism
in solid state and are characterized by microscopy and spectroscopy.
The olivine-composition clasts in the shock melt are mostly colorless under plane-
polarized light (Figure 4.1c). Crossed-polarized light images show that the clasts are fine-
grained aggregates of grains with different extinction orientations (Figure 4.1d). Raman
spectroscopy (Figure 4.2) indicates some of the aggregates (Figure 4.1d) are olivine.
However, their polycrystalline occurrence is distinctly different from the olivine single
85
crystals in the host chondrite. In some clasts (Figure 4.1c), Raman spectra, with
diagnostic peaks at 718 and 918 cm-1, indicate olivine’s high-pressure polymorph
wadsleyite (Figure 4.2). Small peaks at 785 and 844 cm-1 in the spectrum indicate that the
clast includes small amounts of ringwoodite. The 780 cm-1 wadsleyite peak can be
distinguished from ringwoodite signal as a shoulder on the 785 cm-1 ringwoodite peak.
Compared to the 790 cm-1 peak for regular magnesian ringwoodite, the relative low
frequency of the 785 cm-1 peak suggests a Fe2SiO4 content greater than 50 mole% in the
ringwoodite (Feng et al. 2011). This is inferred to be from preferred iron partitioning into
the spinel structure of ringwoodite. Trace olivine is identified in the same spectrum by
the 825 cm-1 peak and the shoulder at ~855 cm-1.
SEM back-scattered electron images show atomic-number contrast variations in
the olivine clasts (Figure 4.3a, b & c). In Figure 3a, the big, 150 µm, olivine clast
includes bright domains and dark channels between the domains. Lighter grey olivine
crystals occur around a feldspar inclusion (Figure 4.3b). EDS analysis confirms that the
contrast variation correlates with iron content (Table 4.1). The light grey olivine in Figure
3b contains up to 83% fayalite. In contrast, the dark grey olivine can have less than 20%
fayalite. The Fa83 olivine is relatively sensitive to the Raman laser and can be damaged
by a 10 s exposure to 3 mW laser power. Raman spectra from the textured olivine in
Figure 3c show the peak shifts from variations in iron concentration (Figure 4.2). The 854
and 851 cm-1 peaks are respectively consistent with Fo80 and Fo60 olivine (Kuebler et al.
2006), which agrees with the EDS analyses. Synchrotron X-ray diffraction from the
forsterite-rich olivine (Figure 4.3a) shows uniform ring patterns consistent with fine-
grained polycrystalline material. The integrated pattern matches well with the calculated
86
olivine powder pattern (Figure 4.4), with refined cell parameters: a=4.77 Å, b=10.27 Å
and c=6.01 Å.
Low calcium pyroxene transformation occurs in small clasts in the melt vein
(Figure 4.3d). These clasts show contrast variation indicative of partial transformation.
The higher density phase has a slightly brighter contrast in the BSE image and is inferred
to be majorite garnet. Raman spectra confirm the partial transformation of enstatite to
majorite (Figure 4.2). The 594 and 931 cm-1 peaks are consistent with garnet with a large
majorite component (McMillan et al. 1989; Manghnani et al. 1998). Untransformed
enstatite in the clast can be identified by the 931 cm-1 peak and 662-682 cm-1 doublet.
High calcium pyroxene clasts occur as uniform single crystals, suggesting no phase
transformation during shock (Figure 4.3c). Raman spectra with a diagnostic single peak
at 665 cm-1 distinguish the high-Ca pyroxene from enstatite. TEM confirmed the diopside
in the clast is a single crystal with deformation features that include twinning on (100).
The plagioclase outside the shock melt vein is mostly transformed to diaplectic
glass. In contrast, the clasts in the melt commonly show flow features and have silicate
inclusions, indicating that the plagioclase melted or partially melted (Figure 4.3b & c).
Small contrast variations in the feldspar suggest that a new phase crystallizes from the
feldspar melt. A Raman spectrum with peaks at 371, 696 and 986-1034 cm-1 indicates the
presence of jadeite (Figure 4.2). Silica-rich glass is inferred to coexist with the
crystallized jadeite in the feldspar (Liu 1978). The contrast variation is likely caused by
composition and density difference between jadeite, silica and feldspar.
4.3.3 The shock-melt crystallization assemblage
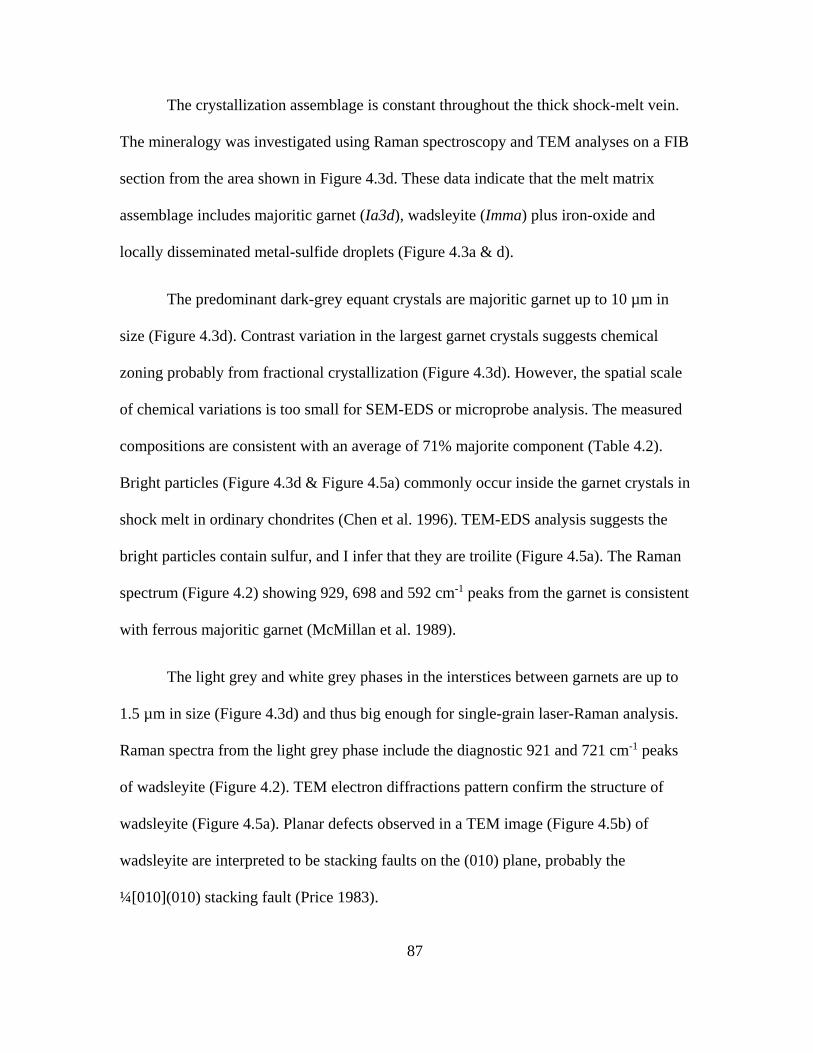
87
The crystallization assemblage is constant throughout the thick shock-melt vein.
The mineralogy was investigated using Raman spectroscopy and TEM analyses on a FIB
section from the area shown in Figure 4.3d. These data indicate that the melt matrix
assemblage includes majoritic garnet (Ia3d), wadsleyite (Imma) plus iron-oxide and
locally disseminated metal-sulfide droplets (Figure 4.3a & d).
The predominant dark-grey equant crystals are majoritic garnet up to 10 µm in
size (Figure 4.3d). Contrast variation in the largest garnet crystals suggests chemical
zoning probably from fractional crystallization (Figure 4.3d). However, the spatial scale
of chemical variations is too small for SEM-EDS or microprobe analysis. The measured
compositions are consistent with an average of 71% majorite component (Table 4.2).
Bright particles (Figure 4.3d & Figure 4.5a) commonly occur inside the garnet crystals in
shock melt in ordinary chondrites (Chen et al. 1996). TEM-EDS analysis suggests the
bright particles contain sulfur, and I infer that they are troilite (Figure 4.5a). The Raman
spectrum (Figure 4.2) showing 929, 698 and 592 cm-1 peaks from the garnet is consistent
with ferrous majoritic garnet (McMillan et al. 1989).
The light grey and white grey phases in the interstices between garnets are up to
1.5 µm in size (Figure 4.3d) and thus big enough for single-grain laser-Raman analysis.
Raman spectra from the light grey phase include the diagnostic 921 and 721 cm-1 peaks
of wadsleyite (Figure 4.2). TEM electron diffractions pattern confirm the structure of
wadsleyite (Figure 4.5a). Planar defects observed in a TEM image (Figure 4.5b) of
wadsleyite are interpreted to be stacking faults on the (010) plane, probably the
¼[010](010) stacking fault (Price 1983).
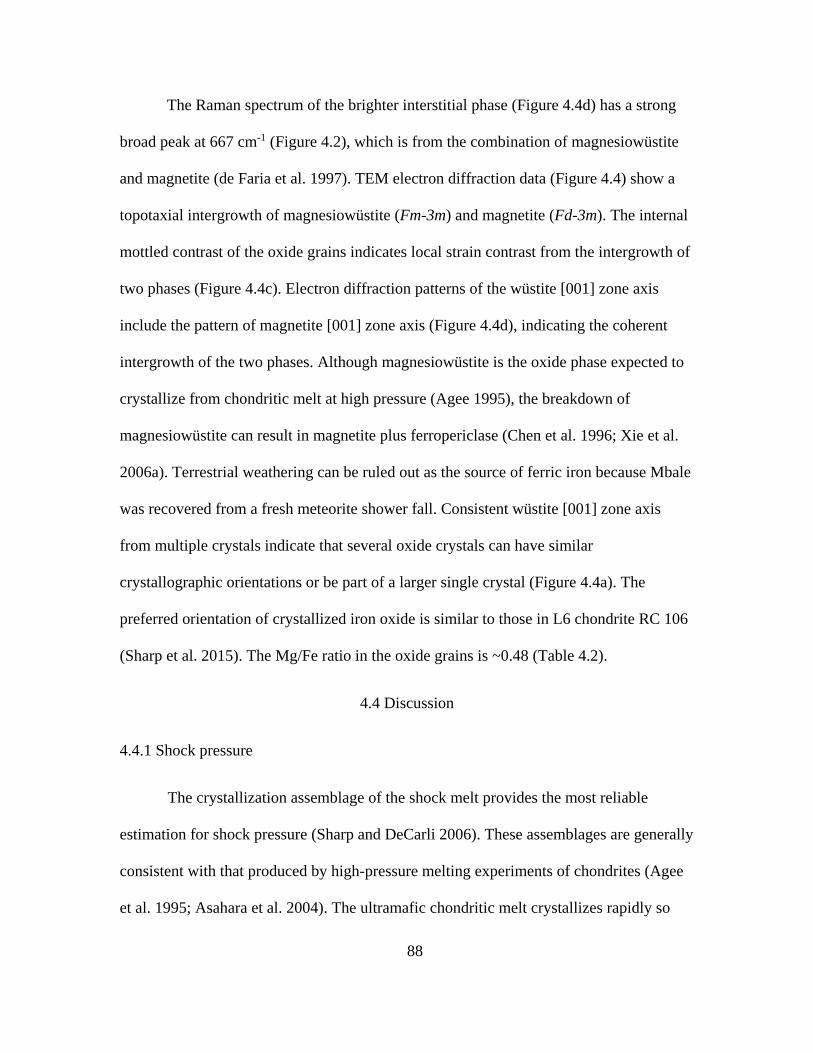
88
The Raman spectrum of the brighter interstitial phase (Figure 4.4d) has a strong
broad peak at 667 cm-1 (Figure 4.2), which is from the combination of magnesiowüstite
and magnetite (de Faria et al. 1997). TEM electron diffraction data (Figure 4.4) show a
topotaxial intergrowth of magnesiowüstite (Fm-3m) and magnetite (Fd-3m). The internal
mottled contrast of the oxide grains indicates local strain contrast from the intergrowth of
two phases (Figure 4.4c). Electron diffraction patterns of the wüstite [001] zone axis
include the pattern of magnetite [001] zone axis (Figure 4.4d), indicating the coherent
intergrowth of the two phases. Although magnesiowüstite is the oxide phase expected to
crystallize from chondritic melt at high pressure (Agee 1995), the breakdown of
magnesiowüstite can result in magnetite plus ferropericlase (Chen et al. 1996; Xie et al.
2006a). Terrestrial weathering can be ruled out as the source of ferric iron because Mbale
was recovered from a fresh meteorite shower fall. Consistent wüstite [001] zone axis
from multiple crystals indicate that several oxide crystals can have similar
crystallographic orientations or be part of a larger single crystal (Figure 4.4a). The
preferred orientation of crystallized iron oxide is similar to those in L6 chondrite RC 106
(Sharp et al. 2015). The Mg/Fe ratio in the oxide grains is ~0.48 (Table 4.2).
4.4 Discussion
4.4.1 Shock pressure
The crystallization assemblage of the shock melt provides the most reliable
estimation for shock pressure (Sharp and DeCarli 2006). These assemblages are generally
consistent with that produced by high-pressure melting experiments of chondrites (Agee
et al. 1995; Asahara et al. 2004). The ultramafic chondritic melt crystallizes rapidly so
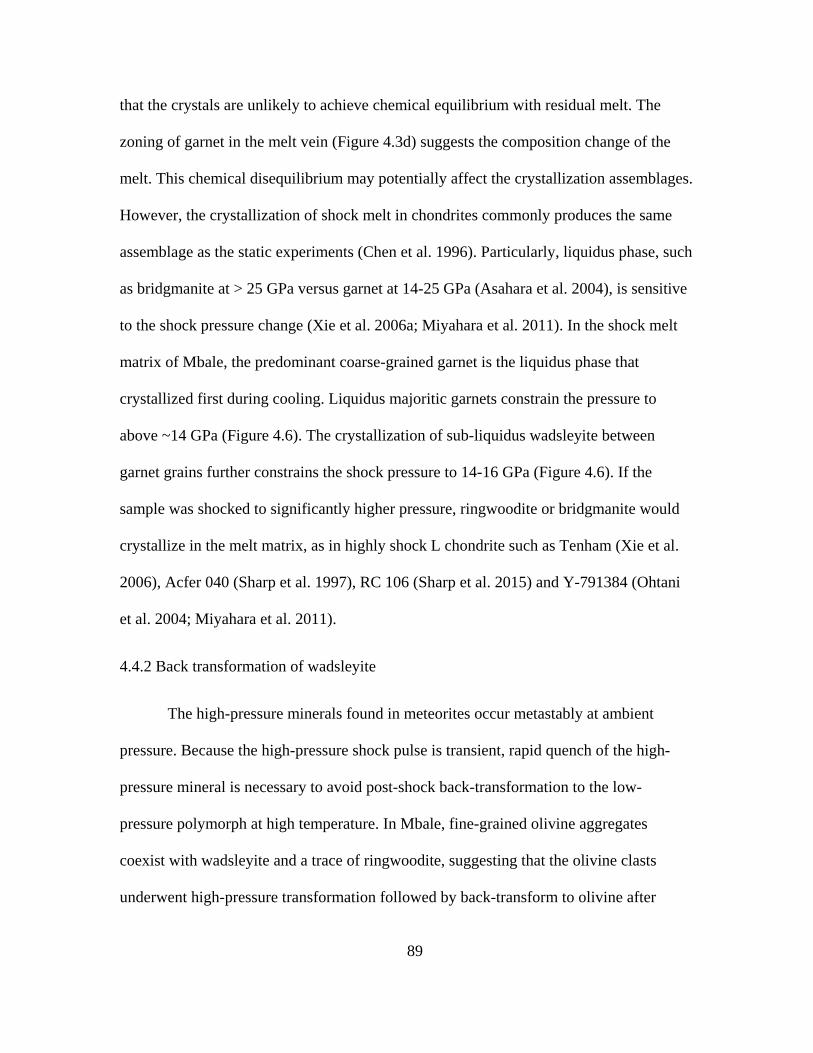
89
that the crystals are unlikely to achieve chemical equilibrium with residual melt. The
zoning of garnet in the melt vein (Figure 4.3d) suggests the composition change of the
melt. This chemical disequilibrium may potentially affect the crystallization assemblages.
However, the crystallization of shock melt in chondrites commonly produces the same
assemblage as the static experiments (Chen et al. 1996). Particularly, liquidus phase, such
as bridgmanite at > 25 GPa versus garnet at 14-25 GPa (Asahara et al. 2004), is sensitive
to the shock pressure change (Xie et al. 2006a; Miyahara et al. 2011). In the shock melt
matrix of Mbale, the predominant coarse-grained garnet is the liquidus phase that
crystallized first during cooling. Liquidus majoritic garnets constrain the pressure to
above ~14 GPa (Figure 4.6). The crystallization of sub-liquidus wadsleyite between
garnet grains further constrains the shock pressure to 14-16 GPa (Figure 4.6). If the
sample was shocked to significantly higher pressure, ringwoodite or bridgmanite would
crystallize in the melt matrix, as in highly shock L chondrite such as Tenham (Xie et al.
2006), Acfer 040 (Sharp et al. 1997), RC 106 (Sharp et al. 2015) and Y-791384 (Ohtani
et al. 2004; Miyahara et al. 2011).
4.4.2 Back transformation of wadsleyite
The high-pressure minerals found in meteorites occur metastably at ambient
pressure. Because the high-pressure shock pulse is transient, rapid quench of the high-
pressure mineral is necessary to avoid post-shock back-transformation to the low-
pressure polymorph at high temperature. In Mbale, fine-grained olivine aggregates
coexist with wadsleyite and a trace of ringwoodite, suggesting that the olivine clasts
underwent high-pressure transformation followed by back-transform to olivine after
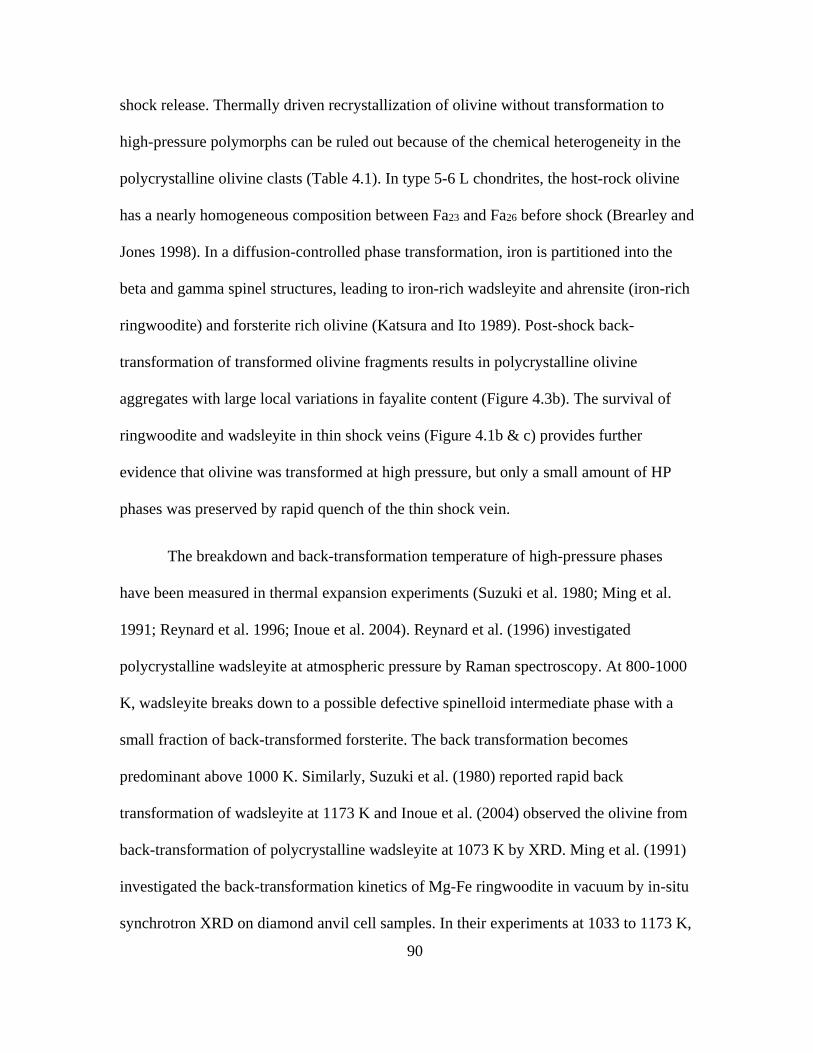
90
shock release. Thermally driven recrystallization of olivine without transformation to
high-pressure polymorphs can be ruled out because of the chemical heterogeneity in the
polycrystalline olivine clasts (Table 4.1). In type 5-6 L chondrites, the host-rock olivine
has a nearly homogeneous composition between Fa23 and Fa26 before shock (Brearley and
Jones 1998). In a diffusion-controlled phase transformation, iron is partitioned into the
beta and gamma spinel structures, leading to iron-rich wadsleyite and ahrensite (iron-rich
ringwoodite) and forsterite rich olivine (Katsura and Ito 1989). Post-shock back-
transformation of transformed olivine fragments results in polycrystalline olivine
aggregates with large local variations in fayalite content (Figure 4.3b). The survival of
ringwoodite and wadsleyite in thin shock veins (Figure 4.1b & c) provides further
evidence that olivine was transformed at high pressure, but only a small amount of HP
phases was preserved by rapid quench of the thin shock vein.
The breakdown and back-transformation temperature of high-pressure phases
have been measured in thermal expansion experiments (Suzuki et al. 1980; Ming et al.
1991; Reynard et al. 1996; Inoue et al. 2004). Reynard et al. (1996) investigated
polycrystalline wadsleyite at atmospheric pressure by Raman spectroscopy. At 800-1000
K, wadsleyite breaks down to a possible defective spinelloid intermediate phase with a
small fraction of back-transformed forsterite. The back transformation becomes
predominant above 1000 K. Similarly, Suzuki et al. (1980) reported rapid back
transformation of wadsleyite at 1173 K and Inoue et al. (2004) observed the olivine from
back-transformation of polycrystalline wadsleyite at 1073 K by XRD. Ming et al. (1991)
investigated the back-transformation kinetics of Mg-Fe ringwoodite in vacuum by in-situ
synchrotron XRD on diamond anvil cell samples. In their experiments at 1033 to 1173 K,
91
the Mg-Fe ringwoodite samples all had more than 80% back-transformation in the time
scale of ~1 hour. The authors analyzed the transformation rate using the Avrami equation:
X = 1 – exp (-Ktn) (4.1)
where X is the fraction of the product phase, t is the time of reaction in [s], K is a rate
constant in [s-n] dependent on conditions such as temperature and grain size and n is an
exponent that depends on transformation mechanism. The K and n values for the
experiments are summarized in Table 3. The average value of n = ~1.5 is not indicative
of a definite transformation mechanism and probably results from mixed mechanisms
(Rubie and Thompson 1985). Nevertheless, these results suggest that iron content
enhances the transformation kinetics significantly. The reaction rate constant K for
Mg0.8Fe1.2SiO4 is one order of magnitude greater than that for Mg1.6Fe0.4SiO4 (Ming et al.
1991). Reynard et al. (1996) performed back transformation experiments at 1023-1083 K
on Mg-wadsleyite and obtained a similar average value of n = ~1.5 (Table 4.3). Back-
transformation of 50% wadsleyite into forsterite takes 10 hours at 1023 K but only 30
min at 1083 K, corresponding to K values of 4.2 × 10⁻⁷ and 6.9 × 10⁻⁶ s-n (Table 4.3). The
authors also proposed the back transformation involves two regimes in sequence with n =
~2 and n = ~1 respectively. The second regime of n = 1 is predominant when the fraction
of resultant olivine is greater than ~50%. The n value depends on the transformation
mechanism. The nucleation regime (homogeneous or heterogeneous) commonly has a
value of n ≥ 2 (Reynard et al. 1996). Although multiple mechanisms can result in an n
value of 1 (Reynard et al. 1996), growth after nuclei saturation is a likely scenario (Cahn
1956). The two regime hypothesis is advantageous for analyzing the temperature
92
dependence on the transformation kinetics (Reynard et al. 1996) because n = 1 for the
second regime reaction allows utilizing the modified Arrhenius equation, expressed as:
K = K0 exp (-Ea/RT) (4.2)
where K is the rate constant at given temperature, K0 is the pre-exponential factor [s-1], Ea
is the activation energy [kJ/mol], T is temperature [K] and R is gas constant [J/mol·K].
The authors used the K and n values from the Avrami plot and extracted K0 = 2.35 × 10¹⁷
s-1 and Q = 432 kJ/mol for the second regime. The calculated rate constant K at 1200 and
1300 K are 3.68 × 10⁻² and 1.03 s-1 (Table 4.3). Using the K values and n = 1 for the
Avrami equation (4.1), I calculated the time needed for back transformation in the second
regime at 1200 and 1300 K (Table 4.3). The back transformation from 50% fraction,
where the second regime start to dominate, to 80% fraction takes 25 s at 1200 K and 0.89
s at 1300 K. Although the temperature dependence of the first regime reaction (n =2) was
not quantified, the experimental results for 1023-1083 K suggest the first regime reaction
occurs in the same magnitude of time scale as the second regime (Table 4.3).
In Mbale, the composition of olivine is not exactly the same as the experimental
samples (Table 4.3). Also the oxygen fugacity of the experiments (in vacuum or Earth
atmosphere) may not reproduce the condition of back-transformation in Mbale (Ming et
al. 1991; Reynard et al. 1996). Low oxygen fugacity can slow down the reaction while
high iron-content enhances it. Nevertheless, I conclude that ~1200 K is the critical post-
shock temperature for rapid back-transformation of wadsleyite within the time scale of
seconds (Table 4.3) after shock pressure release. At temperature between 1200 and 900 K,
it requires minutes to hours for extensive back-transformation. My thermal modeling in

93
the next section suggests that the slow reaction at lower temperature is unlikely to occur
in a sample like Mbale with a small amount of shock melt. Below 900 K, the high-
pressure phase can survive annealing.
In contrast to wadsleyite, majorite garnet in Mbale survived the post-shock
cooling. This is consistent with experiments that suggest that, at low pressure, garnet can
persist to higher temperature. Thiéblot et al. (1998) observed the persistence of pyrope to
1400 K and its decomposition to corundum plus enstatite at 1500 K. Although few
studies have been performed for the breakdown kinetics of garnet, Kimura et al. (2003)
investigated the back-transformation of ringwoodite and majorite caused by transient
fusion crust heating in a highly shocked L chondrite. According to their observation and
thermal calculations, majorite, 400 µm from the fusion crust, can be heated to 1673 K for
~1 s and still survive.
4.4.3 Thermal modeling of the shock melt and entrained clasts
The coexistence of wadsleyite and polycrystalline olivine from partial back-
transformation in Mbale is evidence for high shock pressure and post-shock annealing.
However, the partial back-transformation phenomenon is rarely observed in shocked
meteorites except the example from shergottite EETA 79001 (Walton 2013). As
discussed in the previous section, the post-shock temperature is the most critical factor
controlling the activation and kinetics of back-transformation. Thermal modeling is
employed in this study to investigate the cooling history of the clasts in the shock melt
during and after shock. The models start at the formation of shock melt at high pressure.
The clast inside the vein is heated by the surrounding melt, which provides the heat
94
required for the high-pressure transformation. Meanwhile heat conduction from melt to
the colder host-rock cools down the melt and the entrained clasts. The minimum duration
of high pressure is constrained by the solidification of the shock melt. To crystallize a
constant high-pressure assemblage from the melt, the high-pressure pulse must be
maintained until the melt drops below the solidus temperature. Afterwards, if the shock
pressure is released before cooling to below a critical temperature for back transformation,
the newly formed high-pressure phase would break down. In the previous section, I
showed that back-transformation can occur in seconds above 1200 K and in hours to days
between 900 – 1200 K. The HP phases are essentially stable below 900 K. These are the
critical temperatures that constrain the P-t history for back-transformation. The modeling
results can provide shock and post-shock conditions needed for preserving high-pressure
phases, for partial back transformation and for complete annealing.
I use F-Chart Finite Element Heat Transfer (FEHT) software for two-dimensional
thermal modeling. The governing equation used in this program to approximate transient
heat transfer is:
k(∂/∂x)(∂T/∂x) + k(∂/∂y)(∂T/∂y) –ρc(∂T/∂t) = 0 (4.3)
Where x and y are distances in two dimensions [m], k is the thermal conductivity
[W/m·K]; T is temperature [K]; ρ is the local density [kg/m3]; c is the local specific heat
[J/kg·K]; and t is time [s]. The finite-element cell is based on user-defined triangle mesh
in the modeled area. In my models, the cell is 20 µm size in average.
The melt and host rock in the model have the same thermodynamic properties of
ordinary chondrite but with different starting temperature. The melting temperature of
95
chondrite at the shock pressure (15 GPa) is approximately 2200 to 2300 K (Agee et al.,
1995). I preset the melt vein to 2500 K as the starting temperature. By summing the high-
pressure thermal conductivity (Hofmeister, 1999; Osako et al., 2004) of rock-forming
minerals proportionally in volume fraction, I get approximately 6.5 to 3 W/m·K for the
chondrite at 300 to 2200 K. The volume fraction of mineral constituents is taken from
data on Tenham L chondrite (Xie et al., 2006a), which is similar to Mbale. The thermal
conductivity of chondritic melt at high pressure is not well known from previous
experiments. I use 3 W/m·K, which is close to the thermal conductivity at solidus
temperature. The heat capacity of chondrite, 790 to 1290 J/kg·K at 300 to 2200 K, is also
calculated from the data for the mineral constituents (Navrotsky, 1994; Osako et al., 2004)
by their mass fraction. In the models, the latent heat of 500 kJ/kg (Lange et al., 1994;
Ghosh and McSween, 1999) is assumed to be uniformly distributed between 2200 and
2300 K. The post-shock temperature of the host chondrite is estimated by calculating the
shock waste heat, which is defined by the energy difference between the work of shock
loading along the Rayleigh-line and the work of adiabatic release. The starting
temperature of the host in the model. i.e. the shock temperature, is the post-shock
temperature plus the temperature increase from compression along the release adiabat to
the shock pressure. The temperature drop from adiabatic release is approximately 100 K
for the melt and 20 K for the host. Detailed methodology of the waste heat calculation
and shock adiabat estimation can be found in Walsh and Christian (1956), Sharp and
DeCarli (2006), Xie et al. (2006a) and Sharp et al. (2015). Qualitatively, higher porosity
(irreversible compression) and higher shock pressure (reversible and irreversible
compression) lead to higher shock temperature. In the models, I use 340 K and 500 K as
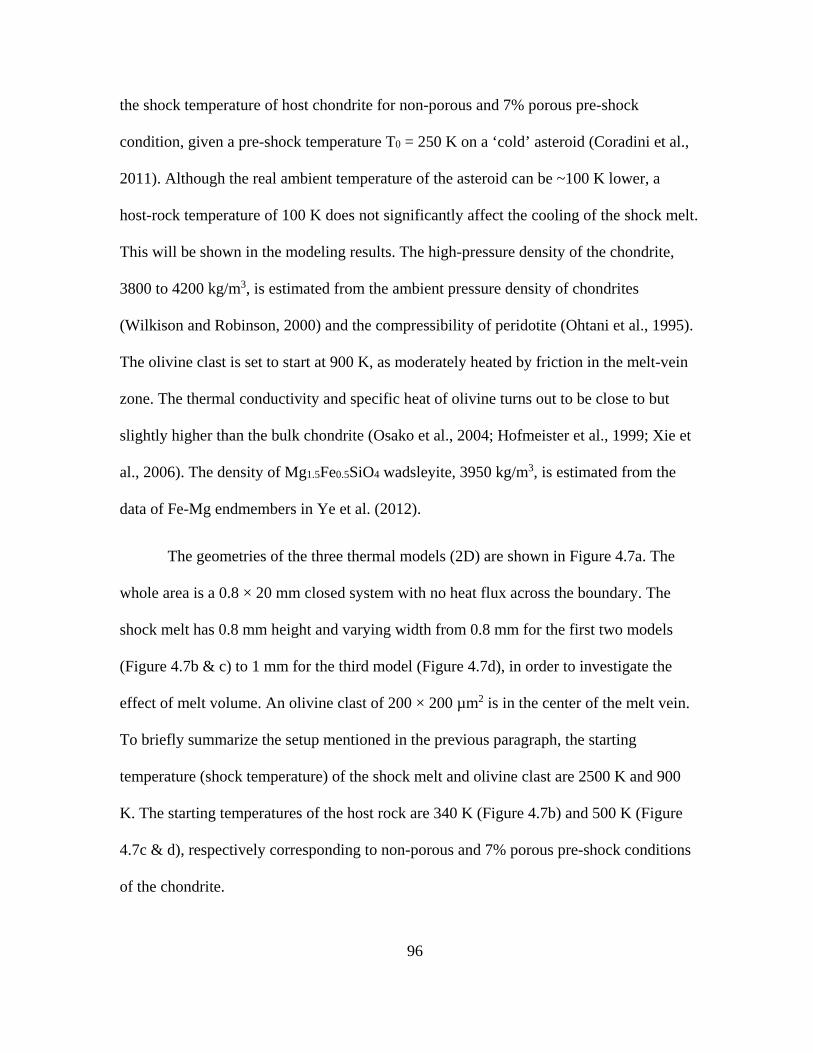
96
the shock temperature of host chondrite for non-porous and 7% porous pre-shock
condition, given a pre-shock temperature T0 = 250 K on a ‘cold’ asteroid (Coradini et al.,
2011). Although the real ambient temperature of the asteroid can be ~100 K lower, a
host-rock temperature of 100 K does not significantly affect the cooling of the shock melt.
This will be shown in the modeling results. The high-pressure density of the chondrite,
3800 to 4200 kg/m3, is estimated from the ambient pressure density of chondrites
(Wilkison and Robinson, 2000) and the compressibility of peridotite (Ohtani et al., 1995).
The olivine clast is set to start at 900 K, as moderately heated by friction in the melt-vein
zone. The thermal conductivity and specific heat of olivine turns out to be close to but
slightly higher than the bulk chondrite (Osako et al., 2004; Hofmeister et al., 1999; Xie et
al., 2006). The density of Mg1.5Fe0.5SiO4 wadsleyite, 3950 kg/m3, is estimated from the
data of Fe-Mg endmembers in Ye et al. (2012).
The geometries of the three thermal models (2D) are shown in Figure 4.7a. The
whole area is a 0.8 × 20 mm closed system with no heat flux across the boundary. The
shock melt has 0.8 mm height and varying width from 0.8 mm for the first two models
(Figure 4.7b & c) to 1 mm for the third model (Figure 4.7d), in order to investigate the
effect of melt volume. An olivine clast of 200 × 200 µm2 is in the center of the melt vein.
To briefly summarize the setup mentioned in the previous paragraph, the starting
temperature (shock temperature) of the shock melt and olivine clast are 2500 K and 900
K. The starting temperatures of the host rock are 340 K (Figure 4.7b) and 500 K (Figure
4.7c & d), respectively corresponding to non-porous and 7% porous pre-shock conditions
of the chondrite.
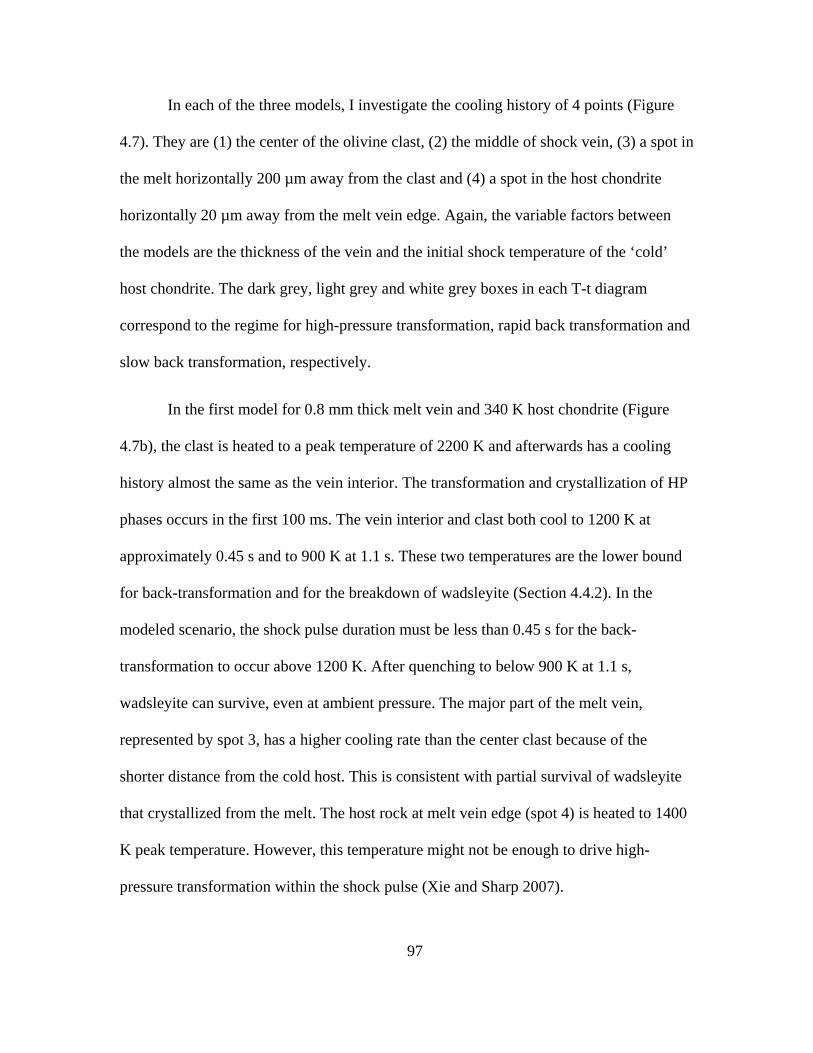
97
In each of the three models, I investigate the cooling history of 4 points (Figure
4.7). They are (1) the center of the olivine clast, (2) the middle of shock vein, (3) a spot in
the melt horizontally 200 µm away from the clast and (4) a spot in the host chondrite
horizontally 20 µm away from the melt vein edge. Again, the variable factors between
the models are the thickness of the vein and the initial shock temperature of the ‘cold’
host chondrite. The dark grey, light grey and white grey boxes in each T-t diagram
correspond to the regime for high-pressure transformation, rapid back transformation and
slow back transformation, respectively.
In the first model for 0.8 mm thick melt vein and 340 K host chondrite (Figure
4.7b), the clast is heated to a peak temperature of 2200 K and afterwards has a cooling
history almost the same as the vein interior. The transformation and crystallization of HP
phases occurs in the first 100 ms. The vein interior and clast both cool to 1200 K at
approximately 0.45 s and to 900 K at 1.1 s. These two temperatures are the lower bound
for back-transformation and for the breakdown of wadsleyite (Section 4.4.2). In the
modeled scenario, the shock pulse duration must be less than 0.45 s for the back-
transformation to occur above 1200 K. After quenching to below 900 K at 1.1 s,
wadsleyite can survive, even at ambient pressure. The major part of the melt vein,
represented by spot 3, has a higher cooling rate than the center clast because of the
shorter distance from the cold host. This is consistent with partial survival of wadsleyite
that crystallized from the melt. The host rock at melt vein edge (spot 4) is heated to 1400
K peak temperature. However, this temperature might not be enough to drive high-
pressure transformation within the shock pulse (Xie and Sharp 2007).
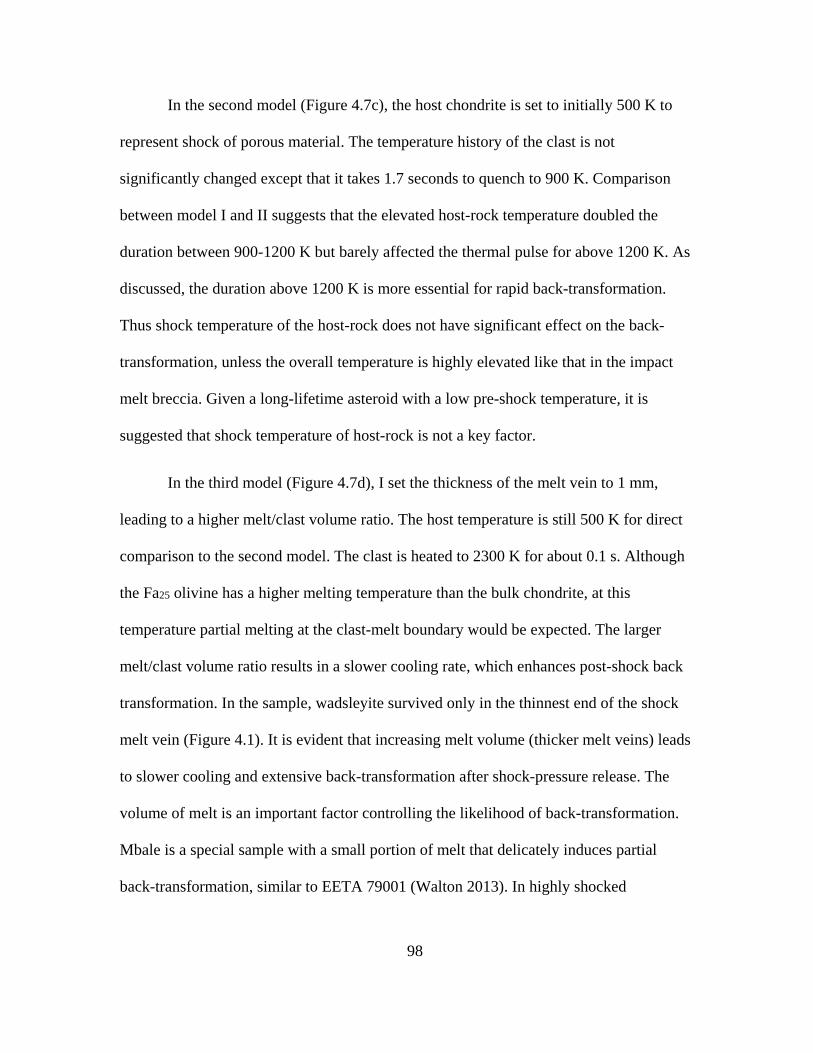
98
In the second model (Figure 4.7c), the host chondrite is set to initially 500 K to
represent shock of porous material. The temperature history of the clast is not
significantly changed except that it takes 1.7 seconds to quench to 900 K. Comparison
between model I and II suggests that the elevated host-rock temperature doubled the
duration between 900-1200 K but barely affected the thermal pulse for above 1200 K. As
discussed, the duration above 1200 K is more essential for rapid back-transformation.
Thus shock temperature of the host-rock does not have significant effect on the back-
transformation, unless the overall temperature is highly elevated like that in the impact
melt breccia. Given a long-lifetime asteroid with a low pre-shock temperature, it is
suggested that shock temperature of host-rock is not a key factor.
In the third model (Figure 4.7d), I set the thickness of the melt vein to 1 mm,
leading to a higher melt/clast volume ratio. The host temperature is still 500 K for direct
comparison to the second model. The clast is heated to 2300 K for about 0.1 s. Although
the Fa25 olivine has a higher melting temperature than the bulk chondrite, at this
temperature partial melting at the clast-melt boundary would be expected. The larger
melt/clast volume ratio results in a slower cooling rate, which enhances post-shock back
transformation. In the sample, wadsleyite survived only in the thinnest end of the shock
melt vein (Figure 4.1). It is evident that increasing melt volume (thicker melt veins) leads
to slower cooling and extensive back-transformation after shock-pressure release. The
volume of melt is an important factor controlling the likelihood of back-transformation.
Mbale is a special sample with a small portion of melt that delicately induces partial
back-transformation, similar to EETA 79001 (Walton 2013). In highly shocked

99
chondrites with more shock melt, such as melt breccias, complete or extensive back-
transformation induced recrystallization is likely to occur.
4.4.4 Post-shock annealing and implications for shock stage classification
Recrystallization of olivine in a chondrite impact melt breccia, such as Chico, is
recognized as an indicator of high shock stage (Stöffler et al. 1991). However, the shock
condition and mechanism of olivine recrystallization is not well understood. Bauer (1979)
produced recrystallized olivine from shock recovery experiments on olivine single crystal
and dunite where inter-granular nucleation of strain-free olivine grains occurred in highly
deformed areas of the samples. The author also produced the same recrystallization
feature by performing heating experiments on shock deformed olivine and concluded that
recrystallization is an indicator of post-shock thermal metamorphism instead of an
indicator of high shock pressure. In contrast, the hypothesis of back-transformation-
induced olivine recrystallization (Stöffler 1974; Ahrens et al. 1976; Reimold and Stöffler
1978) cannot be fully tested because high-pressure polymorphs of olivine have not been
produced in solid olivine by shock-recovery experiments. The partial back-transformation
of wadsleyite to olivine in Mbale demonstrates the importance of both high-pressure
phase transformations and post-shock annealing. High-pressure transformation of olivine
to wadsleyite or ringwoodite structures is required to significantly segregate iron in the
olivine clasts (Table 4.1). As suggested by my modeling (Figure 4.7), a relatively short
shock pulse, combined with slow post-shocking cooling, can result in significant back-
transformation of high-pressure polymorphs to polycrystalline olivine. However, a
special combination of pre-shock temperature, shock pulse duration and volume of shock

100
melt is required to produce the partial back-transformation that I observed in Mbale. In
highly shocked L chondrites that have abundant shock melt, such as in Sixiangkou (Chen
et al. 1996), Tenham (Tomioka and Fujino 1999; Xie et al. 2006; Tschauner et al. 2014),
Y-791384 (Ohtani et al. 2004) or RC 106 (Sharp et al. 2015), the shock pulse was long
enough to prevent the high-pressure phases from back reacting. However, in samples like
the Chico L6 chondrite (Stöffler et al. 1991), the abundant melt resulted in a post-shock
thermal environment sufficient to back transform and recrystallize all high-pressure
polymorphs. This explains why ringwoodite or wadsleyite do not commonly co-exist
with the recrystallized olivine in shocked meteorites.
Although both recrystallized olivine and high-pressure polymorphs indicate shock
stage S6 (Stöffler et al. 1991), the preservation of HP minerals require relatively cold host
rock and fast cooling. Therefore, the shock pressure and temperatures for HP-mineral
bearing samples cannot be too high. In contrast, the recrystallization would favor the
condition that is close to induce whole-rock melting. With increasing shock pressure, the
overall shock temperature and volume of melt increase. In this case, the clasts in shock
melt would be heated to near-solidus temperature, rapidly transform to high-pressure
polymorphs during the shock pulse and then back transform to low-pressure polymorphs
during post-shock cooling (Figure 4.7d). Based on the shock-melt crystallization phases,
the high-pressure-mineral-bearing S6 meteorites have been inferred to experience
pressures of 15-25 GPa (Chen et al. 1996; Ohtani et al. 2004; Xie et al. 2006; Chen and
Xie 2008; Miyahara et al. 2011; Section 4.4.1). My results suggest that the meteoritical
material shocked to pressure beyond ~ 30 GPa would likely have extensive
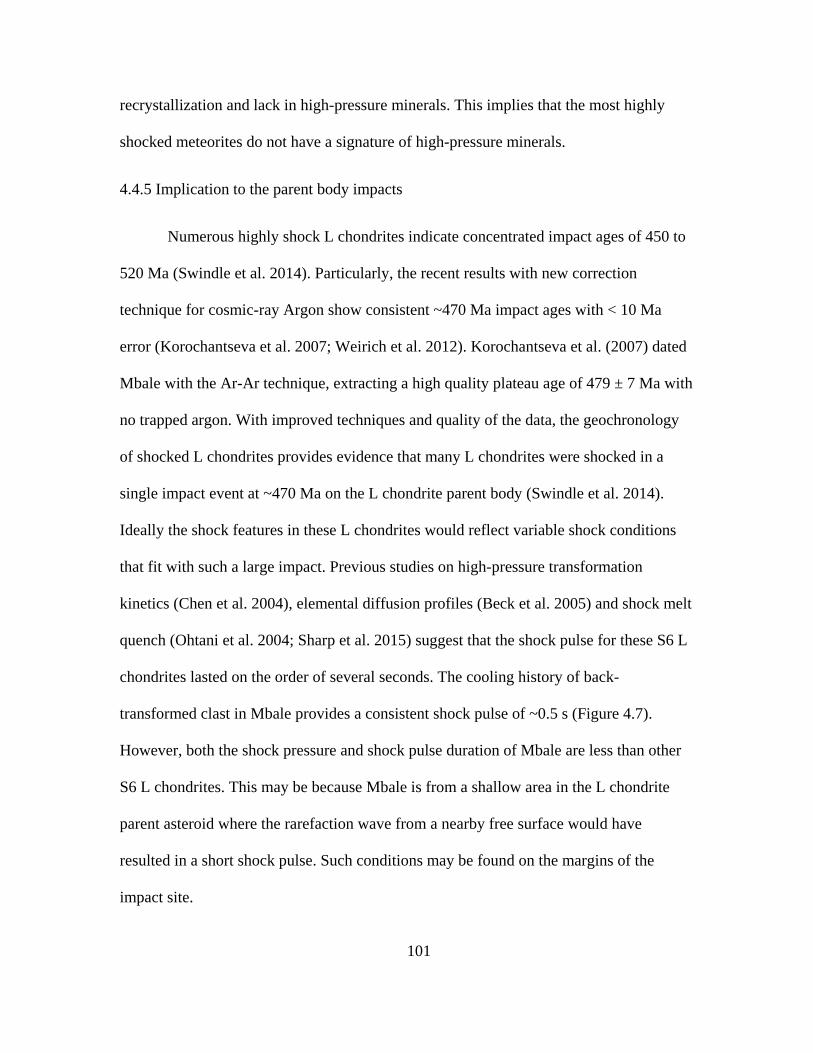
101
recrystallization and lack in high-pressure minerals. This implies that the most highly
shocked meteorites do not have a signature of high-pressure minerals.
4.4.5 Implication to the parent body impacts
Numerous highly shock L chondrites indicate concentrated impact ages of 450 to
520 Ma (Swindle et al. 2014). Particularly, the recent results with new correction
technique for cosmic-ray Argon show consistent ~470 Ma impact ages with < 10 Ma
error (Korochantseva et al. 2007; Weirich et al. 2012). Korochantseva et al. (2007) dated
Mbale with the Ar-Ar technique, extracting a high quality plateau age of 479 ± 7 Ma with
no trapped argon. With improved techniques and quality of the data, the geochronology
of shocked L chondrites provides evidence that many L chondrites were shocked in a
single impact event at ~470 Ma on the L chondrite parent body (Swindle et al. 2014).
Ideally the shock features in these L chondrites would reflect variable shock conditions
that fit with such a large impact. Previous studies on high-pressure transformation
kinetics (Chen et al. 2004), elemental diffusion profiles (Beck et al. 2005) and shock melt
quench (Ohtani et al. 2004; Sharp et al. 2015) suggest that the shock pulse for these S6 L
chondrites lasted on the order of several seconds. The cooling history of back-
transformed clast in Mbale provides a consistent shock pulse of ~0.5 s (Figure 4.7).
However, both the shock pressure and shock pulse duration of Mbale are less than other
S6 L chondrites. This may be because Mbale is from a shallow area in the L chondrite
parent asteroid where the rarefaction wave from a nearby free surface would have
resulted in a short shock pulse. Such conditions may be found on the margins of the
impact site.
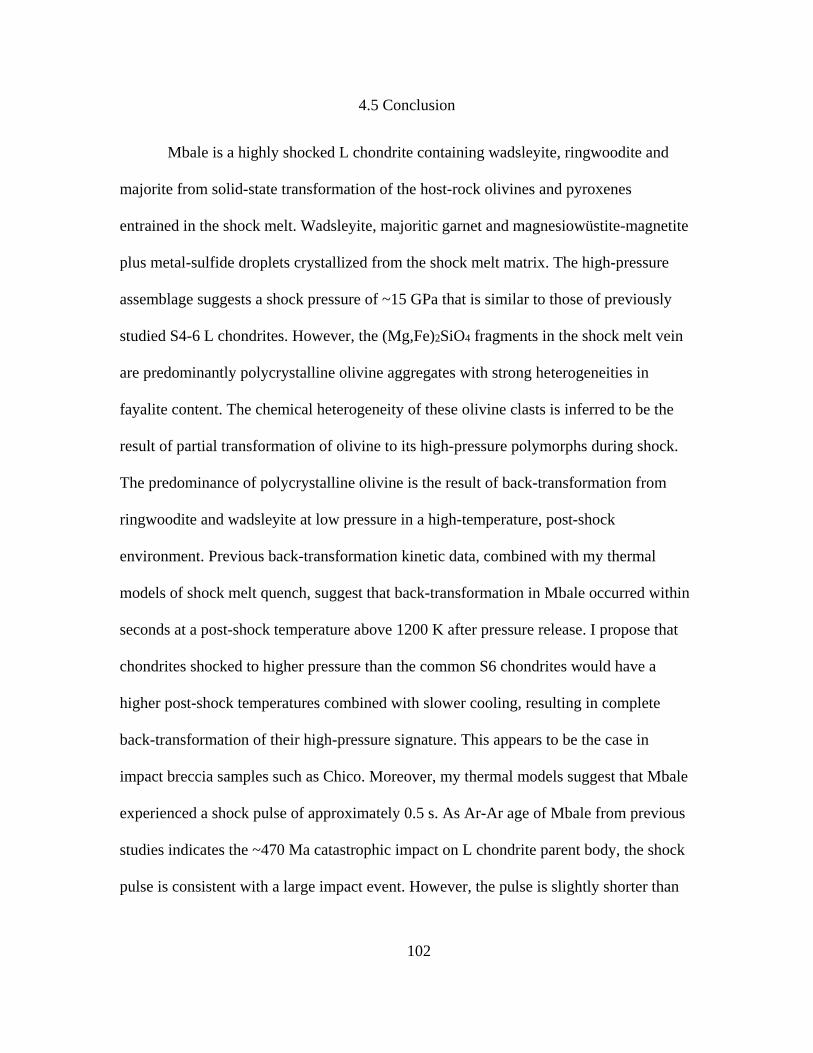
102
4.5 Conclusion
Mbale is a highly shocked L chondrite containing wadsleyite, ringwoodite and
majorite from solid-state transformation of the host-rock olivines and pyroxenes
entrained in the shock melt. Wadsleyite, majoritic garnet and magnesiowüstite-magnetite
plus metal-sulfide droplets crystallized from the shock melt matrix. The high-pressure
assemblage suggests a shock pressure of ~15 GPa that is similar to those of previously
studied S4-6 L chondrites. However, the (Mg,Fe)2SiO4 fragments in the shock melt vein
are predominantly polycrystalline olivine aggregates with strong heterogeneities in
fayalite content. The chemical heterogeneity of these olivine clasts is inferred to be the
result of partial transformation of olivine to its high-pressure polymorphs during shock.
The predominance of polycrystalline olivine is the result of back-transformation from
ringwoodite and wadsleyite at low pressure in a high-temperature, post-shock
environment. Previous back-transformation kinetic data, combined with my thermal
models of shock melt quench, suggest that back-transformation in Mbale occurred within
seconds at a post-shock temperature above 1200 K after pressure release. I propose that
chondrites shocked to higher pressure than the common S6 chondrites would have a
higher post-shock temperatures combined with slower cooling, resulting in complete
back-transformation of their high-pressure signature. This appears to be the case in
impact breccia samples such as Chico. Moreover, my thermal models suggest that Mbale
experienced a shock pulse of approximately 0.5 s. As Ar-Ar age of Mbale from previous
studies indicates the ~470 Ma catastrophic impact on L chondrite parent body, the shock
pulse is consistent with a large impact event. However, the pulse is slightly shorter than

103
that of other S6 L chondrites, suggesting that Mbale was in a shallow region on the parent
body.
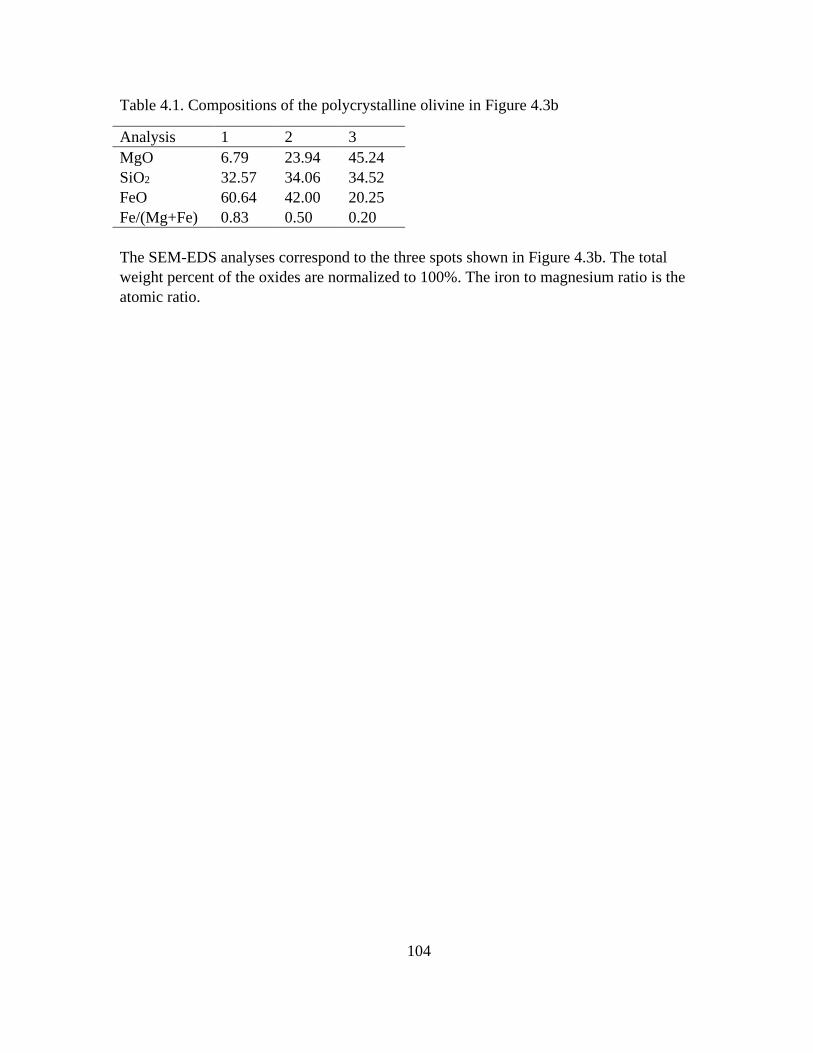
104
Table 4.1. Compositions of the polycrystalline olivine in Figure 4.3b
Analysis 1 2 3 MgO 6.79 23.94 45.24 SiO2 32.57 34.06 34.52 FeO 60.64 42.00 20.25 Fe/(Mg+Fe) 0.83 0.50 0.20 The SEM-EDS analyses correspond to the three spots shown in Figure 4.3b. The total weight percent of the oxides are normalized to 100%. The iron to magnesium ratio is the atomic ratio.
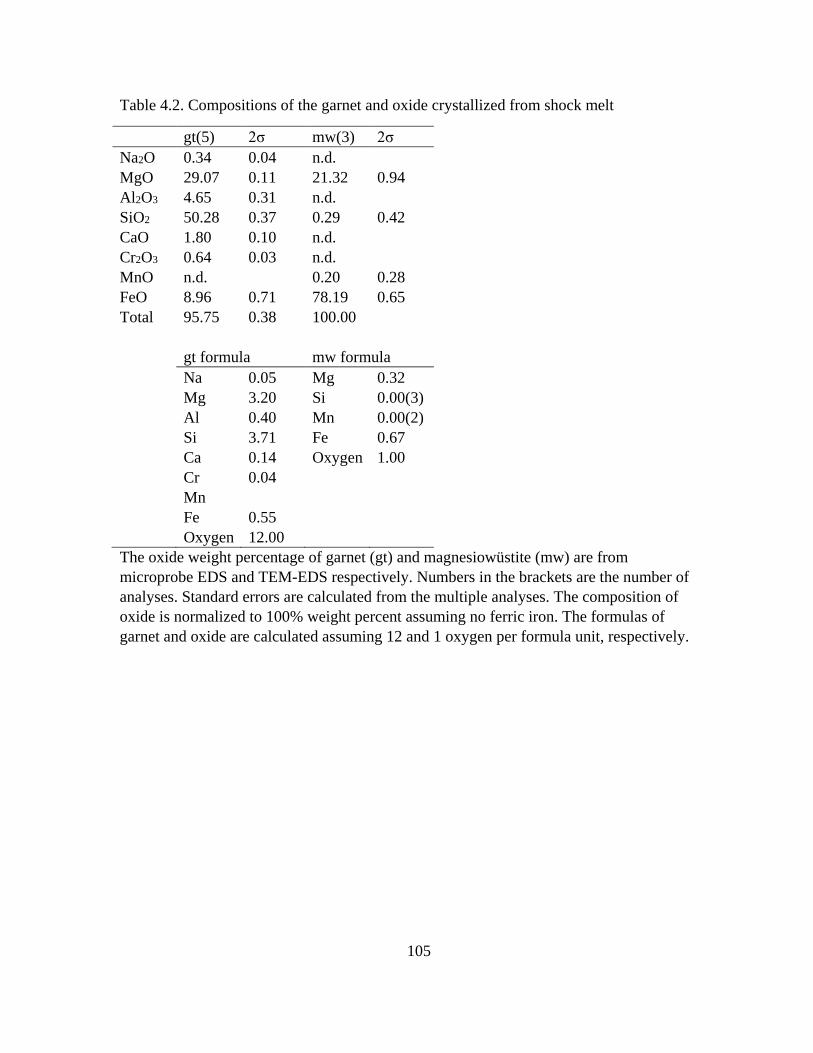
105
Table 4.2. Compositions of the garnet and oxide crystallized from shock melt
gt(5) 2σ mw(3) 2σ Na2O 0.34 0.04 n.d. MgO 29.07 0.11 21.32 0.94 Al2O3 4.65 0.31 n.d. SiO2 50.28 0.37 0.29 0.42 CaO 1.80 0.10 n.d. Cr2O3 0.64 0.03 n.d. MnO n.d. 0.20 0.28 FeO 8.96 0.71 78.19 0.65 Total 95.75 0.38 100.00
gt formula mw formula
Na 0.05 Mg 0.32
Mg 3.20 Si 0.00(3)
Al 0.40 Mn 0.00(2)
Si 3.71 Fe 0.67
Ca 0.14 Oxygen 1.00
Cr 0.04
Mn
Fe 0.55 Oxygen 12.00 The oxide weight percentage of garnet (gt) and magnesiowüstite (mw) are from microprobe EDS and TEM-EDS respectively. Numbers in the brackets are the number of analyses. Standard errors are calculated from the multiple analyses. The composition of oxide is normalized to 100% weight percent assuming no ferric iron. The formulas of garnet and oxide are calculated assuming 12 and 1 oxygen per formula unit, respectively.
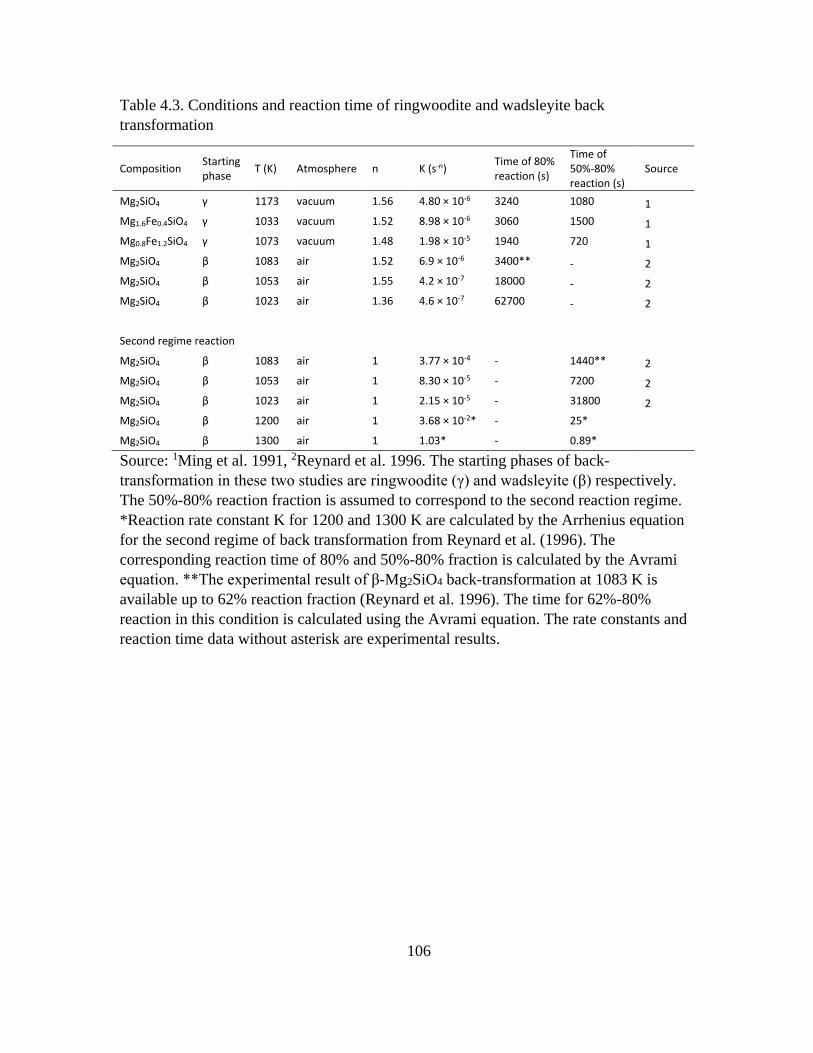
106
Table 4.3. Conditions and reaction time of ringwoodite and wadsleyite back transformation
Composition Starting phase T (K) Atmosphere n K (s-n) Time of 80%
reaction (s)
Time of 50%-80% reaction (s)
Source
Mg2SiO4 γ 1173 vacuum 1.56 4.80 × 10⁻⁶ 3240 1080 1 Mg1.6Fe0.4SiO4 γ 1033 vacuum 1.52 8.98 × 10⁻⁶ 3060 1500 1 Mg0.8Fe1.2SiO4 γ 1073 vacuum 1.48 1.98 × 10⁻⁵ 1940 720 1 Mg2SiO4 β 1083 air 1.52 6.9 × 10⁻⁶ 3400** - 2 Mg2SiO4 β 1053 air 1.55 4.2 × 10⁻⁷ 18000 - 2 Mg2SiO4 β 1023 air 1.36 4.6 × 10⁻⁷ 62700 - 2
Second regime reaction
Mg2SiO4 β 1083 air 1 3.77 × 10⁻⁴ - 1440** 2 Mg2SiO4 β 1053 air 1 8.30 × 10⁻⁵ - 7200 2 Mg2SiO4 β 1023 air 1 2.15 × 10⁻⁵ - 31800 2 Mg2SiO4 β 1200 air 1 3.68 × 10⁻²* - 25*
Mg2SiO4 β 1300 air 1 1.03* - 0.89* Source: 1Ming et al. 1991, 2Reynard et al. 1996. The starting phases of back-
transformation in these two studies are ringwoodite (γ) and wadsleyite (β) respectively. The 50%-80% reaction fraction is assumed to correspond to the second reaction regime. *Reaction rate constant K for 1200 and 1300 K are calculated by the Arrhenius equation for the second regime of back transformation from Reynard et al. (1996). The corresponding reaction time of 80% and 50%-80% fraction is calculated by the Avrami equation. **The experimental result of β-Mg2SiO4 back-transformation at 1083 K is available up to 62% reaction fraction (Reynard et al. 1996). The time for 62%-80% reaction in this condition is calculated using the Avrami equation. The rate constants and reaction time data without asterisk are experimental results.
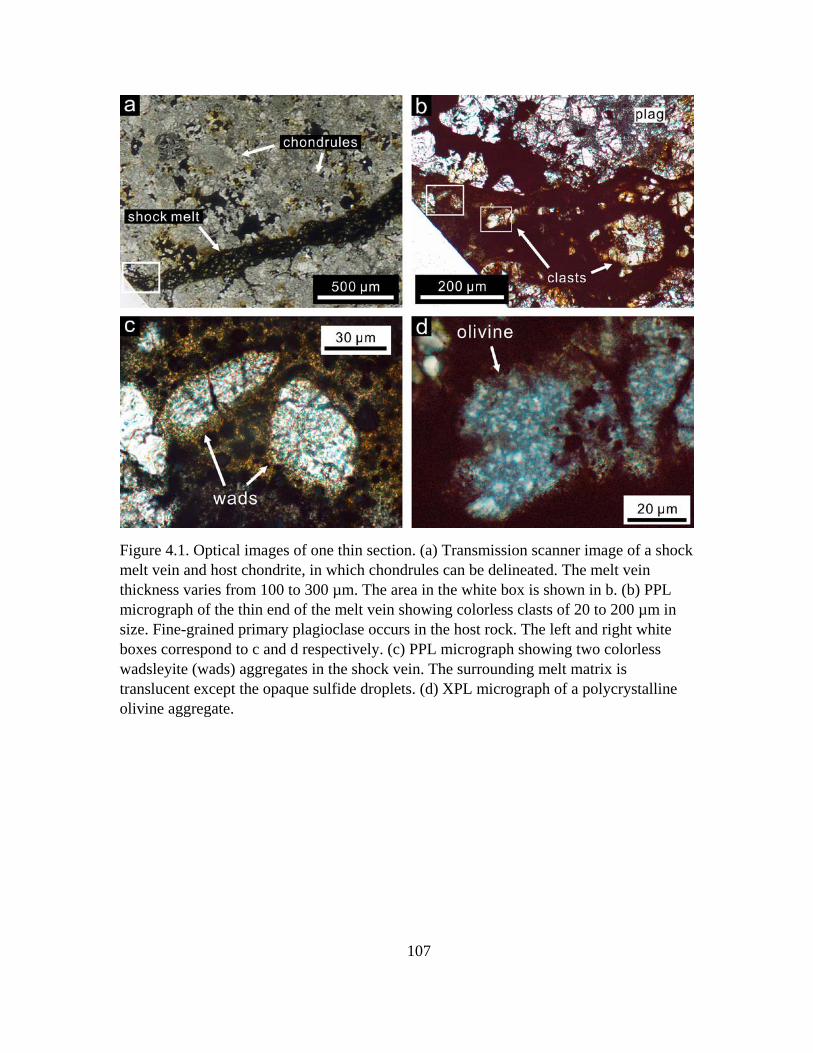
107
Figure 4.1. Optical images of one thin section. (a) Transmission scanner image of a shock melt vein and host chondrite, in which chondrules can be delineated. The melt vein thickness varies from 100 to 300 µm. The area in the white box is shown in b. (b) PPL micrograph of the thin end of the melt vein showing colorless clasts of 20 to 200 µm in size. Fine-grained primary plagioclase occurs in the host rock. The left and right white boxes correspond to c and d respectively. (c) PPL micrograph showing two colorless wadsleyite (wads) aggregates in the shock vein. The surrounding melt matrix is translucent except the opaque sulfide droplets. (d) XPL micrograph of a polycrystalline olivine aggregate.
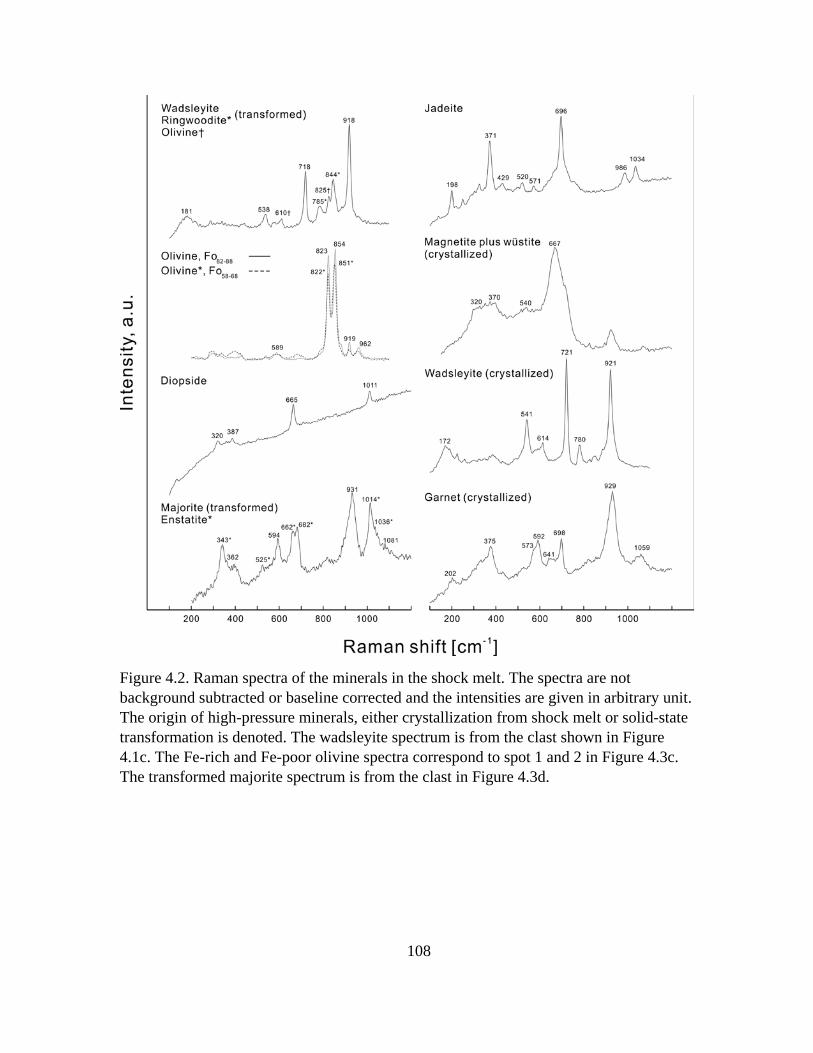
108
Figure 4.2. Raman spectra of the minerals in the shock melt. The spectra are not background subtracted or baseline corrected and the intensities are given in arbitrary unit. The origin of high-pressure minerals, either crystallization from shock melt or solid-state transformation is denoted. The wadsleyite spectrum is from the clast shown in Figure 4.1c. The Fe-rich and Fe-poor olivine spectra correspond to spot 1 and 2 in Figure 4.3c. The transformed majorite spectrum is from the clast in Figure 4.3d.
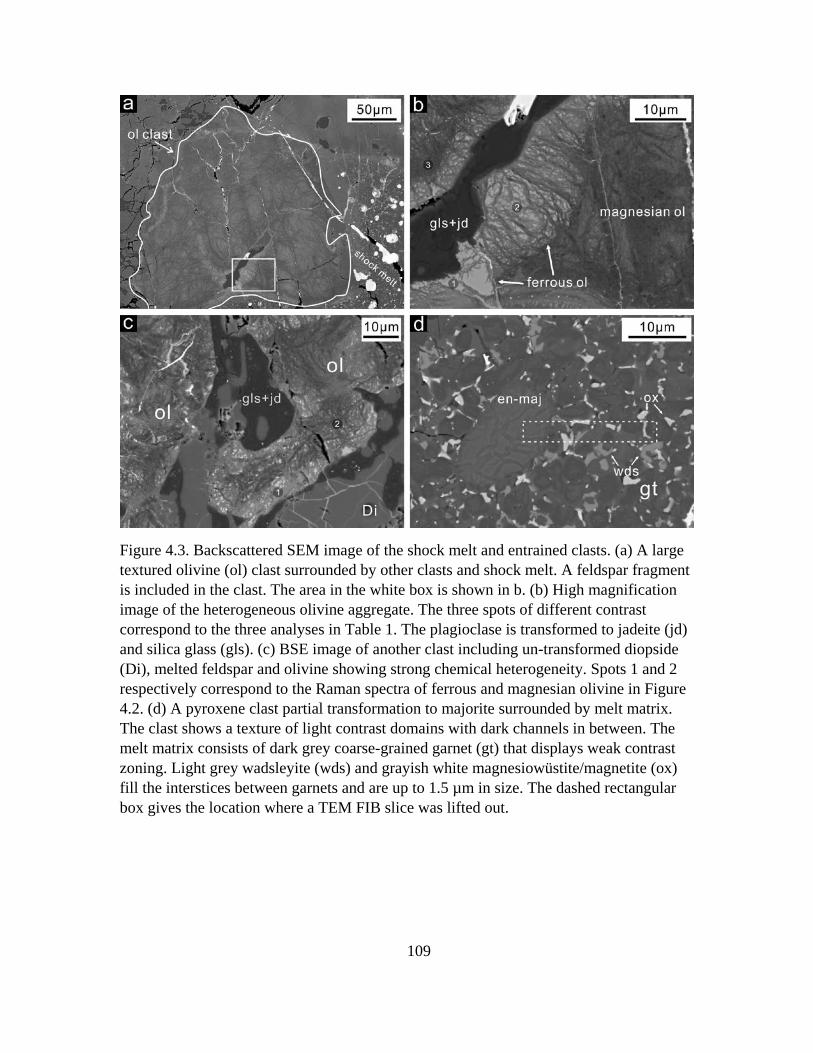
109
Figure 4.3. Backscattered SEM image of the shock melt and entrained clasts. (a) A large textured olivine (ol) clast surrounded by other clasts and shock melt. A feldspar fragment is included in the clast. The area in the white box is shown in b. (b) High magnification image of the heterogeneous olivine aggregate. The three spots of different contrast correspond to the three analyses in Table 1. The plagioclase is transformed to jadeite (jd) and silica glass (gls). (c) BSE image of another clast including un-transformed diopside (Di), melted feldspar and olivine showing strong chemical heterogeneity. Spots 1 and 2 respectively correspond to the Raman spectra of ferrous and magnesian olivine in Figure 4.2. (d) A pyroxene clast partial transformation to majorite surrounded by melt matrix. The clast shows a texture of light contrast domains with dark channels in between. The melt matrix consists of dark grey coarse-grained garnet (gt) that displays weak contrast zoning. Light grey wadsleyite (wds) and grayish white magnesiowüstite/magnetite (ox) fill the interstices between garnets and are up to 1.5 µm in size. The dashed rectangular box gives the location where a TEM FIB slice was lifted out.
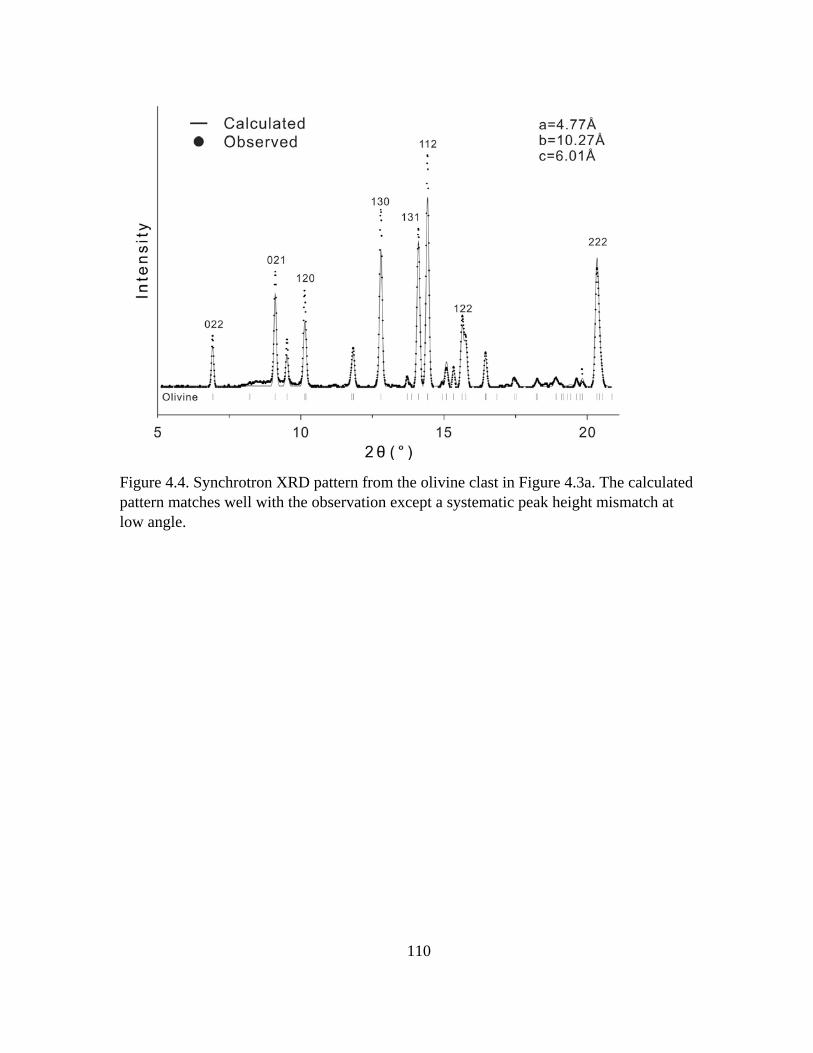
110
Figure 4.4. Synchrotron XRD pattern from the olivine clast in Figure 4.3a. The calculated pattern matches well with the observation except a systematic peak height mismatch at low angle.
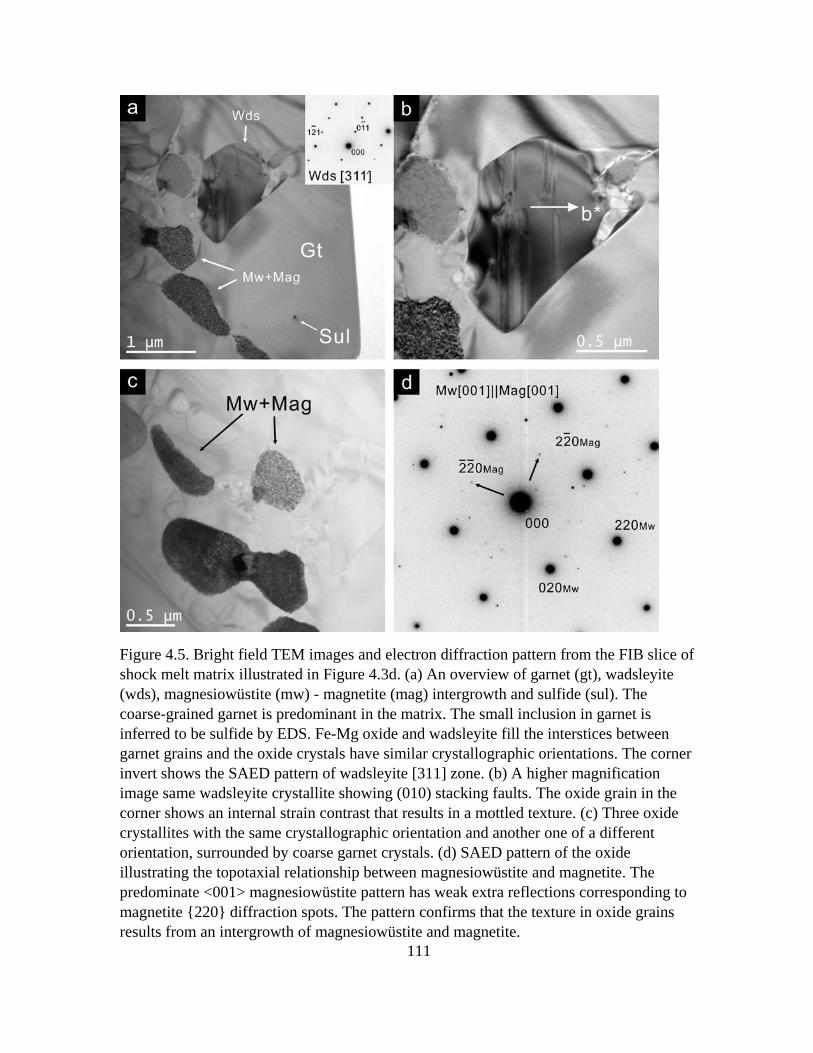
111
Figure 4.5. Bright field TEM images and electron diffraction pattern from the FIB slice of shock melt matrix illustrated in Figure 4.3d. (a) An overview of garnet (gt), wadsleyite (wds), magnesiowüstite (mw) - magnetite (mag) intergrowth and sulfide (sul). The coarse-grained garnet is predominant in the matrix. The small inclusion in garnet is inferred to be sulfide by EDS. Fe-Mg oxide and wadsleyite fill the interstices between garnet grains and the oxide crystals have similar crystallographic orientations. The corner invert shows the SAED pattern of wadsleyite [311] zone. (b) A higher magnification image same wadsleyite crystallite showing (010) stacking faults. The oxide grain in the corner shows an internal strain contrast that results in a mottled texture. (c) Three oxide crystallites with the same crystallographic orientation and another one of a different orientation, surrounded by coarse garnet crystals. (d) SAED pattern of the oxide illustrating the topotaxial relationship between magnesiowüstite and magnetite. The predominate <001> magnesiowüstite pattern has weak extra reflections corresponding to magnetite {220} diffraction spots. The pattern confirms that the texture in oxide grains results from an intergrowth of magnesiowüstite and magnetite.
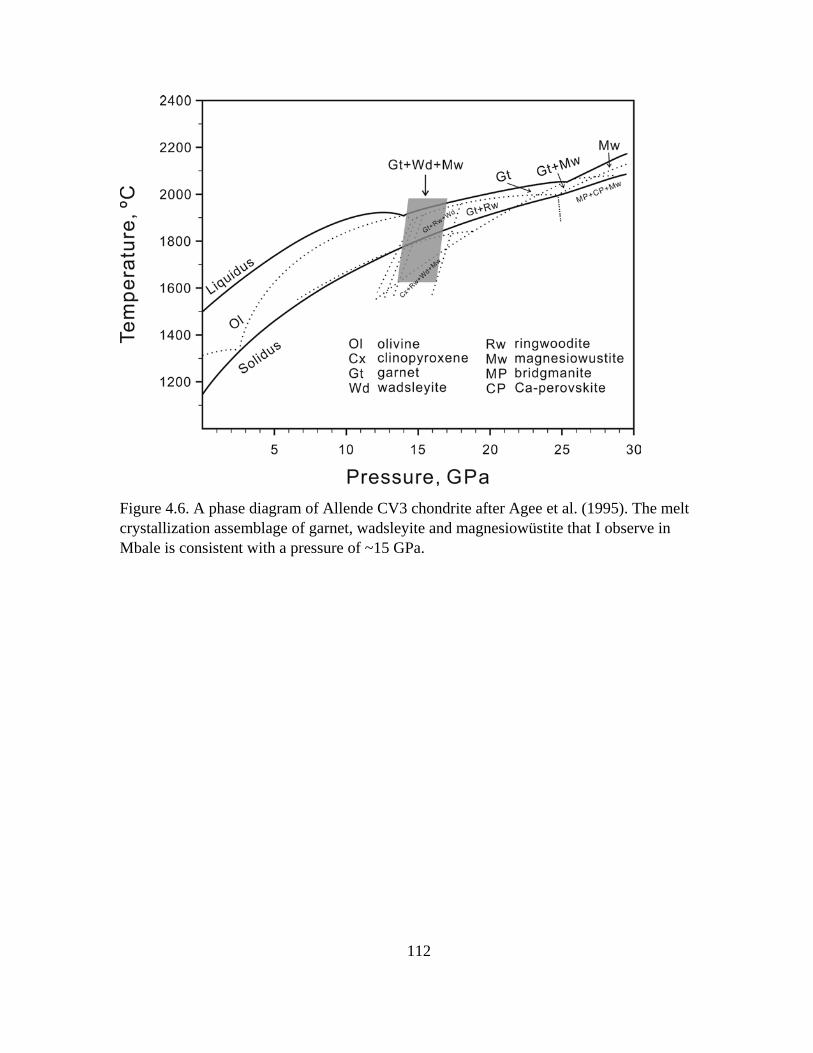
112
Figure 4.6. A phase diagram of Allende CV3 chondrite after Agee et al. (1995). The melt crystallization assemblage of garnet, wadsleyite and magnesiowüstite that I observe in Mbale is consistent with a pressure of ~15 GPa.
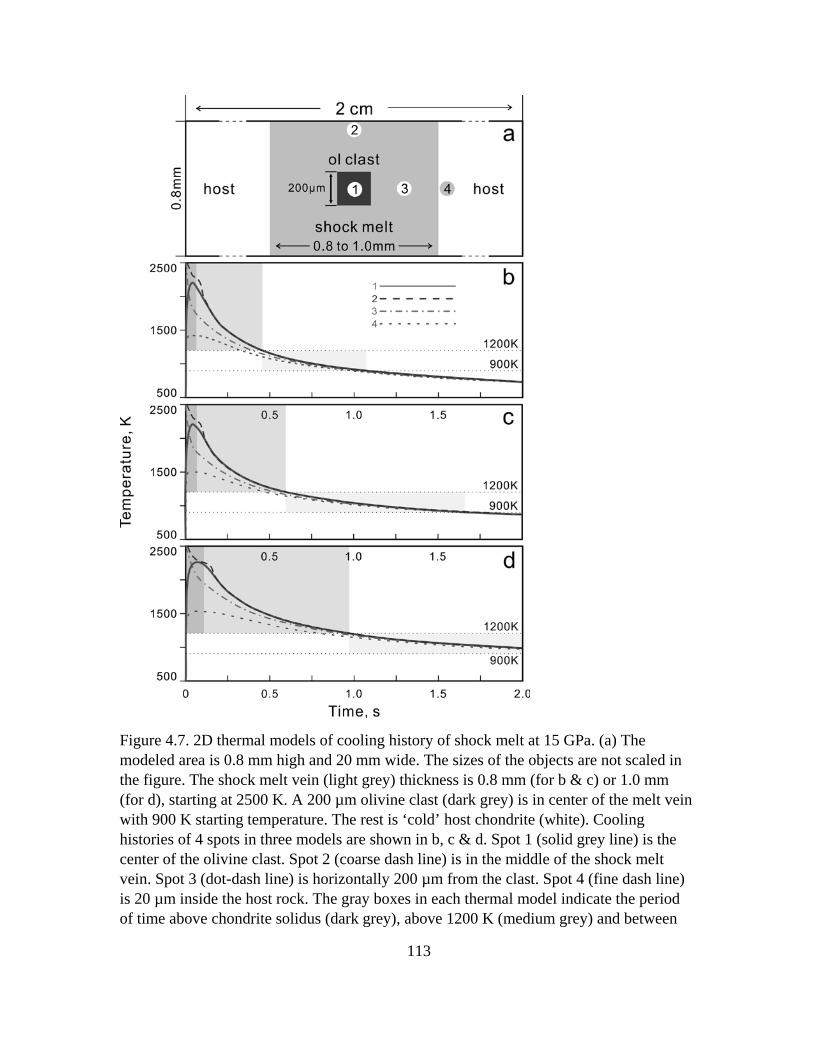
113
Figure 4.7. 2D thermal models of cooling history of shock melt at 15 GPa. (a) The modeled area is 0.8 mm high and 20 mm wide. The sizes of the objects are not scaled in the figure. The shock melt vein (light grey) thickness is 0.8 mm (for b & c) or 1.0 mm (for d), starting at 2500 K. A 200 µm olivine clast (dark grey) is in center of the melt vein with 900 K starting temperature. The rest is ‘cold’ host chondrite (white). Cooling histories of 4 spots in three models are shown in b, c & d. Spot 1 (solid grey line) is the center of the olivine clast. Spot 2 (coarse dash line) is in the middle of the shock melt vein. Spot 3 (dot-dash line) is horizontally 200 µm from the clast. Spot 4 (fine dash line) is 20 µm inside the host rock. The gray boxes in each thermal model indicate the period of time above chondrite solidus (dark grey), above 1200 K (medium grey) and between

114
1200 and 900 K (light grey). (b) 0.8mm melt vein and shock temperature of host rock at 340 K, corresponding to 15 GPa shock pressure. The clast is heated to 2200 K and then cools along with the melt interior; to 1200 K at 0.45 s and to 900 K at 1.1 s. (c) 0.8 melt vein and starting with host rock shock temperature of 500 K, corresponding to 15 GPa and 7% pre-shock porosity. The clast is similarly heated but takes 0.6 s to cool to 1200 K and another 1 s to 900 K. (d) 1.0 mm shock melt with 500 K host rock. The clast is heated to 2300 K and does not cool to 1200 K until 1 s.
115
Chapter 5
Using pressure-temperature paths to understand shock metamorphism and shock stage
classification
5.1 Introduction
5.1.1 Formation of high-pressure minerals in meteorites
High-pressure (HP) minerals occur in shocked meteorites from the crystallization
of shock melt and solid-state transformation of clasts in shock melt (Sharp and DeCarli,
2006). Particularly, the crystallization of shock melt produces assemblages that reflect the
pressure conditions of crystallization. For example, a chondritic melt crystallizes
olivine’s high-pressure polymorphs, ringwoodite and wadsleyite, at pressure between 14
to 24 GPa (Chapter 2 and 4) and olivine below 14 GPa (Agee et al. 1995). If the melt
vein remains in a liquid state after the pressure release, it would crystallize a low-pressure
assemblage, such as olivine, orthopyroxene plus plagioclase. Solid-state transformations
at high-pressure are also strongly dependent on the shock temperature heterogeneity and
associated exclusively with shock melt in chondrite samples. Because of the short
duration of the shock-induced high-pressure pulse (milliseconds to seconds) in a
hypervelocity impact (Beck et al. 2005), the reconstructive phase transformations of the
mineral constituents of meteorites to their HP polymorphs must occur very quickly. Local
melting and temperatures close to melting are required to create the reaction rates
necessary to transform minerals to their HP polymorphs during the shock pulse (Xie and
Sharp 2007). This is why the shock-induced HP minerals are exclusively associated with
shock melt veins and pockets in meteorites.
116
5.1.2 Post-shock breakdown of high-pressure minerals
High pressures and temperatures during shock are necessary, but not fully
sufficient, to produce observable HP minerals in shocked meteorites. Cooling of the
meteorite after pressure release is equally important for the survival of HP phases
(Chapter 4). The HP phases formed during the initial shock pulse are metastable at low
pressure. If the sample cools through a critical temperature before becoming metastable,
the HP phases are preserved because the reaction rates for back-transformation to the
low-pressure polymorphs are too slow. The critical post-shock temperature for
breakdown of a HP mineral is dependent on the thermodynamic stability of the mineral
and reaction rate (Chapter 3 and 4). In summary, the HP phases observed in meteorites
require a pressure-temperature-time (P-T-t) path that drives high-pressure reaction but
also prevents back-transformation at low-pressure. The details are discussed in section
5.3.1.
5.1.3 Highly shocked melt breccias
In addition to HP minerals, other features have been recognized as indicators of
severe shock in chondrites, including recrystallization of olivine (Dodd and Jarosewich.
1979; Stöffler et al. 1991), blackening of silicates by disseminated metal or sulfide
(Heymann 1967; Rubin, 1992), feldspathic normal glass (Miller and DeCarli 1963) and
pervasive shock melt (Fredriksson et al. 1963). These features commonly co-exist in the
so-called impact melt breccias. However, HP minerals are consistently absent in these
breccia samples. This suggests that either the formation of HP minerals requires even
higher pressure or other factors, such as post-shock temperature, can affect shock features
117
(Stöffler et al. 1974). Stöffler et al. (1991) suggested that high-pressure mineral requires
nearly whole-rock melting pressure (75-90 GPa) because shock recovery experiments on
olivine single crystal with pressures of 5-75 GPa can hardly produce solid-state
recrystallization or transformation (Bauer 1979; Jeanloz 1980). However, this hypothesis
is disapproved by the shock melting experiments that produced wadsleyite at 16-26 GPa
(Tschauner et al. 2009). Therefore, it is unlikely that HP-mineral bearing chondrites have
experienced significantly higher pressure than melt breccias.
Understanding the origin of shock melt is important for interpreting the shock
conditions experienced by melt breccias. The formation of pervasive melting requires in
high shock temperature and post-shock temperature resulting from high shock pressures.
For a natural impact, the bulk temperature is dependent on the total work of shock
loading, which is controlled by the shock pressure and porosity of the target (Section 1.3).
The post-shock temperature is lower than the shock temperature because of the adiabatic
release of pressure. However, for a porous target, the non-recoverable work of
compression (waste heat) is significantly greater than the recoverable work of adiabatic
release, resulting in an elevated post-shock temperature. If the melting curve (Figure 1.7)
has a higher T/P slope than the adiabat, pressure release along the adiabat can result in
decompression melting, leading to pervasive post-shock melting (Melosh 1989).
Based on shock-melt crystallization, the HP assemblages in highly shocked S6
chondrites formed at pressures from 15 to 25GPa (Chapter 2, 3 and 4). The shock
temperature for 20 GPa pressure is ~500 K, assuming <7% porosity and ~250 K pre-
shock temperature (Stöffler et al. 1991; Sharp and DeCarli, 2006). In this case, the
118
common HP-mineral-bearing samples contain only 5-10% shock melt from local porosity,
shearing and friction. Although the fraction of shock melt is not necessarily a measure of
the shock level, the bulk (local shock melt plus host rock) shock temperature of the
impact breccias must be much higher than the HP-mineral-bearing samples, resulting
from higher shock pressure. The shock level for impact breccias with 50% melt is thus
likely between the HP-mineral bearing samples (~20 GPa) and whole-rock melting
samples (~90 GPa). Therefore, the absence of HP minerals in melt breccias is not caused
by insufficient shock pressure, but rather by P-T-t paths that are inconsistent with
preservation of HP phases. In this chapter, the shock features in melt breccias are
characterized to better address the shock conditions (P-T paths) of HP minerals and
impact melt breccias.
5.1.4 The importance of temperature in shock classification
Stöffler et al. (1991) proposed six stages (S1-S6) to classify the shock features in
chondrites (Table 1.1). Each stage is assigned a shock pressure range for the
corresponding features. In the classification, the post-shock temperature is considered as
a primarily effect of shock pressure. However, as the authors mentioned, the shock
temperatures are dependent on the pressure, mineralogy, porosity and ambient pre-shock
temperature of the chondrite. For example, 25 GPa pressure shock on a target of 7%
porosity can lead to ~200 K post-shock temperature increase over the pre-shock
temperature, which is significantly higher than 100 K temperature increase for a non-
porous material at the same pressure (Sharp and DeCarli, 2006). As the pre-shock state of
the chondrite is heterogeneous and relatively poorly constrained, the shock temperatures
119
are not only dependent on shock pressure, but also on the heterogeneity of local porosity
and shear bands (Chapter 2). Therefore, it is important to consider the shock pressure-
temperature-time as semi-independent factors. The two dimensional (P-T) or three
dimensional (P-T-t) constraints on shock metamorphism are essential for building the
link between shock features and shock conditions.
In this chapter, I use petrographic and mineralogical investigations by optical and
electron microscopy to estimate the shock conditions of two L6 chondrites, NWA 091
and Chico, which are characterized as blackened impact melt breccias. In the discussion,
I evaluate the results from melt breccias, HP-mineral-bearing samples and moderately
deformed samples and illustrate their P-T-t paths to better understand the sequence of
shock levels in chondrites.
5.2 Impact melt breccia NWA 091 and Chico
As L6 impact melt breccias, Chico and NWA 091 exhibit similar shock features,
such as extensive recrystallization and blackening of silicate minerals. Pervasive melting
was identified in the recovered samples of the two chondrites (Bogard et al. 1995;
Weirich et al. 2012). The investigated thin sections were made to include limited shock
melt in order to obtain more material for characterizing the shock petrography of the
unmelted host rock.
In NWA 091, olivine and pyroxene fragments all contain abundant micron sized
troilite inclusions (Figure 5.1a). Locally, troilite veinlets of up to 10 µm in length form
networks through silicate minerals. The disseminated troilite inclusions and veinlets
make the host-rock optically opaque, which is referred as shock blackening. The olivine
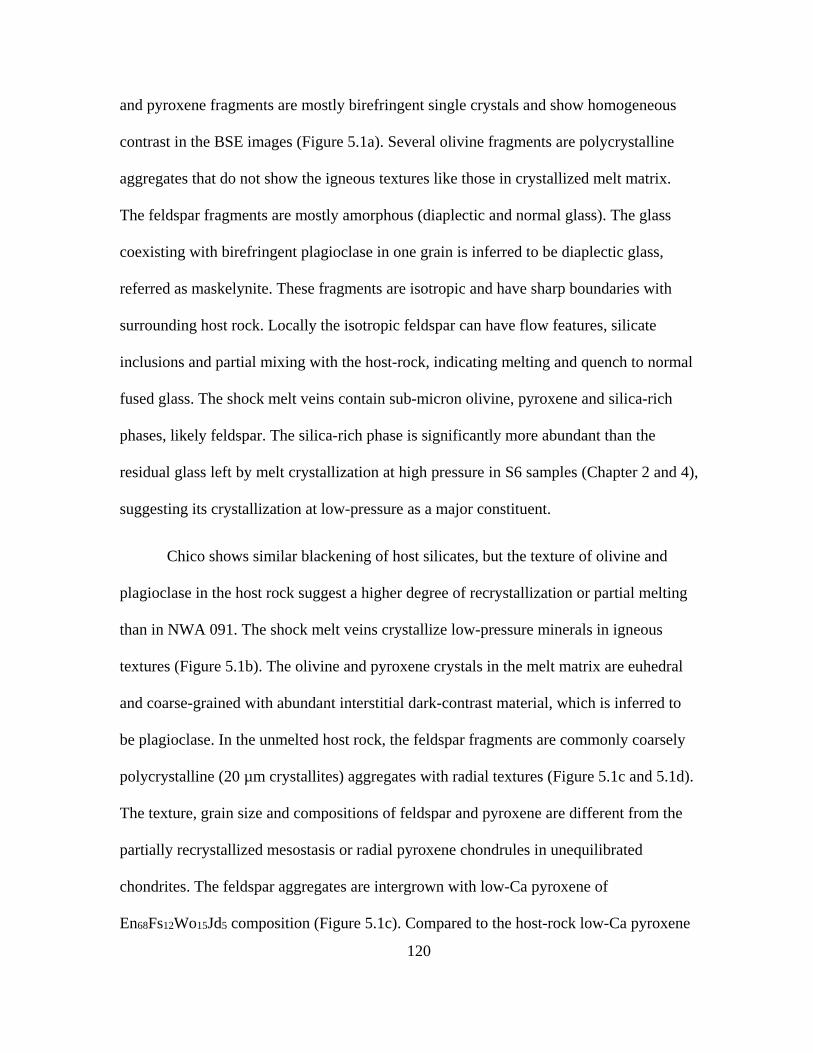
120
and pyroxene fragments are mostly birefringent single crystals and show homogeneous
contrast in the BSE images (Figure 5.1a). Several olivine fragments are polycrystalline
aggregates that do not show the igneous textures like those in crystallized melt matrix.
The feldspar fragments are mostly amorphous (diaplectic and normal glass). The glass
coexisting with birefringent plagioclase in one grain is inferred to be diaplectic glass,
referred as maskelynite. These fragments are isotropic and have sharp boundaries with
surrounding host rock. Locally the isotropic feldspar can have flow features, silicate
inclusions and partial mixing with the host-rock, indicating melting and quench to normal
fused glass. The shock melt veins contain sub-micron olivine, pyroxene and silica-rich
phases, likely feldspar. The silica-rich phase is significantly more abundant than the
residual glass left by melt crystallization at high pressure in S6 samples (Chapter 2 and 4),
suggesting its crystallization at low-pressure as a major constituent.
Chico shows similar blackening of host silicates, but the texture of olivine and
plagioclase in the host rock suggest a higher degree of recrystallization or partial melting
than in NWA 091. The shock melt veins crystallize low-pressure minerals in igneous
textures (Figure 5.1b). The olivine and pyroxene crystals in the melt matrix are euhedral
and coarse-grained with abundant interstitial dark-contrast material, which is inferred to
be plagioclase. In the unmelted host rock, the feldspar fragments are commonly coarsely
polycrystalline (20 µm crystallites) aggregates with radial textures (Figure 5.1c and 5.1d).
The texture, grain size and compositions of feldspar and pyroxene are different from the
partially recrystallized mesostasis or radial pyroxene chondrules in unequilibrated
chondrites. The feldspar aggregates are intergrown with low-Ca pyroxene of
En68Fs12Wo15Jd5 composition (Figure 5.1c). Compared to the host-rock low-Ca pyroxene
121
of En76.3Fs20.3 (Bogard et al. 1995), the intergrown pyroxene is significantly enriched in
calcium, suggesting chemical exchange with the feldspar. High-Ca pyroxene (diopside) is
not commonly associated to these radial feldspar aggregates. Olivine fragments are also
recrystallized to small, 1 to 10 µm, subhedral crystals (Figure 5.1d). The recrystallized
olivine grains have a consistent composition of Fa15 with the equilibrated host rock.
5.3 Pressure-temperature paths of shock features
In section 5.2, I characterized the shock feature of impact melt breccias, in
addition to the previously investigated HP-mineral bearing (Chapter 2 and 3) and
partially annealed samples (Chapter 4). With the combination of these samples, the
pressure-temperature (P-T) paths for a sequence of shock levels are summarized in this
section.
5.3.1 HP-mineral bearing samples
Although high-pressure phases are not the only evidence of severe shock (stage
S6) in chondrites, many S6 samples are identified based on the appearance of HP
minerals. The HP assemblage in most of these samples consists of predominantly
ringwoodite plus majoritic garnet. Typical samples include Sixiangkou (L6), NWA 757
(LL6) and Y-75267 (H6). In these samples, olivine and enstatite clasts entrained in the
shock melt have been transformed to ringwoodite and majoritic garnet, respectively
(Sharp and DeCarli, 2006; Gillet et al. 2007; Gillet and El Goresy, 2013). The shock melt
crystallizes an assemblage of garnet, ringwoodite and/or magnesiowüstite. The HP
assemblage provides three major constraints on the pressure-temperature condition.
122
First, the crystallization pressure in these highly shocked samples is
approximately 20-25 GPa (Figure 5.2). If the crystallization assemblage in the sample is
constant across the melt veins and pockets, then I can infer that the pressure did not
change drastically during crystallization and that the crystallization pressure is the
equilibration shock pressure. If the melt matrix includes mostly wadsleyite instead of
ringwoodite, such as in NWA 757 (Chapter 2) and Mbale (Chapter 4), the crystallization
pressure is inferred to be lower. Although the liquidus phases, such as majoritic garnet
(Chapter 2) and bridgmanite (Chapter 3), are the most indicative of the crystallization
pressure, it is possible that the crystallization assemblage of the shock melt is a
combination of liquidus phases and sub-solidus phases, such as the wadsleyite +
clinopyroxene in NWA 757 (Chapter 2) and the bridgmanite + ringwoodite + akimotoite
in Acfer 040 (Chapter 3). This occurs because the melts are commonly supercooled such
that subsolidus phases are stabilized during crystallization. In these cases, the
crystallization pressure can still be estimated by the inferred liquidus and subsolidus
phases in the melt matrix.
The solid blue line in Figure 5.2 shows a possible P-T curve of the shock melt in a
HP-mineral bearing chondrite. The shock melt needs to start with a temperature above the
liquidus at ~2200 K. Compared to the HP liquidus, the bulk shock-temperature of the
host rock is only ~500 K at 20-25 GPa, assuming 7% porosity and 250 K temperature
before impact (Sharp and DeCarli, 2006). This large difference in temperature between
the shock melt and the surrounding host rock results in rapid quench of the melt by
conducting heat into the surrounding host rock. If the shock pulse is longer than the time
required to quench the melt, there is no significant decompression during crystallization
123
and the resulting crystallization assemblage would be constant throughout the quenched
melt.
Second, the chondrite fragments that are entrained in the shock melt are heated
rapidly to enable transformation to HP polymorphs during the shock pulse. Although the
duration of the shock pulse varies depending on the size of the impacting body and the
location of the sample relative to the impact, the pulse duration is mostly on the order of
seconds for chondrites (Chen et al. 2004; Ohtani et al. 2004; Beck et al. 2005; Sharp et al.
2015). Transformation of olivine on such a time scale requires a temperature above 1600
K (Xie and Sharp 2007). For the transformation of enstatite clasts to majorite, akimotoite
or bridgmanite, the temperature must be even higher because of the slow kinetics of
enstatite transformations (Hogfere et al. 1994; Lockridge 2015). The blue dot-dash line
represents the P-T path of an entrained mineral fragment that is heated rapidly by heat
conduction from the melt and can easily reach the solidus temperature. The heating and
transformation to HP polymorphs occur during the shock pulse at the equilibration shock
pressure. Only material within the shock melt or immediately adjacent to the melt reaches
sufficiently high temperatures for transformation. Temperature is the key difference
between the entrained clast and the host rock (blue dashed line in the Figure 5.2).
Observable HP transformation cannot occur in the host-rock at its shock temperature of a
few hundred kelvins (Sharp and DeCarli, 2006; Xie and Sharp, 2007). Although the
relatively cold host rock experienced the same equilibration shock pressure as the S6
shock melt (blue solid and dot-dash line in Figure 5.2), only mosaicism (S4-S5), PDFs
(S4-S5) and maskelynite (S5) would appear in the host rock outside of the narrow zone of
high temperatures associated with the shock melt.
124
Third, the HP minerals must cool below a critical temperature of annealing before
pressure release in order to survive. At ambient pressure, ringwoodite and wadsleyite
break down at temperatures above 900 K and back-transform to olivine in only seconds at
T >1200 K (Chapter 4). The critical temperature depends on the stability of the mineral
and the kinetics of back-transformation reaction. The critical temperature for garnet is
~1500 K, which makes garnet more resistant to back transformation than the olivine
polymorphs (Chapter 4). The red dashed line in Figure 5.2 represents a critical
temperature of annealing. In this scenario, heat conduction to the relatively cool host rock
is the major mechanism for the cooling of the shock melt. Therefore, graphically the blue
solid line passes almost in vertical direction and its intersection with the red dashed line
is still at high pressure.
Acfer 040 is similar to other HP-mineral bearing chondrites except that it represents
higher shock pressure than most. The predominantly bridgmanite melt-matrix assemblage
suggests that crystallization occurred above 25 GPa (orange line in Figure 5.2). The
shock pressure also results in the transformation of enstatite clasts in the melt to
bridgmanite. Bridgmanite is extremely unstable at low pressure and it begins to vitrify at
400 K and cannot survive above 750 K (Durben and Wolf, 1992; Chapter 3). In order for
bridgmanite to survive in a shocked meteorite, it must remain at high pressure until it has
cooled, at least locally, below 750 K.
5.3.2 Partially annealed samples
Technically, both Mbale and Acfer 040 are partially annealed, highly shocked
samples. However, in Acfer 040, it is only the bridgmanite that has broken down and the
125
shock veins still experienced a relatively long shock pulse and fast cooling, similar to
shock veins in other S6 samples but starting from a higher pressure (Figure 5.2). In
contrast, Mbale, with back-transformation of ringwoodite and wadsleyite, experienced a
significantly different P-T history from other S6 samples. Remnants of high-pressure
phases indicate that shock melt in Mbale started at high-pressure and temperature but
experienced a shorter shock pulse (green solid line in Figure 5.2). The clasts in the shock
melt were heated to high temperatures (green dash-dot line in Figure 5.2) to enable rapid
transformation to HP minerals. However, breakdown of ringwoodite/wadsleyite indicates
that a low-pressure condition was reached before the shock melt cooled below the critical
temperature for annealing. In this case, decompression occurred as the heat was
conducted from the shock melt to the surrounding host rock.
Graphically, the corresponding P-T curve in Figure 5.2 has a gentle slope toward
low P and T conditions and the intersection between the cooling curve and the critical-
temperature line (red dashed) is at low-pressure. Assuming that the temperature decrease
strictly from adiabatic decompression is not significant (Sharp and DeCarli 2006; Xie et
al. 2006; Sharp et al. 2015), such a path can result from either slower cooling of the melt
or by a shorter shock pulse. For the former scenario, a higher background temperature
could lead to slower heat transfer from the melt to the host rock. Similarly, a larger
volume of melt contains higher internal energy that takes longer to dissipate. Either case
results in slow cooling of the melt relative to the shock pulse duration. Alternatively, the
shock pulse of Mbale could be shorter than those of other S6 samples so that the pressure
is released as the melt cools by a combination of conduction to the host rock and by
adiabatic cooling. Mbale does not have a large volume of melt or evidence of high bulk
126
temperature (Chapter 4) thus it likely experienced a shorter shock pulse than most HP-
mineral bearing samples. Nevertheless, significantly higher post-shock temperature and
more pervasive melting than that of Mbale could also lead to extensive post-shock
annealing in some other samples, such as the impact melt breccias.
5.3.3 Impact melt breccias
Impact-melt breccias, such as NWA 091 and Chico, have shock features including
recrystallization of olivine, blackening of silicates by disseminated metal-sulfide,
feldspathic normal glass and pervasive impact melt. Some impact-melt breccias are
classified as highly shocked S6 samples (Stöffler et al. 1991), although it was not clear
why these breccias do not contain any HP minerals. My results show that the melt
breccias have evidence of high bulk temperature. Besides pervasive melt being direct
evidence for strong shock, disseminated troilite indicates that sulfide was mobile,
probably molten, throughout the sample. Moreover, the troilite inclusions in olivine and
pyroxene are not associated with obvious cracks (Figure 5.1a). It is likely that the rock-
forming minerals were fractured by shock and the fractures are filled by sulfide melt.
During subsequent slow cooling, the fractures were healed, leaving strings of sulfide
inclusions (Rubin et al. 1992). van der Bogert et al. (2003) performed high-speed friction
experiments on ordinary chondrites and observed sulfide veinlets along cracks in the
silicates near the shear zone. They suggested that the blackening by veinlets requires
strong friction instead of severe shock (Heymann 1967). In my samples, the sulfide
particles and veinlets are much finer-grained than the common crack-filling sulfide in
chondrites. Also the particles occur in strings without co-existing fractures. My
127
observations suggest NWA 091 and Chico underwent higher order of recrystallization
from high temperature than that in friction experiments.
The polycrystalline olivine probably results from a combination of back-
transformation, recrystallization and partial melting. During the shock pulse, the olivine
single crystals transform to polycrystalline aggregates of ringwoodite at a high shock
temperature. After pressure release, the temperature was high enough to enable the
complete back-transformation of ringwoodite to olivine and to allow olivine aggregates
to recrystallize and coarsen (Figure 5.1d). These features suggest that impact melt
breccias experienced an elevated bulk temperature by being shocked to higher pressures
than typical S6 samples. With increasing shock pressure, the bulk temperature increases
such that the host rock is no longer cool enough to cause rapid cooling of isolated shock
melt by heat conduction. For example, the post-shock temperature that correspond to 50
GPa shock pressure is ~1100 K, assuming 7% porosity and 250 K ambient temperature of
chondrite before impact (Sharp and DeCarli 2006). In such a highly shocked sample,
adiabatic decompression primarily accounts for the temperature drop of the whole rock in
the first several minutes after impact. Thus, the temperature of the host rock remains high
and decreases relatively little with pressure release, forming a gentle slope on the P-T
diagram (purple fine-dashed line in Figure 5.2).
The shock melt in these breccias consistently crystallizes low-pressure
assemblages of olivine, pyroxene plus feldspar (Figure 5.1b). In very highly shocked
samples, melting can occur at high pressure or at low pressure as a result of adiabatic
decompression. In either scenario, crystallization of the shock melt occurs at the low-
128
pressure conditions and cannot crystallize HP minerals. It is possible that impact breccia
samples contain both HP melt and decompression melt. The HP melt forms at the early
stage of compression by heating above high-pressure liquidus (purple solid line in Figure
5.2). Since the bulk temperature in the impact breccias is high, the HP melt stays hot
during and after decompression and crystallizes at low-pressure (purple solid line in
Figure 5.2). Alternatively, the host rock can start with a high, but sub-solidus,
temperature that remains high during adiabatic decompression and crosses the melting
curve at low pressure. In this case, the melt forms in the later stage of decompression
(purple coarse-dashed line in Figure 5.2). Although the melt forming with compression
starts with a much higher temperature than the melt from decompression, their
crystallization textures are not necessarily distinguishable. In either case, the melt
crystallizes a low-pressure assemblage of olivine, pyroxene and feldspar (Figure 5.1b).
The intergrown feldspar and pyroxene (Figure 5.1c) suggests partial eutectic
melting, which is likely an example of decompression melting. The local temperature in
this case is between solidus and liquidus to produce only partial melting at low-pressure.
This implies that this part of the sample was solid at high pressure. If this area started
with a HP solidus temperature, the pressure release would leave this region well above
the liquidus temperature and cause complete melting (Sharp and DeCarli 2006).
Graphically, the solidus is steeper than release curve (purple coarse-dashed line in Figure
5.2) of the host-rock and the two curves intersect, indicating partial melting.
Although the shock features are evidence for severe shock, it is difficult to
precisely estimate the shock pressure in impact-melt breccia samples. The relative
129
abundance of shock features can be qualitatively used as a measurement of shock level.
For example, recrystallized olivine and radial feldspar (Figure 5.1c and 5.1d) are more
common in Chico than in NWA 091. Extensive recrystallization and partially melting
outside the shock melt vein in Chico suggests higher overall temperature, likely resulting
from a higher shock level than NWA 091.
5.3.4 Shock classification by P-T-t paths
The six shock stages in the currently used classification are based mainly on the
shock features of olivine and plagioclase (Stöffler et al. 1991). In practice, discrepancy
between the co-existing shock features in shocked samples is common. Undulatory
extinction (S2), planar fracture (S3), mosaicism (S4-S5), PDFs (S4-S5) and maskelynite
(S5) coexist in many samples (Xie and Sharp, 2004; Xie et al. 2006; Chapter 2). The
classification procedure suggested by Stöffler et al. (1991) is to investigate shock features
in a number of crystals and use the predominate features to infer the shock stage. This
method tends to work if the various shock features are concentrated in one shock stage.
However, in some samples, such as NWA 757, the features are consistent with more than
one shock stage (Chapter 2). The olivine in NWA 757 mostly has weak undulatory
extinction and irregular to planar fractures. Mosaicism and PDFs are rare, suggesting
shock stage S2. In contrast, the feldspar is approximately half maskelynite and half
crystalline plagioclase, suggesting shock stage S4. S4 was originally assigned to NWA
757 although the features are not perfectly compatible (Bischoff, 2002).
Assuming that the shock pressure can independently control shock features, as
suggested by the Stöffler et al. (1991) classification (Table 1.1), it is difficult to interpret
130
discrepancies in shock stages suggested by co-existing features. For the shock pressure
calibration summarized in classification, the pressures of S2-S5 features are distinctly
lower than and almost do not overlap with the S6 features. i.e. the samples with S6
equilibrium pressure must not contain S2-S5 features. In other word, if those pressure
calibrations were correct, the shock melt and associated HP minerals (shock state S6)
would always suggest a higher pressure than the features in the host-rock (S2-S5).
Contradictorily, both the S6 and S2-S5 features in one sample must represent only one
equilibrium pressure, also according to the classification (Stöffler et al. 1991). This
contradiction comes from artificially making S6 features stand out from S2-S5 by
assigning an unrealistic high pressure that does not have experimental support. The
internal contradiction lead to subjective shock classification by individual researchers
based on their own understanding, in which case the assigned stage may not objectively
represent the shock condition.
Bischoff (2002) used birefringent plagioclase in the host rock of NWA 757, for
example, for the classification of S4. This idea potentially suggests the S6 features in the
shock melt is not from equilibrium condition of the sample and may represent local
pressure excursion. However, the pressure excursion can only occur during shock
compression. Minerals with different shock impedances reach different pressures during
compression. As the shock wave reaches grain boundaries, two adjacent grains with
different pressures need to achieve a common particle velocity and pressure. By this
process, a reflected wave is created in the high-shock-velocity material. The reflected
wave travels to the back side of the grain, resulting in a new particle velocity and creating
a reflected wave. This reverberation process occurs until all the adjacent grains have the
131
same pressure and particle velocity (Sharp and DeCarli 2006; Chapter 1.3). A typical
shock wave velocity is > 3 km/s for silicate, in which case the reverberation occurs
rapidly. Therefore, the pressure difference would ring out in nanoseconds to
microseconds, depending on the shock velocity and size of the domain of the pressure
excursion. A transient pressure excursion is not likely to affect shock melt crystallization
or the clast transformation that occur on a timescale of milliseconds to seconds.
The formation of shock melt may involve transient local pressure variation but the
formation of HP minerals is predominantly after the pressure has equilibrated. In fact,
shock temperature and post-shock temperature are dependent on the shock pressure,
porosity, mineralogy and ambient temperature of the target material (Stöffler et al. 1991).
The local melt results from local porosity collapse, shear under differential stress and
then friction on fracture or shear zone (Sharp and DeCarli, 2006; Chapter 2). In other
words, the local melting does not require excessive pressure of long duration and can
form rapidly at the beginning of the compression (Langenhorst and Poirier, 2000). The
subsequent shock transformations within and outside the shock melt represent the
equilibration pressure until decompression. As in NWA 757, the host-rock suggests a
shock stage of ambiguous S2-S4 and the HP mineral in shock melt suggests S6. I suggest
for NWA 757 and similar samples, the HP minerals form under equilibration pressure
and should be used to assign the shock stage S6 for the whole rock. Moreover, if we
refine the pressure of typical S6 features (HP minerals) to the more actual 15-25 GPa
range (Chapter 2, 3 and 4), all the shock deformation features can occur in this range
(Snee and Ahrens 1975; Bauer 1979; Jeanloz 1980), for which their distribution is
132
dependent on the pre-shock heterogeneity. Such a P-T scenario does not suggest the S6
features to form at excess pressure and better explains the observed features.
Understanding the P-T paths of shock in chondrites is important because shock
effects are heterogeneous and the P-T conditions that any part of a sample experience
may not be on the Hugoniot. Locally heterogeneous porosity, fractures and shear stress
during compression result in heterogeneous temperatures that are not controlled by the
bulk-rock Hugoniot (Chapter 2). These temperature heterogeneities have important
effects on the formation of most shock deformational features besides the HP minerals.
For example, the pressure for solid-state amorphization of plagioclase is strongly related
to the temperature (Kubo et al. 2010). Shock temperature also changes the physical
properties of minerals and influence deformational features such as PDFs and mosaicism
(Bauer 1979; Bowden 2002). More importantly, ignoring temperature heterogeneities
would lead to difficulties explaining the significant discrepancy between co-existing
shock features in some samples, such as sharp extinction in an S6 chondrite.
5.4 Revision to the shock stage classification
My results provide new constraints on the shock pressure, shock temperature and
post-shock temperature histories of ordinary chondrites. I suggest several revisions to the
features and pressures assigned to each shock stage.
First, one shock stage and equilibrium pressure should be assigned to a sample
(chondrite) for the whole rock. Assigning multiple shock stages for one sample is not
clearly supported or prevented in the Stöffler et al. (1991) classification, but is seen in the
literature. Although some features such as shock melt veins may result from transient
133
local shear at the beginning of compression, pressure is equilibrated before most
deformational and transformation feature occurs. Particularly, the host-rock and HP-
mineral bearing melt veins of S6 chondrites experienced a single equilibrium shock
pressure and should be assigned to S6 for the whole rock. The exception is that the
samples (chondrite) recovered in a large mass from a meteor shower may represent
different regions of the parent body (e.g. Chelyabinsk and Mbale). It is possible for those
samples to experience different shock pressures in different pieces.
Second, using the high-pressure minerals as the primary diagnostic indicator for
shock stage S6, the shock pressure for S6 should be assigned to 15-30 (?) GPa. The
pressure range is consistent with HP minerals from wadsleyite (~15 GPa) to bridgmanite
(> 25 GPa) in ordinary chondrites. This is also supported by recent shock melting
experiments (Tschauner et al. 2009). Correspondingly, the shock-deformational features
can occur in a wider range of pressures than common HP minerals. Thus the deformation
features must coexist with HP minerals and their distribution is affected but not fully
controlled by shock pressure. In this case, the deformational features are less indicative of
shock pressure.
Third, at least one more shock stage (S7) needs to be added between shock stage
S6 and whole-rock melting. Chondrite samples shocked to above ~ 40 (?) GPa would
have significantly elevated bulk shock temperature and post-shock temperature. The
observed states of these samples would be formed under predominantly high-temperature
post-shock conditions. Since they would lack direct high-pressure signatures, I suggest
use of the extent of high-temperature features as a proxy for shock level. The abundance

134
of shock melt, the level of solid-state recrystallization of olivine and pyroxene, the
abundance of normal glass and recrystallized aggregate in feldspar and the dissemination
of sulfide all suggest the level of thermal processes in these samples and provide an
estimation of bulk temperature. The waste heat and corresponding shock pressure can be
calculated from the temperature, given an estimated pre-shock state of the rock.
I propose a partial revision on the strong shock part (Table 5.1) to the shock
classification from Stöffler et al. (1991). Based on high-pressure mineral physics, the
shock pressure for stage S6 is refined to 15-35 GPa. The lower bound of ~15 GPa for S6
is dependent on the stability fields of common HP minerals in chondrites, such as
majoritic garnet, wadsleyite and ringwoodite. At this pressure, the shock-deformational
features in the host rock are not distinctly differently from those induced by lower (10-15
GPa) pressure. Features, such as planar fractures, mosaicism and diaplectic glass, would
occur in a wide range of pressures of >10 GPa (Bauer 1979; Kubo et al. 2010). For the
samples with abundant S6 features (HP minerals), the abundance of shock deformational
features in their host rock are variable (Chapter 2) and may not be easily distinguishable
from ≤ S5 samples. Nevertheless, with these uncertainties, the shock pressures for S6 and
≤ S5 are still refined to much narrower ranges than those provided by shock-recovery
experiments. For examples, a sample with considerable maskelynite but no S6-S7
features must experience 10-20 GPa shock pressure, which is overlapping with the lower
bound of S6. Compared to the 30-55 GPa range calibrated by shock-recovery
experiments for maskelynite (Stöffler et al. 1991), the uncertainty in the revised
classification is not significant.

135
The upper bound of S6 is defined by the high-pressure range for post-spinel
transformation. The bridgmanite in Acfer 040 and Tenham suggest shock pressure of 25
GPa or greater. More abundant bridgmanite is expected in sample of >30 GPa shock
pressure. However, at certain pressure, the high post-shock temperature would anneal out
the bridgmanite. It is difficult to constrain the exactly pressure that would just anneal out
most of the HP minerals because of temperature heterogeneities.
The shock stage S7 is defined by features induced by high shock temperatures.
Although high-pressure minerals barely survive in these temperatures, excessive shock
pressure is required to significantly increase the bulk temperatures of the sample. The
upper bound of S7 would be the pressure that leads to a post-shock temperature above the
liquidus temperature of chondrite (whole rock melting).
As I emphasize the effects of temperature in shock metamorphism, the pre-shock
state of the sample is of great importance. This research focused on ordinary chondrites,
which provide potential constraints on the average size, impact velocity, ambient
temperature, mineralogy and porosity of the parent asteroid. The fundamental shock
physics and features in other chondrites and achondrites are expected to be similar. High-
pressure minerals, in most cases, are still a robust indicator of shock conditions. However,
the variations on average impact velocities and projectiles sizes for achondrite parent
bodies could lead to different P-T-t paths from chondrites, resulting in meteorites of
distinct shock features. For example, many Martian meteorites shocked by hypervelocity
(> 5 km/s) small impactor commonly have low-pressure crystallization assemblage in the
quenched melt co-existing with high-pressure transformation in olivine (Walton 2013;
136
Walton et al. 2014). The P-T path of Tissint shock vein is therefore approximately
between that of Mbale and Chico. These achondrite samples are worth systematic
investigation in order to get a shock classification of features and pressures specifically
for their own representative P-T paths.
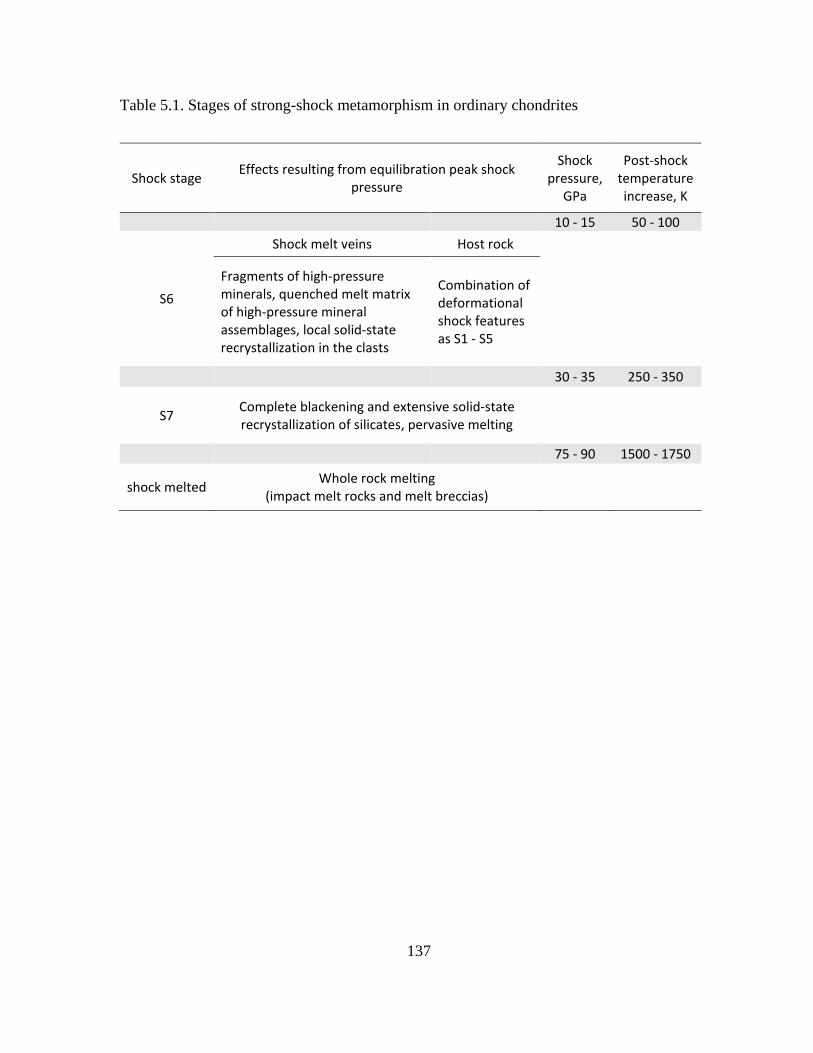
137
Table 5.1. Stages of strong-shock metamorphism in ordinary chondrites
Shock stage Effects resulting from equilibration peak shock pressure
Shock pressure,
GPa
Post-shock temperature increase, K
10 - 15 50 - 100
S6
Shock melt veins Host rock
Fragments of high-pressure minerals, quenched melt matrix of high-pressure mineral assemblages, local solid-state recrystallization in the clasts
Combination of deformational shock features as S1 - S5
30 - 35 250 - 350
S7 Complete blackening and extensive solid-state recrystallization of silicates, pervasive melting
75 - 90 1500 - 1750
shock melted Whole rock melting (impact melt rocks and melt breccias)
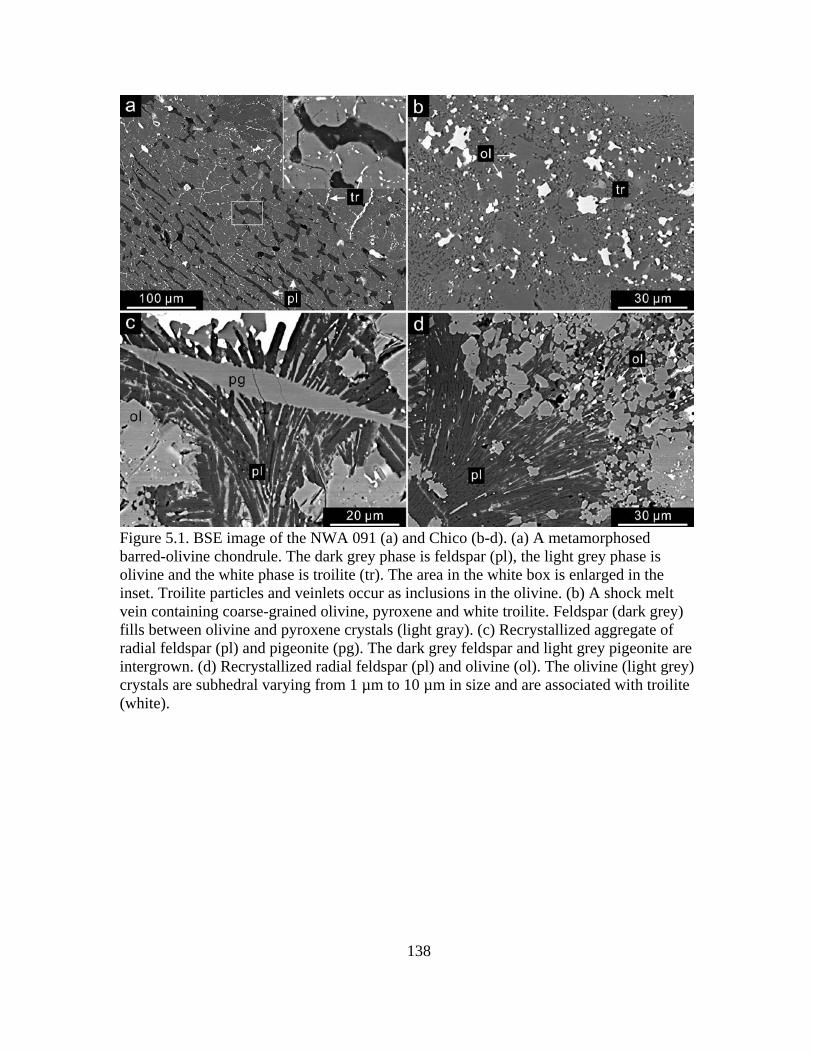
138
Figure 5.1. BSE image of the NWA 091 (a) and Chico (b-d). (a) A metamorphosed barred-olivine chondrule. The dark grey phase is feldspar (pl), the light grey phase is olivine and the white phase is troilite (tr). The area in the white box is enlarged in the inset. Troilite particles and veinlets occur as inclusions in the olivine. (b) A shock melt vein containing coarse-grained olivine, pyroxene and white troilite. Feldspar (dark grey) fills between olivine and pyroxene crystals (light gray). (c) Recrystallized aggregate of radial feldspar (pl) and pigeonite (pg). The dark grey feldspar and light grey pigeonite are intergrown. (d) Recrystallized radial feldspar (pl) and olivine (ol). The olivine (light grey) crystals are subhedral varying from 1 µm to 10 µm in size and are associated with troilite (white).
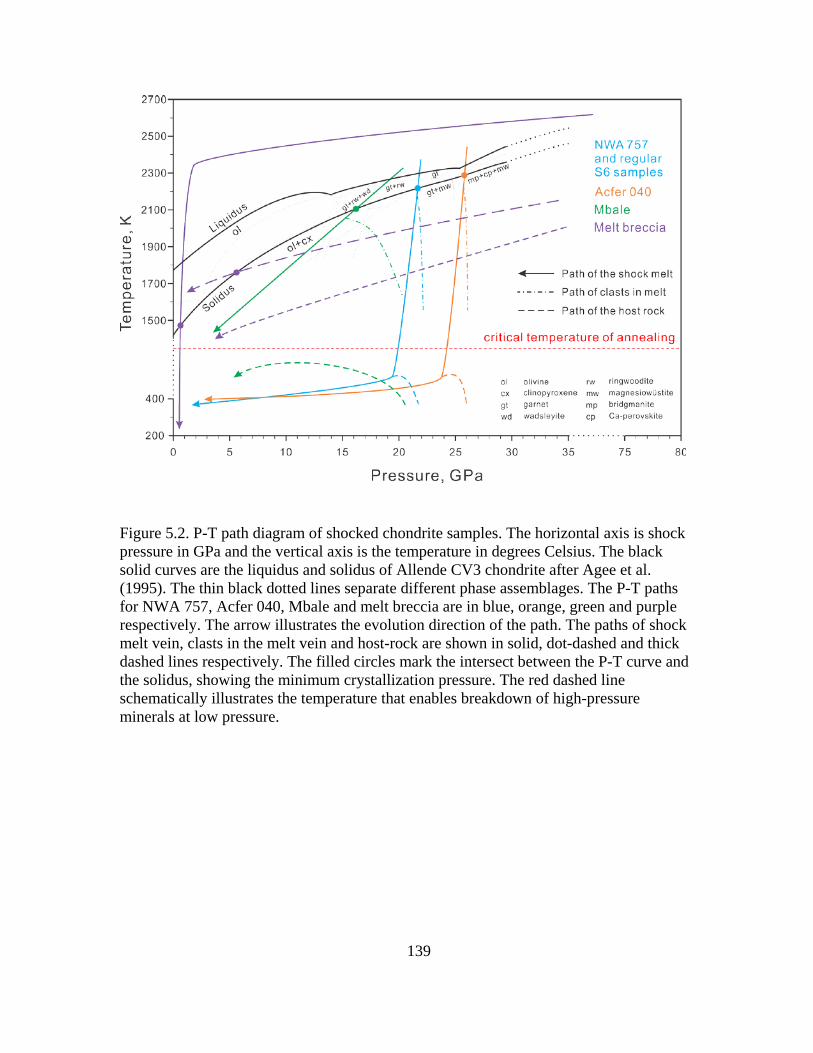
139
Figure 5.2. P-T path diagram of shocked chondrite samples. The horizontal axis is shock pressure in GPa and the vertical axis is the temperature in degrees Celsius. The black solid curves are the liquidus and solidus of Allende CV3 chondrite after Agee et al. (1995). The thin black dotted lines separate different phase assemblages. The P-T paths for NWA 757, Acfer 040, Mbale and melt breccia are in blue, orange, green and purple respectively. The arrow illustrates the evolution direction of the path. The paths of shock melt vein, clasts in the melt vein and host-rock are shown in solid, dot-dashed and thick dashed lines respectively. The filled circles mark the intersect between the P-T curve and the solidus, showing the minimum crystallization pressure. The red dashed line schematically illustrates the temperature that enables breakdown of high-pressure minerals at low pressure.
140
References
Acosta-Maeda T. E., Scott E. R. D., Sharma S. K., and Misra A. K. 2013. The pressures and temperatures of meteorite impact: Evidence from micro-Raman mapping of mineral phases in the strongly shocked Taiban ordinary chondrite. American Mineralogist 98: 859–869.
Agee C. B. 1990. A new look at differentiation of the Earth from melting experiments on the Allende meteorite. Nature 346: 834–837.
Agee C. B., Li J., Shannon M. C., and Circone S. 1995. Pressure-temperature phase diagram for the Allende meteorite. Journal of Geophysical Research: Solid Earth 100: 17725–17740.
Akaogi M., and Akimoto S. 1977. Pyroxene-garnet solid-solution equilibria in the systems Mg4Si4O12-Mg3Al2Si3O12 and Fe4Si4O12-Fe3Al2Si3O12 at high pressures and temperatures. Physics of the Earth and Planetary Interiors 15: 90–106.
Asahara Y., Kubo T., and Kondo T. 2004. Phase relations of a carbonaceous chondrite at lower mantle conditions. Physics of The Earth and Planetary Interiors 143–144: 421–432.
Bauer J. F. 1979. Experimental shock metamorphism of mono- and polycrystalline olivine - A comparative study. In Proceedings of Lunar and Planetary Science Conference 10th. pp. 2573–2596
Beck P., Gillet P., El Goresy A., and Mostefaoui S. 2005. Timescales of shock processes in chondritic and martian meteorites. Nature 435: 1071–1074.
Binns R. A., Davis R. J., and Reed S. J. B. 1969. Ringwoodite, Natural (Mg,Fe)2SiO4 Spinel in the Tenham Meteorite. Nature 221: 943–944.
Bischoff A. 2002. Discovery of purple-blue ringwoodite within shock veins of an LL6 ordinary chondrite from Northwest Africa (abstract #1264). 33rd Lunar and Planetary Science Conference.
Bogard D. 1995. Impact ages of meteorites: A synthesis. Meteoritics 30: 244–268.
Bottke W. F., Vokrouhlický D., Minton D., Nesvorný D., Morbidelli A., Brasser R., Simonson B., and Levison H. F. 2012. An Archaean heavy bombardment from a destabilized extension of the asteroid belt. Nature 485: 78–81.
Bouvier A., Blichert-Toft J., Vervoort J. D., Gillet P., and Albarède F. 2008. The case for old basaltic shergottites. Earth and Planetary Science Letters 266: 105–124.
141
Brearley A. J., and Jones R. H. 1998. Chondritic meteorites. Reviews in Mineralogy and Geochemistry 36: 3.1-3.398.
Britt D., Yeomans D., Housen K., and Consolmagno G. 2002. Asteroid density, porosity, and structure. In Asteroids III. edited by Bottke W.F., Cellino A., Paolicchi Paolo., Binzel R. The University of Arizona Press Tucson. pp.485-500
Cahn J. W. 1956. The kinetics of grain boundary nucleated reactions. Acta Metallurgica 4: 449–459.
Chen M., Goresy A. E., Gillet P., and Mao H. 2004. Ringwoodite lamellae in olivine: clues to olivine-ringwoodite phase transition mechanisms in shocked meteorites and subducting slabs. Proceedings of the National Academy of Sciences of the United States of America 101: 15033–15037.
Chen M., Li H., Goresy A. E., Liu J., and Xie X. 2006. Fracture-related intracrystalline transformation of olivine to ringwoodite in the shocked Sixiangkou meteorite. Meteoritics & Planetary Science 41: 731–737.
Chen M., Sharp T. G., Goresy A. E., Wopenka B., and Xie X. 1996. The majorite-pyrope + magnesiowustite assemblage: constraints on the history of shock veins in chondrites. Science 271: 1570–1573.
Chen M., and Xie X. 2008. Two distinct assemblages of high-pressure liquidus phases in shock veins of the Sixiangkou meteorite. Meteoritics & Planetary Science 43: 823–828.
Consolmagno G. J., Britt D. T., and Macke R. J. 2008. The significance of meteorite density and porosity. Chemie der Erde - Geochemistry 68: 1–29.
de Faria D. L. A., Venâncio Silva S., and de Oliveira M. T. 1997. Raman microspectroscopy of some iron oxides and oxyhydroxides. Journal of Raman Spectroscopy 28: 873–878.
DeCarli P. S., Xie Z., Trickey R., Hu J., Weaver C., and Sharp T. 2012. High-pressure minerals in RC 106 provide evidence for a very large impact (abstract #2877). 43rd Lunar and Planetary Science Conference.
Dodd R. T., and Jarosewich E. 1979. Incipient melting in and shock classification of L-group chondrites. Earth and Planetary Science Letters 44: 335–340.
Bowden K. E. (2002) Effects of loading path on the shock metamorphism of porous quartz: An experimental study. Ph.D. these, University of London, London, UK. 207 pp.
142
Durben D. J., and Wolf G. H. 1992. High-temperature behavior of metastable MgSiO3 perovskite: a Raman spectroscopic study. The American mineralogist 77: 890–893.
Dymshits A. M., Bobrov A. V., Litasov K. D., Shatskiy A. F., Ohtani E., and Litvin Y. A. 2010. Experimental study of the pyroxene-garnet phase transition in the Na2MgSi5O12 system at pressures of 13–20 GPa: First synthesis of sodium majorite. Doklady Earth Sciences 434: 1263–1266.
Fei Y., and Bertka C. M. 1999. Phase transitions in the Earth’s mantle and mantle mineralogy. In Mantle Petrology: Field Observations and High Pressure Experimentation: a Tribute to Francis R.(Joe) Boyd, edited by Fei Y., Bertka C.M. and Mysen B.O. The Geochemical Society. Houston. pp. 189–207.
Feng L., Lin Y., Hu S., Xu L., and Miao B. 2011. Estimating compositions of natural ringwoodite in the heavily shocked Grove Mountains 052049 meteorite from Raman spectra. American Mineralogist 96: 1480–1489.
Ferroir T., Beck P., Van de Moortèle B., Bohn M., Reynard B., Simionovici A., El Goresy A., and Gillet P. 2008. Akimotoite in the Tenham meteorite: Crystal chemistry and high-pressure transformation mechanisms. Earth and Planetary Science Letters 275: 26–31.
Fredriksson K., DeCarli P., and Aaramae A. 1963. Shock-induced veins in chondrites. Space Res 3: 3.
Ghosh A., and McSween H. Y. Jr. 1999. Temperature dependence of specific heat capacity and its effect on asteroid thermal models. Meteoritics and Planetary Science 34: 121–127.
Gillet P., Chen M., Dubrovinsky L., and El Goresy A. 2000. Natural NaAlSi3O8-hollandite in the shocked Sixiangkou meteorite. Science 287: 1633–1636.
Gillet P., El Goresy A., Beck P., and Chen M. 2007. High-pressure mineral assemblages in shocked meteorites and shocked terrestrial rocks: Mechanisms of phase transformations and constraints to pressure and temperature histories. Special Papers-Geological Society of America 421: 57.
Gillet P., and El Goresy A. 2013. Shock Events in the Solar System: The Message from Minerals in Terrestrial Planets and Asteroids. Annual Review of Earth and Planetary Sciences 41: 257–285.
Grady M. M., Pratesi G., and Cecchi V. M. 2014. Atlas of meteorites, Cambridge: Cambridge University Press.
Graham E. K. 1986. Recent developments in conventional high-pressure methods. Journal of Geophysical Research: Solid Earth 91: 4630–4642.
143
Grew E. S., Locock A. J., Mills S. J., Galuskina I. O., Galuskin E. V., and Hålenius U. 2013. Nomenclature of the garnet supergroup. American Mineralogist 98: 785–811.
Heymann D. 1967. On the origin of hypersthene chondrites: Ages and shock effects of black chondrites. Icarus 6: 189–221.
Heymann D., and Hörz F. 1990. Raman-spectroscopy and X-ray diffractometer studies of experimentally produced diaplectic feldspar glass. Physics and Chemistry of Minerals 17: 38–44.
Hirose K., Fei Y., Ma Y., and Mao H.-K. 1999. The fate of subducted basaltic crust in the Earth’s lower mantle. Nature 397: 53–56.
Hogrefe A., Rubie D. C., Sharp T. G., and Seifert F. 1994. Metastability of enstatite in deep subducting lithosphere. Nature 372: 351–353.
Hofmeister A. M. 1999. Mantle Values of Thermal Conductivity and the Geotherm from Phonon Lifetimes. Science 283: 1699–1706.
Hu J., and Sharp T. G. 2016. Shocked Feldspar in Martian Meteorites: Evidence Against Pervasive Melting and Resetting (abstract #2542). 47th Lunar and Planetary Science Conference.
Incropera F. P., DeWitt D. P., Bergman T. L., and Lavine A. S. 2006. Fundamentals of Heat and Mass Transfer, 6th edition. Hoboken. John Wiley & Sons Press.
Inoue T., Tanimoto Y., Irifune T., Suzuki T., Fukui H., and Ohtaka O. 2004. Thermal expansion of wadsleyite, ringwoodite, hydrous wadsleyite and hydrous ringwoodite. Physics of the Earth and Planetary Interiors 143–144: 279–290.
Irifune T., and Isshiki M. 1998. Iron partitioning in a pyrolite mantle and the nature of the 410-km seismic discontinuity. Nature 392: 702–705.
Ito E., and Takahashi E. 1987. Ultrahigh-Pressure Phase Transformations and the Constitution of the Deep Mantle. In High-Pressure Research in Mineral Physics: A Volume in Honor of Syun-iti Akimoto, edited by Manghnani M., and Syono Y. American Geophysical Union. pp. 221–229
Ito E., and Takahashi E. 1989. Postspinel Transformations in the System Mg2SiO4-Fe2SiO4 and Some Geophysical Implications. J. Geophys. Res. 94: 10637–10646.
Jeanloz R. 1980. Shock effects in olivine and implications for Hugoniot data. Journal of Geophysical Research: Solid Earth 85: 3163–3176.
144
Jenniskens P., Betlem H., Betlem J., Barifaijo E., Schluter T., Hampton C., Laubenstein M., Kunz J., and Heusser G. 1994. The Mbale meteorite shower. Meteoritics 29: 246–254.
Kato T. 1986. Stability relation of (Mg,Fe)SiO3 garnets, major constituents in the Earth’s interior. Earth and Planetary Science Letters 77: 399–408.
Katsura T., and Ito E. 1989. The system Mg2SiO4-Fe2SiO4 at high pressures and temperatures: Precise determination of stabilities of olivine, modified spinel, and spinel. Journal of Geophysical Research: Solid Earth 94: 15663–15670.
Kerschhofer L., Dupas C., Liu M., Sharp T. G., Durham W. B., and Rubie D. C. 1998. Polymorphic transformations between olivine, wadsleyite and ringwoodite; mechanisms of intracrystalline nucleation and the role of elastic strain. Mineral Mag 62: 617–638.
Kimura M., Chen M., Yoshida Y., El Goresy A., and Ohtani E. 2003. Back-transformation of high-pressure phases in a shock melt vein of an H-chondrite during atmospheric passage: Implications for the survival of high-pressure phases after decompression. Earth and Planetary Science Letters 217: 141–150.
Kimura M., Suzuki A., Kondo T., Ohtani E., and El Goresy A. 2000. Natural occurrence of high-pressure phases, jadeite, hollandite, wadsleyite, and majorite-pyrope garnet, in an H chondrite, Yamato 75100. Meteoritics and Planetary Science Supplement 35: 87.
Korochantseva E. V., Trieloff M., Lorenz C. A., Buykin A. I., Ivanova M. A., Schwarz W. H., Hopp J., and Jessberger E. K. 2007. L-chondrite asteroid breakup tied to Ordovician meteorite shower by multiple isochron 40Ar-39Ar dating. Meteoritics & Planetary Science 42: 113–130.
Kubo T., Kimura M., Kato T., Nishi M., Tominaga A., Kikegawa T., and Funakoshi K. 2010. Plagioclase breakdown as an indicator for shock conditions of meteorites. Nature Geoscience 3: 41–45.
Kuebler K. E., Jolliff B. L., Wang A., and Haskin L. A. 2006. Extracting olivine (Fo–Fa) compositions from Raman spectral peak positions. Geochimica et Cosmochimica Acta 70: 6201–6222.
Lange R. A., Cashman K. V., and Navrotsky A. 1994. Direct measurements of latent heat during crystallization and melting of a ugandite and an olivine basalt. Contributions to Mineralogy and Petrology 118: 169–181.
Langenhorst F., and Poirier J.-P. 2000. Anatomy of black veins in Zagami: clues to the formation of high-pressure phases. Earth and Planetary Science Letters 184: 37–55.
145
Langenhorst F., Poirier J.-P., Deutsch A., and Hornemann U. 2002. Experimental approach to generate shock veins in single crystal olivine by shear melting. Meteoritics & Planetary Science 37: 1541–1553.
Larsen A., and Von Dreele R. 1994. GSAS, General Structure Analysis System. LANSCE, MS-H805, Los Alamos National Laboratory, Los Alamos, NM.
Lindsay F., Herzog G., Park J., Turrin B., Delaney J., and Swisher C. 2015. Chelyabinsk Ar-Ar ages - a young heterogeneous LL5 chondrite (abstract #2226). 46th Lunar and Planetary Science Conference.
Liu L. 1975. Post-oxide phases of forsterite and enstatite. Geophysical Research Letters 2: 417–419.
Liu L. 1978. High-pressure phase transformations of albite, jadeite and nepheline. Earth and Planetary Science Letters 37: 438–444.
Lockridge J. A. (2015) Using micro-scale observations to understand large-scale geophysical phenomena: Examples form seismology and mineral physics. Ph.D. thesis, Arizona State University, Tempe AZ. USA. 143 pp.
Ma C., Tschauner O., Beckett J. R., Liu Y., Rossman G. R., Sinogeikin S. V., Smith J. S., and Taylor L. A. 2016. Ahrensite, γ-Fe2SiO4, a new shock-metamorphic mineral from the Tissint meteorite: Implications for the Tissint shock event on Mars. Geochimica et Cosmochimica Acta 184: 240–256.
Manghnani M. H., Vijayakumar V., and Bass J. D. 1998. High-Pressure Raman Scattering Study of Majorite-Garnet Solid Solutions in the System Mg4Si4O12—Mg3Al2Si3O12. In Properties of Earth and Planetary Materials at High Pressure and Temperature, edited by H.nghnani M., and Yagi T. American Geophysical Union. pp. 129–137
Marti K., and Graf T. 1992. Cosmic-ray exposure history of ordinary chondrites. Annual Review of Earth and Planetary Sciences 20: 221–243.
McConville P., Kelley S., and Turner G. 1988. Laser probe 40Ar-39Ar studies of the Peace River shocked L6 chondrite. Geochimica et Cosmochimica Acta 52: 2487–2499.
McMillan P. F. 1989. Raman spectroscopy in mineralogy and geochemistry. Annual Review of Earth and Planetary Sciences 17: 255.
Melosh H. J. 1989. Impact cratering: A geologic process. Oxford University Press. 253 p.
Melosh H. J., Ryan E. V., and Asphaug E. 1992. Dynamic fragmentation in impacts: Hydrocode simulation of laboratory impacts. Journal of Geophysical Research: Planets 97: 14735–14759.
146
Michael G. G., and Neukum G. 2010. Planetary surface dating from crater size–frequency distribution measurements: Partial resurfacing events and statistical age uncertainty. Earth and Planetary Science Letters 294: 223–229.
Miyahara M., Ohtani E., Kimura M., El Goresy A., Ozawa S., Nagase T., Nishijima M., and Hiraga K. 2010. Coherent and subsequent incoherent ringwoodite growth in olivine of shocked L6 chondrites. Earth and Planetary Science Letters 295: 321–327.
Miyahara M., Ohtani E., Kimura M., Ozawa S., Nagase T., Nishijima M., and Hiraga K. 2011. Evidence for multiple dynamic events and subsequent decompression stage recorded in a shock vein. Earth and Planetary Science Letters 307: 361–368.
Miyahara M., Ohtani E., Ozawa S., Kimura M., El Goresy A., Sakai T., Nagase T., Hiraga K., Hirao N., and Ohishi Y. 2011. Natural dissociation of olivine to (Mg,Fe)SiO3 perovskite and magnesiowüstite in a shocked Martian meteorite. Proceedings of the National Academy of Sciences 108: 5999–6003.
Miyahara M., El Goresy A., Ohtani E., Kimura M., Ozawa S., Nagase T., and Nishijima M. 2009. Fractional crystallization of olivine melt inclusion in shock-induced chondritic melt vein. Physics of The Earth and Planetary Interiors 177: 116–121.
Moser D. E., Chamberlain K. R., Tait K. T., Schmitt A. K., Darling J. R., Barker I. R., and Hyde B. C. 2013. Solving the Martian meteorite age conundrum using micro-baddeleyite and launch-generated zircon. Nature 499: 454–457.
Nakamura T., Tomeoka K., Takaoka N., Sekine T., and Takeda H. 2000. Impact-Induced Textural Changes of CV Carbonaceous Chondrites: Experimental Reproduction. Icarus 146: 289–300.
Navrotsky A. 1994. Physics and chemistry of earth materials, Cambridge University Press, Cambridge.
Ohtani E., Kimura Y., Kimura M., Takata T., Kondo T., and Kubo T. 2004. Formation of high-pressure minerals in shocked L6 chondrite Yamato 791384: constraints on shock conditions and parent body size. Earth and Planetary Science Letters 227: 505–515.
Ohtani E., Kagawa N., and Fujino K. 1991. Stability of majorite (Mg, Fe)SiO3 at high pressures and 1800°C. Earth and Planetary Science Letters 102: 158–166.
Ohtani E., Nagata Y., Suzuki A., and Kato T. 1995. Melting relations of peridotite and the density crossover in planetary mantles. Chemical Geology 120: 207–221.
Osako M., Ito E., and Yoneda A. 2004. Simultaneous measurements of thermal conductivity and thermal diffusivity for garnet and olivine under high pressure. Physics of the Earth and Planetary Interiors 143–144: 311–320.
147
Ostertag R. 1983. Shock experiments on feldspar crystals. Journal of Geophysical Research: Solid Earth 88: B364–B376.
Ozawa S., Miyahara M., Ohtani E., Koroleva O. N., Ito Y., Litasov K. D., and Pokhilenko N. P. 2014. Jadeite in Chelyabinsk meteorite and the nature of an impact event on its parent body. Scientific Reports 4: 1-5.
Ozawa S., Ohtani E., Miyahara M., Suzuki A., Kimura M., and Ito Y. 2009. Transformation textures, mechanisms of formation of high-pressure minerals in shock melt veins of L6 chondrites, and pressure-temperature conditions of the shock events. Meteoritics & Planetary Science 44: 1771–1786.
Price G. D., Putnis A., and Smith D. G. W. 1982. A spinel to β-phase transformation mechanism in (Mg,Fe)2SiO4. Nature 296: 729–731.
Price G. D. 1983. The nature and significance of stacking faults in wadsleyite, natural β-(Mg, Fe)2SiO4 from the Peace River meteorite. Physics of the Earth and Planetary Interiors 33: 137–147.
Putnis A., and Price G. D. 1979. High-pressure (Mg, Fe)2SiO4 phases in the Tenham chondritic meteorite. Nature 280: 217–218.
Reimold W. U., and Stöffler D. 1978. Experimental shock metamorphism of dunite. In Proceedings of Lunar and Planetary Science Conference. pp. 2805–2824
Reynard B., Takir F., Guyot F., Gwanmesia G., Liebermann R., and Gillet P. 1996. High-temperature Raman spectroscopic and X-ray diffraction study of beta-Mg2SiO4: insights into its high-temperature thermodynamic properties and the beta-to alpha-phase-transformation mechanism and kinetics. American Mineralogist 81: 585–594.
Righter K., Abell P., Agresti D., Berger E., Burton A., Delaney J., Fries M., Gibson E., Harrington R., and Herzog G. 2015. Mineralogy, petrology, chronology, and exposure history of the Chelyabinsk meteorite and parent body (abstract #2686). 46th Lunar and Planetary Science Conference.
Rubie D. C., and Thompson A. B. 1985. Kinetics of Metamorphic Reactions at Elevated Temperatures and Pressures: An Appraisal of Available Experimental Data. In Metamorphic Reactions, edited by Thompson A. B., and Rubie D. C. Springer New York. pp. 27–79
Sharp T. G., Lingemann C. M., Dupas C., and Stöffler D. 1997. Natural occurrence of MgSiO3-ilmenite and evidence for MgSiO3-perovskite in a shocked L chondrite. Science 277: 352–355.
148
Sharp T. G., and DeCarli P. S. 2006. Shock effects in meteorites. In Meteorites and the early solar system II, edited by Lauretta D. S. and McSween H. Y. University of Arizona Press. pp. 653–677.
Sharp T. G., Lingemann C. M., Dupas C., and Stöffler D. 1997. Natural occurrence of MgSiO3-ilmenite and evidence for MgSiO3-perovskite in a shocked l chondrite. Science 277: 352–355.
Sharp T. G., Xie Z., DeCarli P. S., and Hu J. 2015. A large shock vein in L chondrite Roosevelt County 106: Evidence for a long-duration shock pulse on the L chondrite parent body. Meteoritics & Planetary Science 50: 1941–1953.
Shaw C. S. J., and Walton E. 2013. Thermal modeling of shock melts in Martian meteorites: Implications for preserving Martian atmospheric signatures and crystallization of high-pressure minerals from shock melts. Meteoritics & Planetary Science 48: 758–770.
Smith J. V., and Mason B. 1970. Pyroxene-Garnet Transformation in Coorara Meteorite. Science 168: 832–833.
Snee L. W., and Ahrens T. J. 1975. Shock-induced deformation features in terrestrial peridot and lunar dunite. In Proceedings of Lunar and Planetary Science Conference 6th. pp. 833–842.
Spray J. G. 1995. Pseudotachylyte controversy: Fact or friction? Geology 23: 1119–1122.
Spray J. G. 1998. Localized shock- and friction-induced melting in response to hypervelocity impact. Geological Society, London, Special Publications 140: 195–204.
Stöffler D. 1974. Deformation and transformation of rock-forming minerals by natural and experimental shock processes: II. Physical properties of shocked minerals. Fortschritte der Mineralogie 51: 256–289.
Stöffler D., Keil K., and Scott E. R. D. 1991. Shock metamorphism of ordinary chondrites. Geochimica et Cosmochimica Acta 55: 3845–3867.
Suzuki I., Ohtani E., and Kumazawa M. 1980. Thermal expansion of modified spinel, β-Mg2SiO4. Journal of Physics of the Earth 28: 273–280.
Swindle T. D., Kring D. A., and Weirich J. R. 2014. 40Ar/39Ar ages of impacts involving ordinary chondrite meteorites. Geological Society, London, Special Publications 378: 333–347.
Thiéblot L., Roux J., and Richet P. 1998. High-temperature thermal expansion and decomposition of garnets. European Journal of Mineralogy 10: 7–16.
149
Toby B. H. 2001. EXPGUI, a graphical user interface for GSAS. Journal of Applied Crystallography 34: 210–213.
Tomioka N., and Fujino K. 1997. Natural (Mg,Fe)SiO3-ilmenite and -perovskite in the Tenham meteorite. Science 277: 1084–1086.
Tomioka N., Mori H., and Fujino K. 2000. Shock-induced transition of NaAlSi3O8 feldspar into a hollandite structure in a L6 chondrite. Geophysical Research Letters 27: 3997–4000.
Tomioka N., and Fujino K. 1997. Natural (Mg,Fe)SiO3-ilmenite and -perovskite in the Tenham meteorite. Science 277: 1084–1086.
Tschauner O., Asimow P. D., Kostandova N., Ahrens T. J., Ma C., Sinogeikin S., Liu Z., Fakra S., and Tamura N. 2009. Ultrafast growth of wadsleyite in shock-produced melts and its implications for early solar system impact processes. Proceedings of the National Academy of Sciences 106: 13691–13695.
Tschauner O., Ma C., Beckett J. R., Prescher C., Prakapenka V. B., and Rossman G. R. 2014. Discovery of bridgmanite, the most abundant mineral in Earth, in a shocked meteorite. Science 346: 1100–1102.
Turner G. 1969. Thermal histories of meteorites by the 39Ar-40Ar method. In Meteorite Research, edited by Millman P. M. Springer Netherlands. pp. 407–417
van der Bogert C. H., Schultz P. H., and Spray J. G. 2003. Impact-induced frictional melting in ordinary chondrites: A mechanism for deformation, darkening, and vein formation. Meteoritics & Planetary Science 38: 1521–1531.
Walsh J. M., and Christian R. H. 1955. Equation of state of metals from shock wave measurements. Physical Review 97: 1544–1556.
Walton E. L. 2013. Shock metamorphism of Elephant Moraine A79001: Implications for olivine–ringwoodite transformation and the complex thermal history of heavily shocked Martian meteorites. Geochimica et Cosmochimica Acta 107: 299–315.
Walton E. L., Sharp T. G., Hu J., and Filiberto J. 2014. Heterogeneous mineral assemblages in martian meteorite Tissint as a result of a recent small impact event on Mars. Geochimica et Cosmochimica Acta 140: 334–348.
Wilkison S. L., McCoy T. J., McCamant J. E., Robinson M. S., and Britt D. T. 2003. Porosity and density of ordinary chondrites: Clues to the formation of friable and porous ordinary chondrites. Meteoritics & Planetary Science 38: 1533–1546.
Wilkison S. L., and Robinson M. S. 2000. Bulk density of ordinary chondrite meteorites and implications for asteroidal internal structure. Meteoritics & Planetary Science 35: 1203–1213.
150
Weirich J. R., Swindle T. D., and Isachsen C. E. 2012. 40Ar-39Ar age of Northwest Africa 091: More evidence for a link between L chondrites and fossil meteorites. Meteoritics & Planetary Science 47: 1324–1335.
Wlotzka F. 1991. Meteoritical Bulletin, No. 71. Meteoritics 26.
Wlotzka F. 1993. Meteoritical Bulletin, No. 75. Meteoritics 28: 692.
Xie X., Minitti M. E., Chen M., Mao H.-K., Wang D., Shu J., and Fei Y. 2002. Natural high-pressure polymorph of merrillite in the shock veins of the Suizhou meteorite. Geochimica et Cosmochimica Acta 66: 2439–2444.
Xie X., Minitti M. E., Chen M., Mao H.-K., Wang D., Shu J., and Fei Y. 2003. Tuite, γ-Ca3(PO4)2 a new mineral from the Suizhou L6 chondrite. European Journal of Mineralogy 15: 1001–1005.
Xie X., Zhai S., Chen M., and Yang H. 2013. Tuite, γ-Ca3(PO4)2, formed by chlorapatite decomposition in a shock vein of the Suizhou L6 chondrite. Meteoritics & Planetary Science 48: 1515–1523.
Xie Z., and Sharp T. G. 2004. High-pressure phases in shock-induced melt veins of the Umbarger L6 chondrite: Constraints of shock pressure. Meteoritics & Planetary Science 39: 2043–2054.
Xie Z., and Sharp T. G. 2007. Host rock solid-state transformation in a shock-induced melt vein of Tenham L6 chondrite. Earth and Planetary Science Letters 254: 433–445.
Xie Z., Sharp T. G., and DeCarli P. S. 2006a. High-pressure phases in a shock-induced melt vein of the Tenham L6 chondrite: Constraints on shock pressure and duration. Geochimica et Cosmochimica Acta 70: 504–515.
Xie Z., Sharp T. G., and DeCarli P. S. 2006b. Estimating shock pressures based on high-pressure minerals in shock-induced melt veins of L chondrites. Meteoritics & Planetary Science 41: 1883–1898.
Xie Z., Tomioka N., and Sharp T. G. 2002. Natural occurrence of Fe2SiO4-spinel in the shocked Umbarger L6 chondrite. American Mineralogist 87: 1257–1260.
Ye Y., Brown D. A., Smyth J. R., Panero W. R., Jacobsen S. D., Chang Y.-Y., Townsend J. P., Thomas S.-M., Hauri E. H., Dera P., and Frost D. J. 2012. Compressibility and thermal expansion of hydrous ringwoodite with 2.5(3) wt% H2O. American Mineralogist 97: 573–582.
Zhang J., and Herzberg C. 1994. Melting experiments on anhydrous peridotite KLB-1 from 5.0 to 22.5 GPa. Journal of Geophysical Research: Solid Earth 99: 17729–17742.


![of Ordinary Chondrites - CaltechAUTHORSauthors.library.caltech.edu/51511/1/jgr4710.pdf · teorites by Noddack and Noddack [1930] and also by Goldschmidt and Peters [1932], but the](https://img.pdfslide.us/doc/110x75/5ba0903609d3f2fb538cc115/of-ordinary-chondrites-c-teorites-by-noddack-and-noddack-1930-and-also-by.jpg)