Embed Size (px)
Citation preview

///
(_ASA-CH-180_14) SHO_2 FA_IGC_ C_ACKEEI_IVIO_ IS HCI¢_ 2024-_ JIU_IbU_.__£C/_E_ c Final HeFo_t (ache- _ _e_kins
Univ.) 346 p Avail: B_I5 EC JIS/HF A01CSCI 20K G3/39
N87-2£3£4
https://ntrs.nasa.gov/search.jsp?R=19870016931 2018-06-07T18:48:18+00:00Z

ABSTRACT
Single-edge, semi-circular notched specimens of A1
2024-T3, 2.3 mm thick, were cyclicly loaded at R-ratios of 0.5,
0.0, -I.0, and -2.0, as part of an AGARD-sponsored, round-robin
test program. The notch roots were periodically inspected using
a replica technique which duplicates the bore surface. The
replicas were examined under an optical microscope to determine
the initiation of very short cracks and to monitor the growth
of short cracks ranging in length from a few tens of microns to
the specimen thickness.
In addition to short crack growth measurement, the crack
opening displacement (COD) was measured for surface cracks as
short as 0.035 n_ and for through-thickness cracks using the
Interferometric Strain/Displacement Gage (ISDG), a laser-based
optical technique. Two very small indentations were placed
across the short crack and illuminated with a laser. This
formed interference fringe patterns which could be monitored to
measure the relative displacement between the two indentations.
The resulting load-COD data were then analyzed to determine the
closure load.
Cracks initiated mostly at the inclusion particles, and
the initiation cycles were in reasonably good agreement with
values predicted from the Manson-Coffin relation. The growth
rates of short cracks were faster than the long crack growth
rates for R-ratios of -i.0 and -2.0. No significant difference
ii

\
between short and long crack growth rates was observed for R =
0.0. Short cracks had slower growth rates than long cracks for
R= 0.5.
The crack compliances show a linear relationship to the
surface crack length, without regard to R-ratio or applied
stress level. The crack opening stresses measured for short
cracks were smaller than those predicted for large cracks, with
little difference appearing for positive R-ratios and large
differences noted for negative R-ratios.
A considerable improvement in agreement of long and short
crack growth rates was achieved for negative R-ratios when the
closure effect was considered.
iii

TABLEOF CONTENTS
ABSTACT ii
TABLEOFCONTENTS iv
LIST OFTABLES vii
LIST OFFIGURES viii
I. Introduction 1
II. Background 7
-i. Definition of small crack 7
-2. Initiation and growth of small fatigue cracks 9
-3. Crack closure and its effect on the growth ofsmall fatigue cracks 15
-4. Measurementtechniques for closure insmall cracks 19
III. Experimental procedure 23
-i. Materials and specimens 23
-2. Specimen fixtures 24
-3. Test schedule and loading procedures 30
-4. Crack length measurement 33
-5. Closure measurement 35
IV. Results and discussion 40
-i. Analysis of replicas 45
-2. Crack initiation analysis 50
-3. Crack shape 59
-4. Crack growth rate results and discussion 64
iv

-5. Crack closure results and discussion 74
A. Results of CODmeasurement 76B. Comparisonof compliances for crack lengths 82
C. Effect of crack length on crack closure load 86
D. Effect of R-ratios on crack closure levels 90
-6 Crack closure effect on crack growth rates 95
V. Conclusions i01
VI. References 103
Appendix I. 108
A. Stress intensity factor calculation 108
B. Replica method 112
C. Stress-strain analysis of the notch 114
D. Alignment of grips and checks 118
E. Test and data acquisition program lists 125
Appendix II.
A. Test data of specimen number A-54-04
B. Test data of speclmen number A-65-07
C. Test data of speclmen number A-71-05
D. Test data of speclmen number A-68-22
E. Test data of speclmen number A-84-03
F. Test data of speclmen number A-59-13
G. Test data of speclmen number A-52-03
144
145
153
168
179
187
192
199
v
H. Test data of speclmennumberA-51-16
I. Test data of speclmennumberA-82-16
J. Test data of speclmennumberA-59-30
K. Test data of speclmennumberA-57-14
L. Test data of speclmennumberA-80-28
M. Test data of speclmennumberA-55-27
N. Test data of speclmennumberA-67-08
O. Test data of speclmennumberA-65-24
P. Test data of speclmennumberA-72-07
Q. Test data of speclmennumberA-55-08
R. Test data of speclmennumberA-83-23
S. Test data of speclmen number A-52-21
T. Test data of speclmen number A-74-20
U. Test data of speclmen number A-75-16
V. Test data of speclmen number A-84-20
W. Test data of speclmen number A-80-11
X. Test data of speclmen number A-68-05
211
218
228
229
237
244
251
258
268
272
281
288
297
299
312
318
324
vi

TABLES
III-I. Test Schedule
IV-I
IV-2
IV-3
IV-4
IV-5
IV-6
IV-7
IV-8
C-I.
C-2.
D-I.
Summaryof Test Results
Test Results of Crack Initiation
Dimensions of Small Cracks
Dimensions of Through-thickness Cracks
Typical Crack Growth Data
Results of Closure Load and Compliance Measurements
Comparisonof Pop/Pmaxfor Short and Long Cracks
Comparisonof Effective Stress RangeRatio
Stress Concentration Around the Notch
Estimated Notch Plastic Zone
Strain Measurementfor Alignment Check
vii
FIGURES
II-I. Typical load-displacement plot used to determine crackopening point.
III-i. Dimensions of specimenwith a single-edge notch.
111-2. Micrograph of typical grain structures in AI 2024-T3material.
111-3. Specimen fixtures and sketch of set-up.
111-4. Design of specimengrip set.
111-5. Guide plate for compressive loads.
111-6. Typical micrograph of indentations across a crack.
111-7. Notch root sprayed with black paint, except in crackarea, to prevent spurious reflection of laser beam.
111-8. Reduceddata method from a load-CODcurve.
IV-I. SEMmicrograph showing fracture surface of specimenA-84-03.
IV-2. Typical crack map(traced).
IV-3. Micrograph showing example of crack initiation atinclusions.
IV-4. Crack initiation life comparedwith value predicted byManson-Coffin relationship.
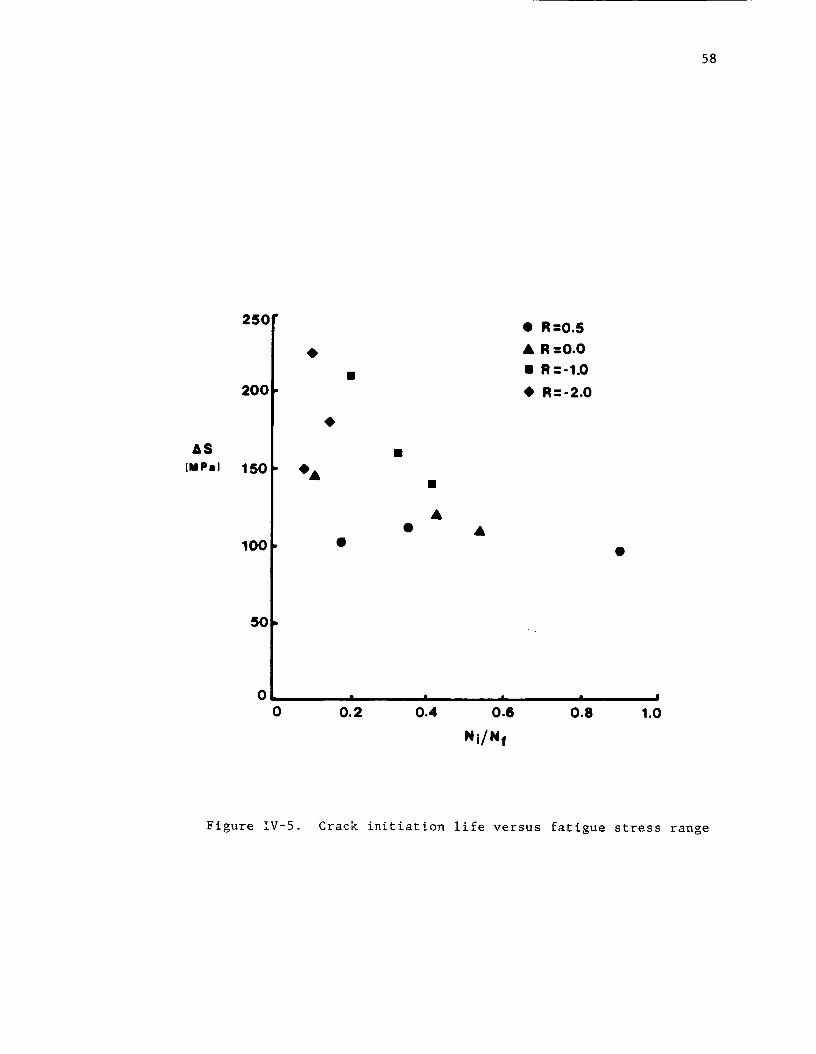
IV-5. Crack initiation life versus fatigue stress range.
IV-6. Typical crack shape for short cracks observed in thisstudy.
IV-7. Typical through-thickness crack.
IV-8. Plot of da/dN - AK for R = 0.5.
IV-9. Plot of da/dN - AK for R = 0.0.
IV-IO. Plot of da/dN - AK for R = -i.0.
IV-II. Plot of da/dN - AK for R = -2.0.
IV-12. Typical COD-loadplot for R = 0.5.
IV-13. Typical COD-loadplot for R = 0.0.
viii
IV-14. Typical COD-loadplot for R = -i.0.
IV-15. Typical COD-loadplot for R = -2.0.
IV-16. Plot of COD-load,enlarged scale.
IV-17. Short crack compliances - surface crack length forsemi-elliptical surface crack.
IV-18. Crack compliances - crack length for through-thicknesscrack.
IV-19. Crack opening load ratio - crack length.
IV-20. Crack opening load - R-ratio for short cracks.
IV-21. Plot of da/dN - AKeff for R = 0.0.
IV-22. Plot of da/dN - AKeff for R = -i.0.
IV-23. Plot of da/dN - AKeff for R = -2.0.
A-l.
C-1.
D-I.
D-2.
Definition of dimensions for surface and corner cracks
at a notch in a finite plate.
Displacement measurement at the notch root using ISDG.
Strain-gaged specimen used to check alignment.
Plot of bending strain measurement.
ix

I. INTRODUCTION
Fatigue has been studied in order to predict the exact
life of engineering structures and components. The fatigue life
can be categorized into three periods: microcrack initiation,
propagation of the microcrack to detectable size, and
macroscopic propagation. From an engineering point of view, the
first two periods are generally classified together as a period
of engineering-size crack initiation.
The total fatigue life, in an engineering sense, can be
measured by the number of crack initiation cycles and the
number of propagation cycles until final failure. The
initiation cycles can account for a large portion of the
fatigue life of many engineering materials, especially for
commercial aluminum alloys, where initiation cycles may
constitute up to 90% of the fatigue life [1,2]. This fact alone
addresses the importance of studying the behavior of
initiation-related small crack problems.
Considerable emphasis has been placed on the study of
small crack problems in recent years, not only because small
crack behavior determines the fatigue life of many engineering
materials but also because the growth rates of small cracks
differ from the predictions of conventional linear elastic
fracture mechanics (LEFM). In LEFM, crack growth rates depend
only upon the value of the stress intensity factor range, AK,
when the plastic zone is small with respect to all other length

dimensions and provided plane strain conditions are met. But
small cracks usually appear on the surface of the specimen;
this violates the condition of plane strain. Also, small cracks
are not long enough to satisfy the plastic zone condition. The
maximumplastic zone, rmax, can be estimated using the maximum
stress intensity factor, Kmax, based on Irwin's relation,
i Kmax 2rmax = -2_ {--}oo
(1.1)
where °o is the flow stress, which is taken as an average value
of the yield stress, Oy , and the ultimate strength, Ou" Even a
crack that is short in the engineering sense can be analyzed
based on LEFM if it is long enough with respect to the size of
the plastic zone. Small cracks can be categorized in regard to
these considerations in the following manner.
(a) Small cracks which are not long enough for
continuum mechanics and LEFM to apply are called
microcracks.
(b) Small cracks which are long enough to use LEFM
are called physically short cracks, or simply short
cracks here. Typically these cracks are 0.5 - 2 mm
long.
A typical value of rma x for the specimen used in this study, A1
2024- T3, is approximately 0.05 mm, with Kma x = 8 MPa and _o =
427 MPa.
Many researchers [1,3-12] have observed that small cracks
show faster growth rates than those predicted from long crack
data. But for some materials in some experiments [13,14], no
appreciable difference between the growth rates of small and

long cracks has been observed. Also, the growth behavior of
microcracks is influenced by microstructural features such as
grain orientation and grain boundaries, limiting the usefulness
of a continuum mechanics approach. Several investigators
[4,5,15-20] showedthat propagation of microcracks was retarded
or even halted as a crack front reached a grain boundary.
Manyattempts have been madeto analyze small crack
behavior by modifying the concept of LEFM.Several researchers
[21-26] have proposed that the difference in fatigue growth
behavior of the long and the short crack is mainly due to the
closure effect. Whenthe crack opening stress, _p , is higher
than the minimumstress, _in ' the effective stress intensity
range, A_ff , will be
AKeff = Smax - Sop AK
Smax- Stain
(1.2)
If a smaller opening stress is observed in fatigue growth, the
effective crack driving force, A_ff, will be larger than the
driving force with a larger opening stress, and faster crack
growth is expected.
Considering that most cracks emanate from notches in the
specimens, the local plasticity due to a notch must be
accounted for in an analysis of small crack behavior. Notch
plasticity due to applied tensile load will induce a
compressive residual stress, _rs , at the notch root. Then the
local effective stress intensity factor range, A Keff,local ,
will be reduced by the amountof _rs from AKeff when there is
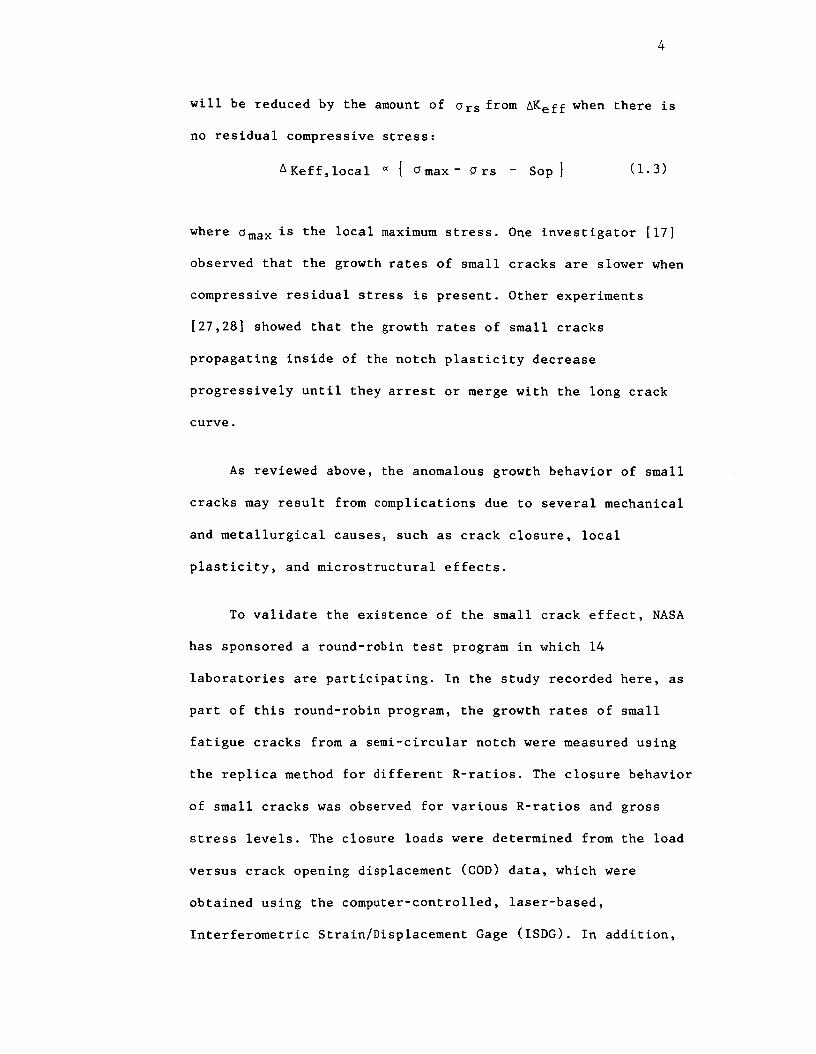
no residual compressive stress:
AKeff,local = { _max- _rs - Sop I (1.3)
where _maxis the local maximumstress. One investigator [17]
observed that the growth rates of small cracks are slower when
compressive residual stress is present. Other experiments
[27,28] showed that the growth rates of small cracks
propagating inside of the notch plasticity decrease
progressively until they arrest or merge with the long crack
curve.
As reviewed above, the anomalous growth behavior of small
cracks may result from complications due to several mechanical
and metallurgical causes, such as crack closure, local
plasticity, and microstructural effects.
To validate the existence of the small crack effect, NASA
has sponsored a round-robin test program in which 14
laboratories are participating. In the study recorded here, as
part of this round-robin program, the growth rates of small
fatigue cracks from a semi-circular notch were measuredusing
the replica method for different R-ratios. The closure behavior
of small cracks was observed for various R-ratios and gross
stress levels. The closure loads were determined from the load
versus crack opening displacement (COD)data, which were
obtained using the computer-controlled, laser-based,
Interferometric Strain/Displacement Gage (ISDG). In addition,

crack initiation was analyzed and the closure effect on the
growth rate was examined.
In this thesis, the definition of "small crack" as it is
presented in other works will be reviewed. Various phenomenaof
small cracks, such as the microstructural effect, differences
in the growth behaviors of small and long cracks, the notch
plasticity effect, and the closure effect will be discussed as
they have been documentedin other investigations. Also, the
small crack closure measurementtechniques described in Section
II, Background, will be examined. In Section III, Experimental
Procedure, material properties and specimen geometry will be
introduced. This section also contains a description of special
fixtures which allow accurate specimenalignment and
application of the load without any bending effects. A further
explanation of the experiment includes details of the loading
conditions, measurementprocedures used to observe crack growth
behavior, and measurementof the crack closure with the ISDG
technique.
The results of the crack growth measurements, including an
analysis of crack initiation and crack shape as well as a
discussion of the changes in short crack growth behavior in the
notch relative to changing R-ratios, will be presented in
Section IV, Results and Discussion. Results of CODmeasurement
will be given and the crack compliances obtained from the
COD-loadcurve will be discussed as a function of crack length.
Since crack closure is knownto be an important factor in the

6
growth behavior of short cracks, the effects of crack length
and R-ratio on crack closure will be examined. Finally, the
effect of closure on the crack growth rate will be discussed.
In Appendix I, the equation used in calculating the stress
intensity factor for short cracks on the notch root and
detailed procedures for replicating the surface of the notch
root will be described. Measurementof notch displacement using
the ISDGand the analysis of notch stress-strain from these
measurementswill also be presented. The procedure for aligning
specimens and fixtures on the test machine will be described,
and the check data using a stain-gaged specimen to confirm the
alignment will be presented. In addition, representative
computer programs are listed which maybe used for measuring
CODwith the ISDGtechnique, for determining the opening loads,
and for calculating and plotting data on the growth rate -
stress intensity factor range.
All data resulting from each test, including a listing of
test conditions, drawings of crack maps, a plot of the growth
rate - stress intensity factor range, and the micrograph of the
fracture surface, are attached in-Appendix II.

7
II. BACKGROUND
II-i. Definition of Small Crack
Taylor and Knott [4] defined a crack as "small" when the
crack length is less than a certain critical length. In their
experiments with a cast nickel-aluminum-bronze material, which
had a very coarse microstructure (grain size = i00 microns),
cracks larger than 300_m were observed to have the same
propagation characteristics as long cracks. They also observed
that the critical crack length for small crack behavior was
correlated with the scale of the microstructure.
Lankford [5] hypothesized that the rapid average growth of
small cracks might be a consequenceof the large size of the
crack tip plastic zone relative to that of the crack itself. He
examined the relationship between the ratio of the plastic zone
size to the crack length in order to deduce the criteria for
the microcrack behavior, a faster growth rate than that of the
long crack. However, he did not find a clear relationship
between this ratio and the microcrack behavior.
Suresh and Ritchie [29] defined short cracks in the
following way: either i) the length of the crack is small
comparedto relevant microstructural dimensions, 2) the length
is small comparedto the scale of local plasticity, or 3) the
crack is simply physically small. The first category limits the
usefulness of continuum mechanics; the second group limits the

use of LEFMin the analysis of their behavior; and the third
category represents only the size of the crack length, i.e.,
typically smaller than 0.5-1 mm.
The short cracks which are divided into these three
categories have been shownto propagate more quickly than
corresponding long cracks under the samenominal driving force.
But Leis and Forte [14] showedthat even physically long
cracks, i.e., as large as 2.5 mmin the aluminum alloys and
1.25 cm in steel, also exhibit different growth behavior
comparedto longer-crack trends.
These facts indicate that the cracks are to be called
small (or short) when their behavior is shownto be different
from the behavior predicted by long crack data (or LEFM
analysis). But a definition can not be madesimply by using an
arbitrary value as the standard. Small crack behavior depends
on the material, the geometry of the specimen, and the test
environment.
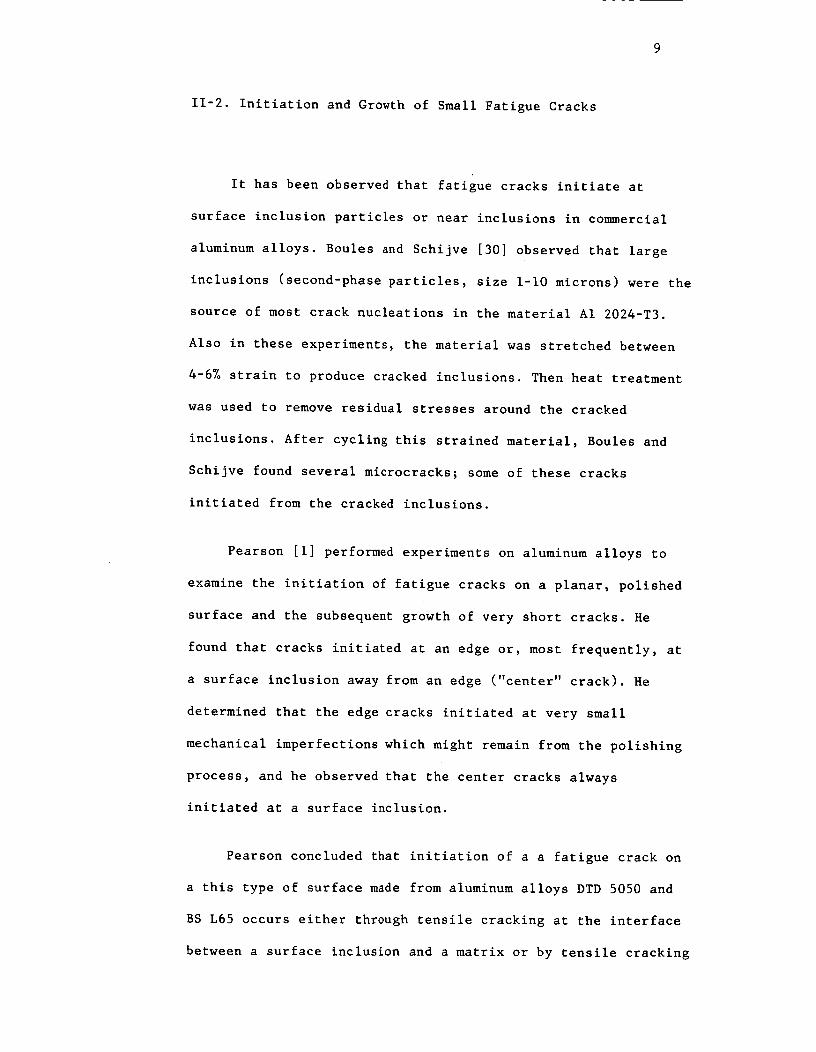
11-2. Initiation and Growth of Small Fatigue Cracks
It has been observed that fatigue cracks initiate at
surface inclusion particles or near inclusions in commercial
aluminum alloys. Boules and Schijve [30] observed that large
inclusions (second-phase particles, size i-I0 microns) were the
source of most crack nucleations in the material AI 2024-T3.
Also in these experiments, the material was stretched between
4-6% strain to produce cracked inclusions. Then heat treatment
was used to remove residual stresses around the cracked
inclusions. After cycling this strained material, Boules and
Schijve found several microcracks; someof these cracks
initiated from the cracked inclusions.
Pearson [I] performed experiments on aluminum alloys to
examine the initiation of fatigue cracks on a planar, polished
surface and the subsequent growth of very short cracks. He
found that cracks initiated at an edge or, most frequently, at
a surface inclusion away from an edge ("center" crack). He
determined that the edge cracks initiated at very small
mechanical imperfections which might remain from the polishing
process, and he observed that the center cracks always
initiated at a surface inclusion.
Pearson concluded that initiation of a a fatigue crack on
a this type of surface madefrom aluminum alloys DTD5050 and
BS L65 occurs either through tensile cracking at the interface
between a surface inclusion and a matrix or by tensile cracking

i0
of the particles themselves. Also, he saw that the crack front
of a short center crack wasappoximately semi-circular in
shape. The meancrack growth rate in the early stages of growth
was observed to be muchfaster than those predicted from long
crack data, and the crack propagation curve tended towrds that
for the long crack whenthe crack depth was greater than 0.127
Swain and Newman[31] experimented on AI 2024-T3 sheets
with double edge notches to study the initiation and growth of
small cracks (5-500 microns). They noted that cracks initiated
either at inclusion clusters or at one or both notches along
the bore of the notch rather than at the corner. The inclusion
particles were fragmented and formed clusters during the
rolling process. The data showedthat small cracks grow at
stress intensity factor ranges substantially less than the
threshold stress intensity factor range obtained from large
cracks.
A number of recent studies have demonstrated that small
cracks behave differently than large cracks. This appears to be
the case when small cracks are analyzed using the concepts of
conventional fracture mechanics. Pearson [i], Swain and Newman
[31], Leis and Forte [14], de los Rios et al [19], Saxenaet al
[8], Lankford [5], Taylor and Knott [4], Tanaka [26], and Brent
et al [22] showed for various materials that the small crack
grows faster than the long crack, based on the parameters of
LEFM.The researchers observed that the small crack grows

ii
faster especially below the long crack fatigue threshold stress
intensity factor range. But in the experiments of Leis and
Forte [14], short cracks grew faster than long cracks in tests
above the long crack fatigue threshold values; even crack
lengths greater than 2.5 mmin aluminum alloys were observed to
grow in a manner similar to that of physically short cracks.
Leis and Forte also noted that there was no apparent
anomalousbehavior in the initial growth rates of physically
short fatigue cracks which initiated from notches. They
attributed this similarity in behavior between physically short
and long cracks to notch plasticity, which may lead to a
constant or decreasing driving force for crack growth until the
crack nears the elastic-plastic boundary of the notch field.
Other investigators have suggested that anomalous small-crack
behavior at notches might be very different from behavior for
smooth specimens if notch plasticity was developed.
Leis and Galliher [32] observed crack growth behavior for
cracks as small as 25 microns emanating from circular notches
in AI 2024-T351 specimens. They found that the corner cracks
began with a fast growth rate, then slowed their growth; an
increase in the growth rate would follow, approaching the rate
of the long crack, whenthe cracks grew in inelastic regions of
the notches. In all cases, the trend shifting from a decreasing
to an increasing rate wasobserved to correlate with the
transition of a crack from a corner to a through crack. Leis
and Galliher considered this shift as the result of an

12
inelastic displacement-c0ntrolled notch field.
Later, Leis [33] analyzed his previous experiment [32]
using two postulates: that inelastic action due to the notch is
a major cause of the short crack effect, and that the local
value of R is controlled by both the notch field and, to some
extent, the crack length. He described crack growth in notches
in terms of three categories. The crack tip and its plastic
zone are (a)beyond the notch field, (b)beyond the inelastic
field but within the elastic field of the notch, or
(c)contained within the inelastic field of the notch. To
analyze the third group, he applied a pseudoplastic form of the
stress intensity factor,
A Kp = & _ (2.1)
where A E is the stable strain range in the material element
at the crack length of interest. This relation implies that the
crack driving force is under a displacement-controlled field.
Leis also formulated the effective pseudoplastic stress
intensity factor range:
Smax- Sop= AKp (2.2)AKp
eff Smax- Smin
Results from this analysis agreed reasonably well with
experimental data. He concluded that the local notch plasticity
and crack closure were a major cause of the so-called short
crack effect.

13
Saxenaet al [8] performed experiments on small fatigue
crack behavior at notches in an environment consisting of wet
hydrogen plus air. They examined the growth of cracks with
lengths less than 0.76 mmand observed a dependencyof growth
rate on cycling frequency in the hydrogen environment. The
small cracks grew faster than long cracks at i0 Hz; but at less
than I0 Hz, small cracks grew at a rate comparable to that of
the long cracks. Also, the trend noted earlier of a shift from
decreasing to increasing rates was shownin a plot of growth
rate versus AK for the small cracks grown faster than long
cracks. This trend did not appear to relate to the notch
plasticity.
Microstructural effects must be considered when examining
the behavior of small cracks. The behavior of microscopically
small cracks can be summarizedin terms of deceleration or
retardation of growth through interactions with microstructural
features, such as grain boundaries [4,5,15-20].
Morris et al [17] proposed a model to predict early crack
growth in the AI 2219-T851alloy as a function of both crack
length and the location of the surface crack tips relative to
the grain boundaries. Theresearchers observed that the crack
growth rate was at a minimumwhen a crack tip enters into a new
grain. In the model, the closure stress,cc c , was considered as
a function of the distance from the tip to the grain boundary:
_cc _Zo_max 2C (2.3)
14
where _max is the maximumapplied tensile stress and _ is the
distance from the crack tip to the next grain boundary.
Equation 2.3 shows that the closure.stress reaches a maximum
when a crack enters into a new grain; the equation agrees with
the crack growth behavior in the experiment conducted by
Morris' group.
In Larsen's experiment [13], which measured the growth of
small fatigue cracks in Ti-6AI-2Sm- Zr-6Mo material, he showed
that small cracks propagate faster than long cracks. Also,
interestingly, he observed that retardation of the growth rate
appeared at several points, not just at one point as other
papers have shown.

15
11-3. Crack Closure and Its Effect on the Growth of Small
Fatigue Cracks
Crack closure has been studied as an important factor in
the accurate prediction of fatigue crack growth rates. If the
opening stress, Sop (or closure stress), is higher than the
minimumapplied stress in fatigue cycling, Smin, then the
effective stress range, ASeff, is
(2.4)ASeff = Smax- Sop
The crack growth relationship will be written as follows.
amdN
- C ( AKeff )n (2.5)
where AKeff is proportional to ASeff.
Several mechanisms have been suggested for the crack
closure. They are (a)plasticity induced closure, (b)oxide
induced closure, and (c)roughness induced closure.
Plasticity induced closure, as first proposed by Elber
[34], is due to the residual tensile deformation which follows
in the wake of a fatigue crack. It is often stated [29,35] that
plasticity induced closure is operative in a dominant role
under plane stress. The plane stress implies that the plastic
zone of the crack is large while the thickness of the specimen
is small. Banerjee [36] showed that even in a thin specimen,
the stress present at low ratios of stress intensity factor to
yield stress need not be plane stress.

16
Newman [37] proposed a crack closure model based on the
plasticity induced mechanism. He modified the Dugdale model to
leave plastically deformed material in the wake of the
advancing crack tip. He showed that the crack growth law
predicted with the proposed closure model agreed quite well
with experimental data for long cracks.
Oxide induced closure is generally considered to play a
major role only in specific combinations of material and
environment. The oxide induced closure mechanism applies
particularly in situations where plasticity, the maximum stress
intensity factor, and the crack growth rate are very small
[35].
It has been suggested [38] that the roughness induced
closure mechanism is encountered in situations where the
maximum plastic zone is very small (less than the grain size).A
In such a situation, crack extention occurs through a single
slip system which creates zig-zag fracture paths, resulting in
significant mode II displacement. This mode II displacement
would be important in the development of roughness induced
closure. In this sense, roughness induced closure may be more
relevant to small fatigue cracks than to long cracks because
small cracks exhibit a limited wake of plasticity. McCarver et
al [ii] and Morris et al [39] have proposed a model which shows
the importance of roughness induced closure in small fatigue
cracks. The contribution of oxide induced closure of small
cracks remains unclear.

17
Breat et al [22] and Liaw et al [40] suggested that small
crack closure is associated with residual stress along the
crack due to cyclic loading and fracture surface roughness due
to zig-zag fracture paths. James' [23] analysis of short crack
closure focused on plasticity induced closure in the wake of
the growing crck tip. However, decreasing crack size will cause
the closure to decrease without regard to plasticity or
roughness, because a smaller crack length means decreasing the
wake around the crack tip and the contact area of fracture
surfaces.
Several investigators, including Breat et al [22], James
et al [I0], and Tanaka et al [61], observed a decrease in crack
closure as the crack length decreases. But Larsen [13] showed
in his fatigue experiment for physically short cracks in a
certain material that crack closure did not increase
consistently as the crack grew.
Many researchers have attempted to explain the difference
in growth behavior of small and long cracks using closure.
Morris [16] proposed a microstructural model to fit the
empirical closure data, suggesting that the closure stress is a
function of the distance of the crack tip from the next grain
boundary. Morris et al [17] created the growth rate model to
predict growth of microstructurally small fatigue cracks. They
showed that the crack growth was at a minimum when the crack
entered into the next grain and that the closure stress value
was at a maximum in this situation.

18
Tanaka [61] and Breat [22] measured the growth behavior of
small fatigue cracks and compared the results with long crack
data. Whenthe growth rates were plotted against the effective
stress intensity range, _eff, so that
AKeff = Kmax- Kop (2.6)
the growth rates of short and long cracks were in agreement.
Liaw [40] re-analyzed data from other experiments and
offered an explanation of small crack retardation and the
difference in growth rates comparedwith large cracks. The
explanation involved crack closure.
Leis et al [51] reviewed the problem of short fatigue
cracks. They stated that short crack problems could be ascribed
to a wide range of factors: violation of the limitations of
LEFM, incomplete implementation of LEFM,and transients due to
initiation. They also determined that phenomenological data do
not clearly indicate which factors are of consequenceand why.
This anomolousbehavior of the short crack is attributed to a
lack of mechanical and metallurgical similitude. Leis et al
concluded that the short crack effect arises primarily because
of crack tip plasticity, transients from the initiation
process, and incorrect implementation of LEFM.They also
emphasized the contribution of local closure to the short crack
effect.

19
11-4. MeasurementTechniques for Closure in Small Cracks
The techniques used in measuring the closure behavior of
long cracks -- the clip gage, the strain gage, ultrasonics, and
the potential difference technique -- generally are not
available for short cracks. Special methods must be applied in
monitoring small crack closure; these methods must provide
sufficient resolution and be easily adaptable to the shapes and
geometries of small cracks.
Morris et al [42] measuredclosure stress on surface
micro- cracks with lengths from 70 to 90 microns using scanning
electron microscopy (SEM). They measuredcrack opening
displacement with 30,000Xmagnification at each successive load
to take crack compliance data. The crack closure load was
determined from the break point in the linear relationship
between crack opening and applied stress. Jameset al [43] used
the samemethod as Morris et al [42] in measuring the closure
load for crack lengths from 600 to 1,000 microns.
Zeiken et al [44] measuredmeanclosure loads on a
through-edge crack with a length of 500 microns using a
back-face strain technique. This technique developed in another
experiment [45] determined a closure load from the point where
the resulting elastic compliance curves of load versus relative
strain deviated from linearity.

20
Breat et al [22] measuredbulk closure load on through-
edge cracks with lengths of 300 to 600 microns using a clip
gage extensometer. Crack closure was determined from a
P - (_P-_)plot where _ was selected in such a way that the
linear part of the P-_ curve above Popwas vertical.
Sharpe [41] developed a laser-based interferometric
technique; Sharpe and Lee [46] described its use in measuring
crack opening displacement. His technique has a very short gage
length (a few tens of microns) and high resolution (0.02
micron). The crack compliance data was obtained from the crack
opening displacement and closure load was determined by a
"reduced data method" which is widely used in closure
measurement.Larsen [13] applied a similar technique in
measuring the closure load on surface cracks as small as 37
microns.
Williams et al [47] developed a stereo-imaging technique
to monitor the crack tip strain field. This technique measures
displacement with an accuracy of 0.04 micron at 1,000X
magnification. It can be useful in measuring the behavior of
small cracks.
All of the preceding techniques have been used to measure
short crack closure. However, typical bulk techniques, such as
a notch-mouth clip gage or a back-face strain gage (BFS), must
be used very carefully whentaking surface measurements.

21
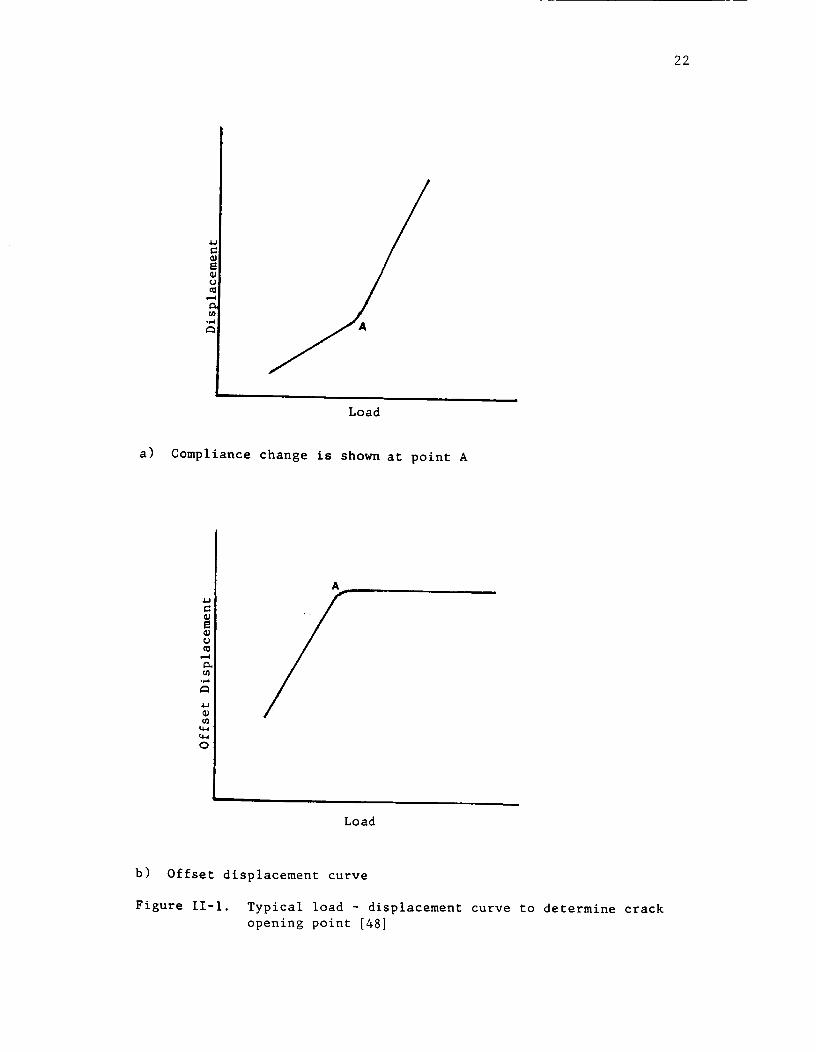
A major problem in the use of compliance methods to
determine the crack-opening point involves the exact position
of the point at which the compliance is changed, as shownin
Figure II-i. Jameset al [48] indicate that even in long-crack
measurements(10-20 mm), when using the BFS(which has about
twice the sensitivity of a notch-mouth clip gage) the change in
compliance corresponding to the critical i00 microns behind the
crack tip is only on the order of 2%for a/w = 0.4. Such a
small change is extremely difficult to detect experimentally
and the opening point is likely to be underestimated. Better
resolution in determining the crack-opening point can be
obtained by incorporating an offset elastic displacement
circuit into the compliance measurementsystem. An offset
displacement system is defined as
_" = 6 - a P (2.7)
where a is chosen such that 6' is zero once the crack is fully
open. With this method, the detectable crack length can be as
small as 50 microns.
Techniques involving a SEMor laser-based interferometry
are muchmore useful in measuring the small crack's behavior
because they can measurecrack opening displacement directly on
the crack surface. Then the sensitivity in measuring the
displacement is very high and the compliance change can be seen
more clearly than is possible by the bulk technique.
22
Load
a) Compliance change is shown at point A
4-J
=
U
4.J
o
A
Load
b) Offset displacement curve
Figure II-i. Typical load - displacement curve to determine crack
opening point [48]

III. EXPERIMENTALPROCEDURE
23
III-I. Materials and Specimens
The material used in this study was AI 2024-T3, an
aluminum alloy which is widely used in the structures of
airplanes. The stress-strain data of this material were found
for monotonic and cyclic cases as follows [49].
s = E e
s = K enl
s = K en2
for e _ el
for el_.e _ e2
for e > e2(3.1)
where s is the stress in MPaE is the elastic modulus in MPae is the strainKI and K2 are the material constants in MPanland n2are the power hardening coefficients
The following values were found for monotonic and cyclic
cases.
E K1 K2 el e2 n I n2
Monotonic 73100 1013 431 0.0047 0.006 0.2 0.032Cyclic 73100 5135 917 0.0049 0.0071 0.499 0.15
The specimens, which had a stress concentration factor of
3.17 (detailed in Appendix I-C), were supplied by NASALangley
Research Center and manufactured at Wright-Patterson Air Force
Base. The material had a yield stress of 359 MPaand an

24
ultimate strength of 496 MPa[31]. The specimenshad the single
edge-notched geometry shownin Figure III-I. They had been
chemically polished to removethe possible residual stress due
to machining. They had also been given number labels; the same
numberswere used in this study. Further preparation of the
notch surface was carried out before the tests. The notch area
was cleaned with acetone and etched with Keller's etchant for
25 seconds. Etching removeda very thin layer of material and
revealed the grain structure, as shownin Figure 111-2.
111-2. SPECIMENFIXTURES
The loading conditions in this study included
tension-tension conditions aswell as tension-compression. The
specimen fixture had to be carefully designed, and a procedure
for aligning the specimenwas developed so that the loading
could be carried out without any bending or torsional effects.
As shown in Figure 111-3, the devices include two base
fixtures and two grip sets. The base fixture was constructed
with a spherical joint, by which the parallelism of the base
fixture to the test machine table (refer to Figure 111-3) could
be adjusted, and a mechanismwhich could raise a small block to
contact with the specimenend for compressive loading. The base
fixtures used in this experiment were made for a previously

25
ORIGINAL PAGE l_
OF POOR QUALITY"
7-W-5Omm
1_Grip line
(,._r • 3.18 mm
Gri line
Thickness • B • 2.3 mm
Figure III-i. Dimension of the specimen with a single-edge notch
400X
Figure 111-2. Micrograph of typical grain structures of
AL2024-T3 material

26
_d of Test
_//_ A_O.OOOS"J
Spocer'J
( PMM A)
f
Mochine
LoodCell
r"l
I..J
Top Bose
Fixture
Specimen
Grip Set
pecimen
1
Specimen
Grip Set
[_0.OOO5"]
Sphericol Joint r-,
Bottom Bose
Fixture
Hydroulic
uotor Rod
Figure 111-3. Specimen fixtures and sketch of set up

_.L "-
_J
_j-
_°<b0
•..J C_
_J
.f
_Jt
,JW
_J
m__
©°L
/
1
r :%,
_J_J
_d k-
LC
L_
'0
0
--u.t
Ld
_] LL
bJ
c_
.i.-I
Q_
.,-I
Q_
0
_Do_.-I
!
Q_
.r4
L_

ORIGINAE PKGE I_
OF POOR QUAI/T_
3o
-%
<.LF
Ii
wm
<
u_
U_<3
J
Cx
la_
<3
_m>
5.
o
.,-_
E..4
u(u
u_
o
.,-_
!
.,,-4
_Z

TEE0O
a
_.i
E EE E
13. OJ "I" Od
...._ .... i>
', o o-- -o-o-
/ _ _<_
<,,> _
0 0 _ 0 0
_1a_
oI
W
0
EE
II
Zv,
"r"I--
0
._-I
Q;
0Cl
0U.-i
Q;,i.i
¢i
Ii--ii,--ii--I
Q;lw
°_-I
6_

30
conducted test. Only the specimen grip sets were made for this
study. Figure 111-4 shows the shape and dimensions of the grip.
Part of the grip set was aligned and fixed to the base fixture.
The other part of the grip set could be loosened to insert a
specimen. The procedure of aligning fixtures and specimens is
described in detail in Appendix I-D.
Three bolts were used at each end of the specimen to hold
the specimen in place. The plastic (PMMA) spacers were used to
prevent cracking in the gripping area.
For the compressive load tests, anti-buckling guides were
made as shown in Figure 111-5. To avoid unneccessary effects,
Las_=,ed _the guides were not = _^- _._ly during the tests.
111-3. TEST SCHEDULE AND LOADING PROCEDURES
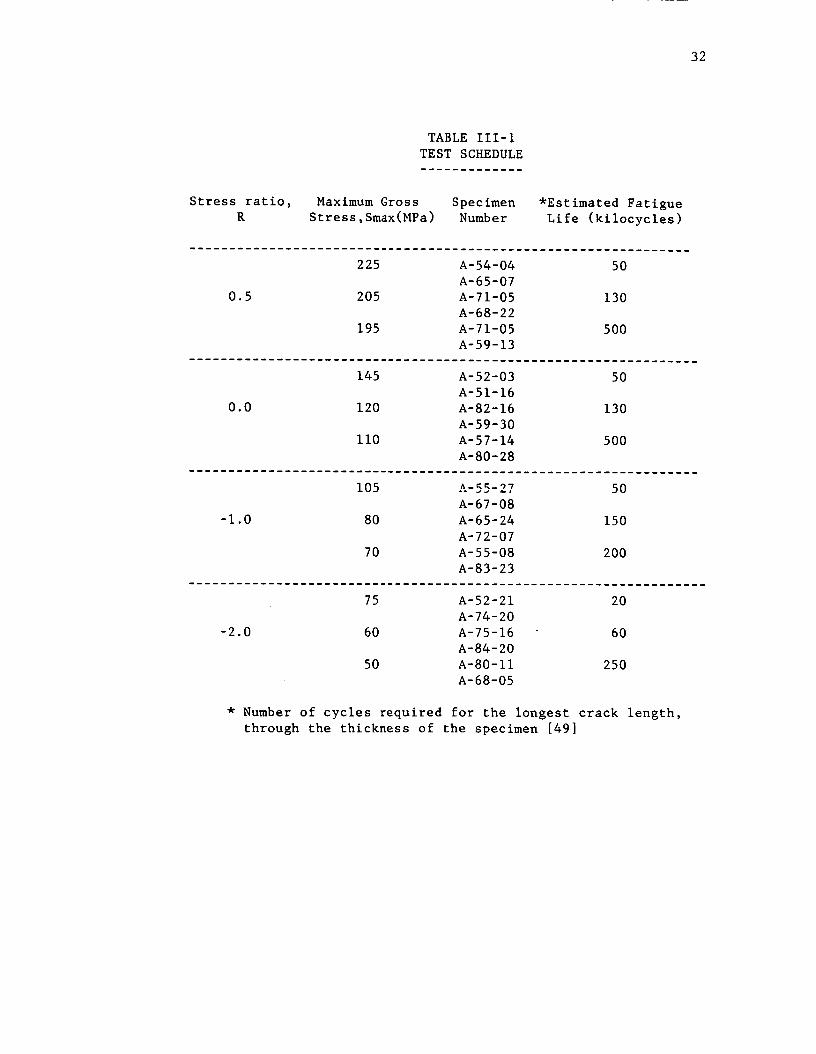
Test conditions were specified by NASA as part of an AGARD
round-robin test program. The conditions are listed in Table
III-i. Loading was to be performed under constant amplitude
conditions at four different R-ratios: 0.5, 0.0, -i.0, and
-2.0. Three different stress ranges were carried out for each
loading, and two specimens were tested for each stress range.
For each pair of specimens, one specimen was tested and data on
crack length against cycles were recorded until a crack grew
all the way across the notch root. The purpose of this

31
procedure was to obtain information on crack growth. The other
specimen in the pair was tested until the crack length was less
than 0.5 rm_along the bore of the notch in order to examine the
small crack characteristics. A total of 24 specimenswere
scheduled to be tested, all randomly selected for each test
condition. Loading was performed using a MTSelectro-hydraulic
test machine with a capacity of 20 kips. The wave form for
fatigue loading was sinusoidal, and the wave frequency was 20
Hz.
The crack lengths were monitored by a replica technique at
regular intervals during the cycling; crack opening
displacements were measuredby ISDGtechnique at the end of
each test. If a test washalted during fatigue cycling, the
minimumload was maintained at the sameor a higher value than
the minimumload in the test to prevent excessive residual
stress due to unloading.
For all tests, where the applied stress is less than zero,
anti-buckling guides were used. All tests were conducted under
laboratory air and roomtemperature conditions.
32
TABLEIII-ITESTSCHEDULE
Stress ratio, MaximumGross SpecimenR Stress,Smax(MPa) Number
*Estimated FatigueLife (kilocycles)
225 A-54-04 50A-65-07
0.5 205 A-71-05 130A-68-22
195 A-71-05 500A-59-13
145 A-52-03 50A-51-16
0.0 120 A-82-16 130A-59-30
ii0 A-57-14 500A-80-28
1_ A-_-97 KN
A-67-08
-I.0 80 A-65-24 150
A-72-07
70 A-55-08 200
A-83-23
75 A-52-21 20
-2.0
A-74-20
60 A-75-16 60
A-84-20
50 A-80-11 250
A-68-05
* Number of cycles required for the longest crack length,
through the thickness of the specimen [49]

111-4. CRACKLENGTHMEASUREMENT
33
The crack growth along the bore of the notches was
monitored using the acetate replica method described in
Appendix I-B. The replica technique has several advantages in
this application, particularly in measuring small cracks:
a) The sheets of replica can be stored permanently sothat they can be examined again at a later time tofind the smaller cracks.
b) The surface of the bore of the notch can bethoroughly examined, even the area far from thecenter of the specimenwhich is very difficult toobserved directly with a regular microscope.
The c._= _=L_od_=_y to_=_gue loading was interrupted ---= =_.11 take
the replicas. In general, 25-30 replicas were taken during a
longer test, which was continued until a crack grew through the
specimen. The interval between replicas differed between
specimens. It was chosenbased on the estimated fatigue life;
i.e., every two kilocycles for the life less than 50
kilocycles, every five kilocycles for the life between 50 and
200 kilocycles, and every ten kilocycles for over 200
kilocycles.
The replica was taken at 80%of maximumload because the
cracks were expected to be fully open at this point. Each
replica was taped on a microslide and observed with an optical
microscope at either 200Xor 400X magnification.

34
111-5. CLOSUREMEASUREMENT
Crack opening displacements (COD)were measuredusing a
laser-based interferometric technique. Only a brief discusssion
will be included here; for more details, see reference 41.
The Interferometric Strain/Displacement Gage (ISDG)
technique is especially useful in the study of small cracks,
since it has a very small gage length, from 20 _m to about i00
_m, and can measure the relative displacement with a resolution
of approximately 0.02 micron. Two small indentations were
placed across a short fatigue crack with a Vicker's
microhardness tester, as shown in Figure 111-6. Whenthese two
indentations are illuminated with a laser, interference fringe
patterns are produced. As the indentations moveaway from each
other, the fringe patterns also move, and this motion is easily
associated with the relative displacement, Ad:
A-mu+A ml kAd = (3.2)
2 sin _o
where k is the wave length of the laser and _o is the angle
betweemthe incident laser beamand the reflected pattern. Amu
and Aml are the relative fringe motion of the two patterns in
the plane containing the axis of measurement, k is equal to
632.8 nm for the He-Ne laser used in this experiment, while _o
is approximately 420. Thus the calibration factor,sin _o

DRICI'NAE PAGE IW
OF POOR QU'_LITy
a. Indentations were placed with a spacing of 20 _m across a 35 _m longcrack (400x)
b°
Indentations were placed with a spacing of 75 _m across a through-thickness (2.3mm) crack. (200x)
Figure 111-6. Typical micrograph of indentations across a crack

36
is about I micron. While the ISDGtechnique has been used for
CODmeasurementson flat specimens, somechangeswere required
to enable CODmeasurementsalong the bore of semi-circular
notches in a long specimen.
Spurious reflections from the semi-circular region which
interrupted the interference fringes were eliminated by
spraying the entire notch area, except for the immediate area
around the crack, with flat black paint, as shownin Figure
111-7. A large rigid body motion due to the greater elongation
of a long specimenmovedthe indentations out of the incident
laser beamas the load wasapplied. The problem was solved by
rewriting the loading and data acquisition programs to allow
readjustment of the laser beam. The loading and data
acquisition programs are listed in Appendix I-E.
Closure loads were automatically determined from COD
versus load data by a computer program, which is listed in
Appendix I-E. It is recognized that highly accurate values for
closure loads are not easily determined. Closure loads can be
defined with reasonable accuracy by using a reduced data method
[46,48,50].
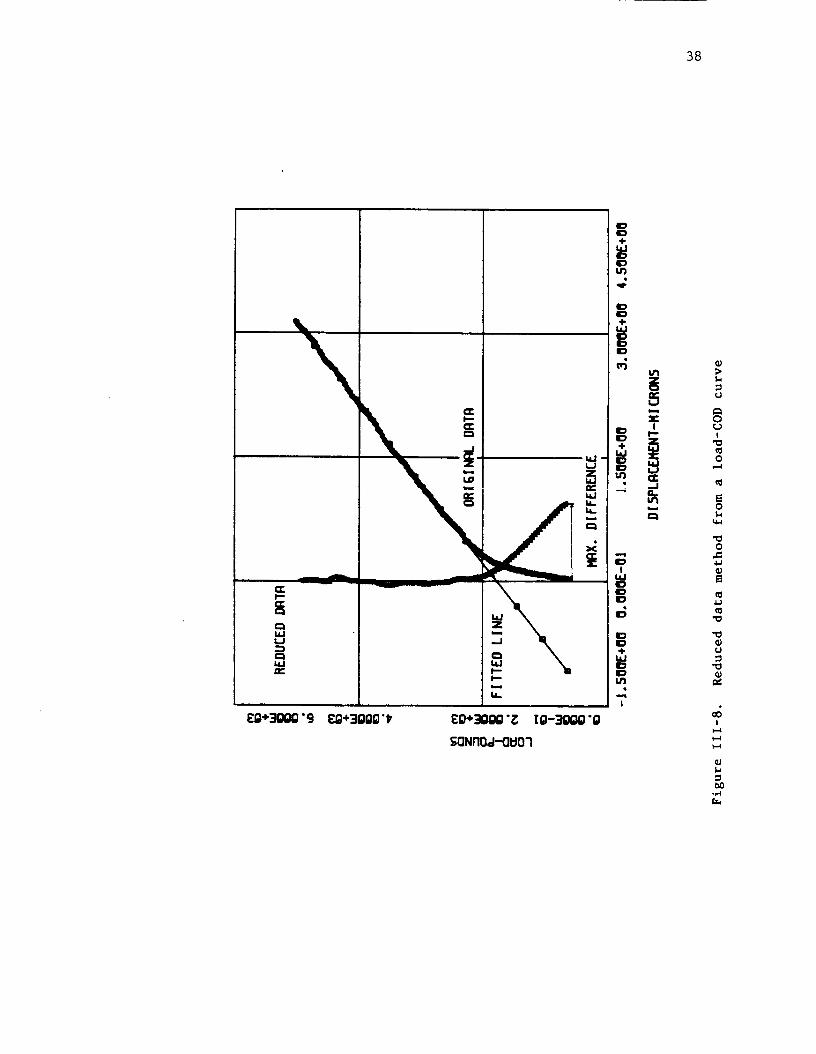
A typical example of this method is shownin Figure 111-8.
A least-square line is fitted to the upper linear portion of
the CODcurve. In the linear portion, it is assumedthat the
crack is fully opened. The reduced data are obtained by
subtracting values of the fitted line from the original data.
Then the closure load is defined at the point where the reduced

37
Figure 111-7. Black paint spray on the notch root except the
crack area to prevent spurious reflection of
laser beam
38
=-r"In¢¢
I-I
=..
7= =
_: ,.,,
=:°==,
Eg+3ggg "9 Eg+3ggg't,
I,-.
14.
u3
'TEg+3ggg "_ Ig-3ggg'g
SQNrlO,=I'-OI:IO"I
;>
0
I
oi,--I
o
o
0_
.IJ
u
Q;
!
I-4
Q;
ow..I

data become zero. It is too ideal a case to pick the point
where the data are exactly equal to zero because the linear
portion of the original data is not perfectly linear. It is
more reasonable that the closure load be determined at the
point where the deviation of the reduced data becomes 10% of
the maximum difference. These procedures incorporate a computer
program to prevent arbitrary errors which accompany
measurements made by eye.
39
IV. RESULTS AND DISCUSSION
40
Results of the crack growth tests are summarized in Table
IV-I. The column heading "Initiation Cycles" corresponds to the
number of cycles completed when the first crack was observed
through examination of the replica under an optical microscope.
"Location" implies the location of the crack at its point of
origin. The following abbreviations were used in this column:
C : Edge of the specimen at the notch root
N : Near the edge of the specimen at the notch root
S : Center of the specimen at the notch root
The cracks labeled "C" were corner cracks, while those
labeled "S" were surface cracks. Cracks labeled "N" were
originally surface cracks but usually changed to corner cracks
as they grew. The heading "Crack Length" implies the total
surface length, which corresponds to 2a for a surface crack and
a for a corner crack, as defined in Figure IV-6. "LI, L2,..L5"
in the "Final Crack Length" column designates several cracks
wich appeared in the same specimen simultaneously or
sequentially. "Total Test Cycles" means the number of cycles
completed at the time when the crack grew through the section.
The tested lives are in reasonably good agreement with the
estimated fatigue life in Table III-I.

41
TABLE IV-I
SUMMARY OF TEST RESULTS
Maximum Specimen Initiation Initial Loca- Final Total
R Stress Number Cycles Crack tion Crack Test
(MPa) (XI000) Length Length Cycle
(ram) (nm_) (XlO00)
0.5 225 A-54-04 26 0.080 N LI 0.5
A-65-07 42 0.033 S L1 2.3 121
S L2.. LI
S L3.. LI
S L4.. LI
205 A-71-05 20 0.044 S LI 2.25 117
S L2 0.251
S L3 0.174
S L4 0.114
N L5 0.169
A-68-22 35 0.049 N LI 0.545
S L2 0.18
195 A-84-03 690 0.098 C LI 1.55 760
A-59-13 130 0.027 S LI 0.403
S L2..LI
S L3 0.022
0.0 145 A-52-03 6 0.025 S LI..L3
S L2 0.131
S L3 2.25
S L4..L3
S LI 0.038
S L2 0.245
N L3 0.234
120 A-82-16 60 0.093 C LI 2.25 138
A-59-13 No crack found in 660,000 cycles
ii0 A-57-14 80 0.225 S LI 2.19 130
A-80-28 I00 0.082 C LI 0.40
A-51-16 8 0.022
53
-I.0 105 A-55-27 4 0.032 S LI 2.25 20
C L2 0.431
C L3 0.22
C L4..LI
S L5 0.164
A-67-08 7 0.044 S LI 0.398
S L2 0.19
C L3 0.19
C L4 0.19
C L5 0.218

42
TABLEIV-I (cont.)SUMMARYOFTEST_SULTS
MaximumSpecimenInitiation Initial Loca- Final TotalR Stress Number Cycles Crack tion Crack Test
(MPa) (XI000) Length Length Cycle(ram) (ram) (XlO00)
-i.0 80 A-65-24 40 0.016 S LI 2.25 125
S L2 0.343
S L3 0.229
S L4 0.055
S L5..LI
A-72-07 40 0.050 S LI 0.050
70 A-55-08 120 0.065 S LI 2.25 290
S L2 0.30
S L3 0.20
S L4..LI
A-83-23 70 0.044 C LI 0.382
C L2 0.267
S L3 0.229
C L4 0.20
S L5 0.065
-2.0 75 A-52-21 2 0.027 S L1 2.25 20
S L2 0.071
S L3 0.518
S L4..LI
S LS..LI
A-74-20 4 0.035 S LI 0.035
60 A-75-16 15 0.010 S LI 1.809 II0
S L2..LI
C L3..LI
S L4 2.175
S LS..L4
A-84-20 15 0.015 S LI 1.809
C L2..LI
S L3..LI
S L4 2.175
S L5..L4
50 A-80-11 715 0.050 S LI 0.i0
A-68-05 30 0.093 C LI 1.515 362
C L2..L3
C L3 2.25
S L4 0.436
43
Two of the 24 specimens tested in this experiment showed
some unexpected behavior. The specimen A-84-03, which was
cycled with a maximum stress of 195 MPa (54% of yield stress)
at R = 0.5, was broken during cycling at almost 760 kilocycles.
A crack was found at 690 kilocycles at the center of the notch
root and grew as a surface crack. This crack propagated
quickly, growing from 0.561 mm to 1.55 mm in I0 kilocycles at
740 kilocycles.
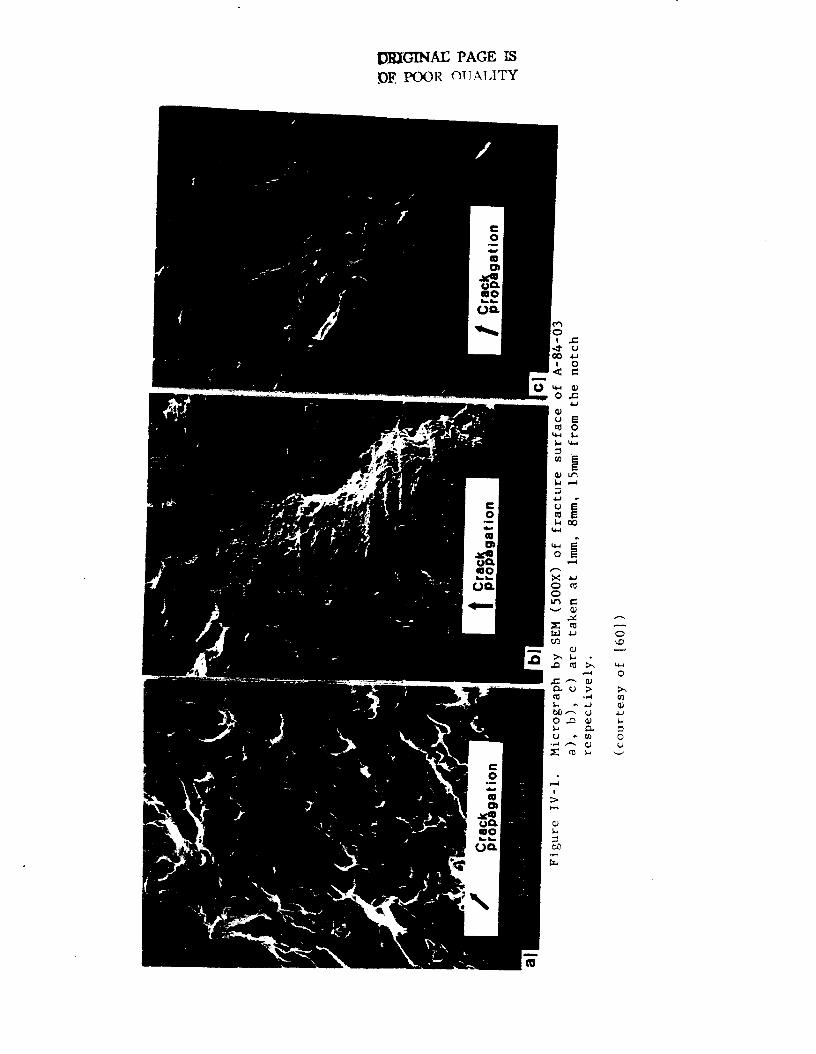
The broken fracture surface was photographed with an SEM
at Kentron International Inc. [60] to examine the fatigue
propagation (Figure IV-l). The first micrograph was taken at i
mm from the notch; the second and third are at 8 mm and 15 mm,
respectively. Even the picture at 25 mm shows the striation
marks which prove fatigue cracking. The plane strain fracture
toughness for AI 2024-T3 is 44 MPa-m ½ [60]. An approximate
calculation of the critical crack length based on the plane
strain fracture toughness is 13 mm. But the thickness (2.3 mm)
of this material is not enough to satisfy the plane strain
condition,
( K_ )2
B > 2.5 ____AAk_f= (Oys)
(4.1)
where B would be greater than 37 mm for KIC = 44 MPa-m ½ andys
= 359 MPa. Therefore, the fracture toughness of this specimen
will be larger than KICand the critical crack length will be
DRIGINAE PAGE IS
DE POOR OI_ALITY
45
longer.
For another specimen, A-59-30, which was cycled with a
maximum stress of 120 MPa at R = 0.0, no crack was observed
after 660 kilocycles. The estimated fatigue life [49] at this
load condition is 130 kilocycles. No explanation could be made
for this unexpected behavior.
IV-I. Analysis of Replicas
For each loading condition, two specimens were tested. In
_11 .....A +_ g..... _h_nllgh the _hickness of theone, a crack was =_v,_ ...............
specimen (approximately 2.3 mm) in order to obtain growth data;
in the other, a small crack (up to 500 _m) was grown so that
short crack behavior might be examined. From five to 70
replicas were taken for each test to monitor the initiation and
growth of each crack. These replicas were observed closely
under an optical microscope. The length and location of each
crack were measured and crude maps were sketched on the
magnified scale. Crack maps of all the tests are shown in
Appendix II.
A typical example of a crack map, tracing the growth of a
crack from first observation through the thickness of the
specimen, is shown in Figure IV-2. This is the data from
specimen number A-55-08 with a maximum remote stress of 70 MPa
at a stress ratio of -I.0. The width of the sketch corresponds

ORIG1N/EE PAGE _
oF POOR QUAI2T_
46
Record o{ crack lengths and map
120.000
L1Cyc I es
.065 mm
L2 mm
1,3 mm
L4 mm
L5
Cyc I• s
,21_ mmL2 mm
1.3 mm
L4 mm
,16o,oooL l .2o2
L2
170.000
L1 .316
1'2
i80.00_
LI .338
L2
190,000
LI
1,5
Cyc ] esmm
mm
L3
L4
L5
Cyc I es-mm
mm
mm
mm
mm
mm
mm
1.3 mm
L4 mm
L5 mm
Cyc 1esmm
,09S mm
L3 mm
1,4 mm
L5 mm
Cy= ] es.420 mm
L2 .136 mmL3 mm
1'4 mm
L5 mm
Figure IV-2. Typical example of a crack map

O_.iGIN$1; pNO1_ tS
O__ pO0_ QUAh[T_
47
Record of crack lengths and map
Page _ o'F 1Specimen no A-55-08
B. lmm grid
< ........ B
Load i ng Type. Constant Am_lltud._R=-I.OPeak Sl:re=s 70 MPa
2oo,ooo Cyc 1 e=L 1 ._52 mm
L2 . zs8 mmL3
L4L5
21o,ooo Cyc I e=Ll .512 mm
L2 . 207 mm
L3 .033 mm
L4 mm
L5
220,000 Cyc I e=L 1 .632 mm
L2 .218 mm
L3 .o33 mmL4 mm
230m000
L I _Q
L2
L5
Cyc I • s
.mm
• 288 mm
L3- .o33
L4
240.000
L5
Cyc 1esL1,763
L2 ._osL3
250,000
L I ._99
L2
mm
mm
mm
mm
mm
mm
.038 mm
L4 mm
L5
Cyc I esmm
•349 mm
L3 ,131 mm
L4 mm
L5
mm
mm
mm
mm
mm
mm
Figure IV-2. Typical example of a crack map (continued)

48
Sp.-cimen no A-_S-O_
B. Imm grid
< B
crack lengths and map
Loading Type c_.._.._ Am._li_-,,,aaR'-I.O
Peak Stress 70 HPa
260,000 Cyc Ies
LI 1.o79 mm
L2 •324 mm
L3 .17o mm
L4 mm
L5 mm
270)000 Cyc | esL 1 z.'363 mm
L2 . 305 mmL3 . ZTO mm
L4 mmL5 mm
280.000 Cyc I esLI i. _,_,_ mm
L2,294 mmL3 .zol ram
L4 .022 mmL5 mm
290,000 Cyc 1 e$
LI _ -mmL2 ._oo mm
L3 * mmL4 L1 mm
L5 mm
Cyc 1 esL1 mm
L2 mm
L3 mm
L4 mm
L5 mm
Cyc I esLI mm
L2 mm
L3 mm
L4 mm
L5 mm
* Crack was not clear
Figure IV-2. Typical example of a crack map (continued)

49
to the specimen thickness, and all dimensions are at the same
scale. The crack originated along the centerline of the notch
root near the edge of the specimenafter 120,000 cycles.
Replicas were taken every I0,000 cycles for this test, so the
first visible crack was 65micrometers long before it was
found. The crack grew toward the center and the edge. Another
crack initiated near the center of the specimen at 180,000
cycles. A third crack appearedat the upper side of the notch
at 210,000 cycles. The first crack grew continuously, but the
second and third cracks stagnated after growing for a short
time. Information about crack initiation and the crack growth
rate behavior can be obtained from the crack maps.
IV-2. Crack Initiation Analysis
50
It was convenient to examine crack initiation by observing
the replicas, even after the tests were finished. The smallest
observable crack was approximately i0 _mlong, viewed under an
optical microscope at 400Xmagnification. The number of cycles,
crack lengths, and locations measuredwheneach crack was first
observed are shown in Table IV-I. The numberof cycles to crack
initiation appeared to be of the sameorder of magnitude as the
loading condition, with the samestress ratio and stress level,
except for the case of the smallest stress levels at R = 0.5
and R = -2.0. This result can be regarded as quite consistent,
considering that most fatigue test data have showna tendency
to be scattered over a substantially large band. The first
observed crack lengths varied from I0 to I00 micrometers, since
the replicas were taken at certain fixed intervals, as
mentioned before.
In most cases, a single crack nucleated and several other
cracks appeared sequentially. In only three specimens out of
the 24 tested -- one where Smax= 195 MPaand R = 0.5 and two
with Smax= 105 MPaand R = -I.0 -- were multiple cracks
initiated at the sametime. Considering the stress, multiple
initiation was expected at the highest applied stress level, as
in the case where R = -I.0. But this was not true for R = 0.5.
51
Most of the crack nucleations were observed along the bore
of the notch rather than at the corner. The cases where
initiation occurred at a corner maybe attributed to mechanical
defects from the machining procedure.
It was found that most surface cracks which were initiated
at the bore of the notch were nucleated at the inclusion
particles, as shownin Figure IV-3. This phenomenonwas
observed in manyother experiments [1,3,18,30,31,42,43,52],
especially in commercial aluminum alloys [I] and has been
called brittle initiation. If the crack is initiated in this
brittle manner, the plastic zone may be considered quite small-3
(estimated to i0 in [52]). But this estimation is limited to
the very beginning of crack initiation. Another estimation of
plastic deformation at the crack tip [53] is calculated as
follows.
r o = 0.002 ( em / S o / E )2 (4.2)
where r o is the radius of the plastic zone
e m is the maximum value of the applied tensile
strain
S o is the yielding stress
E is the elastic modulus
Using this equation, the size of the plastic zone
surrounding a crack in AI 2024-T3 was calculated to be 0.05 nun,
given that e m = 0.0049 (measured at the root of the notch by
ISDG technique, when the corresponding remote stress was ii0
_):GI'NAE PPiGE ]_
OZ POOR QUALITY.52
400X
400X
Figure IV-3. Micrograph of the example of crack initiation
at inclusions.
53MPa), S
o= 359 MPa, and E = 73,100 MPa.
Based on the lower extreme of brittle initiation (former
case of above estimation), the criteria of linear elastic
mechanics (LEFM) are satisfied at a crack length of about 0.01
mm. For the latter case, a crack length must be longer than 0.5
mm to apply LEFM. But the applied stress must be low enough to
avoid general yielding in the notch root for any case.
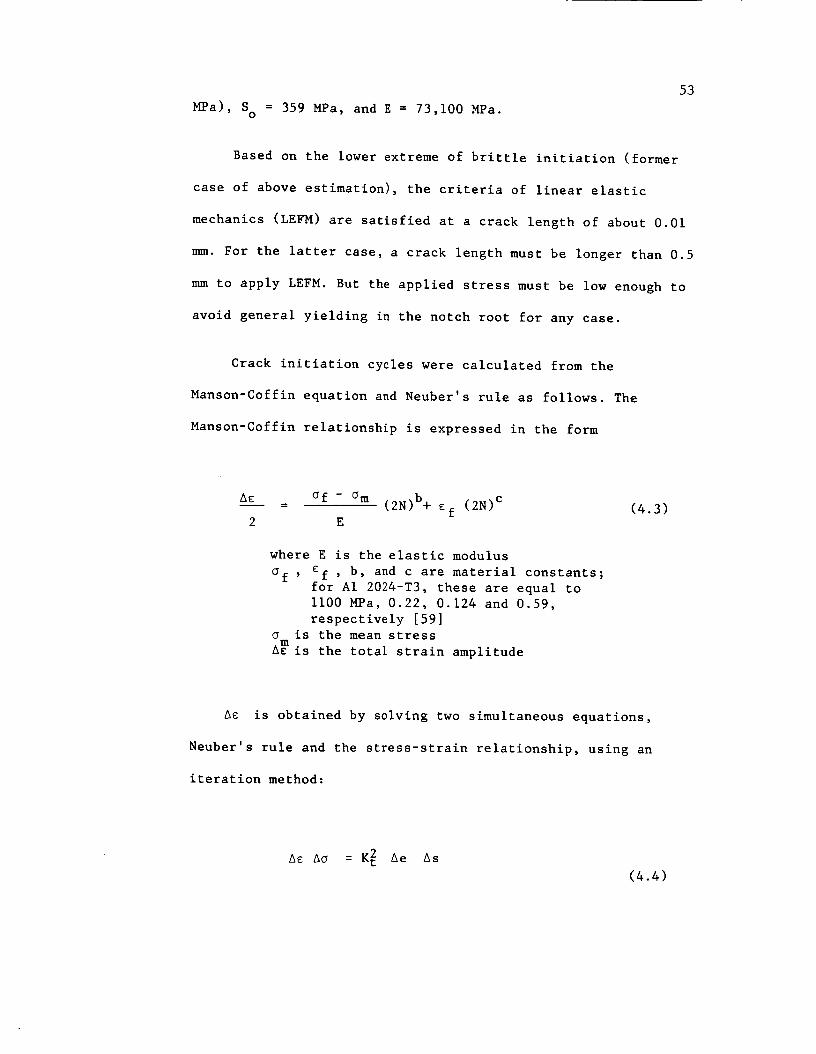
Crack initiation cycles were calculated from the
Manson-Coffin equation and Neuber's rule as follows. The
Manson-Coffin relationship is expressed in the form
A_____ = of - om (2N)b+ _f (2N)C
2 E
where E is the elastic modulus
of , sf , b, and c are material constants;for AI 2024-T3, these are equal to
ii00 MPa, 0.22, 0.124 and 0.59,
respectively [59]
o is the mean stress
A_ is the total strain amplitude
(4.3)
Ae is obtained by solving two simultaneous equations,
Neuber's rule and the stress-strain relationship, using an
iteration method:
A_ Ao = K_ Ae As
(4.4)

and 54
A_
I___ Ao --,= A_ + ___,___ nE "K " (4.5)
where AE and A_ are the notch strain and
stress amplitudes
Ae and AS are the remote strain and stress
amplitudes
K t is the stress concentration factor,
equal to 3.17 for the geometry of the
specimen used in this experiment
K' and n' are material constants, equal to
655 and 0.065 respectively for AI 2024-T3
As shown in Table IV-2, initiation cycles observed in this
experiment are in good agreement with values predicted by the
Manson- Coffin equation for the two highest stress levels at
each R-ratio, with the best agreement at R = -i.0 and -2.0.
Figure IV-4 shows this agreement of tested initiation cycles
and calculated values for R = -i.0 in which the mean stresses
are zero for all applied stress ranges. The close agreement in
short fatigue lives was expected, since the Manson-Coffin
relationship was derived for low-cycle fatigue.

55
TABLE IV-2
TEST RESULTS OF CRACK INITIATION
Stress Maximum Specimen Tested Predicted Ratio of
Ratio, Stress Number Initiation Initiation Initiation
R (MPa) Cycles Cycles Cycles* To
(XI000) (XI000) Total Life*
0.5 225 A-54-04 26 0.21
A-65-07 42 22.5 -
205 A-71-05 20 0.17
A-68-22 35 54.3 -
195 A-84-03 690 0.91
A-59-13 130 90.2 -
0.0 145 A-52-03 6 0.ii
A-51-16 8 30.5
120 A-82-16 60 0.43
A-59-30 * 191.8 -
ii0 A-57-14 70 0.61
A-80-28 i00 428.2 -
-I.0 105 A-55-27 4 0.2
A-67-08 7 3.0 -
80 A-65-24 40 0.32
A-72-07 40 38.4 -
70 A-55-08 120 0.41
A-83-23 70 157.4 -
-2.0 75 A-52-21 2
A-74-20 4 2.2
60 A-75-16 15
A-84-20 15 16.5
50 A-80-11 715
A-68-05 30 114.3
0.i
0.14
0.08

56
u
÷
A
z
iIIII
| i
/! !
%
-- "O
-'o
'Oqm
m
e
ZN
q_
o
!
o
r_
p.,
Q;
"oQ;4.J
_J°,-I
Q;
°,-I
O3
O_J
Q;
O
4.L
•_ O
!
:>I--i
°,.#

57
In addition, the ratio of initiation cycles to tested
total life (the test was stopped when the crack grew through
the section) is shown in Table IV-2. The ratio appears with a
range of 0.I to 0.9. For some pure metals in which the crack
usually initiated at a slip band (in a ductile manner), the
number of cycles required to produce a detectable crack was
known to be a small proportion (a few percent) of the total
life. In experiments with commercial aluminum alloys, Pearson
[i] showed that the number of cycles to the initiation of a
crack was equal to 40-60% of failure, a much higher ratio than
is found in the pure metals.
The ratios of crack initiation cycles to tested total life
are plotted against stress ranges for different R-ratios in
Figure IV-5. The data is scattered in a wide band, but a
tendency toward increasing crack initiation life with
decreasing stress ratio can be observed, except in the cases
where AS = 102.5 MPa at R = 0.5 and for AS = 150 MPa at R =
-2.0.
Also, the range of crack initiation life to tested total
life is observed to be 10-40% for R = -i.0 and -2.0, and 20-90%
for R = 0.5 and 0.0. This dependence of crack initiation life
on R-ratio was shown by Sova et al [2]: approximately 70% of
fatigue life at R = 0.5 and 0.0 and 40% of fatigue life at R =
-0.5 and -I.0 for the material AI 2024- T3, the same material
used in this study.
58
AS
[MPal
250
2O0
150
100
50
Oi0
%
• R =0.5
• R =0.0
• R =-1.0
• R=-2.0
| i i i I
0.2 0.4 0.6 0.8 1.0
Ni/Nf
Figure IV-5. Crack initiation life versus fatigue stress range
IV-3. Crack Shape
59
After testing, the specimens were broken open to examine
the shapes of short and through-thickness cracks. The typical
short crack, defined as a surface crack less than 0.5 mm long,
was observed to be either a semi-elliptical surface crack or a
quarter-elliptical corner crack, as shown in Figure IV-6. The
dimensions of a semi-elliptical surface crack are given in this
figure; 2a is the surface crack length and c is the crack
depth. For a quarter-elliptical corner crack, a is the surface
crack length and c is the crack depth. The surface crack
lengths and crack depths as measured from the broken surface
are listed in Table 111-3 with the calculation value of the
crack depth, c, taken from the following empirical equation
[49]:
c/a = 0.9 - 0.25 ( a/t )2(4.6)
where a is the half-length of the crack for a surface crack and
the edge length for a corner crack. The parameter t represents
half the specimen thickness for a surface crack and the full
specimen thickness for a corner crack, as defined in Appendix
I-A, Figure A-I.
The crack depths could not be measured during the tests;
yet this value was needed in order to calculate the stress
intensity factor without significant error. The calculated
crack depth values agree quite well with measured values, as

-'_TG,.rNAE PA-G'_ l_
-::" POOR QU_
a)
Micrograph of fracture surface
(50x)Semi-elliptical surface crack
og
o
fm
Tracing of crack front
ou_
t_6
_o
Micrograph of fracture surface
(5ox)Tracing of crack front
b) Quarter-elliptical corner crack
Figure IV-6. Typical crack shape of short cracks observed in this study.

61
Table IV-3 shows. This agreementhas been proven in other work
[31]. Therefore, the crack depths calculated from the above
equation may be used to find the stress intensity factor
without significant error.
TABLEIV-3DIMENSIONSOF SMALLCRACKS
SpecimenNumber
Surface Crack Crack MeasuredCrack Calculated CrackLength (mm) Shape Depth (mm) Depth (mm)
A-54-04 0.54 C 0.42 0,478A-68-22 0.545 C 0.48 0.483A-59-13 0.403 S 0,18 0,180A-51-56 0.245 S 0.12 0.ii0A-80-28 0.414 C 0.38 0.370
A-67-08 0.398 S 0.18 0.173
A-83-23 0.229 C 0.32 0.333
A-84-20 0.174 C 0.16 0.156
A-80-1! 0.!00 S 0.04 0.045
S : semi-elliptical surface crack
C : quarter-elliptical corner crack
TABLE IV-4
DIMENSIONS OF THROUGH-THICKNESS CRACKS
Specimen Number Surface Crack Crack Depth*
Length (mm) Measured (mm)
A-65-07 2.3 1.31
A-71-05 2.25 2.27
A-52-03 2.25 I.i
A-82-16 2.25 2.69
A-57-14 2.19 1.65
A-65-24 2.25 i. 26
A-55-08 2.25 1.3
A-52-21 2.25 1.35
A-75-16 2.175 0.88
A-68-05 2.25 1.23

62
The through-thickness cracks which were grown in surface
length up to the thickness of the specimen (approximately 2.3
rm_)appeared to have a relatively large crack depth, as shown
in Figure IV-7. The measuredvalues of the crack depths, which
were averaged by three points, are listed in Table IV-4. The
expected depth of the semi-elliptical surface crack is 0.73 ram,
from Equation 4.6, whenthe observed length is equal to the
thickness of the specimen. All values in Table IV-4 are
significantly greater than 0.73 mm. SpecimenA-82-16 showedan
especially large value of 2.69 ramfor the crack depth. The
crack in specimen A-82-16 was initiated as a corner crack (see
crack map in Appendix II); the depth was expected to be
approximately the sameas the surface length. But the depth of
the quarter-elliptical corner crack with a surface length of
2.3 nmlwould be 1.5 mmaccording to Equation 4.6.
The crack growth rate becomesfaster as the crack length
approaches the thickness of the specimen (to be discussed in
the section entitled "Crack Growth Rate"). But the replicas
were taken at certain intervals, every 2,000 to I0,000 cycles.
Thus in the interval between the last two measurements, a crack
may grow to its full length and then continue to grow in the
direction of depth. However, such an oversized
through-thickness crack must be considered an edge crack rather
than a surface crack, and the crack growth data from the last
cycling interval must be omitted when observing the growth
behavior of the surface crack.

_F POOR QUALIT_
80-_g-V

IV-4. Crack Growth Rate Results and Discussion
64
Crack growth was monitored using the replica technique at
certain cyclic intervals. The first observable surface crack
lengths, those visible under an optical microscope with 400X
magnification, tended to be one or two times the grain size of
the specimen, or a few tens of microns long. The material's
typical grain size was 25 _m in the direction of crack growth.
The stress intensity factor range, AK, was calculated from
the approximate equation for semi-elliptical surface cracks and
quarter-elliptical corner cracks, as described in Appendix I-A.
The full load range was used in calculations of AK, including
compressive loads for negative R-ratios. The crack depth, c,
for these calculations was estimated from Equation 4.6.
All crack growth data -- crack length, number of cycles,
K, da/dN (growth rate), and the plot of da/dN versus A K for
each specimen -- are included in Appendix II. Also found in
Appendix II are data sheets containing information on test
conditions. The AK values for R = 0.5 appeared smaller than
those for R = -2.0, even with much higher maximum stress
levels, because the stress ranges are smaller in the case of R
= 0.5 than for R = -2.0.
The crack growth rates were calculated with a simple
point-to-point method:

65
da a an+l - anin mm/cycle
dN N Nn+ I - N n
(4.7)
where a is the crack length at N. cycles. The correspondingn n
stress intensity factor range was calculated at an average
crack length, a, as
an+l + a na =
2(4.8)
A typical set of data including crack lengths, cycles,
stress intensity range (AK), and growth rate (da/dN) is
presented in Table IV-5. The data are for specimen A-65-07,
tested with Sma x = 225 MPa (63% of the yielding stress) and R =
0.5. The first observed crack was a surface crack, 0.033 nun
long and located at the center of the bore. AK was calculated
based on the average crack length; da/dN was calculated by the
point-to-point method described earlier in this section.
By examining the da/dN data, it can be determined that the
crack grew inconsistently as the number of cycles increased.
Crack growth slowed in the neighborhood of 46,000 to 54,000
cycles and also during the period from 60,000 to 64,000 cycles,
due to the micro-structure effect mentioned before.
Crack growth data taken at the very end of cycling was not
used in the calculation of da/dN. This is because the crack
length was measured only on the notch root, while the crack was
observed to grow as an edge crack through the thickness at the
last cycling. The process was discussed in Section IV-3.

66
TABLEIV-5TYPICALCRACKGROWTHDATA
SpecimenNumberA-65-07Tested With Smax= 225 MPaand R = 0.5
Cycles Crack Length K da/dN(X i000) 2a (_) (MPa-M) (XI0 mm/cycle)
42 0.03344 0.038 1.88 1.25046 0.044 2.02 1.50054 0.049 2.14 0.312
56 0.065 2.36 4.00060 0.071 2.57 0.75064 0.087 2.76 2.00070 0.114 3.09 2.250
72 0.125 3.35 2.75074 0.136 3.49 2.75080 0.158 3.69 1.83384 0.174 3.90 2.000
86 0.185 4.04 2.75092 0.213 4.24 2.33396 0.349 4.96 17.00098 0.392 5.62 10.750
i00 0.425 5.87 8.250102 0.463 6.09 9.500104 0.507 6.34 II.000106 0.518 6.50 2.750
108 0.632 6.85 28.500Ii0 0.719 7.37 21.750112 0.801 7.78 20.500114 0.970 8.33 42.250
118 1.875 10.32 113.125121 2.300 12.41

67
The crack growth rate versus AK is plotted for the
different R-ratios -- R = 0.5, 0.0, -I.0, and -2.0 -- in
Figures IV-8, IV-9, IV-10, and IV_II, respectively. The crack
growth ranges are from a few tens of microns (as mentioned
above) to through the thickness of the specimen (approximately
2.3 rmn). The data points of all four plots showunsteady
growth: acceleration in the beginning of crack growth and then
deceleration. This pattern repeats itself several times. It is
believed that this unsteady growth, which is especially large
in the early stages, is due to microstructural effects which
have been noted in other investigations [4,5,15-20]. In
particular, the repetition of acceleration and deceleration was
observed by Larsen [13].
Growth-rate data for long cracks are also plotted in
Figures IV-8 through IV-II. These data are from experiments
performed several years ago and from more recent tests on the
samelot of material [49] used in this study. As the cracks
grow, the crack growth rate tends to approach the rate of the
long crack and the scatter band tends to narrow. This indicates
that the short crack behavior is changing to the behavior of
the long crack.
Figure IV-8, for R = 0.5, showsa definite slowing of the
growth rate for short cracks relative to the rate for long
cracks. As described in Appendix I-C, all the stresses applied
in R = 0.5 produce plastic deformation at the notch root due to
the stress concentration. The compressive residual stress, _rs,

68
tzl_Ju>.(,3
XX
Zr_
qcr-i
10-1
10"2
10 .3
10-4
lO-S
lO-S
R-0.5+--+:SMAX-225MPA
N_.N:SMAX-2OSMPA
x_..x:SNAX-i9514PAo,,,-o:LONG-CRACK
!
IO'T i
10 0 101
DELK INPA-I_/21
I I I I I I
10 2
Figure IV-8. da/dN - AK plot for R = 0.5

69
is present in subsequent cycling from ½Smax to Smax. This Ors
changes with the local R-ratio:
RlocaI = _ m_n + _s (4.9)
q max + _s
A change in R-ratio will affect the crack growth rate, since
the growth rate is known to be a function of R as well as of
AK. The residual stress was not measured in this study, but an
estimate based on Neuber's relation shows it to be very small,
since the specimen is not unloaded after the first cycle. Thus
the R-ratio would change little.
In addition to the change in local R-ratio, another
explanation may be given. The growth rates of short cracks
which propagate on the surface of the notch root under
conditions of plasticity may be slower than those of long
cracks which grow under plane stress conditions. Growth under
plane stress and inside the area of plastic deformation is slow
due to residual compressive stress [54]. Zurek et al [28]
studied the growth of short cracks when a compressive residual
stress existed. They noted a decrease in AK with the residual
stress, Ors, which is negative:
A K" = (Omax + Ors - °cc) f(a) (4.10)
where ace is the closure stress and f(a) is the coefficient
dependent upon crack geometry. Zurek's group also observed an
improvement in agreement of prediction with experimental data
when the residual stress was taken into account.

70
Data for R = 0.0 is shownin Figure IV-9. Somedifferences
between the short and long crack growth rates can be observed
in the lower AK range. The loading in this case caused initial
plastic deformation at the notch for the two highest stresses,
as shown in Appendix l-C, but all three growth rates are
similar.
Figure IV-10, for R = -I.0, shows faster growth rates for
short cracks than for long cracks. All three loadings for R =
-i.0 left the notch root in an elastic condition, so no
retardation of the crack growth due to notch plasticity was
expected. The stress effect, meaning faster crack growth at
higher stresses, may also be clearly observed in this plot.
The samegrowth behavior is observed in Figure IV-II for R
= -2.0, i.e., a faster growth rate for short cracks and the
result of the stress effect. Here the two highest loads
produced yielding in compression at the notch root, but no
corresponding effect on the growth rate behavior was observed.
The so-called "small crack effect" was seen under the
loading conditions of R = -I.0 and -2.0. This faster growth was
observed through almost the entire range of AK, for crack
lengths up to the thickness of the specimen (2.3 mm). Thus it
maybe said that the small crack effect appeared to a crack
length of 2.3 mm. The small crack with this length has been
called a "physically short crack" [14,29] or a "mechanically
short crack" [26].

71
IJdJU)-U
22w
zo
o
10-1
10-2
10"3
104
lO-S
10"S
IO-T
- R-O .0
+--+: SMAX- J.451dPA
N_. N: SMAX- t20MPA
x_.. x: SMAX-t IOMPA
o-o: LONG-CRACK
L
10 o
I I I I 1 I I II I
101I/2
DELK (NPA-N I
1 1 I I I I I
10 2
Figure IV-9. da/dN - AK plot for R = 0.0

72
10"1 _ R--i. 0
+--+: SNA×: t05NPAN .N: SNAX 80NPA
10-2 _ x_.. x: SNAX-7OMPAo-o: LONG-CRACK
10"3 I
10"4 _
lOs /
10"6 I
IO-T L I I .. I , n
lU/(.1>-¢.)
XX
Z0
r,t
10 0 101
DELK (NPA-I_ nl
I I I
10 2
Figure IV-lO. da/dN - AK plot for R = -I.0

73
u.I_JU>,-u
'JrX
w
Z0
0
10 "1
= R'-2.0- 4---+: SMAX'75MPA
" __. _: SNAX'6ONPA
x_.. X: SMAX'5OMPA
10"2 ! 0'-0: LONG-CRACK
10"3
1O'S
10-7
10 0 101 10 _'
OELK (NPA-_ ral
Figure IV-ll. da/dN - AK plot for R = -2.0
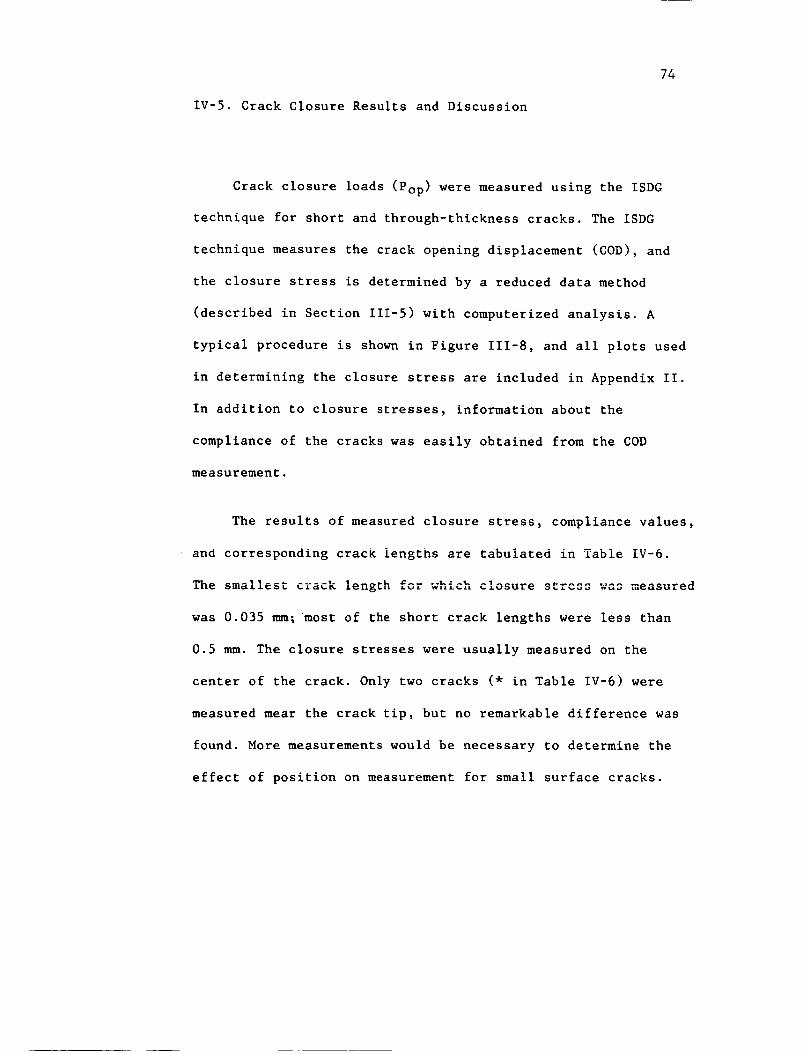
IV-5. Crack Closure Results and Discussion
74
Crack closure loads (Pop) were measuredusing the ISDG
technique for short and through-thickness cracks. The ISDG
technique measures the crack opening displacement (COD), and
the closure stress is determined by a reduced data method
(described in Section 111-5) with computerized analysis. A
typical procedure is shownin Figure 111-8, and all plots used
in determining the closure stress are included in Appendix II.
In addition to closure stresses, information about the
compliance of the cracks was easily obtained from the COD
measurement.
The results of measuredclosure stress, compliance values,
and corresponding crack lengths are tabulated in Table iV-6.
The ---_ gth c.... _ ^i ....... _........._m_Llest _L=_-'-len _vL w,_. _vo_L= meas ,,_=A
was 0.035 mm; most of the short crack lengths were less than
0.5 mm. The closure stresses were usually measured on the
center of the crack. Only two cracks (* in Table IV-6) were
measured mear the crack tip, but no remarkable difference was
found. More measurements would be necessary to determine the
effect of position on measurement for small surface cracks.

75
TABLE IV-6
RESULTS OF CLOSURE LOAD AND COMPLIANCE MEASUREMENTS
R
0.5
0.0
-i .0
-2.0
Maximum Specimen Crack Crack Normalized Compliance
Stress Number Length Shape Closure (_m/Nt)
(MPa) 2a Depth Load
(mm) (mm) (Pop/Pmax)
225 A-54-04 0.54 0.42 C 0.34* 1.59 E-4
A-65-07 2.3 1.31 T 0.29 14.0 E-4
205 A-68-22 0.18 - S 0.32 1.3 E-4
0.54 0.48 C 0.38* -
195 A-59-13 0.403 0.18 S 0.39 2.17 E-4
145 A-52-03 2.25 i.I T 0.33 15.0 E-4
A-51-16 0.245 0.12 S 0.32 1.34 E-4
120 A-82-16 2.25 2.69 T 0.21 31.2 E-4
Ii0 A-57-14 2.19 1.65 T 0.30 24.5 E-4
A-80-28 0.414 0.38 C 0.34 4.21 E-4
105 A-55-27 2.25 - T 0.0 10.8 E-4
A-67-08 0.19 - S 0.0 0.9 E-4
80 A-65-24 2.25 I. 26 T 0.12 17.7 E-4
A-72-02 0.05 0.23 S 0.12 0.46 E-4
70 A-55-08 2.25 1.3 T 0.0 17.9 E-4
A-83-23 0.2 0. i S 0.18 0.91 E-4
75 A-52-21 2.25 1.35 T -0.18 20. i E-4
A-74-20 0.035 - S 0.0 0.15 E-4
60 A-75-16 2.175 0.88 T -0.12 10.4 E-4
A-84-20 0.17 0.16 S -0.38 1.09 E-4
50 A-68-05 2.25 1.23 T -0.13 16.8 E-4
A-80-11 0.I 0.04 S 0.0 0.53 E-4
S : Semi-elliptical surface crack
C : Quarter-elliptical corner crack
T : Through-thickness crack
* Measured near the tip behind the crack

A. Results of COD Measurement
76
Typical plots of load versus COD are shown in Figures
IV-12, IV-13, IV-14, and IV-15 for R = 0.5, 0.0, -i.0, and
-2.0, respectively.
Figure IV-12a shows the load-COD for a crack with a
surface length of 0.5 mm and a crack which grew through the
thickness of the specimen (2.3 mm). The 0.5-mm crack originated
near the edge of the specimen at the notch root and grew into a
corner crack. Indentations were placed 50 microns apart near
the edge of the crack for the 0.5-mm crack and i00 microns
apart for the through-thickness crack. The maximum cyclic load
was 5,800 ibs (225 MPa) with a minimum load of 2,900 Ibs. The
change in the slope of the compliance for the 0.5-mm crack is
unclear in Figure IV-12a, since it is plotted on a large scale
in order to compare the magnitude with the through-thickness
crack data. The usual COD plot for such a short crack length is
plotted on a smaller scale, as shown in Figure IV-12b.
The COD of the 0.5-mm crack increased slightly until a
substantial load was applied, when it began to increase
linearly with the load. The linear increase means that the
crack is fully open. This behavior can be seen clearly on an
enlarged scale such as the one in Figure IV-12b. The pattern of
increase in the COD changes at 2,000 Ibs to a linear form which
corresponds quite well to the linear-square-fitted line shown
in the plot. The transition point is obtained easily from the

77
.J
I
R-e. 5 /SIHRX)-_r25_
-1.500E+O! O.00_-01 1.500E+Ol
COIJ.-M! r.lq(3l_
a) in a large scale
3. OOOE÷OI 4.5ffOE+Ol
++
R-§. S
5 (RRX]-225_
LJ-O. 481_
Reduced /Data
/i-4._+00-2.00_+00 0._0E-0I 2.00_+00 4.00_÷00
0IPLACBENt--14Im016
b) in an enlarged scale
Figure IV-t2. Typical COD-Load plot for R = 0.5

78
reduced data. This value is the crack opening load, Pop, which
is equal to 1,980 Ibs for the data in Figure IV-12b. The
compliance value which is obtained from the upper linear
-4portion of the COD curve is equal to 1.59 x i0 B m/Nt for the
-40.5-mm crack and 14.0 x I0 _m/Nt for the through-thickness
crack•
Figure IV-13 is for a crack with a surface length (2a) of
0.245 rm_ and a through-thickness crack. Indentations were
placed at the center of the crack in both cases. The maximum
cyclic load was 3,750 Ibs (145 MPa) with a minumum load of 0
Ibs. The maximum COD at the maximum load was 1.44 microns for
the 0.245-mm crack and 23.0 microns for the through-thickness
crack. The COD curves show behavior similar to the case of
Figure IV-i2a. The compliance value was 1 24 x iO4• B m/Nt for
4the 0.245-mm crack and 15.0 x iO _ m/Nt for the
through-thickness crack.
Figure IV-14 shows the COD curves for fully reversed
loading; the maximum cyclic load was 2,715 ibs (105 MPa) and
the minimum was -2,715 ibs. The sharply sloped curve is for a
surface crack with a length of 0.19 mm, and the large-COD-
valued curve is for a through-thickness crack. It can be seen
clearly from these curves that the slope transition point in
the COD curve of the through-thickness crack occurs in the
compressive load region. This implies that the crack was opened
fully in compressive load. This phenomenon will be discussed
later.
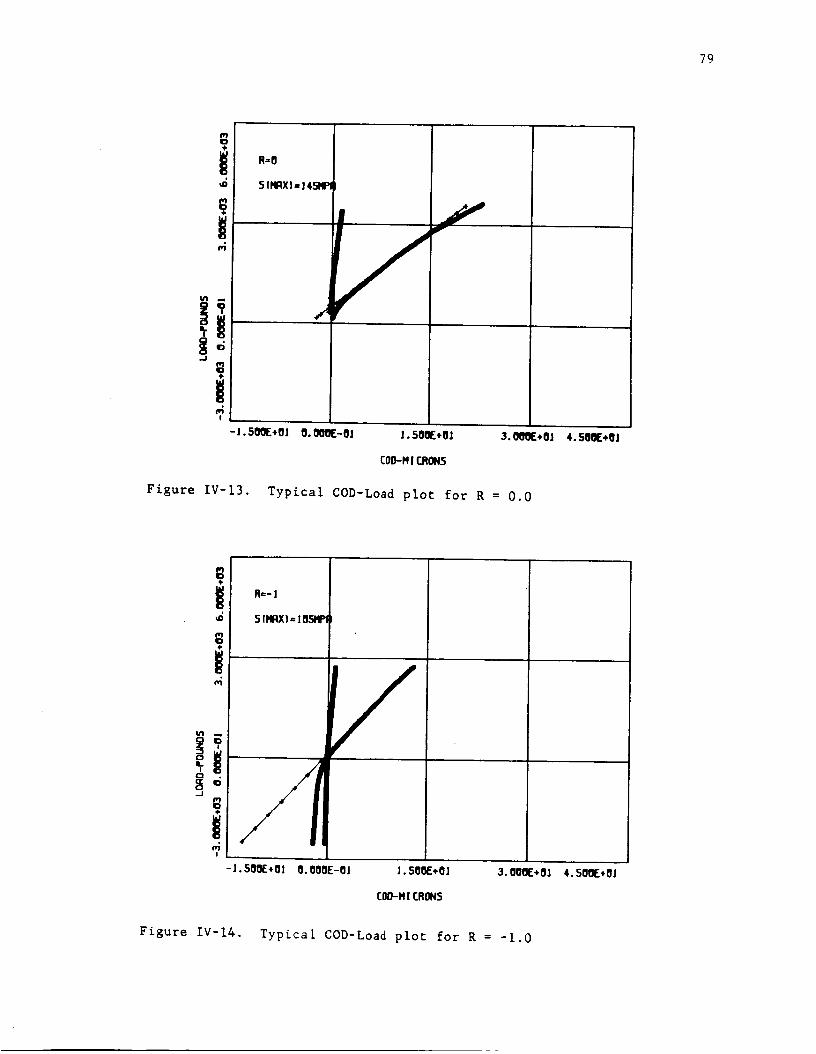
79
.J¢11
?
I
R:O
5 {HRX)-] 4SHl_
-I.5O0E+0] 0.0gO[-01 1.50_+01 3.0_+01 4.50_+0]
EOD-H i _q0N5
Figure IV-[3. Typical COD-Load plot for R = 0.0
?
I11O
8
Lfl
I
3. O0OE+Ol 4.SOOE+O]
Figure IV-14. Typical COD-Load plot for R : -I.0

80
Figure IV-15 shows the COD curves for R = -2.0; the
maximum cyclic load was 1,550 Ibs and the minimum was -3,100
Ibs. The steep curve is for a corner crack with a length of
0.16 mm, while the curve with the sharp bend is for a through-
thickness crack. The COD curves of the chort cracks in Figures
IV-14 and IV-15 are plotted again on an enlarged scale in
Figure IV-16.
As shown in this plot, when the cracks are closed in the
compressive load region, the bore of the notch behaves as an
elastic material until the crack begins to open. The
displacement measured from the indentations across the crack in
the compressive load region was -0.25 micron for the specimen
with the 0.19-mm crack. The indentations were 50 microns apart;
so the strain, e, is
e(measured) = -0.25/50 = -0.005
The elastic modulus of this material is 73,100 MPa, and
the stress concentration factor for the geometry of this
specimen is 3.17 [49]. Calculating the strain at the center of
the notch for the applied gross stress of -105 MPa gives
-105 Mpa x 3.17e(calculated) = 73100 Mpa
= -0.0046
The measured strain agrees well with the strain value
calculated from the elastic modulus. This is evidence of
elastic behavior in the compressive region.

81
?
.J
?
I
- 1.500E+0I 0. 000E-0! 1.500E+0I 3.000E+0I 4.500E+al
[0D-H [ ERON5
Figure IV-15. Typical COD-Load plot for R = -2.0
O1
J
R=-2.
I:1=0.16Htl
-l. 500E+O0 O. O00iE-OJ J. 500E+O0
2R_0.19_4
3.000E+O0 4.500E+00
COD-HfERON5
Figure IV-16. COD-Load plot in enlarged scale

B. Comparison of Compliances For Crack Lengths
82
It was shown in the "Crack Shape" section that surface
cracks are semi-elliptical in shape and that corner cracks are
quarter- elliptical. The measured crack depths were shown to be
a constant ratio, approximately 0.9, to the semi-surface crack
length for most cases. Thus the crack lengths can be compared
simply with the surface lengths for this case where there is a
constant ratio of surface length to depth.
Figure IV-17 is the comparison of compliance values for
surface crack lengths of short cracks with the semi-elliptical
shape and lengths up to 0.5 mm. Each data point was tested at a
different stress level, Smax, but no variation in compliance
due to Smax were noted. Also, no dependence of compliance upon
the variation of R was found for these semi-elliptical short
cracks. The compliance showed a linearly proportional
relationship lto the surface crack length, as seen in the plot.
Similar results have been reported in other papers [16,43].
Morris [16] found a linear relationship between compliance and
crack length and no variation of compliance with the applied
stress level for surface microcracks tested at R = -I.0. James
and Smith [43] also observed the linear relationship of
compliance and crack length for surface microcracks tested at R
--0.I.

83
2.5 /r e R-0.5
A R =0.0 "e
E 2"0 ° R=-I'0 /
-,o"/g "_I
° ti l.O
0"51_I- i i _ i
0.1 0.2 0.3 0.4
Surface Crack Length
I0.5 mm
Figure IV-17. Short crack compliances - surface crack length
for semi-elliptical surface crack

84
Figure IV-!8 shows a comparison of compliance values for
crack lengths of through-thickness cracks. As explained in the
"Crack Shape" section, the through-thickness cracks must be
considered edge cracks rather than surface or corner cracks
because the crack depths were substantially deeper than what
was expected from a semi-elliptical surface crack or a quarter-
elliptical corner crack. The linear relationship was observed
between the compliances and crack lengths of less than 2 mm
measured in the depth direction.
This linear relationship of compliance values and crack
lengths implies that COD is proportional to crack lengths in a
linear fashion, which is the result from LEFM.
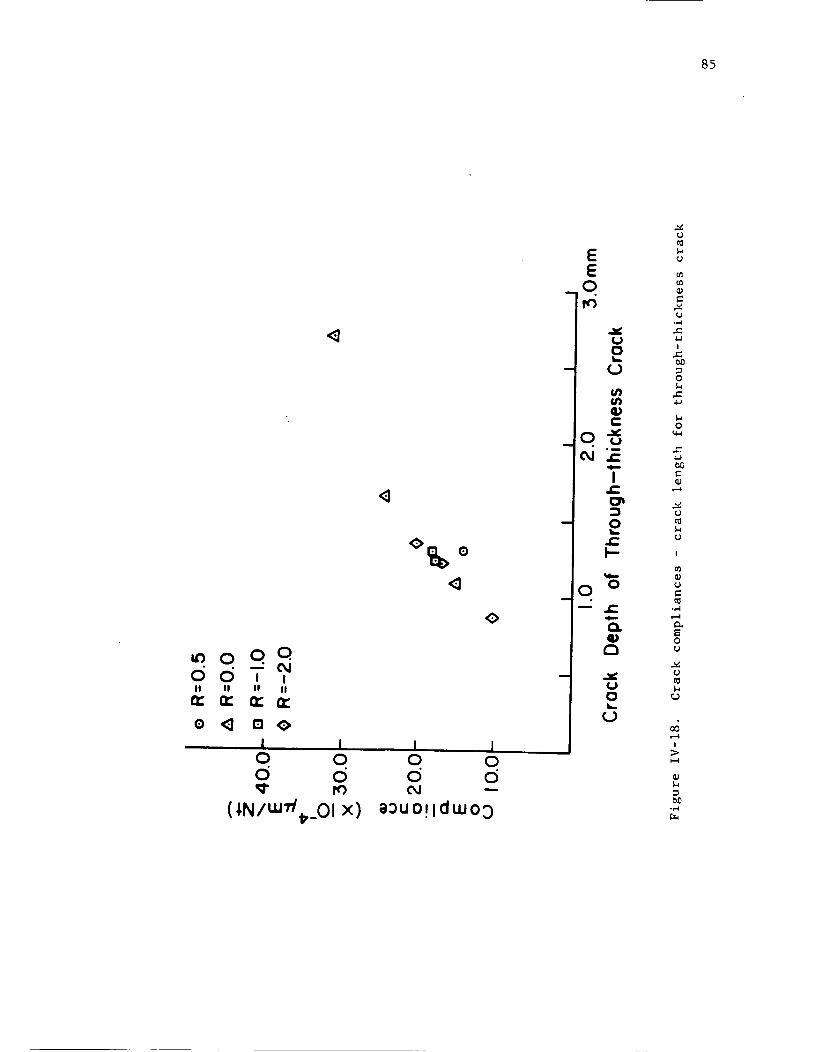
85
<
oO.odciT ,
II II II II
o _ oo
I I I I0 0 0 0ci ci ci ci
(,N/UU'd_,_OI x) e_UO!lduJo9
EE
_0
U
0
- (_
.n
I
0t,.._
r..I--
0 o
Q.
a
0
0
¢J
._,..c:4-)
I_0
O
O
r4
I
O
,,_1
Or4
I-I
¢1

C. Effect of Crack Length on Crack Closure Load
86
Figure IV-19a shows variations of opening load levels with
crack lengths for short surface cracks whose lengths ranged
from 0.035 mm to 0.5 nm_. The solid lines represent the opening
stress ratio predicted for short cracks form Newman's
calculated data [62]. Each data point was tested at a different
stress level, but Newman's prediction was calcualted for a
specific stress level: Smax/So = 0.25 for R = 0.0; Smax/S o =
0.15 for R = -i.0 and -2.0. So is the flow stress, which is
taken as an average value of the yield stress (359 MPa) and the
ultimate tensile stress (496 MPa for AI 2024-T3).
Measured opening stress ratios for R = 0.5 were below the
minimum cyclic stress for such a case. Newman's prediction for
R = 0.5 shows the opening stress to be the same as the minimum
applied stress. Most of the measured opening ratios are smaller
than the levels predicted for R = 0.0, -I.0, and -2.0.
Predicted values show rapid increases in the opening stress
level while the crack is still very short (less than 0.08 mm),
with stabilization for the opening stress for crack lengths
greater than 0.i _. Measured Data shows scattering in a wide
band for lengths less than 0.2 rm_. It can be observed from
Figure IV-19a as a general trend that the opening stress levels
increase as the crack lengths increase, except in the case
where R = -2.0.

87
o -c.9 d
,, _
0
_.J
cJ
cJ
!
oo_,_
o mm
cJ "om0
m
oo
m
o _J
g!

88
Figure IV-19b shows the opening load ratio versus crack
length measured in the specimen width direction for through-
thickness cracks. Also, opening stress ratio values predicted
for a long crack from Newman's equation [58] are plotted to
compare with measured data. The opening ratios for short,
through-thickness cracks tested in this experiment appear
smaller in general compared to the values predicted for long
cracks. The difference between the opening stress levels is
relatively small for positive R-ratios and substantially large
for negative R-ratios. No dependence of opening stress levels
on crack length was observed for through-thickness cracks.

D. Effect of R-ratios on Crack Closure Levels
90
The effect of R-ratios on closure levels has been studied
by many investigators. Elber [34] observed the relationship
between the closure stress, Sop, and the R-ratio and proposed
the empirical equation for the material AI 2024-T3,
Sop = 0.5 + 0.i R + 0.4 R 2 (4.11)
Smax
where Smax is the maximum cyclic stress. Schijve [55] modified
the above equation to apply where R _-i:
Sop = 0.45 + (0.1+a)R + (0.45-2a)R2 + aR 3Smax
(4.12)
where a is a constant with values from 0.i0 to 0.15. The above
formulas were obtained from the long crack data.
Newman [58] used his closure model to propose a general
crack opening stress equation for long cracks as a function of
constraint, stress ratio, and stress level. The proposed
equations are
Sop = Ao + AIR + A2R2 + A3R3 for R _ 0Smax
(4.13)
and
= Ao + AIR for -i _R<0 (4.14)Smax
when Sop a Smi n.
PR'ECEDiNG PAGE BLANK NOT FILMED

91
The coefficients are
A0= (0.825 - 0.34a + 0.05a 2 )" [cos(_" Smax/2c o )]1/2
AI= (0.415 - 0.071a ) (Smax/c o )
A2= I - AO- A I- A 3
A3= 2A0+ A I- i
where a is a constraint factor, a = I for plane stress and a =
3 for plane strain condition, and c o is a flow stress which is
taken to be the average between the uniaxial yield stress and
the uniaxial ultimate tensile strength of the material. The
yield stress is 359 MPa and the ultimate tensile strength is
496 MPa for AI 2024-T3; thus, the flow stress will be 427.5
MPa. The constraint factor was chosen as 1.73. It was used by
Newman in correlating the crack-growth rate data for large
cracks in a specimen with the same geometry as the ones used in
this study.
Normalized opening stress ratios for long cracks were
predicted from Schijve's equation and Newman's equation and
compared with short crack data measured in this study. The
results are compiled in Table IV-7.
The measured opening loads for short cracks at R = 0.5
appeared below the minimum cyclic load, as shown in Table IV-6.
It may be reasonable to define the opening load as equivlaent
to the minimum cyclic load for such a case. So opening load
ratios are changed to be the same as the R-ratio in Table IV-7.
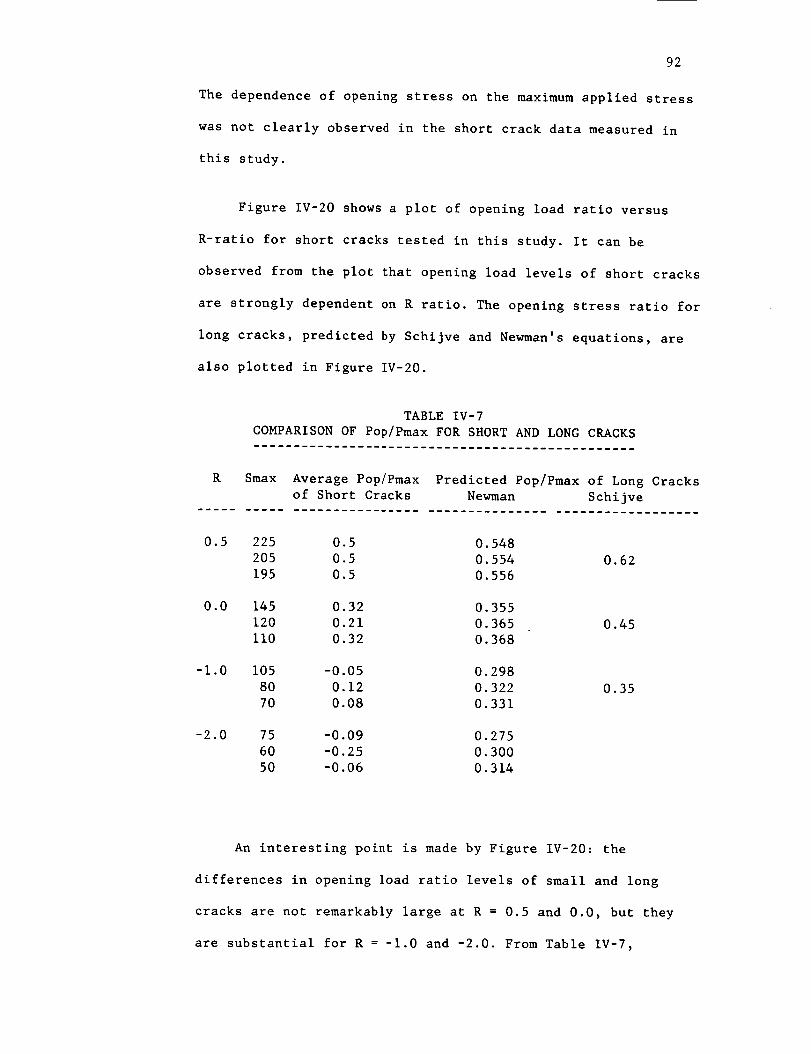
92
The dependence of opening stress on the maximum applied stress
was not clearly observed in the short crack data measured in
this study.
Figure IV-20 shows a plot of opening load ratio versus
R-ratio for short cracks tested in this study. It can be
observed from the plot that opening load levels of short cracks
are strongly dependent on R ratio. The opening stress ratio for
long cracks, predicted by Schijve and Newman's equations, are
also plotted in Figure IV-20.
TABLE IV-7
COMPARISON OF Pop/Pmax FOR SHORT AND LONG CRACKS
R Smax Average Pop/Pmax Predicted Pop/Pmax of Long Cracks
of Short Cracks Newman Schijve
0.5 225 0.5 0.548
205 0.5 0.554
195 0.5 0.556
0.62
0.0 145 0.32 0.355
120 0.21 0.365
ii0 0.32 0.368
0.45
-i .0 105 -0.05 0.298
80 0.12 0.322
70 0.08 0.331
0.35
-2.0 75 -0.09 0.275
60 -0.25 0.300
50 -0.06 0.314
An interesting point is made by Figure IV-20: the
differences in opening load ratio levels of small and long
cracks are not remarkably large at R = 0.5 and 0.0, but they
are substantial for R = -I.0 and -2.0. From Table IV-7,

93
0.8
0.6
0.4
],(
0
EU')
0.2Q,o
fj,'}
0.0
-0.2
• SHORTCRACKDATA
X PREDICTIONFORLONGCRACKBY SCHIJVE
PREDICTIONFORLONGCRACKBY NEWMAN
aw
Qo
®
0G
X
--0.4 9 I I I I-2.0 -I.S -i .o -O.S 0.0 0.5
R-ratio
I1.0
Figure IV-20. Crack opening load R-ratio for short cracks
94
normalized opening load levels of short cracks at R = 0.5 and
0.0 are approximately 10%lower than those predicted by Newman
for long cracks. But at R = -i.0 and -2.0, the short crack data
are more than 100%lower than the data for the long cracks in
most cases. This meansthat the short crack growth rate should
be much faster that the long crack growth rate at R = -i.0 and
-2.0 and that there should be no appreciable difference in the
two rates at R = 0.5 and 0.0.

95
IV-6. Crack Closure Effect on Crack Growth Rates
Manyattempts [16,17,21,22,33,40,61] have been madeto
relate the difference betweenshort and long crack growth
behavior with the concept of crack closure. The effective
stress intensity range, AKeff, is calculated as follows.
AKeff = U x AK (4.15)
where U is the effective stress range ratio with the value
U = I- _nl__o_._max (4.16)I - R
The effective stress range ratios are calculated in Table
IV-8 with the values from Table IV-7.
TABLE IV-8
COMPARISON OF EFFECTIVE STRESS RANGE RATIO
R Smax U U For Long Crack
(MPa) For Short Crack Newman Schijve
0.5 225 1.0 0.90
205 1.0 0.89
195 1.0 0.89
0.76
0.0 145 0.68 0.64
120 0.79 0.63
ii0 0.68 0.63
0.55
-i .0 105 0.53 0.35
80 0.44 0.34
70 0.46 0.34
0.33
-2.0 75 0.36 0.24
60 0.42 0.23
50 0.35 0.23
96
For R = 0.5, measured opening stresses for short cracks
are below Smin, as shown in Table IV-6. Here closure stresses
have no influence on crack growth. But closure levels predicted
by Schijve and Newman, also shown in Table IV-6, are higher
than Smi n. Thus the growth rate of the long crack data would
shift to the left and produce less agreement with short crack
data.
Figure IV-21 shows da/dN versus AKef f for R = 0.0. The
measured opening stresses for short cracks are approximately
10% lower than the long crack values predicted from Newman;
there is little change in the agreement between the rates as
compared to rates which do not display the closure effect shown
in Figure IV-9.
Table IV-7 shows a considerable difference -- more than
100% -- in the opening stress levels of short and long cracks.
The average value of U for the short crack at R = -I.0 is 0.48;
the average value of U as predicted for the long crack by
Newman is 0.34. Therefore, the plot of da/dN versus AKef f would
shift to the left by a substantial amount in both cases. Figure
IV-22 shows the good agreement in growth rates of short and
long cracks based on AKef f. This implies that the short crack
growth rates were approximately 40% faster than the those of
the long cracks due to the closure effect for the case of R =
-I .0.

97
mmm-JU
U
XX
ZQ
0
10-I
10-2
10"3
10.4
10"5
10-s
10-7
R=O
Schijve
+
+ •
m.+X4
10 0 10 i
Newma n
I I I
EFF. DELK (NPA-I_I
I I I I 1
10 2
Figure IV-21. da/dN - AKef f plot for R = 0.0

98
UJJCJ>-_3
2Xw
Z_2
0
10-1
10-2
10"3
10-4
lO-S
lO-e
10-7
: R'- -1i
xx
Schijve
| |
x
x
Newma n
10 ° 101
EFF. DELK (NPA_Nnl
10 2
Figure IV-22. da/dN - AKef f plot for R = -I.0

99
For R = -2.0, growth rates for short and long cracks
recalculated with closure stresses are in reasonably good
agreement, as Figure IV-23 shows. The use of AKef f gives
considerable improvement in the coalescence of the growth rate
data for R = -I.0 and -2.0. But in addition to the closure
effect, the complexity of notch plasticity must also be
considered when examining the difference in growth rate
behavior of short and long cracks for R = 0.5, 0.0, and -2.0.

I00
W-J_J>.
XXw
ZEl
.<l:3
10-I
10-2
10"3
lO-4
10"s
10"6
I0 q
=: R- -2mD
+/Newman
+ +
II +
x xxxxx xxx
" _lm x
B
x- li I x
5 m
m
I , I I
10 °I I i i i I I
101
EFF.Om.KmPA2 J
i I I I I I I
10 2
Figure IV-23. da/dN - AKef f plot for R = -2.0

I01
V. CONCLUSIONS
Based on the study of short fatigue cracks growth and
short crack closure behavior, involoving an experimental study
of short surface or corner cracks (0.035 - 0.5 mm) and short
through-thickness cracks (0.8 - 2.7 mm, average depth) in
notched AI 2024-T3 specimens, the following conclusions may be
made.
I. Crack initiation and growth were observed successfully
using the replica technique. Most of the cracks originate
at the center of the notch root rather than at the corner.
Those cracks which originate at a corner initiate atinclusions.
2. The initiation cycles observed in this experiment are
in reasonably good agreeement with the values predicted by
the Manson- Coffin relationship. The ratios of initiation
cycles to tested life vary from 0.I to 0.9.
3. The shapes of short surface and corner cracks, as
determined from examination of the broken test specimens,
are usually semi- elliptical and quarter-elliptical,
respectively. The aspect ratios are in good agreement with
the equation
c/a = 0.9 - 0.25 (a/t) 2
4. The growth rates of short cracks in these aluminum
specimens differs in general from those of long cracks in
the same material. Short cracks grow faster than the long
cracks for negative R-ratios and slower than the long
cracks for R = 0.5. At R = 0.0, the two kinds of cracks
grow at about the same rates. Also, there is a stress
effect on the growth rates of the short cracks at negative
R ratios.
5. The laser-based Interferometric Strain/Displacement
Gage is capable of measuring the crack opening
displacement (COD) across very short cracks at the roots
of the notches. Since it measures so close to the crack
surface, the resulting load-COD curves clearly show the
crack closure effect. This technique is also used to
measure the strain at a notch root.

102
6. The crack compliances of short surface cracks, obtainedform CODcurves, showa linear relationship with the cracklength. The compliances of short through-thickness cracksalso vary linearly with crack length (in the direction ofdepth).
7. The crack closure load ratios measured for the shortcracks were in general lower than those predicted forlonger cracks. There is only a slight difference forpositive R-ratios, but the difference is significant fornegative R-ratios, where the measuredclosure ratios forthe short cracks were nearly zero or less than zero.
8. An attempt to explain the difference between the growthrates using an effective stress intensity factor range toaccount for the crack closure was partially successful.This approach improved the correlation between long andshort crack growth for R = -I.0 and -2.0, but did littleto explain results for positive R-ratios. Micro-structural effects and the plasticity of the notch rootadd to the complexity of this problem.

103
Vl. REFERENCES
I. Pearson, S.: Initiation of Fatigue Cracks in CommercialAluminumAlloys and the Subsequent Propagation of Very ShortCracks. Engineering Fracture Mechanics, vol. 7, no. 2, pp.235-247, 1975.
2. Sova, J. A.; Crews, J.H., Jr.; and Exton, R. J.:Fatigue-Crack Initiation and Growth in Notched 2024-T3SpecimensMonitored by a Video Tape System. NASATN D-8224,1976.
3. Hudak, S. J., Jr.: Small Crack Behavior and the Predictionof Fatigue Life. Transactions of ASME,vol. 103, pp. 26-35,1981.
4. Taylor, D.; and Knott, J. F.: Fatigue Crack PropagationBehavior of Short Cracks: The Effect of Microstructure. Fatigueand Fracture of Engineering Materials and Structures, vol. 4,no. 2, pp. 147-155, 1981.
5. Lankford, J.: The Effect of Environment on the Growth ofSmall Fatigue Cracks. Fatigue and Fracture of EngineeringMaterials and Structures, vol. 6, no. i, pp. 15-31, 1983.
6. Fujimura, S.; Hayashi, T.; and Yamada,T.: Short CrackGrowth and Life Prediction in Low-Cycle Fatigue of SmoothSpecimens. Engineering Fracture Mechanics, vol. 21, no. 2, pp.85-101, 1985.
7. E1Haddad, M. H.; Smith, K. N.; and Topper, T. H.: FatigueCrack Propagation of Short Cracks. Transactions of ASME,vol.I01, pp. 42-46, 1979.
8. Saxema,A.; Wilson, W. K.; Roth, L. D.; and Liaw, P. K.: TheBehavior of Small Fatigue Cracks at Notches in CorrosiveEnvironments. International Journal of Fracture, vol. 28, pp.69-82, 1985.
9. Gangloff, R. P.: in "Advances in Crack Length Measurement"(ed. C. J. Beevers), 175; 1983, Warley, West Midlands,Engineering Materials Advisory Services Ltd.
I0. James, M. R.; and Morris, W. L.: Effect of Fracture SurfaceRoughnesson Growth of Short Fatigue Cracks. MetallurgicalTransactions A, vol. 14A, pp. 153-158, 1983.
II. McCarver, J. F.; and Ritchie, R. O.: Fatigue CrackPropagation Thresholds for Long and Short Cracks in Reni 95Nickel-based Superalloy. Material Science of Engineering, vol.55, pp. 63-67, 1982.
12. Tanaka, K.; Hojo, M.; and Nakai, Y.: Fatigue Growth

104
Initiation and Early Propagation in 3%Silicon Iron. ASTMSTP811, pp. 207-232, 1983.
13. Larsen, J. M.: AdvancedExperimental Methods for Monitoringthe Behavior of Small Cracks. Presentation given at AGARDStrutures and Materials Panel Specialists Meeting, SanAntonio,TX, April 1985.
14. Forte, T. P.; and Leis, B. N.: Fatigue Growth of InitiallyPhysically Short Cracks in Notched Aluminumand Steel Plates.ASTMSTP743, pp. 100-124, 1981.
15. Morris, W. L.: NoncontinuumCrack Tip Deformation Behaviorof Surface Microcracks. Metallurgical Transactions, vol. IIA,pp. 1117-1123, July 1980.
16. Morris, W. L.: Microcrack Closure Phenomenafor A12219-T851. Metallurgical Transactions A, vol. 10A, pp. 5-11,1979.
17. Morris, W. L.; James, M. R.; and Buck, O.: Growth RateModels for Short Surface Cracks in AI 2219-T851. MetallurgicalTransactions A, vol. 21A, pp. 57-64, 1981.
18. Kung, C. Y.; and Fine, M. E.: Fatiuge Crack Initiation andMicrocrack Growth in 2024-T4 and 2124-T4 AluminumAlloys.Metallurgical Transactions A, vol. 10A, pp. 603-610, 1979.
19. de los Rios, E. R.; Mohamed,Hussain J.; and Miller, K. J.:A Micro-Mechanics Analysis for Short Fatigue Crack Growth.Fatigue and Fracture of Engineering Materials and Structures,vol, 8, no. I, pp. 49-163, 1985.
20. Tanaka, K.; Nakai, Y.; and Yamashita, M.: Fatigue GrowthThreshold of Small Cracks. International Journal of Fracture,vol. 17, pp. 519-533, 1981.
21. Newman,J. C., Jr.: Behavior of Short Cracks in AirframeComponents.AGARDConference Proceedings No. 328, pp. 6.9-6.26,AGARD,France, 1981.
22. Breat, J. L.; Mudry, F.; and Pineau, A.: Short CRackPropagation and Closure Effects in A508 Steel. Fatigue andFracture of Engineering Materials and Structures, vol. 6, no.4, pp. 349-358, 1983.
23. James, M. N.; and Knott, J. F.: An Assessmentof CrackClosure and the Extent of the Short Crack Regime in QIN (HY 80)Steel. Fatigue and Fracture of Engineering Materials andStructures, vol. 8, no. 2, pp. 177-191, 1985.
24. McEvily, A. J.; and Minakawa, K.: Crack Closure and theGrowth of Short and Long Fatigue Cracks. Scripta Metallurgica,vol. 18, pp. 71-76, 1984.

105
25. Ritchie, R. O.; and Zaiken, E.: On the Development of Crack
Closure and the Threshold Condition for Short and Long Cracks
in 7150 Aluminum Alloy. Metallurgical Transactions A, vol. 16,
pp. 1467-1477, 1985.
26. Tanaka, K.: Short-Crack Fracture Mechanics in Fatigue
Conditions. Current Research on Fatigue Cracks, pp. 79-100,
Society of Material Science, Japan, 1985.
27. Hommouda, M. M.; and Miller, K. J.: ASTM STP 668_ pp. 703-
, 1979.
28. Zurek, A. K.; James, M. R.; and Morris, W. L.: The Effect
of Grain Size on Fatigue Growth in Short Cracks. Metallurgical
Transactions A, vol. 14A, pp. 1697-1705, 1983.
29. Suresh, S.; and Ritchie, R. O.: Propagation of Short
Fatigue Cracks. International Metals Reviews, vol. 29, no. 6,
pp. 445-475, 1984.
30. Bowles, C. Q.; and Schijve, J.: The Role of Inclusions in
Fatigue Crack Initiation in an Aluminum Alloy. International
Journal of Fracture, vol. 9, no.2, pp. 171-179, 1973.
31. Swain, M. H.; and Newman, J. C., Jr.: On the Use of Marker
Loads and Replicas for Measuring Growth Rates for Small Cracks.
Presented at AGARD Specialists Meeting, Siena, Italy, April
1984.
32. Leis, B. N.; and Galliher, R. D.: Growth of Physically
Short Corner Cracks at Circular Notches. ASTM STP 770, pp.
399-421, 1982.
33. Leis, B. N.: Displacement Controlled Fatigue Crack Growth
in Inelastic Notch Fields: Implications for Short Cracks.
Engineering Fracture Mechanics, vol. 22, no. 2, pp. 279-293,
1985.
34. Elber, W.: The Significance of Fatigue Crack Closure. ASTM
STP 486, pp. 230-242, 1971.
35. Banerjee, S.: A Review of Crack Closure. AFWAL-TR-84-4031,
1984.
36. Banerjee, S.: Influence of Specimen Size and Configuration
on the Plastic Zone Size, Toughness, and Crack Growth.
Engineering Fracture Mechanics, vol. 15, pp. 343-390, 1981.
37. Newman, J. C., Jr.: A Crack-Closure Model for Predicting
Fatigue Crack Growth Under Aircraft Spectrum Loading. ASTM STP
748, pp. 52-84, 1981.
38. Ritchie, R. O.; and Suresh, S.: Some Consideration on
Fatigue Crack Closure Induced by Fracture Surface Morphology.

Metallurgical Transactions, vol. 13A, pp. 937-940, 1982.
i06
39. Morris, W. L.; James,M. R.; and Buck, O.: A Simple Modelof Stress Intensity RangeThreshold and Crack Closure Stress.Engineering Fracture Mechanics, vol. 18, no. 4, pp. 871-877,1983.
40. Liaw, P. K.; and Logson, W. A.: Crack Closure: AnExplanation for Small Fatigue Crack Growth Behavior.Engineering Fracture Mechanics, vol. 22, no. 2, pp. 115-121,1985.
41. Sharpe, W. N., Jr.: Application of the InterferometricStrain/ Displacement Gage. Optical Engineering, vol. 21, no. 3,pp. 483-488, 1982.
42. Morris, W. L.; and Buck, 0.: Crack Closure Load Measurementfor Microcracks DevelopedDuring the Fatigue of AI 2219-T851.Metallurgical Transactions A; vol. 8A, pp. 597-601, 1977.
43. James, M. N.; and Smith, G. C.: Surface Microcrack Closurein Fatigue. International Jounal of Fracture ; vol. 22, pp.R69-R75, 1983.
44. Zeiken, E.; and Ritchie, R. 0.: On the Developmentof CrackClosure and the Threshold Condition for Short and Long FatigueCracks in 7150 AluminumAlloy. Metallurgicl Transactions A,vol. 16A, pp. 1467-1477, 1985.
45. Dutta, V. B.; Suresh, S.; and Ritchie, R. 0.: Fatigue CrackPropagation in Dual-Phase Steels: Effects ofFerritic-Martensitic Microstructures on Crack Path Morphology.Metallurgical Transactions A, vol. 15A, pp.i193-1207, 1984.
46. Sharpe, W. N.; and Lee, J. J.: Near Tip Crack DisplacementMeasurementsDuring High-Temperature Fatigue. ASTMSTP905, pp.253-264, 1986.
47. Williams, D. R.; Davison, D. L.; and Lankford, J.: Fatigue-Crack-tip Plastic STrains by the Stereoimaging Technique.Experimental Mechanics, pp. 134-139, April 1980.
48. James, M. N.; and Knott, J. F.: Critical Aspects of theCharacterization of Crack Tip Closure by Compliance Technique.Material Science and Engineering, vol. 72, pp. LI-L4, 1981
49. Edwards, P. R.; and Newman,J. C., Jr.: AGARDCollaborativeEffort on Short Cracks (Introduction to Participants). NASALangley Research Center, 1984.
50. Lee, J. J.: A Study of Fatigue Threshold and Crack Closureat Elevated Temerature. Master's thesis, The Johns HopkinsUniversity, 1984.

107
51. Leis, B. N.; Kanninen, M. F.; Hopper, A. T.; Ahmad,J.; andBroek, D.: A Critical Review of the Short Crack Problem inFatigue. AFWAL-TR-83-4019.
52. Morris, W. L.; Buck, O.; and Marcus, H. L.: Crack Intiationand Early Propagation in AI 2219-T851. MetallurgicalTransactions A, vol. 7A, pp. 1161-1165, 1976.
53. Drucker, D. C.; and Rice, J. C.: Plastic Deformation inBrittle and Ductile Fracture. Engineering Fracture Mechanics,vol. i, pp. 500-602, 1970.
54. Newman,J. C., Jr.: Private communication. January 1986.
55. Schijve, J.: SomeFormulas for the Crack Opening StressLevel. Engineering Fracture Mechanics, vol. 14, pp. 481-465,1981.
56. Suresh, S.: Crack Initiation in Cyclic compression and itsApplications. Engineering Fracture Mechanics, vol. 21, no. 3,pp. 453-463, 1985.
57. Sehitoglu, H.: Crack Opening and Closure in Fatigue.Engineering Fracture Mechanics, vol. 21, no. 2, pp. 329-339,1985.
58. Newman,J. C., Jr.: A Crack Opening Stress Equation forFatigue Crack Growth. International Journal of Fracture, vol.24, pp. RI31-RI35, 1984.
59. Fuchs, H. O.; and Stephens, R. I.: Metal Fatigue inEngineering. Wiley Interscience Publication, 1980.
60. Swain, M. H.: Private communication, July 1985.
61. Tanaka, K.; and Nakai, Y.: Propagation and Nonpropagationof Short Fatigue Cracks at a Sharp Notch. Fatigue ofEngineering Materials and Structures, vol. 6, no. 4, pp.315-327, 1983.
62. Newman,J. C.; Swain, M. H.; and Phillips, E. P.: AnAssessmentof the Small-crack EFfect for 2024-T3 AluminumAlloy. Presented at the SecondInternational Workshopon SmallFatigue Cracks, January, 1986.

108
APPENDIXI
A. Stress Intensity Factor Calculation
The calculation of the stress intensity factor range (K)
assumeseither that a semi-elliptical surface crack is located
at the center of the edgenotch or that a quarter-elliptical
corner crack is located at an edge, as shown in Figure A-I. For
a surface crack found at other locations along the bore of the
notch, the calculation is adequate if the crack is small
compared to the thickness of the specimen.
To calculate the stress intensity factor at the point
where the crack intersects the notch surface, the crack length,
a, and the crack depth, c, must be known. Whenthe crack
length, a, is measured then the crack depth, c, is calculated
from the following equation for either a surface or corner
crack:
c/a = 0.9 -0.25 (a/t) 2
where a, c, and t are defined in Figure A-I.
The stress intensity factor range equation [49] for a
surface crack located at the center of the edge notch and
subjected to remote uniform stress is
AK = AS/_a/Q. Fsn

109
OF POOR QUALI_F_
I!n_
l
t-O
0
u')
0
J_J
0
c_
c_
C_
_J
0
c_
c_
C_
0
o.,.._
0
0
0
.,-_o_
• ,-_ tU
o
0

ii0
The equation for a quarter-elliptical corner crack is
AK : AS/_a/Q- Fcn
for 0.2<a/c<2 and a/t < i.
These equations are modified from the empirical stress
intensity factor equations, which are obtained by fitting to
the finite element results for two-symmetric, semi-elliptical
surface cracks and for two-symmetric, quarter-elliptical corner
cracks at a hole in a finite plate, as shown in Figure A-2.
The stress range, AS, is the full range, Smax - Smin, for
constant amplitude loading.
The shape factor,Q, is given by
Q : i + 1.464 (a/c) for a/c_l
Q = i + 1.464 (c/a) for a/c>l
The functions Fcn and Fsn are found as follows.
Fcn = Fsn (1.13-0.09 a/c) for a/c_l
Fcn = Fsn (I + 0.04 c/a) for a/c>l
Fsn = [MI + M2 (a/t) + M3 (a/t) ] gl g2 g3 g4 fl f2

iii
where for a/c _-<i and _ = _/2,
M1 = f2 = i
and for a/c > i and _ = _/2.
MI = f2 = (c/a) I/2
Other subfunctions of Fsn are
M2 = 0.05 / [0.ii + (a/c) 1.5]
M3 = 0.29 / [0.29 + (a/c) 1"5]
gl = 1
g2 =I + 0.358k + 1.425k 2 - 1.578k 3 + 2.156k 4
I + O.08k 2
k
i + 0.1564 c/r
g3 = I + 0.I (I + a/t) I0
i/2g4 = 1.14- 0.i / (i + c/r) for 0.2_(a/c)_2, (a/t)<l,
and _ = _/2.
The finite-width correction, fl, is
fl = (-0.2n + 9.4n - 19.4n + 27.1n ) where n = (c+r)/w.

B. Replica Method
112
A replica of the notch surface is madeafter each cyclic
interval which is specified in Section II, Experimental
Procedure. At each cyclic interval, the specimen is held under
a constant applied stress, S = (0.8)Smax, while the replica is
taken. The replica material is acetylcellulose film, with a
width of 0.034 mm(Item Number14640, Ernest F. Fullan, Inc.),
which is cut into pieces about 8 rmmX 30 mm.
Prior to making each replica, the notch surface is cleaned
with acetone. A piece of the replica material is held in place
loosely against the notch surface using a metal or glass rod
with a diameter slightly smaller than that of the notch. A few
drops of acetone, applied with an injector or a swab, are
allowed to flow between the film and the notch surface. The
film is then touched lightly to the notch surface and left to
adhere and dry for at least five minutes. While the replica is
in place on the specimen, the surface is checked for flaws such
as bubbles or other artifacts using a low-magnification
microscope with a relatively long focussing length.
Once dry, the replica is slowly peeled from the specimen.
Best results are obtained when the replica is handled with
tweezers. Oneof the top corners of the finished replica film
is chipped away to aid in orienting the replica for analysis
under the microscope. Each replica is attached with
double-sided tape to a microslide, labeled with the number of

113
cycles run at that point in the experiment, and stored in a box
marked with the specimennumber. Analysis of the replicas from
the last replica to those madeearly in the life of the
specimen permits easy location of the crack.
Occasionally a replica will be twisted or have an
unusually large curvature, making crack length measurements
less accurate. For this reason, the position of the crack tip
from each replica should be marked on a montage of micrographs
from a relatively flat replica. A holder can be madefrom a
thin metal plate with a slit at the center; this will keep the
replica flat when it is observed under an optical microscope.

114
C. Stress-strain Analysis of the Notch
The data in Table C-I concerning elastic normal stress
distribution along the center line of the specimenwere taken
from reference 18. The table gives the location, x, normalized
by the hole radius, r, against the stress concentration ayy/S,
where S is the gross stress.
TABLEC-ISTRESSCONCENTRATIONAROUNDTHENOTCH
x/r oyy/S x/r oyy/S
1.00 3.170 1.15 2.3781.01 3.096 1.20 2.2061.02 3.027 1.30 1.9441.03 2.962 1.40 1.7561.04 2.901 1.50 1.6181.05 2.843 1.60 1.5131.06 2.787 1.70 1.4331.07 2.734 1.80 1.3701.08 2.683 1.90 1.3191.09 2.634 2.00 1.280i.i0 2.587
The notch plastic zone was estimated using Irwin's method
for each loading condition, based on the elastic normal stress
distribution around the notch as shownabove. Table C-2 shows
the calculated notch plastic zone radius, r*, for a yield
stress of 359 MPa.
As shown in Table C-2, since the stress at the notch was
above the yielding point for several loading conditions, notch
stress-strain was analyzed using Neuber's rule,
e-o = K_'e's

115
and the stress-strain relationship,
i
E = -- +E
where E and _ are local strain and stress, e and S are remote
strain and stress, K t is the elastic stress concentration
factor, E is the elastic modulus, and K and n are constants in
the stress-strain curve.
TABLE C-2
ESTIMATED NOTCH PLASTIC ZONE
R Smax Radius of Notch Plastic
Zone (mm)
0.5 225 1.59
205 1.27
195 I. ii
0.0 145 0.41
120 0.08
ii0
-I.0 i05
80
70
-2.0 75
60
50
0.47*
0.08*
*Yielding in compression for Smin
For the material A1 2024-T3 and the specimens used in this
study, the constants are:
E = 73,100 MPa
K = 455 MPa [59]
n = 0.032 [59]

116
The notch stress and strain with the remote stress are
calculated by Neuber's rule, while the notch strain was
measured against the remote stress using the ISDG technique.
Two indentations with a spacing of 50 microns were set on
the root of the notch and the relative displacement between the
indentations was measured as shown in Figure C-I. From the
curve of Figure C-l, the measured displacement for the remote
stress of 145 MPa, corresponding to 3,749 ibs, is 0.35 m.
Thus, the measured notch strain will be
0.35 _m _ 0.007050 _m
This measured value is quite close to the value calculated by
Neuber's rule (0.0077), within 10%.
Table C-3 shows the notch stress and strain, comparing
values calculated from Neuber's rule and measured values.

117
Eg+3ggg'9 Eg+3ggg'_ Eg+3ggg "i:- Eg+3ggg'9-
_ONRO4-OUO'I 3101_J
5
=
U3 Z
IDI
I,=J0OID
IDI
o0
u_!
=.,-4
oo
u_J
oZ
=
E
E
E
u
6
°_
D. Alignment of Grips and Checks
118
As shown in Figure 111-3, the fixtures gripping a specimen
consist of two parts: the base fixtures, which are attached at
the bottom to the hydraulic ram of the test machine and at the
top to the load cell, and the specimen grip sets, which are
attached to the base fixtures.
The bottom base fixture, which has a spherical joint
inside, was aligned to be parallel to the test machine table.
This was accomplished by adjusting the spherical joint. The
parallelism was achieved through the following steps.
i. A dial gage with a precision of 0.0005 inch was
mounted on the test machine table and the probe was
positioned vertically on the edge of the bottom
base fixture.
2. The hydraulic ram was brought to the bottom of
the machine, instead of being allowed to float in the
hydraulic liquid, and rotated.
3. The dial indicator was monitored while the
hydraulic ram was rotating. Dial gage variations could
not exceed 0.0005 inch.
4. If the variations were greater than 0.0005 inch,
the appropriate adjusting bolts in the base fixture
were tightened.
5. Procedures 3 and 4 were repeated until the bottom
base fixture was parallel to the table.
The top base fixture has the same structure as the bottom
base fixture. It was also aligned parallel to the table in a
procedure similar to the bottom base fixtue alignment described
above. In this second procedure, however, the dial gage was

119
mounted on the bottom base fixture and the probe was positioned
vertically on the edge of the top base fixture.
After the base fixtures were aligned, the specimen grips
were attached to the base fixtures and aligned using a
strain-gaged specimen. Five strain gages (Micro-Measurement;
CEA-13-062UW-120)were placed as shownin Figure D-I on each
side of a specimenwhich had the samedimensions as the study
specimensbut did not have a notch.
The alignment procedure for the specimen grips was as
follows.
I. Specimengrips were finger-tightened at the top (orthe bottom) base fixture. The strain-gaged specimenwasput in place, the other specimen grip was tightened byhand, and the specimenwas loosely fastened.
2. Another specimengrip was placed at the other side ofthe specimen and aligned parallel to the specimen asaccurately as possible; then that pair of grips wastightened by hand and the specimen loosely fastened.
3. Approximately 300 Ibs of tension load was applied;then the specimenwas tightly fastened.
4. The test machinewas unloaded and one set of specimengrips (top or bottom) was fastened tightly.
5. The other set of specimen grips was loosened from thebase fixture and adjusted while reading the strain fromthe strain indicator. Before any readings were taken,the strain was set to zero while the specimen was in afree condition.
After the specimengrips were aligned, one grip from each
of the two pairs (sameside top and bottom) was never loosened
until it had to be aligned again; this was the "reference
grip." To check for misalignment, strain gage readings were

120
152.5 mm
37 mm
ct. ,37 mm
IDirection
of strain
measurement
152.5mm
One of grip setdefined as .
reterence grip
I!
I_3-B20 20
5oC
I!
I
_50 mm-m
/I-oce _j
///////I
St ra in gauges
3 4
7,1,9 ml0,2,8
2.3ram
Front
,4
I0 2 8
.6
¢cFRONT SIDE BACK
Figure D-I. Strain-gaged specimen to check
alignment

121
taken at zero load and at i0 KN (= 2,240 ibs) load in the
manner described below.
i. The strain-gaged specimen was placed so that the
front face (face I in Figure D-l) was in contact with the
reference grip (the standard position). The grips were
tightened, and strains on all gages were read at zero
load. This strain reading was labeled enS o at gage
number n, standard position, zero load.
2. A tensile load of i0 KN was applied and the strains
were measured (strain = enSo )-
3. The specimen was unloaded and removed, then replaced
so that face 4 (see Figure D-l) was in contact with the
reference grip (reverse position). Grips were tightened,
and strains were read on all gages (strain = enRl0).
Strain measurements from the above procedure are shown in
Table D-I. The bending strains are given by the difference
between enS and enR , such as elS o - elRo. The final bending
strain values are the average of those obtained from opposite
gages, such as i and 2. The resulting bending strains at A, B,
and C are plotted in Figure D-2.
The criteria of misalignment for lateral bending, eL, and
rotational bending, eR, are [49]:
eL _ 20 microstrain
e R _ I0 microstrain
The measured values of e and e at zero load are
e L = 12 microstrain
e R = 12 microstrain
while at a load of I0 KN,
e L = 13 microstrain
e R = 3 microstrain
which nearly satisfies the bending criteria.
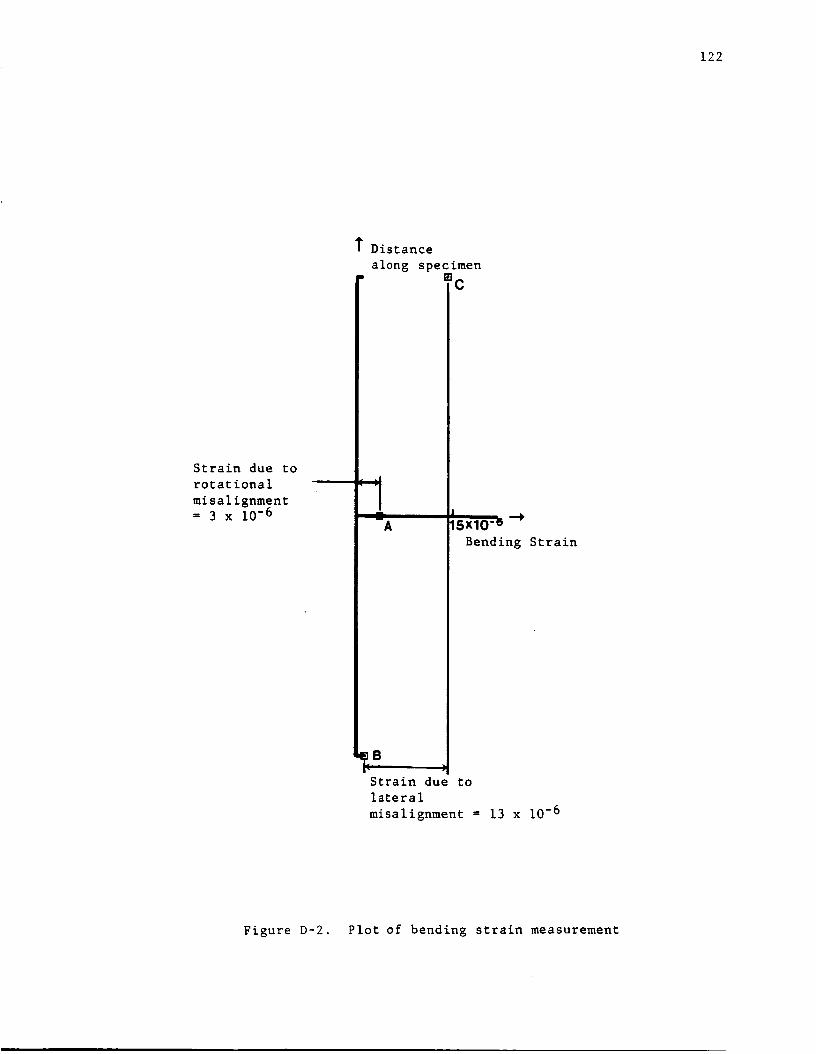
122
Strain due to
rotational
misalignment= 3 x 10 -6
T Distance
along specimen
_C
.!
]-A
Strain due to
lateral
misalignment = 13 x 10 -6
15xlo-e
Bending Strain
Figure D-2. Plot of bending strain measurement

123
TABLE D- 1
STRAIN MEASUREMENT FOR ALIGNMENT CHECK
Strain (X 10E-6)
Position Gage SX RX Bending Average SIX R1X Bending Average
Strain Strain
A 1 -17 -30 13 1152 1149 3
2 13 24 ii 12 1181 1184 3
B 3 -19 -29 i0 1144 1145 -i
4 14 21 7 8.5 1190 1193 3 i
C 5 -i0 -31 21 1162 1149 13
6 7 27 20 20.5 1183 1198 15 14
D 7 -19 -25 6 1188 1186 2
8 15 30 15 10.5 1186 1187 I 1.5
E 9 -18 -38 20 1143 1141 2
i0 16 21 5 12.5 1187 1188 1 1.5
The criterion for torsional misalignment, which is the
difference in the bending strain at points D and E, is less
than 15 microstrain [49]. The measured value of the difference
between points D and E is 2 microstrain at zero load and 0
microstrain at a load of I0 KN.
The criterion for the tensile strain range is defined as
follows.
0.95 < eT---_D< 1.05
= eTE

124
where
eTD= (e7SlO + eSSl0 + e7Rl0 + e8Rl0 - e7s0 - ess0
e7R0 - e8R0)
eTE = (egslo + el0Sl 0 + e9Rl0 + el0Rl 0 - e9s0
- elOS0 - e9R0 - el0R0)
The measuredvalue of the tensile range is
eTD--= 1.01eTE
which satisfies the criterion well.

Ee
OR_GINAT__ :.'_'•
Test and data program list .OF_ POOR QUAL_
125
C
C Th_s _s the REVISED version o? NACOMF' to meas,Jre
C COMPLIANCE for R<O. of small crack.
C June 85, J.J.LEE
DIMENSION RAM(1200)
DIMENSION IRAM(1200),LB(600),IDSF'<600),XRAM(1200),LD(600)
BYTE ICHAR
INTEGER*4 INN,INNI,IN1,NC
INTEGER IFLNM(IO),ISP(IO)
INTEGER CHI,CH2,CHIN,CH2N
TYPE*,'USING 20,000 LB L,'C ? -- Y=I'
ACCEF'T*,IGA
IF(IGA.NE.I)GO FO 650
3 CONTINUE
WRITE(7,*)'SF'ECIMEN NO. ?'
READ(5,5)ISF'
TYPE*,'No. of cwcle ? '
READ(5,*)IF'
WRITE(7,1)'FILE NAME FOR COMPLIANCE ?'
READ(5,5)IFLNM
FORMAT(IOA2)
OF'EN(UNIT=I,NAME=IFLNM,ACCESS='DIRECT',
INITIALSIZE=IO,RECORDSIZE=604J
WRITE(7,8)'COMF'LIANCE FILE=',IFLNM
FORMAT(2OA,IOA2)
I0
WRITE(6,10) IFLNM
* /T6,'_',IX,'COMPLIANCE MEASUREMENT',I6X,'*'
* ITII,'COMPLIANCE FILE =',lOA2/)
WRITE(6,12.) ISP
WRITE(6,11) IP
Ii FORMAT(IOX,'MEASURED CYCLE : ',I6,1X,'CYCLES')
12 FORMAT(IOX,'SPECIMEN NO. : ",5A2)
CALL AOUT(O,O,I)
CALL AOUT(O,I,1)
CALL AOUT(0,2,1)
WRITE(7,*)'** HOOK UF' MTS MACHINE **'
CALL ISLEEP(O,O,4,0)
C --- IFIP,_ the ln?ormatlon ar, d _rint ---
I'YF'E*,;MAX. LOAD ?'
ACCEPT*,PMAX
TYF'EI,'MIN. LOAD ( =INITIAL LOAD) ?+
ACCEF'T*,PMIN
TYF'E*,'NO. OF STEPS IN LOADING(s_me no.
TYF'E*, .... I00,200,300,..to 600 ....
ACCEPT*,NOS
in ur, load ir,_I) ?'

126
15
2o
25
50
WRITE(6,15) NOS
FDRMAT(IOX,'NO. OF STEPS IN LOADING(same no. in unloadir, Q)='
,I5)
TYPE$,'REFLECTED ANGLE AO ? ('REAL) and BASE LENGTH DO ?(REAL)'ACCEPTZ,AO,DOTYPE_,'DEALY IN EACH INCREMENT ? ( ITICK)'
ACCEPT_,ITICK
FS=I.
IF<PMIN.GT.O.) GO TO 20
TYPE_,'_Z LOADINO IN COMPRESSION _'
TYPEZ, ...... IS IT O.K. ? Y=I ..... '
ACCEPTS, KOIF(KO.NE.I) GO TO 650WRITE(7,_)'X_ SET THE INITIAL LOAD (PMAX) ZS',PMAXRL=-(PMAX-PMIN)
GO TO 25
TYPEI,'IZ SET THE INITIAL LOAD II ',PMINCALL ISLEEP(O,O,5,0)
RL=F'MAX-PMIN
DO=DOIIO0.WRITE(6,50) F MAX,PMIN,AO,DO/IO0.FORMAT(//IOX,'MAX. LOAD =',FIO.3,/IOX,'MIN. LOAD =',F10.3
/IOX,'REFLECTED ANGLE =',FP.3,/,IOX,
'INITIAL DISTANCE OF INDENT.=',F7.3,1X,'MICRONS')
C .... _ake and store a ramp wave
110
DO 110 K=O,NOSQK=K_I.
XRAM(K)=QK/FLOAT(NOS)_RLCONTINUE
120
DO 120 K=NOS+I,NOSZ2QK=KZl.
XRAM(K)=(FLOAT<NOS=2)-QK)/FLOAT(NOS)_RL
CONTINUE
125
DO 125 K=O,NOS_2IRAM(K)=XRAM(K)_204S./20000.+.5CONTINUE
150 IF(F'MAX.GT.19900) GO TO 650
160 CONTINUE
C --- call VIEW and check MLC, MSP---
NPTS=60NAV=IO
CALL VIEW(NAV,MLCI,MSFI,MLC2,MSP2)
WRITE<7,_)'CONTINUE? Y=I,N=2'

127
ACCEPT*,ILT
CHI=MLCI*8-1024
CH2=MLC2=8-1024
CALL AOUT(CHI,O,I)
CALL AOUT(CH2,1,1)
IF(ILT.EO.1)GO TO 360
200 CONTINUE
TYF'E=,'RUN JUNK ? Y=I,N=2'ACCEF'T=,ILC
IF(ILC.EQ.2) GO TO 650
C ---run JUNK ---
CALL JUNK
C ---check. MSP, MLC ---
350 CONTINUE
360
30
CALL VIEW(NAV,MLCI,MSPI,MLC2,MSP2)
CHI=MLCI=8-1024
CH2=MLC2=8-1024
CALL AOUT(CHI,O,t)
CALL AOUT(CH2,1,1)
TYPE*,'OoK ? Y=I, N=2 '
ACCEPT=,ILC
IF(ILCoNE.I) O0 TO 200
CHI=NLCIZS-I024
CH2=MLC2*8-1024
CALL AOUT(CHI,0,1)
CALL AOUT(CH2,1,1)
WRITE(6,30) MLCI,MSPI,MLC2,MSP2
TYPE%, '*_Z NOW START LOADING *Z_'
CALL ISLEEP(O,O,I,0)
FORMAT(//,IOX,'MLCI =',3X,15,1OX,'MSPI=',3X,I5,/,IOX,'MLC2=',
3X,I5,1OX,'MSP2=',3X,15,//SX,'*_% Ma>:Imum Values
,1X,'Z**'/)
C ---initialize the data of SND ---
SO=(MSPI÷MSP2)_4
AO=AO*3.1416/IBO.
CC=0.632B/(21SOISIN(AO))
CHIN=CH1
CH2N=CH2
NDSPO=O
NQ=I
NDSF'=O
CALL SND<NF'TS,MSP1,MSF'2,CHIN,CH2N,CHI,CH2,NAV,CC,NDSP,NDSPO)
CHIN=CHI
CH2N:CH2

128
405
35
410
420
NDSP=O
CALL AOUT(0,2,1)
NS=INQ=O
FORMAT(2X,'NS(odd no. is loadir,_>=',I5,1X,'NQ=',I6,2X,18,1X,'LB',I?,IX,'MICRN/IO0")
DO 410 IK=I,NO$
NQ=NQ÷I
CALL AOUT<IRAM(IK),2,1)CALL ISLEEP(O,O,OpITICK)
CALL AIN(LD(NQ),2,1)
CALL SND(NPTS,MSF'I,MSF'2,CHIN,CH2N,CH1,CH2,NAV,CC,NDSP,NDSPO)LB<NQ)=IO_LD(NQ)
DSP2=NDSP
DSP3=DSF'2/(1-DSP2/DO)IDSF'(NQ)=DSP]÷.5
CONTINUE
WRITE(I'NS)NS,(LB(KR),IDSP(KR),KR=I,NQ)
WRITE(6,35)NS,NQ,LB(NOS),IDSP(NOS)
WRITE(7,35)NS,NQ,LB(NOS),IDSP(NO$)
NS=NS+I
NQ=O
DO 420 IL=NOS+I,NOS*2NO=NO_I
CALL AOUT(IRAM(IL),2,1)CALL ISLEEP(O,O,O,ITICK)
CALL AIN(LD(NQ),2,1)CALL SND(NPTS,MSPZ,MSF'2,CHIN,CH2N,CHI,CH2,NAV,CC,NDSF',NI_SF'O)
LB(NO)=IOSLD(NQ)DSP2=NDSP
DSP3=DSP2/(1-DSP2/DO)IDSP(NQ)=DSP3÷.5
CONTINUE
WRITE(I'NS)NS,<LB(KR),IDSF'<KR),KR=I,NQ)
IF(I.GT.NI) GO TO 600
CALL KEYBRD(ICHAR)IF(ICHAR.EO.'S') GO TO 600
NS=NS+I
600
CALL AOUT(0,2,1>
CONTINUE

129
620 CALL AOUT(0,2,1)
CLOSE(UNIT=I)
TYPE_,'$Z WANT
READ(S,Z)LNS
IF(LNS.EQ.1)GO
TO MEASURE ONCE
TO 3
MORE?
650 STOP
END
_ZZZZZZZSUBROUTINE JUNK
SUBROUTINE JUNK
BYTE ICHAR
_ZZZZZZZ_ZZ_Z_ZZ
DO 300 JK=I,30000
CALL AOUT(1032,3,1)
310
DO 310 IK= 1,257
IAL=SZIK-1032
CALL AOUT(IAL,O,I)
CALL AOUT(IAL,I,I)
CONTINUE
CALL KEYBRD(ICHAR)
IF(ICHAR.EO.'S') GO TO
CALL AOUT(O,3,1)
350
300 CONTINUE
350 RETURN
END
C _ZZZlZ_ZZZ subroutir, e SND _ZZZlZZ
Y=I, N=2,3,...
SUBROUTINE SND(NF'TS,MSPI,MSF'2,CHIN,CH2N,CHI,CH2,NAV,CC,NIaSF.,NDSPO)
INTEGER TI,T2,CHI,CH2,CHIN,CH2N
INTEOERZ4 NDSP,NDSF'O,NDS
DIMENSION TI(60),T2(60),IVI(60),IV2(60)
ISH=O
258 DO 260 J=I,NPTS
Jl=J
TI(J)=CHI-SZ((NF'TS/2)-J1)
T2(J)=CH2-SZ((NPTSI2)-JI)
260 CONTINUE
DO 270 J=I,NPTS
CALL AOUT(TI(J),O,1)
CALL AOUT(T2(J),I,I)
CALL AIN(IVI(J>,O,1)
CALL AIN(IV2(J),I,I)
270 CONTINUE
JS=NPTS/2
CALL AOUT(TI(JS),O,I)
CALL AOUT(T2(JS),I,1)
IMPTI=O
IMPT2=O
DO 280 KJ=I,NAV
IMF'TI=IVI(KJ)+IMF'FI
IMPF2=IV2(KJ)+IMF'T2
280 CONTINUE
IV3=IMPTI
IV4=IMF'T2
CHI=TI(1)

130
CH2=T2(1)
N?=NPTS-NAV-1
DO 300 KK=2,N?
KT=KK+NAV-1IV3=IV3+IVI(KT)-IVI(KT-NAV)
IV4=IV4+IV2(KT)-IV2(KT-NAV)IF(IV3.GE.IMPTI)GO TO 290IMFTI=IV3
CHI=TI(KK)290 IF(IV4.GE.IMPT2)GO TO 300
IMPT2=IV4CH2=T2(KK)
300 CONTINUE304 IF<ISH)305,308,306
305 CHIN=CH1
NDSPO=NDSF'-CCZlOO._(CH2-CH2N)ISH=O
GO TO 336
306 CH2N=CH2NDSFO=NDSP-CC_IOO._(CHIN-CHI)
ISH=OGO TO 336
308 DSF'=<(CHIN-CH1)÷<CH2-CH2N))ZCC_IO0.NDS=DSP+.5
310 NDSP=NDSF'O+NDS
250 IF((CHIN-CHI).LE.(8=MSP1))GO TO 252CHI=CHI+SZMSP1ISH=-IGO TO 258
252 IF((CHI-CHIN).LE.(BZMSPI))GO TO 254
CHI=CHI-B_MSPI
ISH=-I
GO TO 258
254 IF((CH2-CH2N).LE.(8ZMSP2))GO TO 256CH2=CH2-SZMSP2
ISH=+IGO TO 258
256 IF((CH2N-CH2).LE.(SZMSP2))GO TO 336
CH2=CH2+8ZMSP2ISH=I
GO TO 258336 RETURN
END
C ZZZZZZ Subroutine VIEW ZZ$=Z=ZZ
360
370
SUBROUTINE VIEW(NAV,MLCI,MSP1,MLC2,MSF'2)
INTEGER T1,T2
DIMENSION Tl(257),T2(257),IV1(257),IV2(257),AVt(257),AV2(257)CALL ISLEEP(O,O,I,0)
DO 360 3=1,257
Ti(J)=SZJ-1032T2(J)=BZJ-1032CONTINUEDO 370 I=t,257CALL AOUT<TI(1),O,I)CALL AOUT(T2(1),I,1)
CALL AIN(IVI(1),O,I)CALL AIN(IV2(1),I,1)
CONTINUE
IMPTI=O

131
380
400
420
430
440
450
470
480
IMPT2=O
DO 380 KJ=I,NAV
IMPTI=(IVI(KJ)+IMPT1)
IMPT2=(IV2(KJ)+IMPT2)
CONTINUE
AVI(1)=IMPT1/IO
AV2(1)=IMPT2/IO
N?=257-NAV-I
DO 400 KK=2,N9
KT=KK+NAV-1
AVI(KK)=AVI(KK-1)+(IVI(KT)-IVI(KT-NAV))/NAV
AV2(KK)=AV2(KK-1)+(IV2(KT)-IV2(KT-NAV))/NAV
CONTINUE
O0 420 II=168,88,-I
II2=II+2
II3=II+6
-II4=II+8
AI=AVI(II)
A2=AVI(II2)
A3=AVI(II3)
A4=AVI(II4)
SI=A3-A4
S2=AI-A2
IF<S1.GF.O.)GO TO 420
IF(S2.LT.O.)GO TO 420
MLCI=II
GO TO 430
CONTINUE
MI=MLCI-30
DO 440 IJ=MI,I,-I
IJ2=IJ+2
IJ3=IJ+6
IJ4=IJ+8
AI=AVI(IJ)
A2=AVI(IJ2)
A3=AVI(IJ3)
A4=AVI(IJ4)
SI=A3-A4
S2=AI-A2
IF(SI.GT.O.)60 TO 440
IF(S2.LT.O.)60 TO 440
MCI=IJ
60 TO 450
CONTINUE
MSPI=MLCI-MCI
DO 470 JJ=88,168
JJ2=JJ-2
JJ3=JJ-6
JJ4=JJ-8
BI=AV2(JJ)
B2=AV2(JJ2)
B3=AV2(JJ3)
B4=AV2(JJ4)
SI=B3-B4
S2=BI-B2
IF(SI.GT.O.) GO TO 470
IF(S2.LT.O.) 00 TO 470
MLC2=JJ
GO TO 480
CONTINUE
NI=MLC2+30
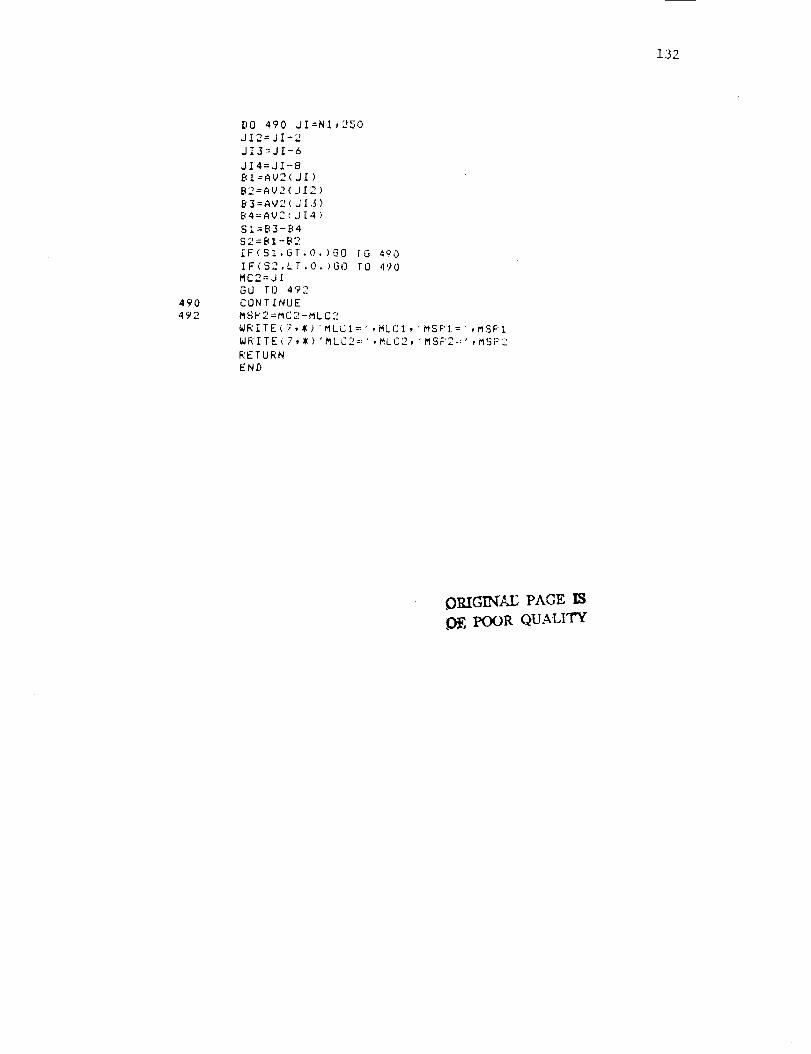
132
490
492
DO 490 JI=NI,250
JI2=JI-2
Jl3=JI-6
J14=JI-8
BI=AV2(JI)
B2=AV2(JI2)
B3=AV2(JI3)
B4=AV2(JI4)
Sl=B3-B4
S2=BI-B2
IF(SI.GT.O.)GO [0
IF(S2°LT.O.)GO rO
MC2=JI
GO TO 492
CONTINUE
MSF'2=MC2-MLC2
WRITE(7,_
WRITE(7,*
RETURN
END
490
,l '?0
'MLCI=',MLC1,
'MLC2=:',MLC2,
MSPI=
MSF'2::
,MSF'I
,MSF'Z
OILIGL-'q'2-J_PAGE IS
POOR QUALITY

ORIGINAEP_GK IBOF POORQUAL_f
133
This is a ProSram to Set LEAST SOUARES stralsht li,-,e
and _et CLOSURE LOAD from smoothln_ curve b_ averase
of data from NACOM*.FOR
JULY i?85 J.J. LEE
DIMENSION X(6OO),Y(6OO),×D(6OO),YL(6OO),LB(600
INTEGER FLNN(IO),ISF'CM(IO)
COMMON XyY,II,12pI3
,IDSF'(600)
K2=1
WRITE(7,*)'** SPECIMEN NO. ? *_'
READ(S,3) ISPCM
TYF'EI,' MIN. & MAX. DISF'L ; XMIN=? XMAX=?'
ACCEPT*,XMIN,XMAX
TYF'E*,' MIN. & MAX, LOAD ; YMIN=? YMAX=?'
TYF'E*,'... WANT metrlc unit ? .... '
TYF'E*,' i LB = 4.448 Nt '
ACCEPTI,YMIN,YMAX
WRITE(7,*)'** FILE NAME? *_("
READ (5,3) FLNN
FORMAT (IOA2)
TYF'E*,' NO. OF STEPS _'
ACCEF'T_, NOS
TYPE*,' LOADING (=I_ or UNLOADING (=2)
ACCEF T*, NS
FYF'E*,' ... . READING INCREMENT ? (ever_ Pt =i, ever_ other -_-_)'
ACCEPT*, _R
OF'EN(UNIT=I,NAME=FLNN,TYF'E='OLD',ACCESS='DIRECT ',
* INITIALSIZE=20,RECORDSIZE=604)
10
WRITE(6,10) FLNN
FORMAT(5X,'**_***_*************** FILE NAME =',LA2,2X,
'***I***********Z**ZI**********I**'//)
2O
WRITE(6,20) ISPCM
FORMAT(IOX,' SF'ECIMEN = ',5A2)
READ(I'NS) NS,(LB(K),IDSF'(K), K=I,NOS)
5O
DO 50 I=I,NOS,IR
WRITE(7,*) NS,I,LB(1),IDSF'(1)
CONFINUE
C
_0
DO 60 J=I,NOS,IR
X(J)=FLOAT(IDSP(J);/IO0.
Y(J)=FLOAT(LB(J))
WRITE(7,*) 'Y=',Y(J),'X= ,_(J)
CONTINUE
SUMX=O.
SUMX2=O.
SUMY2=O.
SUMY=O.
SUMXY=O.
WRITE(7,_) **** Choose LINEAR PORTION ,_**'
TYPE*,' • ........ FROM _ (load it) _our, ds_
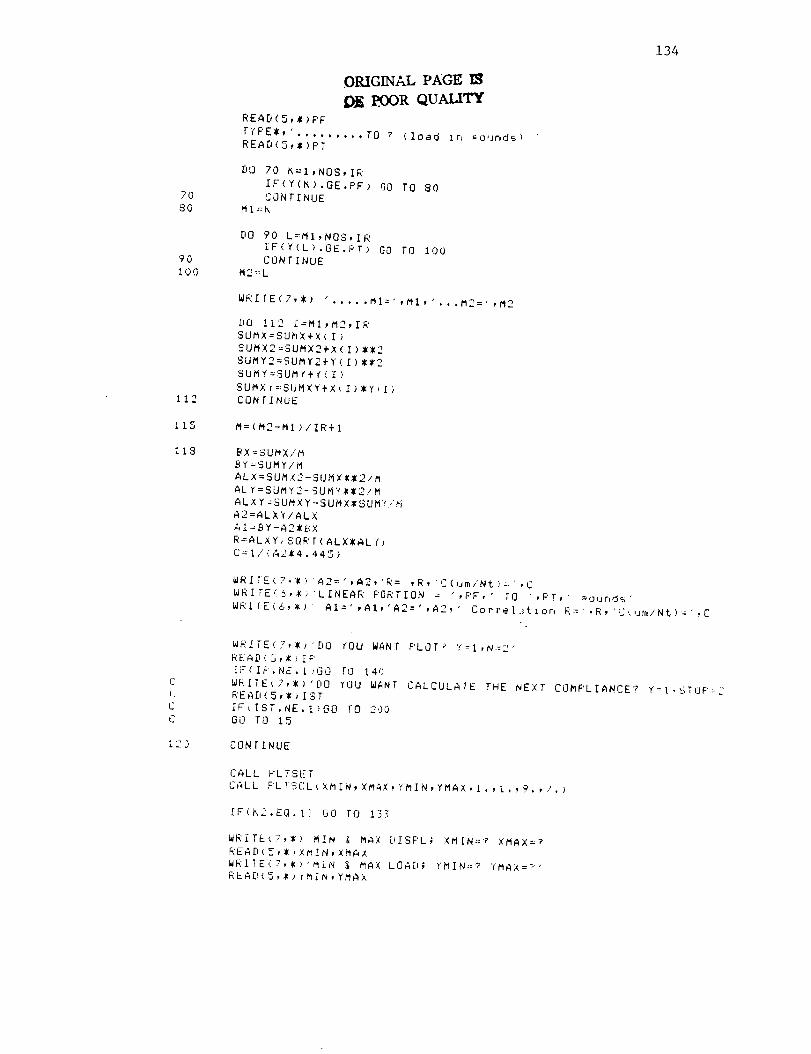
134
70
80
ORIGINAL PAGE
Dl EOOR QUALITY
READ(5,_)F'F
FYF'E*,'. ........ TO ? (load in _o_Jr, dsl
READ(5,_)F'T
DO 70 K=I,NOS,IR
IF(Y(K).GE.PF>
CONTINUE
MI=K
GO TO 80
9O
I00
DO 90 L=MI,NOS,IR
IF(Y(L).GE.PT)
CONTINUE
M2=L
GO TO 1 O0
112
WRIIE(7,*) ". .... MI=',MI,
DO 112 I=MI,M2,1R
SUMX=SUhX+X(I>
SUMX2=SUMX2+X([)_2
SUMY2=SUMY2+Y(1)_2
SUMY=SUMY÷Y(I>
SUMXr=:SUM×Y+X(1)*Y(1)
CONFINUE
...M2=",M2
115
118
M=(M2-MI)/IR+I
BX=SUMX/M
BY:SUMY/M
ALX=SUM;K2-SUMX_2/_
AL.Y=SUMY2-.SUM'F_2./M
ALXY=SUMXY--SUMX,SUMY,d
A2=ALXY/ALX
AI=BY-A21BX
R=ALXY/SORF(ALX,ALY)
C=I/(A2,4.445)
120
WRIIS(7.t_
WRIFE(6,_>
WRI_E<6,*>
A2=:',A2,'R= ' ,R, "C(um/Nt>=' .C
LINEAR PORTION = ' ,F'F, ' TO ' ,PT, " aour, ds
AI=',AI,'A2=',A2,' Corre[::tior, g'=',R,':-.,um/Nt)='.C
WRITE(7,*) DO
READiS,*)IP
[F(IF.NE.I,GO
WRITE(7,*>'[,O
READ(5,*>IST
IF<IST.NE.I)GO
GO TO 15
CONTINUE
IOU WANF F'LOT z Y:=I,N=2'
TO 140
YOU WANT CALCULAFE THE NEXT COMPLIAIWCE? f=I,STOF'-2
FO 200
CALL F'LTSET
CALL F'L I".gCL ( _;MIN, XMAX, YMIN, YMAX. i • , £ , , ',_., 7 . )
IF(KC.EO.I) GO TO 13.3
WRiTE(V,_> MIN _ MAX [pISF'L; XM{N::P XMAX=?
READ ( 5, * ) XC_IN, XMAX
WRITE.:7,t>'_IN i MAX LOAD; YMIN::? YMAX=?'
READ(5,_#)YMIN,YMAX
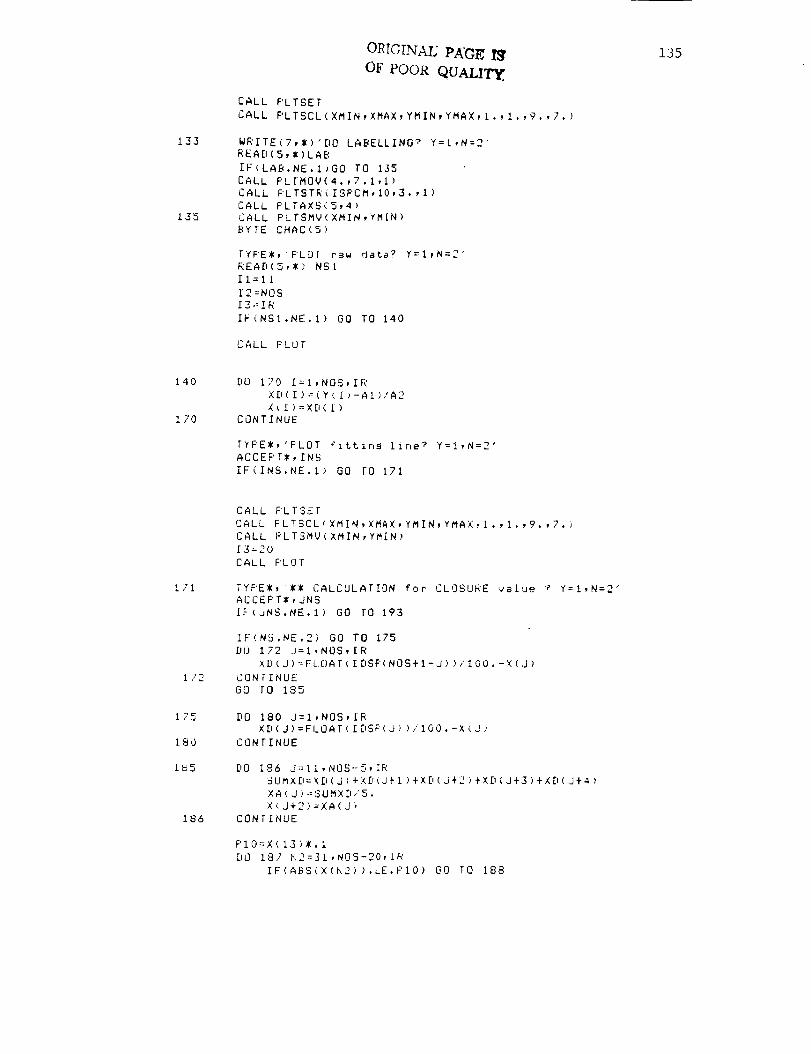
133
135
OR[GINA/A PAGE 1_
OF POOR QUALITy.
CALL F'LTSET
CALL F'LTSCL(XMIN,XMAX,YMIN,YMAX,I.,I.,9.,7.
WRITE(7,_)'DO LABELLING ? Y=I,N=2'
READ(5,_)LAB
IF(LAB.NE.I>O0 TO 135
CALL F'LTMOV(4.,7.1,1>
CALL PLTSTR(ISF'CM,IO,3.,1)
CALL F'LTAXS(5,4)
CALL F'LTSMV(XMIN,YM[N)
BYTE CHAC(5)
TYF'E_,F'LOI raw data? Y=I,N=2'
READ(5,!) NSI
11=11
12=NOS
13=IR
IF(NSI.NE.I) GO TO 140
CALL F'LOT
135
140
170
DO 170 I=I,NOS,IR
XD(1)=(Y(f)-AI)/A2
X_I)=XD(1)
CONTINUE
FYF'Em, 'PLOT
ACCEF' FW(, INS
iF(INS.NE.I
fittir, S lIF, e?
GO I'O 171
Y=I,N=2"
171
172
175
180
185
186
CALL PLTSET
CALL F'LTSCL
CALL F'LTSMV
13=20
CALL F'LOF
XMIN,XMAX,YMIN,YMAX,I.,I.,9.,7.)
XMIN,YMIN)
TYF'E_, *I CALCULATION
ACCEF'TI,JNS
IF(.JNS.NE.i> GO TO 193
for CLOSURE val,Je ? Y=:I,N=2'
IF(NS.NE.2> GO TO 175
Ff(] 172 J=I,NOS,[R
XD (J) =:FL.OAT(IDSF'(NOS+I-J) )/IO0.-X(J)
CONFINUE
GO l'O 185
DO 180 J=I,NOS,IR
XD(J)=FI_OAT(IDSF'(J) )/IO0.-X
CONTINUE
.J'>
DO 186 J=II,NOS-5,IR
SUMXD=XD (J ) +XD(J _I )+XD ( .}+2
XA ( J > =SUMX[I/5.
X(J+2)=XA(J.,
CONTINUE
+XD (J+3 ) +XD ( ,J+4 )
F'IO=X(13)_.I
DO 187 K2=31,NOS-20,[R
IF(ABS(X(K2) ).LE.F'IO) GO TO 188

136
187
188
189
190
191
193
194
195
CONTINUE ORIOINAI_ PAGE IS
Y0=X(K2)*A2+AI OF POOR QUALITy,IF(NS.NE.I) GO TO 189
WRITE(7,_)'--OPENING LOAD =',Y(K2)
WRITE(6,_)'-- OPENING LOAD =',Y(K2),'from
GO TO 190
WRITE(7,1)'-- CLOSURE LOAD=',Y(K2)
WRITE(5,_)'-- CLOSURE LOAD =',Y<K2),'IO%
data ....
of max. dlfferer, ce
CONTINUE
WRITE(6,191) (I,X(1),Y(1),I=K2-6,K2+6,1R)
FORMAT(/IIX,'I',BX,'X(1)',8X,'Y(1)'//(II3,2FI3.5))
FYF'EI,'...F'LOT for CLOSURE
ACCEPF_, NSP
IF(NSF'.NE.I) GO TO 193
? ...Y=I N=2"
CALL F'LTSET
CALL PLTSCL<XMIN,XMAX,YMIN,YMAX,I.,I.,9.,7.)
CALL PLTSMV(XMIN,YMIN)
13=IR
11=13
I2=NOS-5
CALL F'LOF
GO TO 193
WRITE<7,_)'Do _o,J want to write characters or, X-axis? Y=I,N=2'READ(S,I)IX
IF(IX.NE.I)GO [0 195
BYI'E CHAR(20),CHARY(20),CHARR(20),CHARS(20),CHARC(20)
CALL PLTSET
CALL F'LFSCL(XMIN,XMAX,YMIN,YMAX,I.,I.,9.,7.)
CALL F LFMOV(4.,O.2,1)
WRITE(7,_>'iF,P,jt 'D!SFLACEMENT-MICRONS'(or other)for X-X
READ(5,194)CHAR
FORMAI(2OAI)
CALL F'LTS/R(CHAR,20,2.,I)
CALL F'LTMOV(-3.5,2.,I)
WRITE(7,*)'Ir, Put at KEYBRD'LOAD-NEWTON'(or other)for Y-Y
READ(5,194)CHARY
CALL F'LTSTR(CHARY,2Op2.,4)
CALL F'LTMOV(1.,4.,I)
FYF'E_,' InPut 'R=..'"
READ(5,194) CHARR
CALL PLTSTR(CHARR,20,2..I)
CALL F'LTMOV(O.,-.5,1)
T'fF'E_,' Input 'S(MAX)=...' '
READ(5,194> CHARS
CALL F'LTSTR(CHARS,20,2.,I)
CALL F'LTMGV<O.,-.5,t>
['KF'E_, InPut 'CRACK LENGTH:::.,,'"
READ(5,194)CHARC
CALL PLTSTR(CHARC,20,2.,i)
WRITE(7,_)'Do _o,J Plot
READ(5,_>kl
IF(KI.NE.I>GO TC 200
r,e_ t ? Y=I;N=2'
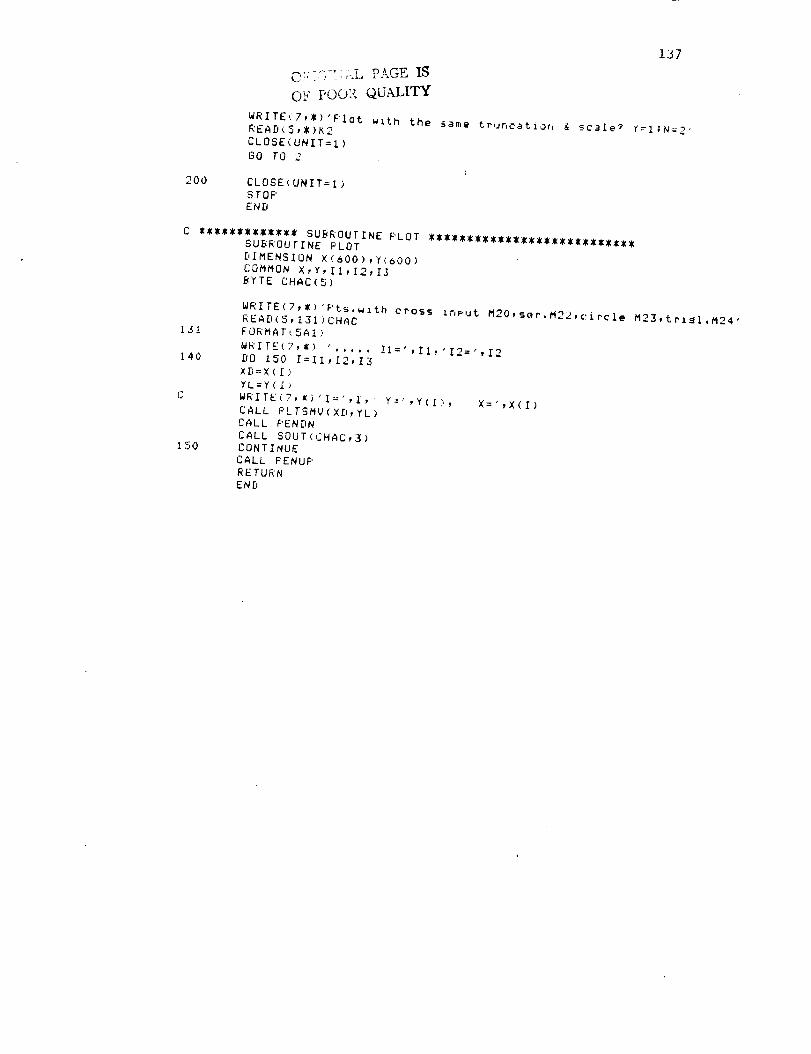
200
137
OF PO01_ QUALITY
WRITE(7,_)'F'Iot with the same trur_c_tlof, & scale _ f=I;N=2'READ(5,*)K2CLOSE(UNIT=I
GO TO 2
CLOSE(UNIT=ISTOPEND
C ***I********* SUBROUTINE PLOT ***************************SUBROUTINE PLOT
DIMENSION X<6OO),Y(oO0)COMMON X,Y,II,12,13BYTE CHAC(5)
131
140
150
WRITE<7,*)'Pts.wIth cross _n_ut M20,s_r.M22,circle M23,tri_l.M24'READ(5,131)CHAC
FORMAT(SAI?
WRITE(7,_) '. .... Ii=',Ii,'12=',12DO 150 I=11,12,I3
XD=X(1)
YL=Y(I>WRITE(7,_)'I=',I, Y:',Y(1), X=',X(I)
CALL F'LTSMV(XD,YL)
CALL PENDNCALL SOUT(CHAC,3)
CONTINUECALL F'ENUF'RETURN
END

138
C
C THIS IS TO PLOT THE DA/DN vs DELK or, LOG-LOG SCALE
C ON THE NEW PLOTTER(LVPIG).
C THIS IS COMBINED with DADNFL.FOR and NASIF.FOR.
C
C AUG. i785 J.J.LEE
DIMENSION XK(IOO),YD(IOO),DADN(IOO),DELK(IOO),N(IO0)
DIMENSION CL(IOO),AAVG(IO0)
INTEGER FLNM(IO),ISF'CM(IO),OFLNM(IO),SYMB(5)
COMMON A,Smax,Smln,B,R,W,NSI,DELK1
TYPE*,'** SPECIMEN NO ? **'
READ(5,4) ISF'CM
FORMAT(IOA2)
TYPE*,'*** from OLD FILE ? Y=I, N=2"
ACCEPT*, NS2
IF(NS2.NE.I> GO TO 10
TYPE*,' .... OLD FILE NAME ?...'
READ_5,4) OFLNM
TYPE*,'....° NO. OF DATA ";"
ACCEPT*,NOS
OPEN(UNIT=I,NAME=OFLNM,TYF'E='OLD',ACCESS='DIRECT',
INITIALSIZE=IO,RECORDSIZE=604)
READ(I'NS2)(K,N(K),CL(K),DELK(K),DADN(K),K=O,NOS)
CLOSE(UNIT=I)
[tO 5 K=I,NOS
WRITE(7,*) K,'A:',CL(K),',,m','DELK=',DELK K),'MF'a'
CONTINUE
GO TO 35
I0 B=2.3E-3
R=3. 18E-3
W=50.E-3
TYPE*,'** CARTEGORIZE THE CRACK ***'
TYF'E*,' SURFACE CRACK=2, CORNER CRACK=t
ACCEPI*,NS1
TYF'E*,'Smax= (MF'a)'
ACCEPT*,SMAX
]YF'E*,'Smln= (MPa)'
ACCEPT*, Smlrl
WRITE(7,*)'NO. OF DATA "P'
READ(5,*)NOS
TYPE*,'... INPUT THE DATA ....
TYPE*," .:;: for END OF DATA t_Pe Jr, i000 .:.>'
20
DO 20 !D=O,NOS
WRITE(I,*) 'I=',ID,';CYCLES;CRACi LENGTH(It, mm>'
READ(5,*) N(ID),CLiID)
CONTINUE
C .... DADN is c_iculated Jr. I.E6*MM/CYCLE ....
DO 22 I=I,NOS

139
99
C
25
3O
35
40
45
46
12
2
47
48
1
DADN(1)=(CL(1)-CL(I-I))IIOOO./((N(1)-N(I-1))_NS1)CONTINUE
DADN(O)=O.O
FOR SURFACE CRACK CL=2_A ,CORNER CRACK CL=A ...DELK _s calculated for AVG. a ......
AAVG(O)=O.ODO 30 J=I,NOS
AAVG(J)=(CL(J)+CL(J-1))/(FLOAT(NS1)_2.)A=AAVG(J)
CALL NASIFDELK(J)=DELKIWRITE(7,_) J,'C.L=',AIIOOOINSI,'MM','DELK=',DELK(J)CONTINUE
IF(NS2.EN.1) GO TO 35TYPE*,'*** STORE DATA
WRITE(7,*)'FILENAME?'READ(5,4>FLNM
IN A FILE Ii_'
OF'EN(UNIT=I,NAME=FLNM,ACCESS='DIRECT',INITIALSIZE=IO,RECORDSIZE=604)
NS=IWRITE(I'NS) (K,N(K),CL(K),DELK(K),DADN<K),K=O,NOS)
CLOSE(UNIT=I)
TYF'E_,'. .... DATA FILE IS GENERATED .... '
DA/DN=DA[_NI1.E-6 (MM/CYCLE) ....STORE DA/DN DATA with OADN unit ...
DO 40 I=I,NOS
YD(1)=DADN(1)_IO._I(-6)XK(1)=DELKi_>
CONTINUE
TYF'EI,'._.:I<I.::_WANT TO PRINT THE DATA ? Y=I,N=2 >>>>'ACCEF'T_,NS3
IF(NS3.NE.I) GO TO 49WRITE(6,46) ISPCM,SMIN/SMAX,SMAX,NOS
FORHAT(///,SX,'_ DA/DN DATA _',//,IOX,'SF'ECIMEN"
,' NO. = ',IOA2,/IOX,'STRESS RATIO=',F3.1,/IOX,'MAX.STRESS=',FS.I,IX,'MF'a',/IOX,'NO.0F DATA=',I5//
7X,'CYCLE(XIOOO)',3X,'CRK L 2a(mm_',IX,'AVG. a(mm)',3X,'DELK(MF'a-M)',3X,'DADN(mm/CYCLE)',/)
WRITE(7,_) .... NOS=,NOS
DO 47 J=O,NOSWRII'E(6,4S) J,N(J) ,CL(J) ,AAVG(J) ,DELK(J) ,DADN (J)
CONTINUEFORMAT(/2X, 13,4X, I5, IOX, FS. 3,7X,F5.2,12X,FS.2,2X,FS.3, IX,
'XI.E-6")
TYF'EJX," "-:_:i_ziWANT TO PLOT ? Y=I,N=2 .... 'ACCEPTS(, NP
IF(NF'.NE.I) GO TO 165
C ******o,o,o,,,t
C ........ LABELING LOG-LOG SCALE ; PLOT .......
,i _: I_L PAGE IS
,tT>FPOOR QUAIXI_

C
49
C556O7O
ORIGINAL P_GE IS
OF POOR QUALITY
140
TYF'EI,' """'"......WANT TO PLOT
ACCEPT*, NF'°,.IF(NP2.NE.I) GO TO 165
P Y=I, N=2 >>i::'
WRITE(6,*) '£N;SF'1;IP1250,750,7400,6900;SCO,2000,O,6000'
TYPE*,'. .... WANT TO LABEL(=I> or PLOT THE DATAACCEF'T*,NS5
IF(NS5.EO.2) GO TO 125TYPE*,'.... NOW LABELING ..... "
TYPE*,' ?? CHECK A PAPER ON THE PLOTTER ??'TYPE*,' READY ? Y=I'ACCEPT*, NS4
or,l'_(=2) ?'
WRITE(6,*)
WRITE(6,*)
WRITE(6,*)WRITE(6,*)
WRITE(6,*)
WRITE<6,*)IY=O
TYPE*,'..°ACCEF'T*,IIII = 6
'F'UO,OPD2OOO,O,2OOO,6OOO,O,6OOO,O,OF'U'"CP40,-3.;DT ;SI.2,.3;LBDELK(MF'A-M ''LBI/2) ;'"PAO,O;CF'-7,t2;DIO,I;SI.2,.3;LBDA/DN(MM/CYCLE)
"F'A8OO,6OOO;CF'O_4;DII,0;SI.3,.4;LB',ISPCM,""DII,O;TLI.5,O
If= ?'
DO 60 I=l,llEl=I*1.
YI=I.*IO._*(EI-I.)
IY=ALOGIO(YI_*IO00
IF(IY.EO.3999) IY=,lO00
WRIFE(?,*_ 'LOG(YI)=',IY
WRITE(6,*) 'F'AO,',IY,";YTWRITE(6,*) "CP-4,-.25;LB'.[Y/IOO0,
IF(IY.GE.o998) GO TO 70
DO 55 J=l,8Y=YI*((J+I)*I.)
JY=ALOGIO(Y)_IO00WRITE(7,*) 'LOG(Y)=',JYCALL ISLEEF'(O,O,O,20)
WRITE(6,*) 'F'AO,',JY,';YT'WRITE(6,*) 'CP-S,-.25;LB',YY,'
CONTINUE
CON FINUE
IX:O
WRITE(6,*) "LIT ;SIiDII,O'
DO I00 I=I,3FI=I.*I
XI=IO.**(FI-1.)
LX=ALOOIO(XI)*IO00WRITE(b,*) 'F'A',LX,',O;XT'
WRITE(6,*) 'CF'-5,-.95;LB',LX/IO00,WRIFE(_,_> 'CPO,-I.2;SI.2,.3;LBIO
IF(LX.GE.1998) GO TO 120
DO 80 J=l,8
XJ=XI*((J+I)_I. )
LXJ=ALOGIO (XJ)*I 000
CALL ISLEEF'(O,O,O,20 )

141
SOI00120
125
127
130
135
140
145
150
155
160
165
WRITE(6,*)'PA',LXJ,',O;XT'CONTINUE
CONTINUECONTINUE
PLOT THE DATA ....
TYPE_,' .... WHICH SYMBOL ? (÷=I,Z=2,x=3,o=4)'READ(5,Z) NSa
FORMAT(2X,'J=',I3,3X,'X=',FT.1,3X,'Y=',F7.1)WRITE(6,1)'BT "
IF(NS6,EQ.2) O0 TO 135
IF(NS6.EO.3) O0 TO 145IF(NS6.EQ.4) GO TO 155
DO 130 J=I,NOSX=<ALOGIO(XK(J)))_IO00.Y=(ALOGIO(YD(J))+7.)=IO00.WRITE(7,i27) J,X,YWRITE(6,1) 'SM+ ;PA',X,Y,'PD;LT3'
CONTINUEWRITE(6,1) 'PU'O0 TO 165
O0 140 J=I,NOS
X=(ALOO10(XK(J)))_1000.
Y=(ALOOIO(YD(J))+7.)$1000.WRITE(7,127) J,X,YWRITE(6,1) 'SMI _PA',X,Y,'PD;LT4'
CONTINUEWRITE(6,_) 'PU'
80 TO 165
DO 150 J=I,NOSX=(ALOOIO(XK(J>))=IO00.Y=(ALOO10(YD(J))+7.)I1000.WRITE(7,127)J,X,Y
WRITE(6,1) "SMx ;PA',X,Y,'F'D;LT6'CONTINUE
WRITE(6,1) 'PU'GO TO I65
O0 160 J=I,NOSX=(ALOGIO(XK(J)))ZlO00.
Y=(ALOOIO(YD(J))+7.)=IO00.WRITE(7,127)J,X,YWRITE(b,I) 'SMo ;PA',X,Y,'PD'
CONTINUEWRITE(6,1) 'PU'
TYPE_,'ANOTHER PLOT ? Y=I,N=2,3,..'READ<5,1) NS7
IF(NS7.EO.1) GO TO 3
333 SFOF'ENE¢
C IIZZI_$1 SUBROUTINE NASIF i_I_Ii_I
SUBROUTINE NASIF

142
COMMON A, Sea;:, Stair,, B,R, W, NSI, DELK1
C This is to calculate S.I.F. for small s,,rFace crack
C and corner crack of edae notched s_ecimen from NASA.
C (ref. Instruction to ParticiPants )
C June, 1985 ',
REAL M1,M2,M3
C ...All the unit are in METRIC (L=m , SIF=MF'a-mI*I/2 , S=MF'a) ....
DELS=SMAX-SMIN
A=A*I.E-3
C ...FOR CORNER CRACK NSl=I ,SURFACE CRACK NS1=2
C ... ' T=B , ' T=B/2
T=B/FLOAT(NSI)
C=A$(.9-.25_(A/T)_I2)
C
C
C
TYPE_,'CRACK DEPTH msed c = (mm)'
ACCEPTI, CD
CD=CDI1.E-3
WRITE(7,_) 'CALCULATED c = ', C, 'm'
WRITE(7,_) 'MEASURED c = ', CD, 'm'
TYF'E_, 'WHICH VALUE OF c BE USED ? ..Calc.=i, Measd =2'
ACCEF'T*, NS2
IF(NS.EQ.2> C=CD
TYPE_, ",.. CHECK 0,2<a/c.:::2
WRITE(7,_) 'a/c= ',A/C
WRITE(7,_) 'a/t= ,alt
ar, d a/t'::il ,.."
IF(A/C.G[.I.) GO TO 50
Q=!.+I.464_(A/C)_Zl.b5
MI=I
GI=I
FP=I
GO TO oO
5O Q=I_I.4641(C/A)I_I.65
MI=(C/A>I*.5
F F'=MI
GI=I
60 M2=.OSI(.II+<A/C)_I,5)
M3=.29/(.23÷(A/C>I*I.5)
C .... V means Ramda ir, eou. i0 and U mear, s Gamma ir, e_u. 14 ....
V=I/(I+.I564_C/R)
G2=(I+.358_V+I.425IVI_2-1,578_VII3+2,156_V_I4)/(1+.OB_VII2>
G3=I+,II(I-A/T)_IO
G4=I.14-.I/(I+C/R)_.5
U=(C+R)/W
FW=I-.2XU+9.4_U_2-1_.4_U*_3+27.1_U_4
FSN=(Ml+M2*(A/T)**2+M3*(A/T)I_4)_Gl*G2IG3_64_FF'_FW
IF(NSI,NE.I) GO TO I00
DELK 1 =DELSI(FSN*SQR r (3.141591A/Q )

143
GO TO 300
C .... CORNER CRACK .....
I00 IF<A/C.GT.I.) GO TO 150
FCN=FSN_(I.13-.Og_A/C>
GO TO 160
150
160
C180
C
C
C
C
C
C200
FCN=FSN_(I+.O4_C/A)
DELKI=DELS_F'CN_SQRT<3.141591A/Q)
IF(NSI.NE.I> GO TO 200
TYFEI, " .... NOW! CALCULATED .... '
TYF'E_,"
TYF'E_,'
WRITE(7,_> S.I.F RANGE for surface crack. =
GO TO 300
', DELK,' MPa-ml/2'
WRITE(7,I) ' S.I.F RANGE for corner crack.. = ',DELK,' MPa-ml/2'
300 I@ETURN
END

144
Appendix Iio

145
TEST DATA
SPECIMEN NUMBER :
DATE: _//_/d'_-
PARTICIPANT' S NAME:
TEST TEMPERATURE:
RELATIVE HUMIDITY:
A -_-4 -oq-
Joo-Jin Lee
John Cieslowski
66"/.
WAVEFORM TYPE:
LOADING SEQUENCE TYPE:
Sinusoidal wave, 20 Hz
Constant amplitude
R-RATIO : O,
S max = _.m--5" MP_
S min = II ;_ • _ _P_
FINAL LENGTH OF CRACK:
COI_MENTS:

146
RGRRD Sho rt Cr ack DFITR CHRRT
Record o_ crack lengths and malo
_. _l_v_laPage / o# _4L Loading Type ,,A=o._Specimen no A__A_o_ Peak Stress. _.4" MPa
B. lmm grid
[lllll lllifjI1_1 Z I I I I I I ILllll I I IIIii
UII{II Itlll
_!'lll',,l IHIIII ilii
III I I I I lift
IIIIIIIIIIIH
r! t II IIII1_I I I I IIIII i_
I I II ! IIII I_
Ill I I I I II If iIll III I I I I I i!t I I I I I I I II IU) I1 III III IIt111.'''."
Ull I I J I J II |
'llllllllllnI I it i1111 IHI III I III t I_
I I tl I111 I I RI III t1111I_I t I I t tlt I EftIIIIIIIIIF_
L!
_k Cycle=
Ll-o__2._..o_mmLE mm
L3 mm
L4 mm
L5
30_ CyclesL! ./o_ mm
L2 mmL3
_ Mm
L4L5
_4_ Cycles --
L2_ mm
L3 mmL4 mm
L5
CyclesL| .mm
L2 mm
L3 mm
L4 mmL5
Cycle=LI mm
'L2 mm
L3 mm
L4mm
L5
Cycle=mm
L2 mmL3
mm
L4 mm
L5
mm
mm
mm
mm
mm
mm
mm

147
RGRRDRecord
Sho r t Cr ack FIRTR CHRRToT
crack lengths and map
Loading Type R--o._"
Peak St rest... _-
Page 2 oT
Specimen no A.54_j_it
B. lmm grid< ........ B ---)
illlllllIII Ill I t1111I I I I II1 IItll
IIIII-H-H-HI--I I I I I i I I tl III I I I I I [ I,,| I _I I I I I t I I II IIill lill Ill||
,_q_ CyclesL; .,/:iS"mm
L2 mm
L3
L4
L5
_ _CyclesL! ._0 mm
L2 mm
L3
L4
L5
CyclesL! ./90 mm
L2 mm
L3
mm
mm
mm
MPa
!1 I I t I I | |1 IIIJ--LLI I I ! I I I I
_ IIIIIIII[|It i I I I I I II
_Jrll |1tl Iflllll|[II If _|
.LIIIIIIIII I I I I III ii
mm
mm
mm
mm
L4 mm
L5 mm
._IL_ Cyc 1 • sLI .2/0 -mm
L2 mm
L3 mm
L4 mm
L5 mm
,i[gk Cycles
L I .2J_ mm
L2 mm
L3 mm
L4 mm
L5 mm
_'Ok Cycles
L l ._75" mm
L2 mm
L3 mm
L4 mm
L5 mm

148
RGRRD
Record
Short Cr ack FIRTR CHRRT
o{ crack lengths and map
Page 3 o{
Spsclmen no ._.__r _
B. |ram 9rld
< ........ B ........ >
|1 I I i I ! I I I| IIII
LJ'n[ I'1 I I ! I f i i_lllU!llll*lll I
--4FH'4-H,.H4..rI!tlll I I1|11
':I'']I,li,II|l,' IIIi tIll I[I ! li I I I
Loading Type ,,Q=O._
Peak Stress, ._
L!k Cycles
•90_ mm
L2 mmL3
L4
L5Cyc I es
• 30 F mmL2 mm
L3
L4
LS
Cycles
mm.990L2
1_3
L4
LI .3g_L2
mm
LS
60 kLI
Cycles
-mm
mm
mm
mm
mm
L3 mm
L4
L5
.Cycles
•_4-_" mm
L2 mm
L3 mm
L4
LS
6_W cycle=L[.,_/O mm
LE __ mmL3
L4L5
mm
i _'T'=r i |sl I r_1111i1111111
I flllllll_I I I I I Itl i r_
lllfI-H-hH_ll_I Ill I|11 I I III I I I I I t.1 I I III III IIIII IIII t I I I Z t I I t I'1
MPa
mm
mm
mm
mm
mm
mm
mm
mm
mm
mm
rnm
mm

149
FtGRRD Short Crack DFITFI CHRRT
Record o_ crack lengths and map
Page_ 4 of 4, Loading Type _-_._Specimen no A-C4.-cvt. - Peak Stre== _ HPa
8. ]mm grid
< ........ B ........ >
l| I I I t I l; I I
EIY_-_--" f I !I1 I1 I I I I III
Illtl Z, 1, ,,.Hff.[!ll II I I It i[# I I I I I _ II I j
Ill! I1| Ill I illli III iiltl
t'1 ; I I ! i | 1 I i rliliill It Itl_t III Itll I I N
_H-I-I+H.+_--' I I I I I I I I I Fi]i I I I I I I tl I I pi
I Ill nl ill qI t I I i I I I I / [_1
I i I I 1't I I I IllI III illll I_i i I ; I I I,I I I [11 II1 lili i 1_
II .ff 14-t-.I--N-Il-l I I I,,, I IIII, IrlI I I I I ill I I rlI II I lllll i il
J< Cyc Ie=L l ,,4,40 mm
L2 mm
L3
L4,.
_,/< Cycles
LI .4.20mmL2 mm
L3
L4
L5
6°_t/< Cycle=L! .;_D mm
L2 mm
L3
LtL2
L3
L4
LI
L2
,L3L4
L4
L5
Cycle=-mm
mm
L5
Cyclesmm
mm
L5
Cycle=LI mm
L2 mmL3
L4L5
mitt
mm
L5
mm
mm
mmmm
mm
mm
mmmm
mm
mm
mitt
mitt
mm
mm
mm
mm

150
_$ DA/DN DATA SZ
SPECIMEN" NO. = A5404.L1NO. OF DATA = 18
R= 0.50
SMAX=225.0 MPa
CYCLE(XIO00) CRK L. 2a(mm) AVG. a(mn,) DELK(MF'a-M)
0 26 0.080 0,000 0.00
1 30 0.105 0.093 4.05
2 34 0.125 0.115 4.48
3 38 0.135 0.130 4.74
4 40 0.140 0.137 4,87
5 42 0.190 0.165 5.29
6 44 0.210 0.200 5.77
7 48 0.'210 0.210 5.90
8 50 0.275 0o.4_ _ 6.29
_ 0.305 0.290 6.81
I0 54 0.305 0.305 6.96
II 56 0.330 0.317 7.09
12 58 0.335 0.332 7.23
13 60 0.345 0.340 7.31
14 62 0.410 0.377 7.65
15 64 0.410 0.410 7.94
16 66 0.420 0.415 7.98
17 68 0.500 0.460 8.35
DADN(mm/CYCLE)
0.000 XI.E-6
6.250 XI.E-6
5.000 XI.E-6
2.500 XI.E-6
2.500 XI.E-6
25.000 X1.E-6
10.000 XI.E-6
0.000 X1.E-6
32.500 Xl.E-6
15.000 X1.E-6
0.000 XI.E-6
12.500 XI.E-6
2.500 XI.E-6
5.000 XI.E-6
32.500 XI.E-6
0.000 Xi.£-6
5.000 X1.E-6
40.000 XI.E-6

151
,q.0I
_r113I
.el
XU
_uII
xm<ZXO
me *l
0+0III
_+o
III I I I I IIIII I I I I IIIIII I I I IIIIII I I I IIIIII I I IIIII I I I I
'0 0 '0 '0 '0qm qlm qlm 9m _,_ qlm
0
<[
!
m
m
n
i
o0
0qm
(:II:)A:)/HN) NO/VO

A-54-04
,O,-._C,.D_"ATSPA_"_, 1_1
DE POOR QUAZj_

153
TEST DATA
SPECIMEN NUMBER:
DATE: _/_.,/j,_
PARTICIPANT' S NAME =
,4 - 6S'-o7
TEST TEMPERATURE:
RELATIVE HUMIDITY:
WAVEFORM TYPE: Sinusoidal wave,
LOADING SEQUENCE TYPE:
R-RATIO = O,
S max = _ZF _,
S rain = { I 2. _- HPo,.
FINAL LENGTH OF CRACK:
COMI_ENTS:
Cr_c_ _s
Joo-Jin Lee
John Cieslowski
6=_Y.
20 Hz
Constant amplitude

154
of
P_ge / af
Crack DRTFi CH RT
B. Imm grid
< ........ B ........ )
L1
MPz_
mm
L5 mm
mm
•L2 mm
L3 mm
L4m
Cyc 1msL 1, mm
L2 mm
L3 mmm
L4 _ rrlr_
L5
Cyc 1• 8L ] mm
L2. mm
L3 mm
L4 mm
L5_ mm
Cyc l esL I mm
L2 ;11m
L3 mm
L4 mm
L5 mm
Cyc IesLI -mm
L2 mm
L3 mm
L4 mm
L5 mmm •
Cyc l e:

155
FIGRRD Sho rt Cr ack DFITR CHRRT
Record of crack lengths and map
Page 2 of 8 -
Spec 1men no/4-(_-o7, Peak
B. lmm grid< ........ B ........ >
Loading Type R-o.;¢
Stress 22_ MPa
_kL1 ._a_
L2L3
Cyclesmm
mm
L4
L5
Cyclesmmi
48
L2L3
L4
L1 ,o_ltL2
L3
111111
52.
LI
L2
L3
LI
L2L3
L5
Cyclesmm
mm
LI .04-qL2
L3
L4L5
Cycles-mm
mm
L4L5
Cyclesmm
mm
L4L5
Cyclesmm
mm
L4
L5
mm
mm
mm
mitt
mm
ITIm
mm
mitt
mill
mitt
mm
mm
mllt
mitt
mm
mm
mm
mm

156
RGRRD
Record of crack
Short Crack DFITR CHRRT
Page _ o.r 8,Spectmen no _-_S'-07
B. lmm grid
< B
Loading TypePeal_ Stress
}
lengths and m=ia
A=o..¢"
2.9._" MP a
_& 00(_ Cyc IesL l._mm
L2
L3
L4
mm
L5
mm
mm
mm
_9: _ Cyc IesL 1 ._a¢- mm
L2L3
L4
mm
mm
mflft

157
RGFIRD
Record
Page_4 °_ _-Spe= imen no--_____.__r__z3_..9,_
B. 1ram grtd
(........ B ........ >
Short Crack ]3FtTFI CHFIRT
o_ crack lengths and map
Loading Type .,_-"-O. _"
Peak Sire== _._-, -MPa
_(,9.00(3 Cyc I e=• LI _nf_ mm
L2 _'rf mm_ mm
L4 mm
L5 mm

158
&.
&
RGRRD Short Crack DRTR CHRRT
Record oT cr_ck lengths _nd m_p
Page aj o{" _- Loading TypeSpecimen no _.___b__j_._. Peak St.ress
O. 1me grid
< B ........ >
7..OOO
_: 000L1
"LI .t_J mm
L2 .mg_ mmL3 mm
L4 mm
_5
Cycles
L1_mmL2 _og& mm
L3 mmL4 mm
L5
Cycles.1"/4 mm
L2 ._92L3
L4
mm
mm
mill
mm
mm
L5 mm
_, 0(_ Cyc 1• s• LI ,llr -mm
L2 ./_4 mm
L3 . o'7_ mmL4 mm
|m
L5 mm
_:0_ CyclesLI -_ mm
L2 .n'J4. mm
L3 .#Tb mm
L4 mm
L5 mm
90_0_0 Cyc I e=L1 . _. mm
L2 .104. mm
L3 .O'T6 mmL4 mm
L5 mm

159
¢.
RGRRDRecord
Page 6 o._
Speclmen no ..,___
Short Crack DRTR CHRRT
o_ crack lengths and m_lo
Loading Type ,q.--o ._Peak Stres= ___ MP_
B. lmm grid........- B ........ >
q/.00Q cy_n,,• Ll_mm
L2 , !._! mm
L3 .o76L4
'L5
Cyc I es
mE
mm
L3 ,/?/ mm
L4_mm
L2
/o2,,.o(/_LI. ,,t__
L2
mm
mm
mm
mm
mm
mm
mm
mm
mm
mm
_e NoT cle,.-

160
£
£
RGRRFI Short Crack 1-1FITR CHRRT
Record o_ c crack lengths and map
Page 7 o_ @ Loading Type
Specimen no_.__._- 7 Peak Stress
B.|mm grid
(.._ B ---->
MPa
/_00 Cycle,I ._o7
L2
mm
mm
L3 .201 mmL4 •/,z mm
/l_, DO0 Cyc ! e,1.I
L2....r/tmm mm
L3 .7.._/ mmL4 .//2. mm
L5 _/77 mm
/8 9.a_O Cyc 1e,L I . {,3Z mm
L2 mm
L3 ."¢zI mm
L4 ./4z mmL5 ./2,r mm
//0, OOO Cyc 1e="L l .,-/19
L2
//z.,o#O- "L 1 ,qOI
!_2
L2
- mmmm
L3 ._l.t mmL4 ./4,# mm
L5 ,/&_ mm
Cyclesmm
mffi
L3 .____=._T__,,1 mmL<_mm
L5 •/"_7 mm
Cyc 1e=mm
mm
L3 .._. mm
L4 ._..2"]_mm
L5._,_..J._.,L.mm
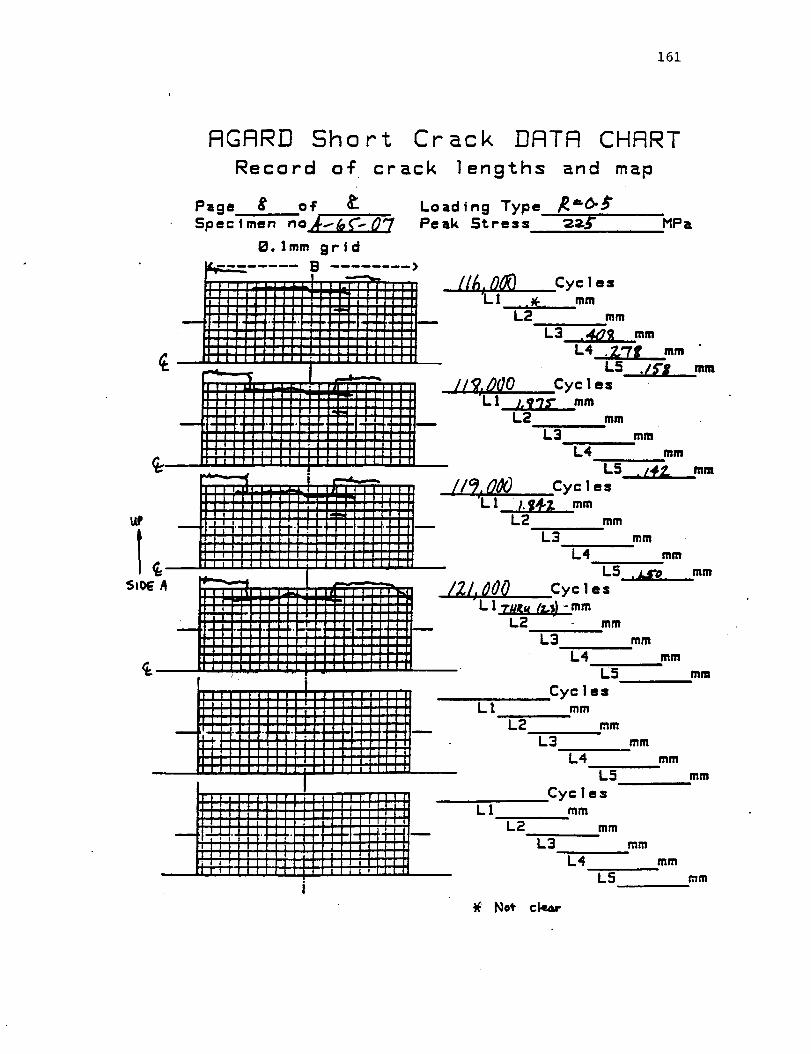
161
RGRRD Sho rt Crack DFtTFt CHFtRT
Record o{ crack lengths and map
Load i ng Type./1_ -_,_"Peak Stress _._" _MPa
Page g o{"
B. Imm 9rid
B ........ >
II_.DI_ Cy=les_! ..__ mm
L2 mm
L3 .,_2 mm
mmmm
mmL4
L2 mm
mm
mm
mm
mm
L!
L3
mm
mm
mm
mm
L4
L5
Cy= ] • smm
L2_ mm
L3
L4L5
•_ No_ ct_._

162
0
1
2
3
4
5
6
7
8
9
I0
ii
12
13
14
15
16
17
18
19
20
21
22
23
24
$I DA/DN DATA ZZ
SPECIMEN" NO. =
NO. OF DATA =R= O. 50
SMAX=225.0 MP=
CYCLE {XlO00) CRK
A-65-O7.L126
L. 2a(mm)
42
44
46
54
56
60
64
70
72
74
80
84
86
92
96
98
100
102
104
106
108
110
112
114
118
0.033
0.038
0.044
0.049
0.065
0.071
0.087
0.114
0.125
0.136
0.158
0.174
0.185
0.213
0.349
0.392
0.425
0.463
0.507
0.518
0.632
0.719
0.801
0.970
1.875
AVG. a(mm)
0.000
0.018
0.021
0.023
0.029
0.034
0.039
0.050
0.060
0.065
0.073
0.083
0.090
0.100
0.140
0.185
0.204
0.222
0.242
0.256
0.287
0.338
0.380
0.443
0.711
DELK(MPa-M)
0.00
1.88
2.02
2.14
2.36
2.57
2.76
3.09
3.35
3.49
3.69
3,90
4.04
4.24
4.96
5.62
5.87
6.09
6.34
6.50
6.85
7.37
7.78
8.33
10.32
DADN(mm/CYCLE)
0.000 XI.E-6
1.250 Xl.E-6
1.500 XI.E-6
0.312 X1.E-6
4.000 X1.E-6
0.750 X1.E-6
2.000 X1.E-6
2.250 X1.E-6
2.750 X1.E-6
2.750 XI.E-6
1.833 XI.E-6
2.000 XI.E-6
2.750 XI.E-6
2.333 Xl.E-6
17.000 X1.E-6
10.750 XI.E-o
8.250 XI.E-6
9.500 XI.E-6
11.000 X1.E-O
2.750 XI.E-6
28.500 XI.E-6
21.750 XI.E-6
20.500 X1.E-6
42.250 XI.E-_
113.125 XI.E-o

163
C.I
It)(D!
_.vXt.1
CUrl"(_1 t,.)
<ZXO
It1 m ..I
. 0
i
u
&
° UJ
(3"13_3/NN) NO/VO

164
r"-EDI
LO_DI
C]I
3
+
EQ+_'9 Eg+30gg'_
IDIDO
OID
I
Eg+_g'g Ig-_ggg'g
soNno,=I-OBO'I

of" ")OOR qv_
A-65-07
/ °

DRIGINAIL PAGE I_
OF POOR QUALITy.
A-65-07

167
SIDE4,
BORE CRACK FRONT
SIDEr
Tracing of Crack Front for A-65-07

168
TEST DATA
SPECIMEN NUMBER:
DATE" _'/'_"# / e
PARTICIPANT' S NAME-
TEST TEMPERATURE:
RELATIVE HUMIDITY:
A - 71 - o_
Joo- Jin Lee
John Cies lowski
Z7"c
WAVEFORM TYPE :
LOADING SEQUENCE TYPE:
R-RATIO ---
S max =
S rain =
Sinusoidal wave, 20 Hz
Constant amplitude
FINAL LENGTH OF CRACK:
COMMENTS :
_-kL _._ 9._.¢ .
|,_
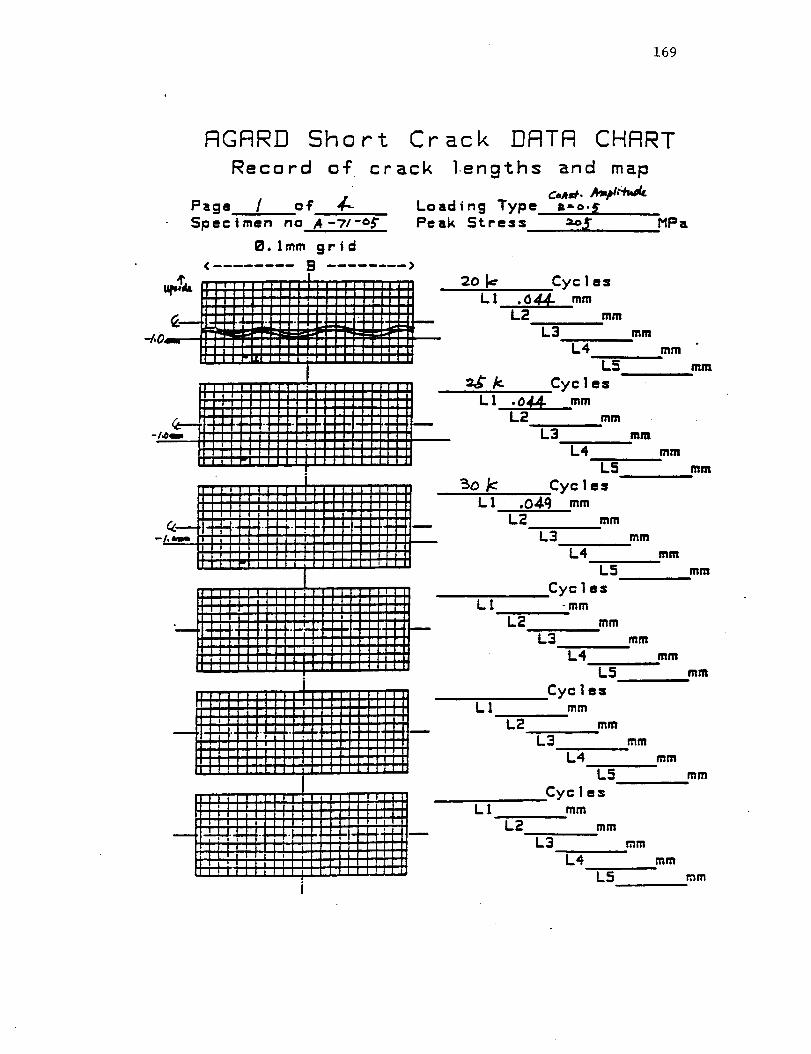
169
FIGFIRD Sh o
Record o_
Page / a_ 4--Specimen no A-7/-°_
B. lmm grid
( R ........ )
rt Cr ack DRTR CHRRT
crack l,engths and map
Loading Type =,,o._
Peak Stress zo=_ MPa
L1 .044-L2
L3
Cyclesmm
mm
L4L5
_'_ Cycles
L1 .0_. mmL2 mm
L3
L4
L5
_0 _ CyclesL 1 .0,4.9
L2
L3
LI
L2
L1
L2
mm
mm
L1
L2
mm
mm
mm
mm
mm
L4 mmL5
Cycles-mm
mm
mm
mm
mm
L3 mmL4 mm
L5 mm
Cyclesmm
mm
L3 mm
L4 mm
L5 mm
mm
L3 mm
L4 mmL5 mm
Cyclesmm

170
_5 k
LZ ./o_L2
L3
5£kLl .147
L2
L ! . 202-
L2
L3
Cyc Ie=mm
mm
L3 mm
L4 mm
L5 mm
Cycle=Rim
mm
mm
L4 mm
L5 mm
Cyc Ie=mm
mm
L3 mm
L4 mm
L5 mm
Cyc I ms-mm
mm
L4L5
Cycle=mm
mm
L3L4
L5
Cycle=
mm
mm
L4
L5
mm
mm
mm
mm
mm
mm
mm
mm
mm

171
RGRRD Short Crack ]3RTR CHRRT
Record o_ c crack l ength_ and map
Page _ o_ +_-- Loading Type P-L0"_
Specimen no _-71"o_ Peak Stress ZoO" MP_
8. lmm grid
<--- B >£_'k- Cyc l es
L 1 .2/3 mmL2 mm
L3 mm
L4 mm
75k
L1
Po/c
_5/,c
• 273
L2
L3
L4L5
Cyclesmm
mm
mm
mm
mm
mm
mm
L4 mm
L5 mm
Cyc 1 es
LI .3il7 -mm
L2 • oq_ mm
L3 • 06,,4" mm
L4 . 04.<_ .ramL5 mm
Cycles
L 1 • _'2- mr.
L2 . [/_. mm
L3 .070 mm
L4 .0}'_ mmL5 mm
Cycle:_
L ! . .4Z_, mm
L2 ./_;_ mm
L3 .__mm
L4 . _" mm
L5 mm
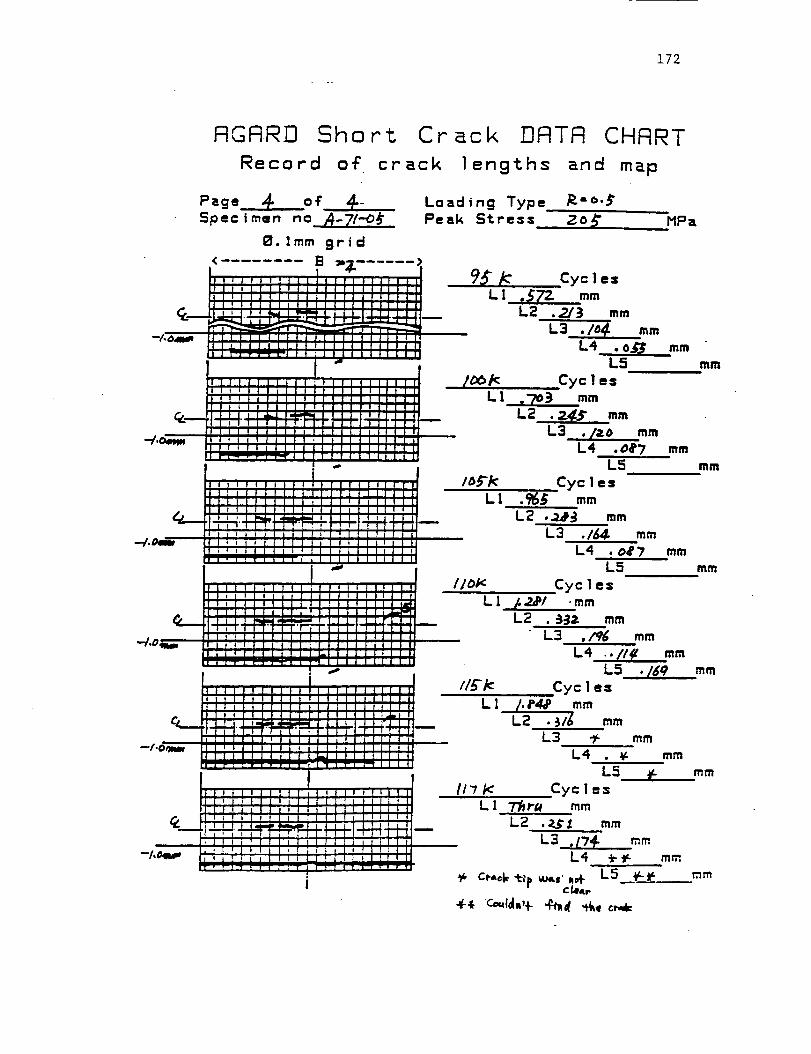
172
RGRRD
Record
Short Cr ack DFtTFt CHRRT
o_ crack lengths and map
Loading Type _=_.9
Peak Stress <ZOO" HPa
9,._/c Cyc ] e=L 1 ,$7Z mm
L2 •2/9 mm
L3. ,/6_ mm
L4 .o._L5
mmmm
mm
mm

173
0
1
2
3
4
5
6
7
8
9
10
11
12
13
14
15
16
17
18
_W( DA/DN DATA Z_
SPECIMEN' NO. =NO. OF DATA =
R= 0.50SMAX=205.0 MPa
sur6_ c_CYCLE(XIO00) CRK
25
30
35
40
50
55
60
65
70
75
80
85
90
95
I00
105
110
115
117
A-71-O5.L119
L. 2a(mm)
0.044
0.049
0.055
0.065
0.109
0.147
0.202
0.213
0.218
0.273
0.337
0.382
0.469
0.572
0.703
0.965
1.281
1.848
2.250
AVG. a(mm)
0.000
0.023
0.026
0.030
0.043
0.064
0.087
0.104
0.108
0.123
0.152
0.180
0.213
0.260
0.319
0.417
0.561
0.782
1.025
DELK(MPa-M)
0.00
1.95
2.06
2.21
2.63
3.15
3.64
3.94
4.01
4.25
4.69
5.05
5.45
5.97
6.54
7.39
8.45
9.83
11.20
DADN(mm/CYCLE)
0.000 Xl.E-6
0.500 XI.E-6
0.600 X1.E-6
1.000 Xl.E-6
2.200 X1.E-6
3.800 X1.E-6
5.500 XI.E-6
1.100 X1.E-6
0.500 X1.E-6
5.500 X1.E-6
6.400 Xl.E-6
4.500 Xl.E-6
8.700 Xl.E-6
10.300 Xl.E-6
13.100 X1.E-6
26.200 XI.E-6
31.600 X1.E-6
56.700 XI.E-6
100.500 X1.E-6

174
*Z DA/DN DATA **
SPECIMEN" NO. = A-71-O5.L2NO. OF DATA = 7
R= 0.50
SMAX=205.0 MPa
s"wr_Le, ¢_-,-c_CYCLE(XIO00) CRK L. 2a(mm) AVG. a(mm) DELK(MPa-M)
0 80 0.093 0.000 0.00
i 85 0.112 0.051 2.84
2 90 0.169 0.070 3.29
3 95 0.213 0.095 3.79
4 i00 0.245 0.115 4.12
5 105 0.283 0.132 4.39
6 110 0.337 0.155 4.72
DADN(mm/CYCLE)
0.000 X1.E-6
1.900 X1.E-6
5.700 X1.E-6
4.400 X1.E-6
3.200 X1.E-6
3.800 X1.E-6
5.400 X1.E-6
I_ DA/DN DATA *Z
SPECIMEN' NO. = A-71-OS.L3NO. OF DATA = 7
R= 0.50SMAX=205.0 MFa
CYCLE(XIO00) CRK L. 2a(mm) AVG. a(mm) DELK(MPa-M)
0 80 0.065 0.000 0.00
1 85 0.070 0.034 2.33
2 90 0.076 0.036 2.42
3 95 0.104 0.045 2.67
4 100 0.120 0.056 2.96
5 105 0.164 0.071 3.31
6 110 0.196 0.090 3.69
DADN(mm/CYCLE)
0.000 X1.E-6
0.500 X1.E-6
0.600 X1.E-6
2.800 X1.E-6
1.600 X1.E-6
4.400 X1.E-6
3.200 X1.E-6
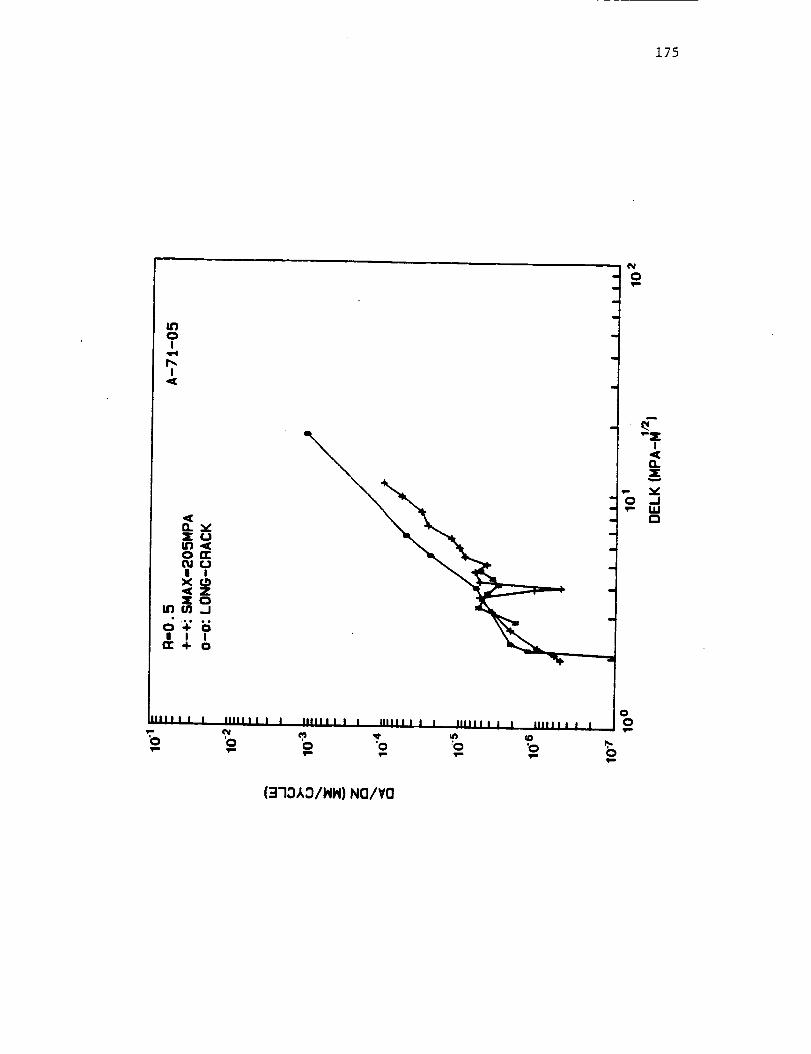
175
oI
f,.I
I1.X
0
|X
X
,16
0 +I IC_ +
illll I I
%
U
rrU
I
Z0.J.e0I
0
Inlll[I I i iiiiii I i i inlll i i I iiiiii i I
_1 (_ _ u_
'o 'o 'o -_o
I Inlll I I
'o
0
o0
m
"ZI
Z
v-JI,U
{':I7::)A::)/HH) NO/VII

ORIGINAIL PAGE IS
K)_ POOR QUALITY
A-71-05
@

OR_GkqWAI7 PAGE
OF POOR QUALITy-
A-71-05

178
SIDE
CRACK FRONT
BORET
Tracing of Crack Front for A-7t-05

179
TEST DATA
SPECIMEN NUMBER:
PARTICIPANT'S NAME: Joo-Jin Lee
John Cieslowski
a-5"cTEST TEMPERATURE:
RELATIVE HUMIDITY: _ _ _"
WAVEFORM TYPE: Sinusoidal wave, 20 Hz
LOADING SEQUENCE TYPE: Constant amplitude
R-RATIO = O. F
S max = =_-0_ _
S min = |OZ'5 MP_
FINAL LENGTH OF CRACK:
COMMENTS:

180
RGRRD Short Crack ]-]RTR CHRRT
Record o{ crack lengths and mop
co_f. A.pl_u/e
Page / o_ Z_ Loading Type _Lo._-Specimen no A-_-ZZ
0. Imm grid<........ B
i ; i t i ; I i I i|11|1111111
Iiirt _;
Jliiiii.iiiillllllllll
I II II I I I I I I
IIIIIIIIII
[i1111111
I',I',I_',_',',',III',',I',I',',II',',lilllltllll
IIllltlill::
Peak Stress =o_- MPa
i"lllll:::",, ,,I I I I I t II I I II
I I I I IIIII I II
!,,H?-,!,-h"!,,,,m,,!-I I I I I I II I I II
I | I I I I I I I I II
I I I I I I I I I I II
I I I I I I I I I I II
I I I I I t II I I II
I I I I II
I i t J t.LLI._I_I I I I I II I I II
I I I I I I II I t II
I | I I I IIII I II
I I I IIlilllti,,,,,
IIllllllkltiillllll'll
II111111111I II _
illlllll[IiiI nli l,oo iI I I tl I III I t
l I I I I I I I I I
III11111111
I III IItll III
I tll Itll t I 11
I II I lllli I II
I II I Iltll I II
I I ,_t,,, H-H.-I:_--I i I I IIIII I !1
I I I I t ,I I _ttI I I I t I I i 11
I I I1 IIIII III
_[ W Cycles
LI .0_? ,mmL2 mm
L3L4
L5
_ Cycles
LI .0#£ mmL2
L3
.4.5/cL1 •/_4.
L2
mm
L4L5
Cycles
mm
mm
L3
L4L5
Cycles
L I •174- -mmmm
L5
L2 .oS_
L3L4
Cyc IesL I ./q6 mm
L2 •b_'9 ,ramL3
' L4
L5
60_ CyclesLI • _3 mm
L2 .0_2 mmL3
L4
L5
mm
mm
mm
mm
mm
mm
mm
mm
mm
mm
mm
mm
mm
mm
mm
mm
mm
mm
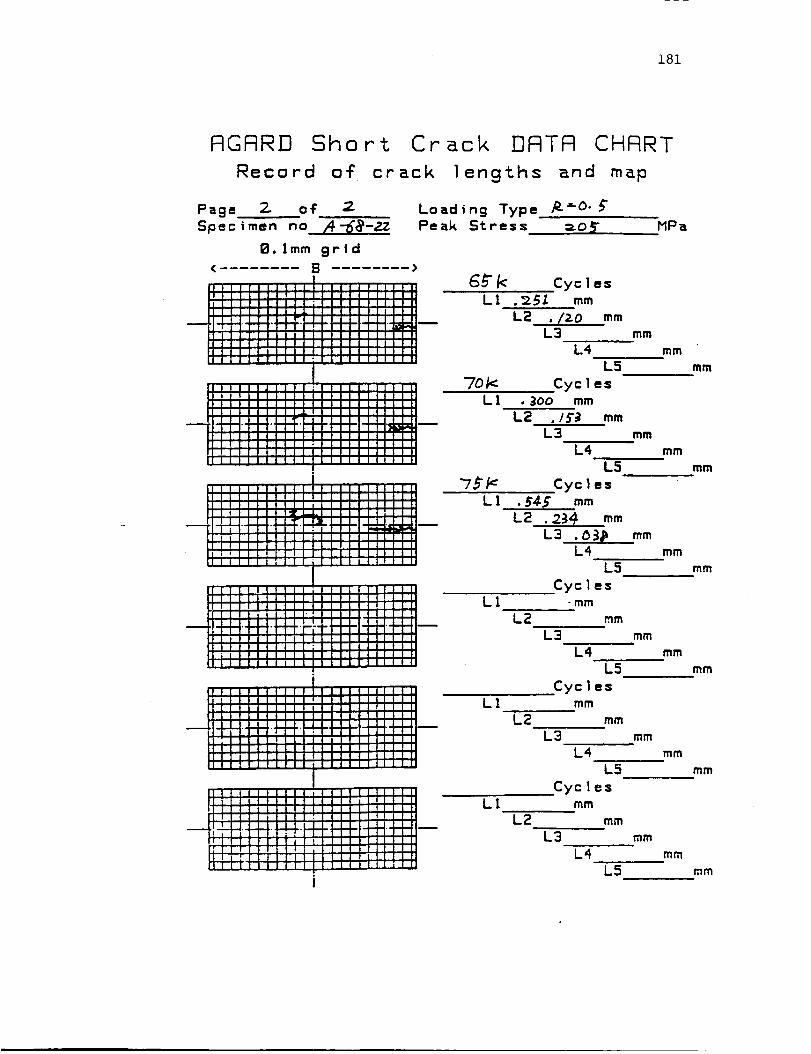
181
FIGFIRD Short Crack FIFITFI CHFIRT
Record o_ crack lengths and map
Page 2. o_¢ 3- Loading Type p._O. _"Specimen no /4-_-2Z Peak Stress _O_r MPa
0. imm grid< B ........ >
I
1111111 II
illlllllllll,.I I I I I I tI II"! i I I I I It I I II
IIIII/
''"'"III"IIIIIII IIIIIIIIIIIIIIIIIltlllllll
IIII II I I I I I III I I I I I I 1 I
IIIIIIIlilllII I, I I I i i II
ilIItlIIIITIii IllillltIt11!t Ill
I1 i , I t I I I I I iI11111111111
I I I I I IIII I II
''"'"III"I I I I I I I III I I I i111 IIII
''"''"1111I I I I I I II
I i II illll IIII I II IIIIIII
,,,''lli'llll"li ,,
Itll Ilili li It11111 III!1
II11 ti i ili liII I t I I I I i i I II 1 _ i I,ll,l,ll.l,I,IiI I III I'1 I IIII I II I I I I I IIII1 II I I I II III I I I I I I I I I I
"7o/=:
"75_
_< Cycles
Li ._SZ mm
L2 ./zO mmL3 mm
L4 mm
L5 mm
Cyc ImsL I •_oo mm
L2 ,/_ mm
L3 mmL4 mm
L5 mm
CyclesL 1 • 545 mm
L2 . 2_l mm
L3 ._3_ mmL4 mm
L5 mm
Eye ImsLi -ram
L2 mmL3 mm
L4 mmL5 mm
Cyc ImsLI mm
L2 mmL3 mm
L4 mmL5 mm
Cyc 1msL! mm
L2 mm
L3 mm
L4 mm
L5 mm

J82
SZ DA/DN DATA *I
SPECIMEN' NO. = A-68-22.LZNO. OF DATA = 9R= 0.50SHAX=205.0 MPa
CYCLE(XIO00) CRK L. 2a(mm) AVG. a(mm) DELK(MPa-M)
0 35 0.049 0.000 0.00
1 40 0.055 0.052 2.81
2 45 0.104 0.079 3.44
3 50 0.174 0.139 4.45
4 55 0.196 0.185 5.07
5 60 0.213 0.205 5.31
6 65 0.251 0.232 5.62
7 70 0.300 0.275 6.06
8 75 0.545 0.422 7.33
DADN(mm/CYCLE)
0.000 X1.E-6
1.200 X1.E-6
9.800 X1.E-6
14.000 X1.E-6
4.400 X1.E-6
3.400 X1.E-6
7.600 X1.E-6
9.800 X1.E-6
49.000 X1.E-6
** DAIDN DATA **
SPECIMEN' NO. = A-68-22.L2NO. OF DATA = 6R= 0.50SMAX=205.0 MPa
CYCLE(XIO00) CRK L. 2a(mm) AVG. a(mm) • DELK(MPa-M) DADN(mm/CYCLE)
0 50 0.055 0.000 0.00 0.000 XI.E-6
1 55 0.059 0.029 2.15 0.400 XI.E-6
2 60 0.082 0.035 2.38 2.300 X1.E-6
3 65 0.120 0;050 2.82 3.800 X1.E-6
4 70 0.153 0.068 3.25 3.300 X1.E-6
5 75 0.234 0.097 3.81 8.100 XI.E-6

183
I_PID
I
ZU
OE_UII
X__ZXO
_mJee oi
0+0III
lilill I I
%IIIIII I I
'o
IIIIIII i I lilllil i
0 '0
I illlli I I I IUlII I I
0
'o 'o
¢M
0
im
i
i
o0
0
(310AO/HH) NO/V(]

184
.I-
÷
u/!
Eg-_3ggg'g £g.,.3ggg "IF £g÷3ggg'g tg-3ggg'g

185
tn ..4
4.
=
a =
4-
0
I0
!
soNnoJ-oI:IO'I
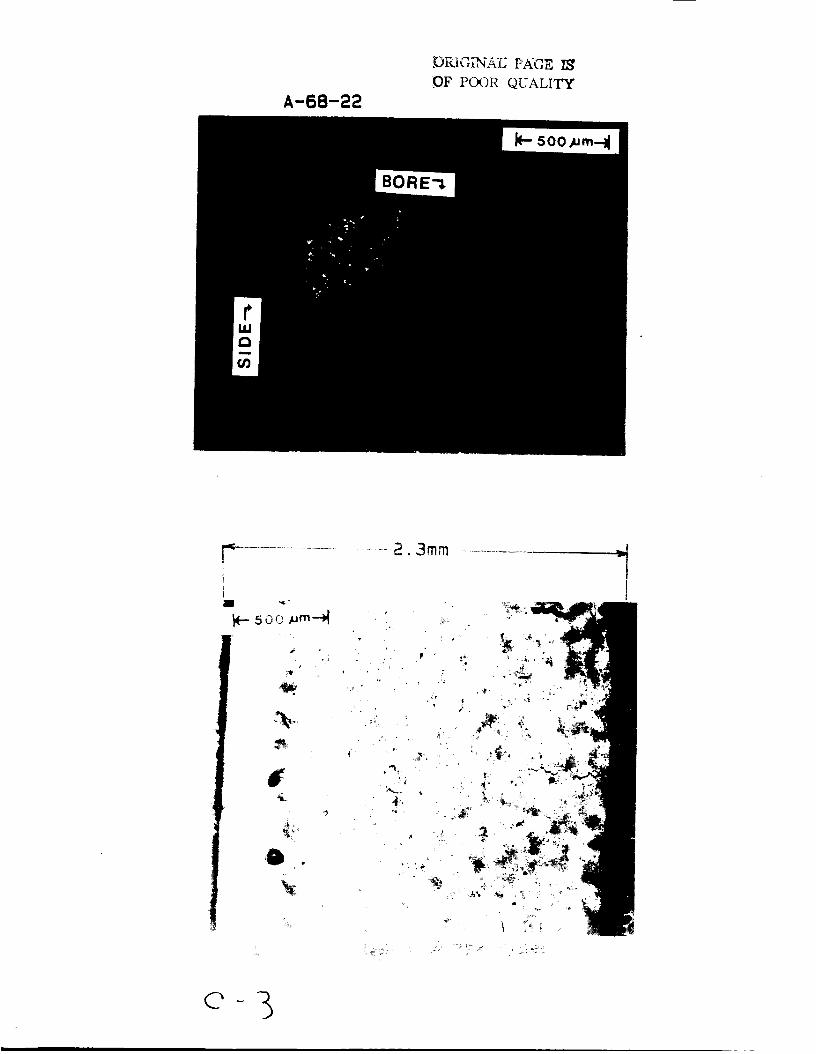
A-68-22
D_GLN'AE PACE I_
OF POOR QUALITY
....................................................2.3mm
!

TEST DATA
SPECIMEN NUMBER:
DATE." _'/_o/_"
PARTICIPANT' S NAME"
A - o_4 -o
Joo-Jin Lee
John Cieslowski
20 Hz
Constant amplitude
TEST TEMPERATURE: 271C
RELATIVEH_MID_TY, 4_
WAVEFORM TYPE: Sinusoidal wave,
LOADING SEQUENCE TYPE:
R-RATIO = O"
S max = lq _ MP_
s rain= qg. _MP_
FINAL LENGTH OF CRACK:
COMMENTS:
187

188
RGRRD
Record
Short Crack I]RTR CHRRTof crack lengths and map
_+. __.pta,_wLoading Type R=o,_, ,-
Peak Stress i_"
---)
&'_ It, Cyc 1esL ! ._t mm
L2 mm
L3
LI
"1_0 IC
L4L5
Cycleso2.z9 mmL2 mm
L3
L4
L5
Cycles
L3
mmmm
L4L5
Cycles
L l_.__mmL2
L3
L4
mm
L5
Cyclesmm
mm
L3L4
L5
CyclesI.._'J"
L.2L3
mm
L4
spee_4w_ ua_s b_k._
d.h_ cyclrw1
mm
L5
mm
mm
mm
mm
mm
mm
Page / 0¢ I-Specimen no A-g+-03
B. lmm grid< B
MPa
mmmm
mmmm
mmmm
mm
mm
mm
mm

189
_Z DA/DN DATA _Z
CYCLE(XIO00)
SPECIMEN' NO. = A-B4-O3.L1NO. OF DATA = 6R= 0.50SMAX=195.0 MPa
Sur6-,L_CRK L. 2a(mm) AVG. a(mm) DELK(MPa-M)
0 690 0.098 0.000 0.00
1 710 0.229 0.082 3.36
2 720 0.316 0.136 4.24
3 730 0.425 0.185 4.87
4 740 0.561 0.247 5.54
5 750 1.550 0.528 7.82
DADN(mm/CYCLE)
0.000 XI.E-6
3.275 Xl.E-6
4.350 XI.E-6
5.450 X1.E-6
6.800 X1.E-6
49.450 X1.E-6

190
0I
_rm
I
O.
I/I01
Ix
XItl I/_
o¥I I
rr 4-
IIIII I I
%ii_
vU
EUI
I.nZ0J
Io
tlllill l I nllll| | I tillill I I UIIill I I
'o o 'o 'o
IIIII I I I I
ID
'0
- 0
u
g
i
a
%
%
(B_DXD/HH)NO/VO

.0_ POOR QUALITY
A-84-03
!
!
~ ;

192
TEST DATA
SPECIMEN NUMBER:
DATE: _'/_ / _"_"
PARTICIPANT' S NAME:
A - _q -13
Joo-Jin Lee
John Cieslowski
TEST TEMPERATURE: _6" C
RELATIVE HUMIDITY: _'D _*
WAVEFORM TYPE: Sinusoidal wave, 20 Hz
LOADING SEQUENCE TYPE:
R-RATIO= O, 5
S max = 19_MP_
S rain = _q'5 M_
FINAL LENGTH OF CRACK:
COMMENTS:
Constant amplitude

193
RGFIRD Short Crack ]3RTR CHRRT
Record 0$ crack lengths and map
Page. 1 of 1- Loading Type _-o.ySpaclmen no __-I_ Peak Stress 19S MPa
8. |mm grid
<........ B ........ >
I I ! TI II I I | I1I II lilll I I III I I 1FI II I I I _I I I I I I | I I Eli
fl tt I I II I I [I I I I I FI]J I I I I II | | [I]IIiiliiii illI I I I I I I I ; I_1_
IIII III Ill I IILl f I I I I I I i iEl Iil i ! I I i ifill I I I f I | i i
-'-FL-'H-I,.H-f.H-H.I!1 tl I I I I I I II]II11111111EII!]ItlIIIkl_l ! [ I I I I I I I
1.9o Ic. Cyc 1asL 1 o&o mm
L2 .0_1 mm
L 3.._,.g2./_mmL4 mm
L5 mmISox Cyc 1asL l .z36 mm
L2 Ut mm
L3 .o27 mmL4 mm
L5 mm
i_n_- Cyc IeaL 1 .2IS mm
L2 mm
L3 .o,14. mmL4 mm
L5 mm
17or: Cyc I • sLI .4o3 -ram
L2 ramL3 _ mm
L4 .os_ mmL5 mm
Cyc I a aL1 mm
L2 mm
L3 mm
L4 mm
L5 mr.
CyclesLI mm
L2 mm
L3 mm
L4 mm
L5 mm
cr_J= J_p _uc too÷ cl_tp

194
I$ DA/DN DATA Zl
SPECIMEN NO. = A-59-13.L1STRESS RATIO=0.5
MAX.STRESS=I95.0 MPa
NO.OF DATA= 3
CYCLE(XIO00) CRK L 2a(mm) AVG. a(mm) DELK(MPa-M) DADN(mm/CYCLE)
0 130 0.060 0.00
1 150 0.136 0.05
2 160 0.21g 0.09
3 170 0.403 0.16
0.00
2.65
3.48
4.49
0.000 X1.E-6
1.900 X1.E-6
4.100 X1.E-6
9.250 X1.E-6

195
fflI
O)Ul
I
rlXUl01',q'l
IX.¢X
inu)
o:¢I I
n- ÷
IIII I I I
%
U
rrU
II..nZ0J
I0
IIIII I I I I
'o
IIIIIII I I IIIIIII I I lllllll I I IIIIIII I I ;
'o 'o 'o
0 -J
o0
(313_3/HN) NO/VO
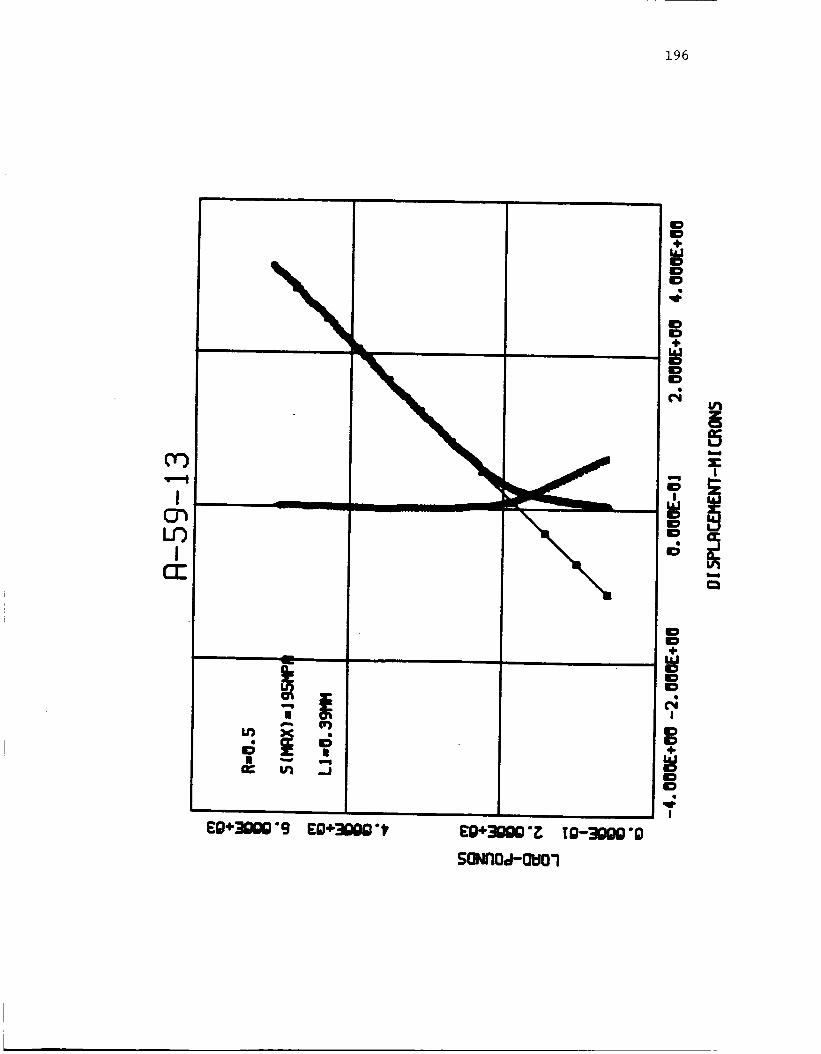
196
i
Eg*:_lggg'_ Ig-31ggg'g
S0NI10=l-'gt:10"l
O
,4!
ID
D
I

0RIGINAI_ PA-GI_ _.
OF POOR QUAIZI_
A-59-13

ORIGINAl: P/(GE IS
OF POOR QUALIT_
CRACK FRONT.-t
Tracing of Crack Front for A-59-t3

199
TEST DATA
SPECIMEN NUMBER:
DATE: 6/_/o _y
PARTICIPANT' S NAME:
TEST TEMPERATURE:
RELATIVE HUMIDITY:
A -_ -03
Joo-din Lee
John Cieslowski
60"/.
WAVEFORMTYPE:
LOADING SEQUENCE TYPE:
R-RATiO _ O. 0
S max = l"t_M P_
s mi_ = O M?_
FINAL LENGTH OF CRACK:
Sinusoidal wave, 20 Hz
Constant amplitude
2.3_ eL3)
COMMENTS:

2OO
Page / oT 5".Specimen no_
0.1mm grid
< B
RGRRD Short Crack DRTR CHRRT
Record oT crack lengths and map
Loading wype _.o.o
Peak Stress /4_" MPa
&K Cycle=Ll.o__mm
L2 .oz')L3
L4
mm
mE
mrn
mm
mm
L5 mm
?K Cyc I e:B
L I .032, mmL2 + mm
L3 mm
L4 mm
L5 mm
/OK Cyc IeeL ! . o.n mm
L2 . o_.'z- mm
L3 mm
L4 mm
L5 mm
IZK Cycles
L1 .,+ -mmL2 " _. mm
L3 mm
L4 mmL5 mm
i_'K Cyc 1esLI .0_- mm
L2 ._i_L3
L4
mm
L5
Ik£ Cycle=L1 ,_1 mm
L2 .dr,J" mmL3
L4L5
mm
mm
mm
iTIm
,.l C_ "H,p _,,_+ ..'I- c.l+..p.

201
RGRRD Short Crack ORTR CHRRT
Record of crack lens%hs and m_
Page 2. o_ 5"Specimen n o -___,5"._7,=_. Peak
B. lmm grid
< B ........ >
Loading Type _,o. 0Stress 145" HPa
/fK ' Cyc I esL 1 . O_lJ mm
L2 .£T7/ mmL3
L4L5
Cyc ! es
Lt
. IO,FL2
mmmm
mm
._l mm
L2 ._'/6 mmL3 mm
L4 mm
L5 mm
Cyclesmm
, _f-/ mmL3 ,07/ mm
L4 , OZ.'7 mmL5 mm
Cycles. I0_" -mm
L2 ". _ mm
L3 , o"Z, mmL4 ._Z_ mm
L5
Cyc I es• 104. mm
L2 . l_q mm
L3 ,#1"/ mmL4 . Q_3
L5
Cyc 1 ms• //4 mm,
L2 ' ./0</ mmL3 ./_ mm
L4 . 0_r'_ mm
L5.0z 7
mm
mm
mm
mm
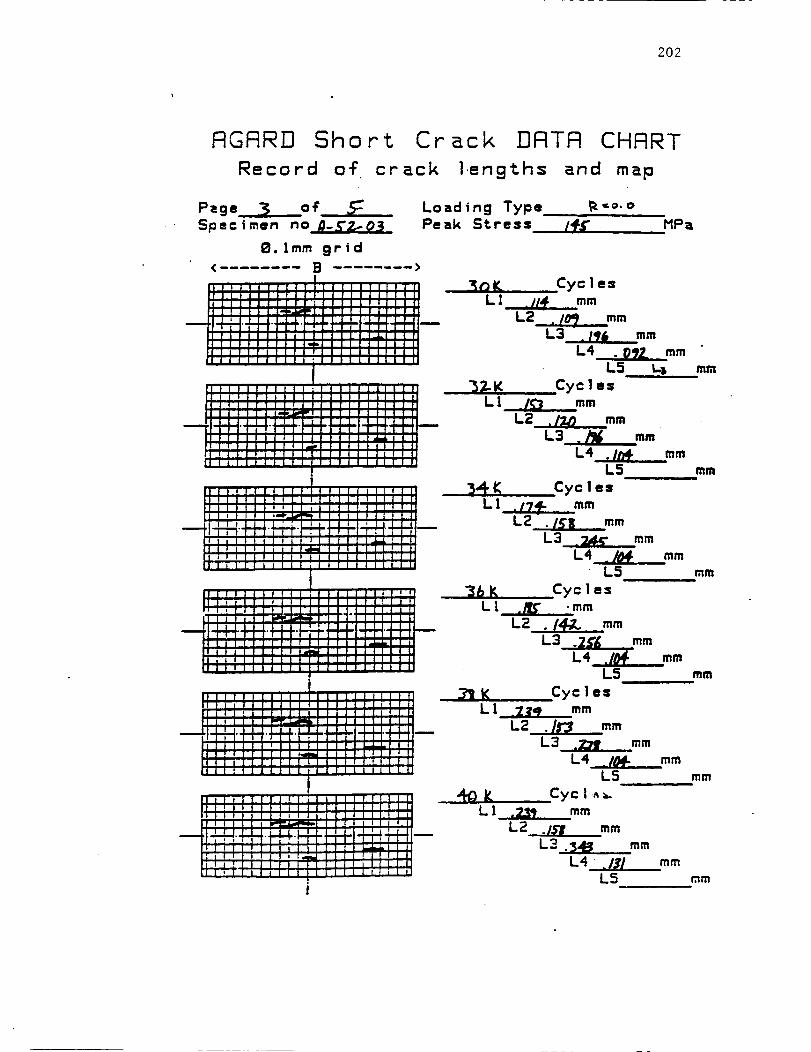
202
RGRR]] Short Crack I]RTR CHRRT
Record of creck lengths and m_p
Page 3 of, _ Loading TypeSpecimen no_ Peak 5tress
B.%mm grid< B ........ >
LI
_ r-O, O
/4S" MPa
LI
Cycle=
.i/@ mm
L2 .I_ mm
L3 . I_& mm
L4 .__mmL5 Ls
Cyc l es_1_ mm
L-2 ,/20 mmL3 ./_ mm
L4 . I/_" mmL5 mm
Cyc I e=• 174_- mmL2 . 15"g mm
L3 2,4_ mmL4 ./FI& mm
L5 mm
Cyc I es
mill
mmmm

203
RGRRD Short Crack EIFITFI CHFIRT
Record of crack lengths and map
Page _ o_ 5"-Spec |men no/A_-_ Peak
9. Imm gri d
<........ B ........ >
Loading Type R =o'o
Stress /_- MP_
'_Z k_ Cycle=L I ,2.&7 mm
L2 ./47 mm
L3 . r'34.L4
L5
mm
mm
mm
44" _ Cyc I • =L 1 .ZA! mm
L2 .147 mm
L3 ._5" mm
L4 ./6=F mm
L5 mm
_: Cyc Ie=LI ._ mm
L2 , 147 mm
L3 , _. mmL4 LS mm
L5 mm
4Y _ Cyc Ie=L ! .4-25" - mm
L2 .1_1 mmL3 I/7-7,. mm
L4 mm
L5 mm
.JT)K Cyc Ie=L 1 ._5"" mm
L2 .131 mm
L3 /.;_4t, mmL4 mm
L5 mm
.CZK Cycle=L1 .'F_ mm
L2 . I_(p mmL3 Z7"_ mm
L4 mm
L5 mm

204
Short Crack DRTFI CHFtRT
of crack ]'engths and m_lO
Page 5- of __ Loading Type P.o,OSpecimen no -_LT_I_ Peak Stress 14L¢" MPa
B. |mm grid
< ........ B -->
b'3K CyclesLI _ mm
L2 ,13l mmL3 _Tk P W mm
L4 mm
L5
CyclesLI mm
L2 mm
L3 mmL4 mm
L5
Cyclesmm
mm
LI mm
L2 mm
L3 mm
L4 mm
L5 mm
CyclesLI -mm
L2 mm
L3 mm
L4 mm
L5 mmi
• CyclesLI mm
L2 mm
L3 mm
L4 mm,
L5 mm
CyclesLi mm
L2 mm
L3 mm
L4 mm
L5 mm

205
_Z DA/DN DATA _
SPECIMEN' NO. =
NO. OF DATA =R= 0.00
SMAX=145.0 MFa
CYCLE(XIO00) CRK
A-52-O3.L316
L. 2a(mm) AVG. a(mm) DELK(MPa-M)
0 22 0.071 0.000 0.00
i 24 0.076 0.037 3.44
2 26 0.087 0.041 3.61
3 28 0.120 0.052 4.04
4 30 0.196 0.079 4.92
5 34 0.245 0.110 5.73
6 36 0.256 0.125 6.07
7 38 0.278 0.133 6.24
8 40 0.343 0.155 6.68
9 42 0.534 0.219 7.81
10 44 0.665 0.300 9.00
11 46 0.834 0.375 9.96
12 48 1.127 0.490 11.24
13 50 1.264 0.598 12.30
14 52 1.777 0.760 13.72
15 53 2.250 1.007 15.71
DADN(mm/CYCLE)
0.000 XI.E-6
1.250 XI.E-6
2.750 XI.E-6
8.250 X1.E-6
19.000 X1.E-6
6.125 X1.E-6
2.750 XI.E-6
5.500 X1.E-6
16.250 XI.E-6
47.750 X1.E-6
32.750 XI.E-6
42.250 XI.E-6
73.250 X1.E-6
34.250 X1.E-6
128.250 XI.E-6
236.500 XI.E-6

206
oI
61In
I
Z_
_UII
X__ZZO
OmJle tl
0÷oIII
E÷O
IIIlll I I lllllll I I IIIIIII I I IIIIIII I
'o o 'o
I IIIIII I I I llllll I I
'o 'o_=, ,p.
I%
qll
"ZI
&
UJr_
(37::)IOlNN] NOIVO
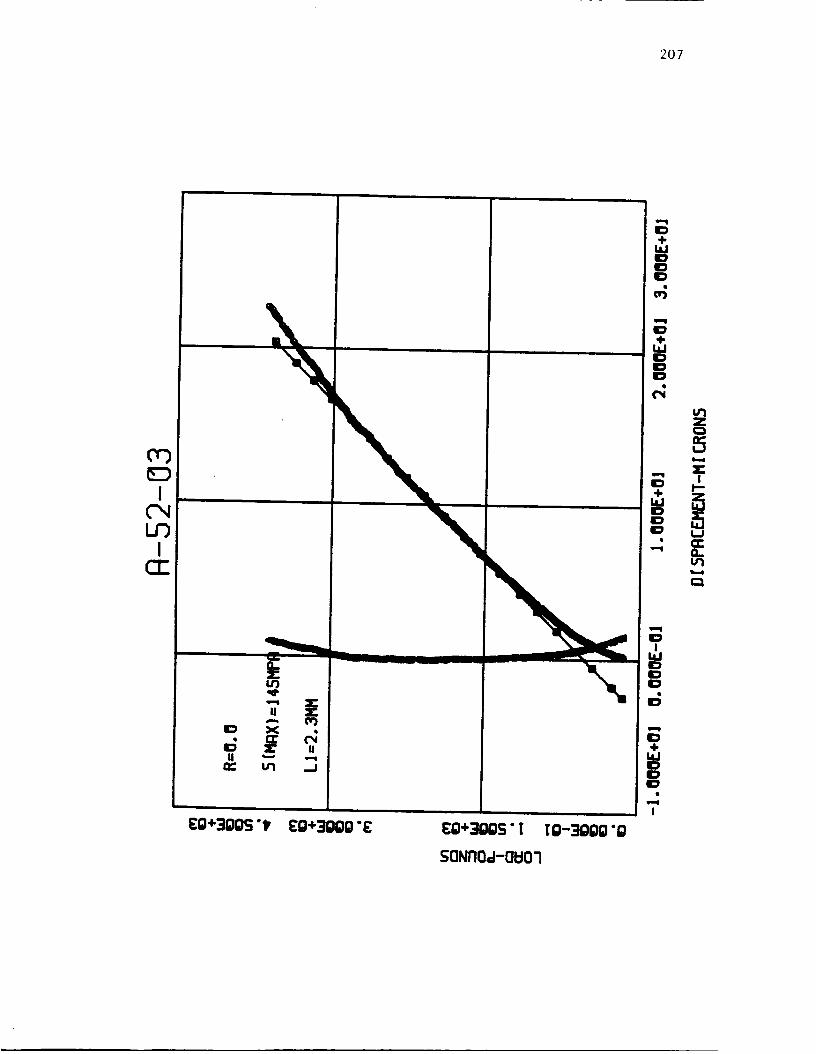
207
¢0EDI
LOI
EQ+30QS'_ ¢g+3QOg'E EQ+3QOS'! _Q-3QQQ'Q
5oNnoa-ouol

ORIGINAl: PA-GE IS
OF pOOR QUALITY
A-52-03

O_%_N.\L PAGE IS
OF POOR QUALITY
A-52-03
BORE

210
SIDE,I,
BORE
CRACK FRONT...4
SIDEr
Tracing of Crack Front for A-52-03

211
TEST DATA
SPECIMEN NUMBER:
DATE: 6/IO/_ _"
PARTICIPANT' S NAME :
TEST TEMPERATURE:
RELATIVE HUMIDITY:
A -_I -I_
Joo-Jin Lee
John Cieslowski
54f.
WAVEFORM TYPE :
LOADING SEQUENCE TYPE:
R-RATIO = O, O
s ma_= 145 H_'_
S rain = 0 • NP_
FINAL LENGTH OF CRACK:
COMMENTS :
_o_o
Sinusoidal wave, 20 Hz
Constant amplitude
_ot _l)le to _ -L--=._=_,,_.c>u+ o÷

212
RGRRD Short Crack FIFtTFI CHRRT
Record of crack lengths and map
Page I of 2-'- Loading Type R.=O .....Specimen no,4-_1-16 Peak Stress 1_ MPa
_. lmm grid< B
I I ill
I I Ill
I III
I I|I
I III
I III
I III
I !II
I III
I III
II I I I I
Ii l I |
II ta i t JII o I l I I
II!,1 : 'II I I I I J
II ! I0''I I | I
+ fill 1 I |l ,i Ii I i ti i I
K Cycles
L! .OZZ mmL2 mm
L3 mmL4 mm
L5
I_ k Cycles
L| .01_ amL2 mm
L3 mmL4 mm
L5
• I_K Cycles
L1.0Z7 mmL2 mm
L3 mmL4 mm
mm
mm
-_J_5 mm
/_Lf ,,ClcIes_.O_3 mmL2 .IT'P mm
L3 ,13& mmL4 mm
' _L5 mm
/fL_l Cyc Ie_J_._ ".OZ"?. mm _ -L2 ./.C'f mm
L3 .169 mmL4 mm
L5 mm
L4 mm
'"_5 mm
Cyc I•=_......_ ' .I Ll ,OS$ -mm
L2 .#X.@ mm
L3 .1_/,, mm
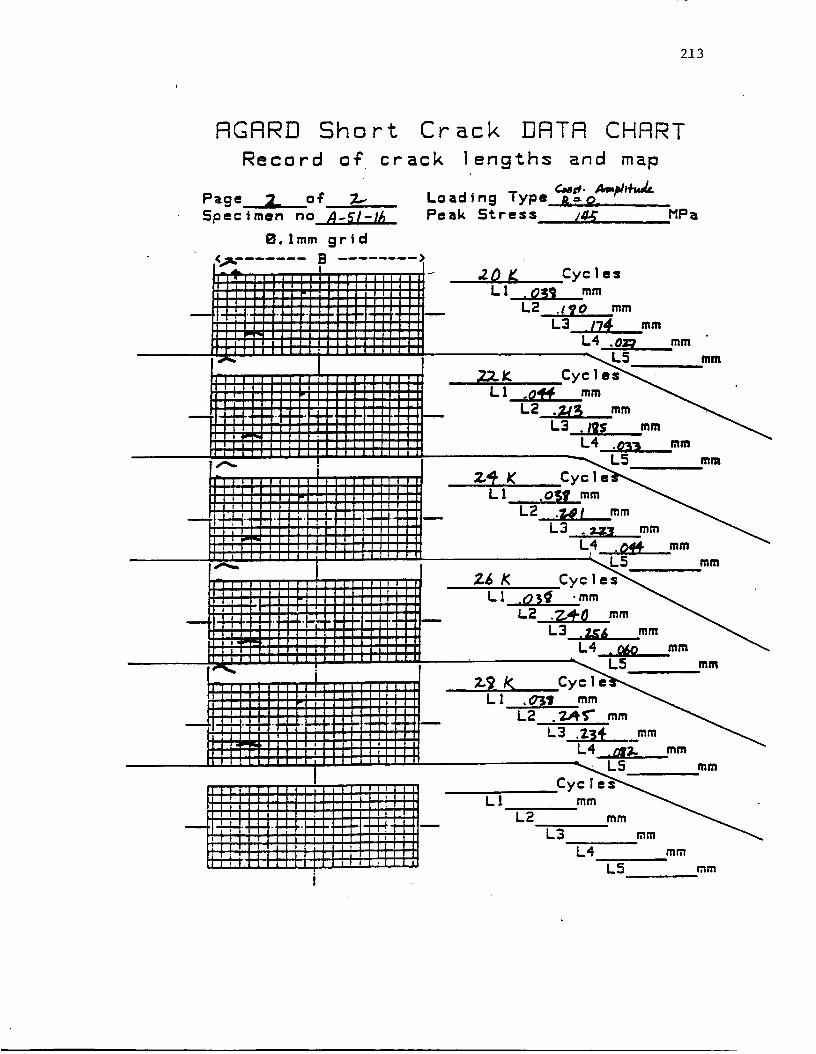
213
FIGFIRD
Record
Short Cr ack OFITR CHFIRT
LI
mR
MPzL
RR
mR
'_,_,.._5 mR
Cyc l •
• , immL2 L3 "rimmm mR
L4 mm
L5 mm
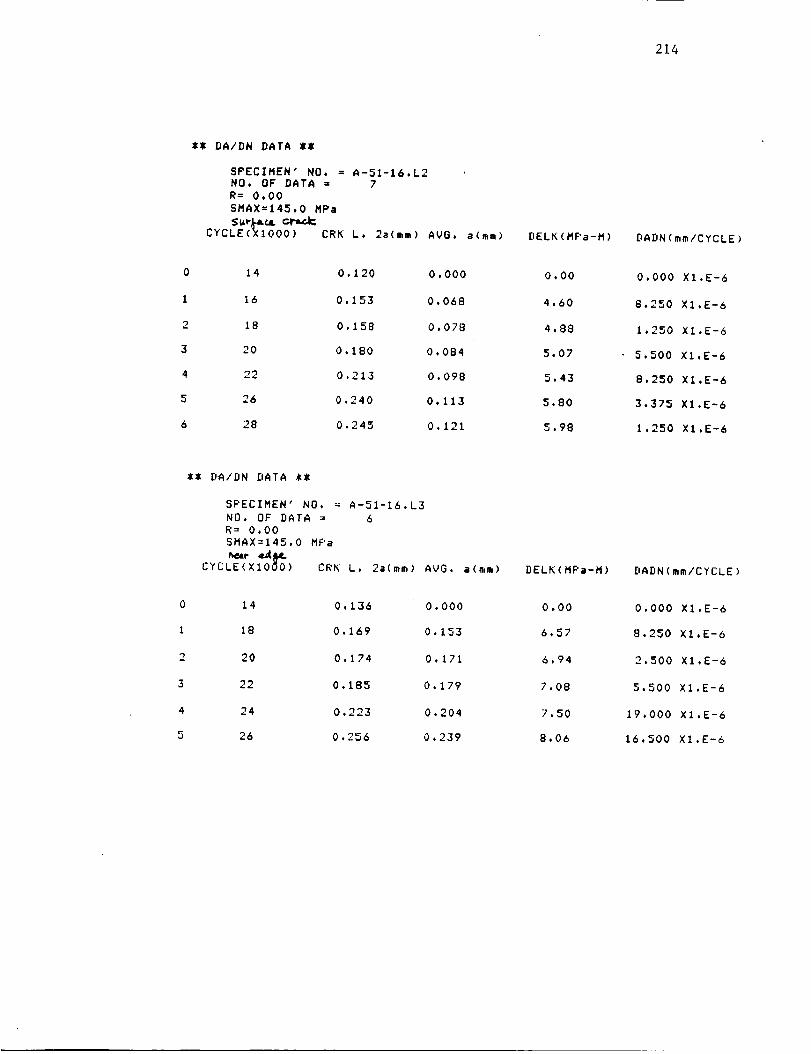
214
*_ DA/DN DATA ZZ
SPECIMEN' NO. = A-51-16.L2NO. OF DATA = 7R= 0.00
SMAX=145,0 MPa
CYCLE(_IO00) CRK L. 2a(mm) AVG. a(mm) DELK (MF'a-M) DADN(ma,/CYCLE)
0 14 0.120 0.000 0.00 0.000 XI.E-6
I 16 0.153 0.068 4.60 8.250 X1.E-6
2 18 0.158 0,078 4.88 1.250 X1.E-6
3 20 0.180 0.084 5.07 5.500 X1.E-6
4 22 0.213 0.098 5.43 8.250 XI.E-6
5 26 0.240 0.113 5.80 3.375 X1.E-6
6 28 0.245 0.121 5.98 1.250 XI.E-6
*_ DA/DN DATA *_
SPECIMEN' NO. = A-51-16.L3
NO. OF DATA = 6R= 0.00SMAX=I45.0 MPa
n_r _.=t#M..CYCLE(XIO00) CRK L. 2a(mm) AVG. a (ram) DELK (MF'a-M) DADN(mm/CYCLE)
0 14 0.136 0.000 0.00 0,000 X1.E-6
1 18 0.169 0.153 6.57 8.250 X1.E-6
2 20 0.174 0.171 6.94 2.500 X1.E-6
3 22 0.185 0.179 7.08 5.500 X1.E-6
4 24 0.223 0.204 7.50 19.000 XI.E-6
5 26 0.256 0.239 8.06 16.500 X1.E-6
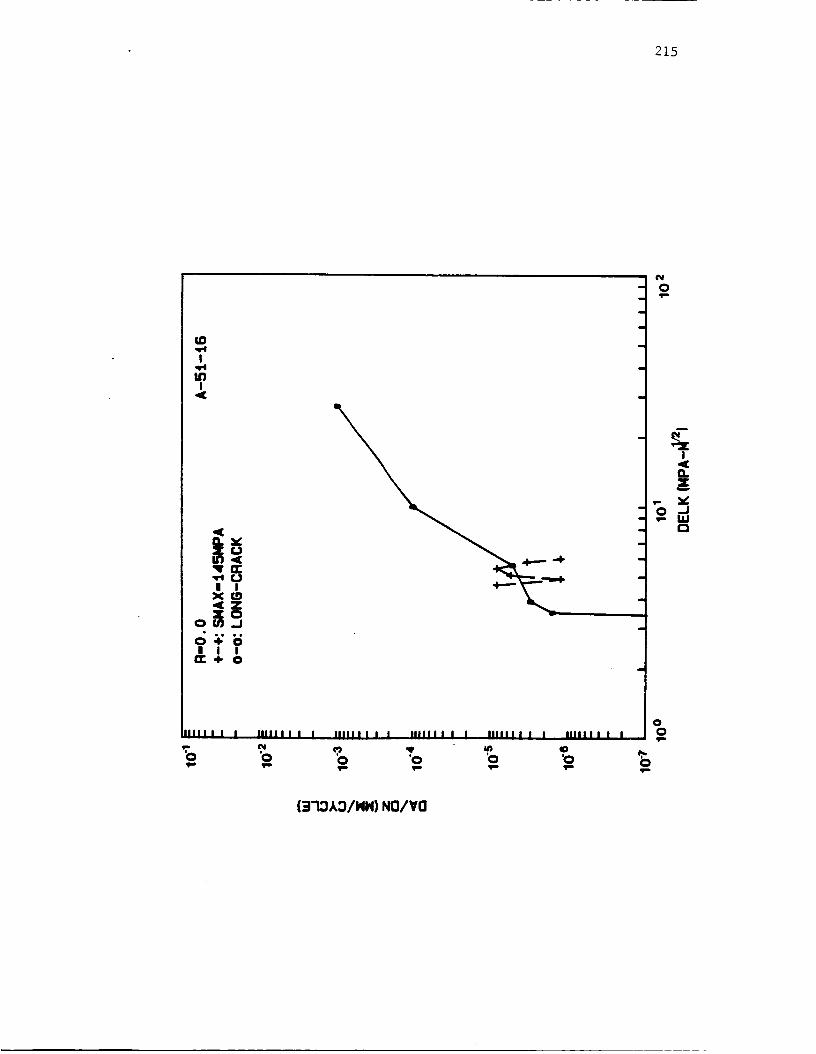
215
o
w
T
u
_i' rr",w.I Ir..1I I
Xf..O',(ZXOl.f_ _I
III I I I IIIlll I I I IIIIII I I I IIIIII
,'o ,_ % " + ='o 'o 'o
(3qOXO/MN)NO/VO

216
L_D
I
UDI
Ell
Q..
LO
•-, 2:U --,
X
Z ,w ,.q
=.
==
===
E:)
E:)0÷WE:)I:)l:)
!
÷
I:)E:)0
I
..J
EO+300S'_ EO+3OOO'E EO+3OOS'I IO-3OO0"O
SONnO_-OU07
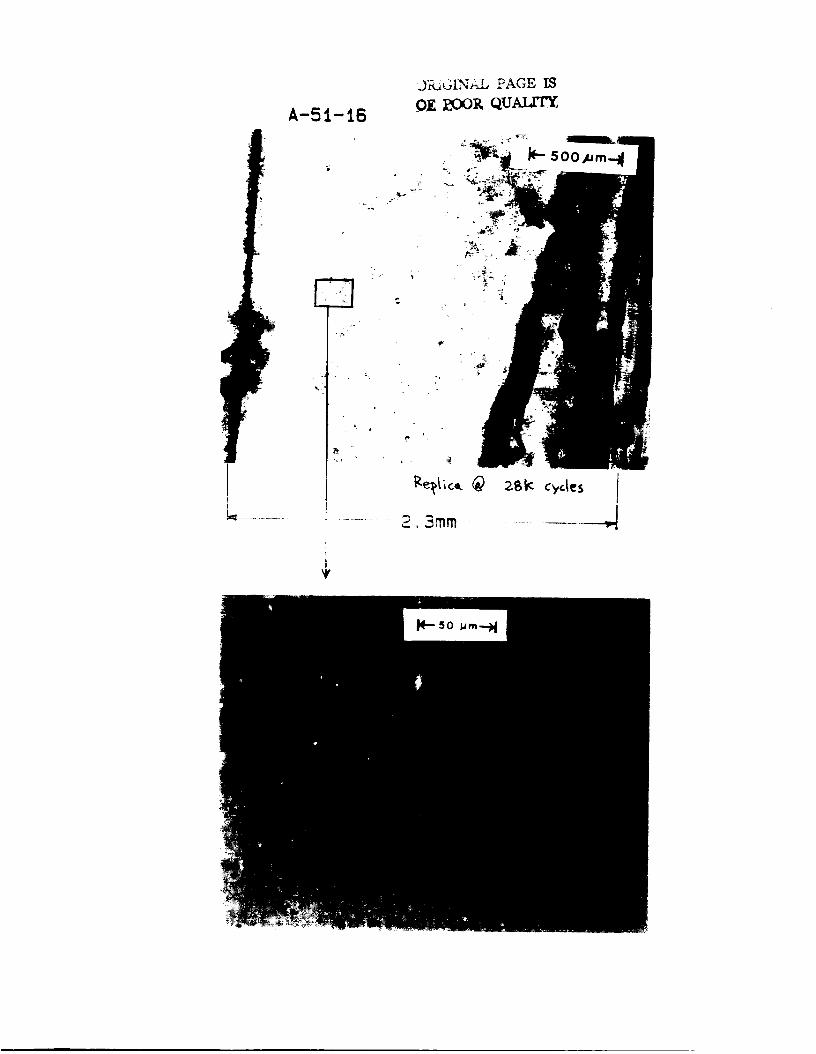
A-51-16
i!
J_GLNAL PAGE IS
OK _OOR QU_

218
TEST DATA
SPECIMEN NUMBER:
PARTICIPANT' S NAME-
TEST TEMPERATURE:
RELATIVE HUMIDITY:
A - _2 -_6
Joo-Jin Lee
John Cieslowski
WAVEFORM TYPE:
LOADING SEQUENCE TYPE:
Sinusoidal wave, 20 Hz
Constant amplitude
R-RATIO= O.O
S max -- I_O MP_
S rain = 0 _4_,
FINAL LENGTH OF CRACK:
COMMENTS:
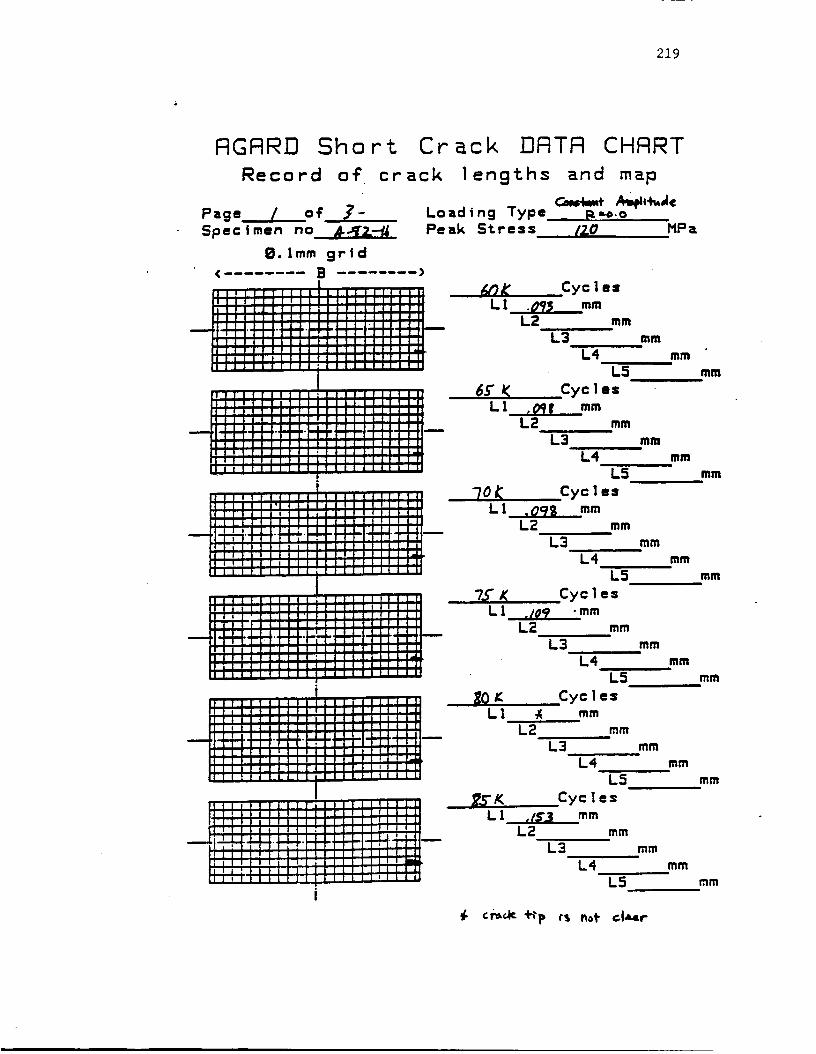
219
Shorto_
Page / o_ 3-
Specimen no _
B, Imm grid
< ....... B ........ >
Cr ack DRTR CHRRT
crack lengths _ncl m_lo
Loading Type . t_o.oPeak Stress /2.0 HPa
mm
mm
mm
mm
i i
Eq _: Cyc I esL! ; mm
L2 mmL3 - mm
L4L5
2,.¢'K Cyc I e= "L 1 ,/_3 mm
L2 mmL3 mm
L4 mm
L5 mm
,/. cr_ _-p cl not cl_r

220
RGRRFI Short Crack DFITR CHRRT
Record of crack lengths and map
?OK Cy= Ias
LI .1"74", mmL2
L3L4
mm
mltl
MPa
mm
L5 mm
mm
L'4L5
Cyc Ies
mm
mm
• Z7,3 mmL2 mm
L3L4
L5
Cycles
,Z'I 3 -mmL2
L3
mm
mm
mm
//# ._ Cyc le=L l__mm
L2 mm
L3 mm
L4 mm
L5 mm
If 5" tIC Cycle=L I • ,'q"67_ mm
L2 mmL3 mm
L4 mm
L5 mm
mm
mmma
L4 mmi
L5 mm

221
RGRRD Short Crack DFITFI CHRRT
Record of crack lengths and map
Page_o_ 3 Loading Type R-O
Specimen no '4,|Z.tb Peak Stre3s_ I_O MPa
B. lmm grid
< ........ B ........ >
/_0 _ Cyc ] esL | .6(J_" mm
L2 mmL3
L4LS
/2F'_ Cyc IesL 1 ."79b mm
L2 mm
L3 --
L4L5
_ 130 t_ Cycles
L2 mm
L3
L4
L5
mm
mm
mm
mm
mm
mm
mnt
mm
__ mm
/_ _ Cyc I • s
L 1 /.737 -mm
L2 mm
L3 mm
L4 mm|
L5 mm
. /3_'.'_-/_ Cyc lee
L I _'_ mm
L2 mm
L3 _ mm
L4 mm
L5 mm
Cyc !esL1 mm
L2 mm
L3 mm
L4 mm
L5 mm

222
0
1
2
3
4
5
6
7
8
9
I0
ii
12
13
14
$_ DA/DN DATA _Z
SPECIMEN" NO. =NO. OF DATA =R= 0.00
SMAX=120,O MP_Cx_r_r crc_J¢
CYCLE(XIO00) CRK
A-82-16.L115
L, 2a(mm)
60
65
75
85
90
95
100
105
110
115
120
125
130
135
138
0.093
0.098
0.109
0.153
0.174
0.196
0.223
0.273
0.360
0.469
0.605
0.796
1.123
1.837
2.250
AVG. a(mm)
0.000
0.095
0.104
0.131
0.163
0.185
0.209
0.248
0.316
0.414
0.537
0.700
0.959
1.480
2.043
DELK(MPa-M)
0.00
4.38
4.55
5.08
5.62
5.94
6.28
6.77
7.55
8.51
9.53
10.72
12.30
14.87
17.32
DADN(mm/CYCLE)
0.000 XI.E-6
1.000 XI.E-6
i. I00 X1.E-6
4.400 X1.E-6
4.200 X1.E-6
4.400 X1.E-6
5.400 X1.E-6
10.000 X1.E-6
17.400 X1.E-6
21.800 XI.E-6
27.200 X1.E-6
38.200 X1.E-6
65.400 X1.E-6
142.800 X1.E-6
137.667 XI.E-6

223
I
I
a.vXU
_._I IXf-__ZTO
OU_.J
I I IIX -I- 0
IIIII i I J nllll i i
¢'.4
'o
IIIIII I I I UlIII I I I IIIIII I I I
'_ '0 '0
IIIIIII I
'o
IN
- 0
i
I
(373AO/IdN] NO/VO
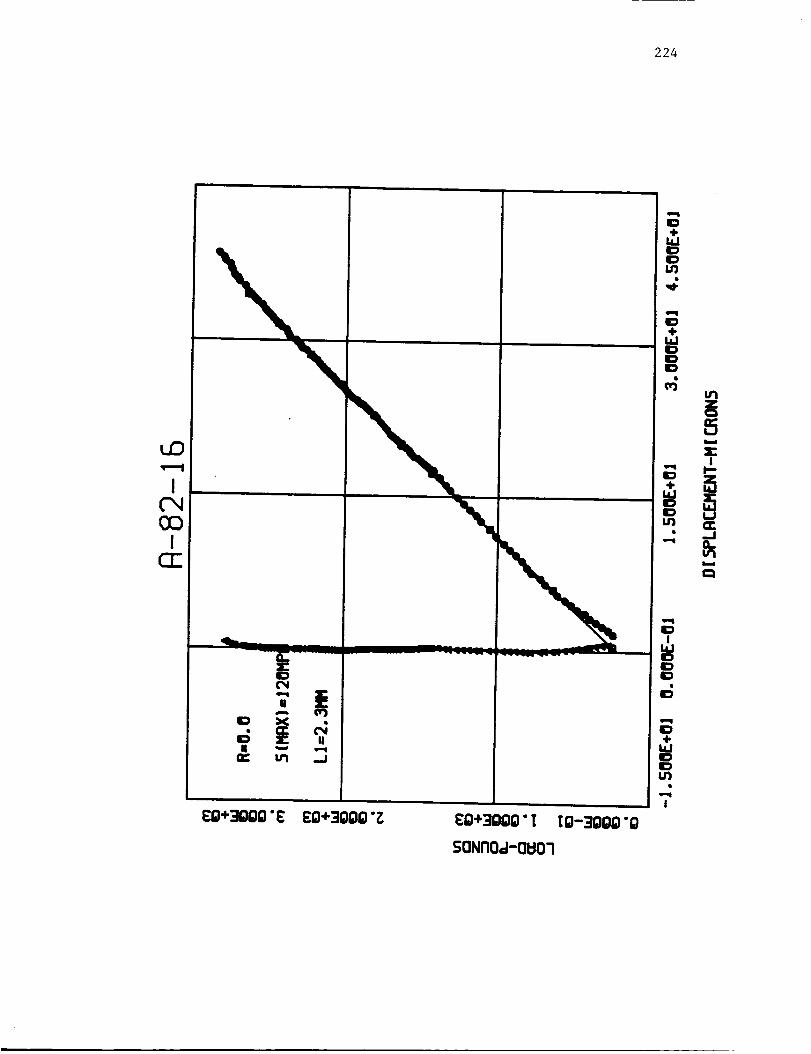
224
1.0
CII
g
_" Lrl .J
Eg+_}gg "E EO+3OOO'Z Eg+3gOO'! ]O-3ggg'g
saNnoa-auo7
4.
ID4.
IDU'J
!

OE tK)O_L QUALITY.
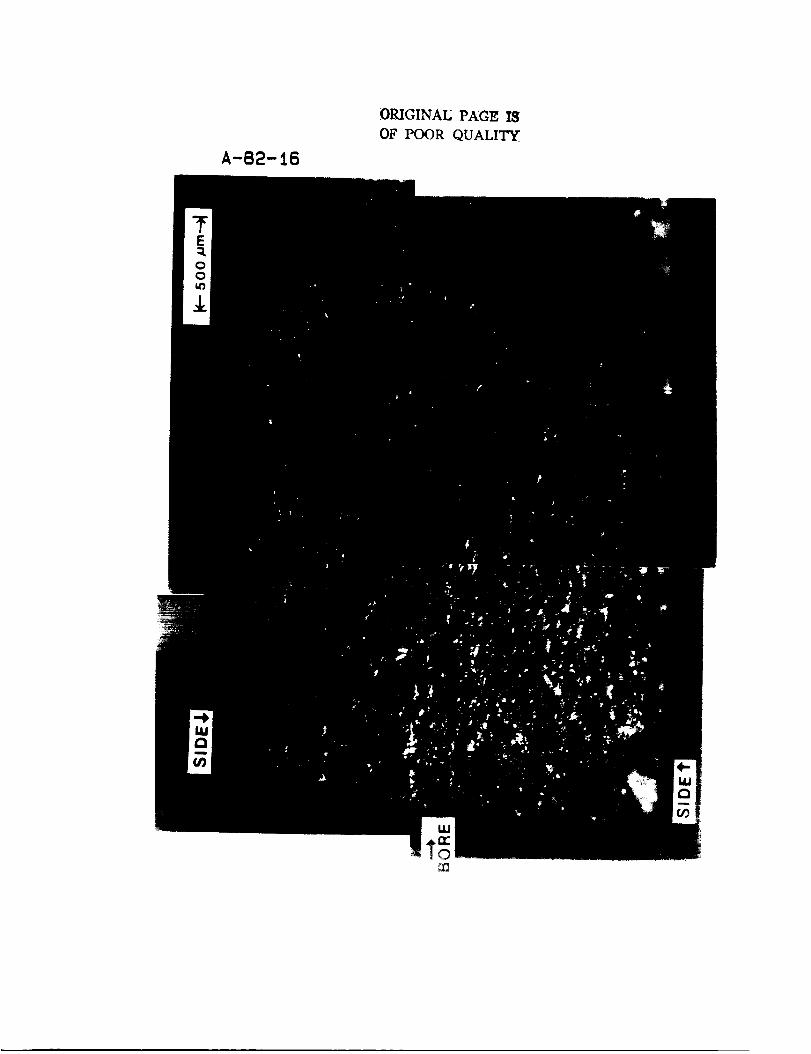
A-82-16
ORIGINALS P.e/GE IS
OF POOR QUALITY.
;E

227
SIDE
SIDE
BOREI
Tracing of Crack Front for A-82-:16

228
TEST DATA
SPECIMEN NUMBER:
DATE. 6/tl / _
PARTICIPANT' S NAME"
A-_% -3o
TEST TEMPERATURE:
RELATIVE HUMIDITY: _0
WAVEFORM TYPE: Sinusoidal wave,
LOADING SEQUENCE TYPE:
R-_ATIO = O. O
S max = I_-O _Pa
S rain = 0 HP_
FINAL LENGTH OF CRACK:
COMMENTS :
I_o c_,.
Joo-Jin Lee
John Cieslowski
-_°C
20 Hz
Constant amplitude
t%o &r_:.,W
CVc_.

229
TEST DATA
SPECIMEN NUMBER:
DATE"
PARTICIPANT' S NAME:
TEST TEMPERATURE:
RELATIVE HUMIDITY:
,4 -_7 -14
Joo-Jin Lee
John Cieslowski
WAVEFORM TYPE:
LOADING SEQUENCE TYPE:
Sinusoidal wave, 20 Hz
Constant amplitude
O,O
O HP_
R-RATIO =
S _ax =
S min s
FINAL LENGTH OF CRACK:
COMMENTS:
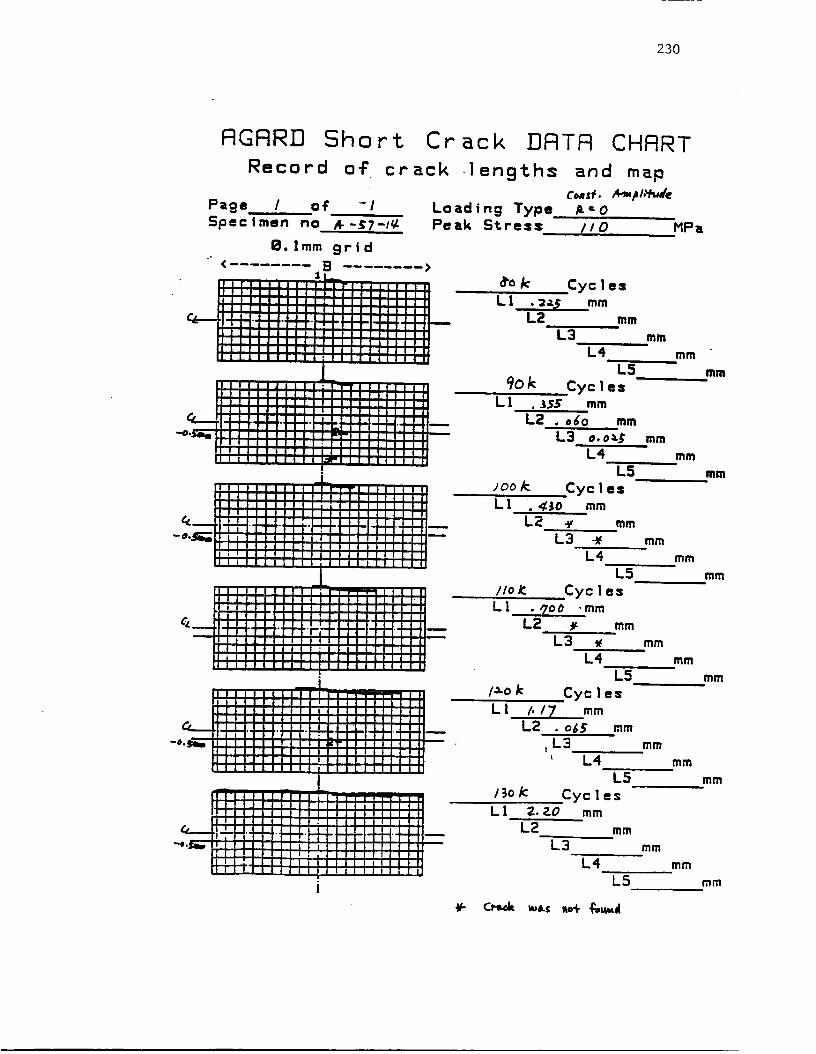
230
86 k Cycles
L1 .=9 mmL2 mm
L3 mm
L4
L5
90k CyclesL 1 .J._5 mm
L2 . 060 mm
L3 o.o=L;
L4
L5
Joo k. Cyc I esL1 . _Jo mm
L2 _ mmL3 -_ mm
L4
L5
.Cyc I es//o/c
mm
Lt, .. ,,700 -ramL2 , mm
L3 _ mm
L4
L5
1=.o k Cyc I e=
/3ok
L1
mm
mm
mm
mm
mm
mm
mm
mm
W- C_L6k w,.s _o+ i%w_l
LI /'/7 mmL2 . o_5 mm
L3 mml
L4 mm
L5 mm
Cyc I es2.2-0 mm
L2 mmL3 mm
L4 mm
L5 mm

231
_Z DA/DN DATA ZZ
SPECIMEN' NO. = A-57-14.L1NO. OF DATA = 6R= 0.00SMAX=110.O MPa
CYCLE(XIO00) CRK L. 2a(mm) AVG. a(mm) DELK(MPa-M) DADN(mm/CYCLE)
0 BO 0.225 0.000 0.00 0.000 XI.E-6
I 90 0.355 0.145 4.92 6.500 X1.E-6
2 100 0.430 0.196 5.64 3.750 XI.E-6
3 110 0.700 0.282 6.65 13.500 XI.E-&
4 120 1.170 0.468 8.35 23.500 X1.E-6
5 130 2.190 0.840 10.91 51.000 X1.E-6

232
I
I
XUO<
_UII
X_<ZXO
0+0HII
IIII I I I I
"onlll i i I
'0Vm
w
IIIIII I I I IIIIIII I I IIIIII I l
'0 '0
I IIIIII I I
(0
'0
0
,--JrI
I,U- 0
w
i
o
I 0
B-13A3/HH) NO/VO

233
T
&
I
0")
E
m
°!
Q
I
50NnO_l-Ob'01

ORIGINAI_ PAGE IS
OK POOR QUALITY
A-57-14

D_IGINAL PAGE IS
£OOR QUALITY,
A-57-14
BORE
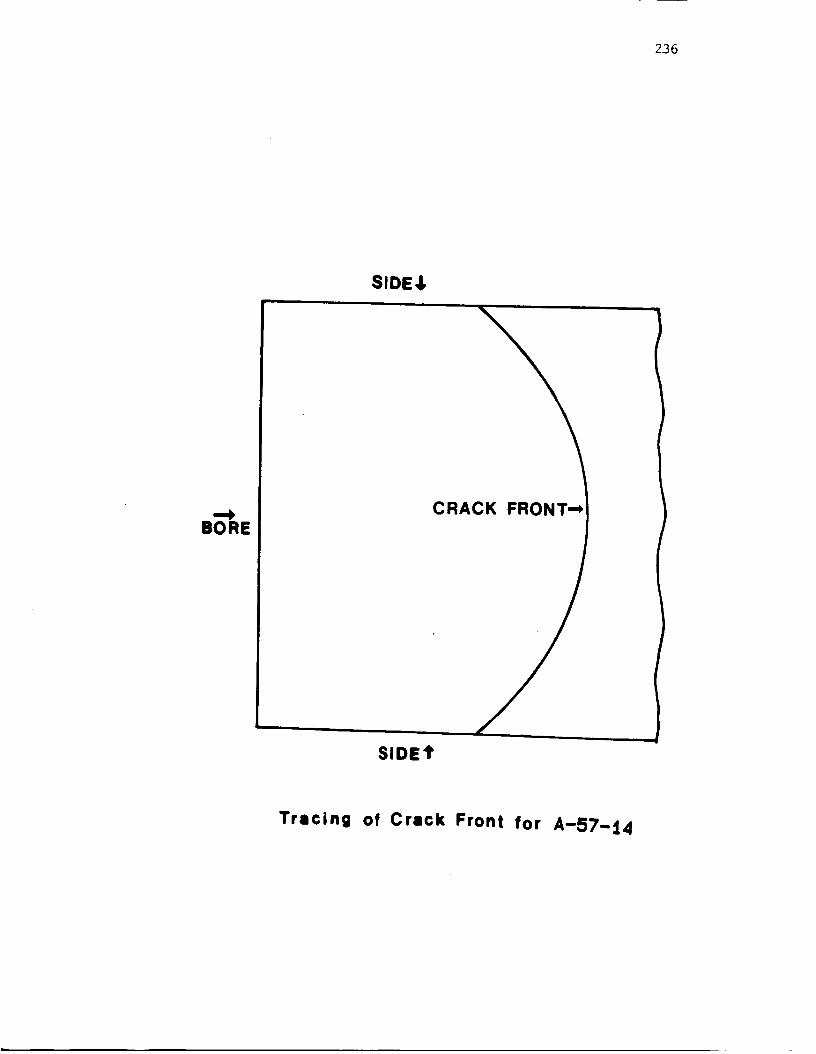
236
BORE
SIDE,I,
CRACK FRONT"*
SIDE1'
Tracing of Crack Front for A-57-i4

237
TEST DATA
SPECIMEN NUMBER:
DATE: 6/15 /_
PARTICIPANT' S NAME:
TEST TEMPERATURE:
RELATIVE HUMIDITY:
A -_o -aS
Joo-Jin Lee
John Cieslowski
27" C
_4 "/o
WAVEFORM TYPE:
LOADING SEQUENCE TYPE:
R-RATIO = _. O
S max = }|0 _P_
s .in - 0 MP_
FINAL LENGTH OF CRACK:
Sinusoidal wave, 20 Hz
Constant amplitude
o.-3")I _
COMMENTS:

238
RGRRD Short Crack FIFITFI CHRRT
Record of crack i engths and map
Page / of 2" Loading Type Cj_ A_,_/,','-,_.Specimen no A-_O-Z.I Peak Stress (tO HPa
B. lmm grid< ........ B
_L
I(_ K Cyc I esLI .tJgZ mm
L2 mmL3 mm
L4 mmL5 mm
/lO ¢ Cyc 1esL 1 ._|'/ mm
L2 mm
L3 mm
L4 mmL5 mm
/ZO _: Cyc 1esLI .114. mm
L2 mmL3 mm
L4 mmL5 mm
130 K Cyc I es
L! _ mmL2 mm
L3 mmL4 mm
L5 mm
14_ /4 Cyc 1• sL I . _.Z_ mm
L2 mmL3 mm
L4 mm
L5 mm
(C'OK Cyc I esL! "_ mm
L2 mm
L3 mm
L4 mmL5 mm

239
FIGRRn Short Crack OFITR CHRRT
Record oT crack lengths and m_p
Page 2 o¢Specimen no #-_-_ Peak
g.[mm grid{ ........ B ........ >
Leading Type _ _ 0 l i
Stress_ /(#
Irl I I 1 I , I I I'1II I I I I l I I I I I
fill I I I I I I I|II I I I I I I I I[l
,,II'lJ Jil.i.l_L.lI_IIIiJI IJ;il|J I I I I I I I I II[I1111 1 IIIIII I I I I I I [I I lI[! [I I II I I II
jlllt| v I I IIiill/flll TM
I I I I I Ill I III
I III I qqll IIII I I I I I I I I LIII I I I I I II I I II
_L
/bO _ CyclesLI ,_r-/l mm
L2 mm
L3 mm
L4
L5
Cyclesmm
mm
MPa
mmmm
LI ._iH_L2
L3 mm
L4 mm
L5 mm
CyclesL1 mm
L2 mm
L3 mm
L4 mm
L5 mm
CyclesLI mm
L2 mm
L3 mm
L4 mm
L5 mm
CyclesLI mm
L2 mm
L3 mm
L4 mm
L5 mm
CyclesLI mm
L2 mm
L3 mm
L4 mm
L5 mm

240
_* DA/DN DATA *Z
SPECIMEN" NO. = A-80-28.L1NO. OF DATA = 5R= 0.00
SMAX=110.O MPa
Cotf,e_ _._
CYCLE(XIO00) CRK L. 2a(mm) AVG. a(mm) DELK(MPa-M)
0 100 0.082 0.000 0.00
1 110 0.087 0.084 3.79
2 120 0.114 0.100 4.11
3 140 0.229 0.171 5.26
4 160 0.371 0.300 6.76
DADN(mm/CYCLE)
0.000 XI.E-6
0.500 X1.E-6
2.700 X1.E-6
5.750 X1.E-6
7.100 XI.E-6
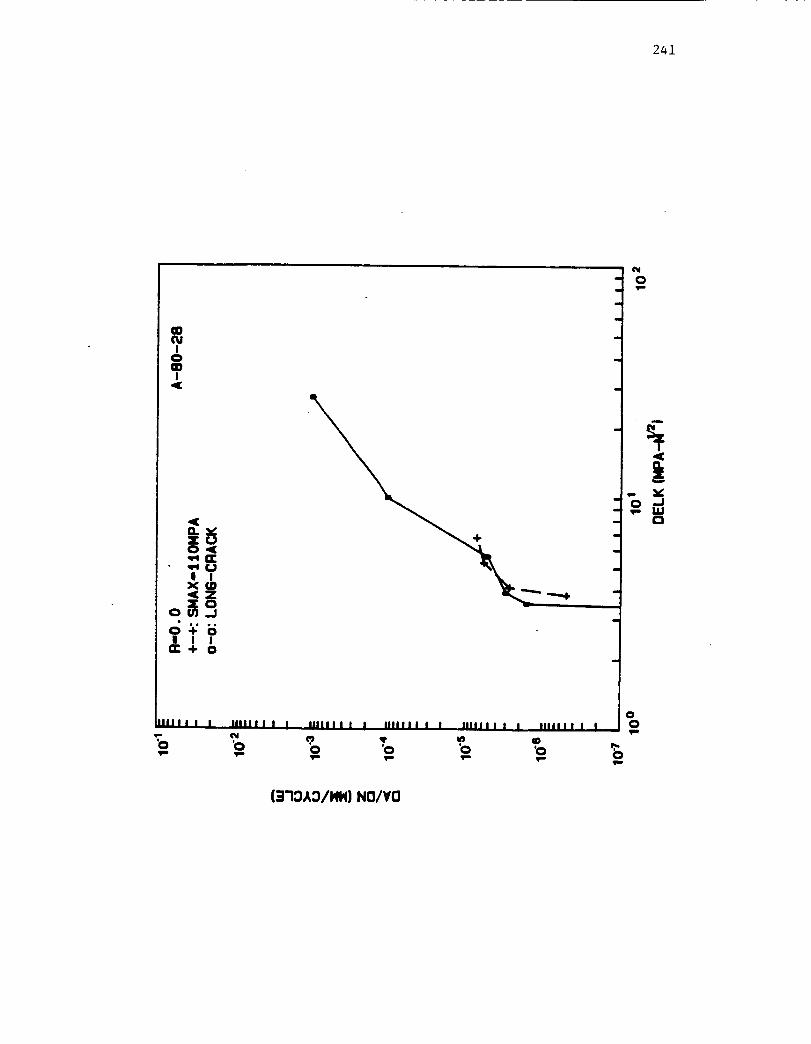
241
;
IIII I I I IIIIII I I I IlUll I I I IIIIII I I I ilill I I I I
% "I-. --,.. O '0 '0
qm Vm qlm
IIII I I I I
aD
'o
i
I
g
(3"I::)A::)/HN) N(]/VO

242
ED+3OOO'E Eg÷3gOg'_ EO+3DOO'T Ig-3DDg'g
SONnO_-O_07
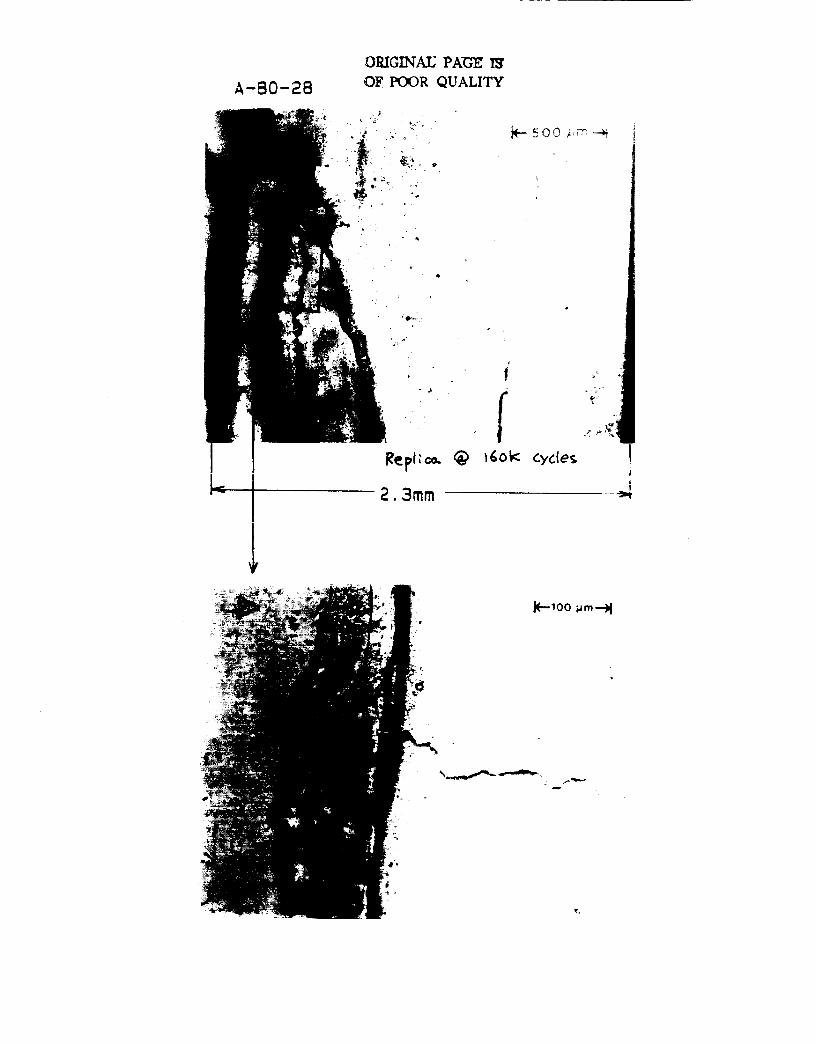
A-BO-2B
ORIGINAl5 PAGE I_
OF POOR QUALITY
!
,II_oM cycles
|
1(,-,,-100 N m --)1
: f*_m=.-,

ORIGI-NAIA PAGE IS
OF POOR QUALITY
B(
BORE
ACK FRONT
SIDE't
for A-BO-2BTracing of Crack Front
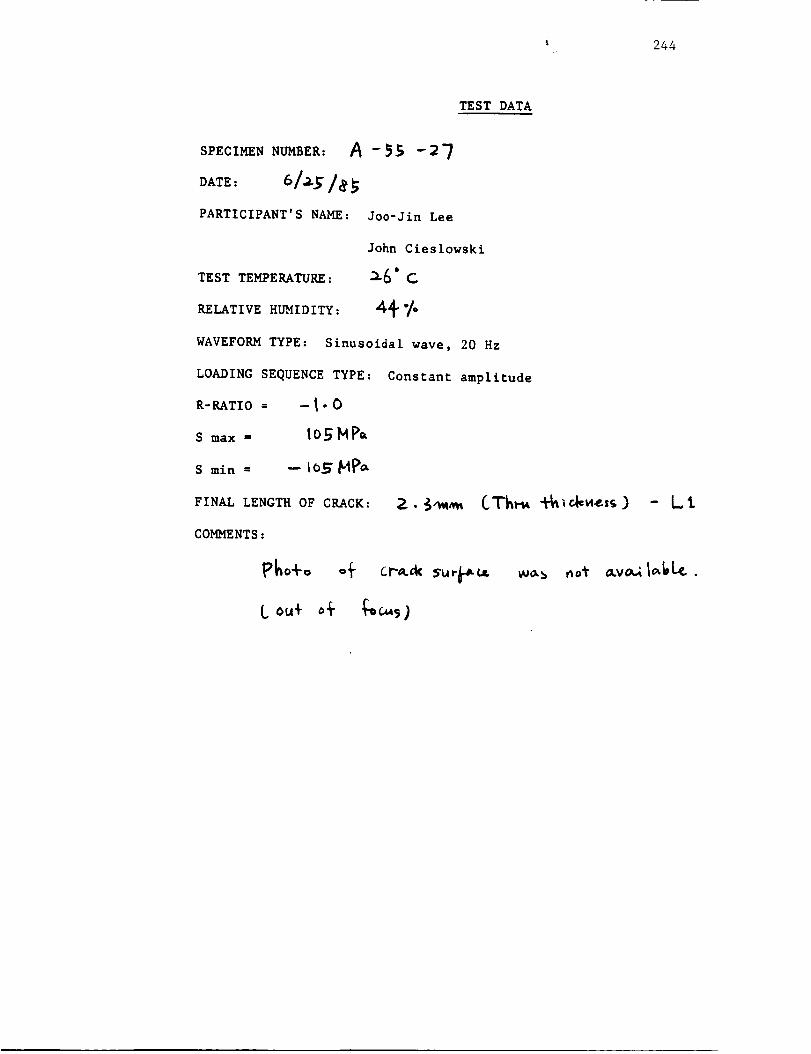
244
TEST DATA
SPECIMEN NUMBER:
DATE: 6/_/_
PARTICIPANT' S NAME :
TEST TEMPERATURE:
RELATIVE HUMIDITY:
A -_s -2V
Joo-Jin Lee
John Cieslowski
WAVEFORM TYPE:
LOADING SEQUENCE TYPE:
Sinusoidal wave, 20 Hz
Constant amplitude
R-RATIO = --_-O
S max = lO_ _ PO.
s rain-- -- 1o_ HP_
FINAL LENGTH OF CRACK:
COMMENTS :
P_o+o
(. OU÷
no_ _v_l_k .

245
RGFIRD
Record
.i_
LS_mm/_ _ Cyc Ies
LI ./?( mm
L2_ram
"L3 .136 mm
L4 ,0_7 mm
L5 , _'/' mm12. F, Cyc I • 8
L l.__._2.2___mmL2 .Ag_ mm
L3 _F mm
L4 ,2;'I mm
L5, . O_ mm/f K Cy= IesLl_mm
L 2__,.2,.d__.___mmL3 ._- mm
L4 ,2R_ mm
L5 ./,ZO mm
'-_ Ce_.'ok"was .#r C_r

246
-! _t
[
mm
L4L5
mmmm
mm
LS_._mm_ I_ Cycles
Ll.._mm
L2._mmL3 _ mm
L4 mm

247
0
1
2
3
4
5
6
7
ZZ DA/DN DATA ZZ
SPECIHEN" NO. =NO. OF DATA =R=-I.008MAX=105,0 MPa
CYCLE(XIO00) CRK
A-55-27.L110
L. 2a(mm)
4
6
8
I0
12
14
15
17
0.032
0.049
0.136
0.191
0.322
0.758
1.760
2.110
AUG. a(mm)
0.000
0.020
0.046
0.082
0.128
0.270
0.629
0.967
DELK (MPa-M)
0.00
3.74
5.55
7.23
8.88
12.43
18.23
22.31
DADN(mm/CYCLE)
0.000 X1.E-6
4.250 X1.E-6
21.750 XI.E-6
13.750 X1.E-6
32.750 X1.E-6
109o000 X1.E-6
250.500 X1.E-6
175.000 X1.E-6
0
1
2
3
4
5
6
7
8
_Z DA/DN DATA SZ
SPECIMEN' NO. =NO. OF DATA =
R=-I.00SMAX=t05.0 MPa
CYCLE(XIO00) CRK
A-55-27.L2
9
L. 2a(mm)
4
8
I0
12
14
16
17
18
20
0.055
0.093
0.135
0.180
0.229
0.300
0.403
0.414
0.431
AVG.
0.000
0.074
0.114
0.158
0.204
0.264
0.352
0.408
0.422
a(mm) DELK(MPa-M)
0.00
6.80
8.35
9.68
10.87
12.20
13.84
14.79
15.01
DADN(mm/CYCLE)
0.000 XI.E-6
9.500 X1.E-5
21.500 XI.E-6
22.000 XI.E-5
24.500 XI.E-6
35.500 X1.E-5
103.000 XI.E-6
11.000 XI.E-6
8.500 XI.E-6

248
_ .0 oo1 4. oI I I
1"1"4. o
llilll I I
"oillllll i I IIIIIII I [ IIIIII I I I lilllll i l lllllil I I
._ .% - ..o ,,'o 'o '_
00
(_'IO*_)/NN) NO/YO

249
8
C3_
IDi
I
E:ID't'3000"( _000" T t_3000" T- _D"_OOO'G-
£_I410,1-QUOl
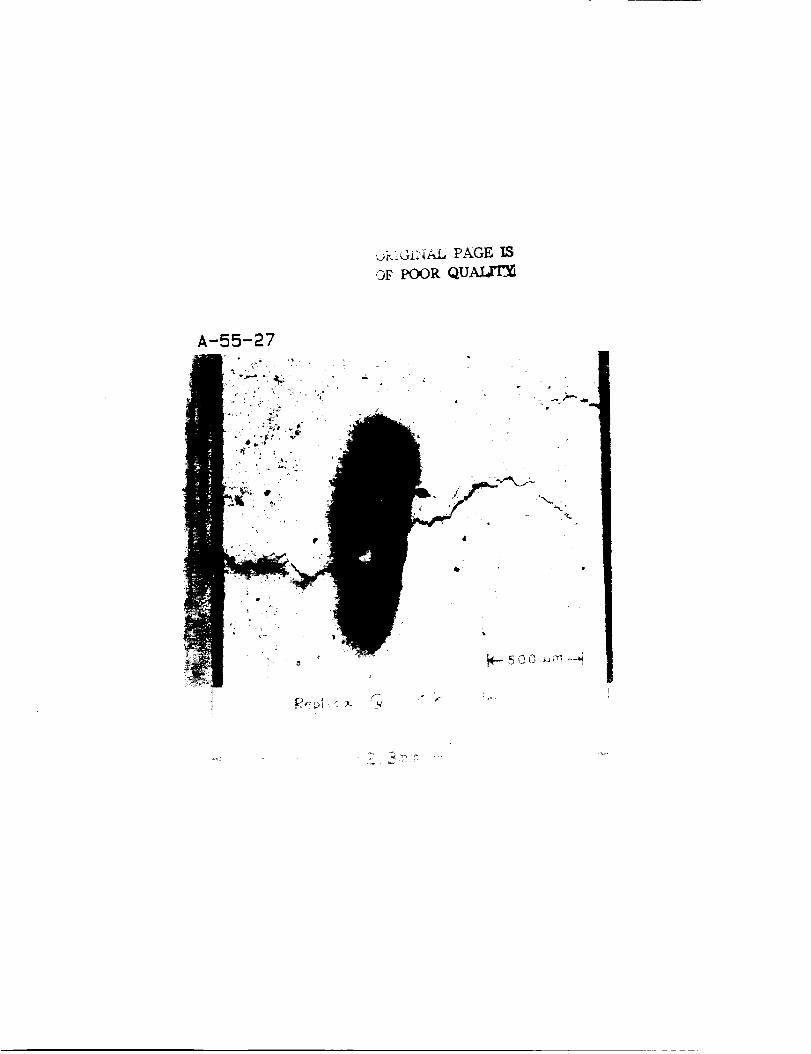
_.._Gn_AL PAGE
OF POoR QUAJAT_
I
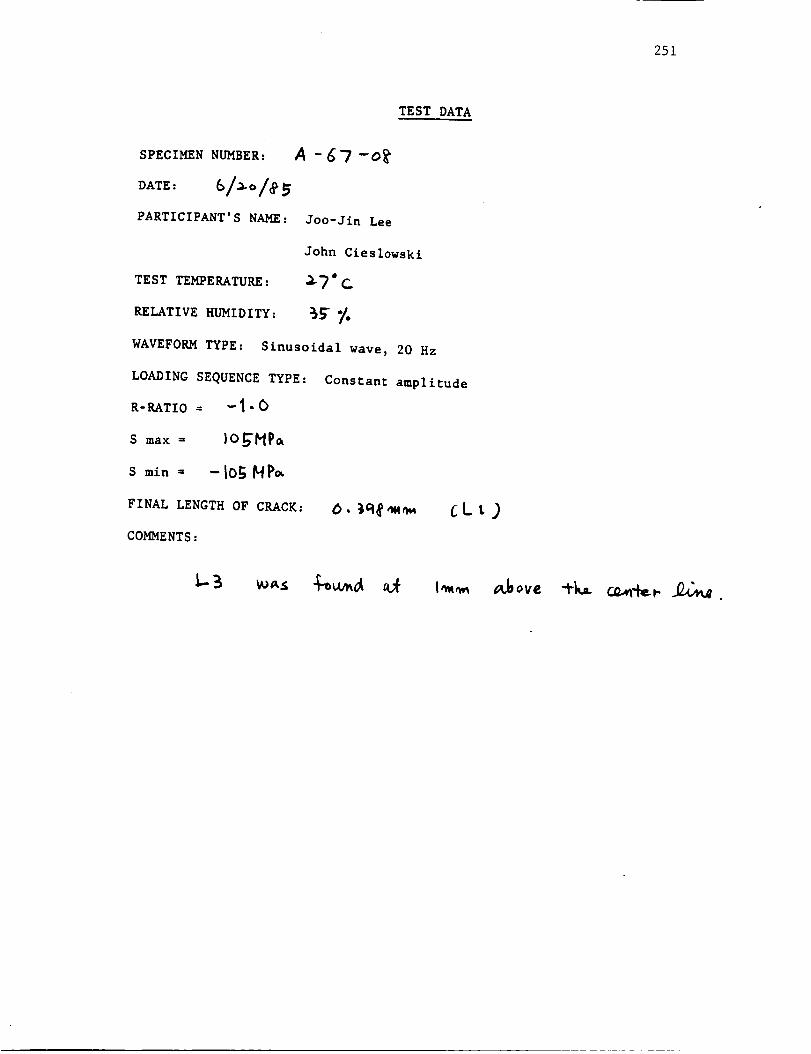
251
TEST DATA
SPECIMEN NUMBER:
DATE: 6/_-"/_ _
PARTICIPANT' S NAME :
A -67 -o_'
Joo-Jin Lee
John Cieslowski
3.?* CTEST TEMPERATURE:
RELATIVE HUMIDITY: _ "/.
WAVEFORM TYPE: Sinusoidal wave, 20 Hz
LOADING SEQUENCE TYPE: Constant amplitude
R-RATiO= -I-O
S max = |O_H_
s rain = -Io_ HP_
FINAL LENGTH OF CRACK:
COMMENTS:

252
8GRRD
Record o; crack lengths _nd map
Page [ o_ _- Loadtng Type _.s-f" t _1_#1;_
Shor t Crack DFITFI CHRRT
Sioec ! men no h-i'/-OT Peak Stress
8. lmm grid< B ........ >
MPa
'7_ CyclesLI ._ mm
L2 .&¢.S" mm
L3 ,,l:t_'l_f mmL4 mm
L5
9 ,_ Cyc 1ese
L I .2_7 mm
L2 ,Z_7 mmL3 ./04 mm
L4 ._mm
t
mm
mm
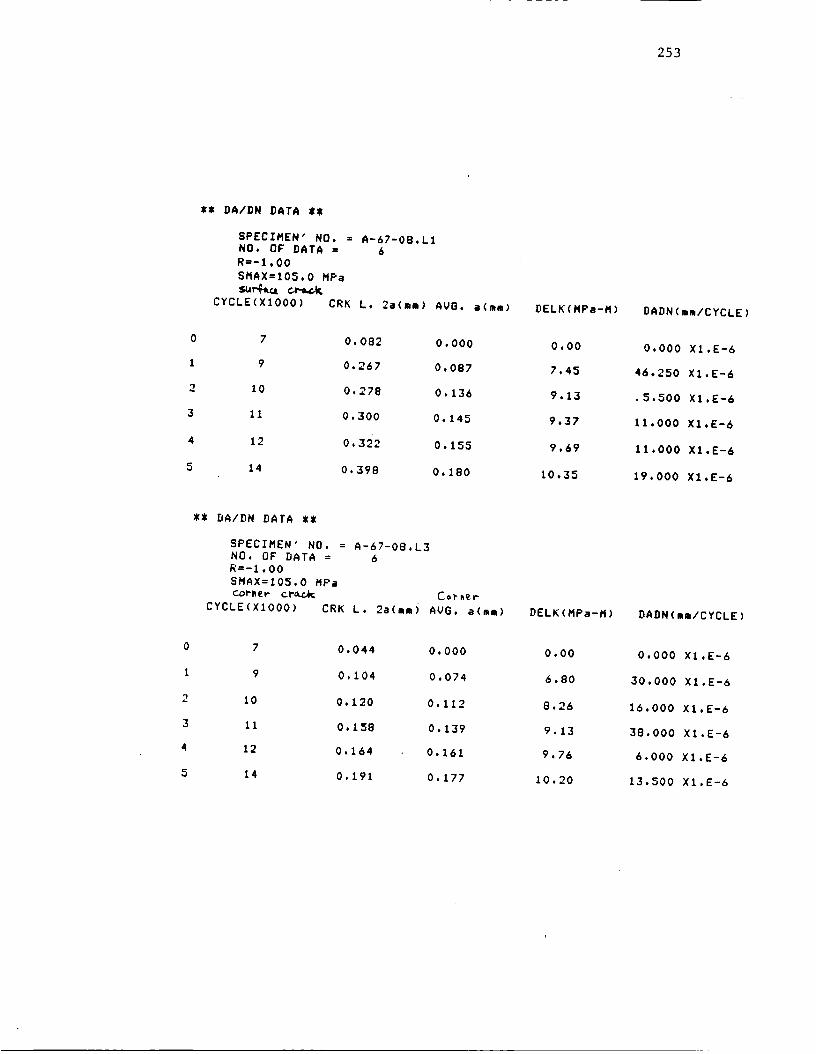
253
ZZ DA/DN DATA ZZ
SPECIMEN" NO* = A-67-O8.L1NO, OF DATA = 6
R=-I.00SMAX=105.0 NPa
CYCLE(XIO00) CRK L. 2a(mm) AVG, a(mm) DELK(MPa-M) DADN(mm/CYCLE)
0 7 0,082 0,000 0,00 0,000 XI.E-6
1 9 0.267 0,087 7,45 46,250 X1,E-6
2 i0 0,278 0.136 9.13 .5,500 XI,E-6
3 11 0,300 0,145 9,37 11,000 X1,E-6
4 12 0.322 0,155 9.69 11,000 XZ.E-6
5 14 0.398 0,180 10,35 19,000 X1,E-6
*Z DA/DN DATA ZZ
SPECIMEN' NO, =NO. OF DATA =
R=-I .00SMAX=105.0 MPa
CYCLE(XIO00) CRK
A-67-O8,L36
L. 2a(mmi
7
9
I0
11
12
14
0.044
0,104
0.120
O, 158
0,164
0.191
AVG. a(mm)
0,000
0,074
0,112
0,139
0,161
0,177
DELK(MPa-M)
0.00
6.80
8.26
9.13
9.76
10.20
DADN(mm/CYCLE)
0,000 XI,E-6
30,000 XI.E-6
16,000 X1,E-6
38,000 XI.E-6
6.000 X1.E-6
13.500 X1.E-6
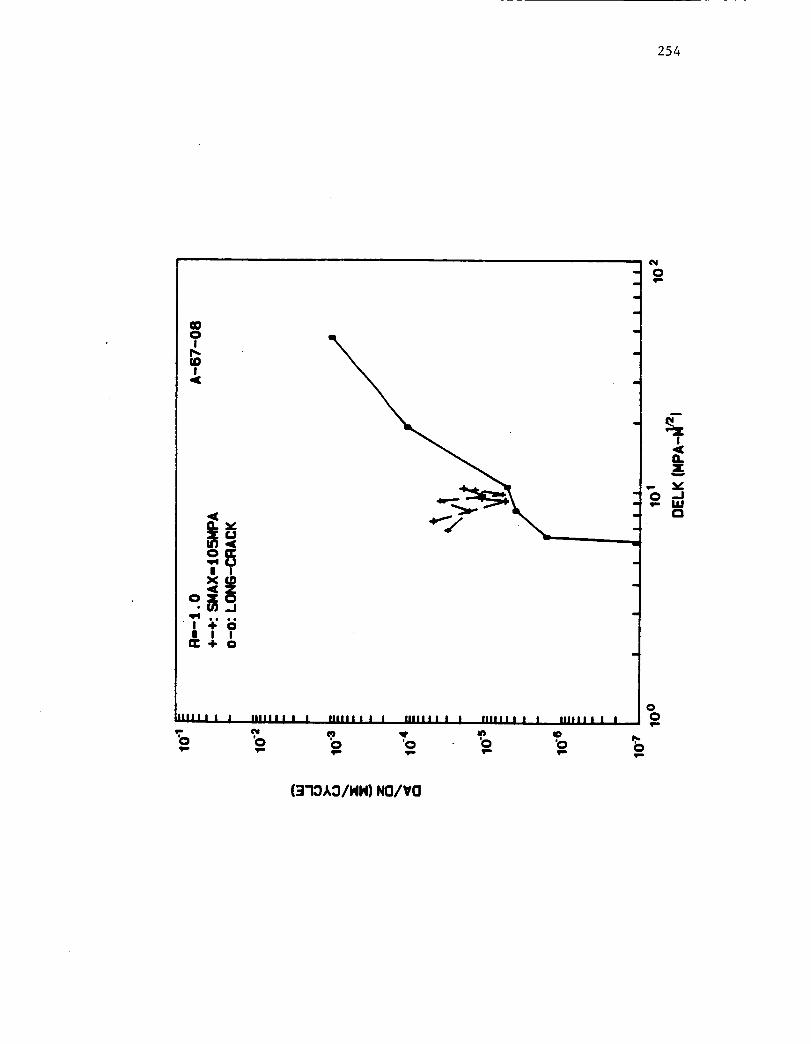
254
N
T
On",,,,I U
0
IIIII I I I IIIIII I I I Inlll I I I IIIIII I I I IIIIII I I I IIIIII I I I
'o 'o 'o
o
"o._
oo
(3_OAO/NN) NO/VO

255
(I
T
g w ,.,
!
Eg+3ggg "E Eg+3ggg" ! F.,O+3ggg"!- Eg+3ggg "£-
SONIIO,=I-Ob'07
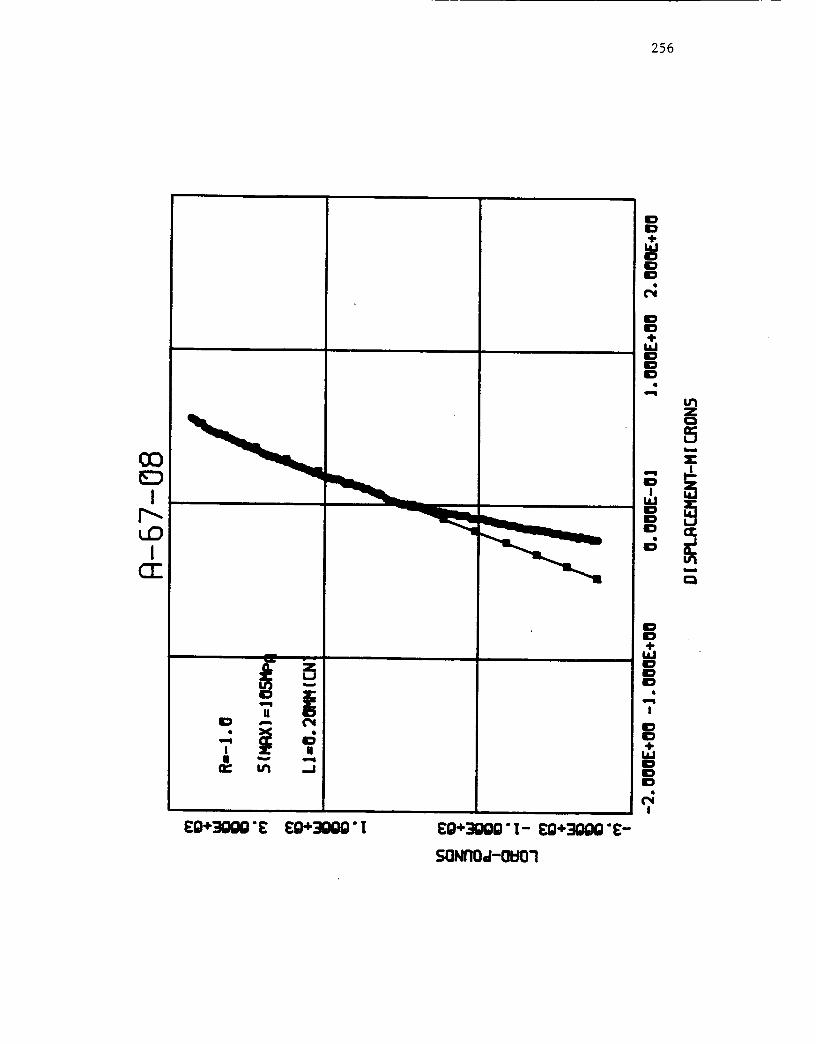
256
CE
U
! U
ED+310D0" I- ED+_'E-
g0Nl'10,J-01:101
?
,.,.,
Z
8ID
IDID4-
IDIO
!
0D÷
N!

A-67-08
OF POOR QUALITY
SIDEr
t
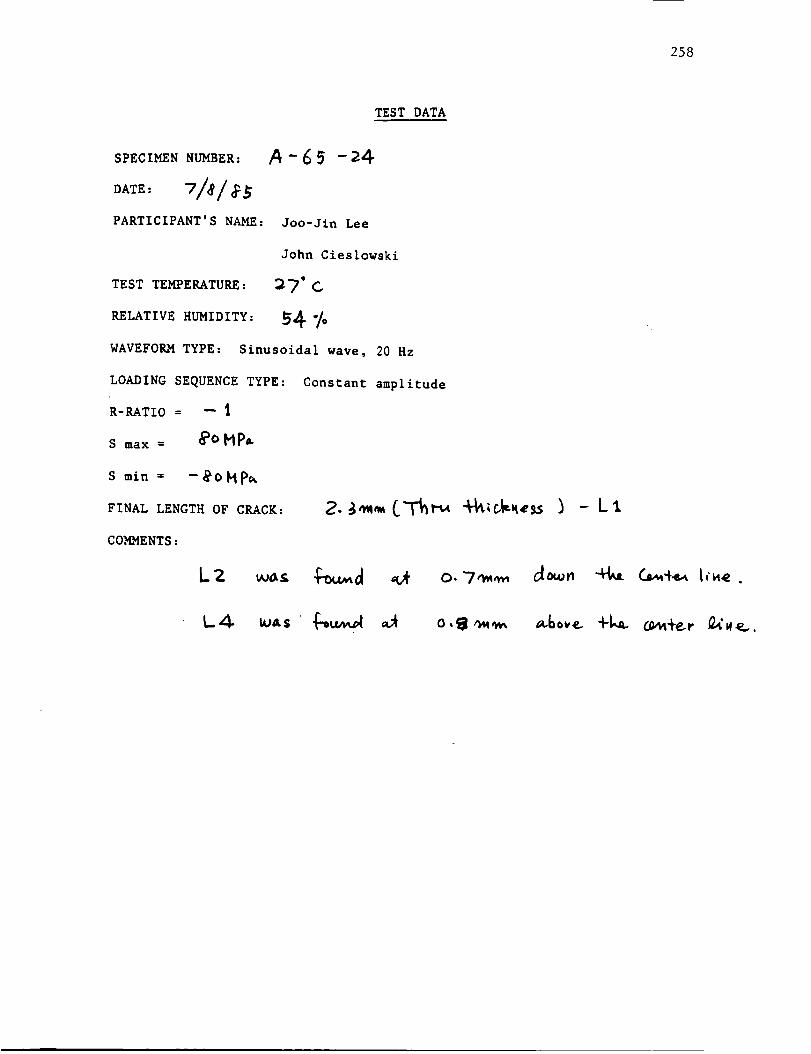
258
TEST DATA
SPECIMEN NUMBER:
DATE: V/e/ PARTICIPANT' S NAME:
TEST TEMPERATURE:
RELATIVE HUMIDITY:
A-d5 -_4
Joo-Jin Lee
John Cieslowski
WAVEFORM TYPE: Sinusoidal wave, 20 Hz
LOADING SEQUENCE TYPE: Constant amplitude
R-RATIO = -- i
S max = _°MP_
S rain = --_O_p_
FINAL LENGTH OF CRACK:
COMMENTS:
_6_ +1_. _,_+_,, _'w_.

259
RGRRD
Record
LJ C]Short Crack I]RTR C,,R,,T
of crack lengths and map
Loading Type _-;/_f/,'a_
Peak Stress 2C)
,_0KLI
MPa
mm
Page I o_ $
Specimen no A_--24
8.1mm grid
< ....... B ........ )
Cycles.a_3 mm
L2 .01_ mmL3
L4
L5
_ CyclesLI .D4_ mm
L2 ,oz_ mmL3 mm
L4 mm
L5 mm
_0_ CyclesL1 .0_3 mm
L2 ,033 mm
L3 mmL4 mm
L5 mm
_K CyclesL1 ._o9 -mm
.L2__.3___mm
L3 ,el6 mmL4 mm
L5 mm
68K CyclesL1 .to5 mm
L2 ._3_ mm
L3 ,o%7 mmL4 mm
L5 mm
6_K CyclesLI ,131 mm
L2 .055 mm
L3 .0_3 mmL4 mm
L5 mm
mm
mm

260
RGRRFI
Record o{ crack lengths and map
Short Crack OFITFI CHRRT
->
Page 2. of 5-
Spec Imen no A.6_-__4
8. Imm grid
< B
_[
Loading Type I_'-tPeak Stress _o
mm
MPa
"7D _ CyclesLI ,I_I mm
L2 ,_'/ mm
L3 _ mm
L4 mm
L5 mm
75"/_ Cyc Ies
L I .2_t-/ mm
L2 ,/:_6 mm
L3 ,_0 mm
L4 ,_3_ mm
L5 mm
_'O K Cyc I esL1 ._3_ mm
L2 ,/_"_ mm
L3 ,0_ mm
L4 ,O_j_ mmL5 .l?.S" mm
_" F, Cyc I esL 1 ,_q_ mm
L2__d__i__ramL3 .06t)
L 4_.JL_L_._mmL5 .131
9D _. Cyc I esL 1 ,#rO_ mm
L2 ,7-Z? mm
L3 .14"/ mm
L4 ,_)_ mm
L5 ,L_T mm'_lS"K Cyc I e s
L I ,470 mm
L2 .TaorO mm
L3 . {70 mm
L4 -_ mm
L5 ._.3_ mm
mm

261
RGRRD Sho r t Cr ack DRTR CHRRT
Record of crack lengths and map
f |llllllll_';_
-J I I I ; I !t I I la
r_lkl I I I I I I HiI IWl'ld | I !1
I', I I I,-I-_--_-_I I I I I I I III
1 I I I II
| I I I I I Iit I II
I ! I I | I III III
L.5 mm
L2.0 _ Cycles
LI _;_-; mm
L2 ,34-3 mm
L3 ,Z23 mm
L4 .05"_" mm
L5 mm
IZ_- I<, Cyc Ies
L 1 THKLI mm
L2 ,3_3 mm
L3 ,22,9 mm
L4 ,0S-g"
L5• .
mm
-_ C,_v_ was act _r
mm

262
ZZ DA/DN DATA _$
SPECIMEN" NO. = A-65-24.L1
NO. OF DATA = 17
R=-I.00
SMAX= 80.0 MPa
CYCLE(XIO00) CRK L, 2_(mm)
0 40 0.033
1 45 0.044
2 50 0.093
3 55 0.109
4 65 0.131
5 70 0.191
6 75 0.251
7 80 0.338
8 85 0.382
9 90 0.409
10 95 0.480
11 i00 0.698
12 105 1.046
13 110 1.117
14 115 1.613
15 120 2.027
AVG. a(mm)
0.000
0.019
0.034
0.050
0.060
0.080
0.111
0.147
0.180
0.198
0.222
0.294
0.436
0.541
0.683
0.910
DELK(MPa-M)
0.00
2.78
3.67
4.41
4.78
5.47
6.32
7.20
7.88
8.23
8.67
9.85
11.77
12.97
14,41
16.49
DADN(mm/CYCLE)
0.000 X1.E-6
1.100 X1.E-6
4.900 X1.E-6
1.600 XI.E-6
1.100 X1.E-6
6.000 X1.E-6
6.000 X1.E-6
8.700 X1.E-6
4.400 X1.E-6
2.700 X1.E-6
7.100 X1.E-6
21.800 X1.E-6
34.800 X1,E-6
7.100 XI.E-6
49,600 X1.E-6
41.400 XI.E-6
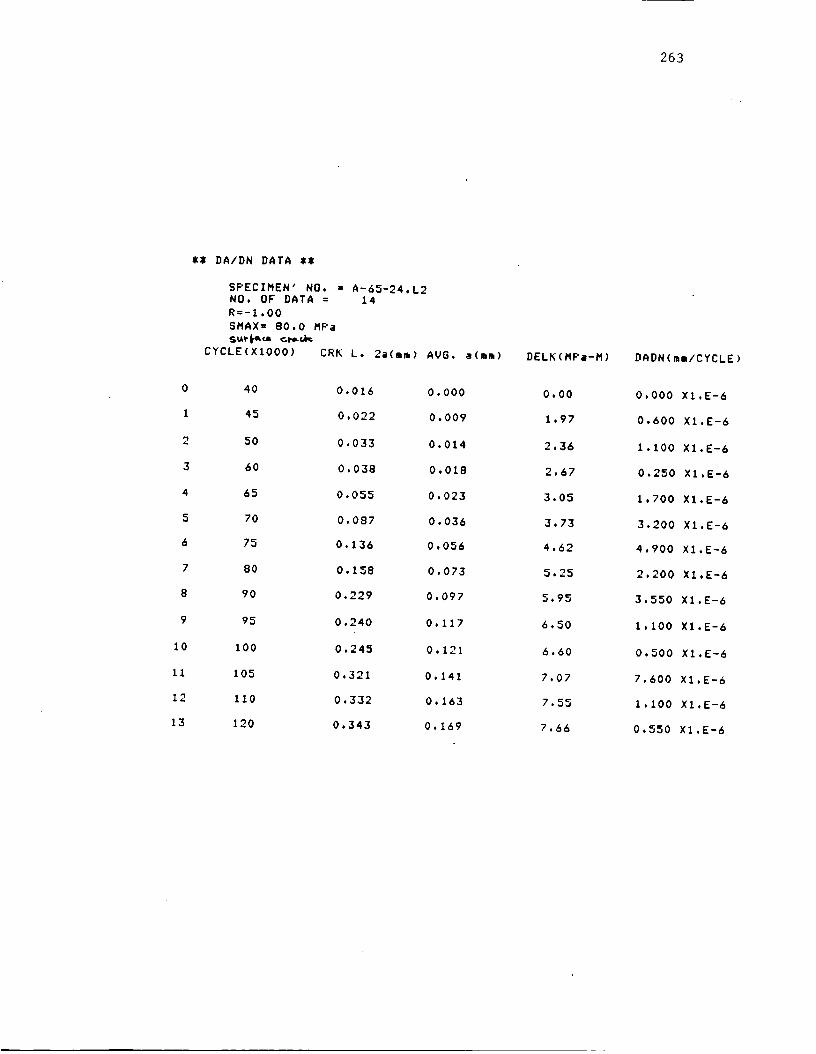
263
0
1
2
3
4
5
6
7
8
9
10
Ii
12
13
ZZ DA/DN DATA ZZ
SPECIMEN" NO. =NO. OF DATA =R=-I.O0SMAX = 80.0 MPa
CYCLE(XIO00) CRK
A-65-24.L214
L. 2a(mm)
40
45
50
60
65
70
75
80
90
95
100
105
110
120
0.016
0.022
0.033
0.038
0.055
0.087
0.136
0.158
0.229
0.240
0.245
0.321
0.332
0.343
AVG. a(mm)
0.000
0.009
0.014
0.018
0.023
0.036
0.056
0.073
0,097
0.117
0.121
0.141
0.163
0.169
DELK(MPa-M)
0.00
1.97
2.36
2.67
3.05
3.73
4.62
5.25
5.95
6.50
6.60
7.07
7.55
7.66
DADN(mm/CYCLE)
0.000 X1.E-6
0.600 X1.E-6
1.100 X1.E-6
0.250 X1.E-6
1.700 X1.E-6
3.200 X1.E-6
4.900 X1.E-6
2.200 X1.E-6
3.550 XI.E-6
1.100 X1.E-6
0.500 X1.E-6
7.600 X1.E-6
1.100 X1,E-6
0.550 X1.E-6

264
IInIDI
Ull I I I IIIIIII I I nllll I I I UlIII I I I IIIIIII I | IIIIIII I I
,. o 'o 'o 'o
lo
0
(3qOAO/NN) NO/VO
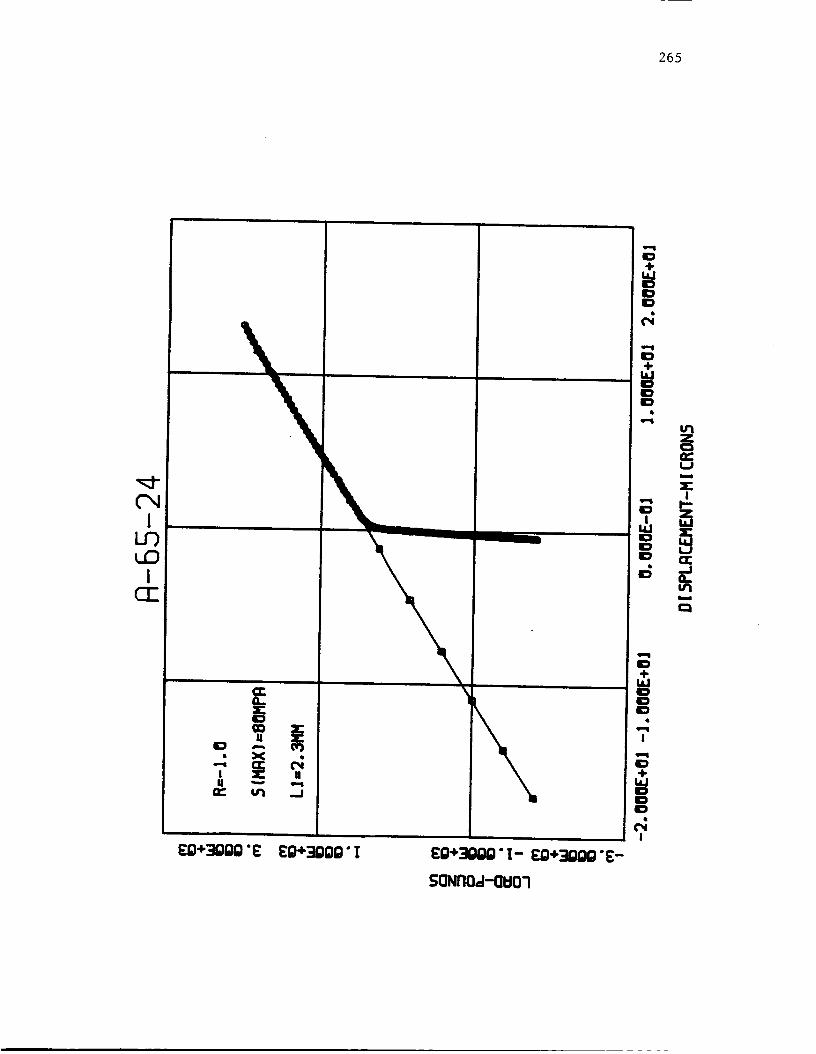
265
EQ÷3QQg'E EQ÷3)gQ'! EQ+_" I- EQ÷_QQ "E-
SQNROJ-QB07
==
===.O
4.
==.3'
ID4-
I.dOID
!
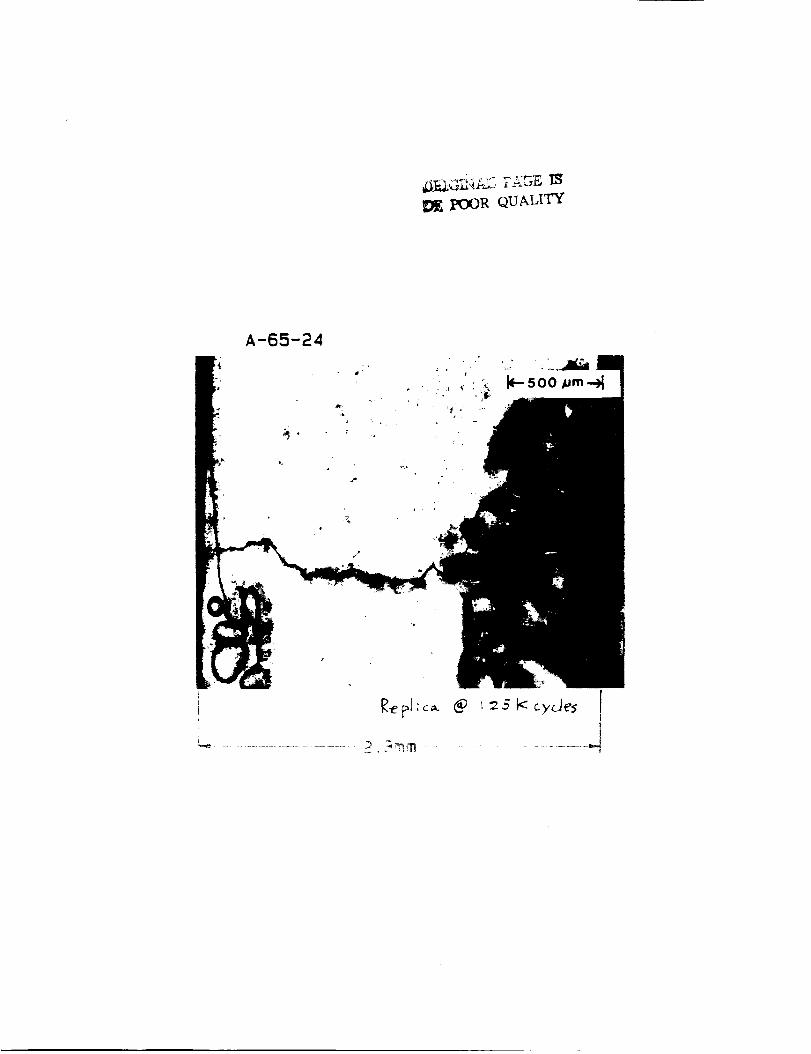
pooP. QUALITY
A-G5-24
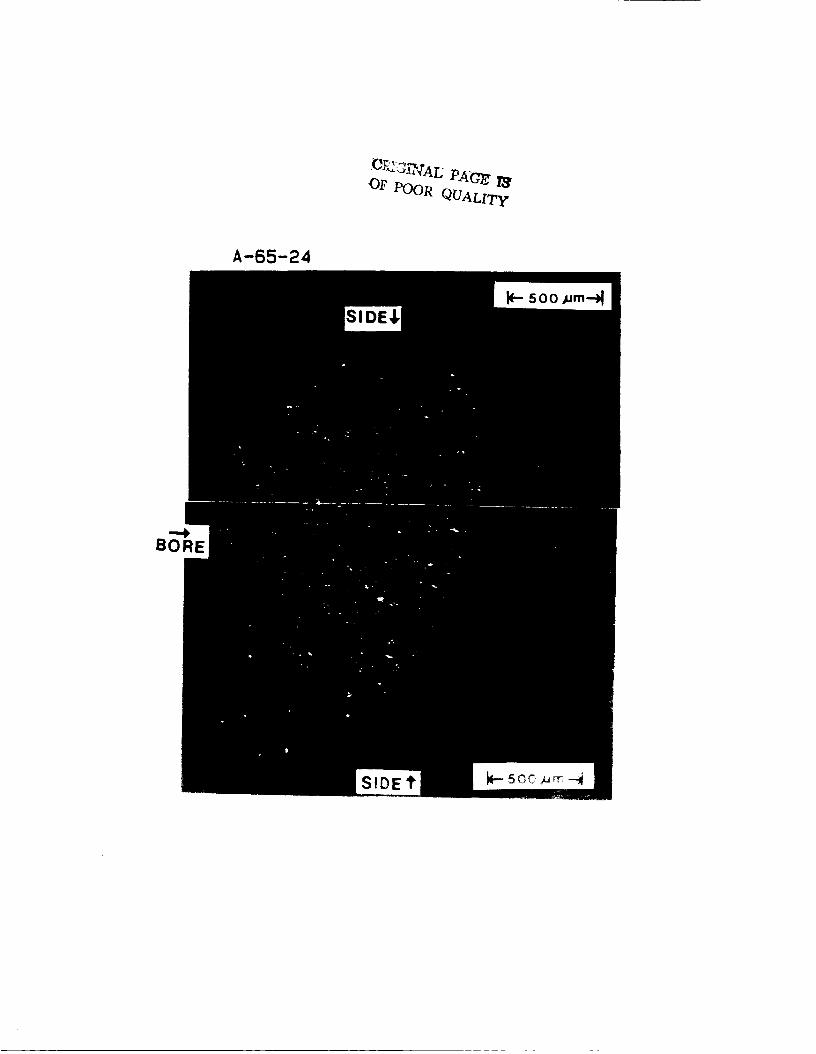
OF POOR QUALITy.
A-65-24
BORE

268
TEST DATA
SPECIMEN NUMBER:
PARTICIPANT' S NAME:
TEST TEMPERATURE:
RELATIVE HUMIDITY:
A - 72 -o7
Joo-Jin Lee
John Cieslowski
27"c
WAVEFORM TYPE:
LOADING SEQUENCE TYPE:
R-RATIO = -- I .0
s max = _0 HP=
S rain = --_'0 HP=
FINAL LENGTH OF CRACK:
COMMENTS:
Sinusoidal wave, 20 Hz
Constant amplitude
0.05 _

269
RGRR]3 Short Crack TIRTR CHRRT
Record o{ crack lengths and mel0
Page ! o_ -I Loading Type 1_-_1Spec|men no A-72_ 7 Peak Stre=s _p MPa
I_, lmm grid< B
IIIlililliftIlilllllllll*II ili i * i tl!|II |I I I I llll
f
--I+TH-I-H.H-+IIIIIIIIIiiiI I I I I I I IIi I
I]I i _I I I I I I I
II | I I I I I I I I I
-)_I0_ Cycles
LI .o_0 mmL2 mm
L3 mmL4 mm
L5 mm
CyclesL! mm
L2 mm
L3 mm
L4 mmL5 mm
CyclesLI mm
L2 mm
L3 mm
L4 mm
L5 mm
CyclesLI -mlTI
L2 mmL3
LI
L2L3
!
I I I I I Ill I I I1
,li,,i,ti,ll LII I II fill I I II
I ' ' "I-H-H-HI--lJl L3
i i II llll, ILlI I I I I III I ILI
i I ii IIII ILLI
L4L5
Cyclesmm
mm
L4L5
Cycles
mm
mm
L4
L5
mm"mm
mmmm
mm
mm
mm
mm
mm

270
I
ICIZ
¢10 I._U UD
,_ .5! U
EO+3OOO'_ Eg+3OgO'! _O+3OOO'T- EO+3gOO'E-
50Nn0_-0U07
9
EI
9
I14J
O
I
ID+
IO
Q
I

_JFS:iD_IAiI_PAGE IS
OF POOR QUALITY
A-72-07

272
TEST DATA
SPECIMEN NUMBER:
DATE: 7/_ /_
PARTICIPANT' S NAME :
TEST TEMPERATURE:
RELATIVE HUMIDITY:
A - 5S-o_
Joo-Jin Lee
John Cieslowski
a-?°C
61"/,
WAVEFORM TYPE •
LOADING SEQUENCE TYPE:
R-RATIO = --_'O
s max-- _70MP_
S rain = --7 ° M P_
FINAL LENGTH OF CRACK:
COMMENTS :
Sinusoidal wave, 20 Hz
Constant amplitude
LI

z73
-)
RGRRD Sho r t Cr ack DRTFI CHRRT
Record of crack lengths end malo
Page / of 3" Loading Type i_.-tSpecimen no A-S'_-OR Peak Stress 1"/o MP_
B. |mm grid
< B
.i
/23_ CyclesL1_mm
L2 mm
L3
L4
L5
(_'O& CyclesLI ._3
L2
160 !(.
L t .-gOZ.L2
L3
mmmm
L3L4
L5
Cycle=mm
mm
mm
mm
mm
mm
mm
mm
mill
L4 mmL5 mm
170 g Cyc 1e=L I ._J16 mm
L2 mm
L3 mm
L4 mm
L5 mm
l_i_) K Cyc I e=L I ._'_E mm
L2 . KF)'_ mmL3 mm
L4 mm
L5 mm
I¢}_]It,. Cyc I esL I .4-ZD mm
L2 • (_,_ mmL3 mm
L4 mm
L5 mm
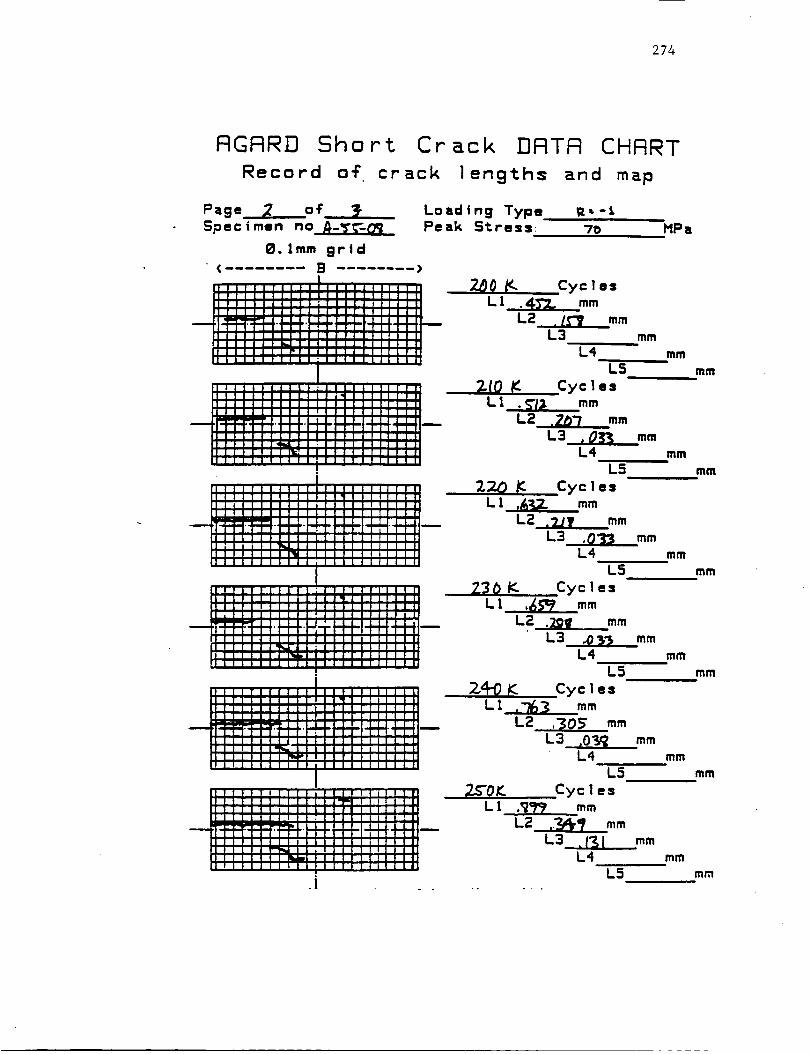
274
RGRRD Short Crack ]]FITFt CHRRT
Record of crack length:; and map
Page _ of _. Loading Type R_-[Specimen no 4-T_'-O_ Peak St.re=s: 70
0. Imm grid< ........ B >
.i
7._0 _,. Cyc IesLI .4_Z, mm
L2 .l_'y mmL3 mm
L4
L5
2.10 # Cyc I esL I ._13 mm
L2 _mmL3 ,O_f_ mm
L4
L5
2:2.0 JC Cyc IesL I ,_3Z mm
L2 .2JT mmL3 ,033 mm
L4
L5
Z3C) _ CyclesL 1 ,_5_' mm
L2 .Zgq mm
L3 .O33L<
L5
_"0_Ll
mm
MPa
mm
mm
mm
mm
mm
mm
mm
mm
Z_ _ Cyc I e,L1 ,-_3 mm
L2 ,_0_ mm
L3 ,0_ mmL4 mm
L5 mm
Cyc I • s
.'_c_:? mm
L2 ..'Zj_t-? mm
L3 . I'_ I mmL4 mm
L5 mm

275
RGRRD
Record
Short Crack
lengthso_ crack
DRTR CHRRT
and m_p
_;_ MPa
mm
Page 3 o_ _ Loading TypeSpecimen no A-ff_-O_ Peak Strell
B. Imm grtd< ........ B ........ )
_ 2_0t Cy:le:
Ll__mm
L2_mm
L3 .170L4
mm
mm
mm
L1
L2
.i
L2
L!
mm
L3 , mm
"L4 _t mm
LS. mmCycles
mmmm
L3_ mm
L4 mm
L5 mm
Cyclesmm
mmL3 mm
L4 mm
L5 mm

** [;A/DR DATA _(_
ORIGINAE PAGE
OF POOR QUAIZI_
SPECIMEN' NO. = A-55-O8.LI
NO. OF DATA = 15
R=-I.QO
SMAX= 70.0 MFa
C¥[-_LE (XIO00 ) CRK L. 2a( Nl_l) AVG. a ( nlnl
0 120 0.065
I 150 0.213
2 170 0.316
3 i_0 0.338
4 190 0.420
5 200 0.452
6 210 0.512
7 220 0.632
8 230 0.659
9 240 '>0"J'63
i0 250 0,899
11 260 1.079
12 270 1.363
13 280 1.,:'o0
14 290 2.250
DELK(MPa-M)
0.000
0 069
0 132
0 163
0 190
0 218
0 241
0 286
0.323
0,355
0.415
0.495
0.610
0.766
0.988
0.00
4.48
6.00
6.61
7.06
7.52
7.87
8.51
8.99
9.39
10.08
10.90
11.99
13.29
15.02
276
DADN(mn,/CYCLE)
0,000 XI.E-6
2,467 XI.E-6
2.575 XI.E-6
i. I00 Xl.E-6
4,100 XI.E-_
1,600 Xl.E-6
3.000 Xl.E-6
6.000 XI.E-6
1.350 X1.E-6
5.200 XI.E-6
6.800 XI.E-6
9.000 XI.E-6
14.200 XI.E-6
16,850 XI.E-6
27.500 XI.E-6
_* DAiDN DAfA _*
SPECIMEN" NO, = A-55-O8,L2
NO. OF UAFA - 8
R ....i • O0
SMAX::: 70.0 MFa
E,)rt_Z_[.fr, "ilYL;L__(X1000;, CRK L. 2a(m.,) AVG. _(n,., DELK < MF _-t_ )
0 180 0.098 0,000 0.00
l 190 0,136 0.058 4.13
2 200 0,158 0,073 4.59
3 210 O.Z07 0,091 5.07
4 220 0.218 0,106 5.44
5 Z30 0.288 0.126 5.88
o 240 O.J05 0,148 6.32
7 250 0.349 0.163 6.61
DADN ( ran,/l C 'rCLE >
0 000 X1.E-6
1 900 X1.E-6
1 100 X1.E-6
2 450 X1.E- 6
0.550 XI,E-6
3.500 X1.E-6
0 850 XI.E-6
2.200 XI.E-6

277
o_
ql_ ii ii
I 4, 0I I I
n-+ o
I1111 I I I I11111 L I I IIIIIII I I IIIIII I I I IIIIII I I I nllll i I I
"o ,% % - " ='o 'o 'o
-o
G
0o
(':r'I::)A,:)IHH) NO/YO

278
gTCK
!#n,-
w
tr_ ..J
EQ÷3QQQ'E EQ÷_}QQ'! Eg+_OgD'[- EO+3OQQ'E-
$0Nfl0_-Ol:101
ID
4.
IDIO
!
4.
I

_AI.; PAGE IS
_t_ POOR QU ,,I,ITY
A-55-08
F ¸
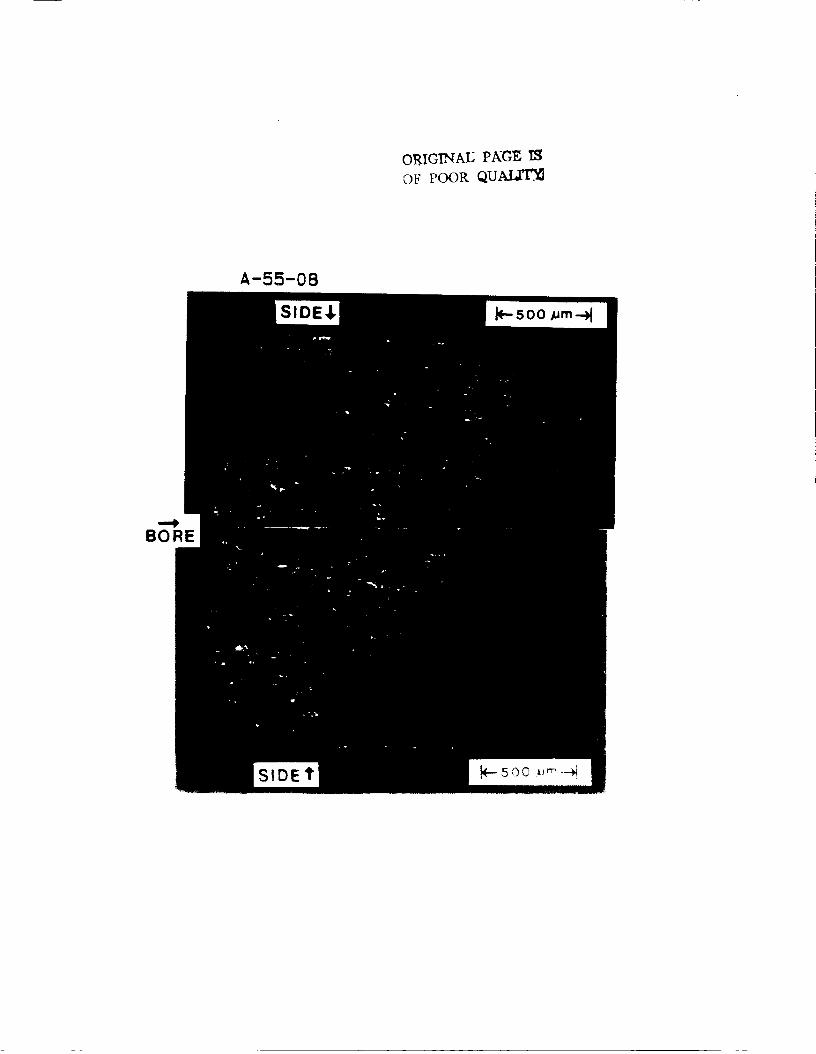
ORIGINAl; PKGE
OF POOR QUAI_
A-55-08
BORE

281
TEST DATA
SPECIMEN NUMBER:
DATE: 6/_ /_
PARTICIPANT' S NAME :
TEST TEMPERATURE:
RELATIVE HUMIDITY:
A -_ -23
Joo-Jin Lee
John Cieslowski
41"I.
WAVEFORM TYPE:
LOADING SEQUENCE TYPE:
Sinusoidal wave, 20 Hz
Constant amplitude
R-RATIO = - _ .0
S max = -7 ° M_
s min -- --70 MP_
FINAL LENGTH OF CRACK:
COMMENTS:
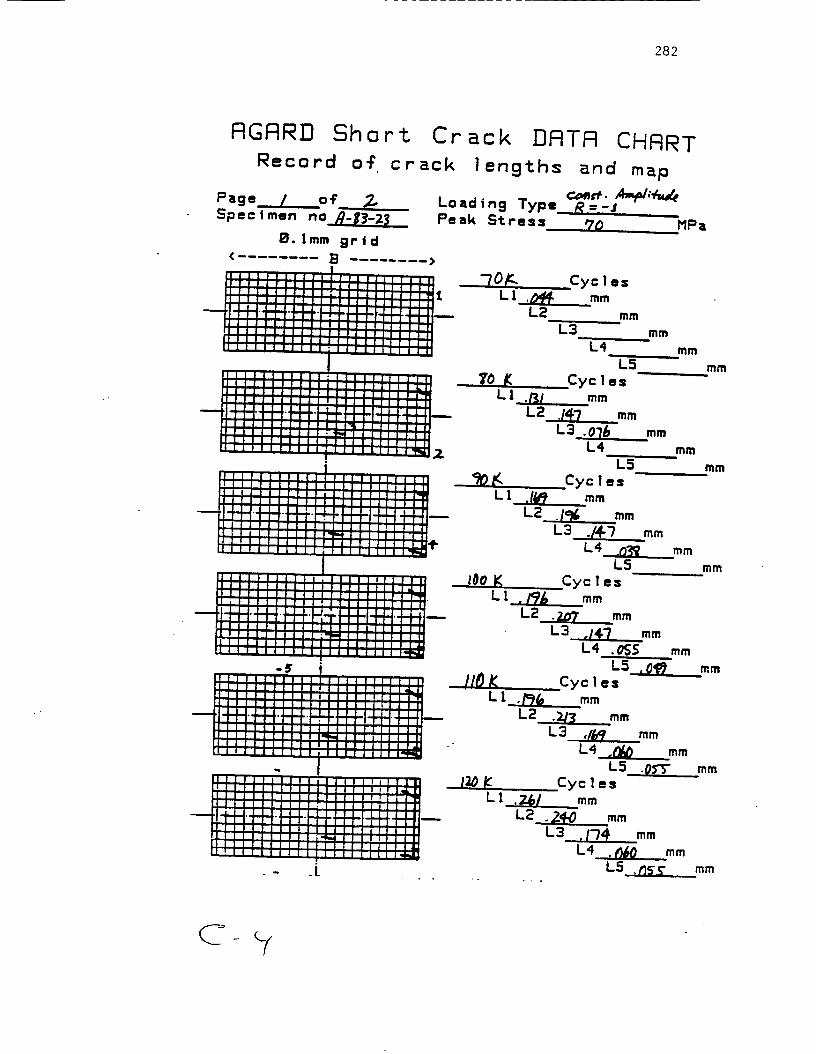
282
RGRR]3 Short. Crack DRTFi CHRRT
Record of cr ack I engths Bnd map
c_. _;_Page / of ,Z. Loading Type R_=__",/ .Specimen no ,q-13-2_ Peak Stress . 90 MPa
0. tmm grid¢ ]3 ........ >
.._o_.Lt .a'/_
L2
_KL 1 .R/
L2
_oKLt .I_
L2
I[I I I IIpllalIti;llI1=111
itllll11111IIIII
.11 I I I I
IIIIII111111I I.H-+-Fllllll
IIIIIII!111!
Z
, _OoKLt ./_6
LE
IR) KL ! .15(o
L2
_L
_ I I I I I I '11, i , i , ,l I '1/,1
,,,,'"'II_,;',;?,H-H-I I I I I i tl -I I I I I [I I I I II
'_!1 I |1 |1,, I ,1i I I I _la.I! I i I I I I i i_i,_d,.i
Cy: 1esmm
mmL3 mm
L4 mm
L5 mm
Eye 1 • smm
.14"/ mm
L3 ,.0]6 mmL4 mm
L5 mm
Cyc I esmm
,1'96 mmL3 .[4-'7 mm
L4 .0_ mmL5 mm
Cyc 1esmm
.ZO'/ mmL3 ./4"/ ram
L4 ,0S$ mm
L5 , O'F) mm
Cyclesmm
._ mmL3 ,//_/ mm
L4._ mm
L5 .Q_"Y" mm
Cyc Ie s.;7-6/ mmL2 .Z¢.O mm
L3 ./-/4 mm
L4 .f)60 mm
L5 ,115_" mm

283
RGRRD
RecordShe rt Cr eck DRTR CHRRT
I_=f I ! I I i i t | iIt 11 I I I I Itlll|llllllflllIkl|l_llllll
IIIIIIIIIiilII !I,,:: ,ollWl I I I I I Iii
if I II IIIIII11_I I if| I It!l _i_IWilliIKlJ
i' If I I II I [TJtlli I I If I i|]_
f f I| | till FM|l Ilil_li |liI I II I Illl IllIIII 11|11111
90 MP a
LI
L2
Ll
L2
LI
L2
mmmm
L3 mm
L4 mm
L5 mm
.Cyclesmm
mmL3 mm
L4 mm
L5 mm
Cyc Ies
mm
mm
L3 mm' ""L4 mm
L5 mm
Cyc I esmm
mm
L3 mm
L4 mm
L5 mm
of crack lengths and map
c_,_..w_,_#_,,/¢Loading Type R--,.- fPeak Stress:
Page _ ofSpecimen no _'_3
B. Imm grid<........ B ........ >

** DA/DN DATA **
SPECIMEN' NO. = A-83-23.L1
NO. OF DATA = 7
R=-I.00
SMAX= 70.0 MF'a
Cor._ C_ck
CYCLE(XIO00) CRK L. 2_(mm) AVG. a(mm) DELK(MPa-M)
284
DADN(mm/CYCLE)
0 70 0.044 0.000 0.00
i 80 0.131 0.087 4.91
2 90 0.169 0.150 6.30
3 100 0.196 0.183 6.89
4 120 0.261 0.228 7.62
5 130 0.278 0.269 8.20
6 140 0.382 0.330 8.97
0.000 X1.E-6
8.700 X1.E-6
3.800 XI.E-6
2.700 XI.E-6
3.250 X1.E-6
1.700 XI.E-6
10.400 XI.E-6
** DA/DN DATA **
SPECIMEN" NO. = A-B3-23.L2
NO. OF DATA = 6
R=--I.O0
SMAX= 70.0 MPa
CQtN_ C_ck
CYCLE(XIO00) CRK L. 2a(mm) AVG. a(mm) DELK(MF a-M)
0 80 0.147 0.000 0.00
1 90 0.196 0.171 6.70
2 100 0.207 0.201 7.20
3 110 0.213 0.210 7.34
4 120 0.240 0.227 7.59
5 140 0.267 0.253 7.98
DADN(mm/CYCLE)
0.000 XI.E-6
4.900 X1.E-6
1.100 X1.E-6
0.600 XI.E-6
2.700 XI.E-6
1.350 X1.E-6
** DA/DN DATA **
SPECIMEN' NO. = A-B3-23.L3
NO. OF DATA = 6
R=-I.00
SMAX= 70.0 MFa
CYCLE(XIO00) CRK L. 2a(mm AVS. a(mm) DELK(MF a-M) DADN(mm/CYCLE)
0 80 0.076 0.000 0.00
1 90 0.147 0.056 4.04
2 110 0.169 0.079 4.75
3 120 0.174 0.086 4.93
4 130 0.213 0.097 5.21
5 140 0.229 0.111 5.53
0.000 XI.E-6
3.550 XI.E-6
0.550 XI.E°6
0.250 X1.E-6
1.950 XI.E-6
0.800 XI.E-6

285
0
IIIIII I I IIIIIll I I Ilillll I I IIIIIII1 I IlUlII I | IIIIIII I 1
'o 'o 'o
(37_),A,O/MH) NO/VO

286
fie
\
R w
i i
£g÷_gg "£ Eg+31;Igg" ! £g+_lgg" l- Eg+3ggg "£-
soNnoa-oUO1
IDID÷
ILl0ID0
0I
I,l.I000
u_
u't
0!
I.l.I000
u_!
0ID÷
00
!

0RIGIN'A/] PAGE
OF POOR QUALITY
A-B3-23
BOR!

288
TEST DATA
SPECIMEN NUMBER:
DATE: 7/ IZ / _'_
PARTICIPANT' S NAME :
TEST TEMPERATURE:
RELATIVE HUMIDITY:
Joo-Jin Lee
John Cieslowski
_7'c
WAVEFORM TYPE:
LOADING SEQUENCE TYPE:
Sinusoidal wave, 20 Hz
Constant amplitude
R-RATIO = -- 2.0
s max= _._HP_
S rain = -" l Fb H P_
FINAL LENGT_ OF CRACK:
COMMENTS:
LI

289
FtGFtRD Short Cr ack I]RTR CHRRT
Record of crack lengths and map
Page I of _. Load!rig Type -_,-.z ,Specimen no _.__._.._L_ Peak Stress "7%- ' MPa
e. lmm grid
<........ B ........ >
__ _K CyclesLI ,ITO mm
_ @K Cycle+
LI_ .21o7 mmL2 ,0_7 mm
L2 .__..02=7._mmL3 mm
L'; mmL5 mm
LI .4-1'9 mm
L2 • OZ7 mmL3_ . 0"7_ mm
L4_mmL5 ,0_3 mm
_'_ Cycles -L ! .bO_ mm
L2_mm
L3_mmL4 ...._mm
L5 .t)_._ mm1_ K- _Cyc tas
L 1__.-/qA mm
L2 .L)S'¢" mm
L3 _Z?3- mm
L4 .ll t mmL5 ._Q mm
17..K . CyclesL 1 I,Z37 mm
L2,0_-,T mmL3 .316 mm
L4 .10'_ mmL5 ./)_h mm
..
L3 ....._mm
L4 ,027 mm
LS._mmCyc lms
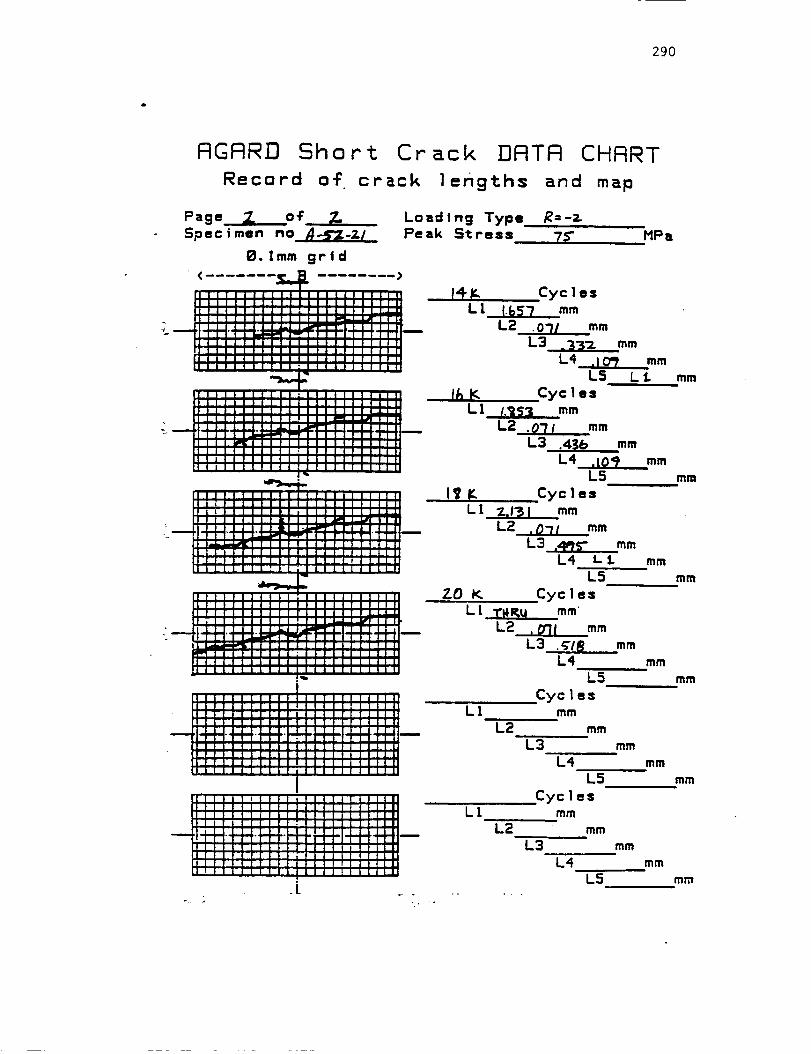
290
RGRRD Sho r t Cr ack DFITR CHRRT
Record o{ crack lengths end m_10
Page Z o_Specimen no A-S'_-ZI
B.%mm grid
Loading Type R=-ZPeak Stres: 7_ MPa
-)
r_F- CyclesL 1 I._5"? mm
L2 .o'/I mmL3 __J3"z mm
L4 .I O_ mmL5 L 1. mm
Ik K Cyc I esLI l._53 mm
L2 .071 mm
L3 .43b mmL4 .I09 mm
L5 mm
I_ IC CyclesLI Z.ISI mm
L2 .0-;/ mm
L3 ,4_ mmL4 L i mm
L5 mm
ZO K Cyc I esL I T_W,_ mm
L2 , O"/I mm
L3 ._1_ mmL4 mm
L5 mm
Cyc I esLI mm
L2
LI
L2
L3L4
L5
Cyclesmm
L3
L4
mm
mm
mm
mm
L5
mm
mm
mm
mmi
--- _ . . ....
o ,

291
0
i
2
3
4
5
6
7
8
SZ DA/DN DATA ZZ
SPECIMEN" NO. = A-52-21.L1
NO. OF DATA = 10R=-2.00
SMAX= 75.0 MPa
CYCLE(XIO00) CRK L. 2a(mm) AVG.
2 0.180 0.000
4 0.267 0.112
6 0.419 0.171
8 0.605 0.256
i0 0.796 0.350
12 1.237_co,,_ 0.508
14 1.657 0.724
16 1.853 0.877
18 2.131 0.996
a(mm) DELK(MPa-M)
0.00
8.94
10.85
13.00
14.99
17.73
20.81
22.79
24.24
DADN(mm/CYCLE)
0.000 X1.E-6
21.750 X1.E-6
38.000 X1.E-6
46.500 X1.E-6
47.750 X1.E-6
110.250 X1.E-6
105.000 X1.E-6
49.000 X1.E-6
69.500 X1.E-6
ZZ DA/DN DATA Z*
SFECIMEN' NO. = A-52-21.L3
NO. OF DATA = 8R=-2.00SMAX= 75.0 MPa
_r_ cr_f,,kCYCLE(XIO00) CRK L. 2a(mm) AVG. a(mm) DELK(MPa-M) DADN(mm/CYCLE)
0 4 0.033 0.000 0.00 0.000 XI.E-6
i 6 0.076 0.027 4.62 10.750 X1.E-6
2 i0 0.283 0.090 8.09 25.875 X1.E-6
3 12 0.316 0.150 10.21 8.250 X1.E-6
4 14 0.332 0.162 10.57 4.000 XI.E-6
5 16 0.436 0.192 11.42 26.000 X1.E-6
6 18 0.495 0.233 12.45 14.750 XI.E-6
7 20 0._18 0.253 12.94 5.750 Xi.E-6

292
I
I
N -IJ¥i_
I1111 I I 1 IIIIII I I I
'o 'o
\
- 0
a
m
i
iD
0
UlIII I I I IIIIII I I I. IIIIII I I I IIIIII I I I , t__ qm,
lr ii) @% 'o ,o .o ,_
[3"I:3J,:3/NHl NO/VII

293
(-_I
("4LZ)I.
\
ellrl
!'_ _"U ,1"
I I I1U '--" .-o
0I: _ ..I
II
EO÷3OOO'E EO+3000"I EO+3000"I- EO+3OOO'E-
SONnOJ-OU07
1,1"1Z
LJ
=,P
u
..JU=) a.
hml
vm I
I
I
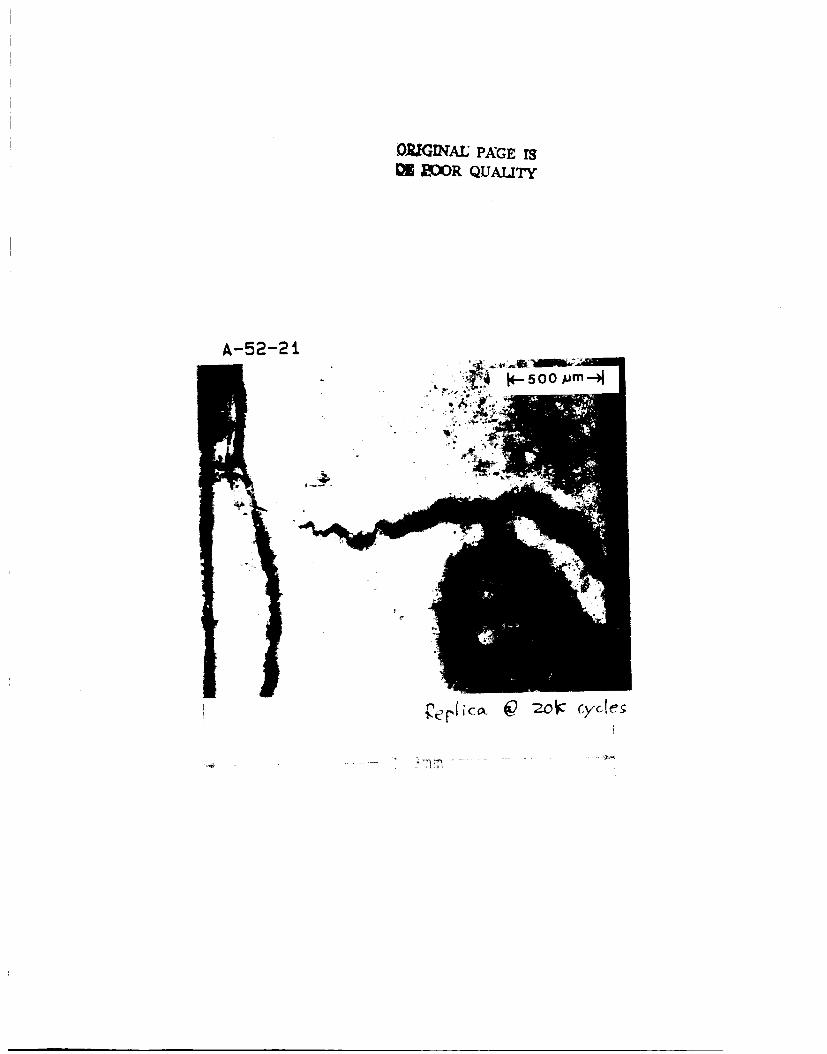
D_INAE PAGEIX 2OOR QIJALITY
A-52-21
_e¢t;c_ _. _obc cy,des

ORIGINAE PA-GE I$
OF POOR QUALITy
T2-2_-V

296
%
SIDE,I,
SIDEr
BORE
Tracing of Crack Front for A-52-2i

297
TEST DATA
SPECIMEN NUMBER:
DATE: "7/1| /(_"
PARTICIPANT' S NAME :
P,- - 74. -=.o
TEST TEMPERATURE :
RELATIVE HUMIDITY :
WAVEFORM TYPE: Sinusoidal wave,
LOADING SEQUENCE TYPE:
R-RATZO= -Z
S max = 7_ MPe.
s rain = --__-0M?¢*
FINAL LENGTH OF CRACK:
COMMENTS •
• N_y
_sO_
• _ pko+o
Joo-Jin Lee
John Cieslowski
Z7"c
_4 _.
20 Hz
Constant amplitude
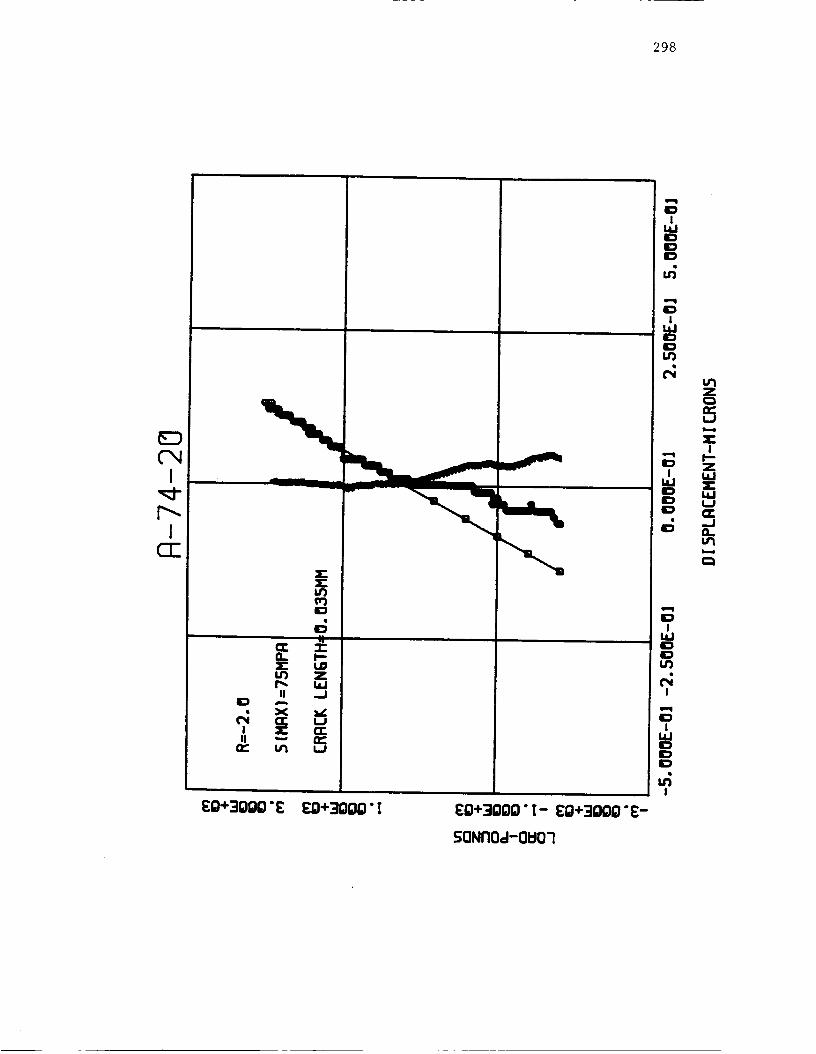
298
t'-I
CEE
Ln_-)O
¢l: "r"
T- LOLO 7
U .JO
II "-- _#"
EQ+309Q'E EQ+3QQ='I Eg+3ggg'[- Eg+3ggg'E-
SgNn0a-0u0_
IO!
I.UIOIOO
u-;
,e,-,i
O!
I,iJIDOU3
u'tZ
I.J
!
ZlaJ
==, ,,-,I=J= =:
,..JIO ¢L
u'l
t_
,l==l
O!
t.lJOOU3
!
,e,=,l
OI
LdOIOIO
!
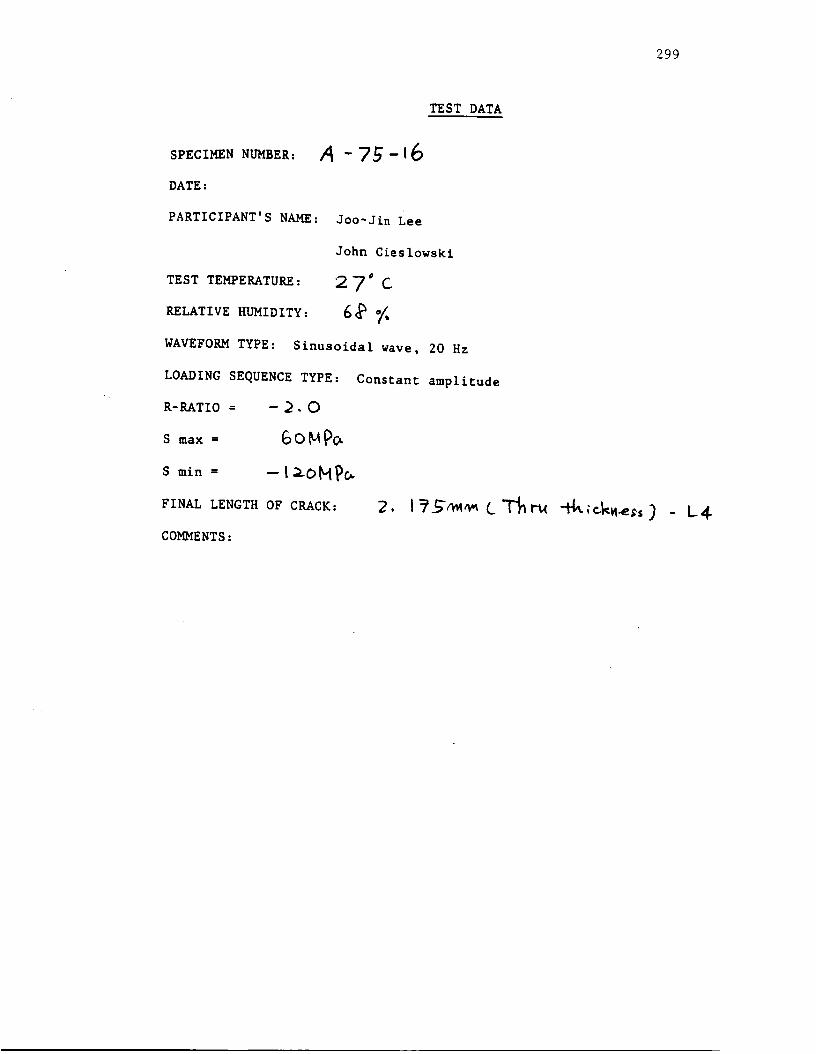
299
SPECIMEN NUMBER:
DATE:
PARTICIPANT'S NAME:
A -7 -t6
-2.0
Joo-Jin Lee
John Cieslowski
TEST DATA
TEST TEMPERATURE: 27' c
RELATIVE HUMIDITY: 6_ o/,
WAVEFORM TYPE: Sinusoidal wave,
LOADING SEQUENCE TYPE:
R-RATIO =
S max =
S min =
FINAL LENGTH OF CRACK:
20 Hz
Constant amplitude
COMMENTS:

300
RGRRD Sho r t
Record of crack lengthm
Page [ o_ _ Loading TypeSpecimen no _-_-16 Peak Stress_
O. Iaa grid
< B ........ >
Cr ack DRTR CHRRT
and map
.F=-2
_;0 MPa
I_-)_L!
Cycles
.OT/ amL2 .0# aa
L3
L4
L5ZQ _ Cycles
Ll_am
L2 .O_
L3
L4
am
L5
_ Z_"_ Cycles
L 1 ,0_"/ mm
L2 L I am
L3 .0_ 7L4
L530_ Cycle=
L t .__l._._]___a aL2
L3 ,(0_-L4
3_ Cycles
Lt_aaL2 am
L3
Illiliilllli'tlill| lllH '_It I I I I I I I I I_,L | I I Ig -III I I I t I I III Lllllg LIIll I I I I I I ) I I : | I I1 It_|llN
tll lllltllllll Itlliil|III I I _ I I I I 1 t i t I I i 1 I _ I i I I|[I I 1 t I I I I I I ; L 1 I I !1
U_ III I III I I !1 I II ltl_IIII
ma
am
am
ma
am
ma
mm
mm
.0_'_ ma
L5 .oz7
.lO_ am
L4_ma
L5 ,O_Cycles
,IS"_ mm
L2 am
L3",147 am
L4 ,_ ma
L5 j_O• . .
am
am
am
am
ma
ma

301
RGFIRD Sho r t Crack DFITR CHFtRT
Record of crack lengths and map
•## _.t c_r to m_s.rc.

302
RGRR]3 Sho r t Cr ack FIRTFI CHRRT
Record o_ crack 1,engths end m_p
Page B of _-
Spec |men no A-'7_'-/6
8. lmm grid
< B
.[
Load!ng TypePeak Stress:
I_.= --2,
6_) MPa
.ow )
_ Cycles
LI ._ mmL2 mm
L3 ._ I mm
L4_mmL5 .9_
_rO_ Cycles
L1,_k_mmL2 mm
mm
L3.,_¢ mm
L4 ._C&7 mmL5 . mm
_2_'qC. Cyc Ies
L 1 ._-7._ mmL2 mm
L3 ."/r_ mm
L4 i.0/9 mmL5 ._¢S mm
90_ Cyc I esLI ,431 mm
L2 mm
L3 ,-;7_r mmL4 1,0[9 mm
L5 ,_50 mm
_'_ Cycles
I l ,4&'I_ mm
L2
mm
mm
L3 ._16 mm
L41_"_mm
L5 [,019
tOO k Cycles
LI ,_q9 mm
L2 mm
L3 .9";'_ mm
L4 i.O_
mm
LS__mm
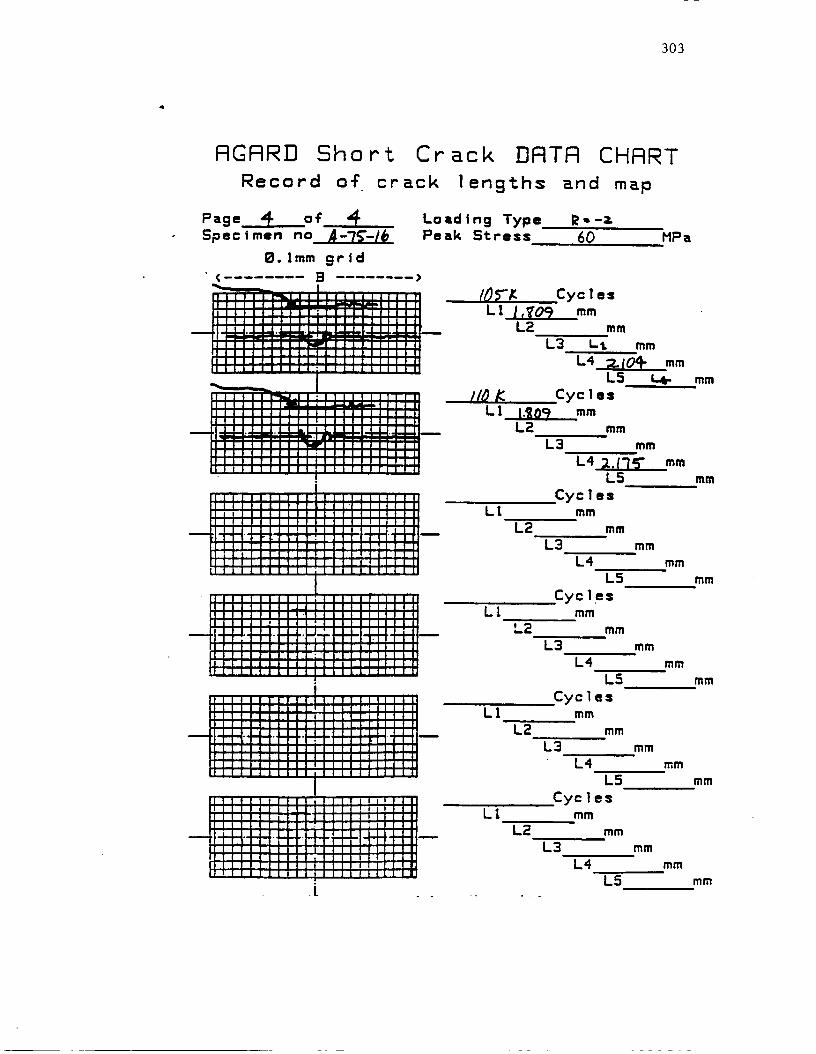
303
RGRRD Short Crack
Record o_ crack length=
Page _- of" _ Load tn@ TypeSpecimen no -_j_..__ Peak Stress_
I[ lilt
IIII III I i I IiH;Illllll| I
--41-H-I.4-H.H-I-.JUI I I I I III II
II I IIIIUI I I I I I I I I I
B. lmm grid
<........ B ........ >
FIRTR CHRRT
_nd map
J I L I I II I I II I l I II I I i Il
I F7 F.I (
| t !
l I I f PI I i l I F
,I III Iltll II]L I I I | I I fl t I IFI
I I I I I I I I I i]1]
I IIIl|lll IIi
+ hq4+-Hl--I III IIIII IN
I III IIIII II__ III IIIII IIII I I I I I I I i I II
60 HPa
_ Cycle:LI I,_05 mm
L2 mm
L3 Li mm
L4o.__=L_mmL5 I-4,. mm
/_ _ CyclesLI 1._0_ mm
L2 mm
L3 mm
L4 _.l_ mm
L5 mm
CyclezEl mm
L2 mm
L3 mm
L4 mm
L5 mm
CyclesLI mm
L2 mm
L3 mmL4 mm
L5 mm
CyclesLI mm
L2 mm
L3 mm
'"'L4 mm
L5 mm
CyclesLI mm
L2 mm
L3 mm
....L4 mm
L5 mm
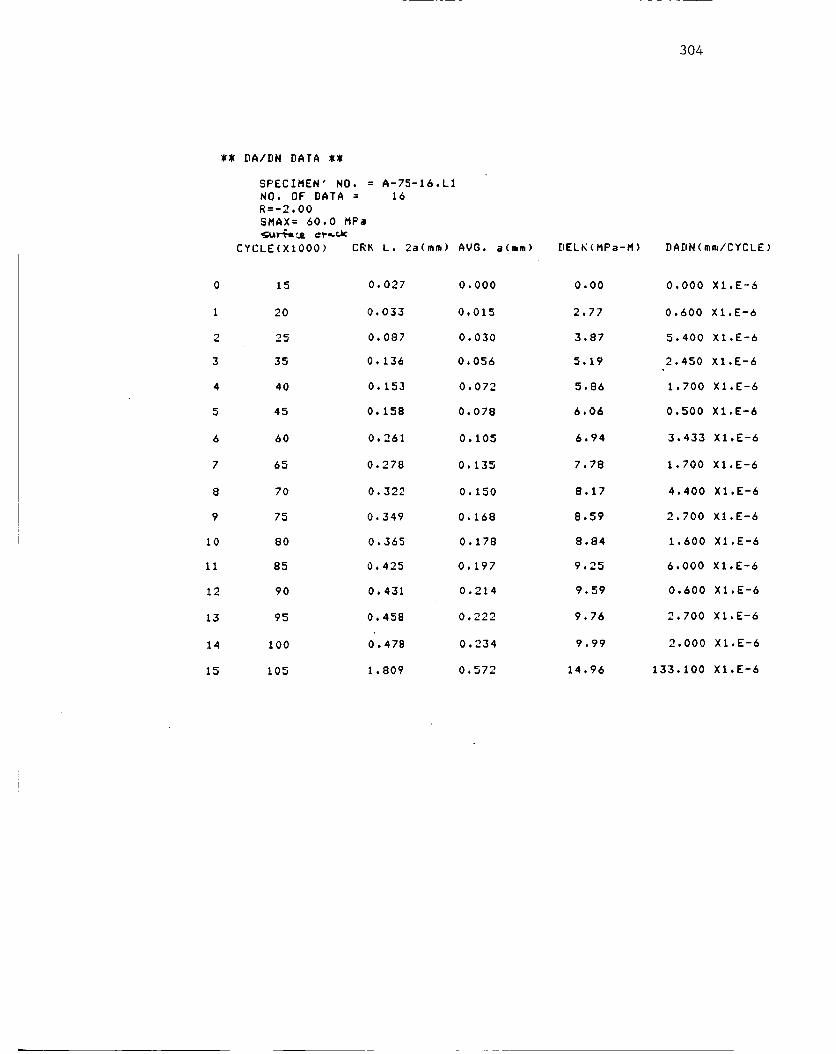
304
0
1
2
3
4
5
6
7
8
9
I0
II
12
13
14
15
_Z DA/DN DATA ZZ
SPECIMEN' NO. =
NO. OF DATA =R=-2.00
SMAX= 60.0 MPa
CYCLE(XIO00) CRK
A-75-16.L116
L. 2a(mm)
15
20
25
35
40
45
60
65
70
75
80
85
90
95
100
105
0.027
0.033
0.087
0.136
0.153
0.158
0.261
0.278
0.322
0.349
0.365
0.425
0.431
0.458
0.478
1.809
AVG. a(mm)
0.000
0.015
0.030
0.056
0.072
0.078
0.105
0.135
0.150
0.168
0.178
0.197
0.214
0.222
0.234
0.572
DELK(MPa-M)
0.00
2.77
3.87
5.19
5.86
6.06
6.94
7.78
8.17
0.59
8.84
9.25
9.59
9.76
9.99
14.96
DADN(mm/CYCLE)
0.000 X1.E-6
0.600 X1.E-6
5.400 X1.E-6
2.450 X1.E-6
1.700 XI.E-6
0.500 X1.E-6
3.433 X1.E-6
1.700 X1.E-6
4.400 XI.E-6
2.700 X1.E-6
1.600 X1.E-6
6.000 X1.E-6
0.600 X1.E-6
2.700 X1.E-6
2.000 X1.E-6
133.100 X1.E-6

305
0
1
2
3
4
5
6
7
8
9
I0
II
12
13
14
15
_Z DA/DN DATA _Z
SPECIMEN" NO. = A-75-16.L3NO. OF DATA = 16R=-2.00SMAX= 60.0 MF'a
CYCLE(XIO00) CRK L. 2a(mm) AVG. a(mm) DELK(MPa-M)
25 0.087 0.000 0,00
30 0.104 0.095 6.58
35 0.109 0.106 6.92
40 0.147 0.128 7.53
45 0.191 0.169 8.55
50 0.251 0.221 9.65
55 0.305 0.278 10.69
60 0.371 0.338 11.66
65 0.458 0.414 12.76
70 0.491 0.475 13.54
75 0.561 0.526 14.17
80 0.676 0.618 15.22
85 0.719 0.697 16.05
90 0.774 0.747 16.53
95 0.916 0.845 17.45
100 0.953 0.934 18.23
DADN(mm/CYCLE)
0.000 X1.E-6
3.400 X1.E-6
1.000 XI.E-6
7.600 X1.E-6
8.800 X1.E-6
12.000 X1.E-6
10.800 XI.E-6
13.200 X1.E-6
17.400 XI.E-6
6.600 X1.E-6
14.000 X1.E-6
23.000 XI.E-6
8.600 X1.E-6
11.000 XI.E-6
28.400 X1.E-6
7.400 X1.E-6

306
0
1
2
3
4
5
6
7
8
9
i0
Ii
12
_I DA/DN DATA I_
SPECIMEN' NO. =
NO. OF DATA =R=-2.00
SMAX= 60.0 MPa
CYCLE(XlO00) CRK
A-75-16.L414
L. 2a(mm)
40
45
50
55
60
65
70
75
80
85
95
100
105
0.038
0.055
0.093
0.098
0.496
0.545
0.594
0.632
0.937
1.019
1.036
1.068
2.104
AVG. a(mm)
0.000
0.023
0.037
0.04B
0.148
0.260
0.285
0.306
0.392
0.489
0.514
0.526
0.793
DELK(MPa-M)
0.00
3.43
4.28
4.83
8.13
10.48
10.91
11.29
12.62
13.94
14.26
14.41
17.37
DADN(mm/CYCLE)
0.000 X1.E-6
1.700 X1.E-6
3.800 X1.E-6
0.500 X1.E-6
39.800 X1.E-6
4.9O0 X1.E-6
4.900 X1.E-6
3.800 X1.E-6
30.500 X1.E-6
8.200 X1.E-6
0.850 X1.E-6
3.200 XI,E-6
103.600 X1.E-6

307
llllli i I illlfl| I l |J|Jll ! I I I|illl I i J lillil I I | IIIIli I I 1
'o 'o 'o
i
,. v
I
0
o
o
(3"13A3/NH) NO/YC]

308
l|ill | I I llllil I | | |llill | I | II|III ( I I ||lllil I | llllll I I I
'_ _ ql' U') aD
'o 'o '_ 'o 'o 'o
(310,_O/NNINO/VO
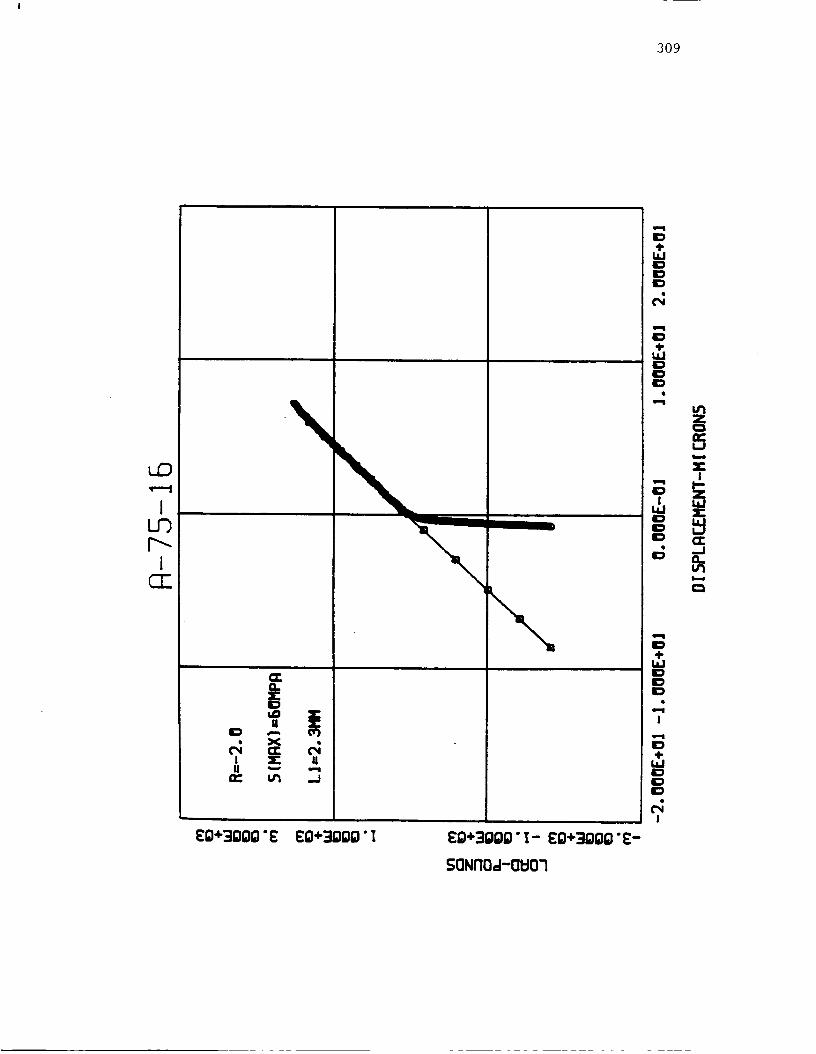
309
_D
JUDF'--J
CII
uD T-" E
lid ,.., t'_
I T- U
n.- U'I ..J
Eg+3ggg'E Eg+3ggg'l Eg+3ggg'[- Eg+3ggg'E-
50Nn0a-0U01
¢N
===,
ID4-
I,iJIDIDID
!
ID"l-
I,iJIDID
!

ORIGINAl] PAGE IS
OF. POOR QUAIXI'_
A-75-16

ORTGINAZj PAGE lJ
oP POoR QUALrI_
A-75-16
SIDE;
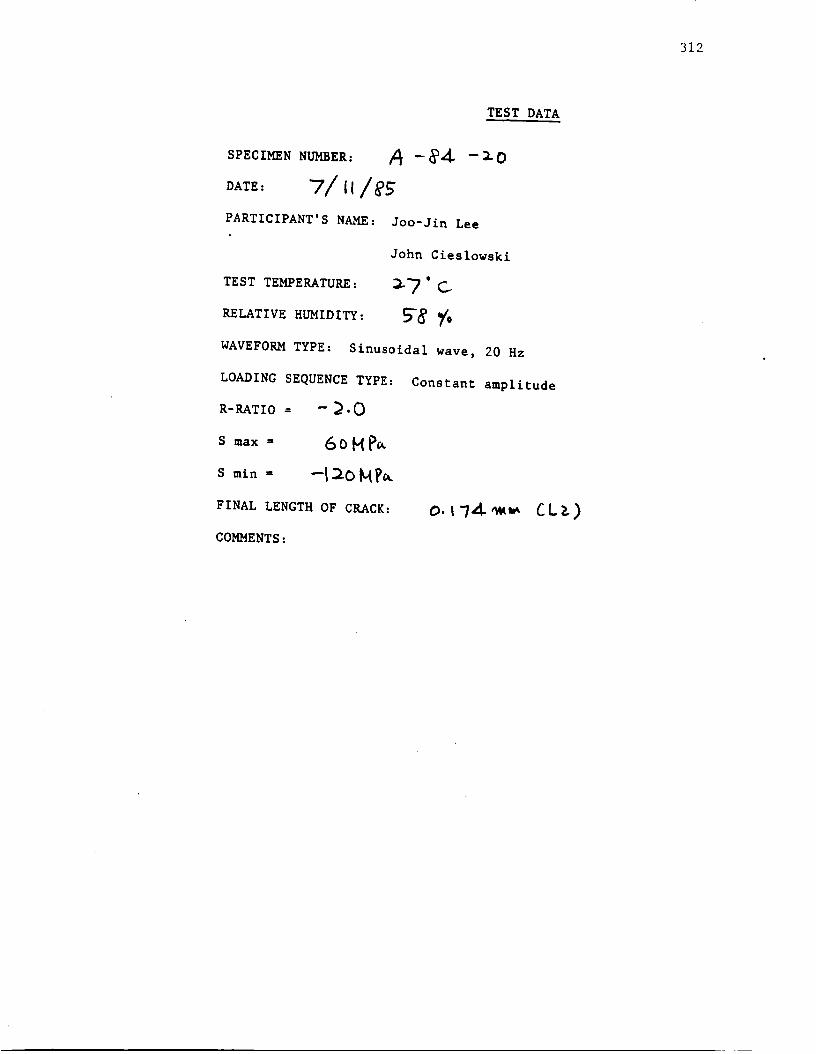
312
TEST DATA
sPzcz_,mmBZZ. A --8Zl.- _-0
_ATE, 7/tt/e_PARTICIPANT'S NAME: Joo-Jin Lee
R-RATIO :
S max :
S min =
TEST TEMPERATURE •
RELATIVE HUMIDITY:
WAVEFORM TYPE: Sinusoidal wave,
LOADING SEQUENCE TYPE:
-_.0
6oH_
-120 N P_
FINAL LENGTH OF CRACK:
John Cieslowski
_7" C
58 7',20 Hz
Constant amplitude
o,17_ CLz)
COMMENTS:

313
RGRRn
Record
Short
of
Page / of /-Spec t men no -__L_L_ -
8. lmm grid
(........ B
Cr ck
crack lengths
Loading TypePeak Stres=
_'l I I I I I I I I I II|1111111111[|LI I I I I III I[|[llllllll|II I I I I I I LLL1Ll_ t J J I']'-1-T'I illI III i I _111Itll I I ! I I I I IUIl IIII IIIILII I _ I I !11 I I :
'l Illllltll[1I illllllll III lilllltlt !1
I ! I it till I_]4 J i i I-l-l-l.J_l_[Ir ! I J i i J J t I]]--I i II! ilil I HI I I I I I /11 II]I I I I I I I I I 17]I I I I 1 111 11 _]
I I l"l I I I I"1 lTrlI l[I,llllll]I I |11 IIII I _
:11 I1 11 I!11 17
' ' I+H-H : lit ' --I I 1 I I I I1 I 1 llI Iit !1111 IllI I II I Illl I III ! I] l I I I i I II
DRTR CHRRT
Bnd m_p
LI
_J I t I I t I I I II11 I lit IIIIIttl I I I I I I I I 1_1 III I1 III I
----h,-kH,.4-H.f-k+.tIll I II I111Irl I I I ! I I _ IU I:11t1III1fl I II I I Ii ii
60 MPa
mmmm
mm
mm
L2 mm
L3 mm
' L4 mm
L5
CyclesLI mm
L2 mm
L3
L4
L5
mm
mm
mm
mm
mm
mm

314
ZZ DA/DN DATA ZZ
SPECIMEN' NO. = A8420.L1NO. OF DATA = 3
R=-2.00SMAX= 60.0 MPa
SURFACE CRACK
CYCLE(XIO00) CRK L. 2a(mm) AVG. a(mm) DELK(MPa-M)
0 15 0.016 0.000 0.00
1 20 0.022 0.009 2.21
2 30 0.027 0.012 2.51
DADN(mm/CYCLE)
0.000 X1.E-6
• 0.600 X1.E-6
0,250 XI.E-6
_Z DA/DN OATA _Z
SPECIMEN' NO. = A8420.L2
NO. OF DATA = 3R=-2.00
SMAX= 60.0 MPa
CORNER CRACK
CYCLE(XIO00> CRK L. 2a(mm) AVG. a(mm) DELK(MPa-M)
0 20 0.093 0,000 0.00
1 25 0.131 0.112 7.0B
2 30 0,174 0,153 8.16
DADN(mm/CYCLE)
0.000 XI.E-6
7,600 X1,E-6
8,600 XI.E-6
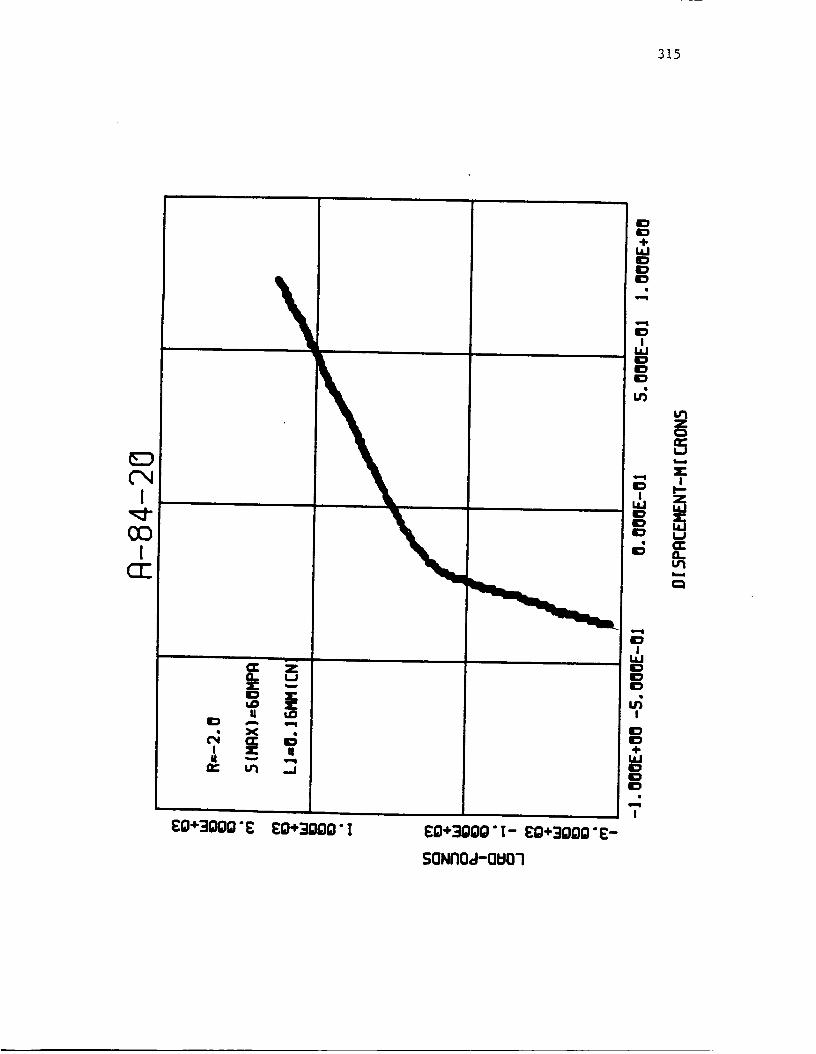
315
E4
U
q
Eg+3ggg" E Eg+3ggg" ! EI;I+3GDD" I- ED+_)DD'E-
$0NI'IOJ-OI:J0"!
=,=,Z,ID
U3
U'!
=z
,m,ml
IDI
I.iJIDIDID
,.,.;I
IDID,4-
14.1IDIC)IC)
!

ORIGINAE PAGE IS
OF POOR QUALITY
A-84-20

A-84-20
ORIGINAl, PAGE IS
OE POOR QUALFr_
SIDE,I,
SIDE,I,
CRACK FRONT--J_
Tracing of Crack Front for A-84-20

318
TEST DATA
SPECIMEN NUMBER: /_ -- _- [ i
DATE" 7/[_ I e_
PARTICIPANT'S NAME: Joo-Jfn Lee
John C£eslowski
TEST TEMPERATURE: _7 ° C
RELATIVE HUMIDITY: 6_ _o
WAVEFORM TYPE: Sinusofdal wave, 20 Hz
LOADING SEQUENCE TYPE: Constant amplitude
a-RATIO = - _. 0
S max = _ "D_)_
S rain = --%00H_
FINAL LENGTH OF CRACK:
COMMENTS:
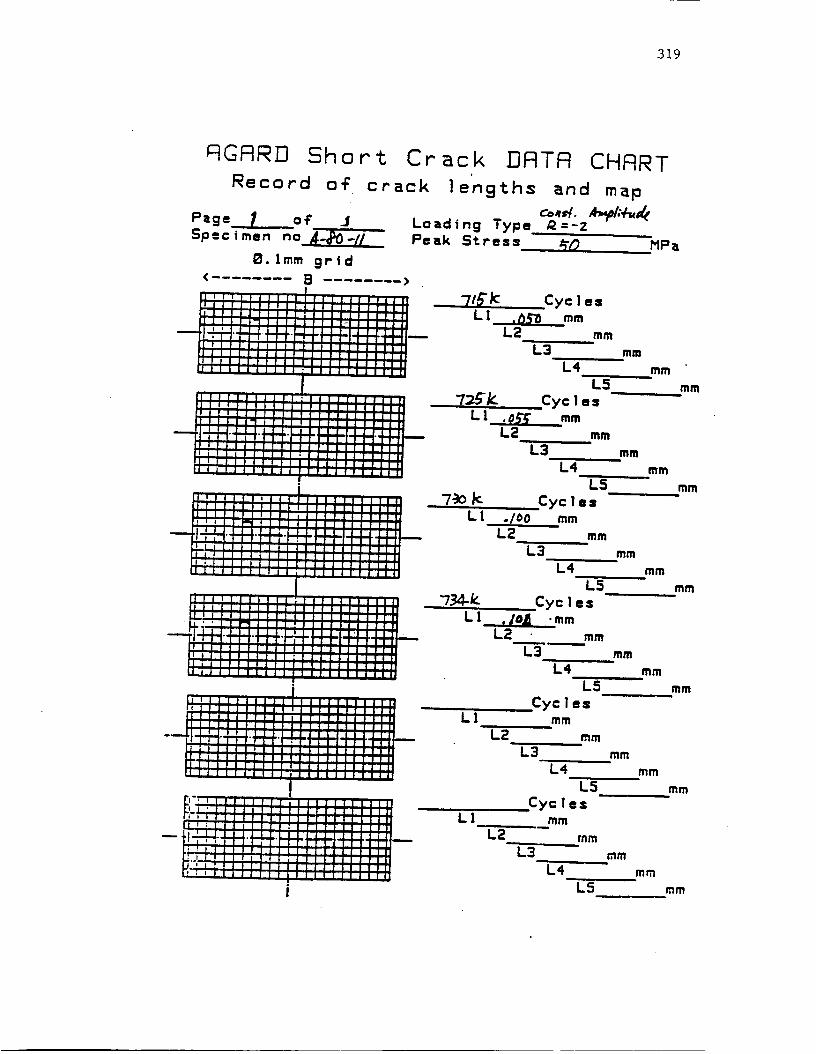
319
ctGFIRD Short Crack FIFITR CHFIRT
Record of crack lengths and map
_/. m.?l;+.4Page _ of J Loading Type _:-Z
Specimen no_4.yPO-[[ Peak Stress #t? MPa
B. Imm grid
< ........ B ........ >
7/_"J( Cyc ! e=L l___mm
L2 mm
L3
L4
L5
7:EIC Cyc ] m s '"L I .O£g mm
L2 mm
L3
L4
L5
7")0k Cyc ! • sL1
"7.._4..k.
mm
LI
LI
L2
mm
mm
mm
mm
mm
mm
mm
mm
L5 mm
./o0 mm
L2 mm
L3 mm
L4 mm
L5 mm
Cycles
,/O_ -mm
L2 mm
_'----- mm
L4 mm
L5 mm
Cyclesmm
mm
L3 mm
L4 mm
L5 mm
Cyc l msLI mm
L2
L3
L4

320
_ DA/DN DATA ZZ
SPECIM[N" NO. = ASOII.L%NO. OF DATA = 4R=-2.00SMAX= 50.0 MPa
SURFACE CRACK
CYCLE(XIO00) CRK L. 2a(mm) AVG. a(mm) I'tEL K (MF'a-M ) DADN(mm/CYCLE)
0 715 0.050 0.000 0.00 0.000 XI.E-6
1 725 0.055 0.026 3.03 0.250 X1.E-6
2 730 0.I00 0.039 3.65 4.500 X1.E-6
3 734 0.101 0.050 4.12 0.125 X1.E-6

321
JEDCOI
¢£tl.EID
I E
n,- m
E.
IDI
ulOID
I
ID0+
ID
I
_O+3OOO'E EO+3DOO'! £g+3ggg'I- EO+3_D'E-
SQNnQ_-QUQ7

I_T_G_NI_L PAGE I_
•i:
¼

A-80-t1
OR]C_,{AE P.KGE IS
OF POOR QUALITY
CRACK
Tracing of Crack Front for A-80-11

324
TEST DATA
SPECI=NNUMBE_: _ --6_--O5
DATE: "7/16/eS
PARTICIPANT'S NAME: Joo-Jin Lee
TEST TEMPERATURE:
RELATIVE HUMIDITY:
John Cieslowski
=L6°C
67"1o
WAVEFORM TYPE:
LOADING SEQUENCE TYPE:
Sinusoidal wave, 20 Hz
Constant amplitude
R-RATIO -- --i. O
S _ax - 9-oHP_
s ,,in.' ---loo_p_
FINAL LENGTH OF CRACK:
COMMENTS:
o, _' _,_ _6ov_
L3
0.6_
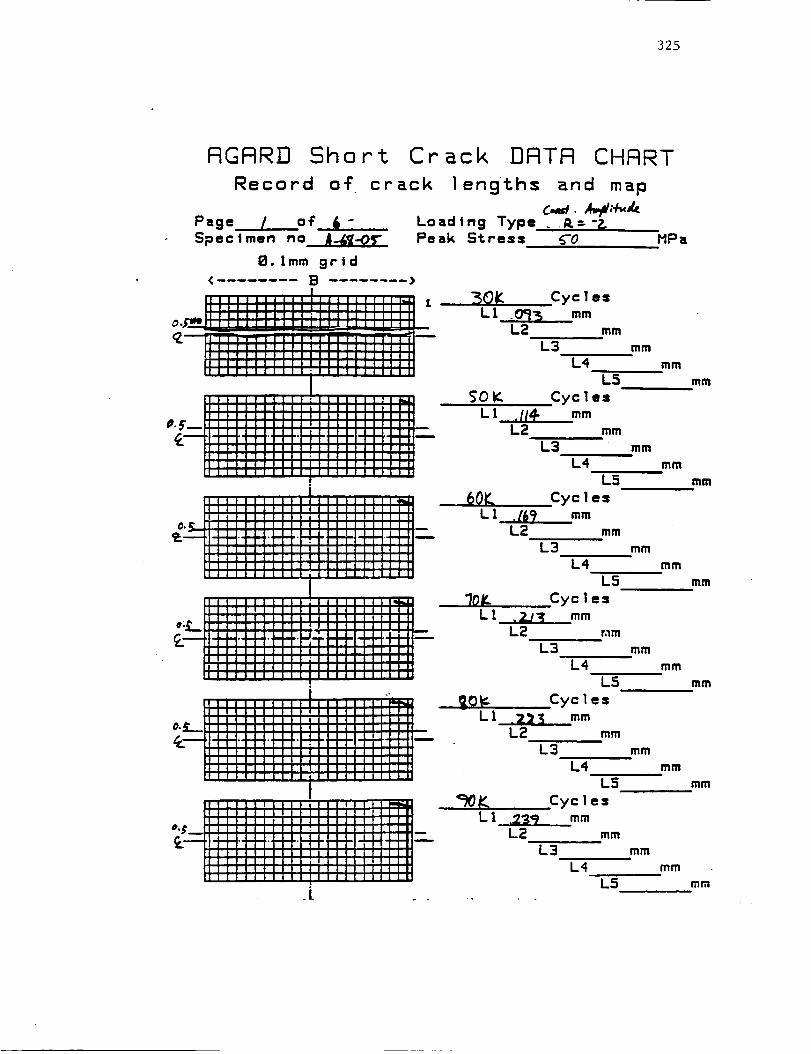
325
RGRR]3 Short Crack DRTR CHRRT
Record of cr_ck length= and map
Page / oT 6 - Loading Type, 0_/. i_#,_k
Specimen no_ Peak St.re== 5"0 HPaE}. lmm grid
¢ ........ B ........ >
.L
£ .'_01_ Cyc l e:L l_. _ mm
L2 mmL3
L4mm
mm
L5 mm
SOY. Cycles -L! .ll+ mm
L2 mm
L3 mm
L4 mm
L5 mm__ 601C eye!e: - -
L l .t67 mmL2 mm
L3 mm
L4 mm
L5 __ mm
"/0//. Cyc Ie=Ll_mm
L2 r,_mL3 mm
L4 mm
L5 mm
_Of- Cyc Ie=
L2 mm
L3 mm
L4 mm
L5 mmCyc Ie s
L l .23_ mmL2 _ mm
L3 - mmL4 mm
"L5 mm

326
Q
FIGFIRO Short Crack FIRTFI CHFIRT
Record o_ crack lengths and map
Page,, 2. of 6- Loading Type__ R._.TZ
Spectmen no A-(pT-O_" Peak Stre=s S-O MPaB. lmm grtd
< ........ B ........ >
.[
L5
/_-D F: Cyc Ies
LI .?_r5 mmL2 _ - mm
L3 ,____0__ mmL4
L5
mm
mm
mm
mm
mm
mm
mm
mm
mm

327
Short
_i
Page__.._ o{" _- Loading TypeSpecimen no -___ Peak Stress
8. Imm grtd
< ........ B ........ >
crack
Crack ]3RTR CHRRT
lengths and map
"n __
5"_ MPa
L3_mmL4 ,2.4-S" mm
L5 mm
of

328
RGRRD Sho r 1: Crack FIRTR CHRRT
Record of crack lengths and map
Page _ of /_ Loading Type P.--?--Specimen no A-_-05- Peak Stress _-0 MPa
8. lmm grid
<........ B
II I I I I I I I I I I
111111111111
It I III I I I I II
•"_._"__llIItiiiiiiiilII
--ll_.{'_il#--II-- I I I I I I I I I I
;--_| I I I I I I I I
II I_11 I I I I I I I
II I I I I I I I I I I
)
,7..,%0g. Cycle=,,,,,,,,,,. L! _e" mmi i_ # I I I i IIL, , L2 mmi,,,I-H-I'+Hi--I | J I I I I I II Il-
L3 "K'- mmI1_ III IIIIII
I I I I I I I I II II L4 _-i I I I II I IIIII
IIIllllllll illlll I
..llO _l,_ |11 II t I III | | III I I Jl I I I1_
t'm'W__lllllllll|llilll_lllll|_
lllillitllllll::llllillH----Oo_illlr-_4,,_ i i i i i i i i i i i i i i i i I i il
iiiiiii;1111111111|1
ii i_1 i i i i i I i i i i i i i i i i ii !1IIIIIIIIIIIl_llt|llllllll
mm
_( P-epl-'=l w*s _0_ ¢;Le_p
L5 mm
_30/C Cyc I e=LI ._/ mm
L2 mm
L3 .34.3 mmL4 . Z._'b mm
L5 mm
Z_-O/q Cyc I e=Lt ,_6_ mm
L2 mm
L3 .'3R _, mmL< . _2..I mm
L5 mm
2_0 K_ Cyc 1esL ! .h_r/ -mm
L :_ mm
L3 . _'/_. mmL4 .:J_? mm
L5 mm
7__OK CyclesL l .q_ mm
L2 mm
L3 -/M}O mmL4 ._ mm
L5 mm
2--70 t: Cyc 1 esL 1 ._2_ mm
L2 mmL3 _g5_ mm
L4 ,'f03 mmL5 mm

329
RGRRD Shor t Crack EIRTR CHRRT
Record o'F crack lengths and map
Page 5- oT _ Loading TypeSpecimen no A.-I[9.-05"- Peak Stress
8. [mm grid
< B ........ >
II I I | I I I I I I I
II Ilbl I I I I I I I III I I i I I I I I I I
_= -2.
_0 MPa
itttli,lll Il|il i t i |i I I I
_0._ it i i , i i i i i i I
lll]l]lh%_-{ _ftlltlll]ll_O._--II ; I I I I I w t I I I i I I I 1 I I I III
II _1 I ! I I I I I I I I I I I I I III1 1 I I I I I I I I I I I t I I II
mm
mm
L5 mm
_10 K Cyc 1 esL l /.//_, - mm
1"2 mm
L3 /. Z_"/ mm
L4 ".'=J'O_ mm
L5 mm
"_2..D K Cyc 1 es
LI /.ZZ/ mm
L2 mm
L3 ./.3_:Z mm
L4 .z_-O_ mm
L5 mm
_O_ Cyc I e s
LI L_%¢;- mm
L2 mm
L3 I._O3. mm
L4 .40_ mm
L5 mm

330
RGRRD Short Crack DRTR CHRRT
Record o{ crack lengths and map
II I 1 I I I It I I !
,iltltllil If
"_ F[''''''''J'IIIIIIIIII
II I I I I I I.t--H-F-o_--I_LL!!!!L!!!
;C;iiiiiili-i
t I I i i f
,,,,,"':::::ltlJlIII I I I I I I I I I
II I I I I I I.f-H-.l'lit
III, i, I, il il I, i | i |II
II I, Ii I ' I I
I f I I I I I Ili t!IIIIIJllllllI_l t 1 I I it_
÷::',:illlillllllllllllll--
_ ;" "t_ 7;-:--t_I I III i I lii ilIIIIIIIIIIII
r,II I III IIIIII
I I I I I I I II IIIIIIIlllltlllIIIIIIIIIIIIlilt,,,,11111111Ii IIII IIIIIII I I I ; I t licit
11111111111II111111111
LI
L1
LI
L1
LI
MPa
Cyc I es
I.'Z?4-- mmL2 mm
L3 t _'/_, mm
L4 _- mmL5 mm
Cyc 1 es
I. _'_'0 mmL :_ mm
L3___.__Q_ mm
L4 .-_"/I mmL5 mm
Cyc 1 es
I. _)9 mm
L2 mm
L3 _-_-0 mm
L4 .'_'/I mmL5 mm
Cyc I • s
./. _;t; -mmL2 mm
L3 "rk v_ mm
L4 ._r36 mmL5 mm
Cyc Ies
mm
L:_ mm
L3 mm
L4
L2
L3
L5
Cycles
mm
mm
mm
L4
L5
mm
mm
mm
mm
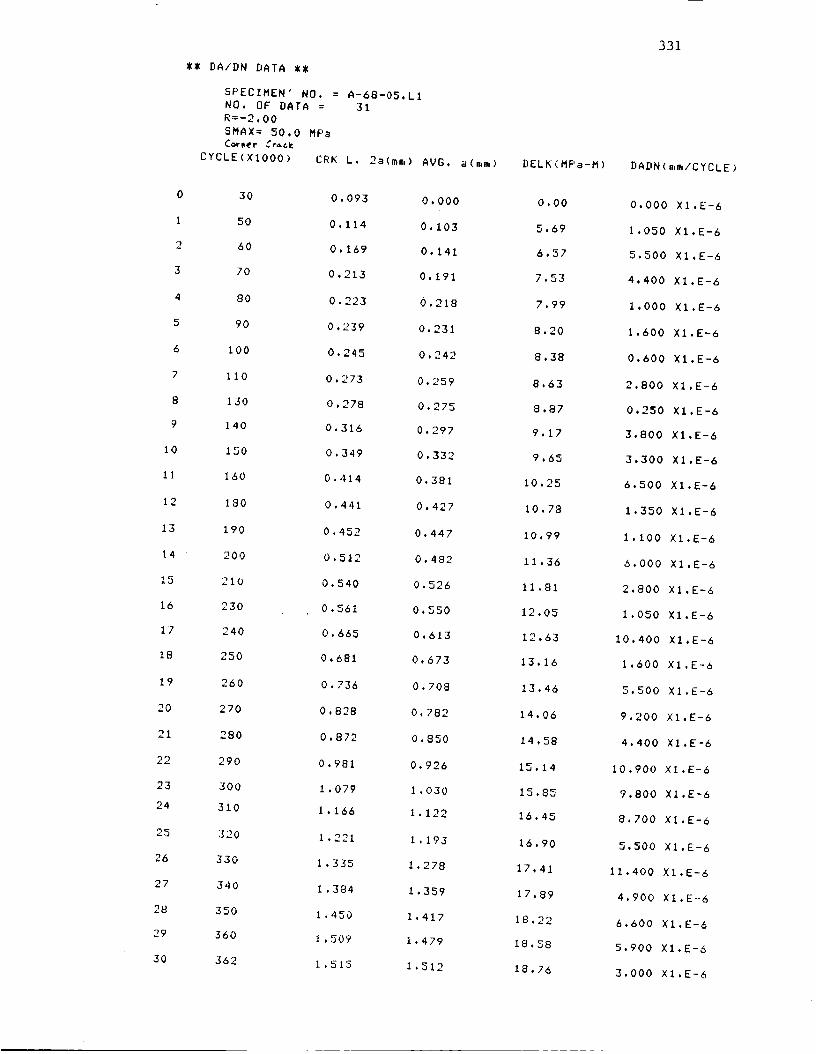
0
1
2
3
4
5
6
7
8
9
10
1]
12
13
14
15
16
17
18
19
20
21
22
23
24
25
26
27
28
29
30
** DA/DN DATA **
SPECIMEN' NO. =
NO. OF DATA =
R=-2.00
SMAX= 50.0 MF'a
C_v_er _r_ck
CYCLE(XIOOg) CRK
30
50
60
70
80
90
100
110
130
140
150
160
180
190
200
210
23O
240
250
260
270
280
290
300
310
320
33O
340
350
360
362
A-68-O5.L1
31
L. 2a(mm)
0.093
0.114
0.169
0.213
0.223
0.239
0.245
0.273
0.278
0.316
0.349
0.414
0.441
0.452
0.512
0.540
0.561
0.665
0.681
0. 736
0.828
0.872
0.981
1.079
1.166
1 .221
1.335
i .384
1. 450
I • 509
i .515
AVG. a(mm)
0.000
0.103
0.141
0.191
0.218
0.231
0.242
0.259
0.275
0.297
0,332
0.381
0.427
0.447
0.482
0.526
0.550
0.613
0.673
0.708
0.782
0.850
0.926
1.030
1.122
1,193
1.278
1.359
1.417
1.479
1.512
DELK<MPa-M)
0.00
5.69
6.57
7.53
7.99
8.20
8.38
8.63
8.87
9.17
9.65
10.25
10.78
10.99
11.36
11.81
12.05
12.63
13.16
13.46
14.06
14.58
15.14
15.85
16.45
16.90
17.41
17.89
18.22
18.58
18.76
331
DADN(mm/CYCLE)
0.000 XI.E-6
1.050 XI.E-6
5.500 X1.E-6
4.400 XI.E-6
1.000 XI.E-6
1.600 Xl.E-6
0.600 XI.E-6
2.800 XI.E-6
0.250 XI.E-6
3.800 Xl.E-6
3.300 XI.E-6
6.500 XI.E-6
1.350 X1.E-6
1.100 XI.E-6
6.000 XI.E-6
2.800 XI.E-6
1.050 XI.E-6
10.400 X1.E-6
1.600 XI.E-6
5.500 X1.E-6
9.200 XI.E-6
4.400 XI.E-6
10.900 XI.E-6
9.800 XI.E-6
8.700 XI.E-6
5.500 XI.E-6
11.400 XI.E-6
4.900 XI.E-6
6.600 XI.E-6
5.900 XI.E-6
3.000 X1.E-6

332
0
1
2
3
4
5
6
7
B
9
I0
11
12
13
14
15
16
17
IB
19
I_ DA/DN DATA ZZ
SPECIMEN' NO. =NO. OF DATA =
R=-2.00SMAX= 50.0 MPa
Cor_'_r Cl'_CYCLE(XIO00) CRK
A-68-O5.L322
L. 2a(mm) AVG. a(mm) DELK(MPa-M) DADN(mm/CYCLE)
110 0.076 0.000 0.00 0.000 X1.E-6
120 0.082 0.079 5.01 0.600 X1.E-6
140 0.120 0.101 5.62 1.900 XI.E-6
160 0.153 0.137 6.46 1,650 XI.E-6
170 0.196 0.175 7.23 4.300 X1.E-6
200 0.240 0.218 7.99 1,467 X1.E-6
210 0.262 0.251 8.51 2.200 X1.E-6
230 0.343 0.303 9.25 4.050 X1.E-6
240 0.392 0.368 10.08 4.900 X1.E-6
250 0.512 0.452 11.05 12.000 X1.E-6
260 0.600 0.556 12.10 8,800 X1,E-6
270 0.659 0.629 12.78 5.900 X1.E-6
280 0.806 0.733 13.66 14.700 XI.E-6
290 0.916 0.861 14.66 11.000 XI.E-6
300 1.079 0.998 15.63 16.300 XI.E-6
310 1.237 1.158 16.68 15.800 XI.E-6
320 1.352 1.294 17.51 11,500 X1.E-6
330 1.602 1.477 18.57 25.000 XI.E-6
340 1.814 1.708 19.85 21.200 XI.E-6
350 _.o006 1.910 20.94 19.200 XI.E-6

333
U')oI
I
Cu
IIII I I I I
%lllll I I I I
'0 0Im
IIIIII I I I
qr
'0
**1'* J I IU7
'o
IIIII I I I I
aP
'o
"2
i
(3"I:3A:3/HM) NO/VO
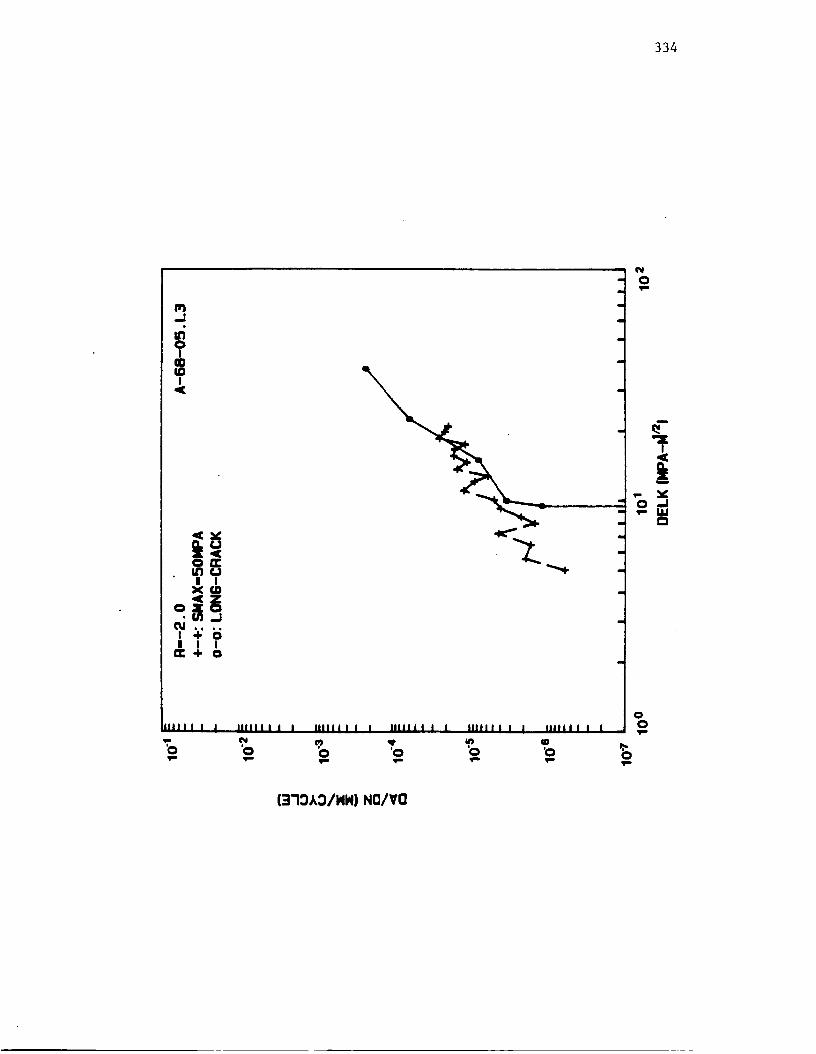
334
..J
IOoI
WI
cJ
I I IIZ÷ o
IIIII I I I IIIIII I I I IIIIII I I I IIIIII I I I IIIIII I I I IIIIII I I I
-: % % - _ .'o 'o 'oqlI qli ql ql_ qi
" 2
!
ooVI
WlI
(37g_IHH) NO/VO

335
CE
IU
F,=.
=.
T
==
I
Eg+3ggg'E Eg+3ggg" [ Eg+3ggg" T- Eg+3ggg "E-
5ONnO,=I-OBO'I

OR_G_qAU PKG]_
OF POOR QU_
2.3ram

ORIGINAl] P_G_
OF POOR QUAL_
A-68-05
BORE
SIDEr

1. Report No.
4, Title and Subtitle
_2 Government Accession No.
Short Fatigue C_ack Behavior in Notched
2024-T3 Aluminum Specimens
7. Aurar(s)
J. J. Lee and W. N. Sharpe, Jr.
9. P_f_mingOr_nizationNameandAddres=
Johns Hopkins University
Department of Mechanical Engineering
Baltimore, Maryland 21218
/
a J
5. Report Date
July, 1986
6, Performing Organization Code
8. Perform;ng Organization Report No.
10, Work Unit No.
11. Contract or Grant No.
12. S_nsmingAgency Narne_d A_ru=
National Aeronautics and Space Administration
Langley Research Center
Hampton, VA 23665
13. Type of Report and Period Covered
FInal
14. Sponsoring Agency Code
15. Supplementary Notes
18. Abstra_
Single-edge, semi-circular notched specimens of AI 2024-T3, 2.3 mm thick,
were cyclicly loaded at R-ratios of 0.5, 0.0, -I.0, and -2.0, as part of an
AGARD-sponsored, round-robin test program. The notch roots were periodically
inspected using a replica technique which duplicates the bore surface. The
replicas were examined under an optical microscope to determine the initiation
of very short cracks and to monitor the growth of short cracks ranging in length
from a few tens of microns to the specimen thickness.
In addition to short crack growth measurements, the crack opening displacement
(COD) was measured for surface cracks as short as 0.035 mm and for through-
thickness cracks using the Interferometric Strain/Displacement Gage (ISDG), a
laser-based optical technique.
The growth rates of short cracks were faster than the long crack growth rates
for R-rations of -I.0 and -2.0. No significant difference between short and long
crack growth rates was observed for R = 0.0. Short cracks had slower growth ratesthan long cracks for R = 0.5.
The crack opening stresses measured for short cracks were smaller than those
predicted for large cracks, with little difference appearing for positive R-ratios
and large differences noted for negative R-ratios.
17. Key Words(Suggest_ by Author(s))Aluminum Alloy COD measurement
Short Crack
Notched Specimen
Fatigue Crack Growth Test
Crack Closure Measurement
Interferometric Strain/DisDl. Gage
19. Security _a_if.(ofthiire_rt)
Unclassified
18. Distribution Statement
20. Security Clas._Jf.(of this page) 21. No. of Pages346
22. Price"
" Fu sale by the National Technical Information Service. Springfield. Virginia 22161
NASA-C-168 (Rev. 10-75)