Embed Size (px)
Citation preview

1
SHMS NGC Cerenkov
Hall C Readiness ReviewAugust 24 & 25, 2016
Newport News
Donal DayUniversity of Virginia

• HMS
• Recent Performance
• SHMS Nobel Gas Cerenkov
• How it got done
• Design Principles and Constraints
• Expected Performance
• Construction Details
• Status
• Extra Parts
• Acknowledgements
• Extra Slides
2
Outline

3
We have done this before+Y
+Z
+X
FRONT VIEW
hydroformedwindows
BNC HV
rohacell
phototube
mirror
base
magneticshield
30° 15°
+Z+X
+Y TOP VIEW
150 cm
150 cm
12/8/94
10/25/15

How it got done• Design and Simulation UVa• Tank Drawings and Fabrication
JLAB• Design Procurement/Fabrication
of everything inside the tank; mirrors, pmts, mirror mounts, pmt mounts, etc: UVa
• Glass blanks: 43 by 43 cm by 3mm with R = 135 cm Rayotek Scientific, Inc
• Measure Shapes Apex Metrology
• Roughness Examination UVa's Zygo white light interferometer
• Glass Coating: Al followed by MgF2 UV reflectance to exceed 75% (at 150 nm) CERN EP-DT Group
• PMTs and and bases: 14 stage, low noise, 5 inch quartz window, positive HV: 9823QKB04 (PMT) and C643KFP-01 (divider) ET Enterprises Ltd, Electron Tubes, UK
• Magnetic Shields Ad-Vance Magnetics
• Gas Handling JLAB• Tedlar Dupont• Window and Port Foam Seals
Precision Sheet Metal Fabrication
4

5
118
total number of photo electrons produced per event. Figure 4.6 (left) presents an ex-
ample of the full Cherenkov response for the electron run 72782. This average signal
is approximately 6 photo electrons per event. For particle identification, electrons are
identified from the number of total photoelectrons >2, while for protons the number
of total photo electrons is <2.!!!!!!
!!!!!!!!!!!!!!!!!!!
"#$%&'!
(#&)*!%$+,-.!#/!01#&#!-*-2&.#%'!!
!!!!!!
!!!!!!!!!
"#$%&'!
())*+*,%
+-!
./0!1#1,%&$1!2++,3&2%+,4!5!678!
./0!1#1,%&$1!2++,3&2%+,4!5!678!
Figure 4.6. Left: an example of a full Cherenkov response for the electron run 72782.Right: the ine�ciency of the Cherenkov as a function of � for the samerun 72782.
However, because the two mirrors are aligned vertically, there is an ine�ciency
at the central region where the two mirrors meet each other. This ine�ciency for
electrons is determined by calculating the ratio of yields with a cut of Cherenkov
photo electrons > 2 to Cherenkov photo electrons > 0 as a function of momentum
acceptance of the HMS, �. As seen in Figure 4.6 (right), the Cherenkov cut of 2 photo
electrons causes an ine�ciency up to 20% in the central region of the � spectrum.
This ine�ciency is applied in Monte Carlo simulation as a function of � in order to
correct the Monte Carlo yields.
0.42 Atm of C4F10
SANE E07-003 2009 Anusha Liyanage HU
Nuclear Dependence of R: E04-001 2007 Vahe Mamyan UVa
Recent HMS Cerenkov Performance
Efficiency dip at mirror overlap
5 inch Burle PMT 8854 coated with WLS
π Threshold: 4 GeV/c
.5 Atm of C4F10
1% effect confirmed at https://hallcweb.jlab.org/elogs/Jan05+Experiments/384

Page
Experiment p (GeV/c)
Req’d e-:π- Disc.
Spec’d NG Cerenkov
Spec’d Calorimeter
Total Expected
E12-06-101 (Fpi-3) 2.2 - 8.1 4.5•103:1
50:1
(HMS Cerenkov
gives up to 300:1 now)
>200:1
(1000:1 above 6 GeV/c)
>104:1
E12-06-104 (σL/σT) 5.4 - 5.8 103:150:1
(HMS Cerenkov
gives up to 300:1 now)
>200:1
(1000:1 above 6 GeV/c)
>104:1
E12-07-103 (pion factorization) (d)
2.4 - 8.5 103:150:1
(HMS Cerenkov
gives up to 300:1 now)
>200:1
(1000:1 above 6 GeV/c)
>104:1E12-06-105 (x>1) 4.8 -10.6 5•103:1
50:1
(HMS Cerenkov
gives up to 300:1 now)
>200:1
(1000:1 above 6 GeV/c)
>104:1
E12-06-110 (c) 2.2 - 6.8 103:1
50:1
(HMS Cerenkov
gives up to 300:1 now)
>200:1
(1000:1 above 6 GeV/c)
>104:1
E12-06-121 (g2n, d2
n) 6.3 - 7.5 >102:1
50:1
(HMS Cerenkov
gives up to 300:1 now)
>200:1
(1000:1 above 6 GeV/c)
>104:1
SHMS PID Requirements : negative polarity
4 overlapping spherical mirrors
2 m of active length
Noble gas at 1 Atm
R = 135 cm, 43 by 43 cm
4Tuesday, April 16, 13

Choice of gases Argon up to 6 GeV and a mixture of Argon and Neon up to 11 GeV
cos ✓ =1�n
Threshold condition : (1 − β) < (n − 1)
5Tuesday, April 16, 13

Full Featured Geant 4 Simulation
V Mamyan, M. Yurov6Tuesday, April 16, 13

Photoelectron Yield
Tube (5) A Ne λ1 λ2R1584 UV glass: 219 5.9 185 650 NeonET 9823QKB Quartz: 349 9.4 154 620 Neon
200 cm active length, 80% of vendor’s QEArgon 4x
Refle
ctanc
e %
QE %
λ (nm) λ (nm)
7Tuesday, April 16, 13

Photoelectron Yield
Tube (5) A Ne λ1 λ2R1584 UV glass: 219 5.9 185 650 NeonET 9823QKB Quartz: 349 9.4 154 620 Neon
200 cm active length, 80% of vendor’s QEArgon 4x
Refle
ctanc
e %
QE %
λ (nm) λ (nm)
7Tuesday, April 16, 13

11
Mirro
r In
stal
lation
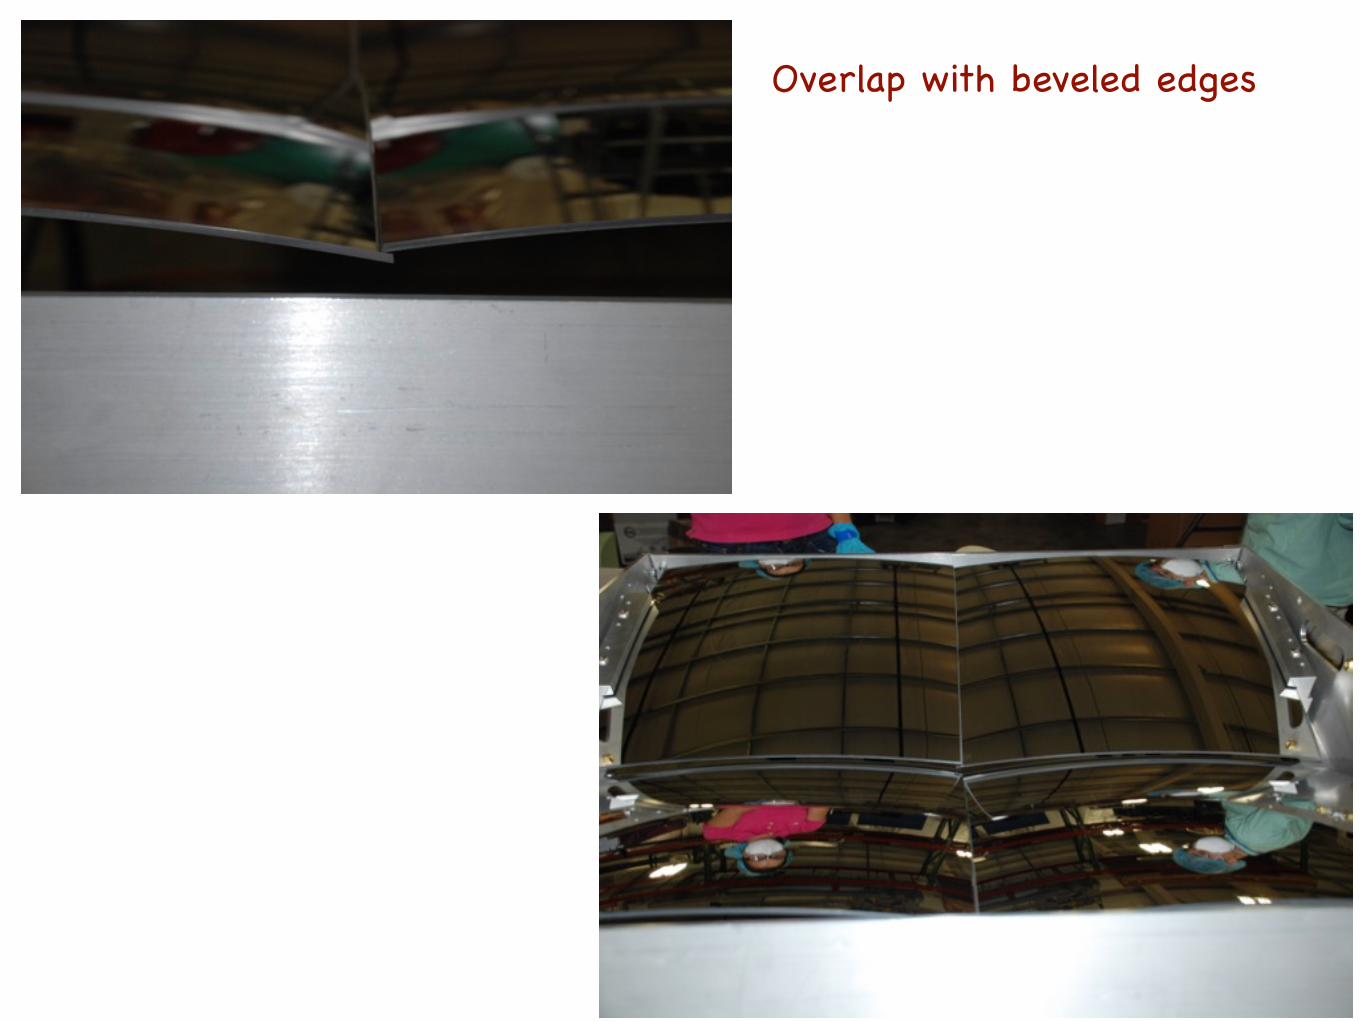
12
Overlap with beveled edges

PMTs
13

Tuning
14
Green laser illuminating whole of acceptance
Red pencil laser probing range of angles

Materials in path of electron
15
Item Material Z Atomicmass density(g/cm^3) RL(g/cm^2) RL(cm) Thickness(in) Thickness(cm) #RL Source
EntranceWindow^* Tedlar((CH2CHCl)n) Z/A= 0.51201 1.3 25.51 19.63 0.002 0.00508 0.000259 PDG
Gas Ar 18 39.948 1.66E-03 19.55 1.17E+04 200 0.017036 PDGNe 10 20.18 8.39E-04 28.93 3.45E+04 200 0.005797 PDG
Glass SiO2 2.2 27.05 12.29 0.3 0.024410 PDGExitWindow Tedlar((CH2CHCl)n) Z/A= 0.51201 1.3 25.51 19.63 0.002 0.00508 0.000259 PDG
TotalRL(withargon) 0.042*Seehttp://pdg.lbl.gov/2014/AtomicNuclearProperties/HTML/polyvinylchloride_PVC.html Percentfrommirror 58.2
MaterialsinpathofelectroninNGCCerenkov
Magnetic Field at PMTs
Max Bx is 2.9 GaussMax Bx is 16.2 Gauss
Steve Lassiter, Hall C SHMS Detector Working Group Meeting Aug. 26, 2010
6-inch shield made of 0.040” Ad-Vance Ad-Mu-80

Detector Efficiency
16
26%32%92%100%
We can assume that the photoelectrons have a Poisson distribution W(N, N̄) =N̄Ne�N̄N! for registering N photoelectrons when N̄ are expected. If by P (N) we de-
note the probability for the detector (PMT and associated circuitry) to recordthe pulses due to N photoelectrons, we can write the efficiency of the de-tector as ✏ =
P1N=0 W(N, N̄)P (N). Let us assume that P (N) is of the form
P (N0) =
(0, N0 N � 1;
1, N0 � N.i.e.: there is a threshold for the detection of N
photoelectrons. Then the efficiency is of the form
✏ = 1 � e�N̄
1 +N�1X
N0=1
N̄N0
N0!
!
.
Hence, we have the efficiency functions
✏1 = 1 � e�N̄,✏2 = 1 � e�N̄(1 + N̄),✏3 = 1 � e�N̄(1 + N̄ + N̄2/2),✏4 = 1 � e�N̄(1 + N̄ + N̄2/2 + N̄3/6),
etc.

17
83
3.4.2 Particle Identification Cuts
As in all experiments there are events coming from reactions other then the one the
experiment wants to study. These events are regarded as a background. Di↵erent type
Photo-electrons
0 5 10 15 20 25
/E’track
E00.2
0.40.6
0.81
1.21.4
0
5000
10000
15000
20000
Pions
Electrons
Cerenkov cut
Calorimeter cut
Figure 30: HMS calorimeter track energy hsshtrk/E0 vs number of C̆erenkov photo-electrons. The magenta line shows the C̆erenkov cut, the red line shows the Calorime-ter cut.
of detectors are constructed to decrease the number of background events in order to
achieve the experiment’s specific precision goals. For this experiment there are two
detectors used for particle identification, a threshold C̆erenkov detector described in
Section 2.7.3, and an electromagnetic lead-glass calorimeter described in Section 2.7.4.
The main background in this experiment is from negative pions produced by charge
exchange reactions. The ratio of pions to electrons varied from 0.1 to 30 for all
runs. In this experiment the C̆erenkov cut required that number of photoelectrons be
bigger than 2 (hcer npe > 2), and the ratio of the Calorimeter track energy divided
Rosen07 RN π/e from .1 to 30
Electrons Npe > 2, ShrTrk > 0.7
86
10000
20000
30000 No cutCer cut > 2
/ E’trackE0 0.5 1 1.5
1
10
210
310
410Cer + Calo cut
Pion contamin.Calorimeter cut > 0.7
Figure 32: HMS central momentum is 0.71 GeV. Top plot: HMS calorimeter trackenergy Etrack/E
0 (hsshtrk/hse) distribution without C̆erenkov cut (the blue line) andwith C̆erenkov cut > 2 (the red line). Bottom plot: The Etrack/E
0 distribution afterC̆erenkov cut > 2 and Etrack/E
0 > 0.7 cut (the red hatched area). The solid bluearea is the pion contamination.
pions that pass the C̆erenkov cut. The distribution of hsshtrk/hse, where hsshtrk is
the track energy in the calorimeter and hse is the energy of the particle measured in
the HMS, has electrons peaked at 1 and pions peaked at 0.3/Etrack, see the bottom
plot of Fig. 32. The hsshtrk/hse > 0.7 cut will remove most of the pions, but it
will also remove some good electrons, which for some reason have less energy in the
calorimeter than expected. It will cause an ine�ciency (Calorimeter cut ine�ciency)
85
Calorimeter energy / HMS momentum0 0.5 1 1.5
0
50
100
150Cut out electrons
Pion background
E’ (GeV)1 2 3 4
Cer
enko
v ef
ficie
ncy
0.98
0.99
1
1.01 / ndf 2χ 109.5 / 103p0 8.276e-05± 0.9971 p1 0.8505± 1.625 p2 335.8± 825
/ ndf 2χ 109.5 / 103p0 8.276e-05± 0.9971 p1 0.8505± 1.625 p2 335.8± 825
Figure 31: First plot: HMS calorimeter total energy hcal et/E0 distribution whennumber of photoelectrons are higher than 0 but less than 2. Second plot: TheC̆erenkov cut e�ciency as a function of scattered energy.
the total number of electrons is the ine�ciency of the C̆erenkov cut and is shown in
the bottom plot of Fig. 32. The C̆erenkov cut e�ciency is 99.7% and drops a little
at the lowest scattered energy (most likely caused by high pion/electron ratio). The
electron cut e�ciency is parametrized in E0 and used to correct the cross section. The
systematic error of the C̆erenkov cut is estimated to be about 0.1%.
Calorimeter Cut E�ciency: The C̆erenkov cut alone is not enough to achieve the
necessary pion rejection power at low energies ( 0.4 � 1.0 GeV). An additional cut,
hsshtrk/hse > 0.7, on the Calorimeter energy is applied to reduce the number of
π Rejection
18
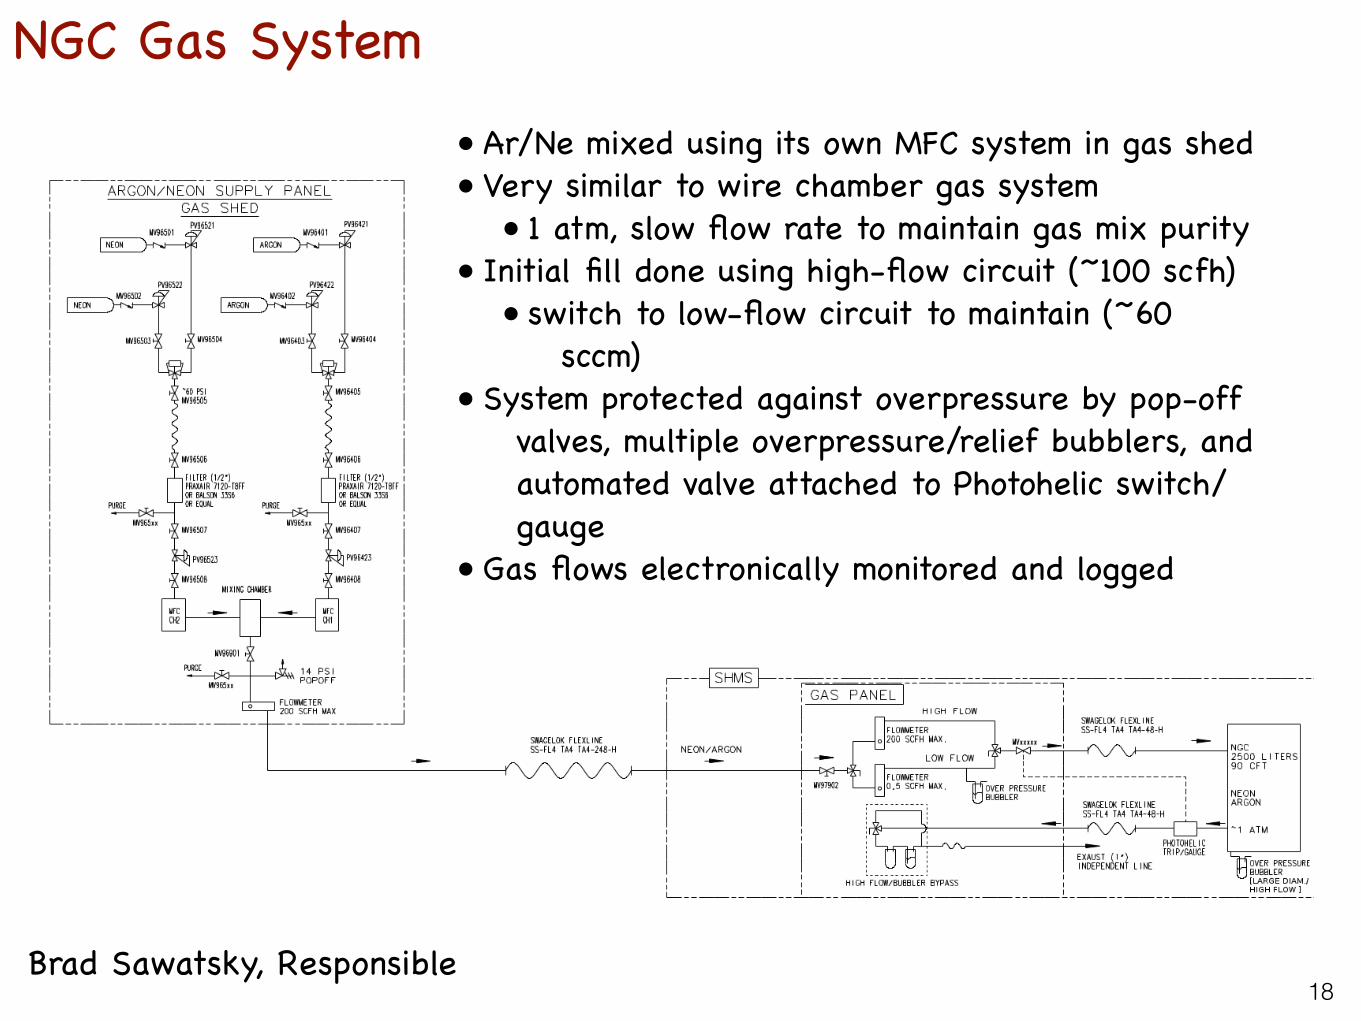
• Ar/Ne mixed using its own MFC system in gas shed• Very similar to wire chamber gas system
• 1 atm, slow flow rate to maintain gas mix purity• Initial fill done using high-flow circuit (~100 scfh)
• switch to low-flow circuit to maintain (~60 sccm)
• System protected against overpressure by pop-off valves, multiple overpressure/relief bubblers, and automated valve attached to Photohelic switch/gauge
• Gas flows electronically monitored and logged
NGC Gas System
Brad Sawatsky, Responsible

Backup & Status• Two HMS mirrors
• Three NGC mirrors
• Four 5 inch Hamamatsu UV glass (suitable for coating)
• One 5 inch ET Quartz tube
• Huge inventory of experience
• Assembled and tuned detector in ESB with nitrogen flowing since October 2015
• Ready for installation and checkout
19

Acknowledgements• Howard Fenker
• Brad Sawatsky
• Bert Metzger
• Vahe Mamyan
• Nicholas Philips
• Mikhail Yurov
• Steve Greco
• Dagmawi Abede
• David Wimer
• Garth Huber
• Dan Abrams
• Jixie Zhang
• Dien Nguyen
• Matt Caplan
• Tyler Cody
• Matt Biondi
• Thomas Schneider
• Tosh Rijal
• Thanakorn Iamsasri
• Cole Smith
• Matthew Nelson
• Melissa Goldman
• Stephen Washington
20
https://hallcweb.jlab.org/doc-private/ShowDocument?docid=794
Extra Slides
21

Faro Arm in Astronomy at UVa
APEX Metrology, Zeiss G2 Calypso
Coordinate measuring machines (CMM)

Mirrors - the glassWe worked with Rayotek of San Diego which claimed great experience in slumping glass.They were 1 year late - the shapes were very good. We specified R = 135cm
Sheet3
Page 1
Rating 1 2 3 4 5 6 7 8 9 10
Mirror # 12 0 8 10 5 7 4 6 9 11
radius, cm
Z 132.9 133.2 133.2 133.4 133.3 134.1 133.2 133.3 133.0 135.7
O 132.6 132.6 132.6 132.6 132.6 133.5 132.6 132.6 132.0 134.9
A 133.1 133.9 133.4 133.5 133.4 134.5 135.9 133.3 134.1 137.5
B 133.3 133.1 133.1 135.3 132.7 134.4 133.7 135.0 133.7 136.3
C 133.0 133.1 135.3 135.0 137.1 133.9 133.5 133.2 133.3 135.5
D 134.0 135.6 133.1 133.3 134.3 136.1 133.9 134.6 134.8 134.6
Z -198.5 -295 -309 -348 -516 -225.2 -450.3 -244.0 -674 -738
O -17.8 -13 -15 -19 -12 -32.1 -14.6 -23.5 -32 -58
A -85.8 -91 -60 -78 -66 -128.5 -297.7 -170.5 -106 -501
B -34.4 -17 -69 -197 -9 -38.0 -182.7 -190.1 -180 -325
C -19.8 -92 -174 -211 -326 -105.7 -69.1 -75.5 -37 -100
D -184.8 -207 -90 -75 -97 -120.7 -96.0 -224.2 -663 -96
Z 78.8 70 179 132 129 114.5 100.4 119.1 91 550
O 17.1 15 12 18 10 18.2 10.6 15.7 26 20
A 28.6 47 42 45 37 99.6 126.7 88.0 67 329
B 23.2 8 100 86 10 78.5 39.4 72.9 37 438
C 22.7 37 135 112 183 61.0 34.5 30.5 46 103
D 60.8 125 39 47 68 40.3 40.0 163.6 64 182
Z 23.5 40 50 48 64 32.8 49.4 38.1 47 103
O 7.3 6 4 8 4 9.8 4.1 6.5 11 13
A 14.5 25 20 20 17 29.8 67.5 35.2 27 113
B 7.3 4 18 43 3 12.3 19.2 39.9 14 76
C 6.6 18 58 55 90 15.1 16.2 16.7 17 30
D 23.0 56 10 11 29 16.8 22.4 38.6 51 27
dev_min, um
dev_max, um
dev_sig, um

24
Bottom LeftMirror # 10Position 1Z
Bottom RightMirror # 7Position 2Z
Top LeftMirror # 5Position 3Z
Top RightMirror # 4Position 4Z
Q. A
Q. DQ. C
Q. B Q. A
Q. DQ. C
Q. B
Q. B
Q. AQ. D
Q. CQ. B
Q. AQ. D
Q. C
X a
xis o
verla
pY axis overlap
-20 -10 0 10 20
-20
-10
0
10
20
x (cm)05
1015
20y (cm)0
510
1520
Hei
ght (
um)
-80
-60
-40
-20
0
20
40
Spherical Fit - Data Spherical Fit - Data
x (cm)05
1015
20y (cm)0
510
1520
Hei
ght (
um)
-80
-60
-40
-20
0
20
40
Conical Fit - Data Conical Fit - Data
x (cm)05
1015
20y (cm)0
510
1520
Hei
ght (
um)
-80
-60
-40
-20
0
20
40
Elliptical Fit - Data Elliptical Fit - Data
-20 -10 0 10 20
-20
-10
0
10
20
x (cm)05
1015
20y (cm)-20
-15-10
-50
Hei
ght (
um)
-60
-40
-20
0
20
Spherical Fit - Data Spherical Fit - Data
x (cm)05
1015
20y (cm)-20
-15-10
-50
Hei
ght (
um)
-60
-40
-20
0
20
Conical Fit - Data Conical Fit - Data
x (cm)05
1015
20y (cm)-20
-15-10
-50
Hei
ght (
um)
-60
-40
-20
0
20
Elliptical Fit - Data Elliptical Fit - Data
-20 -10 0 10 20
-20
-10
0
10
20
x (cm)-10-5
05
10y (cm)-10
-50
510
Hei
ght (
um)
-20-15-10-505
101520
Spherical Fit - Data Spherical Fit - Data
x (cm)-10-5
05
10y (cm)-10
-50
510
Hei
ght (
um)
-60-40-20
020406080
100
Conical Fit - Data Conical Fit - Data
x (cm)-10-5
05
10y (cm)-10
-50
510
Hei
ght (
um)
-20-15-10-505
101520
Elliptical Fit - Data Elliptical Fit - Data
Red line is laser pointer path for PMT position tuning

25
-10 -5 0 5 10 15 20-30
-20
-10
0
10
20
-3
-2
-1
0
1
2
3
vertical angle
-10 -5 0 5 10 15 20-30
-20
-10
0
10
20
-2
-1.5
-1
-0.5
0
0.5
1
1.5
2
horizontal angle
MC produced electron vertical and horizontal angles as a function of X and Y at the front of the NGC window.