Embed Size (px)
Citation preview
Annual Report 2011Shizuoka Bank Group
1
Shizuoka Bank Group at a Glance
ContentsShizuoka Bank Group at a Glance . . . . . . . . . . . . . . . . . . . . . . . . . . .1
Consolidated Financial Highlights . . . . . . . . . . . . . . . . . . . . . . . . . . . .2
To Our Stakeholders . . . . . . . . . . . . . . . . . . . . . . . . . . . . . . . . . . . . . .3
Message from the President . . . . . . . . . . . . . . . . . . . . . . . . . . . . . . . .4
Our 11th Medium-Term Business Plan (FY2011-2013) . . . . . . . . . . . .5
Support for Overseas Market Entry and Business . . . . . . . . . . . . . . . .7
Business Performance in Fiscal 2010 . . . . . . . . . . . . . . . . . . . . . . . . .8
Results of Recent Achievement . . . . . . . . . . . . . . . . . . . . . . . . . . . . .9
Management Systems . . . . . . . . . . . . . . . . . . . . . . . . . . . . . . . . . . .11
Risk Management Systems . . . . . . . . . . . . . . . . . . . . . . . . . . . . . . .13
Our Operational Base: Shizuoka Prefecture . . . . . . . . . . . . . . . . . . .15
Independent Auditors’ Report . . . . . . . . . . . . . . . . . . . . . . . . . . . . . 17
Consolidated Balance Sheets . . . . . . . . . . . . . . . . . . . . . . . . . . . . . 18
Consolidated Statements of Income . . . . . . . . . . . . . . . . . . . . . . . . .19
Consolidated Statement of Comprehensive Income . . . . . . . . . . . . .19
Consolidated Statements of Changes in Equity . . . . . . . . . . . . . . . .20
Consolidated Statements of Cash Flows . . . . . . . . . . . . . . . . . . . . 21
Notes to Consolidated Financial Statements . . . . . . . . . . . . . . . . . .22
Key Consolidated Financial Indicators . . . . . . . . . . . . . . . . . . . . . . . .38
Corporate Data . . . . . . . . . . . . . . . . . . . . . . . . . . . . . . . . . . . . . . . . .41
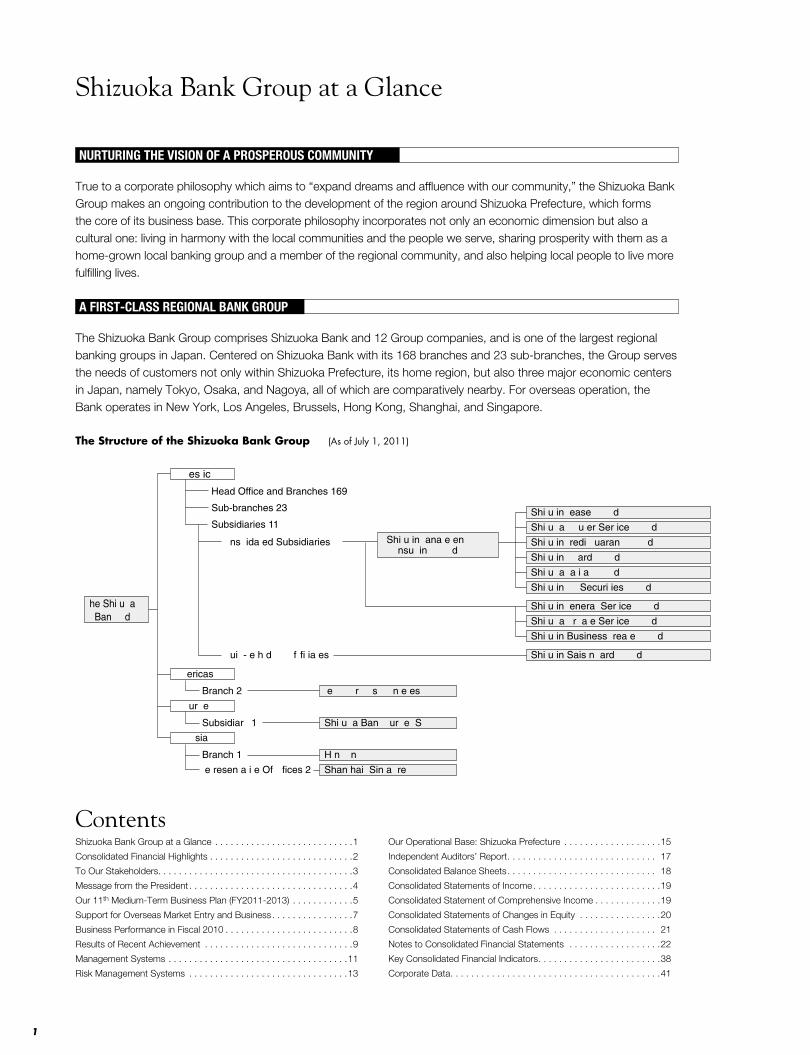
Head Office and Branches 169
Sub-branches 23
Subsidiaries 11
��ns��ida�ed Subsidiaries
��ui��-�e�h�d �f fi�ia�es
���es�ic
�he Shi�u��aBan�� ��d�
Shi�u�in �ease ���� ��d�
Shi�u��a ����u�er Ser�ice ���� ��d�
Shi�u�in �redi� �uaran�� ���� ��d�
Shi�u�in �� �ard ���� ��d�
Shi�u��a �a�i�a� ���� ��d�
Shi�u�in �� Securi�ies ���� ��d�
Shi�u�in �enera� Ser�ice ���� ��d�
Shi�u��a ��r��a�e Ser�ice ���� ��d�
Shi�u�in Business �rea�e ���� ��d�
��ericas
Shi�u�in �ana�e�en���nsu��in� ���� ��d�
Shi�u�in Sais�n �ard ���� ��d�
�e� � �r�� ��s �n�e�esBranch 2
Subsidiar� 1
Branch 1
�e�resen�a�i�e Of fices 2
�ur��e
�sia
Shi�u��a Ban� ��ur��e� S���
H�n� ��n�
Shan�hai� Sin�a��re
The Structure of the Shizuoka Bank Group (As of July 1, 2011)
NURTURING THE VISION OF A PROSPEROUS COMMUNITY
True to a corporate philosophy which aims to “expand dreams and affluence with our community,” the Shizuoka Bank Group makes an ongoing contribution to the development of the region around Shizuoka Prefecture, which forms the core of its business base . This corporate philosophy incorporates not only an economic dimension but also a cultural one: living in harmony with the local communities and the people we serve, sharing prosperity with them as a home-grown local banking group and a member of the regional community, and also helping local people to live more fulfilling lives .
A FIRST-CLASS REGIONAL BANK GROUP
The Shizuoka Bank Group comprises Shizuoka Bank and 12 Group companies, and is one of the largest regional banking groups in Japan . Centered on Shizuoka Bank with its 168 branches and 23 sub-branches, the Group serves the needs of customers not only within Shizuoka Prefecture, its home region, but also three major economic centers in Japan, namely Tokyo, Osaka, and Nagoya, all of which are comparatively nearby . For overseas operation, the Bank operates in New York, Los Angeles, Brussels, Hong Kong, Shanghai, and Singapore .
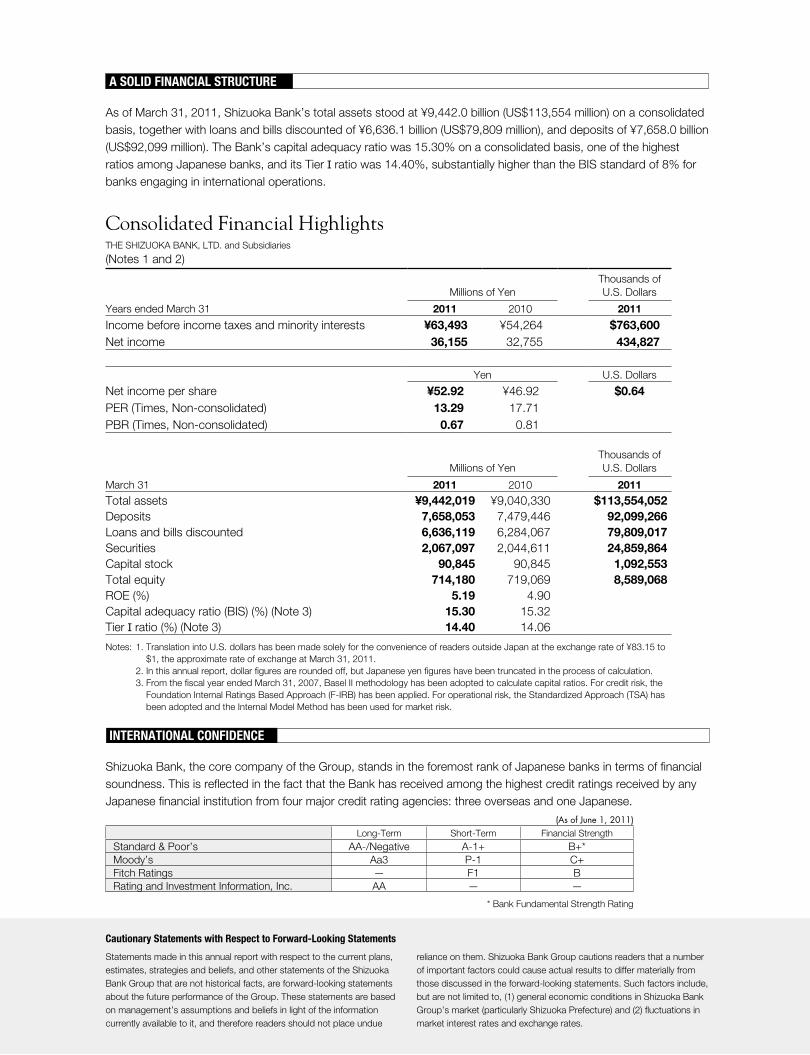
Consolidated Financial HighlightsTHE SHIZUOKA BANK, LTD. and Subsidiaries
(Notes 1 and 2)
Cautionary Statements with Respect to Forward-Looking Statements
Statements made in this annual report with respect to the current plans, estimates, strategies and beliefs, and other statements of the Shizuoka Bank Group that are not historical facts, are forward-looking statements about the future performance of the Group. These statements are based on management’s assumptions and beliefs in light of the information currently available to it, and therefore readers should not place undue
reliance on them. Shizuoka Bank Group cautions readers that a number of important factors could cause actual results to differ materially from those discussed in the forward-looking statements. Such factors include, but are not limited to, (1) general economic conditions in Shizuoka Bank Group’s market (particularly Shizuoka Prefecture) and (2) fluctuations in market interest rates and exchange rates.
A SOLID FINANCIAL STRUCTURE
As of March 31, 2011, Shizuoka Bank’s total assets stood at ¥9,442.0 billion (US$113,554 million) on a consolidated basis, together with loans and bills discounted of ¥6,636.1 billion (US$79,809 million), and deposits of ¥7,658.0 billion (US$92,099 million). The Bank’s capital adequacy ratio was 15.30% on a consolidated basis, one of the highest ratios among Japanese banks, and its Tier I ratio was 14.40%, substantially higher than the BIS standard of 8% for banks engaging in international operations.
Millions of YenThousands of U.S. Dollars
Years ended March 31 2011 2010 2011
Income before income taxes and minority interests ¥63,493 ¥54,264 $763,600 Net income 36,155 32,755 434,827
Yen U.S. Dollars
Net income per share ¥52.92 ¥46.92 $0.64 PER (Times, Non-consolidated) 13.29 17.71PBR (Times, Non-consolidated) 0.67 0.81
Millions of YenThousands of U.S. Dollars
March 31 2011 2010 2011
Total assets ¥9,442,019 ¥9,040,330 $113,554,052 Deposits 7,658,053 7,479,446 92,099,266 Loans and bills discounted 6,636,119 6,284,067 79,809,017 Securities 2,067,097 2,044,611 24,859,864 Capital stock 90,845 90,845 1,092,553 Total equity 714,180 719,069 8,589,068 ROE (%) 5.19 4.90Capital adequacy ratio (BIS) (%) (Note 3) 15.30 15.32Tier I ratio (%) (Note 3) 14.40 14.06
Notes: 1. Translation into U.S. dollars has been made solely for the convenience of readers outside Japan at the exchange rate of ¥83.15 to $1, the approximate rate of exchange at March 31, 2011.
2. In this annual report, dollar figures are rounded off, but Japanese yen figures have been truncated in the process of calculation. 3. From the fiscal year ended March 31, 2007, Basel II methodology has been adopted to calculate capital ratios. For credit risk, the
Foundation Internal Ratings Based Approach (F-IRB) has been applied. For operational risk, the Standardized Approach (TSA) has been adopted and the Internal Model Method has been used for market risk.
INTERNATIONAL CONFIDENCE
Shizuoka Bank, the core company of the Group, stands in the foremost rank of Japanese banks in terms of financial soundness. This is reflected in the fact that the Bank has received among the highest credit ratings received by any Japanese financial institution from four major credit rating agencies: three overseas and one Japanese.
(As of June 1, 2011)Long-Term Short-Term Financial Strength
Standard & Poor’s AA-/Negative A-1+ B+*Moody’s Aa3 P-1 C+Fitch Ratings — F1 BRating and Investment Information, Inc. AA — —
* Bank Fundamental Strength Rating

To Our Stakeholders
Thank you for your continued patronage of the Shizuoka
Bank Group.
Please allow us to extend our deepest sympathies to
everyone who has been affected by the Great East
Japan Earthquake of March 2011. The Great East
Japan Earthquake caused untold damage to stricken
areas and has cast a dark shadow over the future of
Japan’s economy with its shattering impact, which
disrupted the nation’s supply chain and forced con-
sumption to plunge.
The Shizuoka Bank Group, above all, stresses the
importance of interacting with customers and respond-
ing sincerely to all inquires and requests. As a regional
financial institution, the Group fulfills its mission by
supporting the regional economy through the smooth
supply of funds.
In April 2011, the Shizuoka Bank Group embarked
on its 11th medium-term business plan “MIRAI—
FUTURE” under the vision of “A comprehensive financial
group that goes along with customers to open up a
future with the region – Challenge for the Future.” As a
comprehensive financial group, under this new medium-
term business plan, we will continue to further meet the
expectations of all of our stakeholders including custom-
ers, the local community, shareholders, and employees.
We hope that our shareholders and other stakehold-
ers will continue to favor us with their support and
encouragement in the future.
September 2011
Toru Sakurai
Chairman
Katsunori Nakanishi
President & Chief Executive Officer
Toru Sakurai, Katsunori Nakanishi, Chairman President & Chief Executive Officer
3
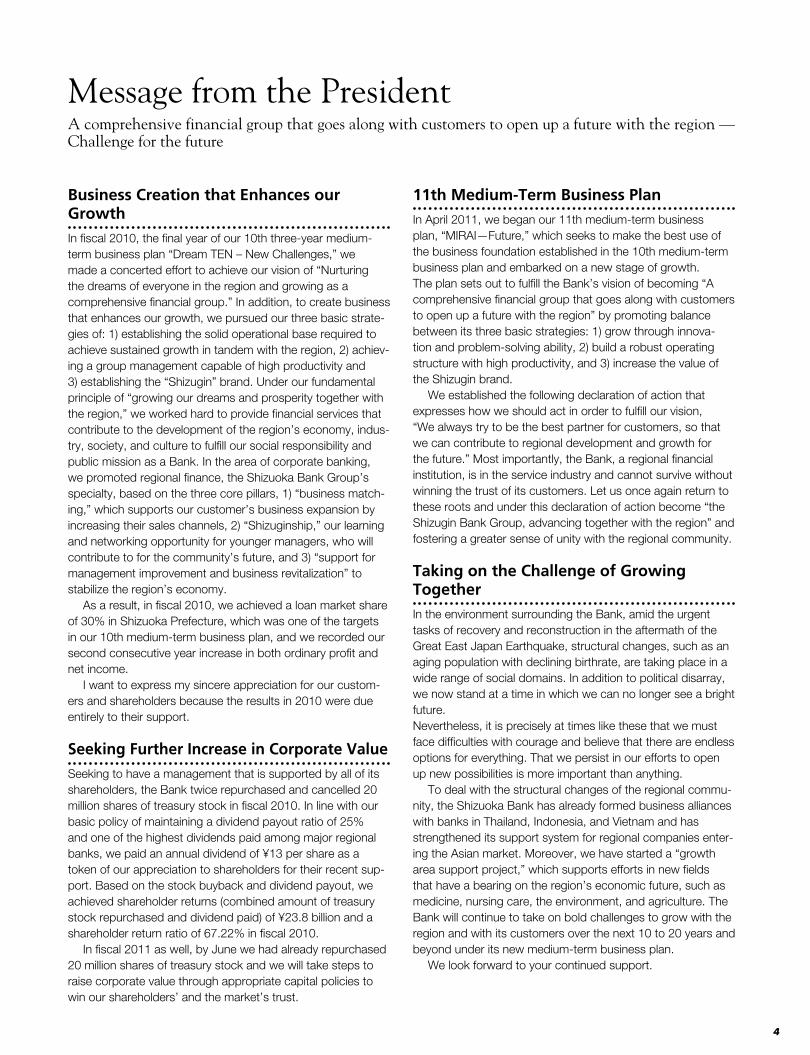
Business Creation that Enhances our GrowthIn fiscal 2010, the final year of our 10th three-year medium-term business plan “Dream TEN – New Challenges,” we made a concerted effort to achieve our vision of “Nurturing the dreams of everyone in the region and growing as a comprehensive financial group.” In addition, to create business that enhances our growth, we pursued our three basic strate-gies of: 1) establishing the solid operational base required to achieve sustained growth in tandem with the region, 2) achiev-ing a group management capable of high productivity and 3) establishing the “Shizugin” brand. Under our fundamental principle of “growing our dreams and prosperity together with the region,” we worked hard to provide financial services that contribute to the development of the region’s economy, indus-try, society, and culture to fulfill our social responsibility and public mission as a Bank. In the area of corporate banking, we promoted regional finance, the Shizuoka Bank Group’s specialty, based on the three core pillars, 1) “business match-ing,” which supports our customer’s business expansion by increasing their sales channels, 2) “Shizuginship,” our learning and networking opportunity for younger managers, who will contribute to for the community’s future, and 3) “support for management improvement and business revitalization” to stabilize the region’s economy. As a result, in fiscal 2010, we achieved a loan market share of 30% in Shizuoka Prefecture, which was one of the targets in our 10th medium-term business plan, and we recorded our second consecutive year increase in both ordinary profit and net income. I want to express my sincere appreciation for our custom-ers and shareholders because the results in 2010 were due entirely to their support.
Seeking Further Increase in Corporate ValueSeeking to have a management that is supported by all of its shareholders, the Bank twice repurchased and cancelled 20 million shares of treasury stock in fiscal 2010. In line with our basic policy of maintaining a dividend payout ratio of 25% and one of the highest dividends paid among major regional banks, we paid an annual dividend of ¥13 per share as a token of our appreciation to shareholders for their recent sup-port. Based on the stock buyback and dividend payout, we achieved shareholder returns (combined amount of treasury stock repurchased and dividend paid) of ¥23.8 billion and a shareholder return ratio of 67.22% in fiscal 2010. In fiscal 2011 as well, by June we had already repurchased 20 million shares of treasury stock and we will take steps to raise corporate value through appropriate capital policies to win our shareholders’ and the market’s trust.
11th Medium-Term Business PlanIn April 2011, we began our 11th medium-term business plan, “MIRAI—Future,” which seeks to make the best use of the business foundation established in the 10th medium-term business plan and embarked on a new stage of growth. The plan sets out to fulfill the Bank’s vision of becoming “A comprehensive financial group that goes along with customers to open up a future with the region” by promoting balance between its three basic strategies: 1) grow through innova-tion and problem-solving ability, 2) build a robust operating structure with high productivity, and 3) increase the value of the Shizugin brand. We established the following declaration of action that expresses how we should act in order to fulfill our vision, “We always try to be the best partner for customers, so that we can contribute to regional development and growth for the future.” Most importantly, the Bank, a regional financial institution, is in the service industry and cannot survive without winning the trust of its customers. Let us once again return to these roots and under this declaration of action become “the Shizugin Bank Group, advancing together with the region” and fostering a greater sense of unity with the regional community.
Taking on the Challenge of Growing TogetherIn the environment surrounding the Bank, amid the urgent tasks of recovery and reconstruction in the aftermath of the Great East Japan Earthquake, structural changes, such as an aging population with declining birthrate, are taking place in a wide range of social domains. In addition to political disarray, we now stand at a time in which we can no longer see a bright future. Nevertheless, it is precisely at times like these that we must face difficulties with courage and believe that there are endless options for everything. That we persist in our efforts to open up new possibilities is more important than anything. To deal with the structural changes of the regional commu-nity, the Shizuoka Bank has already formed business alliances with banks in Thailand, Indonesia, and Vietnam and has strengthened its support system for regional companies enter-ing the Asian market. Moreover, we have started a “growth area support project,” which supports efforts in new fields that have a bearing on the region’s economic future, such as medicine, nursing care, the environment, and agriculture. The Bank will continue to take on bold challenges to grow with the region and with its customers over the next 10 to 20 years and beyond under its new medium-term business plan. We look forward to your continued support.
Message from the PresidentA comprehensive financial group that goes along with customers to open up a future with the region — Challenge for the future
4
11th medium-term business plan “MIRAI”
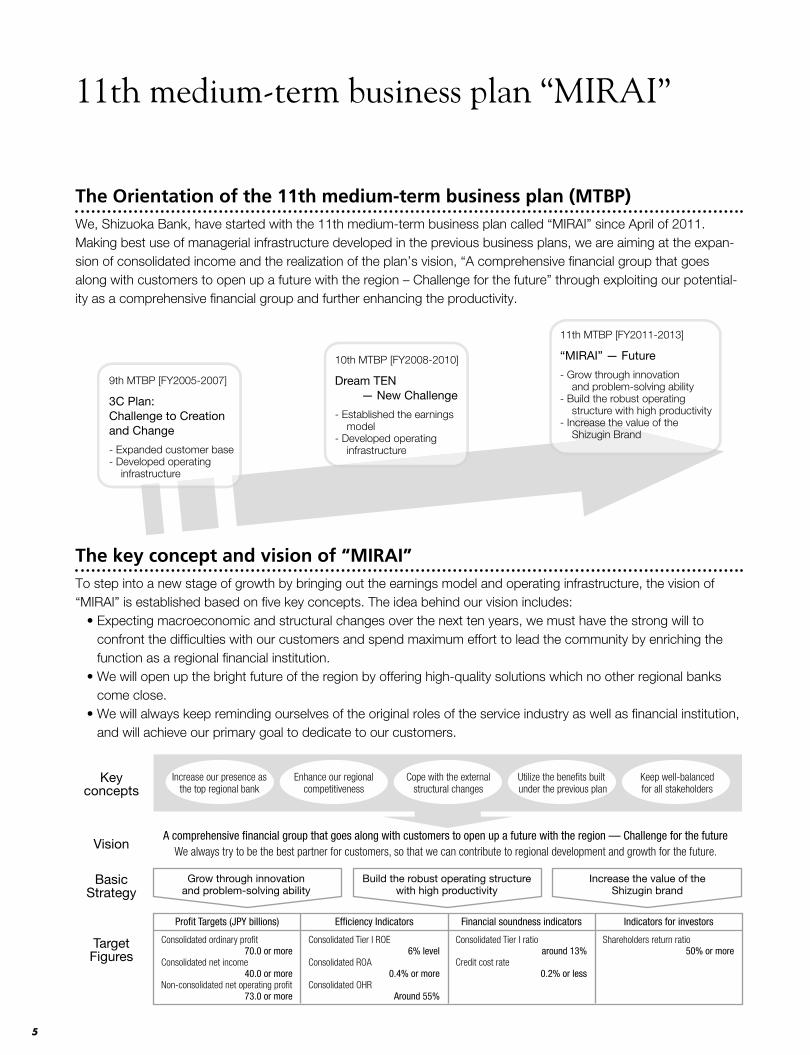
The Orientation of the 11th medium-term business plan (MTBP)We, Shizuoka Bank, have started with the 11th medium-term business plan called “MIRAI” since April of 2011. Making best use of managerial infrastructure developed in the previous business plans, we are aiming at the expan-sion of consolidated income and the realization of the plan’s vision, “A comprehensive financial group that goes along with customers to open up a future with the region – Challenge for the future” through exploiting our potential-ity as a comprehensive financial group and further enhancing the productivity.
The key concept and vision of “MIRAI”To step into a new stage of growth by bringing out the earnings model and operating infrastructure, the vision of “MIRAI” is established based on five key concepts. The idea behind our vision includes:
• Expecting macroeconomic and structural changes over the next ten years, we must have the strong will to confront the difficulties with our customers and spend maximum effort to lead the community by enriching the function as a regional financial institution.
• We will open up the bright future of the region by offering high-quality solutions which no other regional banks come close.
• We will always keep reminding ourselves of the original roles of the service industry as well as financial institution, and will achieve our primary goal to dedicate to our customers.
9th MTBP [FY2005-2007]
3C Plan:Challenge to Creationand Change
- Expanded customer base- Developed operating infrastructure
10th MTBP [FY2008-2010]
Dream TEN — New Challenge
- Established the earnings model- Developed operating infrastructure
11th MTBP [FY2011-2013]
“MIRAI” — Future
- Grow through innovation and problem-solving ability- Build the robust operating structure with high productivity- Increase the value of the Shizugin Brand
Keyconcepts
Vision
BasicStrategy
TargetFigures
Increase our presence asthe top regional bank
Grow through innovationand problem-solving ability
Consolidated ordinary prot 70.0 or moreConsolidated net income 40.0 or moreNon-consolidated net operating prot 73.0 or more
Consolidated Tier I ROE 6% levelConsolidated ROA 0.4% or moreConsolidated OHR Around 55%
Consolidated Tier I ratio around 13%Credit cost rate 0.2% or less
Shareholders return ratio 50% or more
Pro�t Targets (JPY billions) Indicators for investorsFinancial soundness indicatorsEf�ciency Indicators
Build the robust operating structurewith high productivity
Increase the value of theShizugin brand
A comprehensive �nancial group that goes along with customers to open up a future with the region — Challenge for the futureWe always try to be the best partner for customers, so that we can contribute to regional development and growth for the future.
Enhance our regionalcompetitiveness
Keep well-balancedfor all stakeholders
Utilize the benets built under the previous plan
Cope with the externalstructural changes
5
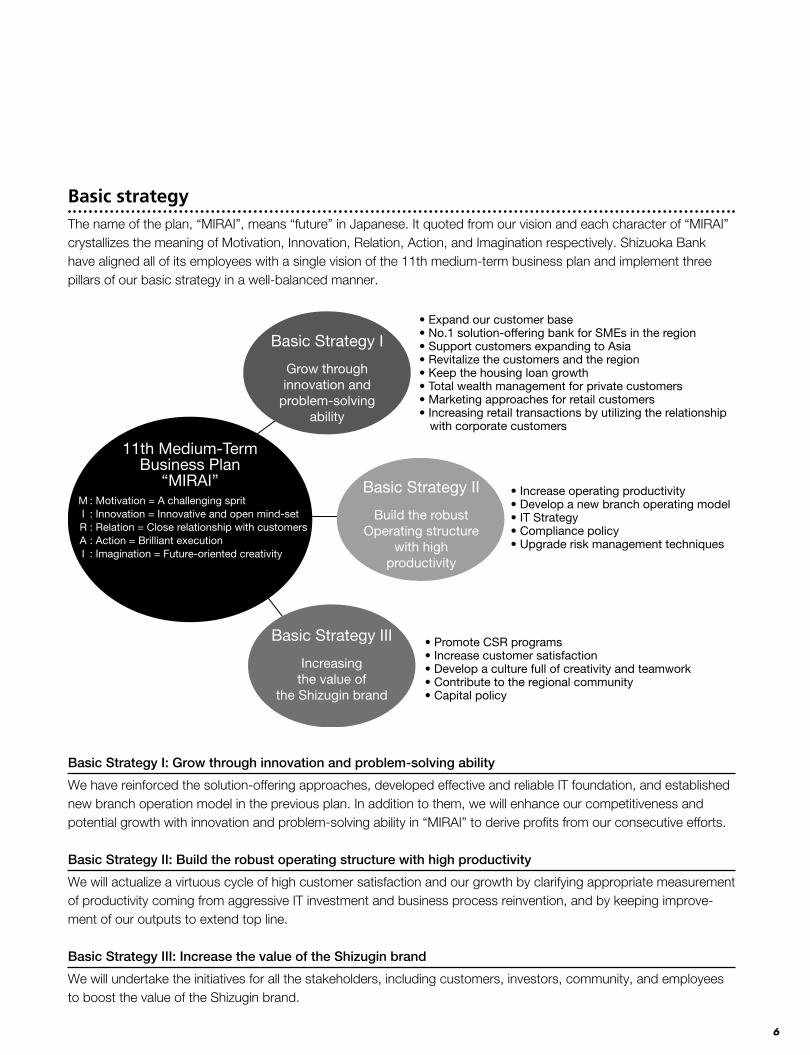
Basic strategyThe name of the plan, “MIRAI”, means “future” in Japanese. It quoted from our vision and each character of “MIRAI” crystallizes the meaning of Motivation, Innovation, Relation, Action, and Imagination respectively. Shizuoka Bank have aligned all of its employees with a single vision of the 11th medium-term business plan and implement three pillars of our basic strategy in a well-balanced manner.
Basic Strategy I: Grow through innovation and problem-solving ability
We have reinforced the solution-offering approaches, developed effective and reliable IT foundation, and established new branch operation model in the previous plan. In addition to them, we will enhance our competitiveness and potential growth with innovation and problem-solving ability in “MIRAI” to derive profits from our consecutive efforts.
Basic Strategy II: Build the robust operating structure with high productivity
We will actualize a virtuous cycle of high customer satisfaction and our growth by clarifying appropriate measurement of productivity coming from aggressive IT investment and business process reinvention, and by keeping improve-ment of our outputs to extend top line.
Basic Strategy III: Increase the value of the Shizugin brand
We will undertake the initiatives for all the stakeholders, including customers, investors, community, and employees to boost the value of the Shizugin brand.
11th Medium-TermBusiness Plan
“MIRAI”
Basic Strategy I
Grow throughinnovation and
problem-solvingability
Basic Strategy II
Build the robustOperating structure
with highproductivity
Basic Strategy III
Increasingthe value of
the Shizugin brand
M : Motivation = A challenging sprit I : Innovation = Innovative and open mind-set R : Relation = Close relationship with customers A : Action = Brilliant execution I : Imagination = Future-oriented creativity
• Expand our customer base• No.1 solution-offering bank for SMEs in the region• Support customers expanding to Asia• Revitalize the customers and the region• Keep the housing loan growth• Total wealth management for private customers• Marketing approaches for retail customers• Increasing retail transactions by utilizing the relationship
with corporate customers
• Increase operating productivity• Develop a new branch operating model• IT Strategy• Compliance policy• Upgrade risk management techniques
• Promote CSR programs• Increase customer satisfaction• Develop a culture full of creativity and teamwork• Contribute to the regional community• Capital policy
6
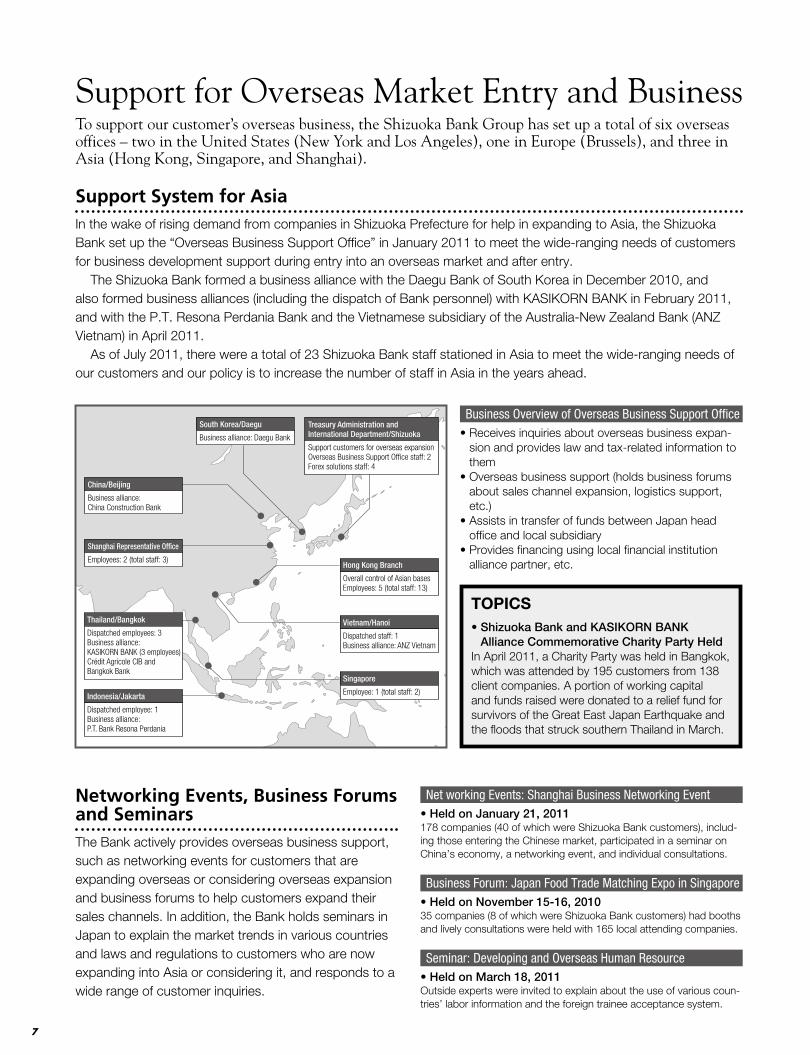
Support for Overseas Market Entry and BusinessTo support our customer’s overseas business, the Shizuoka Bank Group has set up a total of six overseas offices – two in the United States (New York and Los Angeles), one in Europe (Brussels), and three in Asia (Hong Kong, Singapore, and Shanghai).
Support System for AsiaIn the wake of rising demand from companies in Shizuoka Prefecture for help in expanding to Asia, the Shizuoka Bank set up the “Overseas Business Support Office” in January 2011 to meet the wide-ranging needs of customers for business development support during entry into an overseas market and after entry. The Shizuoka Bank formed a business alliance with the Daegu Bank of South Korea in December 2010, and also formed business alliances (including the dispatch of Bank personnel) with KASIKORN BANK in February 2011, and with the P.T. Resona Perdania Bank and the Vietnamese subsidiary of the Australia-New Zealand Bank (ANZ Vietnam) in April 2011. As of July 2011, there were a total of 23 Shizuoka Bank staff stationed in Asia to meet the wide-ranging needs of our customers and our policy is to increase the number of staff in Asia in the years ahead.
Networking Events, Business Forums and SeminarsThe Bank actively provides overseas business support, such as networking events for customers that are expanding overseas or considering overseas expansion and business forums to help customers expand their sales channels. In addition, the Bank holds seminars in Japan to explain the market trends in various countries and laws and regulations to customers who are now expanding into Asia or considering it, and responds to a wide range of customer inquiries.
Net working Events: Shanghai Business Networking Event• Held on January 21, 2011178 companies (40 of which were Shizuoka Bank customers), includ-ing those entering the Chinese market, participated in a seminar on China’s economy, a networking event, and individual consultations.
Business Forum: Japan Food Trade Matching Expo in Singapore• Held on November 15-16, 201035 companies (8 of which were Shizuoka Bank customers) had booths and lively consultations were held with 165 local attending companies.
Seminar: Developing and Overseas Human Resource• Held on March 18, 2011Outside experts were invited to explain about the use of various coun-tries’ labor information and the foreign trainee acceptance system.
Business Overview of Overseas Business Support Office• Receives inquiries about overseas business expan-
sion and provides law and tax-related information to them
• Overseas business support (holds business forums about sales channel expansion, logistics support, etc.)
• Assists in transfer of funds between Japan head office and local subsidiary
• Provides financing using local financial institution alliance partner, etc.
TOPICS• Shizuoka Bank and KASIKORN BANK
Alliance Commemorative Charity Party HeldIn April 2011, a Charity Party was held in Bangkok, which was attended by 195 customers from 138 client companies. A portion of working capital and funds raised were donated to a relief fund for survivors of the Great East Japan Earthquake and the floods that struck southern Thailand in March.
China/Beijing
Business alliance:China Construction Bank
Shanghai Representative Of�ce
Employees: 2 (total staff: 3)
Thailand/Bangkok
Dispatched employees: 3Business alliance: KASIKORN BANK (3 employees)Crédit Agricole CIB and Bangkok Bank
Indonesia/Jakarta
Dispatched employee: 1Business alliance: P.T. Bank Resona Perdania
South Korea/Daegu
Business alliance: Daegu Bank
Treasury Administration andInternational Department/Shizuoka
Support customers for overseas expansionOverseas Business Support Of�ce staff: 2Forex solutions staff: 4
Hong Kong Branch
Overall control of Asian basesEmployees: 5 (total staff: 13)
Vietnam/Hanoi
Dispatched staff: 1 Business alliance: ANZ Vietnam
Singapore
Employee: 1 (total staff: 2)
7
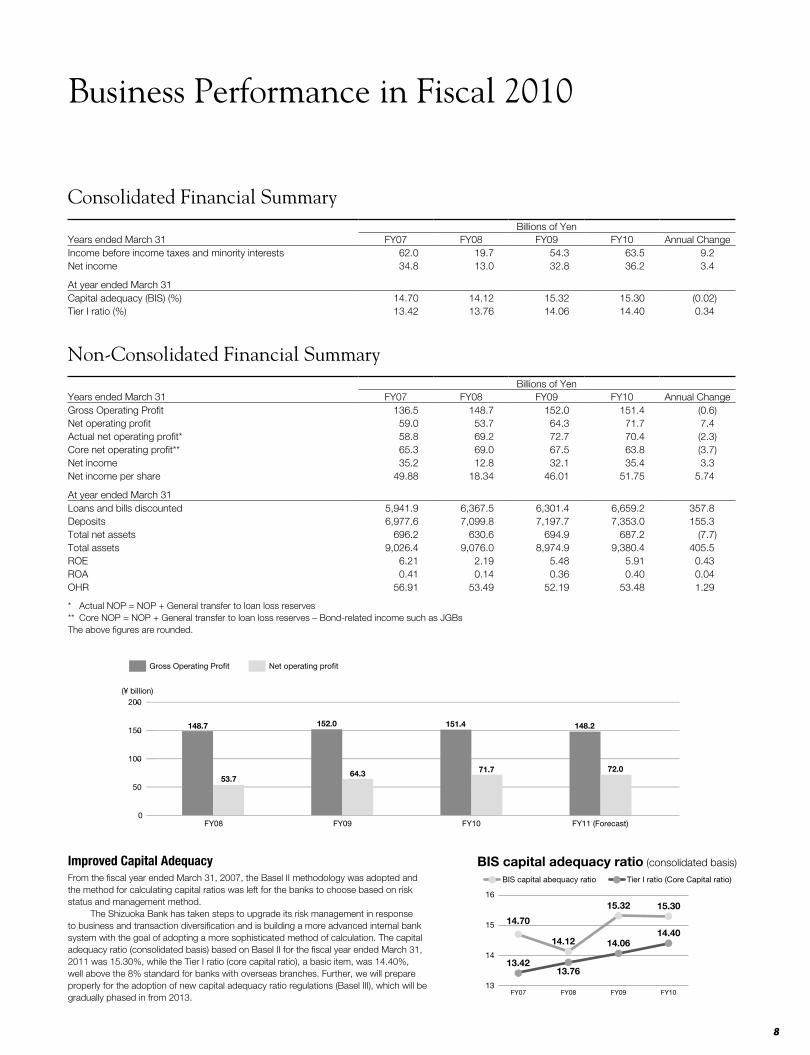
Business Performance in Fiscal 2010
Consolidated Financial SummaryBillions of Yen
Years ended March 31 FY07 FY08 FY09 FY10 Annual ChangeIncome before income taxes and minority interests 62.0 19.7 54.3 63.5 9.2Net income 34.8 13.0 32.8 36.2 3.4
At year ended March 31Capital adequacy (BIS) (%) 14.70 14.12 15.32 15.30 (0.02)Tier I ratio (%) 13.42 13.76 14.06 14.40 0.34
Non-Consolidated Financial SummaryBillions of Yen
Years ended March 31 FY07 FY08 FY09 FY10 Annual ChangeGross Operating Profit 136.5 148.7 152.0 151.4 (0.6)Net operating profit 59.0 53.7 64.3 71.7 7.4Actual net operating profit* 58.8 69.2 72.7 70.4 (2.3)Core net operating profit** 65.3 69.0 67.5 63.8 (3.7)Net income 35.2 12.8 32.1 35.4 3.3Net income per share 49.88 18.34 46.01 51.75 5.74
At year ended March 31Loans and bills discounted 5,941.9 6,367.5 6,301.4 6,659.2 357.8Deposits 6,977.6 7,099.8 7,197.7 7,353.0 155.3Total net assets 696.2 630.6 694.9 687.2 (7.7)Total assets 9,026.4 9,076.0 8,974.9 9,380.4 405.5ROE 6.21 2.19 5.48 5.91 0.43ROA 0.41 0.14 0.36 0.40 0.04OHR 56.91 53.49 52.19 53.48 1.29
* Actual NOP = NOP + General transfer to loan loss reserves** Core NOP = NOP + General transfer to loan loss reserves – Bond-related income such as JGBsThe above figures are rounded.
13
14
15
16
FY07 FY08 FY09 FY10
BIS capital adequacy ratio (consolidated basis)
Tier I ratio (Core Capital ratio)
14.40
15.30
14.12
13.76
15.32
14.06
13.42
14.70
BIS capital abequacy ratio
Improved Capital AdequacyFrom the fiscal year ended March 31, 2007, the Basel II methodology was adopted and the method for calculating capital ratios was left for the banks to choose based on risk status and management method. The Shizuoka Bank has taken steps to upgrade its risk management in response to business and transaction diversification and is building a more advanced internal bank system with the goal of adopting a more sophisticated method of calculation. The capital adequacy ratio (consolidated basis) based on Basel II for the fiscal year ended March 31, 2011 was 15.30%, while the Tier I ratio (core capital ratio), a basic item, was 14.40%, well above the 8% standard for banks with overseas branches. Further, we will prepare properly for the adoption of new capital adequacy ratio regulations (Basel III), which will be gradually phased in from 2013.
100
50
150
200
00
50
100
150
200
0
5050
000000
500050
200000000
Balance of deposits (average; non-consolidated)
FY08 FY09 FY10
(¥ billion)
Gross Operating Pro�t Net operating pro�t
FY11 (Forecast)
148.7
53.7
148.2
72.0
151.4
71.7
152.0
64.3
8
Deposit Services
1,000
2,000
4,000
3,000
5,000
6,000
7,000
00
1001,1,
2002,2,
3003,3,
4004,4,
5005,5,
6006,6,
7007,7,
0
10000000
20000000
30000000
40000000
50000000
60000000
7000000
C
B
A
F
E
DMortgage loans
Unsecured loans
Loan breakdown
Mortgage loans
Unsecured loans
Within Shizuoka Pref.
Other loans Other loans
Note: “Unsecured loans” include loans for car purchase, education expenses and loans taken out using bank cards
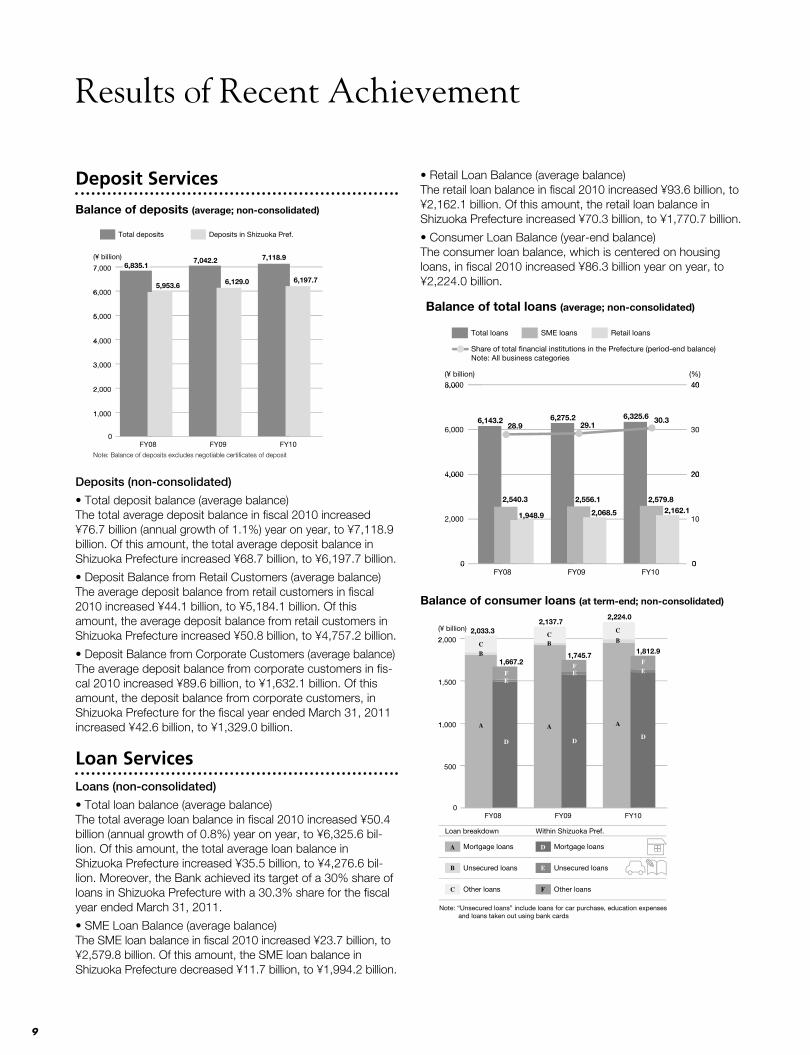
Balance of deposits (average; non-consolidated)
FY08 FY09
(¥ billion)
Total deposits Deposits in Shizuoka Pref.
FY10
6,835.1
5,953.6
7,118.9
6,197.7
Note: Balance of deposits excludes negotiable certi�cates of deposit
7,042.2
6,129.0
Deposits (non-consolidated)
• Total deposit balance (average balance)The total average deposit balance in fiscal 2010 increased ¥76.7 billion (annual growth of 1.1%) year on year, to ¥7,118.9 billion. Of this amount, the total average deposit balance in Shizuoka Prefecture increased ¥68.7 billion, to ¥6,197.7 billion.
• Deposit Balance from Retail Customers (average balance)The average deposit balance from retail customers in fiscal 2010 increased ¥44.1 billion, to ¥5,184.1 billion. Of this amount, the average deposit balance from retail customers in Shizuoka Prefecture increased ¥50.8 billion, to ¥4,757.2 billion.
• Deposit Balance from Corporate Customers (average balance)The average deposit balance from corporate customers in fis-cal 2010 increased ¥89.6 billion, to ¥1,632.1 billion. Of this amount, the deposit balance from corporate customers, in Shizuoka Prefecture for the fiscal year ended March 31, 2011 increased ¥42.6 billion, to ¥1,329.0 billion.
Loan ServicesLoans (non-consolidated)
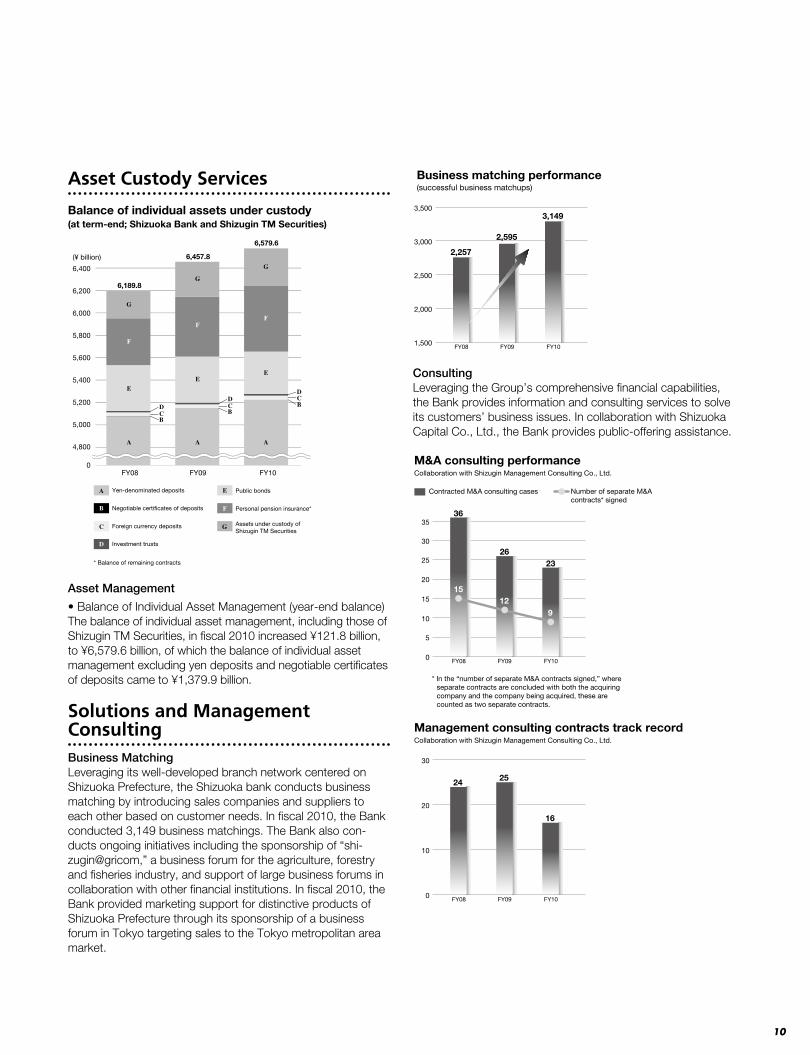
• Total loan balance (average balance)The total average loan balance in fiscal 2010 increased ¥50.4 billion (annual growth of 0.8%) year on year, to ¥6,325.6 bil-lion. Of this amount, the total average loan balance in Shizuoka Prefecture increased ¥35.5 billion, to ¥4,276.6 bil-lion. Moreover, the Bank achieved its target of a 30% share of loans in Shizuoka Prefecture with a 30.3% share for the fiscal year ended March 31, 2011.
• SME Loan Balance (average balance)The SME loan balance in fiscal 2010 increased ¥23.7 billion, to ¥2,579.8 billion. Of this amount, the SME loan balance in Shizuoka Prefecture decreased ¥11.7 billion, to ¥1,994.2 billion.
• Retail Loan Balance (average balance)The retail loan balance in fiscal 2010 increased ¥93.6 billion, to ¥2,162.1 billion. Of this amount, the retail loan balance in Shizuoka Prefecture increased ¥70.3 billion, to ¥1,770.7 billion.
• Consumer Loan Balance (year-end balance)The consumer loan balance, which is centered on housing loans, in fiscal 2010 increased ¥86.3 billion year on year, to ¥2,224.0 billion.
2,000
4,000
6,000
8,000
0
10
20
30
40
00.000000
1333.333333
2666.666667
4000.00000
5333.333333
6666.666667
8000.00000
0.00000000000
1333.3333333333333333
2666.6666676666766667
000 00,000,0000000000004,4,4,4,
5333.3333333333333333
6666.6666676666766667
8,0008,000000000008,8,8,8,
0.00000000000000
1333.33333333333333333
2666.66666676666766667
4000.00000000000000000000000000000000
5333.33333333333333333
6666.6666676666766667
0.0000000000000000000000000
00
2020
4040
C
B
A
F
E
D
2,540.3
28.9 29.130.3
1,948.9
Mortgage loans
Unsecured loans
Loan breakdown
Mortgage loans
Unsecured loans
Within Shizuoka Pref.
Other loans Other loans
Note: “Unsecured loans” include loans for car purchase, education expenses and loans taken out using bank cards
Balance of total loans (average; non-consolidated)
FY08 FY09
(¥ billion) (%)
Total loans SME loans Retail loans
FY10
6,143.2
2,579.82,162.1
6,325.6
2,556.1
2,068.5
6,275.2
Share of total �nancial institutions in the Prefecture (period-end balance) Note: All business categories
900
1,100
1,300
1,500
0
0
(¥ billion)
500
1,000
1,500
2,000
FY08 FY09 FY10
FY04 FY05
(¥ billion)
FY06
0
500
1001,1,
1501,1,
2002,2,
0
5005000
10000000
15005000
20000000
0
500
1000
1500
2000
0
5000
10000
15000
2000
C
B
A
F
F
E
E
D
D
DA
B
C
1,253.7
F
E
A
B
C
1,617.6
1,363.7
A
B
C
1,765.0
F
E
D
1,480.4
1,474.0
1,667.2
A
B
C
FE
D
Balance of consumer loans (at term-end; non-consolidated)
Mortgage loans
Unsecured loans
Loan breakdown
Mortgage loans
Unsecured loans
Within Shizuoka Pref.
Other loans Other loans
Note: “Unsecured loans” include loans for car purchase, education expenses and loans taken out using bank cards
2,033.3
1,812.9
A
B
C
FE
D
2,224.0
1,745.7
A
BC
FE
D
2,137.7
Results of Recent Achievement
9
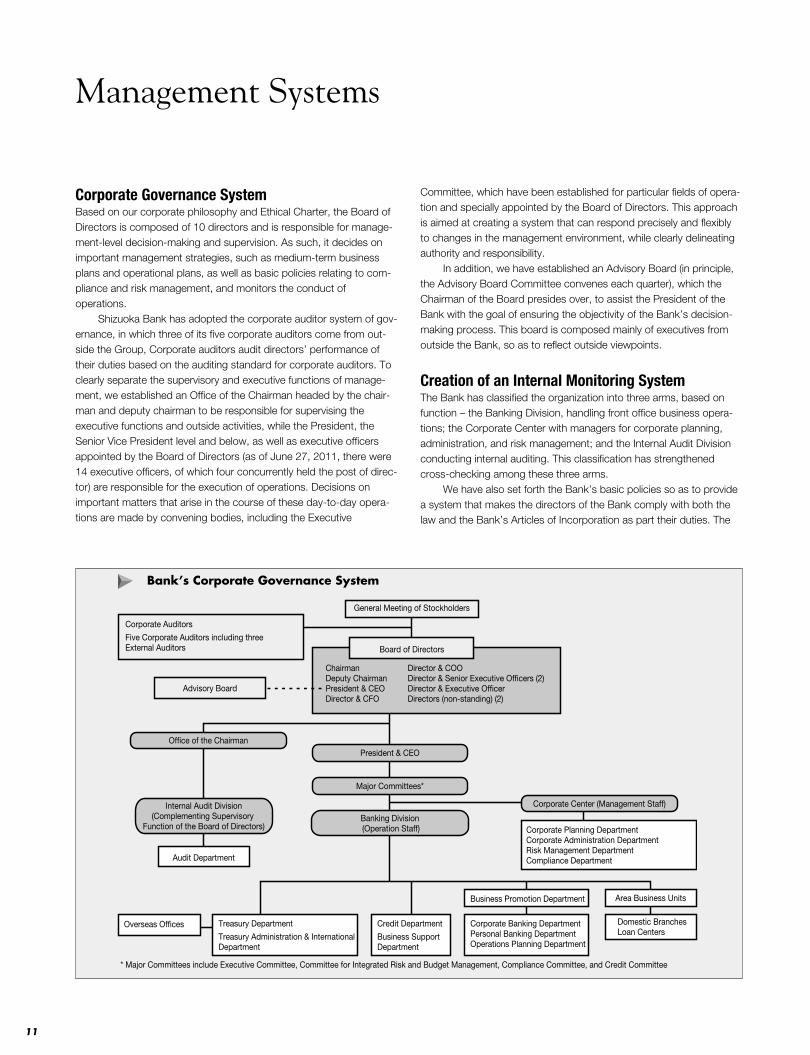
Asset Custody Services
4600
6400
4400
6200
Personal pension insurance*
Foreign currency deposits
Investment trusts
F
F
E
A
G
6,189.8
CD
0
4,800
5,000
5,200
5,400
5,600
5,800
6,000
6,200
6,400
(¥ billion)
Yen-denominated deposits
Assets under custody of Shizugin TM Securities
Negotiable certi�cates of deposits
Public bonds
B
E
F
A
D
C G
B
E
A
G
6,579.6
BCD
Balance of individual assets under custody(at term-end; Shizuoka Bank and Shizugin TM Securities)
FY08 FY09 FY10
* Balance of remaining contracts
F
E
A
G
6,457.8
CD
B
Asset Management
• Balance of Individual Asset Management (year-end balance)The balance of individual asset management, including those of Shizugin TM Securities, in fiscal 2010 increased ¥121.8 billion, to ¥6,579.6 billion, of which the balance of individual asset management excluding yen deposits and negotiable certificates of deposits came to ¥1,379.9 billion.
Solutions and Management ConsultingBusiness MatchingLeveraging its well-developed branch network centered on Shizuoka Prefecture, the Shizuoka bank conducts business matching by introducing sales companies and suppliers to each other based on customer needs. In fiscal 2010, the Bank conducted 3,149 business matchings. The Bank also con-ducts ongoing initiatives including the sponsorship of “shi-zugin@gricom,” a business forum for the agriculture, forestry and fisheries industry, and support of large business forums in collaboration with other financial institutions. In fiscal 2010, the Bank provided marketing support for distinctive products of Shizuoka Prefecture through its sponsorship of a business forum in Tokyo targeting sales to the Tokyo metropolitan area market.
2,500
2,000
1,500
3,000
3,500
FY08 FY09 FY10
Business matching performance
3,149
2,595
2,257
(successful business matchups)
ConsultingLeveraging the Group’s comprehensive financial capabilities, the Bank provides information and consulting services to solve its customers’ business issues. In collaboration with Shizuoka Capital Co., Ltd., the Bank provides public-offering assistance.
5
10
0
15
25
20
30
35
FY08 FY09 FY10
Collaboration with Shizugin Management Consulting Co., Ltd.
M&A consulting performance
Contracted M&A consulting cases Number of separate M&A contracts* signed
2326
36
912
15
* In the “number of separate M&A contracts signed,” where separate contracts are concluded with both the acquiring company and the company being acquired, these are counted as two separate contracts.
10
0
20
30
FY08 FY09 FY10
Management consulting contracts track record
2524
16
Collaboration with Shizugin Management Consulting Co., Ltd.
10
Management Systems
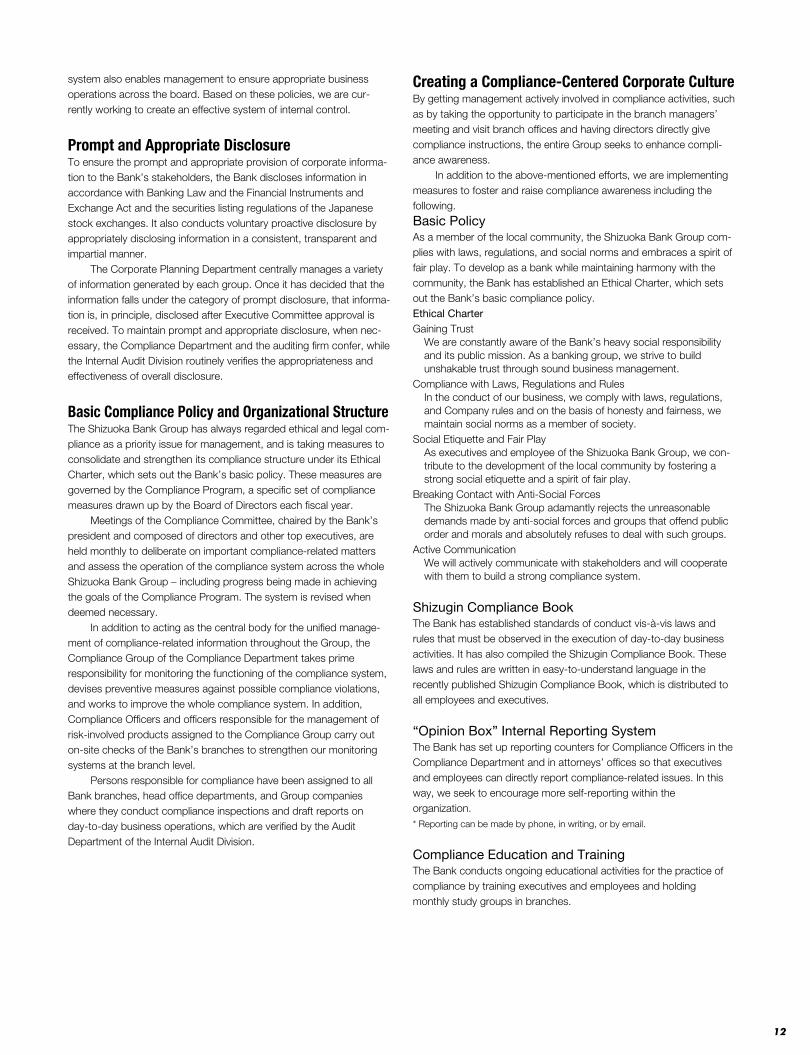
Corporate Governance SystemBased on our corporate philosophy and Ethical Charter, the Board of Directors is composed of 10 directors and is responsible for manage-ment-level decision-making and supervision. As such, it decides on important management strategies, such as medium-term business plans and operational plans, as well as basic policies relating to com-pliance and risk management, and monitors the conduct of operations.
Shizuoka Bank has adopted the corporate auditor system of gov-ernance, in which three of its five corporate auditors come from out-side the Group, Corporate auditors audit directors’ performance of their duties based on the auditing standard for corporate auditors. To clearly separate the supervisory and executive functions of manage-ment, we established an Office of the Chairman headed by the chair-man and deputy chairman to be responsible for supervising the executive functions and outside activities, while the President, the Senior Vice President level and below, as well as executive officers appointed by the Board of Directors (as of June 27, 2011, there were 14 executive officers, of which four concurrently held the post of direc-tor) are responsible for the execution of operations. Decisions on important matters that arise in the course of these day-to-day opera-tions are made by convening bodies, including the Executive
Committee, which have been established for particular fields of opera-tion and specially appointed by the Board of Directors. This approach is aimed at creating a system that can respond precisely and flexibly to changes in the management environment, while clearly delineating authority and responsibility.
In addition, we have established an Advisory Board (in principle, the Advisory Board Committee convenes each quarter), which the Chairman of the Board presides over, to assist the President of the Bank with the goal of ensuring the objectivity of the Bank’s decision-making process. This board is composed mainly of executives from outside the Bank, so as to reflect outside viewpoints.
Creation of an Internal Monitoring SystemThe Bank has classified the organization into three arms, based on function – the Banking Division, handling front office business opera-tions; the Corporate Center with managers for corporate planning, administration, and risk management; and the Internal Audit Division conducting internal auditing. This classification has strengthened cross-checking among these three arms. We have also set forth the Bank’s basic policies so as to provide a system that makes the directors of the Bank comply with both the law and the Bank’s Articles of Incorporation as part their duties. The
General Meeting of Stockholders
Chairman Deputy Chairman President & CEODirector & CFO
Director & COODirector & Senior Executive Of�cers (2) Director & Executive Of�cerDirectors (non-standing) (2)
Board of Directors
Credit Department
Business Support Department
Treasury Department
Treasury Administration & International Department
Area Business Units
Domestic BranchesLoan Centers
Overseas Of�ces
Business Promotion Department
Corporate Banking DepartmentPersonal Banking DepartmentOperations Planning Department
Banking Division (Operation Staff)
Of�ce of the Chairman
Major Committees*
Audit Department
* Major Committees include Executive Committee, Committee for Integrated Risk and Budget Management, Compliance Committee, and Credit Committee
Internal Audit Division(Complementing Supervisory
Function of the Board of Directors) Corporate Planning DepartmentCorporate Administration DepartmentRisk Management DepartmentCompliance Department
Corporate Center (Management Staff)
Bank’s Corporate Governance System
Corporate Auditors
Five Corporate Auditors including three External Auditors
Advisory Board
President & CEO
11
system also enables management to ensure appropriate business operations across the board. Based on these policies, we are cur-rently working to create an effective system of internal control.
Prompt and Appropriate DisclosureTo ensure the prompt and appropriate provision of corporate informa-tion to the Bank’s stakeholders, the Bank discloses information in accordance with Banking Law and the Financial Instruments and Exchange Act and the securities listing regulations of the Japanese stock exchanges. It also conducts voluntary proactive disclosure by appropriately disclosing information in a consistent, transparent and impartial manner. The Corporate Planning Department centrally manages a variety of information generated by each group. Once it has decided that the information falls under the category of prompt disclosure, that informa-tion is, in principle, disclosed after Executive Committee approval is received. To maintain prompt and appropriate disclosure, when nec-essary, the Compliance Department and the auditing firm confer, while the Internal Audit Division routinely verifies the appropriateness and effectiveness of overall disclosure.
Basic Compliance Policy and Organizational StructureThe Shizuoka Bank Group has always regarded ethical and legal com-pliance as a priority issue for management, and is taking measures to consolidate and strengthen its compliance structure under its Ethical Charter, which sets out the Bank’s basic policy. These measures are governed by the Compliance Program, a specific set of compliance measures drawn up by the Board of Directors each fiscal year. Meetings of the Compliance Committee, chaired by the Bank’s president and composed of directors and other top executives, are held monthly to deliberate on important compliance-related matters and assess the operation of the compliance system across the whole Shizuoka Bank Group – including progress being made in achieving the goals of the Compliance Program. The system is revised when deemed necessary. In addition to acting as the central body for the unified manage-ment of compliance-related information throughout the Group, the Compliance Group of the Compliance Department takes prime responsibility for monitoring the functioning of the compliance system, devises preventive measures against possible compliance violations, and works to improve the whole compliance system. In addition, Compliance Officers and officers responsible for the management of risk-involved products assigned to the Compliance Group carry out on-site checks of the Bank’s branches to strengthen our monitoring systems at the branch level. Persons responsible for compliance have been assigned to all Bank branches, head office departments, and Group companies where they conduct compliance inspections and draft reports on day-to-day business operations, which are verified by the Audit Department of the Internal Audit Division.
Creating a Compliance-Centered Corporate CultureBy getting management actively involved in compliance activities, such as by taking the opportunity to participate in the branch managers’ meeting and visit branch offices and having directors directly give compliance instructions, the entire Group seeks to enhance compli-ance awareness. In addition to the above-mentioned efforts, we are implementing measures to foster and raise compliance awareness including the following.
Basic PolicyAs a member of the local community, the Shizuoka Bank Group com-plies with laws, regulations, and social norms and embraces a spirit of fair play. To develop as a bank while maintaining harmony with the community, the Bank has established an Ethical Charter, which sets out the Bank’s basic compliance policy. Ethical CharterGaining Trust
We are constantly aware of the Bank’s heavy social responsibility and its public mission. As a banking group, we strive to build unshakable trust through sound business management.
Compliance with Laws, Regulations and RulesIn the conduct of our business, we comply with laws, regulations, and Company rules and on the basis of honesty and fairness, we maintain social norms as a member of society.
Social Etiquette and Fair PlayAs executives and employee of the Shizuoka Bank Group, we con-tribute to the development of the local community by fostering a strong social etiquette and a spirit of fair play.
Breaking Contact with Anti-Social ForcesThe Shizuoka Bank Group adamantly rejects the unreasonable demands made by anti-social forces and groups that offend public order and morals and absolutely refuses to deal with such groups.
Active CommunicationWe will actively communicate with stakeholders and will cooperate with them to build a strong compliance system.
Shizugin Compliance BookThe Bank has established standards of conduct vis-à-vis laws and rules that must be observed in the execution of day-to-day business activities. It has also compiled the Shizugin Compliance Book. These laws and rules are written in easy-to-understand language in the recently published Shizugin Compliance Book, which is distributed to all employees and executives.
“Opinion Box” Internal Reporting SystemThe Bank has set up reporting counters for Compliance Officers in the Compliance Department and in attorneys’ offices so that executives and employees can directly report compliance-related issues. In this way, we seek to encourage more self-reporting within the organization.* Reporting can be made by phone, in writing, or by email.
Compliance Education and TrainingThe Bank conducts ongoing educational activities for the practice of compliance by training executives and employees and holding monthly study groups in branches.
12
Risk Management Systems
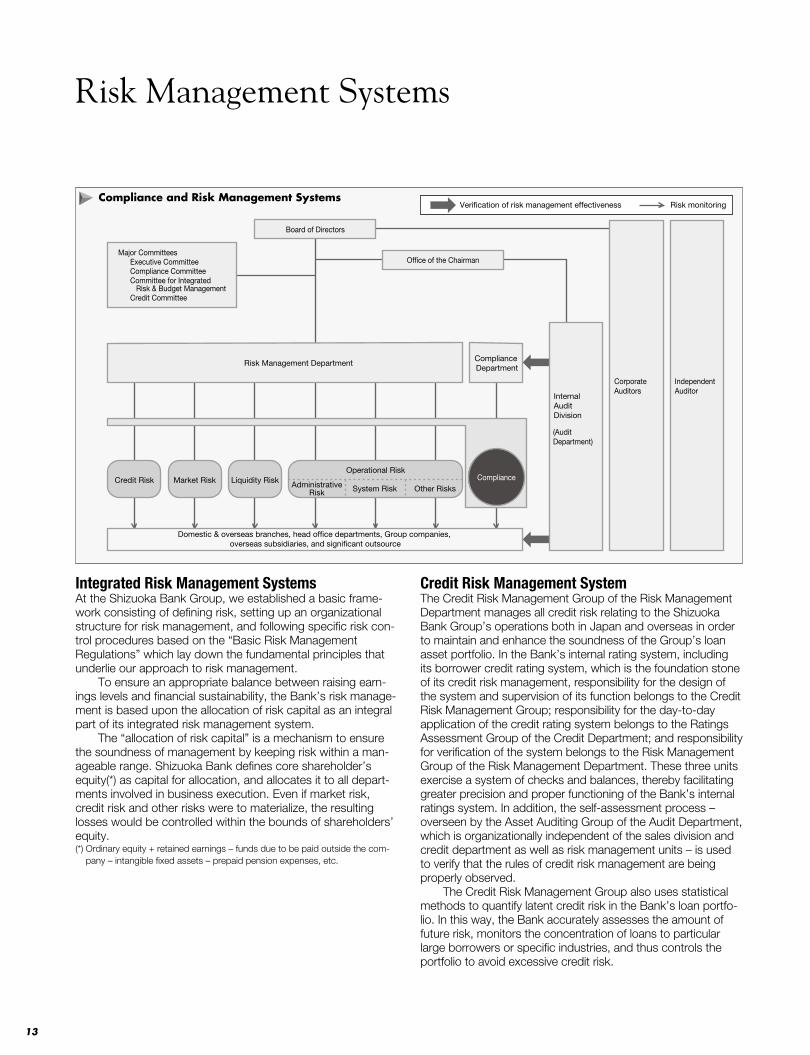
Integrated Risk Management SystemsAt the Shizuoka Bank Group, we established a basic frame-work consisting of defining risk, setting up an organizational structure for risk management, and following specific risk con-trol procedures based on the “Basic Risk Management Regulations” which lay down the fundamental principles that underlie our approach to risk management. To ensure an appropriate balance between raising earn-ings levels and financial sustainability, the Bank’s risk manage-ment is based upon the allocation of risk capital as an integral part of its integrated risk management system. The “allocation of risk capital” is a mechanism to ensure the soundness of management by keeping risk within a man-ageable range. Shizuoka Bank defines core shareholder’s equity(*) as capital for allocation, and allocates it to all depart-ments involved in business execution. Even if market risk, credit risk and other risks were to materialize, the resulting losses would be controlled within the bounds of shareholders’ equity.(*) Ordinary equity + retained earnings – funds due to be paid outside the com-
pany – intangible fixed assets – prepaid pension expenses, etc.
Credit Risk Management SystemThe Credit Risk Management Group of the Risk Management Department manages all credit risk relating to the Shizuoka Bank Group’s operations both in Japan and overseas in order to maintain and enhance the soundness of the Group’s loan asset portfolio. In the Bank’s internal rating system, including its borrower credit rating system, which is the foundation stone of its credit risk management, responsibility for the design of the system and supervision of its function belongs to the Credit Risk Management Group; responsibility for the day-to-day application of the credit rating system belongs to the Ratings Assessment Group of the Credit Department; and responsibility for verification of the system belongs to the Risk Management Group of the Risk Management Department. These three units exercise a system of checks and balances, thereby facilitating greater precision and proper functioning of the Bank’s internal ratings system. In addition, the self-assessment process – overseen by the Asset Auditing Group of the Audit Department, which is organizationally independent of the sales division and credit department as well as risk management units – is used to verify that the rules of credit risk management are being properly observed. The Credit Risk Management Group also uses statistical methods to quantify latent credit risk in the Bank’s loan portfo-lio. In this way, the Bank accurately assesses the amount of future risk, monitors the concentration of loans to particular large borrowers or specific industries, and thus controls the portfolio to avoid excessive credit risk.
Compliance Group
Major Committees Executive Committee Compliance Committee Committee for Integrated Risk & Budget Management Credit Committee
Credit Risk Market Risk Liquidity RiskOperational Risk
Administrative Risk System Risk Other Risks
Domestic & overseas branches, head of�ce departments, Group companies, overseas subsidiaries, and signi�cant outsource
Board of Directors
Of�ce of the Chairman
Compliance
Compliance and Risk Management Systems
Independent Auditor
Corporate Auditors
Internal AuditDivision
(AuditDepartment)
Risk Management DepartmentCompliance Department
Veri�cation of risk management effectiveness Risk monitoring
13
Borrowers’ Credit Rating SystemThe Shizuoka Bank Group employs a borrowers’ credit rating system to gain an accurate picture of the creditworthiness of borrowers and ensure meticulous credit risk management. Borrowers are rated on a scale of 1 to 12 according to finan-cial indicators, including the borrowers’ financial standing and cash flows. To keep the ratings objective, we place more weight on quantitative information in this system. Borrowers’ credit ratings form the basis for classification in self-assessment, which is implemented as part of capital ratio calculations based on the Banking Act. They are also widely used as a standard for calculating the general reserve for possi-ble loan losses, and as a standard for the management of prob-lem loans. In principle, the Bank assigns borrower ratings to all borrow-ers and routinely reviews these ratings each year based on the borrowers’ financial statements and other relevant data. In the event that it becomes necessary to change the rating, a review will be conducted as needed. By monitoring the current financial status of borrowers, we can improve our screening ability.
Market Risk Management SystemIn market transactions, the Shizuoka Bank Group limits the amount of risk capital allocated as well as sets various restric-tions, such as on gains or losses from valuation of investment securities, and on the amount of exposure or loss depending upon the risk profile of each transaction or financial instrument. In this way, we keep market risk within certain defined levels. For banking account transactions, especially deposits, loans, and investment securities, the ALM group of the Corporate Planning Department formulates the hedging poli-cies based on current risk conditions and on the outlook for interest rates so as to keep risk volume within a certain range, and discusses these policies at the Committee for Integrated Risk and Budget Management. The organization of the market divisions is strictly divided between departments conducting transactions (front office: Treasury Department) and administrative and control depart-ments (back office: Treasury Administration & International Department, Treasury & International Operations Center). In addition, an independent risk management department (mid-dle office: Risk Management Department, Risk Management Group) that provides for mutual checks and balances has been established. Moreover, the effectiveness of the mutual checks and balances between these three departments is ver-ified through inspections by the Audit Department, which is independent of the departments responsible for executing transactions.
Liquidity Risk Management SystemThe Shizuoka Bank Group has established separate yen and foreign currency-denominated financing management depart-ments (Treasury Department, Fund & Foreign Exchange Group, Treasury Administration & International Department, Treasury & International Operations Center etc.), and has established a liquidity risk management department (Risk Management Department, Risk Management Group) that is entirely inde-pendent of the financing management departments. In this way, we set up a system that provides mutual checks and bal-ances. The Fund & Foreign Exchange Group of the Treasury Department, which is one of the financing management departments, controls fundraising requirements within procura-ble levels to avoid excessive fundraising. We also conduct sta-ble fund management activities, paying close attention to
market conditions. Moreover, the liquidity risk management department monitors the status of financing management departments and assesses the stability of the assets-liabilities structure. To handle unforeseen circumstances, emergency fundrais-ing management is divided into four stages: “Stage 1 (preven-tive stage)”; “Stage 2 (attention required stage)”; “Stage 3 (liquidity concern stage)”; and “Stage 4 (insufficient liquidity stage)”; with each stage having its own person in charge and predefined countermeasures, thereby forming a structure capable of swiftly responding to issues should they arise. As for market liquidity risk, the liquidity risk management department routinely monitors the status of highly liquid asset holdings that can be easily monetized. The front office addresses market liquidity risk by selecting investment assets based on their liquidity and setting limits on specific stocks and holding periods.
Operational Risk Management SystemEach risk category is managed by a dedicated unit of the Bank, while the Operational Risk Management Group of the Risk Management Department is the central unit responsible for overseeing and managing operational risk throughout the entire Shizuoka Bank Group. In line with our basic policies on operational risk management, we are taking steps to strengthen our operational risk management system through a range of measures including the compilation and analysis of internal loss data and the implementation of a risk control self-assessment. The effectiveness of this risk management sys-tem is verified by on-site audits conducted by the Audit Department, which is organizationally independent from any of the units that it audits.
Business Continuity PlanBecause of the highly public nature of banking services, such as the withdrawing of deposits and account settlement, there are strong demands for banks to ensure business continuity as a fulfillment of their social responsibility. To prepare itself against an outbreak of a state of emer-gency, the Shizuoka Bank has established the Contingency Plan as its business continuity plan. The Plan enables the Bank to continually carry out its critically important operations or to resume them as soon as possible after an interruption, even in the case of a major natural disaster like the Tokai earthquake, which had been predicted as Suruga Bay is a seismic center, or an outbreak of a highly dangerous new strain of bird influenza. When necessary, the Bank reviews its disaster counter-measures, such as responding to stronger tsunami counter-measures in the wake of the massive tsunami that the struck coastal area, particularly in the Tohoku Region, as a result of the Great East Japan Earthquake of March 2011. In addition to making our computer and training centers and some of our branches earthquake-proof, and reinforcing the earthquake-resistance of some of our buildings, we have installed uninterruptible power supplies (UPS) and private power generation equipment. We have also installed a wide range of disaster prevention countermeasure equipment including telecommunications equipment for emergent situa-tions, a duplicate communications network and a backup sys-tem, which ensures that we will be able to resume business soon after disaster strikes. In addition, as a more practical measure, we routinely carry out disaster drills, backup center operation drills and other drills based on the Contingency Plan.
14
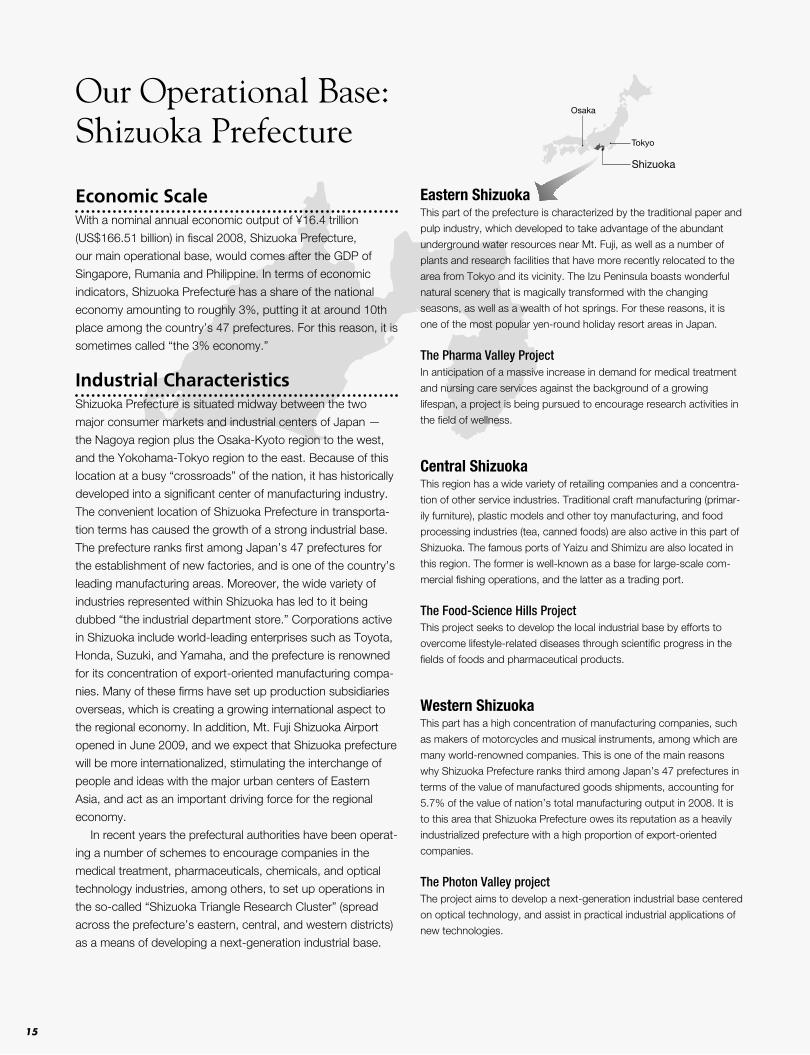
Tokyo
Shizuoka
Osaka
Economic ScaleWith a nominal annual economic output of ¥16.4 trillion
(US$166.51 billion) in fiscal 2008, Shizuoka Prefecture,
our main operational base, would comes after the GDP of
Singapore, Rumania and Philippine. In terms of economic
indicators, Shizuoka Prefecture has a share of the national
economy amounting to roughly 3%, putting it at around 10th
place among the country’s 47 prefectures. For this reason, it is
sometimes called “the 3% economy.”
Industrial CharacteristicsShizuoka Prefecture is situated midway between the two
major consumer markets and industrial centers of Japan —
the Nagoya region plus the Osaka-Kyoto region to the west,
and the Yokohama-Tokyo region to the east. Because of this
location at a busy “crossroads” of the nation, it has historically
developed into a significant center of manufacturing industry.
The convenient location of Shizuoka Prefecture in transporta-
tion terms has caused the growth of a strong industrial base.
The prefecture ranks first among Japan’s 47 prefectures for
the establishment of new factories, and is one of the country’s
leading manufacturing areas. Moreover, the wide variety of
industries represented within Shizuoka has led to it being
dubbed “the industrial department store.” Corporations active
in Shizuoka include world-leading enterprises such as Toyota,
Honda, Suzuki, and Yamaha, and the prefecture is renowned
for its concentration of export-oriented manufacturing compa-
nies. Many of these firms have set up production subsidiaries
overseas, which is creating a growing international aspect to
the regional economy. In addition, Mt. Fuji Shizuoka Airport
opened in June 2009, and we expect that Shizuoka prefecture
will be more internationalized, stimulating the interchange of
people and ideas with the major urban centers of Eastern
Asia, and act as an important driving force for the regional
economy.
In recent years the prefectural authorities have been operat-
ing a number of schemes to encourage companies in the
medical treatment, pharmaceuticals, chemicals, and optical
technology industries, among others, to set up operations in
the so-called “Shizuoka Triangle Research Cluster” (spread
across the prefecture’s eastern, central, and western districts)
as a means of developing a next-generation industrial base.
Eastern ShizuokaThis part of the prefecture is characterized by the traditional paper and
pulp industry, which developed to take advantage of the abundant
underground water resources near Mt. Fuji, as well as a number of
plants and research facilities that have more recently relocated to the
area from Tokyo and its vicinity. The Izu Peninsula boasts wonderful
natural scenery that is magically transformed with the changing
seasons, as well as a wealth of hot springs. For these reasons, it is
one of the most popular yen-round holiday resort areas in Japan.
The Pharma Valley ProjectIn anticipation of a massive increase in demand for medical treatment
and nursing care services against the background of a growing
lifespan, a project is being pursued to encourage research activities in
the field of wellness.
Central ShizuokaThis region has a wide variety of retailing companies and a concentra-
tion of other service industries. Traditional craft manufacturing (primar-
ily furniture), plastic models and other toy manufacturing, and food
processing industries (tea, canned foods) are also active in this part of
Shizuoka. The famous ports of Yaizu and Shimizu are also located in
this region. The former is well-known as a base for large-scale com-
mercial fishing operations, and the latter as a trading port.
The Food-Science Hills ProjectThis project seeks to develop the local industrial base by efforts to
overcome lifestyle-related diseases through scientific progress in the
fields of foods and pharmaceutical products.
Western ShizuokaThis part has a high concentration of manufacturing companies, such
as makers of motorcycles and musical instruments, among which are
many world-renowned companies. This is one of the main reasons
why Shizuoka Prefecture ranks third among Japan’s 47 prefectures in
terms of the value of manufactured goods shipments, accounting for
5.7% of the value of nation’s total manufacturing output in 2008. It is
to this area that Shizuoka Prefecture owes its reputation as a heavily
industrialized prefecture with a high proportion of export-oriented
companies.
The Photon Valley projectThe project aims to develop a next-generation industrial base centered
on optical technology, and assist in practical industrial applications of
new technologies.
Our Operational Base:Shizuoka Prefecture
15
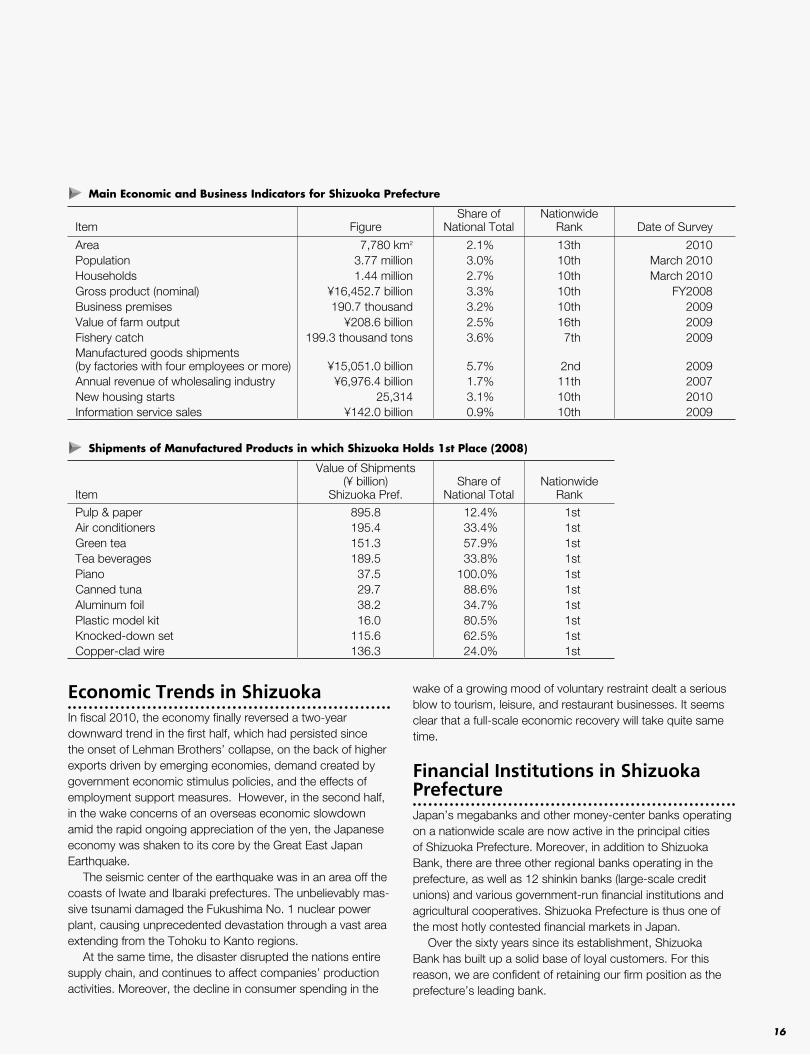
Shipments of Manufactured Products in which Shizuoka Holds 1st Place (2008)
Main Economic and Business Indicators for Shizuoka Prefecture
Economic Trends in ShizuokaIn fiscal 2010, the economy finally reversed a two-year downward trend in the first half, which had persisted since the onset of Lehman Brothers’ collapse, on the back of higher exports driven by emerging economies, demand created by government economic stimulus policies, and the effects of employment support measures. However, in the second half, in the wake concerns of an overseas economic slowdown amid the rapid ongoing appreciation of the yen, the Japanese economy was shaken to its core by the Great East Japan Earthquake. The seismic center of the earthquake was in an area off the coasts of Iwate and Ibaraki prefectures. The unbelievably mas-sive tsunami damaged the Fukushima No. 1 nuclear power plant, causing unprecedented devastation through a vast area extending from the Tohoku to Kanto regions. At the same time, the disaster disrupted the nations entire supply chain, and continues to affect companies’ production activities. Moreover, the decline in consumer spending in the
wake of a growing mood of voluntary restraint dealt a serious blow to tourism, leisure, and restaurant businesses. It seems clear that a full-scale economic recovery will take quite same time.
Financial Institutions in Shizuoka PrefectureJapan’s megabanks and other money-center banks operating on a nationwide scale are now active in the principal cities of Shizuoka Prefecture. Moreover, in addition to Shizuoka Bank, there are three other regional banks operating in the prefecture, as well as 12 shinkin banks (large-scale credit unions) and various government-run financial institutions and agricultural cooperatives. Shizuoka Prefecture is thus one of the most hotly contested financial markets in Japan. Over the sixty years since its establishment, Shizuoka Bank has built up a solid base of loyal customers. For this reason, we are confident of retaining our firm position as the prefecture’s leading bank.
Item
Value of Shipments(¥ billion)
Shizuoka Pref.Share of
National Total
Nationwide
Rank
Pulp & paper 895.8 12.4% 1stAir conditioners 195.4 33.4% 1stGreen tea 151.3 57.9% 1stTea beverages 189.5 33.8% 1stPiano 37.5 100.0% 1stCanned tuna 29.7 88.6% 1stAluminum foil 38.2 34.7% 1stPlastic model kit 16.0 80.5% 1stKnocked-down set 115.6 62.5% 1stCopper-clad wire 136.3 24.0% 1st
Item FigureShare of
National TotalNationwide
Rank Date of Survey
Area 7,780 km2 2.1% 13th 2010Population 3.77 million 3.0% 10th March 2010Households 1.44 million 2.7% 10th March 2010Gross product (nominal) ¥16,452.7 billion 3.3% 10th FY2008Business premises 190.7 thousand 3.2% 10th 2009Value of farm output ¥208.6 billion 2.5% 16th 2009Fishery catch 199.3 thousand tons 3.6% 7th 2009Manufactured goods shipments (by factories with four employees or more) ¥15,051.0 billion 5.7% 2nd 2009Annual revenue of wholesaling industry ¥6,976.4 billion 1.7% 11th 2007New housing starts 25,314 3.1% 10th 2010Information service sales ¥142.0 billion 0.9% 10th 2009
16
17
18
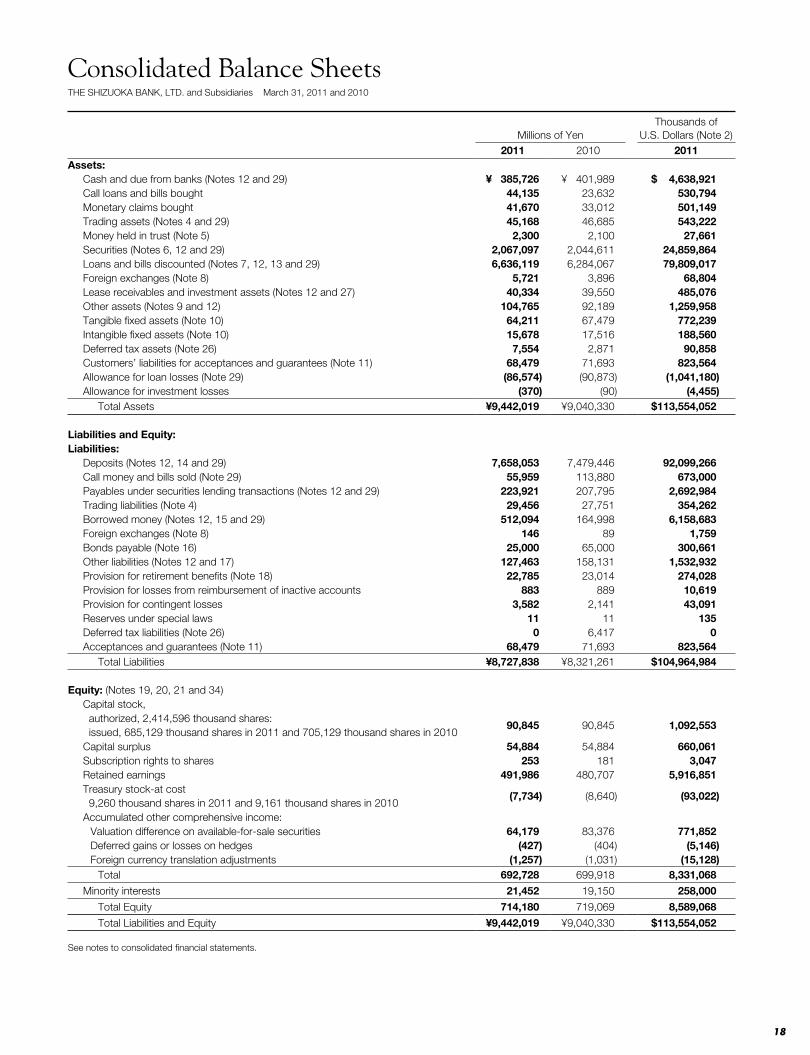
Consolidated Balance SheetsTHE SHIZUOKA BANK, LTD. and Subsidiaries March 31, 2011 and 2010
Millions of Yen
Thousands of U.S. Dollars (Note 2)
2011 2010 2011Assets:
Cash and due from banks (Notes 12 and 29) ¥ 385,726 ¥ 401,989 $ 4,638,921 Call loans and bills bought 44,135 23,632 530,794 Monetary claims bought 41,670 33,012 501,149 Trading assets (Notes 4 and 29) 45,168 46,685 543,222 Money held in trust (Note 5) 2,300 2,100 27,661 Securities (Notes 6, 12 and 29) 2,067,097 2,044,611 24,859,864 Loans and bills discounted (Notes 7, 12, 13 and 29) 6,636,119 6,284,067 79,809,017 Foreign exchanges (Note 8) 5,721 3,896 68,804 Lease receivables and investment assets (Notes 12 and 27) 40,334 39,550 485,076 Other assets (Notes 9 and 12) 104,765 92,189 1,259,958 Tangible fixed assets (Note 10) 64,211 67,479 772,239 Intangible fixed assets (Note 10) 15,678 17,516 188,560 Deferred tax assets (Note 26) 7,554 2,871 90,858 Customers’ liabilities for acceptances and guarantees (Note 11) 68,479 71,693 823,564 Allowance for loan losses (Note 29) (86,574) (90,873) (1,041,180)Allowance for investment losses (370) (90) (4,455)
Total Assets ¥9,442,019 ¥9,040,330 $113,554,052
Liabilities and Equity:Liabilities:
Deposits (Notes 12, 14 and 29) 7,658,053 7,479,446 92,099,266 Call money and bills sold (Note 29) 55,959 113,880 673,000 Payables under securities lending transactions (Notes 12 and 29) 223,921 207,795 2,692,984 Trading liabilities (Note 4) 29,456 27,751 354,262 Borrowed money (Notes 12, 15 and 29) 512,094 164,998 6,158,683 Foreign exchanges (Note 8) 146 89 1,759 Bonds payable (Note 16) 25,000 65,000 300,661 Other liabilities (Notes 12 and 17) 127,463 158,131 1,532,932 Provision for retirement benefits (Note 18) 22,785 23,014 274,028 Provision for losses from reimbursement of inactive accounts 883 889 10,619 Provision for contingent losses 3,582 2,141 43,091 Reserves under special laws 11 11 135 Deferred tax liabilities (Note 26) 0 6,417 0 Acceptances and guarantees (Note 11) 68,479 71,693 823,564
Total Liabilities ¥8,727,838 ¥8,321,261 $104,964,984
Equity: (Notes 19, 20, 21 and 34)Capital stock, authorized, 2,414,596 thousand shares: issued, 685,129 thousand shares in 2011 and 705,129 thousand shares in 2010
90,845 90,845 1,092,553
Capital surplus 54,884 54,884 660,061 Subscription rights to shares 253 181 3,047 Retained earnings 491,986 480,707 5,916,851 Treasury stock-at cost 9,260 thousand shares in 2011 and 9,161 thousand shares in 2010
(7,734) (8,640) (93,022)
Accumulated other comprehensive income:Valuation difference on available-for-sale securities 64,179 83,376 771,852 Deferred gains or losses on hedges (427) (404) (5,146)Foreign currency translation adjustments (1,257) (1,031) (15,128)
Total 692,728 699,918 8,331,068
Minority interests 21,452 19,150 258,000
Total Equity 714,180 719,069 8,589,068
Total Liabilities and Equity ¥9,442,019 ¥9,040,330 $113,554,052
See notes to consolidated financial statements.
19
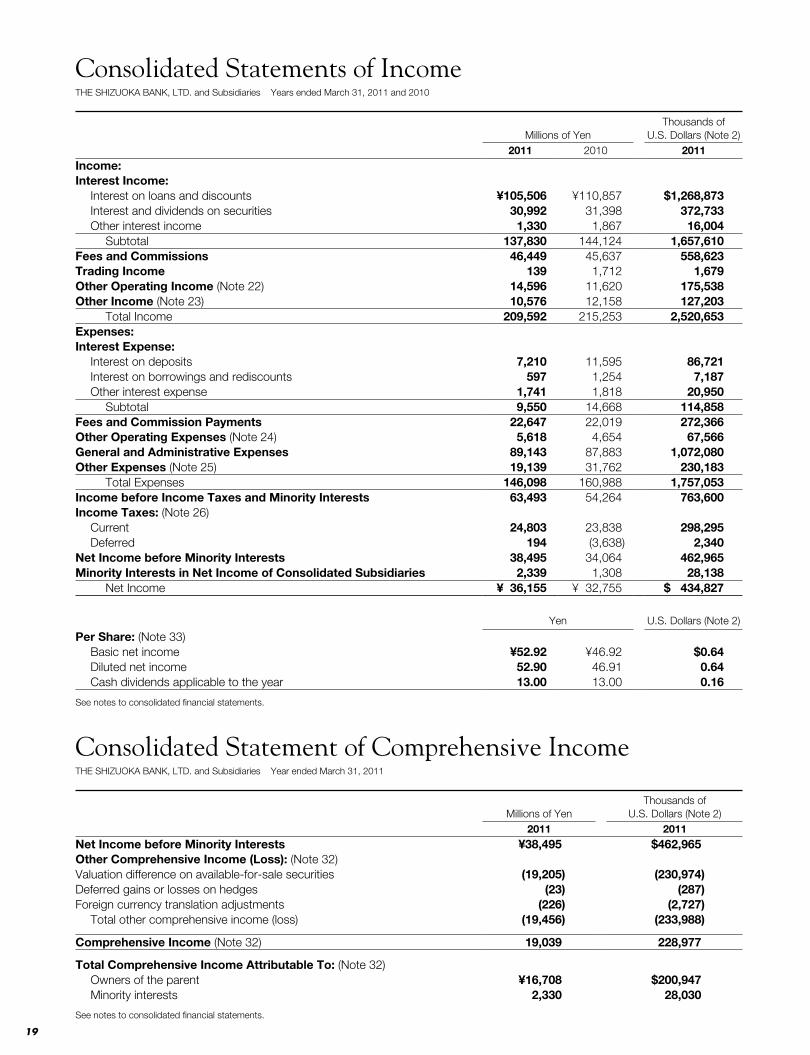
Consolidated Statements of IncomeTHE SHIZUOKA BANK, LTD. and Subsidiaries Years ended March 31, 2011 and 2010
Consolidated Statement of Comprehensive IncomeTHE SHIZUOKA BANK, LTD. and Subsidiaries Year ended March 31, 2011
Millions of Yen
Thousands of U.S. Dollars (Note 2)
2011 2010 2011Income:Interest Income:
Interest on loans and discounts ¥105,506 ¥110,857 $1,268,873 Interest and dividends on securities 30,992 31,398 372,733 Other interest income 1,330 1,867 16,004
Subtotal 137,830 144,124 1,657,610 Fees and Commissions 46,449 45,637 558,623 Trading Income 139 1,712 1,679 Other Operating Income (Note 22) 14,596 11,620 175,538 Other Income (Note 23) 10,576 12,158 127,203
Total Income 209,592 215,253 2,520,653 Expenses:Interest Expense:
Interest on deposits 7,210 11,595 86,721 Interest on borrowings and rediscounts 597 1,254 7,187 Other interest expense 1,741 1,818 20,950
Subtotal 9,550 14,668 114,858 Fees and Commission Payments 22,647 22,019 272,366 Other Operating Expenses (Note 24) 5,618 4,654 67,566 General and Administrative Expenses 89,143 87,883 1,072,080 Other Expenses (Note 25) 19,139 31,762 230,183
Total Expenses 146,098 160,988 1,757,053 Income before Income Taxes and Minority Interests 63,493 54,264 763,600Income Taxes: (Note 26)
Current 24,803 23,838 298,295Deferred 194 (3,638) 2,340
Net Income before Minority Interests 38,495 34,064 462,965 Minority Interests in Net Income of Consolidated Subsidiaries 2,339 1,308 28,138
Net Income ¥ 36,155 ¥ 32,755 $ 434,827
Yen U.S. Dollars (Note 2)
Per Share: (Note 33)Basic net income ¥52.92 ¥46.92 $0.64 Diluted net income 52.90 46.91 0.64 Cash dividends applicable to the year 13.00 13.00 0.16
See notes to consolidated financial statements.
Millions of Yen
Thousands of U.S. Dollars (Note 2)
2011 2011Net Income before Minority Interests ¥38,495 $462,965 Other Comprehensive Income (Loss): (Note 32)Valuation difference on available-for-sale securities (19,205) (230,974)Deferred gains or losses on hedges (23) (287)Foreign currency translation adjustments (226) (2,727)
Total other comprehensive income (loss) (19,456) (233,988)
Comprehensive Income (Note 32) 19,039 228,977
Total Comprehensive Income Attributable To: (Note 32)Owners of the parent ¥16,708 $200,947 Minority interests 2,330 28,030
See notes to consolidated financial statements.
20
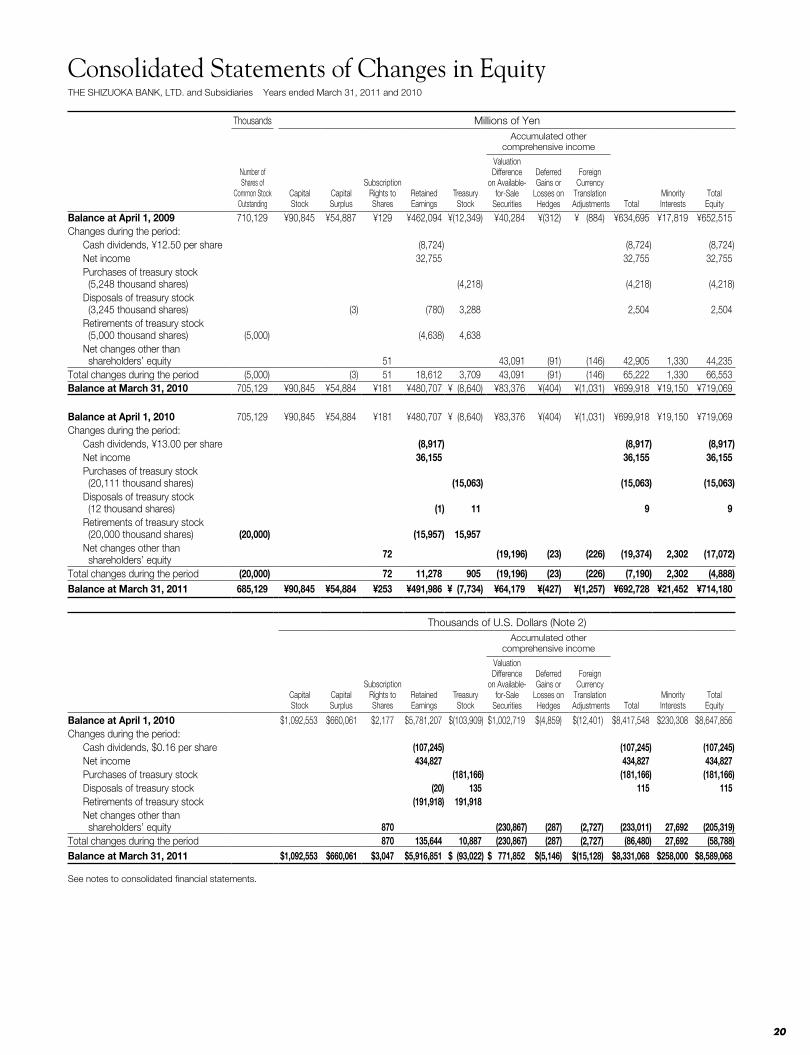
Consolidated Statements of Changes in EquityTHE SHIZUOKA BANK, LTD. and Subsidiaries Years ended March 31, 2011 and 2010
Thousands Millions of YenAccumulated other
comprehensive income
Number of Shares of
Common StockOutstanding
CapitalStock
CapitalSurplus
SubscriptionRights to Shares
Retained Earnings
Treasury Stock
Valuation Difference
on Available-for-Sale
Securities
Deferred Gains or
Losses on Hedges
Foreign Currency
Translation Adjustments Total
Minority Interests
TotalEquity
Balance at April 1, 2009 710,129 ¥90,845 ¥54,887 ¥129 ¥462,094 ¥(12,349) ¥40,284 ¥(312) ¥ (884) ¥634,695 ¥17,819 ¥652,515Changes during the period:
Cash dividends, ¥12.50 per share (8,724) (8,724) (8,724)Net income 32,755 32,755 32,755 Purchases of treasury stock (5,248 thousand shares) (4,218) (4,218) (4,218) Disposals of treasury stock (3,245 thousand shares) (3) (780) 3,288 2,504 2,504Retirements of treasury stock (5,000 thousand shares) (5,000) (4,638) 4,638 Net changes other than shareholders’ equity 51 43,091 (91) (146) 42,905 1,330 44,235
Total changes during the period (5,000) (3) 51 18,612 3,709 43,091 (91) (146) 65,222 1,330 66,553Balance at March 31, 2010 705,129 ¥90,845 ¥54,884 ¥181 ¥480,707 ¥ (8,640) ¥83,376 ¥(404) ¥(1,031) ¥699,918 ¥19,150 ¥719,069
Balance at April 1, 2010 705,129 ¥90,845 ¥54,884 ¥181 ¥480,707 ¥ (8,640) ¥83,376 ¥(404) ¥(1,031) ¥699,918 ¥19,150 ¥719,069Changes during the period:
Cash dividends, ¥13.00 per share (8,917) (8,917) (8,917)Net income 36,155 36,155 36,155 Purchases of treasury stock (20,111 thousand shares) (15,063) (15,063) (15,063) Disposals of treasury stock (12 thousand shares) (1) 11 9 9 Retirements of treasury stock (20,000 thousand shares) (20,000) (15,957) 15,957 Net changes other than shareholders’ equity 72 (19,196) (23) (226) (19,374) 2,302 (17,072)
Total changes during the period (20,000) 72 11,278 905 (19,196) (23) (226) (7,190) 2,302 (4,888)Balance at March 31, 2011 685,129 ¥90,845 ¥54,884 ¥253 ¥491,986 ¥ (7,734) ¥64,179 ¥(427) ¥(1,257) ¥692,728 ¥21,452 ¥714,180
Thousands of U.S. Dollars (Note 2) Accumulated other
comprehensive income
CapitalStock
CapitalSurplus
SubscriptionRights to Shares
Retained Earnings
Treasury Stock
Valuation Difference
on Available-for-Sale
Securities
Deferred Gains or
Losses on Hedges
Foreign Currency
Translation Adjustments Total
Minority Interests
TotalEquity
Balance at April 1, 2010 $1,092,553 $660,061 $2,177 $5,781,207 $(103,909) $1,002,719 $(4,859) $(12,401) $8,417,548 $230,308 $8,647,856Changes during the period:
Cash dividends, $0.16 per share (107,245) (107,245) (107,245)Net income 434,827 434,827 434,827 Purchases of treasury stock (181,166) (181,166) (181,166)Disposals of treasury stock (20) 135 115 115Retirements of treasury stock (191,918) 191,918 Net changes other than shareholders’ equity 870 (230,867) (287) (2,727) (233,011) 27,692 (205,319)
Total changes during the period 870 135,644 10,887 (230,867) (287) (2,727) (86,480) 27,692 (58,788)Balance at March 31, 2011 $1,092,553 $660,061 $3,047 $5,916,851 $ (93,022) $ 771,852 $(5,146) $(15,128) $8,331,068 $258,000 $8,589,068
See notes to consolidated financial statements.
21
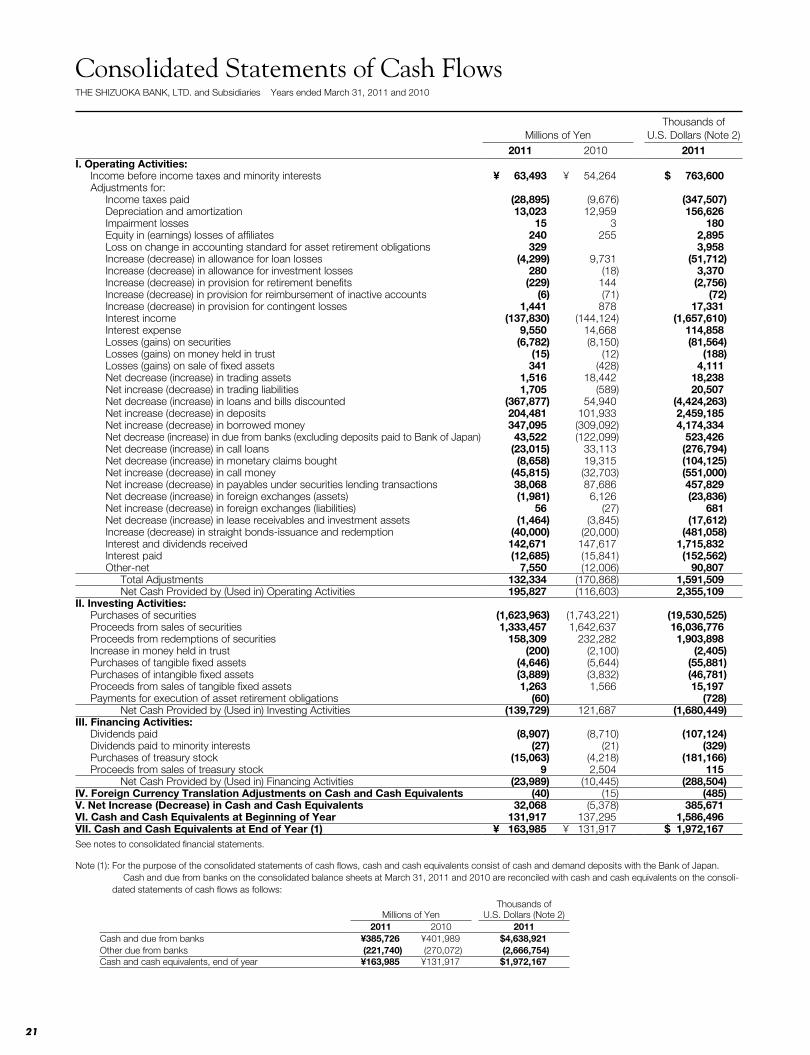
Consolidated Statements of Cash FlowsTHE SHIZUOKA BANK, LTD. and Subsidiaries Years ended March 31, 2011 and 2010
Millions of Yen
Thousands of U.S. Dollars (Note 2)
2011 2010 2011I. Operating Activities:
Income before income taxes and minority interests ¥ 63,493 ¥ 54,264 $ 763,600 Adjustments for:
Income taxes paid (28,895) (9,676) (347,507)Depreciation and amortization 13,023 12,959 156,626 Impairment losses 15 3 180 Equity in (earnings) losses of affiliates 240 255 2,895 Loss on change in accounting standard for asset retirement obligations 329 3,958 Increase (decrease) in allowance for loan losses (4,299) 9,731 (51,712)Increase (decrease) in allowance for investment losses 280 (18) 3,370 Increase (decrease) in provision for retirement benefits (229) 144 (2,756)Increase (decrease) in provision for reimbursement of inactive accounts (6) (71) (72)Increase (decrease) in provision for contingent losses 1,441 878 17,331 Interest income (137,830) (144,124) (1,657,610)Interest expense 9,550 14,668 114,858Losses (gains) on securities (6,782) (8,150) (81,564)Losses (gains) on money held in trust (15) (12) (188)Losses (gains) on sale of fixed assets 341 (428) 4,111 Net decrease (increase) in trading assets 1,516 18,442 18,238 Net increase (decrease) in trading liabilities 1,705 (589) 20,507 Net decrease (increase) in loans and bills discounted (367,877) 54,940 (4,424,263)Net increase (decrease) in deposits 204,481 101,933 2,459,185 Net increase (decrease) in borrowed money 347,095 (309,092) 4,174,334Net decrease (increase) in due from banks (excluding deposits paid to Bank of Japan) 43,522 (122,099) 523,426 Net decrease (increase) in call loans (23,015) 33,113 (276,794)Net decrease (increase) in monetary claims bought (8,658) 19,315 (104,125)Net increase (decrease) in call money (45,815) (32,703) (551,000)Net increase (decrease) in payables under securities lending transactions 38,068 87,686 457,829 Net decrease (increase) in foreign exchanges (assets) (1,981) 6,126 (23,836)Net increase (decrease) in foreign exchanges (liabilities) 56 (27) 681 Net decrease (increase) in lease receivables and investment assets (1,464) (3,845) (17,612)Increase (decrease) in straight bonds-issuance and redemption (40,000) (20,000) (481,058)Interest and dividends received 142,671 147,617 1,715,832Interest paid (12,685) (15,841) (152,562)Other-net 7,550 (12,006) 90,807
Total Adjustments 132,334 (170,868) 1,591,509 Net Cash Provided by (Used in) Operating Activities 195,827 (116,603) 2,355,109
II. Investing Activities:Purchases of securities (1,623,963) (1,743,221) (19,530,525)Proceeds from sales of securities 1,333,457 1,642,637 16,036,776 Proceeds from redemptions of securities 158,309 232,282 1,903,898 Increase in money held in trust (200) (2,100) (2,405)Purchases of tangible fixed assets (4,646) (5,644) (55,881)Purchases of intangible fixed assets (3,889) (3,832) (46,781)Proceeds from sales of tangible fixed assets 1,263 1,566 15,197 Payments for execution of asset retirement obligations (60) (728)
Net Cash Provided by (Used in) Investing Activities (139,729) 121,687 (1,680,449)III. Financing Activities:
Dividends paid (8,907) (8,710) (107,124)Dividends paid to minority interests (27) (21) (329)Purchases of treasury stock (15,063) (4,218) (181,166)Proceeds from sales of treasury stock 9 2,504 115
Net Cash Provided by (Used in) Financing Activities (23,989) (10,445) (288,504)IV. Foreign Currency Translation Adjustments on Cash and Cash Equivalents (40) (15) (485)V. Net Increase (Decrease) in Cash and Cash Equivalents 32,068 (5,378) 385,671 VI. Cash and Cash Equivalents at Beginning of Year 131,917 137,295 1,586,496 VII. Cash and Cash Equivalents at End of Year (1) ¥ 163,985 ¥ 131,917 $ 1,972,167 See notes to consolidated financial statements.
Note (1): For the purpose of the consolidated statements of cash flows, cash and cash equivalents consist of cash and demand deposits with the Bank of Japan. Cash and due from banks on the consolidated balance sheets at March 31, 2011 and 2010 are reconciled with cash and cash equivalents on the consoli-dated statements of cash flows as follows:
Millions of Yen
Thousands of U.S. Dollars (Note 2)
2011 2010 2011Cash and due from banks ¥385,726 ¥401,989 $4,638,921 Other due from banks (221,740) (270,072) (2,666,754)Cash and cash equivalents, end of year ¥163,985 ¥131,917 $1,972,167
22
1. BASIS OF PRESENTATIONThe accompanying consolidated financial statements have been prepared from the accounts maintained by The Shizuoka Bank, Ltd. (the “Bank”) and its subsidiaries (the “Group”) in accordance with the provisions set forth in the “Companies Act,” the Japanese Financial Instruments and Exchange Act, the Banking Act of Japan and the Accounting Guideline for Banks in Japan stated by the Japanese Bankers’ Association and accounting principles generally accepted in Japan (“Japanese GAAP”), which are different in certain respects as to the application and disclosure requirements of International Financial Reporting Standards (“IFRS”).
Under Japanese GAAP, a consolidated statement of comprehensive income is required from the fiscal year ended March 31, 2011 and has been presented herein. Accordingly, accumulated other compre-hensive income is presented in the consolidated balance sheet and the consolidated statement of changes in equity. Information with respect to other comprehensive income for the year ended March 31, 2010 is disclosed in Note 32. In addition, “net income before minority interests” is disclosed in the consolidated statements of income from the year ended March 31, 2011.
In preparing these consolidated financial statements, certain reclas-sifications and rearrangements have been made to the consolidated financial statements issued domestically in order to present them in a form which is more familiar to readers outside Japan.
In addition, certain reclassifications and rearrangements have been made in the 2010 consolidated financial statements to conform to classifications and presentations used in 2011.
2. YEN AND U.S. DOLLAR AMOUNTSAs permitted by the Japanese Financial Instruments and Exchange Act, yen amounts less than one million have been omitted. As a result, the totals in yen shown in the accompanying consolidated financial statements and the notes thereto do not necessarily agree with the sum of the individual account balances.
The consolidated financial statements are stated in Japanese yen, the currency of the country in which the Bank is incorporated and operates. The translations of Japanese yen amounts into U.S. dollar amounts are included solely for the convenience of readers outside Japan and have been made at the rate of ¥83.15 to $1, the approxi-mate rate of exchange at March 31, 2011. Such translation should not be construed as a representation that Japanese yen amounts could be converted into U.S. dollars at that or any other rate.
3. SUMMARY OF SIGNIFICANT ACCOUNTING POLICIESConsolidation:The accompanying consolidated financial statements as of March 31, 2011 and 2010 include the accounts of the Bank, 11 subsidiaries and 1 company accounted by the equity method.
Under the control or influence concept, those companies in which the Bank, directly or indirectly, is able to exercise control over opera-tions are fully consolidated, and those companies over which the Group has the ability to exercise significant influence are accounted for by the equity method.
Investments in associated companies are accounted for by the equity method.
Investments in the remaining unconsolidated subsidiaries and associated companies are stated at cost. If the equity method of accounting had been applied to the investments in these companies, the effect on the accompanying consolidated financial statements would not be material.
The difference between the cost of an acquisition and the fair value of net assets of the acquired subsidiary at the date of acquisition is charged to income when incurred.
All significant intercompany accounts and transactions have been eliminated in consolidation. All material unrealized profits resulting from intercompany transactions are eliminated.
Unification of Accounting Policies Applied to Foreign Subsidiaries for the Consolidated Financial Statements:In May 2006, the Accounting Standards Board of Japan (the “ASBJ”) issued ASBJ Practical Issues Task Force (PITF) No.18, “Practical Solution on Unification of Accounting Policies Applied to Foreign Subsidiaries for the Consolidated Financial Statements.” PITF No.18 prescribes that: (1) the accounting policies and procedures applied to a parent company and its subsidiaries for similar transactions and events under similar circumstances should in principle be unified for the preparation of the consolidated financial statements, (2) financial statements prepared by foreign subsidiaries in accordance with either IFRS or generally accepted accounting principles in the United States of America tentatively may be used for the consolidation process, (3) however, the following items should be adjusted in the consolidation process so that net income is accounted for in accordance with Japanese GAAP unless they are not material: 1) amortization of good-will; 2) scheduled amortization of actuarial gain or loss of pensions that has been directly recorded in equity; 3) expensing capitalized research and development costs; 4) cancellation of fair value model accounting for property, plant, and equipment and investment proper-ties and incorporation of cost model accounting; 5) recording the prior years’ effects of changes in accounting policies in the income statement where retrospective adjustments to financial statements have been incorporated; and 6) exclusion of minority interests from net income, if contained.
Trading purpose transactions:“Transactions for trading purposes” (the purpose of seeking to capture gains arising from short-term fluctuations in interest rates, currency exchange rates or market prices of securities and other market-related indices or from gaps among markets) are included in “Trading assets” and “Trading liabilities” on a trade-date basis. Trading securities and monetary claims purchased for trading purposes recorded in these accounts are stated at market value, and trading-related financial derivatives are stated at the amounts that would be settled if they were terminated at the end of the fiscal year.
Profits and losses on transactions for trading purposes are shown as “Trading income (losses)” on a trade-date basis.
Securities:Held-to-maturity debt securities, which are expected to be held-to-maturity with the positive intent and ability to hold-to-maturity, are stated at amortized cost computed by the straight-line method. Available-for-sale securities, which are not classified as either trading account securities or held-to-maturity debt securities, are stated at fair value, with unrealized gains and losses, net of applicable taxes, reported in a separate component of equity.
Available-for-sale-securities whose fair value cannot be reliably deter-mined are stated at cost determined by the moving-average method.
For other than temporary declines in fair value, investment securities are reduced to net realizable value by a charge to income.
Tangible fixed assets:Tangible fixed assets are stated at cost less accumulated deprecia-tion. Depreciation of tangible fixed assets owned by the Bank is computed using the declining-balance method over the estimated useful lives.
The range of useful lives is principally from 3 to 38 years for build-ings and from 2 to 20 years for equipment.
Depreciation of tangible fixed assets owned by consolidated subsid-iaries is principally computed using the declining-balance method over the estimated useful lives of the assets.
Notes to Consolidated Financial StatementsTHE SHIZUOKA BANK, LTD. and Subsidiaries Years ended March 31, 2011 and 2010
23
Impairment loss:The Group reviews its long-lived assets for impairment whenever events or changes in circumstances indicate the carrying amount of an asset or asset group may not be recoverable. An impairment loss would be recognized if the carrying amount of an asset or asset group exceeds the sum of the undiscounted future cash flows expected to result from the continued use and eventual disposition of the asset or asset group. The impairment loss would be measured as the amount by which the carrying amount of the asset exceeds its recoverable amount, which is the higher of the discounted cash flows from the continued use and eventual disposition of the asset or the net selling price at disposition.
Software:The Bank and its subsidiaries in Japan amortize internal-use software development costs by the straight-line method over the useful life (five years).
Allowance for loan losses:The amount of the allowance for loan losses is determined based on management’s judgement and assessment of future losses based on the Bank’s self-assessment system. This system reflects the past experience of credit losses, possible future credit losses, business and economic conditions, the character, quality and performance of the portfolio and other pertinent indicators.
The Bank implemented a self-assessment system to monitor the quality of its assets. The quality of all loans is assessed by branches and the Credit Supervision Department with a subsequent audit by the Credit Examination Department, in accordance with the Bank’s policy and rules for self-assessment of asset quality.
The Bank has established a credit rating system under which its customers are classified into five categories. The credit rating system is used for self-assessment of asset quality. All loans are classified into five categories for self-assessment purposes — “normal,” “caution,” “possible bankruptcy,” “virtual bankruptcy” and “legal bankruptcy.”
The allowance for loan losses is calculated based on the specific past actual loss ratio for normal and caution categories, and the fair value of collateral for collateral-dependent loans and other factors of solvency, including the value of future cash flows, for other self-assessment categories.
The consolidated subsidiaries provide for the “Allowance for loan losses” at the amount deemed necessary to cover such losses, principally based on past experience.
Allowance for investment losses:The allowance for investment losses is provided at a necessary amount based on the estimated possible losses on investments.
Provision for retirement benefits:The Bank and domestic consolidated subsidiaries have lump-sum retirement benefit plans, a contributory funded pension plan and a non-contributory funded pension plan.
The Bank and its subsidiaries accounted for the provision for retire-ment benefits based on the projected benefit obligations and plan assets at the balance sheet date.
Provision for losses from reimbursement of inactive accounts:Provision for losses from reimbursement of inactive accounts which are derecognized as liabilities under certain conditions is provided for possible losses on future claims of withdrawal based on historical reimbursement experience.
Provision for contingent losses:The provision for contingent losses is provided for the estimated future payments to credit guarantee corporations due to the imple-mentation of a loss sharing system.
Reserves under special laws:Reserves under special laws are reserves for financial product transaction liabilities in accordance with section 1 of Article 46-5 of the Financial Instruments and Exchange Act.
Asset retirement obligations:In March 2008, the ASBJ published the accounting standard for asset retirement obligations, ASBJ Statement No.18, “Accounting Standard for Asset Retirement Obligations,” and ASBJ Guidance No.21, “Guidance on Accounting Standard for Asset Retirement Obligations.” Under this accounting standard, an asset retirement obligation is defined as a legal obligation imposed either by law or contract that results from the acquisition, construction, development and the normal operation of a tangible fixed asset and is associated with the retirement of such tangible fixed asset. The asset retirement obligation is recognized as the sum of the discounted cash flows required for the future asset retirement and is recorded in the period in which the obligation is incurred if a reasonable estimate can be made. If a reasonable estimate of the asset retirement obligation can-not be made in the period the asset retirement obligation is incurred, the liability should be recognized when a reasonable estimate of asset retirement obligation can be made. Upon initial recognition of a liability for an asset retirement obligation, an asset retirement cost is capital-ized by increasing the carrying amount of the related fixed asset by the amount of the liability. The asset retirement cost is subsequently allocated to expense through depreciation over the remaining useful life of the asset. Over time, the liability is accreted to its present value each period. Any subsequent revisions to the timing or the amount of the original estimate of undiscounted cash flows are reflected as an increase or a decrease in the carrying amount of the liability and the capitalized amount of the related asset retirement cost. This standard was effective for fiscal years beginning on or after April 1, 2010.
The Bank applied this accounting standard effective April 1, 2010. The effect of this change was to decrease operating income by ¥56 million ($678 thousand) and income before income taxes and minority interests by ¥385 million ($4,636 thousand).
Leases:In March 2007, the ASBJ issued ASBJ Statement No.13, “Accounting Standard for Lease Transactions,” which revised the previous account-ing standard for lease transactions which was issued in June 1993. The revised accounting standard for lease transactions is effective for fiscal years beginning on or after April 1, 2008.
LesseeUnder the previous accounting standard, finance leases that were deemed to transfer ownership of the leased property to the lessee were to be capitalized. However, other finance leases were permitted to be accounted for as operating lease transactions if certain “as if capitalized” information is disclosed in the notes to the lessee’s financial statements. The revised accounting standard requires that all finance lease transactions should be capitalized to recognize lease assets and lease obligations in the balance sheet. In addition, the revised accounting standard permits leases which existed at the transition date and do not transfer ownership of the leased property to the lessee to be accounted for as operating lease transactions.
The Bank and its consolidated subsidiaries in Japan applied the revised accounting standard effective April 1, 2008. In addition, the Bank and its consolidated subsidiaries in Japan accounted for leases which existed at the transition date and do not transfer ownership of the leased property to the lessee as operating lease transactions.
LessorUnder the previous accounting standard, finance leases that were deemed to transfer ownership of the leased property to the lessee were to be treated as sales. However, other finance leases were permitted to be accounted for as operating lease transactions if certain “as if sold” information is disclosed in the notes to the lessor’s financial
24
statements. The revised accounting standard requires that all finance leases that are deemed to transfer ownership of the leased property to the lessee should be recognized as lease receivables, and all finance leases that are deemed not to transfer ownership of the leased property to the lessee should be recognized as investments in leases.
The Bank and its consolidated subsidiaries in Japan applied the revised accounting standard effective April 1, 2008.
In regard to finance lease sales and cost of sales are accounted when lease payments are paid.
Stock options:ASBJ Statement No.8, “Accounting Standard for Stock Options,” and related guidance are applicable to stock options granted on and after May 1, 2006.
This standard requires companies to recognize compensation expenses for employee stock options based on the fair value at the date of grant and over the vesting period as consideration for receiving goods or services. The standard also requires companies to account for stock options granted to non-employees based on the fair value of either the stock option or the goods or services received. In the balance sheet, the stock option is presented as subscription rights to shares as a separate component of equity until exercised.
The Bank has applied the accounting standard for stock options to those granted on and after May 1, 2006.
Translation of foreign currencies:Assets and liabilities which are payable or receivable in foreign curren-cies are converted into Japanese yen at the rates prevailing at each balance sheet date.
The financial statements of the consolidated subsidiaries outside Japan are translated into Japanese yen at the current exchange rate at each balance sheet date, except for equity, which is translated at the historical exchange rate.
Differences arising from such translation are shown as “Foreign currency translation adjustments” in a separate component of equity.
Income taxes:The Bank and its subsidiaries in Japan allocate income taxes based on the asset and liability method.
Deferred income taxes are recorded to reflect the impact of tempo-rary differences between assets and liabilities recognized for financial reporting purposes and such amounts recognized for tax purposes. These deferred taxes are measured by applying currently enacted tax laws to the temporary differences.
Derivatives and hedging activities:(a) Transactions to hedge against interest rate riskTransactions to hedge against interest rate risk affecting the financial assets and liabilities of the Bank are accounted for using deferral hedge accounting as stipulated in “Accounting and Auditing Treatment of Accounting Standards for Financial Instruments in the Banking Industry” (Japanese Institute of Certified Public Accountant Industry Audit Committee Report No.24). Regarding the effectiveness of a hedging relationship under fair value hedging, a portfolio of hedged items, such as deposits or loans with common maturities, is matched with a group of hedging instruments, such as interest rate swaps, which offset the effect of fair value fluctuations of the hedged items by identified maturities, and are designated as a hedge of the portfolio. The effectiveness of the fair value hedge is assessed by each group. Also, the effectiveness of a cash flow hedge is assessed on the basis of the correlation between the base interest rate index of the hedged cash flow and that of the hedging instrument.
Special hedging treatment is applied for interest rate swaps.Methods similar to that utilized by the Bank are applied to hedge
transactions conducted by the subsidiaries of the Bank.
(b) Transactions to hedge against foreign exchange fluctuation riskDeferral hedge accounting is applied to hedges against foreign exchange fluctuation risks associated with foreign currency denomi-nated monetary assets and liabilities, stipulated in Japanese Institute of Certified Public Accountant Industry Audit Committee Report No.25.
The effectiveness of currency-swap transactions, exchange swap transactions and similar transactions hedging foreign exchange risks of monetary assets and liabilities denominated in foreign currencies is assessed by comparison of the foreign currency position of the hedged monetary assets and liabilities and the hedging instruments.
In order to hedge the foreign exchange risk of foreign-currency-denominated Available-for-sale securities (except bonds), the Bank applies the “general method,” using market-value hedges in accor-dance with certain conditions, namely the stipulation in advance of which foreign-currency-denominated securities are to be hedged, and the existence in foreign currency of a spot-forward liability in excess of the acquisition cost of the relevant foreign-currency-denominated securities.
Statement of cash flows:For the purpose of the consolidated statement of cash flows, cash and cash equivalents represent cash and due from the Bank of Japan.
Per share information:Basic net income per share is computed by dividing net income available to common stockholders by the weighted-average number of common shares outstanding for the period, retroactively adjusted for stock splits. The average number of common shares used in the computation was 683,187,706 shares for 2011 and 698,073,881 shares for 2010.
Diluted net income per share reflects the potential dilution that could occur if the outstanding stock options were exercised. Diluted net income per share assumes full exercise of the outstanding stock options at the beginning of the year (or at the time of grant).
Cash dividends per share presented in the accompanying state-ments of income are dividends applicable to the respective years including dividends to be paid after the end of the year.
New Accounting Pronouncements:Accounting changes and error correctionsIn December 2009, ASBJ issued ASBJ Statement No.24, “Accounting Standard for Accounting Changes and Error Corrections” and ASBJ Guidance No.24, “Guidance on Accounting Standard for Accounting Changes and Error Corrections.” Accounting treatments under this standard and guidance are as follows:(1) Changes in accounting policies:
When a new accounting policy is applied due to a revision of accounting standards, the new policy is applied retrospectively unless the revised accounting standards include specific transi-tional provisions. When the revised accounting standards include specific transitional provisions, an entity shall comply with the specific transitional provisions.
(2) Changes in presentation When the presentation of financial statements is changed, prior period financial statements are reclassified in accordance with the new presentation.
(3) Changes in accounting estimates A change in an accounting estimate is accounted for in the period when the change affects that period only and is accounted for prospectively if the change affects both the period of the change and future periods.
(4) Corrections of prior period errors When an error in prior period financial statements is discovered, those statements are restated. This accounting standard and the guidance are applicable to accounting changes and corrections of prior period errors which are made from the beginning of the fiscal year that begins on or after April 1, 2011.
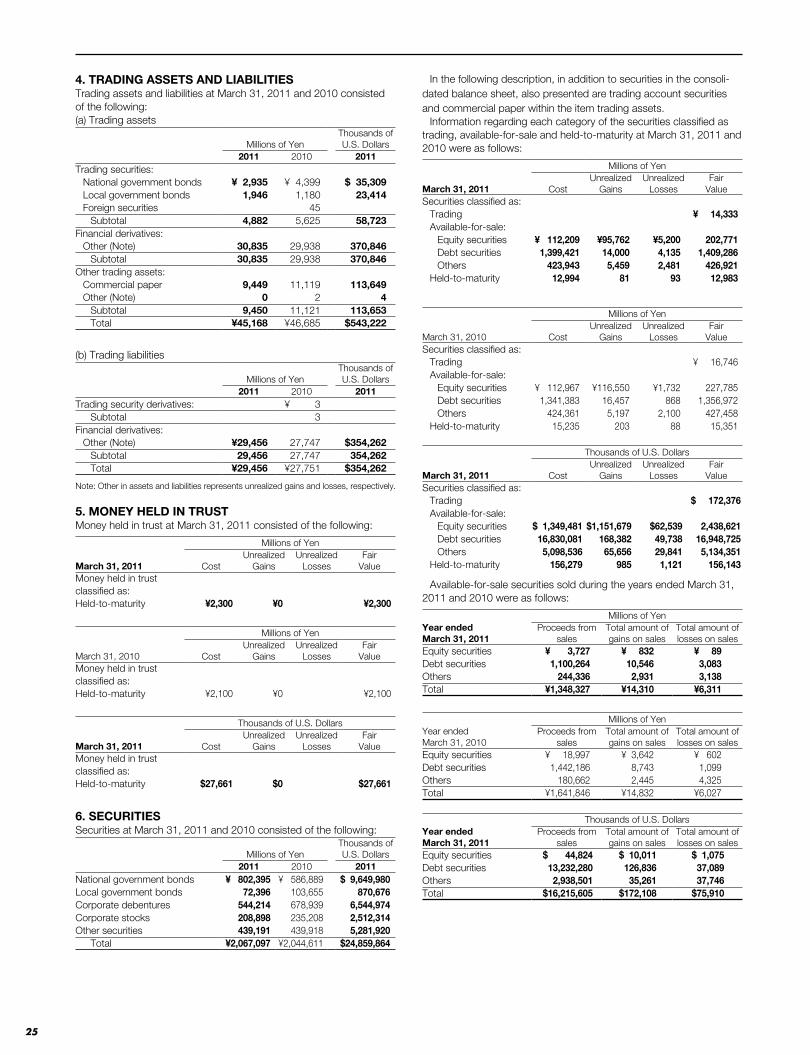
25
4. TRADING ASSETS AND LIABILITIESTrading assets and liabilities at March 31, 2011 and 2010 consisted of the following:(a) Trading assets
Millions of YenThousands ofU.S. Dollars
2011 2010 2011Trading securities:
National government bonds ¥ 2,935 ¥ 4,399 $ 35,309Local government bonds 1,946 1,180 23,414Foreign securities 45
Subtotal 4,882 5,625 58,723Financial derivatives:
Other (Note) 30,835 29,938 370,846Subtotal 30,835 29,938 370,846
Other trading assets:Commercial paper 9,449 11,119 113,649Other (Note) 0 2 4
Subtotal 9,450 11,121 113,653Total ¥45,168 ¥46,685 $543,222
(b) Trading liabilities
Millions of YenThousands ofU.S. Dollars
2011 2010 2011Trading security derivatives: ¥ 3
Subtotal 3Financial derivatives:
Other (Note) ¥29,456 27,747 $354,262Subtotal 29,456 27,747 354,262Total ¥29,456 ¥27,751 $354,262
Note: Other in assets and liabilities represents unrealized gains and losses, respectively.
5. MONEY HELD IN TRUSTMoney held in trust at March 31, 2011 consisted of the following:
Millions of Yen
March 31, 2011 CostUnrealized
GainsUnrealized
LossesFair
ValueMoney held in trust classified as:Held-to-maturity ¥2,300 ¥0 ¥2,300
Millions of Yen
March 31, 2010 CostUnrealized
GainsUnrealized
LossesFair
ValueMoney held in trust classified as:Held-to-maturity ¥2,100 ¥0 ¥2,100
Thousands of U.S. Dollars
March 31, 2011 CostUnrealized
GainsUnrealized
LossesFair
ValueMoney held in trust classified as:Held-to-maturity $27,661 $0 $27,661
6. SECURITIESSecurities at March 31, 2011 and 2010 consisted of the following:
Millions of YenThousands ofU.S. Dollars
2011 2010 2011National government bonds ¥ 802,395 ¥ 586,889 $ 9,649,980Local government bonds 72,396 103,655 870,676Corporate debentures 544,214 678,939 6,544,974Corporate stocks 208,898 235,208 2,512,314Other securities 439,191 439,918 5,281,920
Total ¥2,067,097 ¥2,044,611 $24,859,864
In the following description, in addition to securities in the consoli-dated balance sheet, also presented are trading account securities and commercial paper within the item trading assets.
Information regarding each category of the securities classified as trading, available-for-sale and held-to-maturity at March 31, 2011 and 2010 were as follows:
Millions of Yen
March 31, 2011 CostUnrealized
GainsUnrealized
LossesFair
ValueSecurities classified as:
Trading ¥ 14,333Available-for-sale:
Equity securities ¥ 112,209 ¥95,762 ¥5,200 202,771Debt securities 1,399,421 14,000 4,135 1,409,286Others 423,943 5,459 2,481 426,921
Held-to-maturity 12,994 81 93 12,983
Millions of Yen
March 31, 2010 CostUnrealized
GainsUnrealized
LossesFair
ValueSecurities classified as:
Trading ¥ 16,746Available-for-sale:
Equity securities ¥ 112,967 ¥116,550 ¥1,732 227,785Debt securities 1,341,383 16,457 868 1,356,972Others 424,361 5,197 2,100 427,458
Held-to-maturity 15,235 203 88 15,351
Thousands of U.S. Dollars
March 31, 2011 CostUnrealized
GainsUnrealized
LossesFair
ValueSecurities classified as:
Trading $ 172,376Available-for-sale:
Equity securities $ 1,349,481 $1,151,679 $62,539 2,438,621Debt securities 16,830,081 168,382 49,738 16,948,725Others 5,098,536 65,656 29,841 5,134,351
Held-to-maturity 156,279 985 1,121 156,143
Available-for-sale securities sold during the years ended March 31, 2011 and 2010 were as follows:
Millions of YenYear ended March 31, 2011
Proceeds from sales
Total amount of gains on sales
Total amount of losses on sales
Equity securities ¥ 3,727 ¥ 832 ¥ 89Debt securities 1,100,264 10,546 3,083Others 244,336 2,931 3,138Total ¥1,348,327 ¥14,310 ¥6,311
Millions of YenYear ended March 31, 2010
Proceeds from sales
Total amount of gains on sales
Total amount of losses on sales
Equity securities ¥ 18,997 ¥ 3,642 ¥ 602Debt securities 1,442,186 8,743 1,099Others 180,662 2,445 4,325Total ¥1,641,846 ¥14,832 ¥6,027
Thousands of U.S. DollarsYear ended March 31, 2011
Proceeds from sales
Total amount of gains on sales
Total amount of losses on sales
Equity securities $ 44,824 $ 10,011 $ 1,075Debt securities 13,232,280 126,836 37,089Others 2,938,501 35,261 37,746Total $16,215,605 $172,108 $75,910
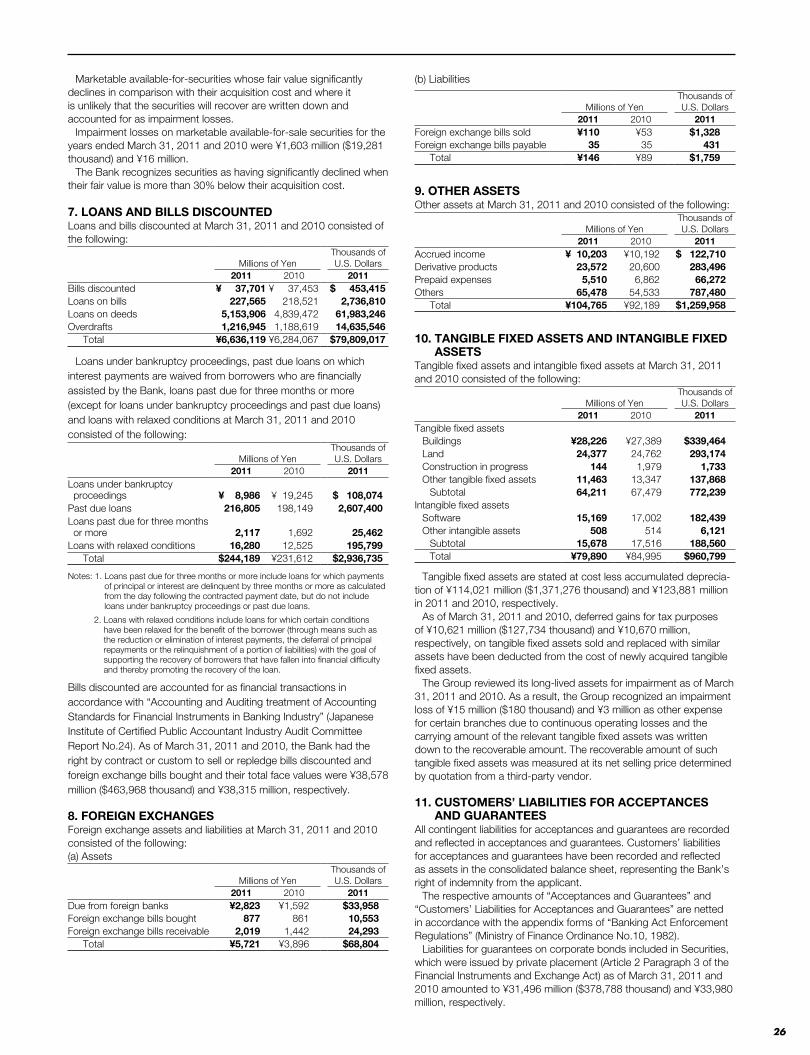
26
Marketable available-for-securities whose fair value significantly declines in comparison with their acquisition cost and where it is unlikely that the securities will recover are written down and accounted for as impairment losses.
Impairment losses on marketable available-for-sale securities for the years ended March 31, 2011 and 2010 were ¥1,603 million ($19,281 thousand) and ¥16 million.
The Bank recognizes securities as having significantly declined when their fair value is more than 30% below their acquisition cost.
7. LOANS AND BILLS DISCOUNTEDLoans and bills discounted at March 31, 2011 and 2010 consisted of the following:
Millions of YenThousands ofU.S. Dollars
2011 2010 2011Bills discounted ¥ 37,701 ¥ 37,453 $ 453,415Loans on bills 227,565 218,521 2,736,810Loans on deeds 5,153,906 4,839,472 61,983,246Overdrafts 1,216,945 1,188,619 14,635,546
Total ¥6,636,119 ¥6,284,067 $79,809,017
Loans under bankruptcy proceedings, past due loans on which interest payments are waived from borrowers who are financially assisted by the Bank, loans past due for three months or more (except for loans under bankruptcy proceedings and past due loans) and loans with relaxed conditions at March 31, 2011 and 2010 consisted of the following:
Millions of YenThousands ofU.S. Dollars
2011 2010 2011Loans under bankruptcy proceedings ¥ 8,986 ¥ 19,245 $ 108,074Past due loans 216,805 198,149 2,607,400Loans past due for three months or more 2,117 1,692 25,462Loans with relaxed conditions 16,280 12,525 195,799
Total $244,189 ¥231,612 $2,936,735
Notes: 1. Loans past due for three months or more include loans for which payments of principal or interest are delinquent by three months or more as calculated from the day following the contracted payment date, but do not include loans under bankruptcy proceedings or past due loans.
2. Loans with relaxed conditions include loans for which certain conditions have been relaxed for the benefit of the borrower (through means such as the reduction or elimination of interest payments, the deferral of principal repayments or the relinquishment of a portion of liabilities) with the goal of supporting the recovery of borrowers that have fallen into financial difficulty and thereby promoting the recovery of the loan.
Bills discounted are accounted for as financial transactions in accordance with “Accounting and Auditing treatment of Accounting Standards for Financial Instruments in Banking Industry” (Japanese Institute of Certified Public Accountant Industry Audit Committee Report No.24). As of March 31, 2011 and 2010, the Bank had the right by contract or custom to sell or repledge bills discounted and foreign exchange bills bought and their total face values were ¥38,578 million ($463,968 thousand) and ¥38,315 million, respectively.
8. FOREIGN EXCHANGESForeign exchange assets and liabilities at March 31, 2011 and 2010 consisted of the following:(a) Assets
Millions of YenThousands ofU.S. Dollars
2011 2010 2011Due from foreign banks ¥2,823 ¥1,592 $33,958Foreign exchange bills bought 877 861 10,553Foreign exchange bills receivable 2,019 1,442 24,293
Total ¥5,721 ¥3,896 $68,804
(b) Liabilities
Millions of YenThousands ofU.S. Dollars
2011 2010 2011Foreign exchange bills sold ¥110 ¥53 $1,328Foreign exchange bills payable 35 35 431
Total ¥146 ¥89 $1,759
9. OTHER ASSETSOther assets at March 31, 2011 and 2010 consisted of the following:
Millions of YenThousands ofU.S. Dollars
2011 2010 2011Accrued income ¥ 10,203 ¥10,192 $ 122,710Derivative products 23,572 20,600 283,496Prepaid expenses 5,510 6,862 66,272Others 65,478 54,533 787,480
Total ¥104,765 ¥92,189 $1,259,958
10. TANGIBLE FIXED ASSETS AND INTANGIBLE FIXED ASSETS
Tangible fixed assets and intangible fixed assets at March 31, 2011 and 2010 consisted of the following:
Millions of YenThousands ofU.S. Dollars
2011 2010 2011Tangible fixed assets
Buildings ¥28,226 ¥27,389 $339,464Land 24,377 24,762 293,174Construction in progress 144 1,979 1,733Other tangible fixed assets 11,463 13,347 137,868
Subtotal 64,211 67,479 772,239Intangible fixed assets
Software 15,169 17,002 182,439Other intangible assets 508 514 6,121
Subtotal 15,678 17,516 188,560Total ¥79,890 ¥84,995 $960,799
Tangible fixed assets are stated at cost less accumulated deprecia-tion of ¥114,021 million ($1,371,276 thousand) and ¥123,881 million in 2011 and 2010, respectively.
As of March 31, 2011 and 2010, deferred gains for tax purposes of ¥10,621 million ($127,734 thousand) and ¥10,670 million, respectively, on tangible fixed assets sold and replaced with similar assets have been deducted from the cost of newly acquired tangible fixed assets.
The Group reviewed its long-lived assets for impairment as of March 31, 2011 and 2010. As a result, the Group recognized an impairment loss of ¥15 million ($180 thousand) and ¥3 million as other expense for certain branches due to continuous operating losses and the carrying amount of the relevant tangible fixed assets was written down to the recoverable amount. The recoverable amount of such tangible fixed assets was measured at its net selling price determined by quotation from a third-party vendor.
11. CUSTOMERS’ LIABILITIES FOR ACCEPTANCES AND GUARANTEES
All contingent liabilities for acceptances and guarantees are recorded and reflected in acceptances and guarantees. Customers’ liabilities for acceptances and guarantees have been recorded and reflected as assets in the consolidated balance sheet, representing the Bank’s right of indemnity from the applicant.
The respective amounts of “Acceptances and Guarantees” and “Customers’ Liabilities for Acceptances and Guarantees” are netted in accordance with the appendix forms of “Banking Act Enforcement Regulations” (Ministry of Finance Ordinance No.10, 1982).
Liabilities for guarantees on corporate bonds included in Securities, which were issued by private placement (Article 2 Paragraph 3 of the Financial Instruments and Exchange Act) as of March 31, 2011 and 2010 amounted to ¥31,496 million ($378,788 thousand) and ¥33,980 million, respectively.
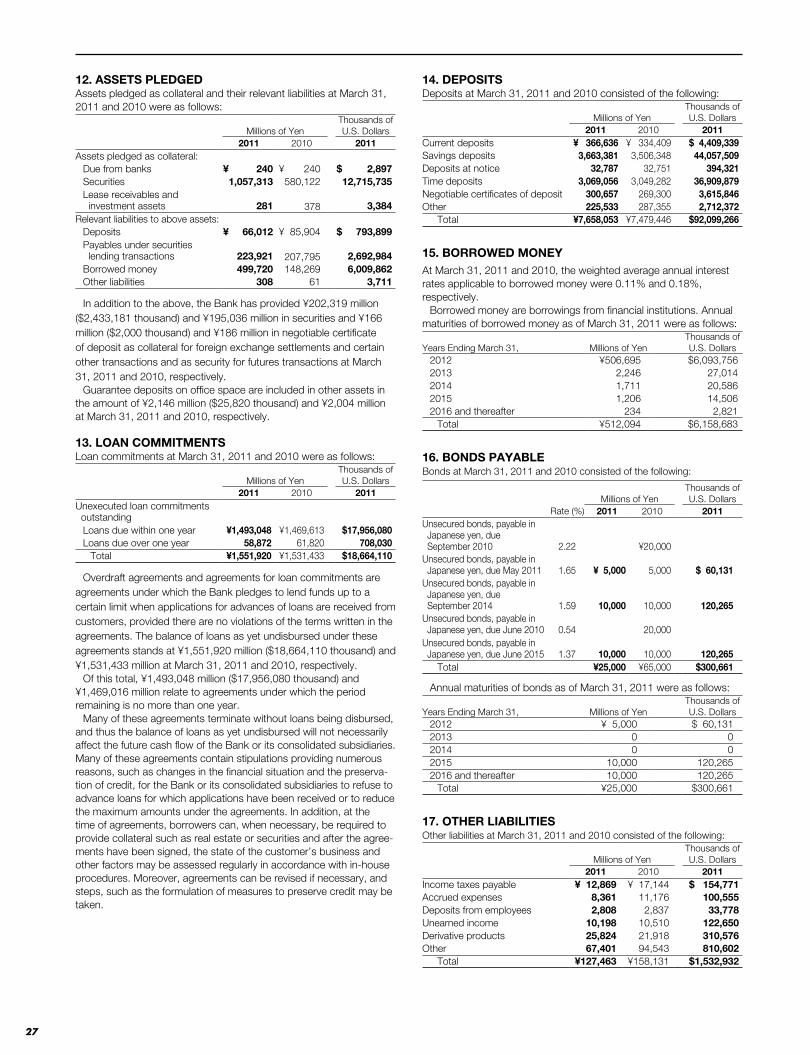
27
12. ASSETS PLEDGEDAssets pledged as collateral and their relevant liabilities at March 31, 2011 and 2010 were as follows:
Millions of YenThousands ofU.S. Dollars
2011 2010 2011Assets pledged as collateral:
Due from banks ¥ 240 ¥ 240 $ 2,897Securities 1,057,313 580,122 12,715,735Lease receivables and investment assets 281 378 3,384
Relevant liabilities to above assets:Deposits ¥ 66,012 ¥ 85,904 $ 793,899Payables under securities lending transactions 223,921 207,795 2,692,984Borrowed money 499,720 148,269 6,009,862Other liabilities 308 61 3,711
In addition to the above, the Bank has provided ¥202,319 million ($2,433,181 thousand) and ¥195,036 million in securities and ¥166 million ($2,000 thousand) and ¥186 million in negotiable certificate of deposit as collateral for foreign exchange settlements and certain other transactions and as security for futures transactions at March 31, 2011 and 2010, respectively.
Guarantee deposits on office space are included in other assets in the amount of ¥2,146 million ($25,820 thousand) and ¥2,004 million at March 31, 2011 and 2010, respectively.
13. LOAN COMMITMENTSLoan commitments at March 31, 2011 and 2010 were as follows:
Millions of YenThousands ofU.S. Dollars
2011 2010 2011Unexecuted loan commitments outstanding
Loans due within one year ¥1,493,048 ¥1,469,613 $17,956,080Loans due over one year 58,872 61,820 708,030
Total ¥1,551,920 ¥1,531,433 $18,664,110
Overdraft agreements and agreements for loan commitments are agreements under which the Bank pledges to lend funds up to a certain limit when applications for advances of loans are received from customers, provided there are no violations of the terms written in the agreements. The balance of loans as yet undisbursed under these agreements stands at ¥1,551,920 million ($18,664,110 thousand) and ¥1,531,433 million at March 31, 2011 and 2010, respectively.
Of this total, ¥1,493,048 million ($17,956,080 thousand) and ¥1,469,016 million relate to agreements under which the period remaining is no more than one year.
Many of these agreements terminate without loans being disbursed, and thus the balance of loans as yet undisbursed will not necessarily affect the future cash flow of the Bank or its consolidated subsidiaries. Many of these agreements contain stipulations providing numerous reasons, such as changes in the financial situation and the preserva-tion of credit, for the Bank or its consolidated subsidiaries to refuse to advance loans for which applications have been received or to reduce the maximum amounts under the agreements. In addition, at the time of agreements, borrowers can, when necessary, be required to provide collateral such as real estate or securities and after the agree-ments have been signed, the state of the customer’s business and other factors may be assessed regularly in accordance with in-house procedures. Moreover, agreements can be revised if necessary, and steps, such as the formulation of measures to preserve credit may be taken.
14. DEPOSITSDeposits at March 31, 2011 and 2010 consisted of the following:
Millions of YenThousands ofU.S. Dollars
2011 2010 2011Current deposits ¥ 366,636 ¥ 334,409 $ 4,409,339Savings deposits 3,663,381 3,506,348 44,057,509Deposits at notice 32,787 32,751 394,321Time deposits 3,069,056 3,049,282 36,909,879Negotiable certificates of deposit 300,657 269,300 3,615,846Other 225,533 287,355 2,712,372
Total ¥7,658,053 ¥7,479,446 $92,099,266
15. BORROWED MONEYAt March 31, 2011 and 2010, the weighted average annual interest rates applicable to borrowed money were 0.11% and 0.18%, respectively.
Borrowed money are borrowings from financial institutions. Annual maturities of borrowed money as of March 31, 2011 were as follows:
Years Ending March 31, Millions of YenThousands ofU.S. Dollars
2012 ¥506,695 $6,093,7562013 2,246 27,0142014 1,711 20,5862015 1,206 14,5062016 and thereafter 234 2,821
Total ¥512,094 $6,158,683
16. BONDS PAYABLEBonds at March 31, 2011 and 2010 consisted of the following:
Millions of YenThousands ofU.S. Dollars
Rate (%) 2011 2010 2011Unsecured bonds, payable in Japanese yen, due September 2010 2.22 ¥20,000Unsecured bonds, payable in Japanese yen, due May 2011 1.65 ¥ 5,000 5,000 $ 60,131Unsecured bonds, payable in Japanese yen, due September 2014 1.59 10,000 10,000 120,265Unsecured bonds, payable in Japanese yen, due June 2010 0.54 20,000Unsecured bonds, payable in Japanese yen, due June 2015 1.37 10,000 10,000 120,265
Total ¥25,000 ¥65,000 $300,661
Annual maturities of bonds as of March 31, 2011 were as follows:
Years Ending March 31, Millions of YenThousands ofU.S. Dollars
2012 ¥ 5,000 $ 60,1312013 0 02014 0 02015 10,000 120,2652016 and thereafter 10,000 120,265
Total ¥25,000 $300,661
17. OTHER LIABILITIESOther liabilities at March 31, 2011 and 2010 consisted of the following:
Millions of YenThousands ofU.S. Dollars
2011 2010 2011Income taxes payable ¥ 12,869 ¥ 17,144 $ 154,771Accrued expenses 8,361 11,176 100,555Deposits from employees 2,808 2,837 33,778Unearned income 10,198 10,510 122,650Derivative products 25,824 21,918 310,576Other 67,401 94,543 810,602
Total ¥127,463 ¥158,131 $1,532,932
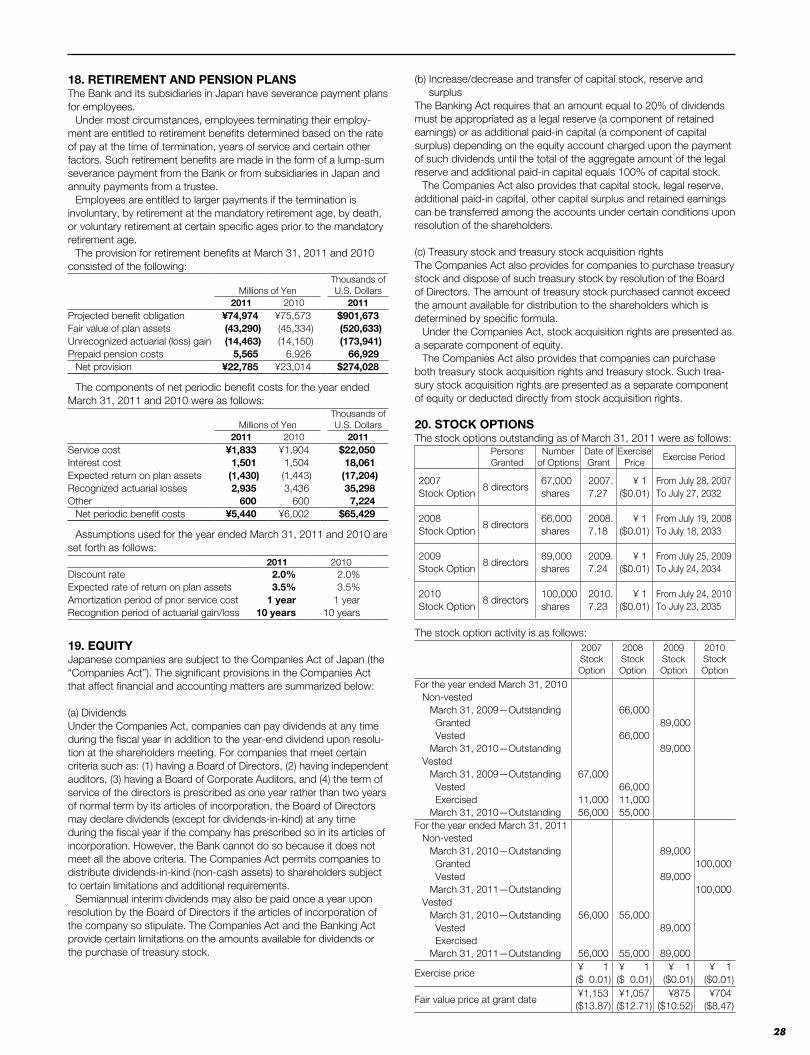
28
18. RETIREMENT AND PENSION PLANSThe Bank and its subsidiaries in Japan have severance payment plans for employees.
Under most circumstances, employees terminating their employ-ment are entitled to retirement benefits determined based on the rate of pay at the time of termination, years of service and certain other factors. Such retirement benefits are made in the form of a lump-sum severance payment from the Bank or from subsidiaries in Japan and annuity payments from a trustee.
Employees are entitled to larger payments if the termination is involuntary, by retirement at the mandatory retirement age, by death, or voluntary retirement at certain specific ages prior to the mandatory retirement age.
The provision for retirement benefits at March 31, 2011 and 2010 consisted of the following:
Millions of YenThousands ofU.S. Dollars
2011 2010 2011Projected benefit obligation ¥74,974 ¥75,573 $901,673Fair value of plan assets (43,290) (45,334) (520,633)Unrecognized actuarial (loss) gain (14,463) (14,150) (173,941)Prepaid pension costs 5,565 6,926 66,929
Net provision ¥22,785 ¥23,014 $274,028
The components of net periodic benefit costs for the year ended March 31, 2011 and 2010 were as follows:
Millions of YenThousands ofU.S. Dollars
2011 2010 2011Service cost ¥1,833 ¥1,904 $22,050Interest cost 1,501 1,504 18,061Expected return on plan assets (1,430) (1,443) (17,204)Recognized actuarial losses 2,935 3,436 35,298Other 600 600 7,224
Net periodic benefit costs ¥5,440 ¥6,002 $65,429
Assumptions used for the year ended March 31, 2011 and 2010 are set forth as follows:
2011 2010Discount rate 2.0% 2.0%Expected rate of return on plan assets 3.5% 3.5%Amortization period of prior service cost 1 year 1 yearRecognition period of actuarial gain/loss 10 years 10 years
19. EQUITYJapanese companies are subject to the Companies Act of Japan (the “Companies Act”). The significant provisions in the Companies Act that affect financial and accounting matters are summarized below:
(a) DividendsUnder the Companies Act, companies can pay dividends at any time during the fiscal year in addition to the year-end dividend upon resolu-tion at the shareholders meeting. For companies that meet certain criteria such as: (1) having a Board of Directors, (2) having independent auditors, (3) having a Board of Corporate Auditors, and (4) the term of service of the directors is prescribed as one year rather than two years of normal term by its articles of incorporation, the Board of Directors may declare dividends (except for dividends-in-kind) at any time during the fiscal year if the company has prescribed so in its articles of incorporation. However, the Bank cannot do so because it does not meet all the above criteria. The Companies Act permits companies to distribute dividends-in-kind (non-cash assets) to shareholders subject to certain limitations and additional requirements.
Semiannual interim dividends may also be paid once a year upon resolution by the Board of Directors if the articles of incorporation of the company so stipulate. The Companies Act and the Banking Act provide certain limitations on the amounts available for dividends or the purchase of treasury stock.
(b) Increase/decrease and transfer of capital stock, reserve and surplus
The Banking Act requires that an amount equal to 20% of dividends must be appropriated as a legal reserve (a component of retained earnings) or as additional paid-in capital (a component of capital surplus) depending on the equity account charged upon the payment of such dividends until the total of the aggregate amount of the legal reserve and additional paid-in capital equals 100% of capital stock.
The Companies Act also provides that capital stock, legal reserve, additional paid-in capital, other capital surplus and retained earnings can be transferred among the accounts under certain conditions upon resolution of the shareholders.
(c) Treasury stock and treasury stock acquisition rightsThe Companies Act also provides for companies to purchase treasury stock and dispose of such treasury stock by resolution of the Board of Directors. The amount of treasury stock purchased cannot exceed the amount available for distribution to the shareholders which is determined by specific formula.
Under the Companies Act, stock acquisition rights are presented as a separate component of equity.
The Companies Act also provides that companies can purchase both treasury stock acquisition rights and treasury stock. Such trea-sury stock acquisition rights are presented as a separate component of equity or deducted directly from stock acquisition rights.
20. STOCK OPTIONSThe stock options outstanding as of March 31, 2011 were as follows:
PersonsGranted
Number of Options
Date of Grant
Exercise Price
Exercise Period
2007 Stock Option
8 directors67,000 shares
2007.7.27
¥ 1($0.01)
From July 28, 2007To July 27, 2032
2008 Stock Option
8 directors66,000 shares
2008.7.18
¥ 1($0.01)
From July 19, 2008To July 18, 2033
2009 Stock Option
8 directors89,000 shares
2009.7.24
¥ 1($0.01)
From July 25, 2009To July 24, 2034
2010 Stock Option
8 directors100,000 shares
2010.7.23
¥ 1($0.01)
From July 24, 2010To July 23, 2035
The stock option activity is as follows:2007 Stock Option
2008 Stock Option
2009 Stock Option
2010 Stock Option
For the year ended March 31, 2010Non-vested
March 31, 2009—Outstanding 66,000 Granted 89,000 Vested 66,000March 31, 2010—Outstanding 89,000
VestedMarch 31, 2009—Outstanding 67,000 Vested 66,000 Exercised 11,000 11,000March 31, 2010—Outstanding 56,000 55,000
For the year ended March 31, 2011Non-vested
March 31, 2010—Outstanding 89,000 Granted 100,000 Vested 89,000March 31, 2011—Outstanding 100,000
VestedMarch 31, 2010—Outstanding 56,000 55,000 Vested 89,000 ExercisedMarch 31, 2011—Outstanding 56,000 55,000 89,000
Exercise price¥ 1($ 0.01)
¥ 1($ 0.01)
¥ 1($0.01)
¥ 1($0.01)
Fair value price at grant date¥1,153($13.87)
¥1,057($12.71)
¥875($10.52)
¥704($8.47)
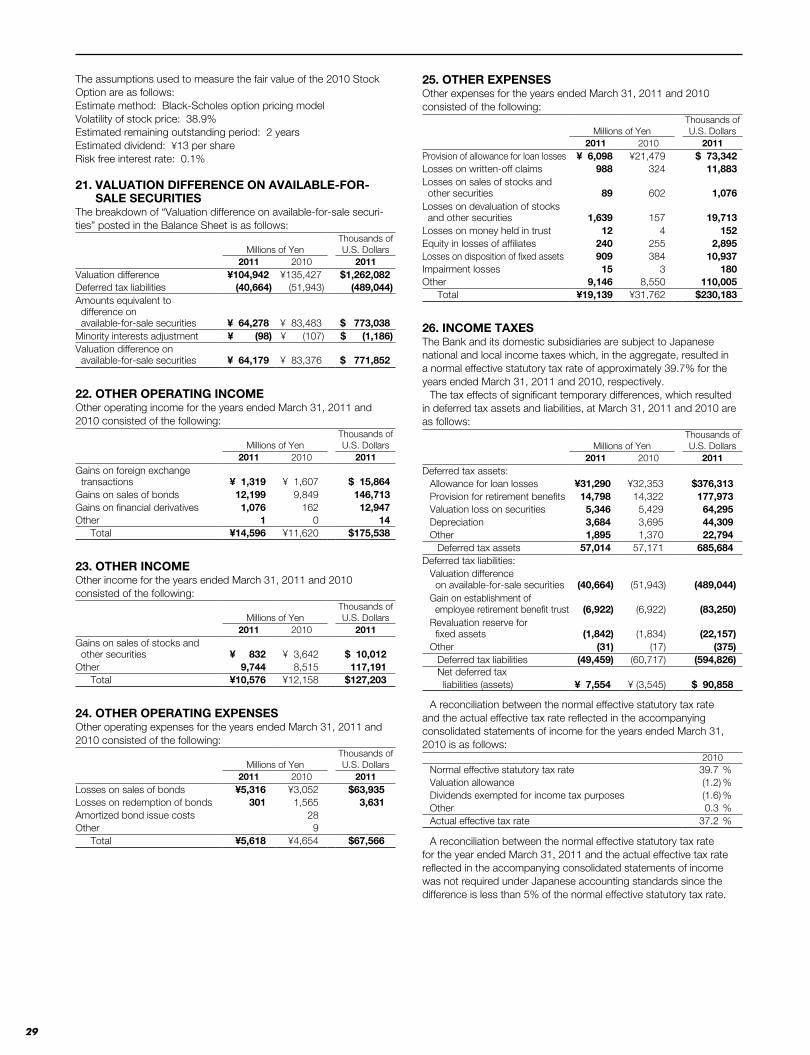
29
The assumptions used to measure the fair value of the 2010 Stock Option are as follows:Estimate method: Black-Scholes option pricing modelVolatility of stock price: 38.9%Estimated remaining outstanding period: 2 yearsEstimated dividend: ¥13 per shareRisk free interest rate: 0.1%
21. VALUATION DIFFERENCE ON AVAILABLE-FOR-SALE SECURITIES
The breakdown of “Valuation difference on available-for-sale securi-ties” posted in the Balance Sheet is as follows:
Millions of YenThousands ofU.S. Dollars
2011 2010 2011Valuation difference ¥104,942 ¥135,427 $1,262,082Deferred tax liabilities (40,664) (51,943) (489,044)Amounts equivalent to difference on available-for-sale securities ¥ 64,278 ¥ 83,483 $ 773,038Minority interests adjustment ¥ (98) ¥ (107) $ (1,186)Valuation difference on available-for-sale securities ¥ 64,179 ¥ 83,376 $ 771,852
22. OTHER OPERATING INCOMEOther operating income for the years ended March 31, 2011 and 2010 consisted of the following:
Millions of YenThousands ofU.S. Dollars
2011 2010 2011Gains on foreign exchange transactions ¥ 1,319 ¥ 1,607 $ 15,864Gains on sales of bonds 12,199 9,849 146,713Gains on financial derivatives 1,076 162 12,947Other 1 0 14
Total ¥14,596 ¥11,620 $175,538
23. OTHER INCOMEOther income for the years ended March 31, 2011 and 2010 consisted of the following:
Millions of YenThousands ofU.S. Dollars
2011 2010 2011Gains on sales of stocks and other securities ¥ 832 ¥ 3,642 $ 10,012Other 9,744 8,515 117,191
Total ¥10,576 ¥12,158 $127,203
24. OTHER OPERATING EXPENSESOther operating expenses for the years ended March 31, 2011 and 2010 consisted of the following:
Millions of YenThousands ofU.S. Dollars
2011 2010 2011Losses on sales of bonds ¥5,316 ¥3,052 $63,935Losses on redemption of bonds 301 1,565 3,631Amortized bond issue costs 28Other 9
Total ¥5,618 ¥4,654 $67,566
25. OTHER EXPENSESOther expenses for the years ended March 31, 2011 and 2010 consisted of the following:
Millions of YenThousands ofU.S. Dollars
2011 2010 2011Provision of allowance for loan losses ¥ 6,098 ¥21,479 $ 73,342Losses on written-off claims 988 324 11,883Losses on sales of stocks and other securities 89 602 1,076Losses on devaluation of stocks and other securities 1,639 157 19,713Losses on money held in trust 12 4 152Equity in losses of affiliates 240 255 2,895Losses on disposition of fixed assets 909 384 10,937Impairment losses 15 3 180Other 9,146 8,550 110,005
Total ¥19,139 ¥31,762 $230,183
26. INCOME TAXESThe Bank and its domestic subsidiaries are subject to Japanese national and local income taxes which, in the aggregate, resulted in a normal effective statutory tax rate of approximately 39.7% for the years ended March 31, 2011 and 2010, respectively.
The tax effects of significant temporary differences, which resulted in deferred tax assets and liabilities, at March 31, 2011 and 2010 are as follows:
Millions of YenThousands ofU.S. Dollars
2011 2010 2011Deferred tax assets:
Allowance for loan losses ¥31,290 ¥32,353 $376,313Provision for retirement benefits 14,798 14,322 177,973Valuation loss on securities 5,346 5,429 64,295Depreciation 3,684 3,695 44,309Other 1,895 1,370 22,794
Deferred tax assets 57,014 57,171 685,684Deferred tax liabilities:
Valuation difference on available-for-sale securities (40,664) (51,943) (489,044)Gain on establishment of employee retirement benefit trust (6,922) (6,922) (83,250)Revaluation reserve for fixed assets (1,842) (1,834) (22,157)Other (31) (17) (375)
Deferred tax liabilities (49,459) (60,717) (594,826)Net deferred tax liabilities (assets) ¥ 7,554 ¥ (3,545) $ 90,858
A reconciliation between the normal effective statutory tax rate and the actual effective tax rate reflected in the accompanying consolidated statements of income for the years ended March 31, 2010 is as follows:
2010Normal effective statutory tax rate 39.7 %Valuation allowance (1.2) %Dividends exempted for income tax purposes (1.6) %Other 0.3 %Actual effective tax rate 37.2 %
A reconciliation between the normal effective statutory tax rate for the year ended March 31, 2011 and the actual effective tax rate reflected in the accompanying consolidated statements of income was not required under Japanese accounting standards since the difference is less than 5% of the normal effective statutory tax rate.
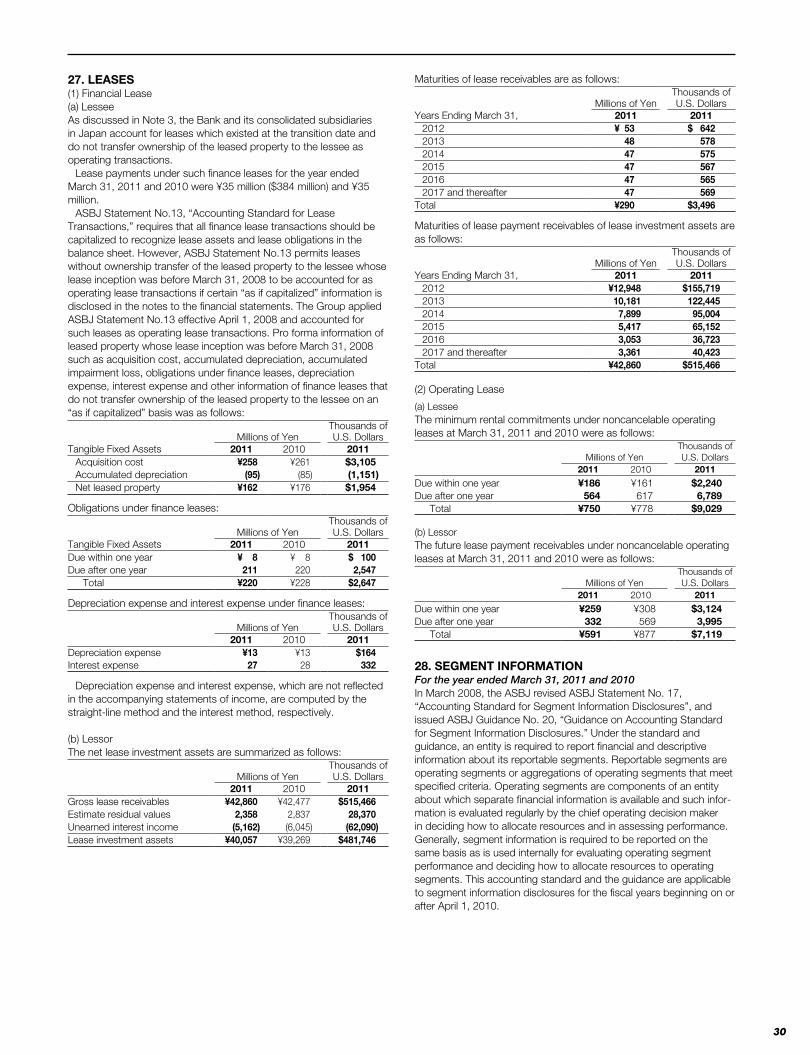
30
27. LEASES(1) Financial Lease(a) LesseeAs discussed in Note 3, the Bank and its consolidated subsidiaries in Japan account for leases which existed at the transition date and do not transfer ownership of the leased property to the lessee as operating transactions.
Lease payments under such finance leases for the year ended March 31, 2011 and 2010 were ¥35 million ($384 million) and ¥35 million.
ASBJ Statement No.13, “Accounting Standard for Lease Transactions,” requires that all finance lease transactions should be capitalized to recognize lease assets and lease obligations in the balance sheet. However, ASBJ Statement No.13 permits leases without ownership transfer of the leased property to the lessee whose lease inception was before March 31, 2008 to be accounted for as operating lease transactions if certain “as if capitalized” information is disclosed in the notes to the financial statements. The Group applied ASBJ Statement No.13 effective April 1, 2008 and accounted for such leases as operating lease transactions. Pro forma information of leased property whose lease inception was before March 31, 2008 such as acquisition cost, accumulated depreciation, accumulated impairment loss, obligations under finance leases, depreciation expense, interest expense and other information of finance leases that do not transfer ownership of the leased property to the lessee on an “as if capitalized” basis was as follows:
Millions of YenThousands ofU.S. Dollars
Tangible Fixed Assets 2011 2010 2011Acquisition cost ¥258 ¥261 $3,105Accumulated depreciation (95) (85) (1,151)Net leased property ¥162 ¥176 $1,954
Obligations under finance leases:
Millions of YenThousands ofU.S. Dollars
Tangible Fixed Assets 2011 2010 2011Due within one year ¥ 8 ¥ 8 $ 100Due after one year 211 220 2,547
Total ¥220 ¥228 $2,647
Depreciation expense and interest expense under finance leases:
Millions of YenThousands ofU.S. Dollars
2011 2010 2011Depreciation expense ¥13 ¥13 $164Interest expense 27 28 332
Depreciation expense and interest expense, which are not reflected in the accompanying statements of income, are computed by the straight-line method and the interest method, respectively.
(b) LessorThe net lease investment assets are summarized as follows:
Millions of YenThousands ofU.S. Dollars
2011 2010 2011Gross lease receivables ¥42,860 ¥42,477 $515,466Estimate residual values 2,358 2,837 28,370Unearned interest income (5,162) (6,045) (62,090)Lease investment assets ¥40,057 ¥39,269 $481,746
Maturities of lease receivables are as follows:
Millions of YenThousands ofU.S. Dollars
Years Ending March 31, 2011 20112012 ¥ 53 $ 6422013 48 5782014 47 5752015 47 5672016 47 5652017 and thereafter 47 569
Total ¥290 $3,496
Maturities of lease payment receivables of lease investment assets are as follows:
Millions of YenThousands ofU.S. Dollars
Years Ending March 31, 2011 20112012 ¥12,948 $155,7192013 10,181 122,4452014 7,899 95,0042015 5,417 65,1522016 3,053 36,7232017 and thereafter 3,361 40,423
Total ¥42,860 $515,466
(2) Operating Lease
(a) LesseeThe minimum rental commitments under noncancelable operating leases at March 31, 2011 and 2010 were as follows:
Millions of YenThousands ofU.S. Dollars
2011 2010 2011
Due within one year ¥186 ¥161 $2,240Due after one year 564 617 6,789
Total ¥750 ¥778 $9,029
(b) LessorThe future lease payment receivables under noncancelable operating leases at March 31, 2011 and 2010 were as follows:
Millions of YenThousands ofU.S. Dollars
2011 2010 2011
Due within one year ¥259 ¥308 $3,124Due after one year 332 569 3,995
Total ¥591 ¥877 $7,119
28. SEGMENT INFORMATIONFor the year ended March 31, 2011 and 2010In March 2008, the ASBJ revised ASBJ Statement No. 17, “Accounting Standard for Segment Information Disclosures”, and issued ASBJ Guidance No. 20, “Guidance on Accounting Standard for Segment Information Disclosures.” Under the standard and guidance, an entity is required to report financial and descriptive information about its reportable segments. Reportable segments are operating segments or aggregations of operating segments that meet specified criteria. Operating segments are components of an entity about which separate financial information is available and such infor-mation is evaluated regularly by the chief operating decision maker in deciding how to allocate resources and in assessing performance. Generally, segment information is required to be reported on the same basis as is used internally for evaluating operating segment performance and deciding how to allocate resources to operating segments. This accounting standard and the guidance are applicable to segment information disclosures for the fiscal years beginning on or after April 1, 2010.
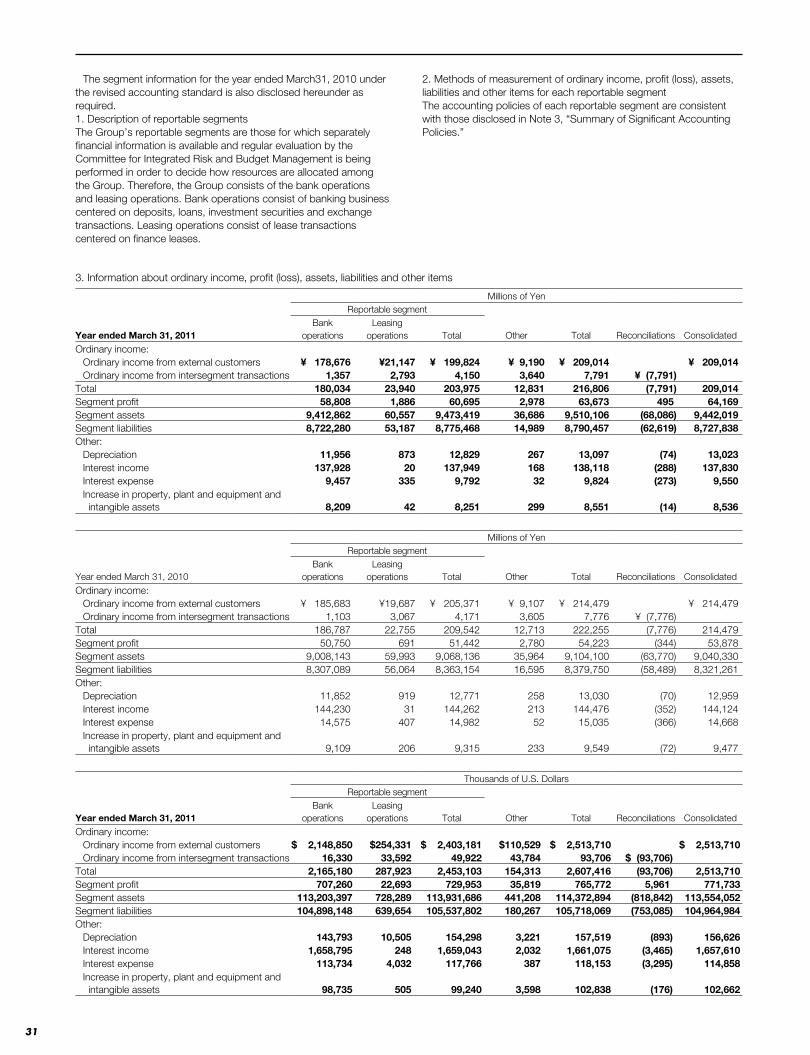
31
3. Information about ordinary income, profit (loss), assets, liabilities and other items
Millions of YenReportable segment
Year ended March 31, 2011Bank
operationsLeasing
operations Total Other Total Reconciliations Consolidated
Ordinary income:Ordinary income from external customers ¥ 178,676 ¥21,147 ¥ 199,824 ¥ 9,190 ¥ 209,014 ¥ 209,014Ordinary income from intersegment transactions 1,357 2,793 4,150 3,640 7,791 ¥ (7,791)
Total 180,034 23,940 203,975 12,831 216,806 (7,791) 209,014Segment profit 58,808 1,886 60,695 2,978 63,673 495 64,169Segment assets 9,412,862 60,557 9,473,419 36,686 9,510,106 (68,086) 9,442,019Segment liabilities 8,722,280 53,187 8,775,468 14,989 8,790,457 (62,619) 8,727,838Other:
Depreciation 11,956 873 12,829 267 13,097 (74) 13,023Interest income 137,928 20 137,949 168 138,118 (288) 137,830Interest expense 9,457 335 9,792 32 9,824 (273) 9,550Increase in property, plant and equipment and intangible assets 8,209 42 8,251 299 8,551 (14) 8,536
Millions of YenReportable segment
Year ended March 31, 2010Bank
operationsLeasing
operations Total Other Total Reconciliations Consolidated
Ordinary income:Ordinary income from external customers ¥ 185,683 ¥19,687 ¥ 205,371 ¥ 9,107 ¥ 214,479 ¥ 214,479Ordinary income from intersegment transactions 1,103 3,067 4,171 3,605 7,776 ¥ (7,776)
Total 186,787 22,755 209,542 12,713 222,255 (7,776) 214,479Segment profit 50,750 691 51,442 2,780 54,223 (344) 53,878Segment assets 9,008,143 59,993 9,068,136 35,964 9,104,100 (63,770) 9,040,330Segment liabilities 8,307,089 56,064 8,363,154 16,595 8,379,750 (58,489) 8,321,261Other:
Depreciation 11,852 919 12,771 258 13,030 (70) 12,959Interest income 144,230 31 144,262 213 144,476 (352) 144,124Interest expense 14,575 407 14,982 52 15,035 (366) 14,668Increase in property, plant and equipment and intangible assets 9,109 206 9,315 233 9,549 (72) 9,477
Thousands of U.S. DollarsReportable segment
Year ended March 31, 2011Bank
operationsLeasing
operations Total Other Total Reconciliations Consolidated
Ordinary income:Ordinary income from external customers $ 2,148,850 $254,331 $ 2,403,181 $110,529 $ 2,513,710 $ 2,513,710Ordinary income from intersegment transactions 16,330 33,592 49,922 43,784 93,706 $ (93,706)
Total 2,165,180 287,923 2,453,103 154,313 2,607,416 (93,706) 2,513,710Segment profit 707,260 22,693 729,953 35,819 765,772 5,961 771,733Segment assets 113,203,397 728,289 113,931,686 441,208 114,372,894 (818,842) 113,554,052Segment liabilities 104,898,148 639,654 105,537,802 180,267 105,718,069 (753,085) 104,964,984Other:
Depreciation 143,793 10,505 154,298 3,221 157,519 (893) 156,626Interest income 1,658,795 248 1,659,043 2,032 1,661,075 (3,465) 1,657,610Interest expense 113,734 4,032 117,766 387 118,153 (3,295) 114,858Increase in property, plant and equipment and intangible assets 98,735 505 99,240 3,598 102,838 (176) 102,662
The segment information for the year ended March31, 2010 under the revised accounting standard is also disclosed hereunder as required.1. Description of reportable segmentsThe Group’s reportable segments are those for which separately financial information is available and regular evaluation by the Committee for Integrated Risk and Budget Management is being performed in order to decide how resources are allocated among the Group. Therefore, the Group consists of the bank operations and leasing operations. Bank operations consist of banking business centered on deposits, loans, investment securities and exchange transactions. Leasing operations consist of lease transactions centered on finance leases.
2. Methods of measurement of ordinary income, profit (loss), assets, liabilities and other items for each reportable segmentThe accounting policies of each reportable segment are consistent with those disclosed in Note 3, “Summary of Significant Accounting Policies.”
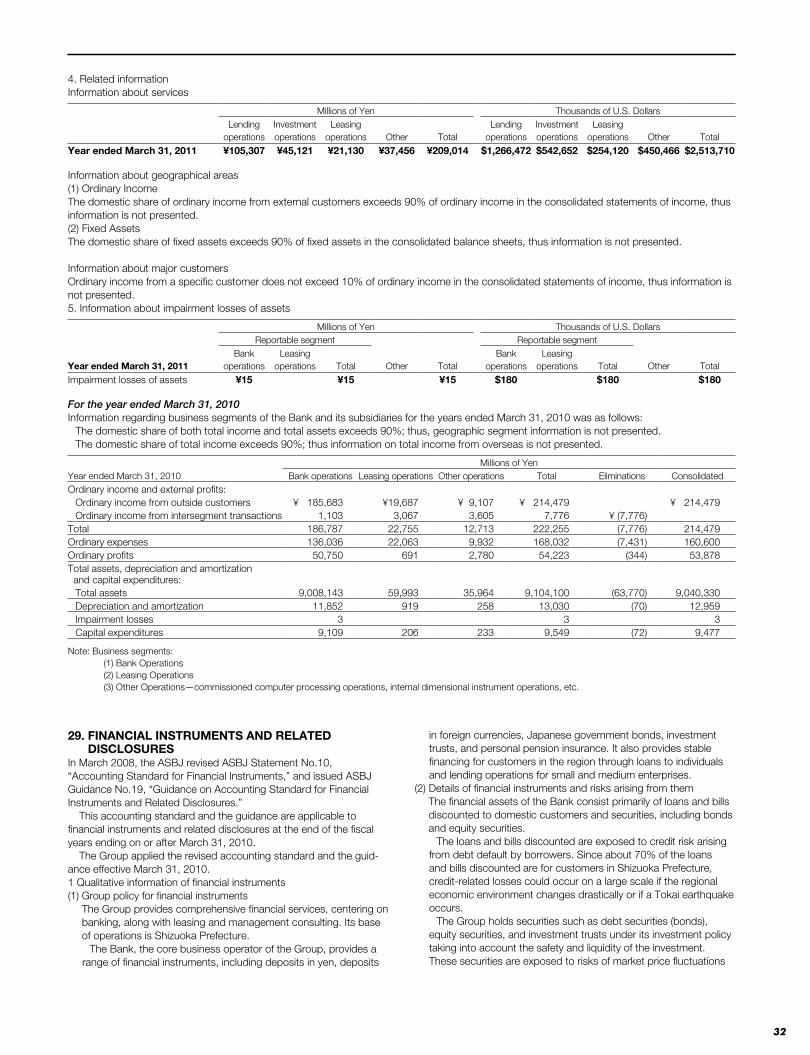
32
4. Related informationInformation about services
Millions of Yen Thousands of U.S. DollarsLending
operationsInvestment operations
Leasing operations Other Total
Lending operations
Investment operations
Leasing operations Other Total
Year ended March 31, 2011 ¥105,307 ¥45,121 ¥21,130 ¥37,456 ¥209,014 $1,266,472 $542,652 $254,120 $450,466 $2,513,710
Information about geographical areas(1) Ordinary IncomeThe domestic share of ordinary income from external customers exceeds 90% of ordinary income in the consolidated statements of income, thus information is not presented.(2) Fixed AssetsThe domestic share of fixed assets exceeds 90% of fixed assets in the consolidated balance sheets, thus information is not presented.
Information about major customersOrdinary income from a specific customer does not exceed 10% of ordinary income in the consolidated statements of income, thus information is not presented.5. Information about impairment losses of assets
Millions of Yen Thousands of U.S. DollarsReportable segment Reportable segment
Year ended March 31, 2011Bank
operationsLeasing
operations Total Other TotalBank
operationsLeasing
operations Total Other Total
Impairment losses of assets ¥15 ¥15 ¥15 $180 $180 $180
For the year ended March 31, 2010Information regarding business segments of the Bank and its subsidiaries for the years ended March 31, 2010 was as follows:
The domestic share of both total income and total assets exceeds 90%; thus, geographic segment information is not presented.The domestic share of total income exceeds 90%; thus information on total income from overseas is not presented.
Millions of YenYear ended March 31, 2010 Bank operations Leasing operations Other operations Total Eliminations ConsolidatedOrdinary income and external profits:
Ordinary income from outside customers ¥ 185,683 ¥19,687 ¥ 9,107 ¥ 214,479 ¥ 214,479Ordinary income from intersegment transactions 1,103 3,067 3,605 7,776 ¥ (7,776)
Total 186,787 22,755 12,713 222,255 (7,776) 214,479Ordinary expenses 136,036 22,063 9,932 168,032 (7,431) 160,600Ordinary profits 50,750 691 2,780 54,223 (344) 53,878Total assets, depreciation and amortization and capital expenditures:
Total assets 9,008,143 59,993 35,964 9,104,100 (63,770) 9,040,330Depreciation and amortization 11,852 919 258 13,030 (70) 12,959Impairment losses 3 3 3Capital expenditures 9,109 206 233 9,549 (72) 9,477
Note: Business segments: (1) Bank Operations (2) Leasing Operations (3) Other Operations—commissioned computer processing operations, internal dimensional instrument operations, etc.
29. FINANCIAL INSTRUMENTS AND RELATED DISCLOSURES
In March 2008, the ASBJ revised ASBJ Statement No.10, “Accounting Standard for Financial Instruments,” and issued ASBJ Guidance No.19, “Guidance on Accounting Standard for Financial Instruments and Related Disclosures.” This accounting standard and the guidance are applicable to financial instruments and related disclosures at the end of the fiscal years ending on or after March 31, 2010. The Group applied the revised accounting standard and the guid-ance effective March 31, 2010.1 Qualitative information of financial instruments(1) Group policy for financial instruments
The Group provides comprehensive financial services, centering on banking, along with leasing and management consulting. Its base of operations is Shizuoka Prefecture.
The Bank, the core business operator of the Group, provides a range of financial instruments, including deposits in yen, deposits
in foreign currencies, Japanese government bonds, investment trusts, and personal pension insurance. It also provides stable financing for customers in the region through loans to individuals and lending operations for small and medium enterprises.
(2) Details of financial instruments and risks arising from them The financial assets of the Bank consist primarily of loans and bills discounted to domestic customers and securities, including bonds and equity securities.
The loans and bills discounted are exposed to credit risk arising from debt default by borrowers. Since about 70% of the loans and bills discounted are for customers in Shizuoka Prefecture, credit-related losses could occur on a large scale if the regional economic environment changes drastically or if a Tokai earthquake occurs.
The Group holds securities such as debt securities (bonds), equity securities, and investment trusts under its investment policy taking into account the safety and liquidity of the investment. These securities are exposed to risks of market price fluctuations
33
associated with the credit standing of issuers and interest rate changes. If the prices of equity securities and other securities held decline, impairment losses or valuation losses could adversely affect the operating results and financial standing of the Group.
Financial liabilities consist primarily of deposits from domestic customers, corporate bonds, and funds raised in the call market. If the Group loses its credit status because of downgrades or other factors or if the market environment deteriorates, conditions for financing could worsen or transactions could be constrained.
The Group enters into derivative transactions for customer needs of hedging exchange rates or interest rates, and for asset and liability management (ALM) or hedging individual transactions to appropriately manage the market risks of the Group. The Group also conducts trading transactions for the short term.
Derivatives mainly include interest-rate swaps, currency swaps, and bond futures, and are exposed to market risk that could cause losses in association with changes in interest rate markets and foreign exchange markets as well as credit risk (counterparty risk), that is, the risk of default on the initial contract due to the bankruptcy of the counterparty or other factors. Between financial assets and financial liabilities, there are interest rate risks associ-ated with mismatches of interest rates and terms.
(3) Risk management systems for financial instruments(i) Integrated risk management system
Under the Basic Risk Management Regulations that stipulate the Group’s basic risk management policy, the Group has established a basic framework including an organizational structure for defining and managing risks and specific proce-dures for risk management.
To ensure a balance between profitability and soundness, the Group has introduced a management system based on a risk capital allocation at the core of integrated risk management.
The risk capital allocation is a system for avoiding excessive risk taking by setting risk limits. This system allocates core regulatory capital to each operational department or section and controls risk so that if market risks emerge, losses will be contained within the range of shareholder’s equity.
(ii) Credit risk management system Credit risk is the risk of incurring losses when collecting loans
and bills discounted becomes difficult because of the worsen-ing of borrowers’ financial conditions.
The Credit Risk Management Group of the Risk Management Department manages all credit risk relating to the Group’s operations both in Japan and overseas in order to ensure the soundness of the Group’s loan asset portfolio.
The Bank’s borrower credit rating system, which is an essential part of its credit risk management, together with other internal rating systems, are operated by the Rating Assessment Group of the Credit Department, designed and supervised by the Credit Risk Management Group which is independent from the Credit Department, and verified by the Risk Management Group of the Risk Management Department.
These three units exercise a mutual limitation and checking function with respect to one another, thereby facilitating greater precision and more advanced functions in the Bank’s internal ratings system.
In addition, the Asset Auditing Group inspects if credit risk management is performed conforming to the relevant rules through verification of the self-assessment process.
The Credit Risk Management Group uses statistical methods to quantify latent credit risk across the Bank’s entire loan portfolio. In this way, the Bank accurately assesses the scale of potential risk, monitors the concentration of loans to particular large-scale borrowers or specific industries, and thus controls the portfolio to avoid excessive credit risk.
The Bank’s credit risk management status, with the status of market risk management and liquidity risk management, which is described below, is reported through monthly meetings of
the Committee for Integrated Risk and Budget Management, which is chaired by the President, and other channels to management.
(iii) Market risk management system Market risk is the risk of incurring losses in association with
changes in the prices of financial assets and liabilities that are caused by changes in interest rates, stock prices, and foreign-exchange rates.
The Group controls the degree of market risks within a certain range by setting risk capital allocations to market transac-tions, the lower limits of gains or losses from the valuation of investment securities, and other limits including position limits in accordance with the risk attributes of each transaction and product, and limits of losses.
The Bank has established ALM hedge criteria for transactions in banking accounts, especially deposits, loans and bills discounted, and investment securities, to control the degree of market risk within a certain range. The ALM Group of the Corporate Planning Department discusses ALM hedge policies based on the situation of interest rate risks and expected inter-est rates at meetings of the Committee for Integrated Risk and Budget Management.
The Bank has established a system of cross-checks and balances in the market division by strictly separating trading departments and operation departments, and has set up an independent risk management department. The Audit Department, which is independent of audited departments, checks the effectiveness of this system of checks and balances among the three divisions.
The Bank and the Shizuoka Bank (Europe) S.A measure the market risks (the estimation of possible losses) of financial assets and liabilities such as securities and derivatives held in trading portfolios, and loans, securities, deposits, bonds payable and derivative transactions held in banking portfolios, using Value at Risk (“VaR”). They are utilized for the quantitative analysis to manage market fluctuations.
A variance co-variance model is used for the measurement of VaR. The Bank performs back-testing comparing VaR calculated by the model and actual profit and loss, in order to determine whether measurement model captures market risks with sufficient accuracy.
Nevertheless, VaR measures possible market risk amounts statistically calculated based on historical data, and is unlikely to capture risks under significant market fluctuations not presumed.
The total amount of market risks as of March 31, 2011 is as follows:
March 31, 2011 Millions of YenThousands ofU.S. Dollars
VaR ¥120,792 $1,452,699
The assumptions used to measure VaR are as follows: Observation period: 1 year Confidence interval: 99% Holding period: 10 days, 21 days or 125 days classified by
the nature of transaction The due date of core deposits, defined as demand deposits
staying long-term without withdrawal, are allocated within 5 years (average 2.5 years).
(iv) Liquidity risk management system There are two types of liquidity risk: (1) financing risk, that is,
the risk of not being able to secure needed funds as a result of worsening market conditions and other factors, or incurring losses due to being forced to raise funds at much higher inter-est rates than usual, and (2) market liquidity risk, that is, the risk of not being able to trade financial instruments such as bonds because of market turmoil or other factors or incurring losses due to being forced to trade financial instruments at far less favorable prices than usual.
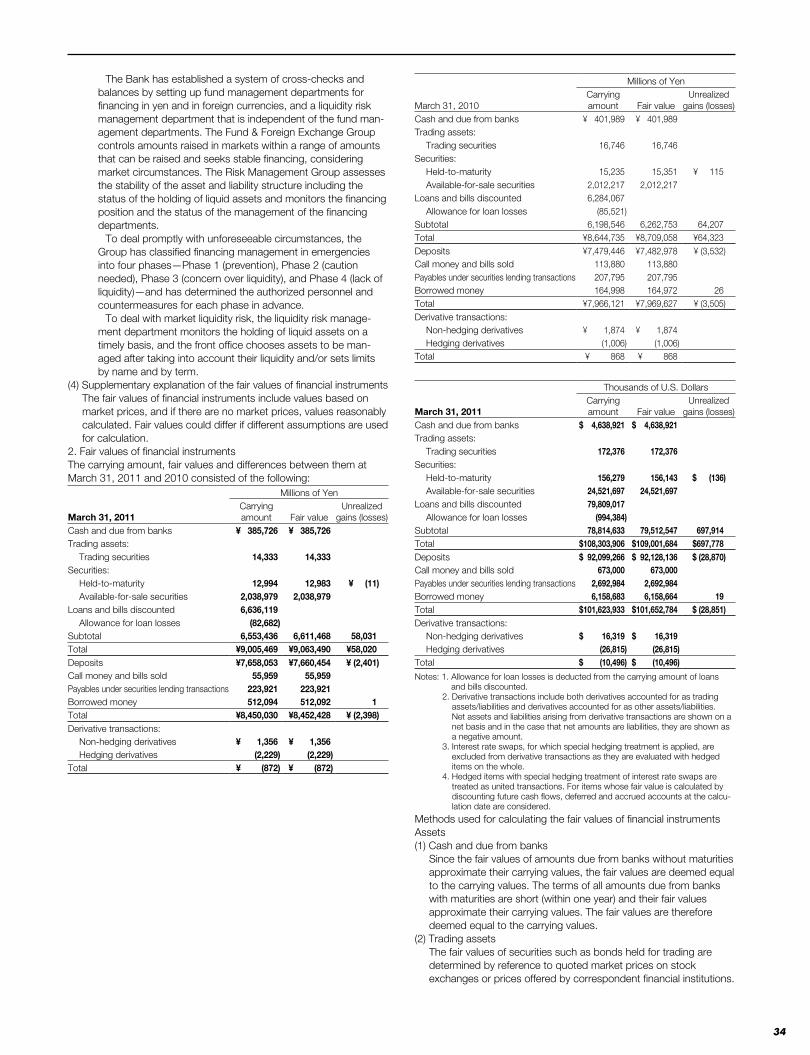
34
The Bank has established a system of cross-checks and balances by setting up fund management departments for financing in yen and in foreign currencies, and a liquidity risk management department that is independent of the fund man-agement departments. The Fund & Foreign Exchange Group controls amounts raised in markets within a range of amounts that can be raised and seeks stable financing, considering market circumstances. The Risk Management Group assesses the stability of the asset and liability structure including the status of the holding of liquid assets and monitors the financing position and the status of the management of the financing departments.
To deal promptly with unforeseeable circumstances, the Group has classified financing management in emergencies into four phases—Phase 1 (prevention), Phase 2 (caution needed), Phase 3 (concern over liquidity), and Phase 4 (lack of liquidity)—and has determined the authorized personnel and countermeasures for each phase in advance.
To deal with market liquidity risk, the liquidity risk manage-ment department monitors the holding of liquid assets on a timely basis, and the front office chooses assets to be man-aged after taking into account their liquidity and/or sets limits by name and by term.
(4) Supplementary explanation of the fair values of financial instrumentsThe fair values of financial instruments include values based on market prices, and if there are no market prices, values reasonably calculated. Fair values could differ if different assumptions are used for calculation.
2. Fair values of financial instrumentsThe carrying amount, fair values and differences between them at March 31, 2011 and 2010 consisted of the following:
Millions of Yen
March 31, 2011Carrying amount Fair value
Unrealized gains (losses)
Cash and due from banks ¥ 385,726 ¥ 385,726Trading assets:
Trading securities 14,333 14,333Securities:
Held-to-maturity 12,994 12,983 ¥ (11)Available-for-sale securities 2,038,979 2,038,979
Loans and bills discounted 6,636,119Allowance for loan losses (82,682)
Subtotal 6,553,436 6,611,468 58,031Total ¥9,005,469 ¥9,063,490 ¥58,020Deposits ¥7,658,053 ¥7,660,454 ¥ (2,401)Call money and bills sold 55,959 55,959Payables under securities lending transactions 223,921 223,921Borrowed money 512,094 512,092 1Total ¥8,450,030 ¥8,452,428 ¥ (2,398)Derivative transactions:
Non-hedging derivatives ¥ 1,356 ¥ 1,356Hedging derivatives (2,229) (2,229)
Total ¥ (872) ¥ (872)
Millions of Yen
March 31, 2010Carrying amount Fair value
Unrealized gains (losses)
Cash and due from banks ¥ 401,989 ¥ 401,989Trading assets:
Trading securities 16,746 16,746Securities:
Held-to-maturity 15,235 15,351 ¥ 115Available-for-sale securities 2,012,217 2,012,217
Loans and bills discounted 6,284,067Allowance for loan losses (85,521)
Subtotal 6,198,546 6,262,753 64,207Total ¥8,644,735 ¥8,709,058 ¥64,323Deposits ¥7,479,446 ¥7,482,978 ¥ (3,532)Call money and bills sold 113,880 113,880Payables under securities lending transactions 207,795 207,795Borrowed money 164,998 164,972 26Total ¥7,966,121 ¥7,969,627 ¥ (3,505)Derivative transactions:
Non-hedging derivatives ¥ 1,874 ¥ 1,874Hedging derivatives (1,006) (1,006)
Total ¥ 868 ¥ 868
Thousands of U.S. Dollars
March 31, 2011Carrying amount Fair value
Unrealized gains (losses)
Cash and due from banks $ 4,638,921 $ 4,638,921Trading assets:
Trading securities 172,376 172,376Securities:
Held-to-maturity 156,279 156,143 $ (136)Available-for-sale securities 24,521,697 24,521,697
Loans and bills discounted 79,809,017Allowance for loan losses (994,384)
Subtotal 78,814,633 79,512,547 697,914Total $108,303,906 $109,001,684 $697,778Deposits $ 92,099,266 $ 92,128,136 $ (28,870)Call money and bills sold 673,000 673,000Payables under securities lending transactions 2,692,984 2,692,984Borrowed money 6,158,683 6,158,664 19Total $101,623,933 $101,652,784 $ (28,851)Derivative transactions:
Non-hedging derivatives $ 16,319 $ 16,319Hedging derivatives (26,815) (26,815)
Total $ (10,496) $ (10,496)
Notes: 1. Allowance for loan losses is deducted from the carrying amount of loans and bills discounted.
2. Derivative transactions include both derivatives accounted for as trading assets/liabilities and derivatives accounted for as other assets/liabilities. Net assets and liabilities arising from derivative transactions are shown on a net basis and in the case that net amounts are liabilities, they are shown as a negative amount.
3. Interest rate swaps, for which special hedging treatment is applied, are excluded from derivative transactions as they are evaluated with hedged items on the whole.
4. Hedged items with special hedging treatment of interest rate swaps are treated as united transactions. For items whose fair value is calculated by discounting future cash flows, deferred and accrued accounts at the calcu-lation date are considered.
Methods used for calculating the fair values of financial instrumentsAssets(1) Cash and due from banks
Since the fair values of amounts due from banks without maturities approximate their carrying values, the fair values are deemed equal to the carrying values. The terms of all amounts due from banks with maturities are short (within one year) and their fair values approximate their carrying values. The fair values are therefore deemed equal to the carrying values.
(2) Trading assetsThe fair values of securities such as bonds held for trading are determined by reference to quoted market prices on stock exchanges or prices offered by correspondent financial institutions.
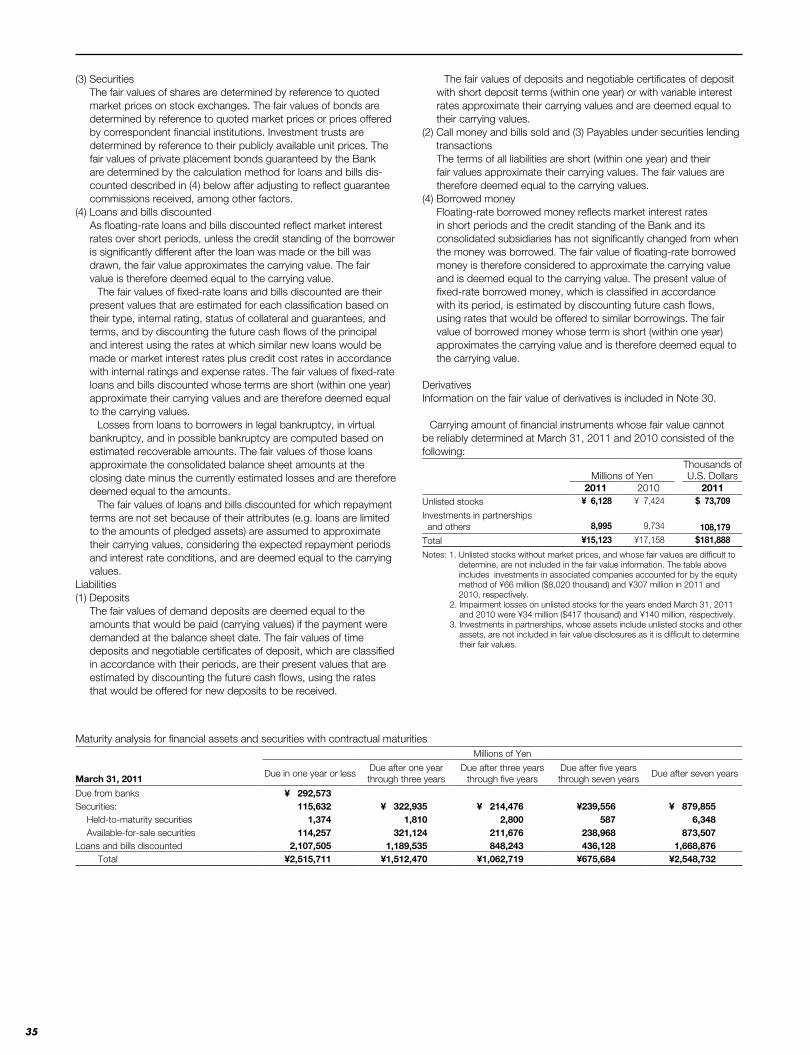
35
Maturity analysis for financial assets and securities with contractual maturitiesMillions of Yen
March 31, 2011Due in one year or less
Due after one year through three years
Due after three years through five years
Due after five years through seven years
Due after seven years
Due from banks ¥ 292,573Securities: 115,632 ¥ 322,935 ¥ 214,476 ¥239,556 ¥ 879,855
Held-to-maturity securities 1,374 1,810 2,800 587 6,348Available-for-sale securities 114,257 321,124 211,676 238,968 873,507
Loans and bills discounted 2,107,505 1,189,535 848,243 436,128 1,668,876Total ¥2,515,711 ¥1,512,470 ¥1,062,719 ¥675,684 ¥2,548,732
(3) SecuritiesThe fair values of shares are determined by reference to quoted market prices on stock exchanges. The fair values of bonds are determined by reference to quoted market prices or prices offered by correspondent financial institutions. Investment trusts are determined by reference to their publicly available unit prices. The fair values of private placement bonds guaranteed by the Bank are determined by the calculation method for loans and bills dis-counted described in (4) below after adjusting to reflect guarantee commissions received, among other factors.
(4) Loans and bills discountedAs floating-rate loans and bills discounted reflect market interest rates over short periods, unless the credit standing of the borrower is significantly different after the loan was made or the bill was drawn, the fair value approximates the carrying value. The fair value is therefore deemed equal to the carrying value.
The fair values of fixed-rate loans and bills discounted are their present values that are estimated for each classification based on their type, internal rating, status of collateral and guarantees, and terms, and by discounting the future cash flows of the principal and interest using the rates at which similar new loans would be made or market interest rates plus credit cost rates in accordance with internal ratings and expense rates. The fair values of fixed-rate loans and bills discounted whose terms are short (within one year) approximate their carrying values and are therefore deemed equal to the carrying values.
Losses from loans to borrowers in legal bankruptcy, in virtual bankruptcy, and in possible bankruptcy are computed based on estimated recoverable amounts. The fair values of those loans approximate the consolidated balance sheet amounts at the closing date minus the currently estimated losses and are therefore deemed equal to the amounts.
The fair values of loans and bills discounted for which repayment terms are not set because of their attributes (e.g. loans are limited to the amounts of pledged assets) are assumed to approximate their carrying values, considering the expected repayment periods and interest rate conditions, and are deemed equal to the carrying values.
Liabilities(1) Deposits
The fair values of demand deposits are deemed equal to the amounts that would be paid (carrying values) if the payment were demanded at the balance sheet date. The fair values of time deposits and negotiable certificates of deposit, which are classified in accordance with their periods, are their present values that are estimated by discounting the future cash flows, using the rates that would be offered for new deposits to be received.
The fair values of deposits and negotiable certificates of deposit with short deposit terms (within one year) or with variable interest rates approximate their carrying values and are deemed equal to their carrying values.
(2) Call money and bills sold and (3) Payables under securities lending transactionsThe terms of all liabilities are short (within one year) and their fair values approximate their carrying values. The fair values are therefore deemed equal to the carrying values.
(4) Borrowed moneyFloating-rate borrowed money reflects market interest rates in short periods and the credit standing of the Bank and its consolidated subsidiaries has not significantly changed from when the money was borrowed. The fair value of floating-rate borrowed money is therefore considered to approximate the carrying value and is deemed equal to the carrying value. The present value of fixed-rate borrowed money, which is classified in accordance with its period, is estimated by discounting future cash flows, using rates that would be offered to similar borrowings. The fair value of borrowed money whose term is short (within one year) approximates the carrying value and is therefore deemed equal to the carrying value.
DerivativesInformation on the fair value of derivatives is included in Note 30.
Carrying amount of financial instruments whose fair value cannot be reliably determined at March 31, 2011 and 2010 consisted of the following:
Millions of YenThousands ofU.S. Dollars
2011 2010 2011Unlisted stocks ¥ 6,128 ¥ 7,424 $ 73,709
Investments in partnerships and others 8,995 9,734 108,179Total ¥15,123 ¥17,158 $181,888
Notes: 1. Unlisted stocks without market prices, and whose fair values are difficult to determine, are not included in the fair value information. The table above includes investments in associated companies accounted for by the equity method of ¥66 million ($8,020 thousand) and ¥307 million in 2011 and 2010, respectively.
2. Impairment losses on unlisted stocks for the years ended March 31, 2011 and 2010 were ¥34 million ($417 thousand) and ¥140 million, respectively.
3. Investments in partnerships, whose assets include unlisted stocks and other assets, are not included in fair value disclosures as it is difficult to determine their fair values.
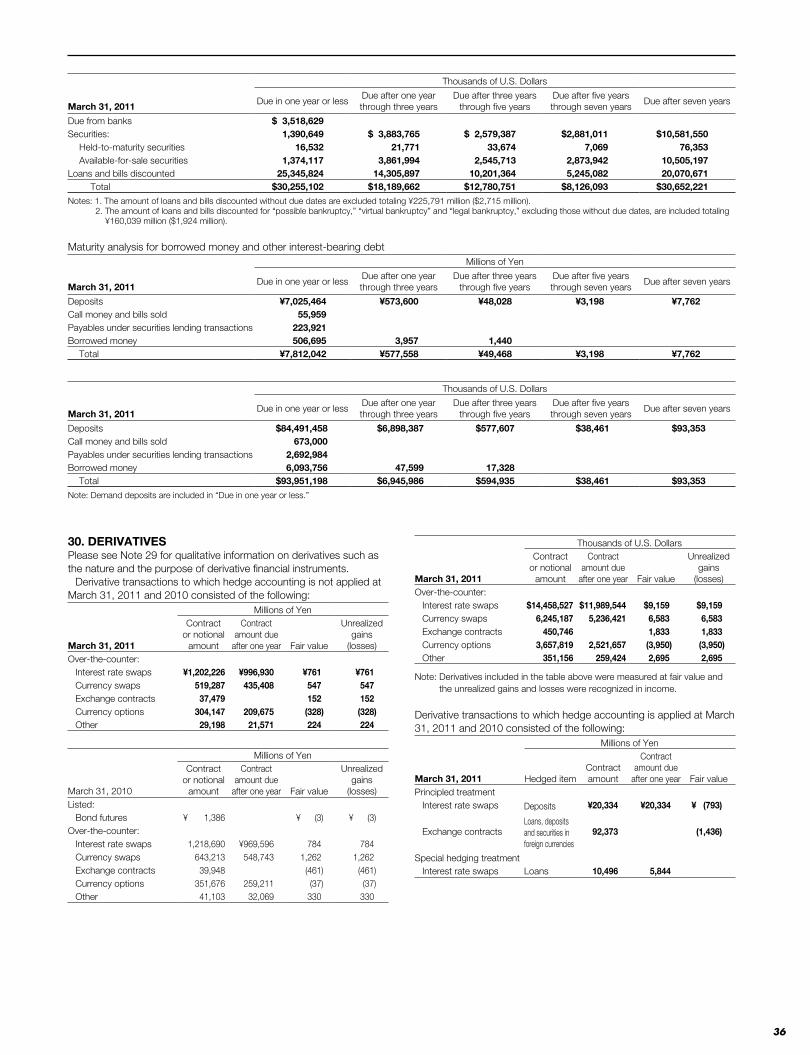
36
Thousands of U.S. Dollars
March 31, 2011Due in one year or less
Due after one year through three years
Due after three years through five years
Due after five years through seven years
Due after seven years
Due from banks $ 3,518,629Securities: 1,390,649 $ 3,883,765 $ 2,579,387 $2,881,011 $10,581,550
Held-to-maturity securities 16,532 21,771 33,674 7,069 76,353Available-for-sale securities 1,374,117 3,861,994 2,545,713 2,873,942 10,505,197
Loans and bills discounted 25,345,824 14,305,897 10,201,364 5,245,082 20,070,671Total $30,255,102 $18,189,662 $12,780,751 $8,126,093 $30,652,221
Notes: 1. The amount of loans and bills discounted without due dates are excluded totaling ¥225,791 million ($2,715 million). 2. The amount of loans and bills discounted for “possible bankruptcy,” “virtual bankruptcy” and “legal bankruptcy,” excluding those without due dates, are included totaling
¥160,039 million ($1,924 million).
Maturity analysis for borrowed money and other interest-bearing debtMillions of Yen
March 31, 2011Due in one year or less
Due after one year through three years
Due after three years through five years
Due after five years through seven years
Due after seven years
Deposits ¥7,025,464 ¥573,600 ¥48,028 ¥3,198 ¥7,762Call money and bills sold 55,959Payables under securities lending transactions 223,921Borrowed money 506,695 3,957 1,440
Total ¥7,812,042 ¥577,558 ¥49,468 ¥3,198 ¥7,762
Thousands of U.S. Dollars
March 31, 2011Due in one year or less
Due after one year through three years
Due after three years through five years
Due after five years through seven years
Due after seven years
Deposits $84,491,458 $6,898,387 $577,607 $38,461 $93,353Call money and bills sold 673,000Payables under securities lending transactions 2,692,984Borrowed money 6,093,756 47,599 17,328
Total $93,951,198 $6,945,986 $594,935 $38,461 $93,353
Note: Demand deposits are included in “Due in one year or less.”
30. DERIVATIVESPlease see Note 29 for qualitative information on derivatives such as the nature and the purpose of derivative financial instruments.
Derivative transactions to which hedge accounting is not applied at March 31, 2011 and 2010 consisted of the following:
Millions of Yen
March 31, 2011
Contract or notional
amount
Contract amount due
after one year Fair value
Unrealized gains
(losses)Over-the-counter:
Interest rate swaps ¥1,202,226 ¥996,930 ¥761 ¥761Currency swaps 519,287 435,408 547 547Exchange contracts 37,479 152 152Currency options 304,147 209,675 (328) (328)Other 29,198 21,571 224 224
Millions of Yen
March 31, 2010
Contract or notional
amount
Contract amount due
after one year Fair value
Unrealized gains
(losses)Listed:
Bond futures ¥ 1,386 ¥ (3) ¥ (3)Over-the-counter:
Interest rate swaps 1,218,690 ¥969,596 784 784Currency swaps 643,213 548,743 1,262 1,262Exchange contracts 39,948 (461) (461)Currency options 351,676 259,211 (37) (37)Other 41,103 32,069 330 330
Thousands of U.S. Dollars
March 31, 2011
Contract or notional
amount
Contract amount due
after one year Fair value
Unrealized gains
(losses)Over-the-counter:
Interest rate swaps $14,458,527 $11,989,544 $9,159 $9,159Currency swaps 6,245,187 5,236,421 6,583 6,583Exchange contracts 450,746 1,833 1,833Currency options 3,657,819 2,521,657 (3,950) (3,950)Other 351,156 259,424 2,695 2,695
Note: Derivatives included in the table above were measured at fair value and the unrealized gains and losses were recognized in income.
Derivative transactions to which hedge accounting is applied at March 31, 2011 and 2010 consisted of the following:
Millions of Yen
March 31, 2011 Hedged itemContract amount
Contract amount due
after one year Fair valuePrincipled treatment
Interest rate swaps Deposits
Loans, deposits and securities in foreign currencies
¥20,334 ¥20,334 ¥ (793)
Exchange contracts 92,373 (1,436)
Special hedging treatment Interest rate swaps Loans 10,496 5,844
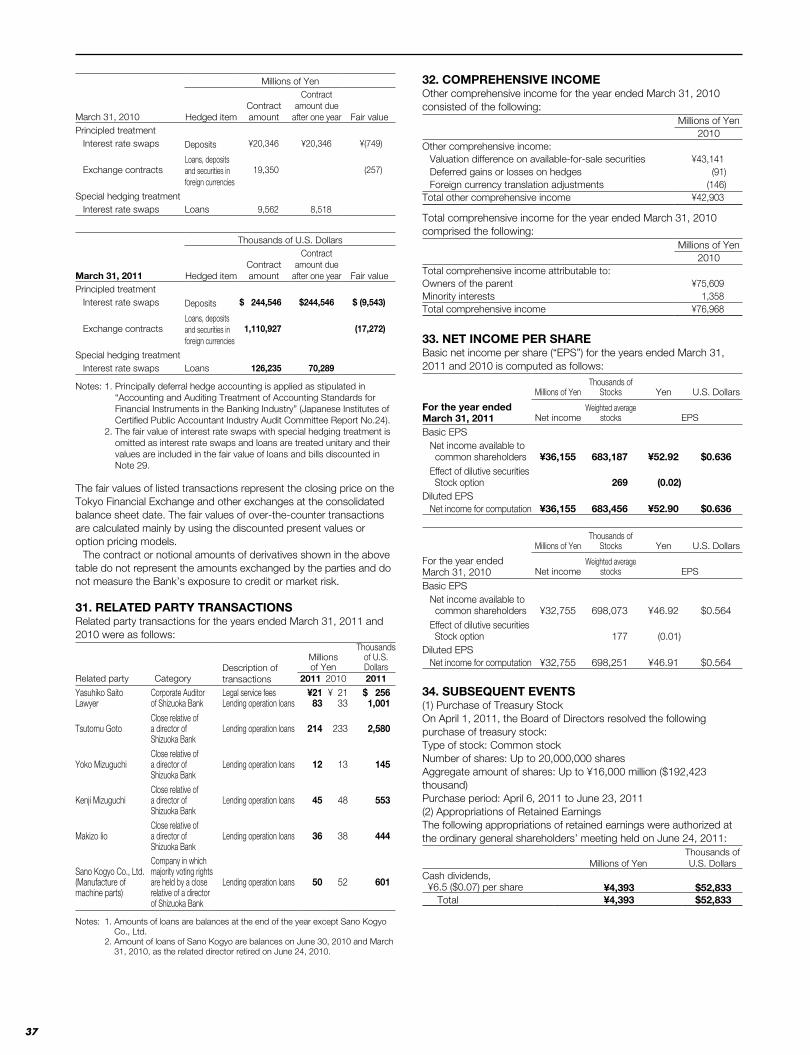
37
Millions of Yen
March 31, 2010 Hedged itemContract amount
Contract amount due
after one year Fair valuePrincipled treatment
Interest rate swaps Deposits
Loans, deposits and securities in foreign currencies
¥20,346 ¥20,346 ¥(749)
Exchange contracts 19,350 (257)
Special hedging treatment Interest rate swaps Loans 9,562 8,518
Thousands of U.S. Dollars
March 31, 2011 Hedged itemContract amount
Contract amount due
after one year Fair valuePrincipled treatment
Interest rate swaps Deposits
Loans, deposits and securities in foreign currencies
$ 244,546 $244,546 $ (9,543)
Exchange contracts 1,110,927 (17,272)
Special hedging treatment Interest rate swaps Loans 126,235 70,289
Notes: 1. Principally deferral hedge accounting is applied as stipulated in “Accounting and Auditing Treatment of Accounting Standards for Financial Instruments in the Banking Industry” (Japanese Institutes of Certified Public Accountant Industry Audit Committee Report No.24).
2. The fair value of interest rate swaps with special hedging treatment is omitted as interest rate swaps and loans are treated unitary and their values are included in the fair value of loans and bills discounted in Note 29.
The fair values of listed transactions represent the closing price on the Tokyo Financial Exchange and other exchanges at the consolidated balance sheet date. The fair values of over-the-counter transactions are calculated mainly by using the discounted present values or option pricing models.
The contract or notional amounts of derivatives shown in the above table do not represent the amounts exchanged by the parties and do not measure the Bank’s exposure to credit or market risk.
31. RELATED PARTY TRANSACTIONSRelated party transactions for the years ended March 31, 2011 and 2010 were as follows:
Related party CategoryDescription of transactions
Millions of Yen
Thousands of U.S. Dollars
2011 2010 2011
Yasuhiko Saito Lawyer
Corporate Auditor of Shizuoka Bank
Legal service fees Lending operation loans
¥2183
¥ 2133
$ 2561,001
Tsutomu GotoClose relative of a director of Shizuoka Bank
Lending operation loans 214 233 2,580
Yoko MizuguchiClose relative of a director of Shizuoka Bank
Lending operation loans 12 13 145
Kenji MizuguchiClose relative of a director of Shizuoka Bank
Lending operation loans 45 48 553
Makizo IioClose relative of a director of Shizuoka Bank
Lending operation loans 36 38 444
Sano Kogyo Co., Ltd. (Manufacture of machine parts)
Company in which majority voting rights are held by a close relative of a director of Shizuoka Bank
Lending operation loans 50 52 601
Notes: 1. Amounts of loans are balances at the end of the year except Sano Kogyo Co., Ltd.
2. Amount of loans of Sano Kogyo are balances on June 30, 2010 and March 31, 2010, as the related director retired on June 24, 2010.
32. COMPREHENSIVE INCOMEOther comprehensive income for the year ended March 31, 2010 consisted of the following:
Millions of Yen2010
Other comprehensive income:Valuation difference on available-for-sale securities ¥43,141 Deferred gains or losses on hedges (91)Foreign currency translation adjustments (146)
Total other comprehensive income ¥42,903
Total comprehensive income for the year ended March 31, 2010 comprised the following:
Millions of Yen2010
Total comprehensive income attributable to:Owners of the parent ¥75,609 Minority interests 1,358 Total comprehensive income ¥76,968
33. NET INCOME PER SHAREBasic net income per share (“EPS”) for the years ended March 31, 2011 and 2010 is computed as follows:
Millions of YenThousands of
Stocks Yen U.S. Dollars
For the year ended March 31, 2011 Net income
Weighted average stocks EPS
Basic EPSNet income available to common shareholders ¥36,155 683,187 ¥52.92 $0.636Effect of dilutive securities Stock option 269 (0.02)
Diluted EPSNet income for computation ¥36,155 683,456 ¥52.90 $0.636
Millions of YenThousands of
Stocks Yen U.S. Dollars
For the year ended March 31, 2010 Net income
Weighted average stocks EPS
Basic EPSNet income available to common shareholders ¥32,755 698,073 ¥46.92 $0.564Effect of dilutive securities Stock option 177 (0.01)
Diluted EPSNet income for computation ¥32,755 698,251 ¥46.91 $0.564
34. SUBSEQUENT EVENTS(1) Purchase of Treasury StockOn April 1, 2011, the Board of Directors resolved the following purchase of treasury stock:Type of stock: Common stockNumber of shares: Up to 20,000,000 sharesAggregate amount of shares: Up to ¥16,000 million ($192,423 thousand)Purchase period: April 6, 2011 to June 23, 2011(2) Appropriations of Retained EarningsThe following appropriations of retained earnings were authorized at the ordinary general shareholders’ meeting held on June 24, 2011:
Millions of YenThousands ofU.S. Dollars
Cash dividends, ¥6.5 ($0.07) per share ¥4,393 $52,833
Total ¥4,393 $52,833
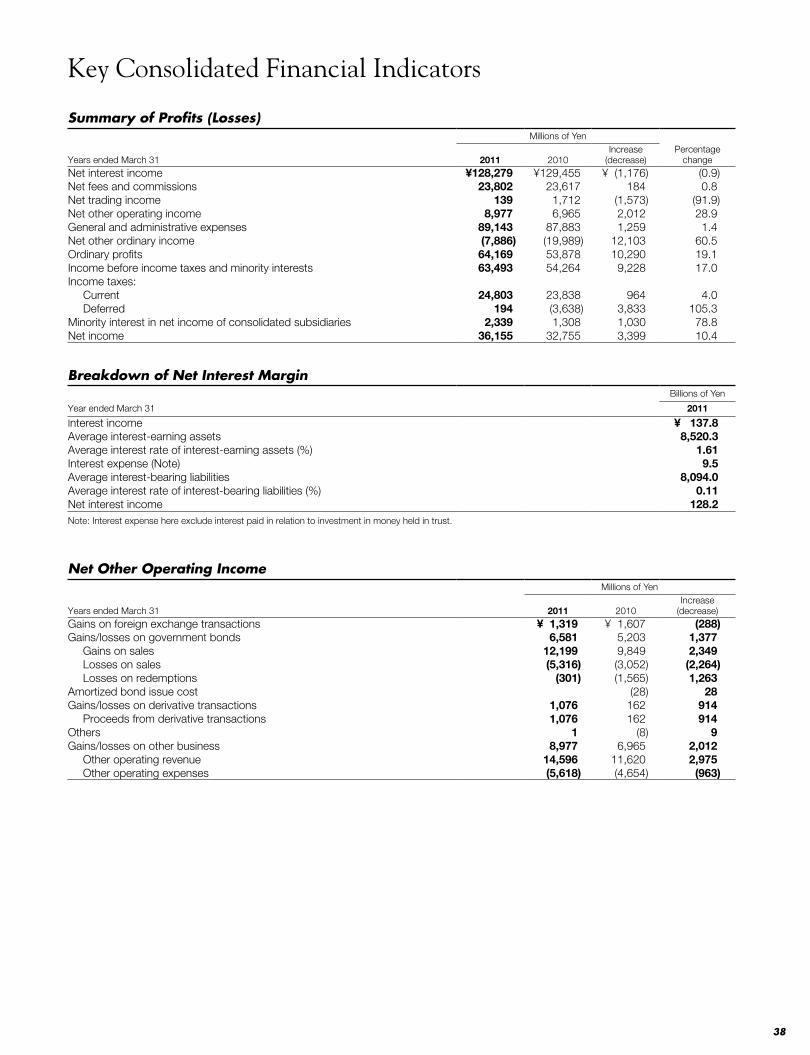
38
Key Consolidated Financial Indicators
Summary of Profits (Losses)Millions of Yen
Years ended March 31 2011 2010Increase
(decrease)Percentage
changeNet interest income ¥128,279 ¥129,455 ¥ (1,176) (0.9)Net fees and commissions 23,802 23,617 184 0.8Net trading income 139 1,712 (1,573) (91.9)Net other operating income 8,977 6,965 2,012 28.9General and administrative expenses 89,143 87,883 1,259 1.4Net other ordinary income (7,886) (19,989) 12,103 60.5Ordinary profits 64,169 53,878 10,290 19.1Income before income taxes and minority interests 63,493 54,264 9,228 17.0Income taxes:
Current 24,803 23,838 964 4.0Deferred 194 (3,638) 3,833 105.3
Minority interest in net income of consolidated subsidiaries 2,339 1,308 1,030 78.8Net income 36,155 32,755 3,399 10.4
Breakdown of Net Interest MarginBillions of Yen
Year ended March 31 2011
Interest income ¥ 137.8Average interest-earning assets 8,520.3Average interest rate of interest-earning assets (%) 1.61Interest expense (Note) 9.5Average interest-bearing liabilities 8,094.0Average interest rate of interest-bearing liabilities (%) 0.11Net interest income 128.2Note: Interest expense here exclude interest paid in relation to investment in money held in trust.
Net Other Operating IncomeMillions of Yen
Years ended March 31 2011 2010Increase
(decrease)Gains on foreign exchange transactions ¥ 1,319 ¥ 1,607 (288)Gains/losses on government bonds 6,581 5,203 1,377
Gains on sales 12,199 9,849 2,349Losses on sales (5,316) (3,052) (2,264)Losses on redemptions (301) (1,565) 1,263
Amortized bond issue cost (28) 28Gains/losses on derivative transactions 1,076 162 914
Proceeds from derivative transactions 1,076 162 914Others 1 (8) 9Gains/losses on other business 8,977 6,965 2,012
Other operating revenue 14,596 11,620 2,975Other operating expenses (5,618) (4,654) (963)
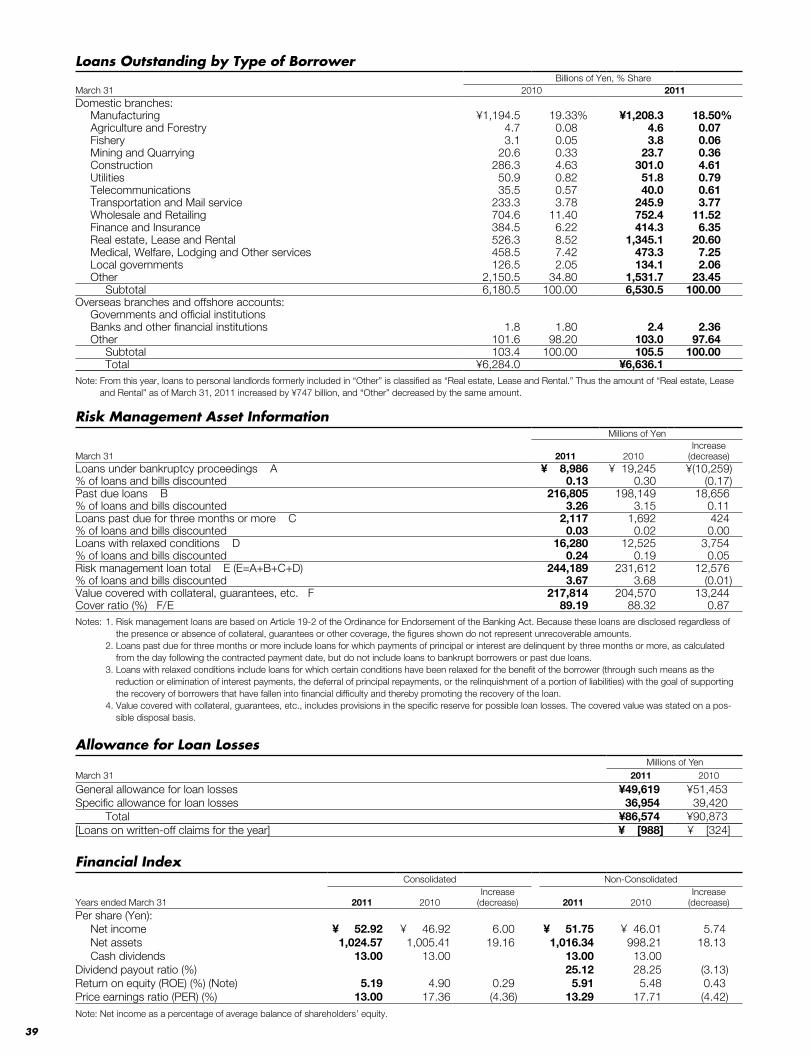
39
Loans Outstanding by Type of BorrowerBillions of Yen, % Share
March 31 2010 2011Domestic branches:
Manufacturing ¥1,194.5 19.33% ¥1,208.3 18.50%Agriculture and Forestry 4.7 0.08 4.6 0.07Fishery 3.1 0.05 3.8 0.06Mining and Quarrying 20.6 0.33 23.7 0.36Construction 286.3 4.63 301.0 4.61Utilities 50.9 0.82 51.8 0.79Telecommunications 35.5 0.57 40.0 0.61Transportation and Mail service 233.3 3.78 245.9 3.77Wholesale and Retailing 704.6 11.40 752.4 11.52Finance and Insurance 384.5 6.22 414.3 6.35Real estate, Lease and Rental 526.3 8.52 1,345.1 20.60Medical, Welfare, Lodging and Other services 458.5 7.42 473.3 7.25Local governments 126.5 2.05 134.1 2.06Other 2,150.5 34.80 1,531.7 23.45
Subtotal 6,180.5 100.00 6,530.5 100.00Overseas branches and offshore accounts:
Governments and official institutionsBanks and other financial institutions 1.8 1.80 2.4 2.36Other 101.6 98.20 103.0 97.64
Subtotal 103.4 100.00 105.5 100.00Total ¥6,284.0 ¥6,636.1
Note: From this year, loans to personal landlords formerly included in “Other” is classified as “Real estate, Lease and Rental.” Thus the amount of “Real estate, Lease and Rental” as of March 31, 2011 increased by ¥747 billion, and “Other” decreased by the same amount.
Risk Management Asset InformationMillions of Yen
March 31 2011 2010Increase
(decrease)Loans under bankruptcy proceedings A ¥ 8,986 ¥ 19,245 ¥(10,259)% of loans and bills discounted 0.13 0.30 (0.17)Past due loans B 216,805 198,149 18,656% of loans and bills discounted 3.26 3.15 0.11Loans past due for three months or more C 2,117 1,692 424% of loans and bills discounted 0.03 0.02 0.00Loans with relaxed conditions D 16,280 12,525 3,754% of loans and bills discounted 0.24 0.19 0.05Risk management loan total E (E=A+B+C+D) 244,189 231,612 12,576% of loans and bills discounted 3.67 3.68 (0.01)Value covered with collateral, guarantees, etc. F 217,814 204,570 13,244Cover ratio (%) F/E 89.19 88.32 0.87Notes: 1. Risk management loans are based on Article 19-2 of the Ordinance for Endorsement of the Banking Act. Because these loans are disclosed regardless of
the presence or absence of collateral, guarantees or other coverage, the figures shown do not represent unrecoverable amounts. 2. Loans past due for three months or more include loans for which payments of principal or interest are delinquent by three months or more, as calculated
from the day following the contracted payment date, but do not include loans to bankrupt borrowers or past due loans. 3. Loans with relaxed conditions include loans for which certain conditions have been relaxed for the benefit of the borrower (through such means as the
reduction or elimination of interest payments, the deferral of principal repayments, or the relinquishment of a portion of liabilities) with the goal of supporting the recovery of borrowers that have fallen into financial difficulty and thereby promoting the recovery of the loan.
4. Value covered with collateral, guarantees, etc., includes provisions in the specific reserve for possible loan losses. The covered value was stated on a pos-sible disposal basis.
Allowance for Loan LossesMillions of Yen
March 31 2011 2010
General allowance for loan losses ¥49,619 ¥51,453Specific allowance for loan losses 36,954 39,420
Total ¥86,574 ¥90,873[Loans on written-off claims for the year] ¥ [988] ¥ [324]
Financial IndexConsolidated Non-Consolidated
Years ended March 31 2011 2010Increase
(decrease) 2011 2010Increase
(decrease)Per share (Yen):
Net income ¥ 52.92 ¥ 46.92 6.00 ¥ 51.75 ¥ 46.01 5.74Net assets 1,024.57 1,005.41 19.16 1,016.34 998.21 18.13Cash dividends 13.00 13.00 13.00 13.00
Dividend payout ratio (%) 25.12 28.25 (3.13)Return on equity (ROE) (%) (Note) 5.19 4.90 0.29 5.91 5.48 0.43Price earnings ratio (PER) (%) 13.00 17.36 (4.36) 13.29 17.71 (4.42)Note: Net income as a percentage of average balance of shareholders’ equity.
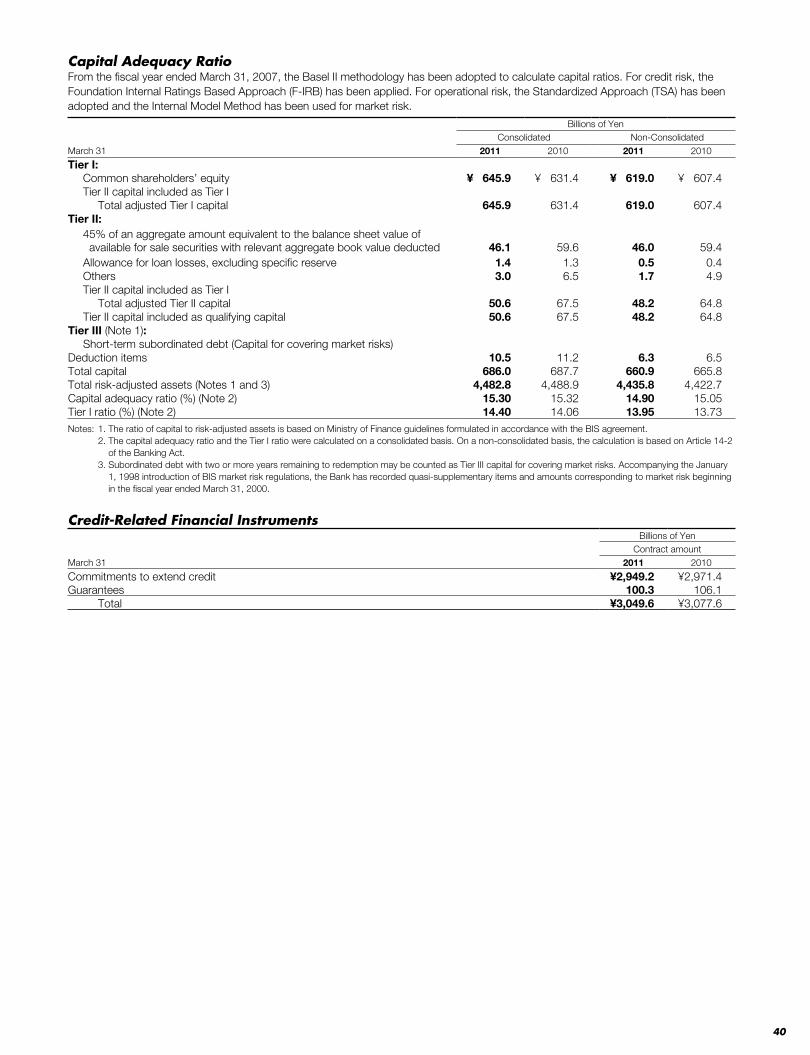
40
Capital Adequacy RatioFrom the fiscal year ended March 31, 2007, the Basel II methodology has been adopted to calculate capital ratios. For credit risk, the Foundation Internal Ratings Based Approach (F-IRB) has been applied. For operational risk, the Standardized Approach (TSA) has been adopted and the Internal Model Method has been used for market risk.
Billions of YenConsolidated Non-Consolidated
March 31 2011 2010 2011 2010
Tier I:Common shareholders’ equity ¥ 645.9 ¥ 631.4 ¥ 619.0 ¥ 607.4Tier II capital included as Tier I
Total adjusted Tier I capital 645.9 631.4 619.0 607.4Tier II:
45% of an aggregate amount equivalent to the balance sheet value of available for sale securities with relevant aggregate book value deducted 46.1 59.6 46.0 59.4Allowance for loan losses, excluding specific reserve 1.4 1.3 0.5 0.4Others 3.0 6.5 1.7 4.9Tier II capital included as Tier I
Total adjusted Tier II capital 50.6 67.5 48.2 64.8Tier II capital included as qualifying capital 50.6 67.5 48.2 64.8
Tier III (Note 1):Short-term subordinated debt (Capital for covering market risks)
Deduction items 10.5 11.2 6.3 6.5Total capital 686.0 687.7 660.9 665.8Total risk-adjusted assets (Notes 1 and 3) 4,482.8 4,488.9 4,435.8 4,422.7Capital adequacy ratio (%) (Note 2) 15.30 15.32 14.90 15.05Tier I ratio (%) (Note 2) 14.40 14.06 13.95 13.73Notes: 1. The ratio of capital to risk-adjusted assets is based on Ministry of Finance guidelines formulated in accordance with the BIS agreement. 2. The capital adequacy ratio and the Tier I ratio were calculated on a consolidated basis. On a non-consolidated basis, the calculation is based on Article 14-2
of the Banking Act. 3. Subordinated debt with two or more years remaining to redemption may be counted as Tier III capital for covering market risks. Accompanying the January
1, 1998 introduction of BIS market risk regulations, the Bank has recorded quasi-supplementary items and amounts corresponding to market risk beginning in the fiscal year ended March 31, 2000.
Credit-Related Financial InstrumentsBillions of Yen
Contract amountMarch 31 2011 2010
Commitments to extend credit ¥2,949.2 ¥2,971.4Guarantees 100.3 106.1
Total ¥3,049.6 ¥3,077.6
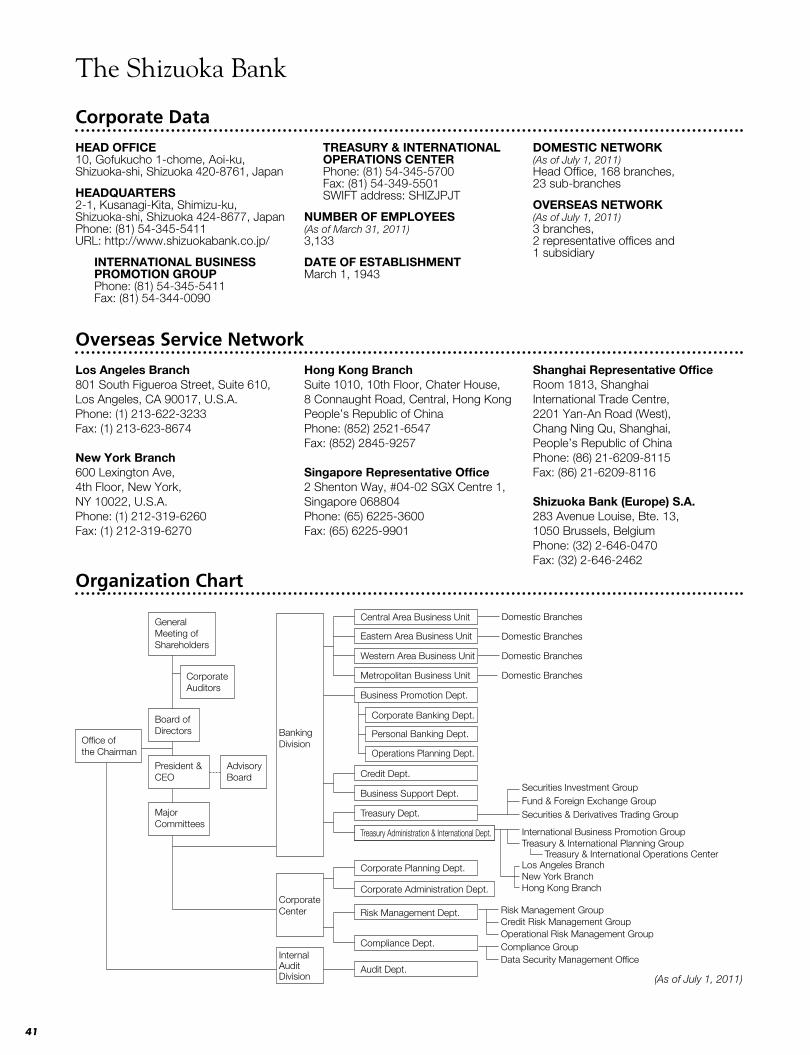
41
(As of July 1, 2011)
Overseas Service Network
Organization Chart
Los Angeles Branch801 South Figueroa Street, Suite 610,Los Angeles, CA 90017, U.S.A.Phone: (1) 213-622-3233Fax: (1) 213-623-8674
New York Branch600 Lexington Ave,4th Floor, New York,NY 10022, U.S.A.Phone: (1) 212-319-6260Fax: (1) 212-319-6270
Hong Kong BranchSuite 1010, 10th Floor, Chater House, 8 Connaught Road, Central, Hong KongPeople’s Republic of ChinaPhone: (852) 2521-6547Fax: (852) 2845-9257
Singapore Representative Office2 Shenton Way, #04-02 SGX Centre 1,Singapore 068804Phone: (65) 6225-3600Fax: (65) 6225-9901
Shanghai Representative OfficeRoom 1813, ShanghaiInternational Trade Centre,2201 Yan-An Road (West),Chang Ning Qu, Shanghai,People’s Republic of ChinaPhone: (86) 21-6209-8115Fax: (86) 21-6209-8116
Shizuoka Bank (Europe) S.A.283 Avenue Louise, Bte. 13,1050 Brussels, BelgiumPhone: (32) 2-646-0470Fax: (32) 2-646-2462
The Shizuoka Bank
Corporate Data
HEAD OFFICE10, Gofukucho 1-chome, Aoi-ku, Shizuoka-shi, Shizuoka 420-8761, Japan
HEADQUARTERS2-1, Kusanagi-Kita, Shimizu-ku, Shizuoka-shi, Shizuoka 424-8677, JapanPhone: (81) 54-345-5411URL: http://www.shizuokabank.co.jp/
INTERNATIONAL BUSINESS PROMOTION GROUPPhone: (81) 54-345-5411Fax: (81) 54-344-0090
TREASURY & INTERNATIONAL OPERATIONS CENTERPhone: (81) 54-345-5700Fax: (81) 54-349-5501SWIFT address: SHIZJPJT
NUMBER OF EMPLOYEES(As of March 31, 2011)3,133
DATE OF ESTABLISHMENTMarch 1, 1943
DOMESTIC NETWORK(As of July 1, 2011)Head Office, 168 branches,23 sub-branches
OVERSEAS NETWORK(As of July 1, 2011)3 branches, 2 representative offices and 1 subsidiary
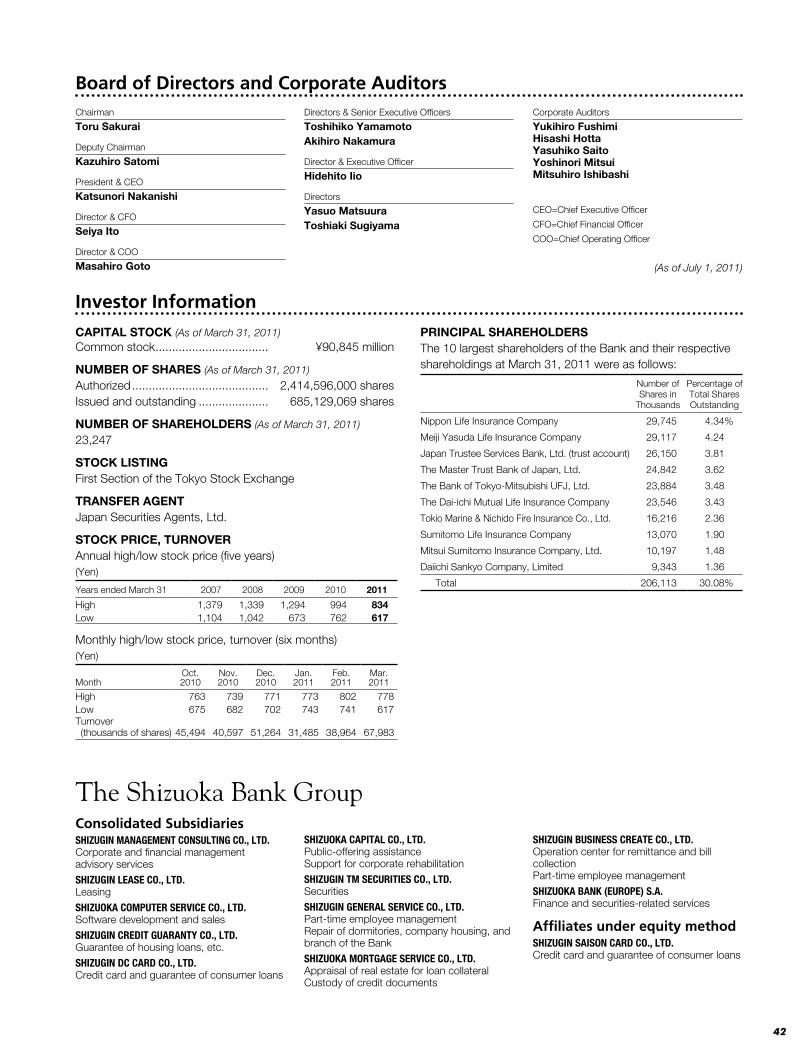
42
The Shizuoka Bank Group
Board of Directors and Corporate Auditors
Investor Information
CAPITAL STOCK (As of March 31, 2011)Common stock . . . . . . . . . . . . . . . . . . . . . . . . . . . . . . . . . . ¥90,845 million
NUMBER OF SHARES (As of March 31, 2011)
Authorized . . . . . . . . . . . . . . . . . . . . . . . . . . . . . . . . . . . . . . . . . 2,414,596,000 sharesIssued and outstanding . . . . . . . . . . . . . . . . . . . . . 685,129,069 shares
NUMBER OF SHAREHOLDERS (As of March 31, 2011)
23,247
STOCK LISTINGFirst Section of the Tokyo Stock Exchange
TRANSFER AGENTJapan Securities Agents, Ltd .
STOCK PRICE, TURNOVERAnnual high/low stock price (five years) (Yen)
Years ended March 31 2007 2008 2009 2010 2011
High 1,379 1,339 1,294 994 834Low 1,104 1,042 673 762 617
Monthly high/low stock price, turnover (six months) (Yen)
MonthOct .2010
Nov . 2010
Dec . 2010
Jan . 2011
Feb . 2011
Mar . 2011
High 763 739 771 773 802 778Low 675 682 702 743 741 617Turnover (thousands of shares) 45,494 40,597 51,264 31,485 38,964 67,983
PRINCIPAL SHAREHOLDERSThe 10 largest shareholders of the Bank and their respective shareholdings at March 31, 2011 were as follows:
Number ofShares in
Thousands
Percentage of Total Shares Outstanding
Nippon Life Insurance Company 29,745 4 .34%
Meiji Yasuda Life Insurance Company 29,117 4 .24
Japan Trustee Services Bank, Ltd . (trust account) 26,150 3 .81
The Master Trust Bank of Japan, Ltd . 24,842 3 .62
The Bank of Tokyo-Mitsubishi UFJ, Ltd . 23,884 3 .48
The Dai-ichi Mutual Life Insurance Company 23,546 3 .43
Tokio Marine & Nichido Fire Insurance Co ., Ltd . 16,216 2 .36
Sumitomo Life Insurance Company 13,070 1 .90
Mitsui Sumitomo Insurance Company, Ltd . 10,197 1 .48
Daiichi Sankyo Company, Limited 9,343 1 .36
Total 206,113 30 .08%
Chairman
Toru Sakurai
Deputy Chairman
Kazuhiro Satomi
President & CEO
Katsunori Nakanishi
Director & CFO
Seiya Ito
Director & COO
Masahiro Goto
Directors & Senior Executive Officers
Toshihiko YamamotoAkihiro Nakamura
Director & Executive Officer
Hidehito Iio
Directors
Yasuo MatsuuraToshiaki Sugiyama
Corporate Auditors
Yukihiro FushimiHisashi HottaYasuhiko SaitoYoshinori MitsuiMitsuhiro Ishibashi
CEO=Chief Executive Officer
CFO=Chief Financial Officer
COO=Chief Operating Officer
(As of July 1, 2011)
Consolidated SubsidiariesSHIZUGIN MANAGEMENT CONSULTING CO., LTD.Corporate and financial management advisory services
SHIZUGIN LEASE CO., LTD.Leasing
SHIZUOKA COMPUTER SERVICE CO., LTD.Software development and sales
SHIZUGIN CREDIT GUARANTY CO., LTD.Guarantee of housing loans, etc .
SHIZUGIN DC CARD CO., LTD.Credit card and guarantee of consumer loans
SHIZUOKA CAPITAL CO., LTD.Public-offering assistanceSupport for corporate rehabilitation
SHIZUGIN TM SECURITIES CO., LTD.Securities
SHIZUGIN GENERAL SERVICE CO., LTD.Part-time employee managementRepair of dormitories, company housing, and branch of the Bank
SHIZUOKA MORTGAGE SERVICE CO., LTD.Appraisal of real estate for loan collateralCustody of credit documents
SHIZUGIN BUSINESS CREATE CO., LTD.Operation center for remittance and bill collectionPart-time employee management
SHIZUOKA BANK (EUROPE) S.A.Finance and securities-related services
Affiliates under equity methodSHIZUGIN SAISON CARD CO., LTD.Credit card and guarantee of consumer loans

Printed in Japan


![[Architecture eBook] Detail 07.2003 - Shigeru Ban - Paper Museum in Shizuoka](https://img.pdfslide.us/doc/110x75/54f999214a79592b098b4c8a/architecture-ebook-detail-072003-shigeru-ban-paper-museum-in-shizuoka.jpg)