Embed Size (px)
Citation preview
SHIVAJI UNIVERSITY, KOLHAPUR.
B. Sc. Part - III, Practical Examination in Physics, February, March 2015
Instructions to the examiners :
1. Practical examination will be conducted for three days per batch in two sessions of three hours
duration on each day.
2. Each candidate is to be examined in one experiment from each group I, II, III and IV. Each experiment
carries 32 marks.
3. From group V, the candidate is to be examined for two experiments, one from each sub-group VA and
VB, carrying 16 marks each.
4. Candidate be examined orally for group VI which carries 40 marks.
5. Marks obtained by the candidates are to be entered in the respective columns shown on the question
slips.
6. Mark lists along with necessary reports and bill forms be Submit to the Prinicipal of Cencerned
college.
( Dr. R. S. Patil )
Chairman,
B. Sc. III, Physics
Practical Examination, Feb- March 2015

SHIVAJI UNIVERSITY, KOLHAPUR.
B. Sc. Part - III, Practical Examination in Physics, February, March 2015
Instructions to Laboratory Supervisor :
1. It is expected that all the experiment as per the slips be arranged in the Laboratory at the time
of inspection on the day & date as declared.
2. Candidates should be supplied with Mathematical tables.
3. Experts should keep a file of actual observations recorded by them in the setting of the experiments
for determining the results. A copy of the file should be given to the examiners for reference.
Constans supplied must be based on the results required in the scheme of marking.
4. A copy of question slips sent herewith would be used by laboratory supervisors for arranging
experiments and the slips be displayed on the notice board for information of students immediately.
5. All the slips are to be completely pasted on the answer paper.
Dr. R. S. Patil
Chairman,
B. Sc. III, Physics
Practical Examination, Feb- March 2015

SHIVAJI UNIVERSITY, KOLHAPUR.
B. Sc. Part - III, Practical Examination in Physics, February, March 2015
Instructions to the candidates :
1. The candidate should remain present for practical examination, at least 15 minutes before the
commencement of the examination.
2. The candidates are required to produce journal, seminar report and tour report duly signed and
certified by respective teacher in charge and HOD, at the time of the examination.
3. Each candidate is to perform one experiment from group - I, II, III and IV and two experiments from
group-V (one from each sub group VA & VB). Candidate will be examined orally for group VI.
4. Practical examination will be conducted for three days per candidate in two sessions of three hours
duration on each day. The candidate will be examined in one group in each of the six sessions.
5. Candidate should perform the experiments as per the question slip. All observations must be entered
in ink. At least one adjustment with observation should be shown to the examiner.
( Dr. R. S. Patil )
Chairman,
B. Sc. III Physics
Practical Examination, Feb/ March 2015

SHIVAJI UNIVERSITY, KOLHAPUR
B. Sc. Part-III, Practical Examination, February, March 2015
Physics
Seat No. GROUP I
1. Resonance Pendulum
i) Plot the graph of maximum amplitude ‘A’ against the length of simple pendulum, ‘l’ obtain theresonating length ‘L’.
ii) By keeping the length of simple pendulum equal to the resonating length ‘L’, vary the mass‘M’ of the pendulum and obtain amplitudes for different masses.
Plot a graph of ___
vs ___
, Hence determine the damping coefficient r’.
r2 =
______________
where n2 = __
p = ___
and T = Period of Kater’s pendulum.
Sr.No.
Heads of distribution of marksMarks
AllottedMarks
obtained
1. Correct procedure and adjustments 7
2. Observations 10
3. Calculations (4), graphs (6), result (2) 12
4. Oral 3
Total : 32
Signature of examiner.
Remarksif any
Slope
Intercept on __ axis
(n2 _ p2)2
p2x
1A2
gL
g
2π

SHIVAJI UNIVERSITY, KOLHAPUR
B. Sc. Part-III, Practical Examination, February, March 2015
Physics
Seat No. GROUP I
2. Surface tension of soap solution
Determine the surface tension (T) of the given soap solution by forming a film of it.
Use the formula :
T =
where,
m = Mass attached to the film(Mass of lower frame + mass attached)
2a = Width of the film at the frame
2b = Minimum width of the film (at the centre)
2h = Vertical height of the film.
Sr.No.
Heads of distribution of marksMarks
AllottedMarks
obtained
1. Correct procedure and adjustments 10
2. Observations 10
3. Calculations (6) and result (3) 9
4. Oral 3
Total : 32
Signature of examiner.
mg
2(a+b + ____ )h2
a-b
Remarksif any
SHIVAJI UNIVERSITY, KOLHAPUR
B. Sc. Part-III, Practical Examination, February, March 2015
Physics
Seat No. GROUP I
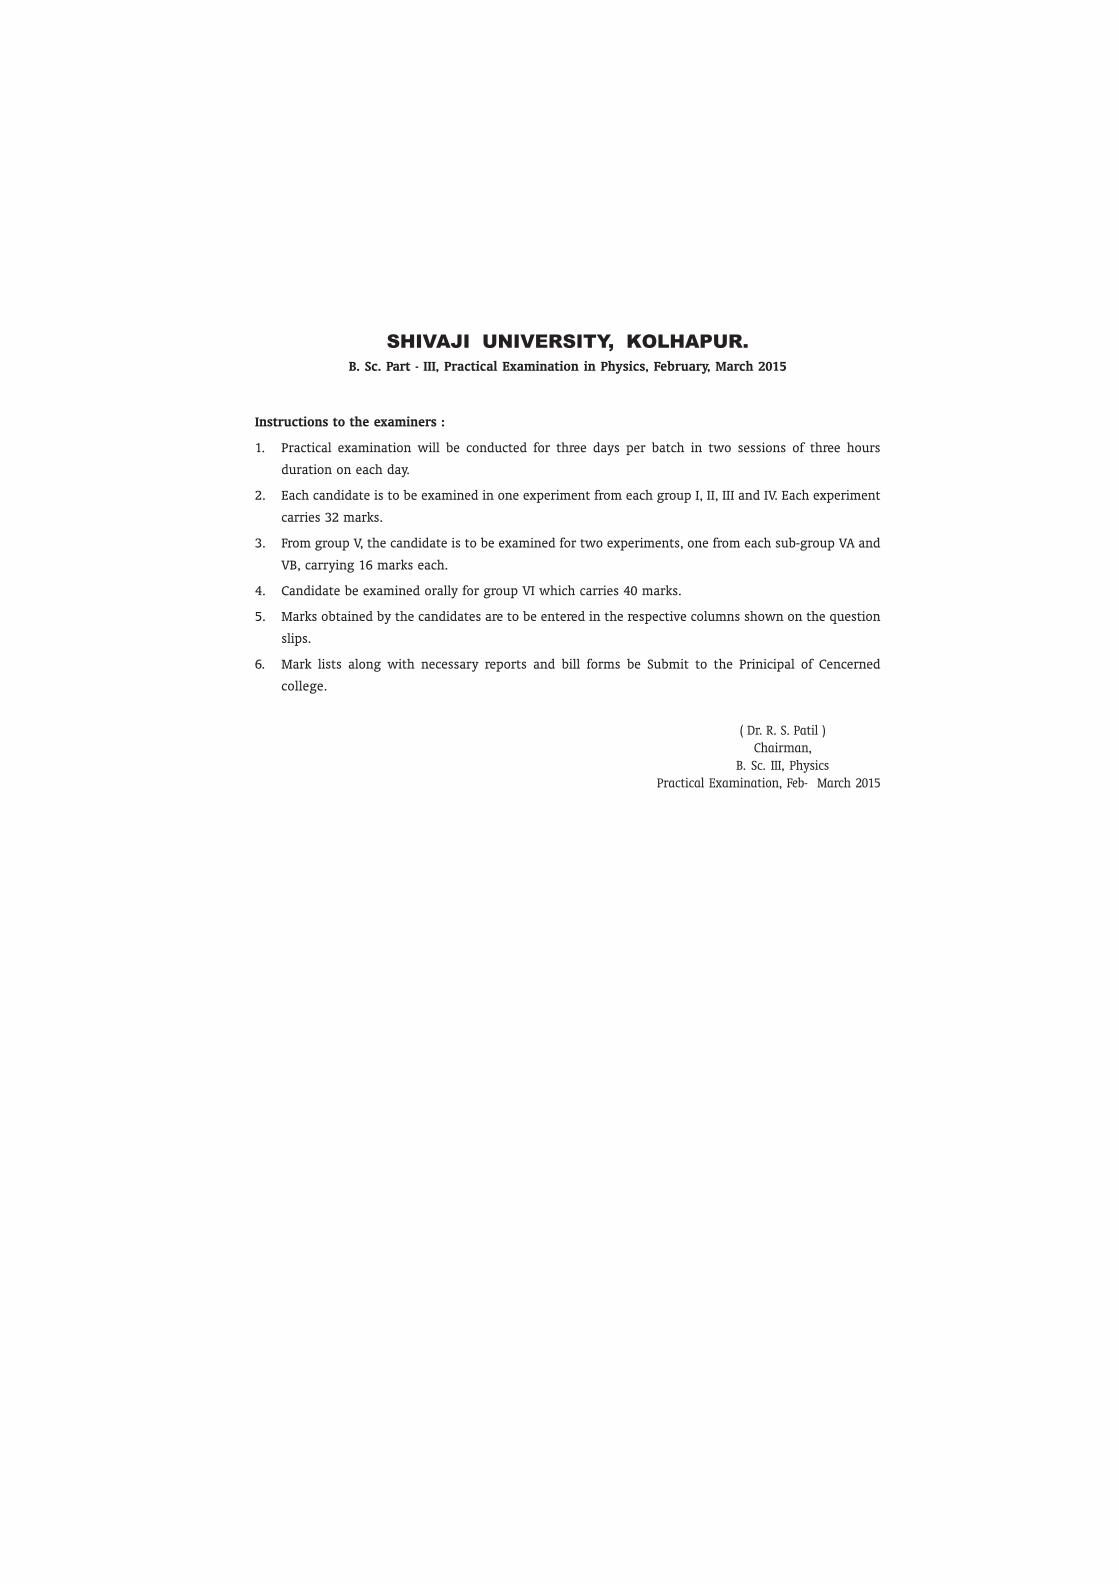
3. S. T. by Fergusson’s Modified Method
Determine the S. T. of mercury by using Fergusston’s modified method
T = _____
where θ = angle of contact of mercury = .....................
9 = density of manometer liquid = .................. gm/cc.
g = 980 cm/sec2
h 9rg
2Cosθ
Sr.No.
Heads of distribution of marksMarks
AllottedMarks
obtained
1. Correct adjustments 10
a) Circuit diagram and connections with Proper settingof platinum wire in the capillary (5)
b) Mercury surface in the beaker in the level of theplatinum wire pin with microscope. (5)
2. Observations 12
a) Radius of the bore of the capillary (5)
b) Difference in the manometric liquid levels whenthe electric bulb is just on (7)
3. Calculations, units 7
4. Oral 3
Total : 32
Signature of examiner.
Remarksif any
134o

SHIVAJI UNIVERSITY, KOLHAPUR
B. Sc. Part-III, Practical Examination, February, March 2015
Physics
Seat No. GROUP I4. Flat Spiral Spring (Y/ ηηηηη)
Determine the Young’s modulus (Y) Or Modulus of rigidity, (η) by plotting the respective graphs (1)
I against T12 Or (2) M-against T2
2.
Y = ____________
; Or η = ________________
N = Total no. of turns in the spring
I = Moment of inertia of the two discs about the axis of suspension = 2m’ a2
2m’ = Mass of two discs
a = distance of each disc from the centre of the bar
I0 = MI - of fixed part of the vibrating system
R = Radius of the cylinder on which the spiral is wound plus the radius of the wire.
r = radius of the wire of the spring
T1 = Period of torsional oscillation
T2 = Period of vertical oscillation\
m = mass of the spring
M = mass attached to the springRead the negative intercept on I-axis in graph (1) and interpret it mentioning what itincludes.Determine ‘m’ from graph (2)
Sr.No.
Heads of distribution of marksMarks
AllottedMarks
obtained
1. Correct adjustments and procedure. 7
2. Observations 10
a) for torsional oscillations OR for vertical oscillations.
3. Calculations (4), graph (4), results with proper units (4) 12
4. Oral 3
Total : 32
Signature of examiner.
32π2NR (I + I0)
r4 T12
16π2 NR3 [M + __ ]
r4 T22
m3
Remarksif any

SHIVAJI UNIVERSITY, KOLHAPUR
B. Sc. Part-III, Practical Examination, February, March 2015
Physics
Seat No. GROUP I
5. Young’s Modulus (Koenig’s Method)
Attach the two plane mirrors beyond the knife-edges of beam (of breadth ‘b’ and depth ‘d’). Let thedistance between the mirrors be ‘a’ and the distance between the knife edges ‘l’
Place the scale behind one of the mirrors and the telescope behind the other so that you may viewthe scale through the telescope after reflection at both mirrors. Let D be the distance between the scaleand the mirror opposite to it and x the difference in the readings of the scale at the cross wires of thetelescope before and after the application of the load W = Mg at a point equidistant from the knife-edges, Young’s Modulus is given by the formula
Y = __ ____
(2D + a) ___
Repeat observations for four different loads.
Plot a graph of M against x, Hence, determine Y. by using slop of the graph.
Sr.No.
Heads of distribution of marksMarks
AllottedMarks
obtained
1. Correct setting (4) and procedure (4) 9
2. Observations 10
a) Measurement of various lengths, thickness, breadth (4)
b) Readings for depression due to load (6)
3. Graphs (4), calculations (4), result (2) 10
4. Oral 3
Total : 32
Signature of examiner.
32
gl2
bd3
Mx
Remarksif any

SHIVAJI UNIVERSITY, KOLHAPUR
B. Sc. Part-III, Practical Examination, February, March 2015
Physics
Seat No. GROUP I
6. Y-by Cornu’s method
Determine Young’s modulus of the glass using Cornu’s method, by measuring minimum distance Dn
between nth pair of fringes.
Plot the graph of D2 against n; hence Calculate R.
L = Distance between knife edge and corresponding load.on each side
M = Mass applied at each end.
b = breadth
d = depth of the glass plate to which mass is attached.
Sr.No.
Heads of distribution of marksMarks
AllottedMarks
obtained
1. Correct procedure for obtaining fringes. 12
2. Observations 9
3. Calculations (4), Graph (2), result (2) 8
4. Oral 3
Total : 32
Signature of examiner.
Y = _______
Where R = __________
λ = 5890 A. U.
6g LMRbd3
D2n+s
_ Dn2
4λs
}
Remarksif any
wave length ofsodium sourle
SHIVAJI UNIVERSITY, KOLHAPUR
B. Sc. Part-III, Practical Examination, February, March 2015
Physics
Seat No. GROUP I
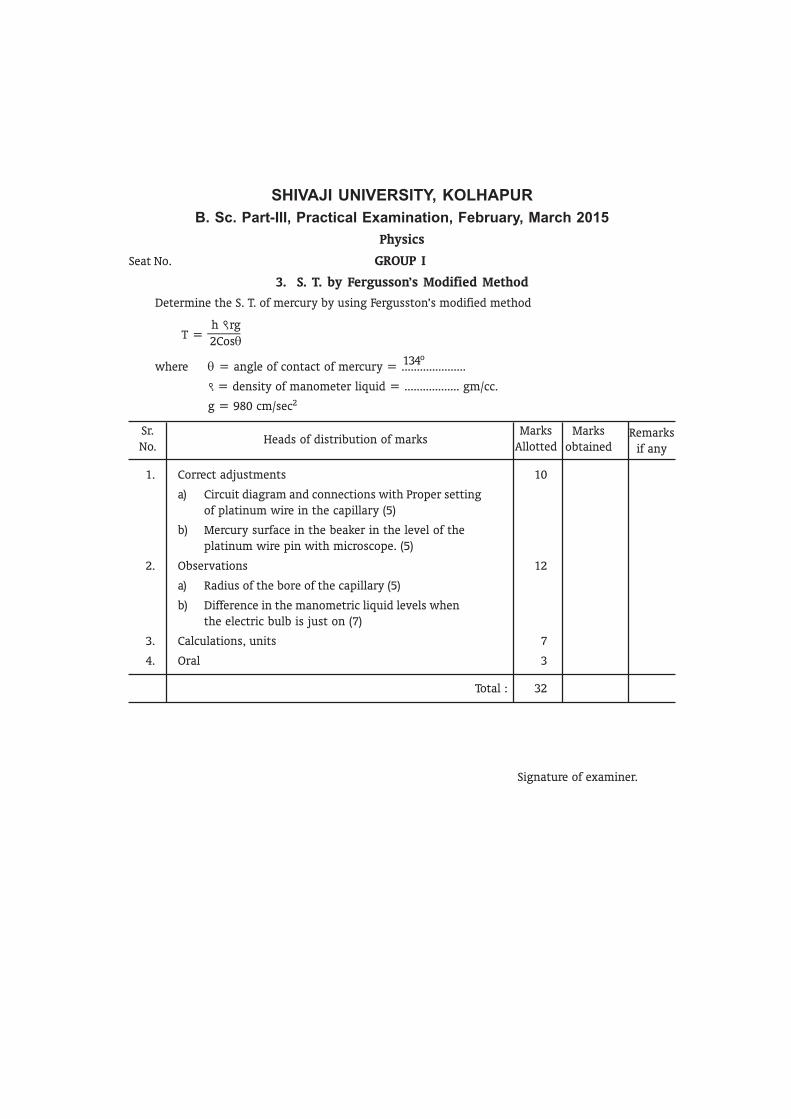
7. Stefan’s Law
Verify Stefan’s fourth power Law by using given apparatus.
N. B. :- Do not pass the current before getting the connections checked. by the examintion
Sr.No.
Heads of distribution of marksMarks
AllottedMarks
obtained
1. Circuit diagram 4
2. Connections 3
3. Observations 8
4. Calculations (4), graphs (8), result (2) 14
5. Oral 3
Total : 32
Signature of examiner.
Remarksif any

SHIVAJI UNIVERSITY, KOLHAPUR
B. Sc. Part-III, Practical Examination, February, March 2015
Physics
Seat No. GROUP I
8. Thermal conductivity by Lee’s Method
Determine the thermal conductivity of the given material in the form of disc by Lee’s methad usingthe following formula :
__________ ( ___)θ1 ( __________ )
where A = Area of the specimen disc
θ1 = Temp. of lower surface of specimen disc at steady state.
θ2 = Temp. of upper surface of specimen disc at steady state.
d = Thickness of the disc (Specimen) = .................... cm.
M = Mass of lower metal disc. = ............... gm.
S = Sp. heat of lower metal disc. = .................. cal./gm./0c
r = Radius of Metal disc.
D = Thickness of lower metal disc.
Scheme of Marking :
Sr.No.
Heads of distribution of marksMarks
AllottedMarks
obtained
1. Procedure 8
2. Tabular form, Observations etc. 10
3. Graph (4), Calculations (4) answer with unit (2) 10
4. Oral 4
Total : 32
Signature of examiner.
dθ
dtA+2π rD
2A + 2π rD
Remarksif any
Msd
A (θ2 - θ1 )
SHIVAJI UNIVERSITY, KOLHAPUR
B. Sc. Part-III, Practical Examination, February, March 2015
Physics
Seat No. GROUP I
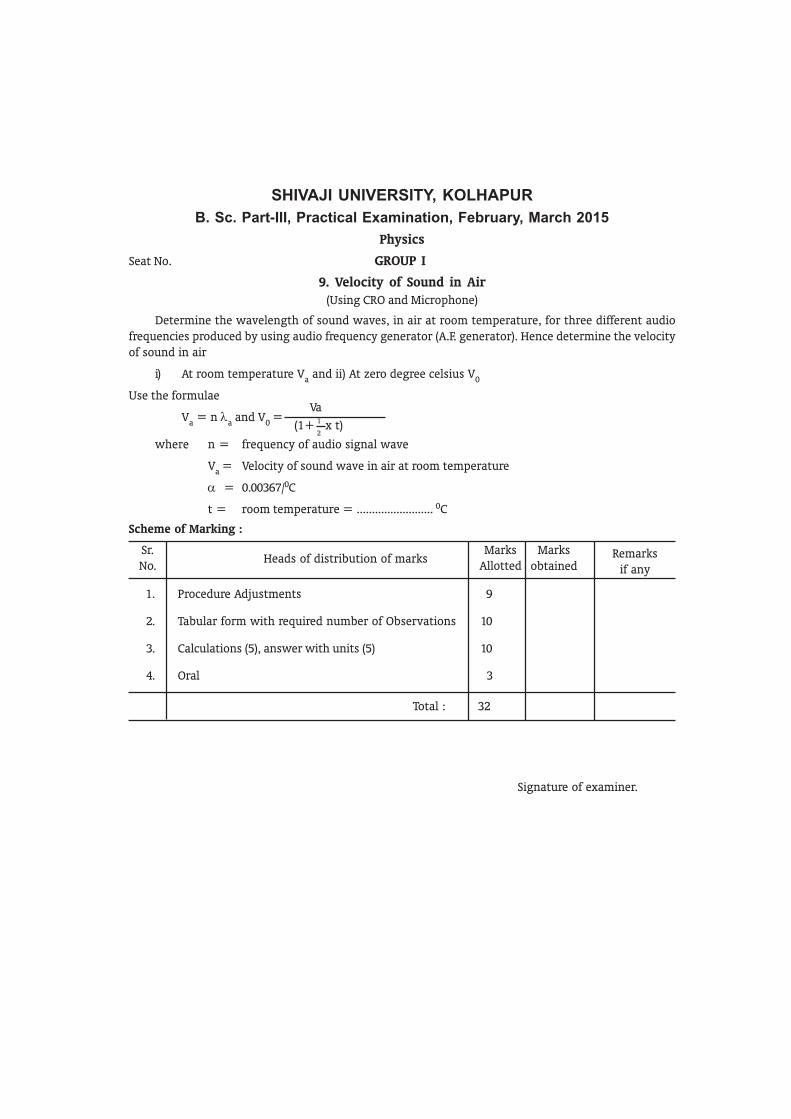
9. Velocity of Sound in Air
(Using CRO and Microphone)
Determine the wavelength of sound waves, in air at room temperature, for three different audiofrequencies produced by using audio frequency generator (A.F. generator). Hence determine the velocityof sound in air
i) At room temperature Va and ii) At zero degree celsius V0
Use the formulae
Va = n λa and V0 =
where n = frequency of audio signal wave
Va = Velocity of sound wave in air at room temperature
α = 0.00367/0C
t = room temperature = ......................... 0C
Scheme of Marking :
Sr.No.
Heads of distribution of marksMarks
AllottedMarks
obtained
1. Procedure Adjustments 9
2. Tabular form with required number of Observations 10
3. Calculations (5), answer with units (5) 10
4. Oral 3
Total : 32
Signature of examiner.
Remarksif any
Va
(1+ x t)1
2
SHIVAJI UNIVERSITY, KOLHAPUR
B. Sc. Part-III, Practical Examination, February, March 2015
Physics
Seat No. GROUP I
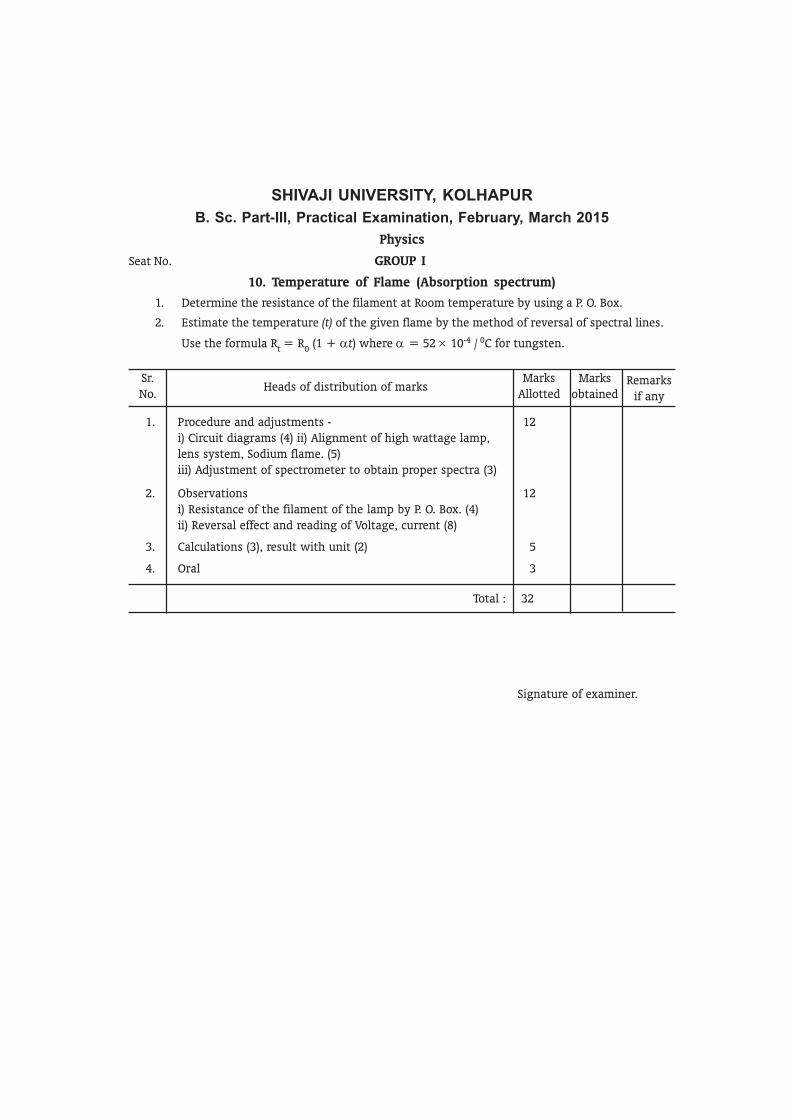
10. Temperature of Flame (Absorption spectrum)
1. Determine the resistance of the filament at Room temperature by using a P. O. Box.
2. Estimate the temperature (t) of the given flame by the method of reversal of spectral lines.
Use the formula Rt = R0 (1 + αt) where α = 52 × 10-4 / 0C for tungsten.
Sr.No.
Heads of distribution of marksMarks
AllottedMarks
obtained
1. Procedure and adjustments - 12i) Circuit diagrams (4) ii) Alignment of high wattage lamp,lens system, Sodium flame. (5)iii) Adjustment of spectrometer to obtain proper spectra (3)
2. Observations 12i) Resistance of the filament of the lamp by P. O. Box. (4)ii) Reversal effect and reading of Voltage, current (8)
3. Calculations (3), result with unit (2) 5
4. Oral 3
Total : 32
Signature of examiner.
Remarksif any

1. Ray diagram showing cardinal points 7
2. Observations 15
a) Focal length by auto collimation (3)
b) Adjustment (7)
c) Readings for 2 Sets (5)
3. Calculations (3), graphs / diagram for cardinal points (4) 7
4. Oral 3
Total : 32
Signature of examiner.
SHIVAJI UNIVERSITY, KOLHAPUR
B. Sc. Part-III, Practical Examination, February, March 2015
Physics
Seat No. GROUP II
1. Cardinal Points by Turn - Table
1. Determine focal lengths of two thin lenses by auto collimation method.
2. Using turn table find the positions of focal points & nodal points of the given system of two
lenses separated by finite distance.
Draw the diagram to represent the cardinal points.
Find the focal length of the system from the diagram. Verify it by the formula.
__ =
__ +
__ _
___
3. Repeat the experiment for ONE MORE distance.
Sr.
No.Heads of distribution of marks
Marks
Allotted
Marks
obtained
1
F
1
f1
1
f2
d
f1f2
Remarks
if any
SHIVAJI UNIVERSITY, KOLHAPUR
B. Sc. Part-III, Practical Examination, February, March 2015
Physics
Seat No. GROUP II
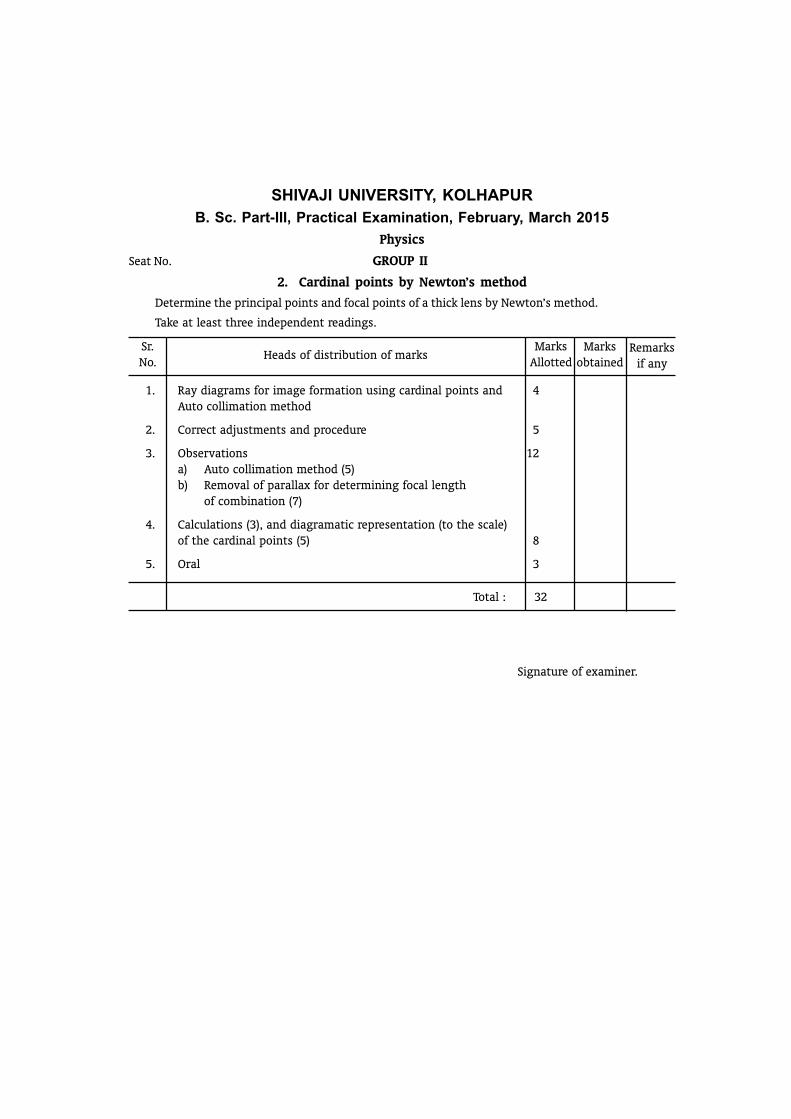
2. Cardinal points by Newton’s method
Determine the principal points and focal points of a thick lens by Newton’s method.
Take at least three independent readings.
Sr.
No.Heads of distribution of marks
Marks
Allotted
Marks
obtained
1. Ray diagrams for image formation using cardinal points and 4
Auto collimation method
2. Correct adjustments and procedure 5
3. Observations 12
a) Auto collimation method (5)
b) Removal of parallax for determining focal length
of combination (7)
4. Calculations (3), and diagramatic representation (to the scale)
of the cardinal points (5) 8
5. Oral 3
Total : 32
Signature of examiner.
Remarks
if any

SHIVAJI UNIVERSITY, KOLHAPUR
B. Sc. Part-III, Practical Examination, February, March 2015
Physics
Seat No. GROUP II
3. Thickness of thin film by interference
Place the given thin film on a plane glass plate and then form a wedge shaped air film by placing
another plane glass plate on it. Incident monochromatic light normally and obtain the interference
fringes. Measure the length of air wedge and fringe width and hence determine the thickness of thin
film.
Formula
t = ___ ___
where t = thickness of thin film
L = length of wedge shaped air film.
x = Fringe width
λ = wavelength monochromatic light = ---------------------- cm.
Sr.
No.Heads of distribution of marks
Marks
Allotted
Marks
obtained
1. Correct procedure and adjustment/focussing 9
2. Observations 12
3. Calculations 8
4. Oral 3
Total : 32
Signature of examiner.
L
x
λ
2
Remarks
if any

SHIVAJI UNIVERSITY, KOLHAPUR
B. Sc. Part-III, Practical Examination, February, March 2015
Physics
Seat No. No. GROUP II
4. Diffraction at a single Slit using Sodium/laser source
Determine wavelength of the given monochromatic light, by investigating the diffraction pattern
(Fraunhofer) of single slit. Use the formula,
e sin θ = mλ , for dark fringes.
e = slit width.
θ = angle of diffraction.
m = 1, 2, 3, ................ etc. for the first, second etc. points of minimum intensity on either side
of principal maximum.
Plot the graph of sin θ against m; hence determine λ.
Sr.
No.Heads of distribution of marks
Marks
Allotted
Marks
obtained
1. Adjustment to obtain good diffraction pattern 10
2. Observations (a) Slit Width (4)
b) Readings for dark fringes. (7) 11
3. Graph, (2) Calculations (4) and result (2) 8
4. Oral 3
Total : 32
Signature of examiner.
Remarks
if any

SHIVAJI UNIVERSITY, KOLHAPUR
B. Sc. Part-III, Practical Examination, February, March 2015
Physics
Seat No. GROUP II
5. Diffraction at a Cylindrical Obstacle
Make the necessary adjustments to obta in the fringes in the geometrical shadow of the given
cylindrical obstacle. Take the micrometer readings corresponding to different fringes.
Plot a graph of micrometor readings against the corresponding order of fringes.
Mesine the with of the wire Cobstacle by micrometon serw gange
Hence determine the wavelength of the monochromatic light using the formula,
λ = ___
where x = distance between consecutive bright or dark fringes.
d = width of the wire (obstacle)
D = distance between the wire and the focal plane of the eye-piece, corrected for bench
error.
Note :- Given Bench error = .................. cms.
Sr.
No.Heads of distribution of marks
Marks
Allotted
Marks
obtained
1. Ray diagram 4
2. Correct pattern without shift 7
3. Observations 10
(a) Fringe width (7) (b) Width of the wire (3)
4. Graph (3) Calculations (3) and result (2) 8
5. Oral 3
Total : 32
Signature of examiner.
xd
D
Remark
is any

SHIVAJI UNIVERSITY, KOLHAPUR
B. Sc. Part-III, Practical Examination, February, March 2015
Physics
Seat No. GROUP II
6. Diffraction at a Straight edge
Determine the wavelength of a given monochromatic light by investigating the diffraction pattern
by a straight edge.
Formula
Xn _ X
m = K ( √ n _ √m )
∴ λ = _________
Κ2
Where Xn = reading of nth minima
Xm
= reading of mth minima
n = order of nth minima
m = order of the mth minima
λ = wavelength of the light used
p = distance between straight edge and eyepiece
q = distance between straight edge and slit
Plot the graph of Xn against √ n and find K (Slope) and hence calculate λ.
Sr.
No.Heads of distribution of marks
Marks
Allotted
Marks
obtained
1. Correct pattern without shift 10
2. Observations 11
3. Graph (3), Calculation (3) and result (2) 8
4. Oral 3
Total : 32
Signature of examiner.
q
Remarks
if any
2p (p + q)

SHIVAJI UNIVERSITY, KOLHAPUR
B. Sc. Part-III, Practical Examination, February, March 2015
Physics
Seat No. GROUP II
7. Lloyd’s Single Mirror
Set up the optical bench, and make the necessary adjustments until interference fringes are formed
by the light from a slit illuminated by a sodium lamp. Determine the wavelength (λ) of the light from the
following observations :
x = separation between the consecutive fringes.
D = distance between the slil and exepiece
d = distance between the two coherent sources = √d1d
2
d1 = distance between the reduced images of the sources.
d2 = distance between the magnified images of the sources.
Use the formula λ = ___
Given Bench error = ................ cms.
Sr.
No.Heads of distribution of marks
Marks
Allotted
Marks
obtained
1. Proper pattern without shift. 10
2. Observations 11
a) For band width (7)
b) For distance between the two coherent sources (4)
3. Calculations (4), Result (2), Unit (2) 8
4. Oral 3
Total : 32
Signature of examiner.
xd
D
Remarks
if any
SHIVAJI UNIVERSITY, KOLHAPUR
B. Sc. Part-III, Practical Examination, February, March 2015
Physics
Seat No. GROUP II
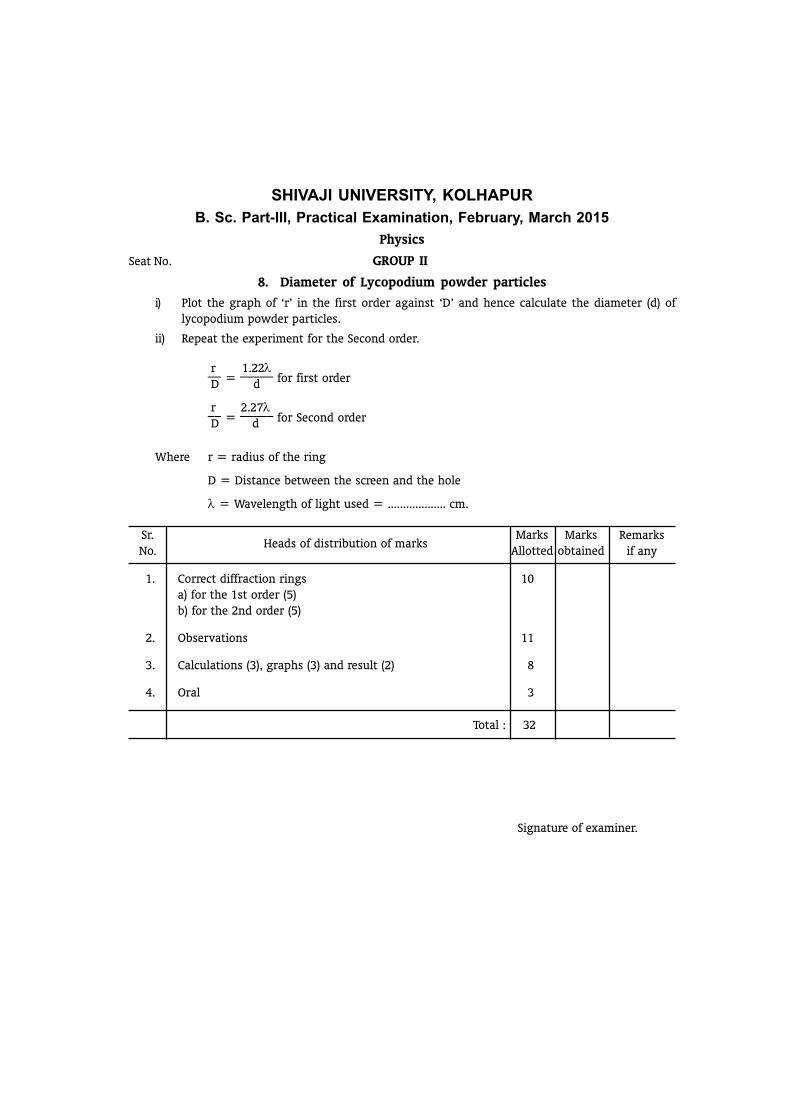
8. Diameter of Lycopodium powder particles
i) Plot the graph of ‘r’ in the first order against ‘D’ and hence calculate the diameter (d) of
lycopodium powder particles.
ii) Repeat the experiment for the Second order.
__ =
_____ for first order
__ =
_____ for Second order
Where r = radius of the ring
D = Distance between the screen and the hole
λ = Wavelength of light used = ................... cm.
Sr.
No.Heads of distribution of marks
Marks
Allotted
Marks
obtained
1. Correct diffraction rings 10
a) for the 1st order (5)
b) for the 2nd order (5)
2. Observations 11
3. Calculations (3), graphs (3) and result (2) 8
4. Oral 3
Total : 32
Signature of examiner.
r
D
r
D
1.22λ
d
2.27λ
d
Remarks
if any
SHIVAJI UNIVERSITY, KOLHAPUR
B. Sc. Part-III, Practical Examination, February, March 2015
Physics
Seat No. GROUP II
9. Spherical Aberration
Plot Caustic curve for a given thick planoconvex lens. Hence determine the ratio of the transverse
(Lateral) aberrtion of the extreme ray to the radius of the circle of least confusion.
Scheme of Marking :
Sr.
No.Different heads for distribution of marks
Marks
Allotted
Marksobtained
Candidate
1. Adjustments & procedure 10
2. Tabular form, observations 07
3. Graph, (4) Calculations,(4) result (4) 12
4. Oral 03
Total : 32
Signature of examiner.
Remarks
if any
SHIVAJI UNIVERSITY, KOLHAPUR
B. Sc. Part-III, Practical Examination, February, March 2015
Physics
Seat No. GROUP II
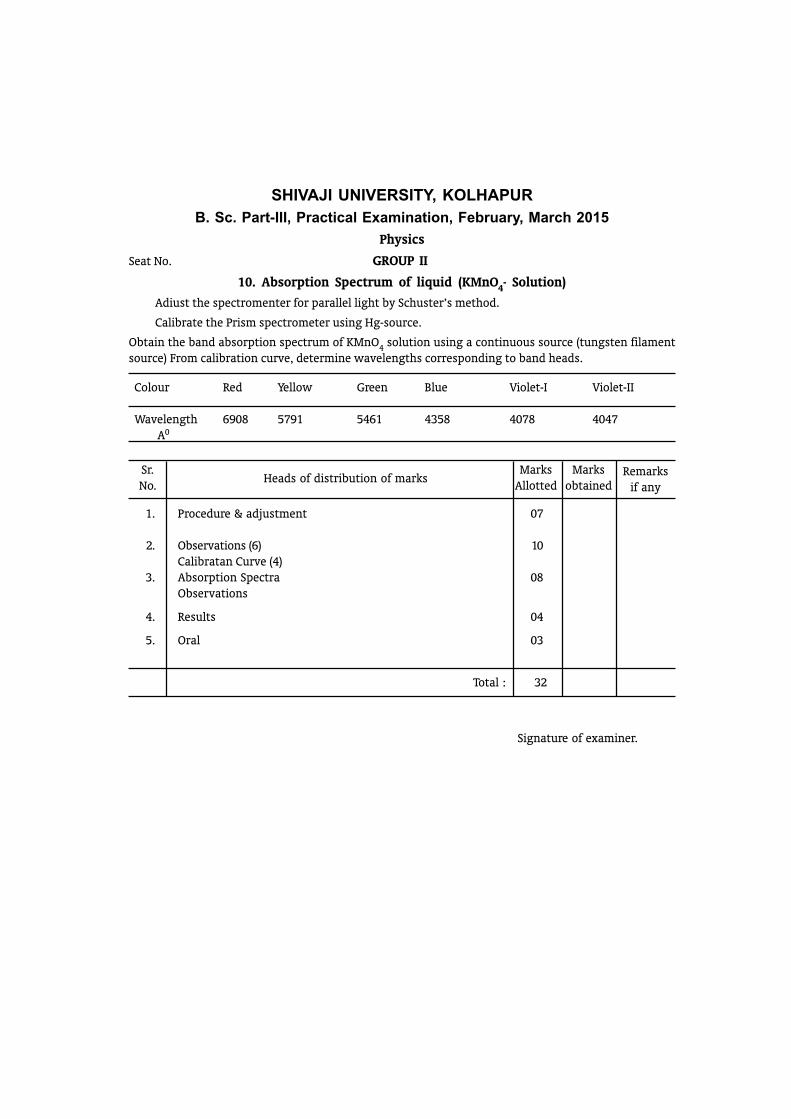
10. Absorption Spectrum of liquid (KMnO4- Solution)
Adiust the spectromenter for parallel light by Schuster’s method.
Calibrate the Prism spectrometer using Hg-source.
Obtain the band absorption spectrum of KMnO4 solution using a continuous source (tungsten filament
source) From calibration curve, determine wavelengths corresponding to band heads.
Colour Red Yellow Green Blue Violet-I Violet-II
Wavelength 6908 5791 5461 4358 4078 4047
A0
Sr.
No.Heads of distribution of marks
Marks
Allotted
Marks
obtained
1. Procedure & adjustment 07
2. Observations (6) 10
Calibratan Curve (4)
3. Absorption Spectra 08
Observations
4. Results 04
5. Oral 03
Total : 32
Signature of examiner.
Remarks
if any

SHIVAJI UNIVERSITY, KOLHAPUR
B. Sc. Part-III, Practical Examination, February, March 2015
Physics
Seat No. GROUP III
1. Owen’s bridge
Obtain d. c. balance; find the value of resistance of inductance coil and maintaining the conditions ofd. c. balance, determine the self-inductance of a coil in terms of standard resistance and capacitance byOwen’s bridge, using a. c. balance by the given formula
L = ..................
N. B. :- Do not pass the current before getting the connections checked.
Sr.No.
Heads of distribution of marksMarks
AllottedMarks
obtained
1. Circuit diagram 7
(a) for d. c. balance (3) (b) for a. c. balance (4)
2. Connections 6
3. Observations 12
(a) d. c. balance (4) (b) a. c. balance (8)
4. Calculations (2), result (1) and unit (1) 4
5. Oral 3
Total : 32
Signature of examiner.
Remarksif any

SHIVAJI UNIVERSITY, KOLHAPUR
B. Sc. Part-III, Practical Examination, February, March 2015
Physics
Seat No. GROUP III
2. Maxwell’s Bridge (Self inductance)
Draw circuit diagram for Maxwell’s inductance - capacitance bridge and make the connections.Make the bridge sensitive by selecting proper values of the components. Obtain AC balance and hencecalculate the value of the self inductance. Repeat the experiment thrice by changing the circuitconditions.
Scheme of Marking :
Sr.No.
Heads of distribution of marksMarks
AllottedMarks
obtained
1. Circuit diagram 7
2. Circuit connections 7
3. Observations 10
4. Calculations (3), result (2) 5
5. Oral 3
Total : 32
Signature of examiner.
Remerksif any

SHIVAJI UNIVERSITY, KOLHAPUR
B. Sc. Part-III, Practical Examination, February, March 2015
Physics
Seat No. GROUP III
3. Measurement of Self Inductance (Rayleigh’s Method)
Determine the value of the self inductance of the given coil.
L = ___
( ___ ) θl (
___ )¼
where L = Self inductance of the coil
T = Period of the ballistic galvanometer
θ1 = First ballistic throw
θ3 = second throw on the same side
φ = Steady deflection corresponding to a known resistancer.
Use Rayleigh key for this purpose.
Take five different values for r and observe the steady deflections for them.
Plot r against φ and determine the slope. Hence find L from the above formula.
N. B. :- 1. Get your diagram checked.
2. Get your connections checked before passing the current.
Sr.No.
Heads of distribution of marksMarks
AllottedMarks
obtained
1. Circuit diagram 6
2. Connections 5
3. Observations 10(a) Bridge balance (3) (b) Inductive throws (3)(c) Steady deflections (4)
4. Calculations (4), graph (2), Result (2) 8
5. Oral 3
Total : 32
Signature of examiner.
T2π
r
φθ
1
θ3
Remerksif any

SHIVAJI UNIVERSITY, KOLHAPUR
B. Sc. Part-III, Practical Examination, February, March 2015
Physics
Seat No. GROUP III
4. Earth Inductor
Determine BH, BV and θ by using an earth inductor and standard solenoid.Using formulae,
1. BH = θH
2. BV = θV
3. θ = tan-1 (____)
Where,
n1 = No. of turns / cm. of primary of solenoid
n2 = No. of turns of secondary of solenoid
d = Diameter of secondary of solenoid
D = Diameter of earth inductor
n = Total number of turns of earth inductor
θH = First throw when earth indnctor responds to horizontal field component
θV = First throw when earth indnctor responds to vertical field component.
θ = throw shown by B. G. for corresponding current ‘i’
N. B. :- Get your connections checked before passing the current.
Sr.No.
Heads of distribution of marksMarks
AllottedMarks
obtained
1. Circuit diagram 7
2. Connections 4
3. Setting of Earthcoil for i) BH ii) B
V4
4. Observations for i) BH (2) ii) B
V (2) iii) Calibration (3) 7
5. Calculations (2), graph (2) results (2) and units (1) 7
6. Oral 3
Total : 32
Signature of examiner.
4π n1 n
2 d2
10 n D2
4π n1 n
2
10 n D2
BV
BH
Remerksif any
iθ
( )
iθ
( )

SHIVAJI UNIVERSITY, KOLHAPUR
B. Sc. Part-III, Practical Examination, February, March 2015
Physics
Seat No. GROUP III
5. Hysteresis (Magnetometer Method)
i) Arrange the magnetising and compensating coils (of a turns/cm) in the east-west direction. Setthe magnetometer in the magnetic meridian, between the coils so that pointer reads 0-0 of thescale, after levelling it.
ii) Make the connections and perform a trial experiment to adjust the distance of the magnetisingcoil keeping the specimen bar inside it.
iii) Remove the specimen bar (magnetic length 21 and area of cross-section S) from the magnetisingcoil and adjust the distance of the compensating coil so as to neutralise the effect ofmagnetising field upon the magnetometer (at maximum current 3 amps.)
iv) Demagnetise the given specimen by any standard method.
v) Introduce the specimen bar in the magnetising coil and let ‘d’ be the distance of magnetometerneedle from the centre of the bar. Take the specimen round a complete and uninterrupedcycle of magnetisation starting from zero current to maximum value 3 amperes. Note the
diflection of the magnetometer needle φ for various currents i.
vi) Plot the graph between tan φ (y-axis) and i (x-axis).
Hence determine retentivity and coercivity using the respective formulae,
I = ________
tan φ
and F = ____
where i is in Amperes.
H = ..................... Oersted2L = Geometric length of the specimen bar.
N. B. :- Get your connections checked before passing the current.
Sr.No.
Heads of distribution of marksMarks
AllottedMarks
obtained
1. Circuit Diagram 6
2. Connections (4) and proper setting (4) and compensation (2) 10
3. Observations 6
4. Graph (4), Calculations (3) 7
5. Oral 3
Total : 32
Signature of examiner.
H (d2 - l2)2
4LSd4πni10
Remerksif any
0.36
SHIVAJI UNIVERSITY, KOLHAPUR
B. Sc. Part-III, Practical Examination, February, March 2015
Physics
Seat No. GROUP III
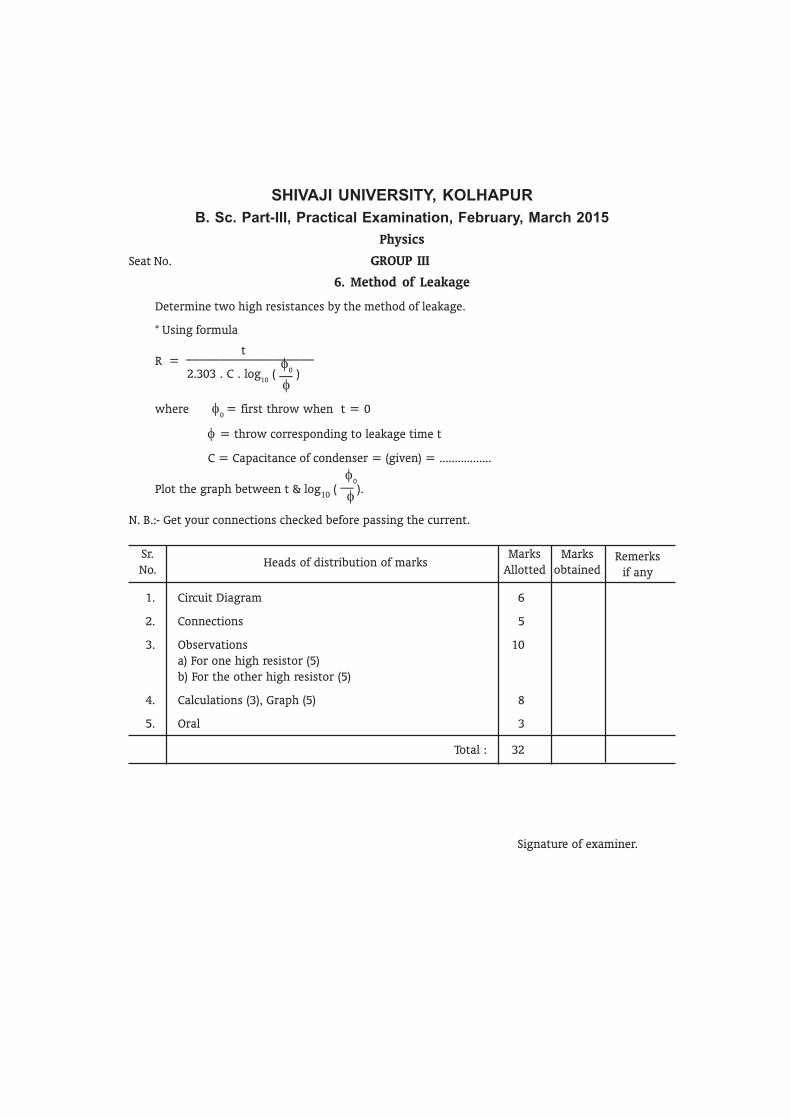
6. Method of Leakage
Determine two high resistances by the method of leakage.
* Using formula
R = ___________________
where φ0 = first throw when t = 0
φ = throw corresponding to leakage time t
C = Capacitance of condenser = (given) = .................
Plot the graph between t & log10 ( __
).
N. B.:- Get your connections checked before passing the current.
Sr.No.
Heads of distribution of marksMarks
AllottedMarks
obtained
1. Circuit Diagram 6
2. Connections 5
3. Observations 10a) For one high resistor (5)b) For the other high resistor (5)
4. Calculations (3), Graph (5) 8
5. Oral 3
Total : 32
Signature of examiner.
t
2.303 . C . log10
( __ ) φ
0
φ
φ0
φ
Remerksif any

SHIVAJI UNIVERSITY, KOLHAPUR
B. Sc. Part-III, Practical Examination, February, March 2015
Physics
Seat No. GROUP III
7. Resistance of B. G. by half deflection method.
You are given a circuit diagram. Make the connections accordingly and hence measure the resistanceof B. G. by half deflection method.
Get the connections checked before passing the current.
Scheme of Marking :
Sr.No.
Heads of distribution of marksMarks
AllottedMarks
obtained
1. Initial adjustments of G M - counter 8
2. Observations for background radiations 5
3. Observations for plateau curve 10
4. Graph, Calculations & Results 6
5. Oral 3
Total : 32
Signature of examiner.
Remarksif any

SHIVAJI UNIVERSITY, KOLHAPUR
B. Sc. Part-III, Practical Examination, February, March 2015
Physics
Seat No. GROUP III
8. Carey-Foster’s Bridge
Calibrate the given bridge wire by Carey-Foster Method. Cover the entire length of the wire insuccession by taking the segment of wire about 5 to 10 cms. Carey-Foster key must be used forreversing the gap.
N. B. :- Get your connections checked before passing the current.
Sr.No.
Heads of distribution of marksMarks
AllottedMarks
obtained
1. Circuit Diagram 5
2. Connections 8
3. Observations 8
4. Calculations and graph 8
5. Oral 3
Total : 32
Signature of examiner.
Remarksif any
SHIVAJI UNIVERSITY, KOLHAPUR
B. Sc. Part-III, Practical Examination, February, March 2015
Physics
Seat No. GROUP III
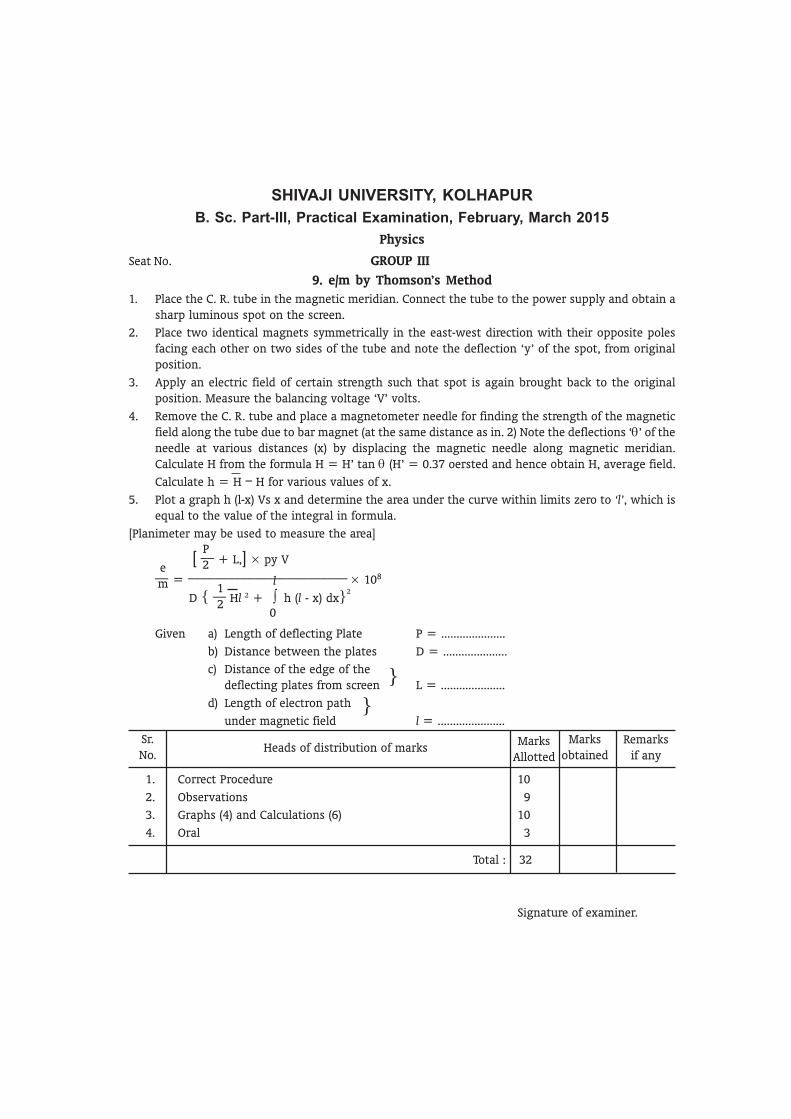
9. e/m by Thomson’s Method
1. Place the C. R. tube in the magnetic meridian. Connect the tube to the power supply and obtain asharp luminous spot on the screen.
2. Place two identical magnets symmetrically in the east-west direction with their opposite polesfacing each other on two sides of the tube and note the deflection ‘y’ of the spot, from originalposition.
3. Apply an electric field of certain strength such that spot is again brought back to the originalposition. Measure the balancing voltage ‘V’ volts.
4. Remove the C. R. tube and place a magnetometer needle for finding the strength of the magneticfield along the tube due to bar magnet (at the same distance as in. 2) Note the deflections ‘θ’ of theneedle at various distances (x) by displacing the magnetic needle along magnetic meridian.Calculate H from the formula H = H’ tan θ (H’ = 0.37 oersted and hence obtain H, average field.
Calculate h = H _
H for various values of x.
5. Plot a graph h (l-x) Vs x and determine the area under the curve within limits zero to ‘l’, which isequal to the value of the integral in formula.
[Planimeter may be used to measure the area]
__ =
________________________ × 108
Given a) Length of deflecting Plate P = .....................
b) Distance between the plates D = .....................
c) Distance of the edge of thedeflecting plates from screen L = .....................
d) Length of electron path
under magnetic field l = ......................
Sr.No.
Heads of distribution of marksMarks
Allotted
Marksobtained
1. Correct Procedure 10
2. Observations 9
3. Graphs (4) and Calculations (6) 10
4. Oral 3
Total : 32
Signature of examiner.
em
[ __ + L,] × py V
P2
D { __
Hl 2 + ∫ h (l - x) dx}21
2
l
0
}
}
Remarksif any

SHIVAJI UNIVERSITY, KOLHAPUR
B. Sc. Part-III, Practical Examination, February, March 2015
Physics
Seat No. GROUP III
10. Absolute Capacity of a Condenser using B. G.
Connect the resistance (R1) across the condenser C, charge the condenser and then discharge throughB. G. which is parallel to condenser; and record 1st and 2nd throws on the same side as θ1 and θ3.Keeping (R1) constant, measure the steady deflection δ for a constant current through B. G., when B. G.is shunted with a small shunt resistance (r). Repeat the experiment for four different values of shuntresistance (r) and note the corresponding deflections (δ).
Plot (r) against (δ) and determine the slope.
Hence calculate the capacitance using the formula -
C = ___ . ___ . ___ . θ1 ( __ )
where,
T = Periodic time of B. G. =....................Sec
G = Resistance of B. G. = ..................... ohms
Sr.No.
Heads of distribution of marksMarks
Allotted
Marksobtained
1. Circuit Diagram 7
2. Connections 7
3. Observations 8
4. Calculations (3), graph (2) and result (2) 7
5. Oral 3
Total : 32
Signature of examiner.
T2π
1GR
1
rδ
θ1
θ3
¼
Remarksif any
Given
i)
ii)

SHIVAJI UNIVERSITY, KOLHAPUR
B. Sc. Part-III, Practical Examination, February, March 2015
Physics
Seat No. GROUP IV
1. Voltage Sweep Generator using UJT
Draw the circuit diagram of voltage sweep generator using UJT
You are given UJT = 2N2646
having η = [intrinsic stand off ratio] = 0.61
Use VBB = 9V and C = .............. µF
“Assemble the circuit. Observe the waveforms on CRO. Measure the frequencies of waveforms forthree different charging resistances.
Verify these frequencies by using the formula.
f = ______________________
where ‘R’ is charging resistance.
Note : - Do not pass the current before circuit is checked by the examiner.
Sr.No.
Heads of distribution of marksMarks
AllottedMarks
obtained
1. Circuit Diagram 8
2. Connections 5
3. Observations 10
4. Calculations 6
5. Oral 3
Total : 32
Signature of examiner.
1
2.303 RC log10
( ____ )
1
1 _ η
Remarksif any

SHIVAJI UNIVERSITY, KOLHAPUR
B. Sc. Part-III, Practical Examination, February, March 2015
Physics
Seat No. GROUP IV
2. Astable Multivibrator Using IC 555
Draw the circuit diagram of astable multivibrator using IC 555
use C = ................ µF Assemble the circuit.
Observe the output on C.R.O. Trace this waveform.
Measure the frequencies for three different sets of corresponding resistances.
Verify the observed frequencies in each case,
f = __________
Sr.No.
Heads of distribution of marksMarks
AllottedMarks
obtained
1. Circuit Diagram 10
2. Connections 8
3. Observations (4), Calculations (5) Tracing wave form (2) 11
4. Oral 3
Total : 32
Signature of examiner.
1.44(R
A + 2R
B) C
Remarksif any
SHIVAJI UNIVERSITY, KOLHAPUR
B. Sc. Part-III, Practical Examination, February, March 2015
Physics
Seat No. GROUP IV
3. OP - AMP - as Inverting Ac Amplifier
Draw the circuit diagram of OP-AMP as inverting amplifer.
use OP-AMP = .................
Assemble the Circuit.
Keeping frequency constant measure output voltage for the given input voltage. Repeat theexperiment for THREE different sets of combination of R1 and R2.
Verify the relation A = ___
= ___
in each case.
Keeping input constant & varying frequency measure the outputs for any one such set and drawthe frequency response curve and find band-width.
Sr.No.
Heads of distribution of marksMarks
AllottedMarks
obtained
1. Circuit Diagram 9
2. Connections 8
3. Observations 8
4. Graph & calculations 4
5. Oral 3
Total : 32
Signature of examiner.
R2
R1
V0
Vi
Remarksif any
IC 741

SHIVAJI UNIVERSITY, KOLHAPUR
B. Sc. Part-III, Practical Examination, February, March 2015
Physics
Seat No. GROUP IV
4. OP-AMP AS a “Schmitt Trigger’’/ Study of Variable D. C. supply using IC-317
Draw the circuit diagram of Schmitt trigger using a given OP-AMP ..................Assemble the circuit.Measure the output Voltage for different input voltages.Use C.R.O. / digital multimeter for measuring output voltages.Plot the hysteresis curve. Hence determine UTP & LTP.Verify values of UTP & LTP using the necessary formula.
ORDraw the Cirauit diagram of Variable D. C. Supply using IC- 317Assemble the circuit & study its operation.
Scheme of Marking :
Sr.No.
Heads of distribution of marksMarks
AllottedMarks
obtained
1. Circuit Diagram 9
2. Connections 8
3. Observations (6), Calculations (4), Graph (4) 12
4. Oral 3
Total : 32
Signature of Examiner.
Remarksif any
IC 741
UTP = x Vsat
LTP = x Vsat
Given Vsat =..................volt
Rf : fecdback vesistor
RR+RfRR+Rf

SHIVAJI UNIVERSITY, KOLHAPUR
B. Sc. Part-III, Practical Examination, February, March 2015
Physics
Seat No. GROUP IV
5. Solar Cell
Plot the I-V. characteristics of the given solar cell, and hence determine the fill factor.
N. B.1) Get your circuit diagram checked.
2) Get your connections checked before connecting the source of e.m.f.
Scheme of Marking :
Sr.No.
Heads of distribution of marksMarks
AllottedMarks
obtained
1. Circuit diagram 6
2. Connections 4
3. Observations 11
4. Graph (4) Calculation (2) result (2) 8
5. Oral 3
Total : 32
Signature of examiner.
Remarksif any

SHIVAJI UNIVERSITY, KOLHAPUR
B. Sc. Part-III, Practical Examination, February, March 2015
Physics
Seat No. GROUP IV
6. Use of Internet
A. Create new E-mail ID send and receive E-mail. Take Print out of mails.
B. Brows the given web site..........................
Demonstrate and Explain to the examiner.
Scheme of Maring
Sr.No.
Heads of distribution of marksMarks
AllottedMarks
obtained
1. Creating e-mail account 8
2. Sending and Receiving e-mail 8
3. Browsing web pages 8
4. Printout 4
5. Oral 4
Total : 32
Signature of examiner.
Remarksif any

SHIVAJI UNIVERSITY, KOLHAPUR
B. Sc. Part-III, Practical Examination, February, March 2015
Physics
Seat No. GROUP IV
7. Crystal Oscillator
Build a Crystal Oscillator using the given componets. Obtain the output waveform of the Oscillatoron CRO and find its Frequescy.
Draw the nature of the wave form in your answer book.
Scheme of Marking :
Sr.No.
Heads of distribution of marksMarks
AllottedMarks
obtained
1. Circuit Diagram 9
2. Connections 8
3. Observations 8
4. Wavel form on CRO & Result (Observed Frequency) 4
4. Oral 3
Total : 32
Signature of examiner.
Remarksif any

SHIVAJI UNIVERSITY, KOLHAPUR
B. Sc. Part-III, Practical Examination, February, March 2015
Physics
Seat No. GROUP IV
8. Characteristics of FET
Plot the output characteristics of FET (......................), for three different VGS - voltages in CS - mode.
Determine the drain resistance (rds), transconductance (gm) and amplification factor (µ).
Scheme of Marking :
Total : 32
Sr.No.
Heads of distribution of marksMarks
AllottedMarks
obtained
1. Circuit Diagram 8
2. Circuit Connections 7
3. Observations 6
4. Calculation (3), Graph (3) & Result (2) 8
5. Oral 3
Signature of examiner.
Remarksif any
i) rds =(-------------) vgs ii) gm =(....................)ID iii) u=rds x gm
N. B.
i) Get tpur circuit diagram checked by exeminer
ii) Get your connechions checked be fore passing the current
V Ds
ID
ID
V Ds

SHIVAJI UNIVERSITY, KOLHAPUR
B. Sc. Part-III, Practical Examination, February, March 2015
Physics
Seat No. GROUP IV
9. FET as VVR
Draw the circuit diagram and assemble the circuit of FET as voltage variable resistance. Measurethe Drain current (ID) with change in VDS for different values of VGS and plot the output characteristics.Also calculate drain resistance (RDS) for different values of VGS. Plot the graph of RDS against VGS andcomment on the nature of the graph.
RDS =----------------
i) Get your circuil diagram checked by examiner
ii) Get your connechon checked be fore passing the chrrent.
Scheme of Marking :
Sr.No.
Heads of distribution of marksMarks
AllottedMarks
obtained
1. Circuit Diagram 6
2. Circuit Connections 6
3. Observations 5
4. Calculation (4), Graphs (6) and Comments (2) 12
5. Oral 3
Total : 32
Signature of examiner.
Remarksif any
VDS
ID
SHIVAJI UNIVERSITY, KOLHAPUR
B. Sc. Part-III, Practical Examination, February, March 2015
Physics
Seat No. GROUP IV
10. Band gap energy/temp. senser using semiconductor diode/ IC- 555 as a monostable
multivibrator
Measure the reverse current (IS) at different temperatures (T0K) for given Semiconductor diode. Plot
the graph of log IS against __ and measure the slope. Hence calculate the band gap Eg in eV, using the
formula,
Eg = _____ = ........... eV
OR
Draw the circuit diagram of monostable multivibrator using IC-555. Assemble the circuit. Measure the
Pulse width for different values of R. Verify the results by using relation. T = 1.1 RC
Scheme of Marking :
Sr.No.
Heads of distribution of marksMarks
AllottedMarks
obtained
1. Circuit Diagram 5
2. Circuit Connections 6
3. Observations 10
4. Calculations and Results 8
5. Oral 3
Total : 32
Signature of examiner.
1T
Slope5036
Remarksif any

SHIVAJI UNIVERSITY, KOLHAPUR
B. Sc. Part-III, Practical Examination, February, March 2015
Physics
Seat No. GROUP V (A)
A-1. Study of divergence of Laser beam
Measure the full angle beam divergence of a given laser beam. Compare the same with thetheoretical value of angular spread ∆θ of the far field beam, given by
∆θ = ___ where, λ = Wavelength of Laser beam = ............................
d = Aperture diameter = ..........................
Scheme of Marking :
Sr.No.
Heads of distribution of marksMarks
AllottedMarks
obtained
1. Observations 7
2. Calculations (3) and result (2) 5
3. Oral to test experimental skill 4
Total : 16
Signature of examiner.
λd
Remarksif any

SHIVAJI UNIVERSITY, KOLHAPUR
B. Sc. Part-III, Practical Examination, February, March 2015
Physics
Seat No. GROUP V (A)
A-2. Polar graph using Photocell/Photovoltaic cell
With the given experimental set up, measure the intensity of the filament-lamp for various angularpositions and plot the polar graph to show intensity distribution by keeping filament lamp in horizontalposition.
Scheme of Marking :
Sr.No.
Heads of distribution of marksMarks
AllottedMarks
obtained
1. Observations 6
2. Polar graph 6
3. Oral to test experimental skill 4
Total : 16
Signature of examiner.
Remarksif any
SHIVAJI UNIVERSITY, KOLHAPUR
B. Sc. Part-III, Practical Examination, February, March 2015
Physics
Seat No. GROUP V (A)
A-3. Measurement of wave length of Laser beam using plane diffraction grating.
Using the diffraction grating & given laser source, obtain diffraction pattern. Determine thewavelength of laser source with the formula,
λ = __ sinθm
= ___ × _________
where,
d = grating element = ........................ cm.
m = order of diffraction.
xm = distance of mth order from central maximum.
D = distance between screen and grating.
Scheme of Marking :
Sr.No.
Heads of distribution of marksMarks
AllottedMarks
obtained
1. Observations 6
2. Calculations (4) and result (2) 6
3. Oral to test experimental skill 4
Total : 16
Signature of examiner.
Remarksif any
dmdm
xm
(xm
2 + D2)½

SHIVAJI UNIVERSITY, KOLHAPUR
B. Sc. Part-III, Practical Examination, February, March 2015
Physics
Seat No. GROUP V (A)
A-4. Optical leveling and Schuster’s method of a spectrometer.
i) Carryout the optical leveling of given spectrometer
ii) Adjust the spectrometer for parallel light by Schuster’s method.
Show each adjustment to the examiner
Scheme of Marking :
Sr.No.
Heads of distribution of marksMarks
AllottedMarks
obtained
1. Optical leveling 5
2. Schuster’s method 7
3. Oral to test experimental skill 4
Total : 16
Signature of examiner.
Remarksif any

SHIVAJI UNIVERSITY, KOLHAPUR
B. Sc. Part-III, Practical Examination, February, March 2015
Physics
Seat No. GROUP V (A)
A-5. Obtaining Biprism fringes without lateral shift
i) Obtain clear fringe-pattern using given biprim.
ii) Remove the lateral shift (optical alignment)
Show the adjustments to the examiner
Scheme of Marking :
Sr.No.
Heads of distribution of marksMarks
AllottedMarks
obtained
1. Clear fringe pattern 6
2. Optical alignment 6
3. Oral to test experimental skill 4
Total : 16
Signature of examiner.
Remarksif any
SHIVAJI UNIVERSITY, KOLHAPUR
B. Sc. Part-III, Practical Examination, February, March 2015
Physics
Seat No. GROUP V (A)
A-6. Measurement of distance between two coherent sources in biprism experiment
You are provided with clear fringe pattern without lateral shift.
Measure the distance between two coherent sources
d = √d1 d2
where, d1 = distance between magnified images
d2 = distance between rednced images.
Scheme of Marking :
Sr.No.
Heads of distribution of marksMarks
AllottedMarks
obtained
1. Adjustments 4
2. Observations 6
3. Calculation (1) and result (1) 2
4. Oral to test experimental skill 4
Total : 16
Signature of examiner.
Remarksif any

SHIVAJI UNIVERSITY, KOLHAPUR
B. Sc. Part-III, Practical Examination, February, March 2015
Physics
Seat No. GROUP V (A)
A-7. Determining the radius of capillary bore using mercury thread
Introduce a thread of mercury of length more than 2cm. in the given capillary tube and measure itslength (l) by meter-scale. Measure the mass (m) of the mercury thread. Calculate the radius (r) of thecapillary tube using
m = π r2 l. 9
where 9 = 13.6 gm/cm3
Scheme of Marking :
Sr.No.
Heads of distribution of marksMarks
AllottedMarks
obtained
1. Introducing mercury thread 4
2. Measurement of l (2) and m (3) 5
3. Calculation (2) & result (1) 3
4. Oral to test experimental skill 4
Total : 16
Signature of examiner.
Remarksif any

SHIVAJI UNIVERSITY, KOLHAPUR
B. Sc. Part-III, Practical Examination, February, March 2015
Physics
Seat No. GROUP V (A)
A-8. Determining lattice constant using given XRD powder pattern
You are given an x-ray diffraction pattern of a powder sample with (h, k, l) values. Measure theangle of diffraction (θ) for three peaks mentioned by the examiner and hence calculate the latticeconstant (a), with the formula,
a = [ ____________ ]½
where λ = -------------------- A0
Scheme of Marking :
Sr.No.
Heads of distribution of marksMarks
AllottedMarks
obtained
1. Measurement of angle (θ) 6
2. Calculation (4) & result (2) 6
4. Oral to test experimental skill 4
Total : 16
Signature of examiner.
Remarksif any
λ2 (h2 + k2 + l2)4 sin2θ
SHIVAJI UNIVERSITY, KOLHAPUR
B. Sc. Part-III, Practical Examination, February, March 2015
Physics
Seat No. GROUP V (A)
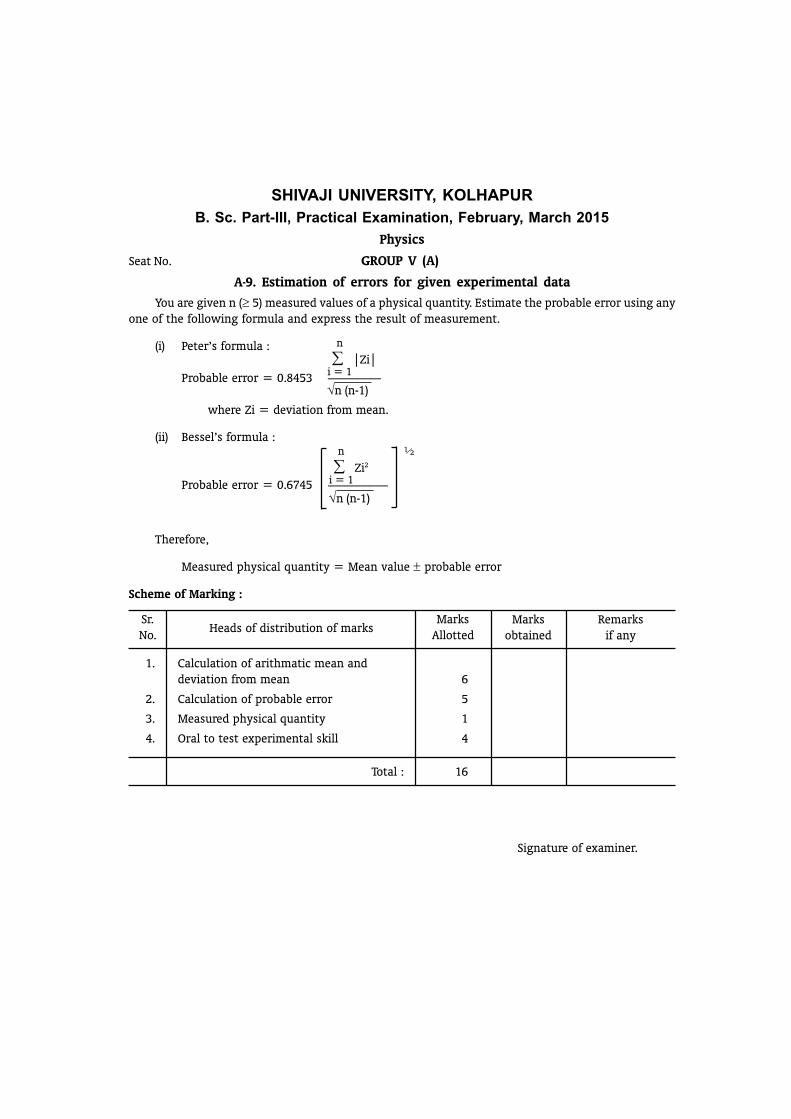
A-9. Estimation of errors for given experimental data
You are given n (≥ 5) measured values of a physical quantity. Estimate the probable error using anyone of the following formula and express the result of measurement.
(i) Peter’s formula :
Probable error = 0.8453 ________
where Zi = deviation from mean.
(ii) Bessel’s formula :
Probable error = 0.6745 _________
Therefore,
Measured physical quantity = Mean value ± probable error
Scheme of Marking :
Sr.No.
Heads of distribution of marksMarks
AllottedMarks
obtained
1. Calculation of arithmatic mean anddeviation from mean 6
2. Calculation of probable error 5
3. Measured physical quantity 1
4. Oral to test experimental skill 4
Total : 16
Signature of examiner.
Remarksif any
∑ |Zi|
n
i = 1
√n (n-1)
∑ Zi2
n
i = 1
√n (n-1)
½

SHIVAJI UNIVERSITY, KOLHAPUR
B. Sc. Part-III, Practical Examination, February, March 2015
Physics
Seat No. GROUP V (A)
A-10. Time base Circuit
You are given a circuit diagram. Make the connections accordingly and hence measure the timeperiod for correrponding charging resistance. Determine the frequency.
Scheme of Marking :
Sr.No.
Heads of distribution of marksMarks
AllottedMarks
obtained
1. Connections 5
2. Procedure Observations calculations 6
3. Result 2
4. Oral to test experimental skill 3
Total : 16
Signature of examiner.
Remarksif any
SHIVAJI UNIVERSITY, KOLHAPUR
B. Sc. Part-III, Practical Examination, February, March 2015
Physics
Seat No. GROUP V (B)
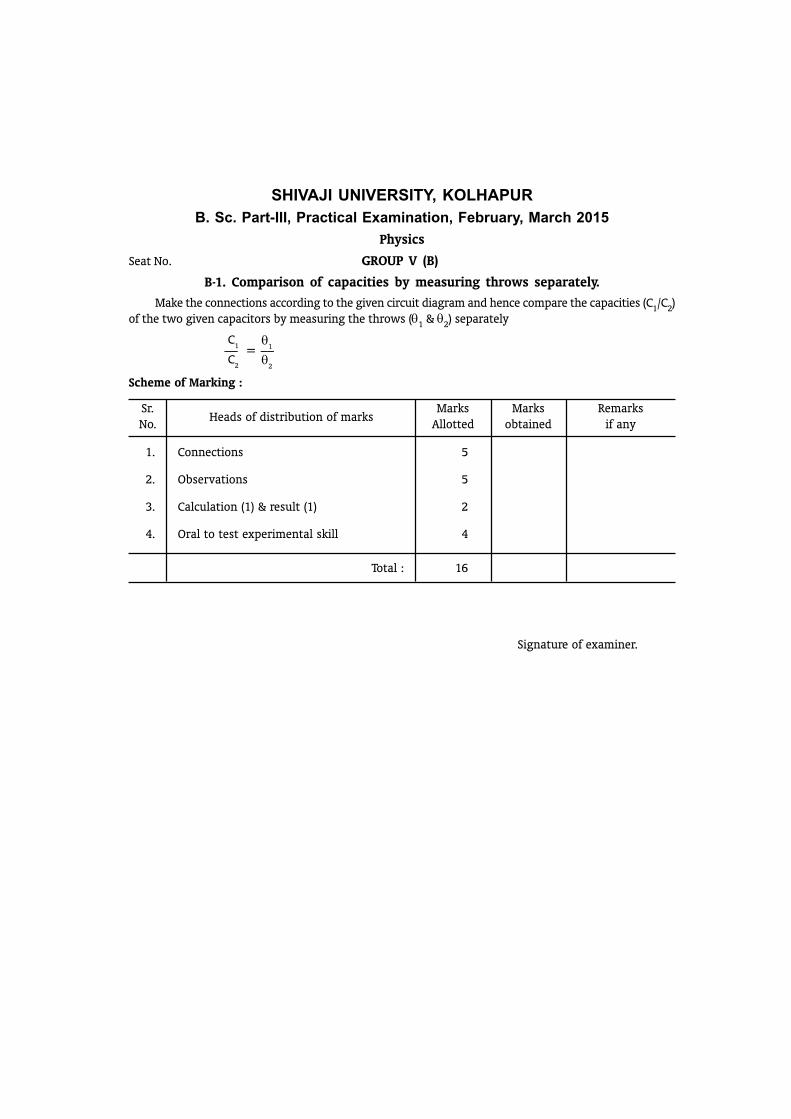
B-1. Comparison of capacities by measuring throws separately.
Make the connections according to the given circuit diagram and hence compare the capacities (C1/C2)of the two given capacitors by measuring the throws (θ1 & θ2) separately
__ = __
Scheme of Marking :
Sr.No.
Heads of distribution of marksMarks
AllottedMarks
obtained
1. Connections 5
2. Observations 5
3. Calculation (1) & result (1) 2
4. Oral to test experimental skill 4
Total : 16
Signature of examiner.
Remarksif any
C1
C2
θ1
θ2
SHIVAJI UNIVERSITY, KOLHAPUR
B. Sc. Part-III, Practical Examination, February, March 2015
Physics
Seat No. GROUP V (B)
B-3. Testing of electronic components
Test the given four components (a resistor, a capacitor, a diode and a transistor) by using multimeter/CRO and note the results.
Scheme of Marking :
Sr.No.
Heads of distribution of marksMarks
AllottedMarks
obtained
1. Testing 8
2. Results 4
3. Oral to test experimental skill 4
Total : 16
Signature of examiner.
Remarksif any

SHIVAJI UNIVERSITY, KOLHAPUR
B. Sc. Part-III, Practical Examination, February, March 2015
Physics
Seat No. GROUP V (B)
B-3. Hysteresis by using CRO
You are given circuit diagram. Make the connections accordingly and obtain hysteresis loop on CRO.Measure the intercept OA and OB on x - and y - axis respectively for standard anchor ring. Repeat theexperiment with a given experimental anchor ring and measure the respective intercepts OA1 and OB1.Calculate the coersitivity (C1) and retentivity (R1) as :
(i) __ = ___ (ii) ___ = ___
Given : C = ............................, R = .................................
Note : Get the connections checked before switching on the circuit.
Sr.No.
Heads of distribution of marksMarks
AllottedMarks
obtained
1. Circuit connections 4
2. Hysteresis loop (3),Measurement of intercepts (3) 8
3. Calculation (1) & result (1) 2
4. Oral to test experimental skill 4
Total : 16
Signature of examiner.
Remarksif any
CC
1
OAOA
1
RR
1
OBOB
1

SHIVAJI UNIVERSITY, KOLHAPUR
B. Sc. Part-III, Practical Examination, February, March 2015
Physics
Seat No. GROUP V (B)
B-4. Study of Lissajeous figures using CRO
Determine the frequency of A.C. mains using a step-down transformer connected to y-plates. Use anaudio frequency generator, as a source of known frequency connected to x-plates and obtain threedifferent Lissajeous figures.
Show the Lissageous figure to the examiner.
Calculate frequency of A. C. main (fy), using the formula
__ = ___
where Nh = No. of loops tangentially touching to x-axis
Nv = No. of loops tangentially touching to y-axis
Sr.No.
Heads of distribution of marksMarks
AllottedMarks
obtained
1. Connections 4
2. Lissajeous figuresMeasurement of N
h & N
V5
3. Calculation (2) & result (1) 3
4. Oral to test experimental skill 4
Total : 16
Signature of examiner.
Remarksif any
fy
fx
Nh
Nv
SHIVAJI UNIVERSITY, KOLHAPUR
B. Sc. Part-III, Practical Examination, February, March 2015
Physics
Seat No. GROUP V (B)
B-5. Kelvin’s Method
Measure the resistance of the given galvanometer using P.O. Box by Kelvin’s method.
Scheme of Marking :
Sr.No.
Heads of distribution of marksMarks
AllottedMarks
obtained
1. Circuit connection as per given circuit 4
2. Balance point 5
3. Calculation (2) & result (1) 3
4. Oral to test experimental skill 4
Total : 16
Signature of examiner.
Remarksif any

SHIVAJI UNIVERSITY, KOLHAPUR
B. Sc. Part-III, Practical Examination, February, March 2015
Physics
Seat No. GROUP V (B)
B-6. Measurement of Phase shift of RC network.
Measure the phase shift (θ) for two different RC-combinations, using CRO. Compare the experimentalresults with the theoretical values.
θ = tan-1 ( ------------------ )
Scheme of Marking :
Sr.No.
Heads of distribution of marksMarks
AllottedMarks
obtained
1. Obtaining trace on CRO 4
2. Measurement of phase angle (4) andcomparision with theoretical Values (4) 8
3. Oral to test experimental skill 4
Total : 16
Signature of examiner.
Remarksif any
12πf Rc

SHIVAJI UNIVERSITY, KOLHAPUR
B. Sc. Part-III, Practical Examination, February, March 2015
Physics
Seat No. GROUP V (B)
B-7. Computer skill testing-I (Programming in ‘C’)
Enter, compile and execute the given C-programme.
Scheme of Marking :
Sr.No.
Heads of distribution of marksMarks
AllottedMarks
obtained
1. Entering the program 4
2. Compling 4
3. Executing 4
3. Oral to test experimental skill 4
Total : 16
Signature of examiner.
Remarksif any

SHIVAJI UNIVERSITY, KOLHAPUR
B. Sc. Part-III, Practical Examination, February, March 2015
Physics
Seat No. GROUP V (B)
B-8. Computer skill testing - III (MS-Office word)
i) MS-WORD :
Type a letter or biodata given to you.
Scheme of Marking :
Sr.No.
Heads of distribution of marksMarks
AllottedMarks
obtained
1. i) Entering the data 4
ii) Obtaining the printout 2
2. i) Tabulating the data 3
ii) Graph 3
iii) Oral to test experimented 4
Total : 16
Signature of examiner.
Remarksif any
SHIVAJI UNIVERSITY, KOLHAPUR
B. Sc. Part-III, Practical Examination, February, March 2015
Physics
Seat No. GROUP V (B)
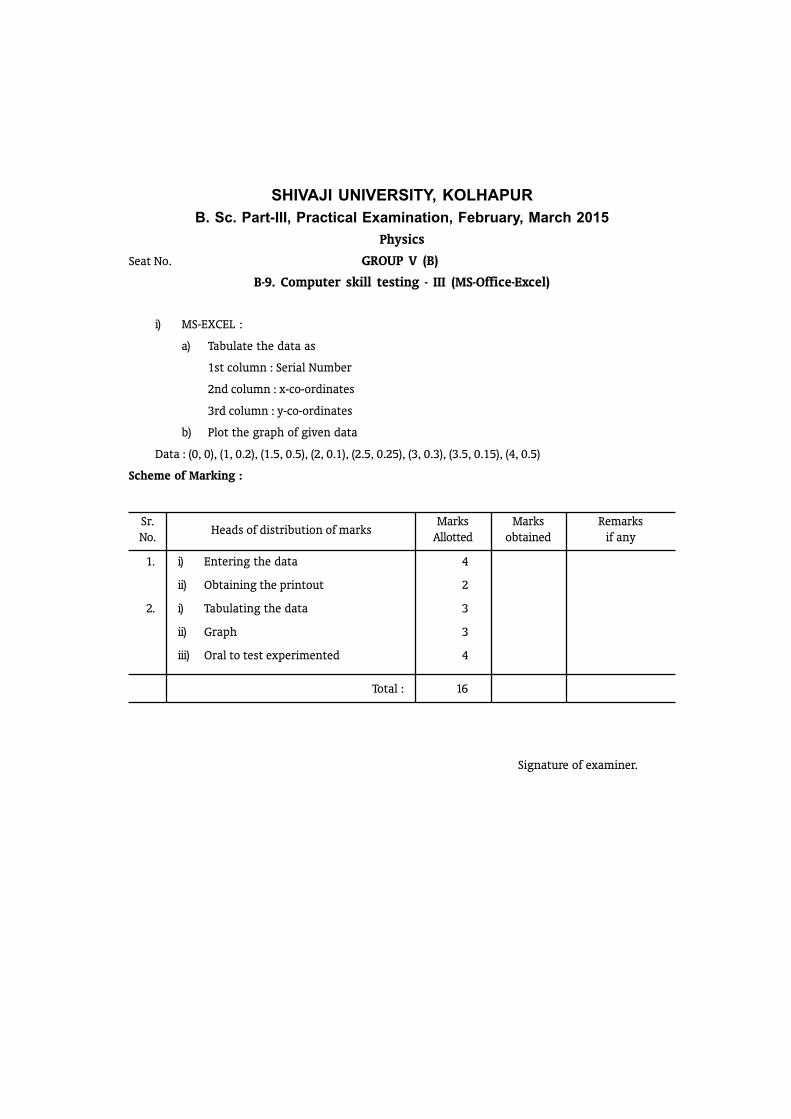
B-9. Computer skill testing - III (MS-Office-Excel)
i) MS-EXCEL :
a) Tabulate the data as
1st column : Serial Number
2nd column : x-co-ordinates
3rd column : y-co-ordinates
b) Plot the graph of given data
Data : (0, 0), (1, 0.2), (1.5, 0.5), (2, 0.1), (2.5, 0.25), (3, 0.3), (3.5, 0.15), (4, 0.5)
Scheme of Marking :
Sr.No.
Heads of distribution of marksMarks
AllottedMarks
obtained
1. i) Entering the data 4
ii) Obtaining the printout 2
2. i) Tabulating the data 3
ii) Graph 3
iii) Oral to test experimented 4
Total : 16
Signature of examiner.
Remarksif any

SHIVAJI UNIVERSITY, KOLHAPUR
B. Sc. Part-III, Practical Examination, February, March 2015
Physics
Seat No. GROUP V (B)
B-10. Computer skill testing - IV (MS-OFFICE- Power Point Presentation)
Create a power point presentation of high lights of your Seminar by preparing four slides. Presentthe slide-show and then take the printouts.
Scheme of Marking :
Sr.No.
Heads of distribution of marksMarks
AllottedMarks
obtained
1. Preparation of slides 6
2. Presentation of slide show & Printaht 6
3. Oral 4
Total : 16
Signature of examiner.
Remarksif any

SHIVAJI UNIVERSITY, KOLHAPUR
B. Sc. Part-III, Practical Examination, February, March 2015
Physics
Seat No. GROUP VI
Sr.No.
Heads of distribution of marksMarks
AllottedMarks
obtained
1. Certified journal (10) presentation (10) 20
2. Study tour report 10
3. Seminar report (2Seminars) 10
Total : 40
Signature of examiner.
Remarksif any
Note :- The synopsis of study tour and seminar should be reported in the answer book.


![Shivaji University, Kolhapur. Electronics... · 1 Shivaji University, Kolhapur Shivaji University, Kolhapur. Syllabus / Structure [Revised from June-2009] (T.E. Electronics Engineering)](https://img.pdfslide.us/doc/110x75/5a7e734b7f8b9a2e6e8e7871/shivaji-university-electronics1-shivaji-university-kolhapur-shivaji-university.jpg)