Embed Size (px)
Citation preview
Shipping IntelligenceWeekly
Issue No. 888 18-Sep-2009 ISSN: 1358-8028
ClarkSea Index $10,262 The Atlantic Market This Week ……
Capesize: Weaker Panamax: Softer Handy: Firm
Selection of ports covered by the various market sectors in this report
The Pacific Market This Week ……
Capesize: Weaker Panamax: Steady Handy: Firmer
510152025303540455055
Sep-
03Ja
n-04
May
-04
Sep-
04Ja
n-05
May
-05
Sep-
05Ja
n-06
May
-06
Sep-
06Ja
n-07
May
-07
Sep-
07Ja
n-08
May
-08
Sep-
08Ja
n-09
May
-09
$,000/day
Highlights VLCC Market A quiet week in the MEG saw rates creep up at the end………...…...p.2 Suezmax Market A steady flow of WAF cargoes met ample tonnage this week……….p.2 Aframax Market Another quiet end to week in the Med market………….……..…..p.2 Products Market A busy week in the MEG saw rates East rise…………………...…....p.3 Capesize Market The week started slowly and activ-ity did not pick up.……………. p.4 Panamax Market The Pacific had a nervous start but firmed at the end of the week…..p.4 Handymax Market Very little activity in the Atlantic, and the Pacific remained steady..p.5 S & P Market Due to ongoing market uncertainty, no matrix of values has been pro-vided this week. If you require valuations or would like to discuss specific issues, please contact Clarkson Valuations Limited…...p.i Newbuilding The majority of enquiries have been targeted at the dry market...…..p.10 Demolition A quieter week for the demolition market……………..…………. p.11

Crude Tanker Spot MarketCrude Tanker Highlights
VLCC Single WS 2009 Average earnings $ per day VLCC Earnings
Voyage..... Sep 11 Sep 18 2009 2007 2008 2009 Sep 11 Sep 18 This Week ....2 280,000t Gulf - Europe 22.5 22.5 30 45,347 74,040 21,798 2,269 1,913 WEAKER -16%2 280,000t Gulf - US Gulf * 22.5 22.5 30 44,484 71,874 21,017 1,806 1,658 WEAKER -8%2 265,000t Gulf - Japan * 30.0 31.0 40 64,572 105,036 29,971 7,279 9,042 FIRMER 24%2 265,000t Gulf - S.Korea * 30.0 31.0 40 62,709 102,002 30,424 8,681 10,181 FIRMER 17%2 270,000t Gulf - Sing 32.5 32.5 41 66,291 108,338 32,123 12,831 12,594 STEADY -2%2 280,000t Gulf - Red Sea 37.5 37.5 47 71,857 118,415 44,295 23,088 22,870 STEADY -1%2 260,000t WAF - East * 35.0 35.0 41 50,884 82,951 32,984 17,869 17,640 STEADY -1%2 260,000t WAF - US Gulf * 40.0 40.0 47 56,072 100,691 42,224 25,651 25,613 STEADY 0%2 280,000t Med - UKC 47.5 52.5 52 71,886 128,474 56,906 42,986 51,046 FIRMER 19%2 260,000t WAF - WC India^ 2.50 2.40 2.85 53,868 87,201 36,790 21,929 19,220 WEAKER -12%2 VLCC Ave. Earnings * 55,744 92,511 31,324 12,257 12,827 FIRM.... 5%^ WAF - WC India route quoted in WS until 11-Aug-06; quoted as a lump-sum figure thereafter (in $ million).
Suezmax Single WS 2009 Average earnings $ per day Suezmax Earnings Voyage..... Sep 11 Sep 18 2009 2007 2008 2009 Sep 11 Sep 18 This Week ....4 130,000t Gulf - S.China 55.0 55.0 64 41,333 65,548 26,189 14,198 13,944 STEADY -2%4 130,000t WAF - USAC * 57.5 55.0 64 39,175 65,588 25,436 15,629 14,550 SOFTER -7%4 130,000t WAF - Med 57.5 55.0 64 46,612 76,636 26,998 16,901 14,817 WEAKER -12%4 130,000t Med - Med * 67.5 72.5 70 49,110 87,681 29,449 21,974 26,565 FIRMER 21%4 Suezmax Ave. Earnings * 44,142 76,634 27,442 18,802 20,558 FIRMER 9%
Aframax Single WS 2009 Average earnings $ per day Aframax Earnings Voyage..... Sep 11 Sep 18 2009 2007 2008 2009 Sep 11 Sep 18 This Week ....6 80,000t Gulf - East * 65.0 70.0 72 29,654 38,045 14,404 7,373 9,396 FIRMER 27%6 80,000t Med - Med * 62.5 70.0 77 31,685 50,637 16,229 5,436 9,323 FIRMER 72%6 80,000t Med - USAC 70.0 72.5 86 35,821 50,924 20,787 8,893 10,565 FIRMER 19%6 80,000t UKC - UKC * 67.5 72.5 78 39,706 68,511 10,610 -1,352 1,941 WEAKER!! -244%6 80,000t UKC - USAC 70.0 70.0 88 35,733 50,587 19,343 6,617 6,743 STEADY 2%6 80,000t UKC - Med 65.0 65.0 73 25,923 40,363 13,799 5,544 5,253 SOFTER -5%6 80,000t Indo - Japan * 57.5 70.0 68 29,493 38,513 11,656 2,399 8,359 FIRMER 248%6 70,000t Carib - US Gulf * 65.0 70.0 83 22,455 36,172 13,747 3,651 5,599 FIRMER 53%6 80,000t Black Sea - Med * 72.5 75.0 84 43,853 67,785 24,114 12,977 14,742 FIRMER 14%6 Aframax Ave. Earnings * 32,808 49,944 15,127 5,081 8,227 FIRMER 62%
Clarkson Research Services Page 2
Note: In June 2008, all tanker earnings since start 2004 were re-evaluated on the basis of revised voyage calculations; "Earnings" are timecharter equivalents of spot freight rates (see footnote on page 4); */# Indicates constituent routes of "Average Earnings" for each sector since start 2004.
18-Sep-09
Crude Tanker Spot Earnings ($,000's/day)
20
40
60
80
100
120
140
160
180
200
220
240
Sep'07
Nov'07
Jan'08
Mar'08
May'08
Aug'08
Oct'08
Dec'08
Feb'09
Apr'09
Jun'09
Aug'09
VLCCSuezmaxAframax
• VLCCs: It was a quiet week in the MEG with rates East creeping up a little towards the end of the week. By the close of the week there were a lot of uncovered cargoes in the MEG, and with September stems now more or less finished, attention has turned to the first decade of October. Rates have remained flat in the Atlantic with little enquiry throughout the week. A softening Suezmax market has prevented owners from taking advantage of the apparently thin VLCC tonnage list in the Atlantic. • Suezmaxes:
A steady flow of cargoes in WAF was met by a well proportioned tonnage list and so we saw an initial softening in rates which quickly stabilised. Owners remained bullish in the face of charterers’ enquiry in the Med. • Aframaxes:
A quiet end to the week in the Med with few fixtures to report. Overall, average Aframax earnings remain at a lowly $8,227/day.

Product Tanker Spot Market
Clean Product WS 2009 Average earnings $ per day Clean Earnings Single Voyage... Sep 11 Sep 18 2009 2007 2008 2009 Sep 11 Sep 18 This Week ....8 75,000t Gulf - Japan 97.5 105.0 78 23,704 41,305 14,899 18,511 21,872 FIRMER 18%9 55,000t Gulf - Japan 105.0 122.5 90 24,194 34,854 12,772 13,637 19,435 FIRMER 43%
13 35,000t Gulf - Japan * 105.0 110.0 92 22,930 22,968 5,794 5,451 6,518 FIRMER 20%13 35,000t Gulf - E.Africa * 160.0 160.0 133 27,401 31,952 15,050 17,472 17,390 STEADY 0%13 37,000t UKC - USAC * 100.0 90.0 107 28,810 24,669 9,720 5,792 3,853 WEAKER!! -33%13 38,000t Caribs - USAC * 90.0 87.5 98 28,820 23,650 7,480 3,547 3,165 WEAKER -11%13 30,000t Sing - Japan * 87.5 90.0 85 14,116 13,386 1,840 -374 135 FIRMER 136%14 30,000t Med - USAC # 120.0 110.0 127 23,231 22,865 10,689 6,944 5,469 WEAKER -21%14 30,000t Med - UKC # 105.0 105.0 120 22,467 20,713 9,860 4,807 4,823 STEADY 0%14 30,000t Med - Med 95.0 95.0 109 36,313 36,510 8,774 3,127 3,235 FIRM.... 3%14 30,000t Black Sea - Med 95.0 105.0 114 27,571 29,075 11,797 5,370 7,738 FIRMER 44%14 30,000t Baltic - UKC # 95.0 95.0 107 21,538 20,687 7,754 2,780 2,645 SOFTER -5%14 30,000t UKC - UKC § 95.0 95.0 107 New time-series 5,325 2,465 -373 WEAKER!! -115%
Clean 'MR' Ave. Earnings * 24,416 23,325 7,977 6,378 6,212 STEADY -3%Clean 'Hdy' Ave. Earnings # 22,412 21,422 9,434 4,844 4,312 WEAKER -11%
See footnote on page 2. § Jun-08: Tees-Amsterdam replaced Tees-Dunkirk as featured UKC-UKC route.
Dirty Product WS 2009 Average earnings $ per day Dirty Earnings Single Voyage... Sep 11 Sep 18 2009 2007 2008 2009 Sep 11 Sep 18 This Week ....12 55,000t Med - US Gulf * 70.0 85.0 93 32,196 36,955 13,894 2,644 7,742 FIRMER 193%12 55,000t UKC - US Gulf * 70.0 85.0 92 34,427 40,028 15,116 3,933 8,959 FIRMER 128%12 50,000t Caribs - USAC * 85.0 95.0 94 26,864 33,552 12,074 6,490 9,652 FIRMER 49%12 45,000t Med - UKC 80.0 90.0 104 New time-series 12,114 1,712 4,543 FIRMER 165%
Dirty Ave. Earnings * 31,162 36,845 13,695 4,355 8,784 FIRMER 102%
VLCC Spot Monthly Fixture Record VLCC Spot Market
Market Activity... Average No. Number Last This Week ...2007 2008 May '09 Jun '09 Jul '09 Aug '09 Sep '09 4 Wks
Fixtures: Gulf-West 28 24 24 25 19 21 12 17 UP BY.... 42%Gulf-East/Japan 67 56 49 46 75 50 36 48 UP BY.... 33%Gulf-Red Sea 0 0 0 0 0 0 0 0 #DIV/0! #DIV/0!Others 33 27 34 35 28 24 18 25 UP BY.... 39%
Total Number of Fixtures 129 107 107 106 122 95 66 90 UP BY.... 36%Vessels due to arrive in Gulf ~ 65 71 84 71 80 58 92 84 DOWN BY... -9%VLCC's Spot in Gulf ~ No. 3 4 8 10 3 3 5 11 UP BY.... 120%
Dwt 744 1,009 2,212 2,846 790 866 1,384 3,259 UP BY.... 135%~ As at the beginning of the month for historical data; for the next 4 weeks (vessels due) or this week (vessels spot) for current week's data.
Clarkson Research Services Page 3
Product Tanker Spot Earnings ($,000's/day) Product Tanker Highlights
18-Sep-09
5
10
15
20
25
30
35
40
45
50
55
60
65
70
Sep'07
Nov'07
Jan'08
Mar'08
May'08
Aug'08
Oct'08
Dec'08
Feb'09
Apr'09
Jun'09
Aug'09
DirtyClean - MRClean - Handy
• Clean Products A busy week of fixing in the MEG, and with a tightening tonnage list, rates correspondingly firmed. LR2 rates on the MEG-Japan route firmed to WS105 and LR1 rates on the same route firmed to WS122.5. Singapore-Japan rates for 30k CPP cargoes are assessed to have ended the week at WS90. Westbound UKC-USAC MR rates softened to WS90 this week on the back of weak demand. However, the sentiment within the CPP market remains downbeat. Overall, average clean MR earnings were $6,212/day, down 3% on the week. • Dirty Products Trans-Atlantic Westbound rates firmed to WS85 this week on the back of tight tonnage lists in the UKC and Med. Caribs-USAC rates firmed this week too. Overall, average dirty products earnings firmed this week to $8,784/day.

Large Bulk Carrier MarketBulkcarrier Spot Earnings ($,000's/Day)
Capesize Single $ Per Ton Average Earnings $ Per Day Capesize Market
Voyage....... Sep 11 Sep 18 2009 2008 2009 Sep 11 Sep 18 This Week ...Iron Ore Trades
16 165,000 Tubarao/Rotterdam 13.75 12.50 13.67 105,639 39,109 34,472 28,476 WEAKER -17.4%16 165,000 Tubarao/Japan 18m 26.80 22.90 25.25 137,961 54,267 53,890 42,174 WEAKER -21.7%16 165,000 Tub/Beilun.Baoshan 28.00 24.00 26.11 139,512 54,050 54,776 43,311 WEAKER -20.9%16 165,000 Dampier/Rotterdam 13.00 12.25 13.85 68,162 20,019 11,372 9,478 WEAKER -16.7%16 165,000 Dampier/Japan 18m 9.15 8.20 9.53 105,720 36,905 28,976 23,353 WEAKER -19.4%16 165,000 Dampier/Beilun.Bao. 10.00 9.00 10.46 98,800 35,852 29,090 23,789 WEAKER -18.2%16 165,000 Saldanha/Beilun.Bao. 19.00 14.25 16.98 95,219 36,035 38,049 22,510 WEAKER!! -40.8%
Coal Trades16 150,000 Bolivar/Rotterdam 15.00 13.30 14.42 104,891 40,591 38,653 31,294 WEAKER -19.0%16 150,000 Hay Pt./Rotterdam 18.25 16.75 17.55 61,906 18,330 14,183 11,139 WEAKER -21.5%16 150,000 R.Bay/Rotterdam 11.00 11.00 11.74 63,533 15,873 8,930 8,623 SOFTER -3.4%16 150,000 Indonesia/Rotterdam 13.50 12.20 12.89 56,850 16,808 13,781 10,241 WEAKER!! -25.7%16 150,000 Hay Pt./Japan 17m 12.00 10.00 11.51 92,802 32,118 29,240 20,200 WEAKER!! -30.9%16 Ave. Earnings, 1999/00-built 97,699 35,054 33,253 25,356 WEAKER -23.7%17 Ave. Earnings, 1990/91-built 83,264 30,622 29,793 23,223 WEAKER -22.1%
Panamax Single $ Per Ton Average Earnings $ Per Day Panamax Market
Voyage....... Sep 11 Sep 18 2009 2008 2009 Sep 11 Sep 18 This Week ...Coal Trades
18 70,000 H.Rds/ARA 16.70 15.35 13.35 53,367 18,506 23,959 20,512 WEAKER -14.4%18 70,000 USGulf/ARA 21.40 19.70 16.80 46,258 16,141 21,414 18,393 WEAKER -14.1%18 70,000 Bolivar/ARA 19.75 18.20 15.61 51,149 17,539 22,869 19,942 WEAKER -12.8%18 70,000 Newcastle/Cont 22.25 22.25 18.29 34,945 7,577 8,774 8,673 STEADY -1.2%18 70,000 Richards B./Rott 15.20 14.50 13.20 39,658 9,639 9,682 8,427 WEAKER -13.0%18 70,000 Roberts Bank/Japan 17.75 17.75 13.39 45,221 14,030 19,589 19,840 STEADY 1.3%18 70,000 Newcastle/Japan 17.75 17.75 13.19 98,800 13,406 19,191 19,442 STEADY 1.3%18 55,000 Roberts Bank/Rott 25.75 25.75 19.18 98,800 7,214 11,581 11,870 STEADY 2.5%18 70,000 Indonesia/Rotterdam 17.50 17.80 14.25 34,100 6,561 8,611 8,974 FIRM....... 4.2%
Grain Trade (Supramax)19 49,000 USGulf/Japan(HSS)* 57.00 61.00 46.66 56,840 23,949 30,057 33,347 FIRMER 10.9%18 Ave. Earnings, 1997/98-built 43,323 12,975 16,819 15,489 SOFTER -7.9%
19/20 Ave. Earnings, 1980's-built 39,673 11,219 14,720 13,412 WEAKER -8.9%
Clarkson Research Services Page 4 18-Sep-09
Bulkcarrier Highlights
2007
146,438124,412
145,91178,713
118,206112,208110,119
118,395
111,38094,884
2007
74,10477,18877,33493,598
51,52752,606
57,65339,73156,52543,52444,936
*This route replaces the Panamax grain routes, which are no longer reported and are not included in average earnings from start 2007 onwards."Average Earnings" are timecharter equivalents of spot freight rates, excluding waiting time off-hire etc., for standard routes/ships, for which see the "Sources & Methods" document on our website, "SIN 2005" (www.clarksons.net). Standard Ships are indicated by the figures on the left, e.g. Modern Capesize = Standard Ship no.13.
49,35045,828
43,00646,472
53,323
20
40
60
80
100
120
140
160
180
200
220
240
Sep'07
Nov'07
Jan'08
Mar'08
May'08
Aug'08
Oct'08
Dec'08
Feb'09
Apr'09
Jun'09
Aug'09
CapesizePanamaxHandymax
• Capesize: The week started slowly and activity did not pick up. Sentiment and rates have declined in both basins, and fresh enquiry is few and far between. Average earnings fell by 23.7% w-o-w to $25,356/day. • Panamax: The Atlantic softened early in the week, but bottomed quite quickly and now remains steady but boring. The Pacific had a nervous start as expected, but firmed again towards the end of the week and also seems quite well supported. There does not seem to be much upside but given the Cape tone, steady sounds good. Average earnings fell by 7.9% to $15,489/day. • Handymax: Very little activity in the Atlantic has led to spot rates stagnating this week. The Pacific has remained fairly steady, with short period rates firming marginally. Average trip earnings rose slightly w-o-w to $20,125/day.

Tripcharter Market, Freight Futures, & Bunkers
Panamax Average Earnings $ Per Day Panamax Market
Tripcharter...* 2007 2008 2009 Aug 21 Aug 28 Sep 04 Sep 11 Sep 18 This Week ....Cont/Far East 62,150 63,005 25,770 28,500 27,500 33,000 33,000 33,000 STEADY 0.0%TransPacific R/V 54,908 43,048 13,582 16,000 14,000 15,000 17,000 17,500 STEADY 2.9%Far East/Cont 51,782 35,673 7,674 10,750 9,750 9,500 9,500 9,250 STEADY -2.6%TransAtlantic R/V 58,894 53,779 19,312 18,500 17,500 24,000 24,000 23,000 SOFTER -4.2%Average Panamax Earnings 56,909 48,876 16,578 18,438 17,188 20,375 20,875 20,688 STEADY -0.9%Clarkson P'max Trip Index 575 494 167 186 174 206 211 209 STEADY -0.9%*Rates are for a Panamax vessel based on the Baltic standard BPI vessel.
Handymax Average Earnings $ Per Day Handymax Market
Tripcharter…* 2007 2008 2009 Aug 21 Aug 28 Sep 04 Sep 11 Sep 18 This Week ....Cont/Far East 49,430 51,075 24,717 29,000 30,750 31,000 33,000 35,000 FIRM....... 6.1%TransPacific R/V 44,675 35,904 11,286 13,750 13,500 14,000 14,000 15,250 FIRMER 8.9%Far East/Cont 44,563 31,317 6,722 7,500 7,500 7,500 7,000 7,500 FIRM....... 7.1%TransAtlantic R/V 51,660 46,214 17,649 20,000 21,000 21,000 22,500 22,750 STEADY 1.1%Average Earnings 52,000 dwt 47,582 41,113 15,041 17,563 18,188 18,375 19,125 20,125 FIRM....... 5.2%Average Earnings 45,000 dwt 42,583 36,245 13,110 15,625 16,188 16,375 16,813 17,375 FIRM....... 3.3%Clarkson Handymax Index 575 497 182 212 220 222 231 243 FIRM....... 5.2%* 52,000 dwt "Supramax" unless stated
Baltic Freight Indices Baltic Panamax Index Trends
19-Aug 2349 4342 1731 261420-Aug 2290 4162 1731 253421-Aug 2244 4030 1733 246824-Aug 2195 3965 1748 243725-Aug 2127 3869 1753 238826-Aug 2085 4026 1749 242727-Aug 2093 4002 1752 242528-Aug 2157 3946 1740 242101-Sep 2230 3894 1732 242302-Sep 2302 3820 1723 241303-Sep 2385 3747 1723 241404-Sep 2486 3651 1742 241507-Sep 2549 3595 1793 2429
08-Sep 2611 3598 1831 2462 FFA Indications at close …..…… 17-Sep09-Sep 2649 3607 1865 249110-Sep 2609 3592 1894 2492 Index Sept Q4 09 Cal 1011-Sep 2550 3539 1917 2468 BPI 1A TransAtlantic R/V, $/day 22,66314-Sep 2520 3494 1933 2450 BPI 2A Skaw-Gib/Far East, $/day 31,793 30,500 26,50015-Sep 2492 3415 1974 2431 BPI 3A TransPacific R/V, $/day 17,661 17,125 17,12516-Sep 2521 3296 2015 2415 BCI 7 Bolivar/Rott $/ton 13.36 12.38 12.00 11.7517-Sep 2555 3165 2048 2390 BCI 4 R.Bay/Rott $/ton 11.07 10.88 10.25 11.38
Max Value 2649 4342 2048 2614 Cape TC Average $/day 29,162 30,250 24,250 22,500Min Value 2085 3165 1723 2388 P'max TC Average $/day 20,486 20,125 17,875 15,825Avg Value 2381 3750 1816 2448 S'max TC Average $/day 21,411 19,750 16,725 13,750
Regional Bunker MDO 380cst
Markets ..... Avg. To date Sep Sep Avg, To date Sep Sep This Week ....2008 2009 11 18 2008 2009 11 18
Rotterdam 854 459 529 550 474 322 415 422 HIGHER 1.6%Genoa - - - - 499 341 441 433 LOWER -1.8%
Philadelphia 957 549 630 618 506 335 436 423 LOWER -3.1%Houston 936 490 565 565 499 329 421 422 HIGHER 0.1%Cristobal 1096 598 620 620 524 349 446 444 LOWER -0.4%
Los Angeles 955 524 638 638 527 344 450 433 LOWER -3.9%Japan 935 537 585 580 583 373 483 473 LOWER -2.1%
Singapore 909 490 577 572 508 340 441 444 HIGHER 0.8%Fujairah - - - - 512 340 443 446 HIGHER 0.7%
Bunkers are in $/t
Clarkson Research Services Page 5 18-Sep-09
Bunkers
(380cst)
BPI BCI BSI BDI
Basis Closing Mid Price
0
2,000
4,000
6,000
8,000
10,000
12,000
1 3 6 8 10 13 15 18 21 23 26 28 30 33 35 38 40 43 45 47 50Week No.
2006200720082009

Gas & Chemical Markets
2009 LPG Charter Rates, $'000/month
Market…. 2007 2008 Jul Aug 18 Sep Trends…Voyage Rates ($/mt) 44/46K mt Gulf/Jap* 37.07 41.91 23.95 24.88 28.00 FIRMER.. 13%T/C Equivalent, $/day 82,000m³ modern + 31,398 22,916 7,102 6,041 10,192 FIRMER.. 69% 78,000m³ modern 23,019 22,230 6,904 5,877 9,863 FIRMER.. 68%12 mths T/C, $/day 82,000m³ modern + 24,288 22,945 14,663 14,795 14,795 STEADY... 0% 78,000m³ modern 25,455 22,003 14,499 14,630 14,630 STEADY... 0% 59,000m³ modern" 32,207 29,858 19,463 19,315 19,233 STEADY... 0% 54,000m³# 26,395 22,613 12,329 12,493 12,493 STEADY... 0% 35,000m³ 30,677 28,347 18,839 18,083 20,055 FIRMER.. 11% 24,000m³ 28,483 27,314 17,721 15,017 16,932 FIRMER.. 13% 22,000m³ Semi-Ref + 29,836 30,004 24,099 23,754 23,343 STEADY... -2% 15,000m³ Semi-Ref 23,684 23,207 18,214 17,918 17,589 STEADY... -2% 8,250m³ Ethylene 20,885 21,143 17,984 17,754 17,425 STEADY... -2% 3,500m³ Pressure (East) 7,846 7,957 6,740 6,740 6,740 STEADY... 0% 3,200m³ Semi-Ref 10,489 10,088 8,055 8,055 7,891 STEADY... -2%* 44K mt for 78K vessel/46K mt for 82K vessel. + Annual data is for end-2007. " 57,000m³ till end 2007. #52,000m³ till end 2007.
Chemicals 2009 Chemical Freight Rates, $/mt
Markets…. 2007 2008 Jul Aug 18 Sep Trends…Voyage Rates ($/mt)10,000 Gulf/WCIndia 30.85 31.66 16.20 18.00 21.00 FIRMER.. 17%15,000* Gulf/MPFE 54.42 63.23 32.20 31.75 35.00 FIRMER.. 10%15,000* Gulf/Med 54.42 63.23 36.00 35.00 38.00 FIRMER.. 9%5,000 Rott/Houston 43.75 45.61 34.40 34.63 31.00 WEAKER. -10%10,000 Rott/Houston 38.18 40.40 25.00 27.38 25.00 WEAKER. -9%1,000 ~ Rott/MPFE 100.61 97.88 114.80 111.75 109.00 STEADY... -2%2,000 ~ Rott/MPFE 91.48 88.92 109.00 102.75 100.00 STEADY... -3%3,000 Rott/MPFE 88.45 83.99 104.00 97.00 95.00 STEADY... -2%5,000 Rott/MPFE 85.82 80.87 88.80 85.00 83.00 STEADY... -2%2,000 ~ Houston/Rott 67.88 66.95 58.00 58.00 57.00 STEADY... -2%3,000 Houston/Rott 62.74 61.89 53.60 54.00 53.00 STEADY... -2%5,000 Houston/Rott 53.85 54.73 47.40 48.00 45.00 SOFTER... -6%2,000 ~ Houston/MPFE 83.81 85.32 97.00 95.50 91.00 SOFTER... -5%5,000 Houston/MPFE 69.24 67.85 61.80 61.75 57.00 SOFTER... -8%10,000 Houston/MPFE 65.03 64.05 59.40 58.75 53.00 WEAKER. -10%Easychems except for: * Chemicals. ~ Stainless Steel. MPFE= Main Port Far East
Clarkson Research Services Page 6 18-Sep-09
LPG
Chem MarketAverage
Average LPG Market
25
35
45
55
65
75
85
95
105
Oct
-03
Apr
-04
Oct
-04
Apr
-05
Sep
-05
Mar
-06
Sep
-06
Mar
-07
Sep
-07
Mar
-08
Sep
-08
Mar
-09
Rott/Far E.
Houston/Far E.
basis 5,000mt
Easychem
0
200
400
600
800
1,000
1,200
1,400
1,600
1,800
Sep
-07
Nov
-07
Dec
-07
Jan-
08M
ar-0
8A
pr-0
8M
ay-0
8Ju
l-08
Aug
-08
Oct
-08
Nov
-08
Dec
-08
Feb-
09M
ar-0
9M
ay-0
9Ju
n-09
Jul-0
9S
ep-0
9
78,000m³,1 Yr t/c
78000m³ TCE, Gulf - Japan
• Saudi Aramco announced their nomination results for October this week, the majority of which were in line with contract holder requests. The hope that eastern spot market activity might have reacted favourably was un-fulfilled, although there were a number of nominations under contracts of af-freightment confirmed, which will see
some further reduction in October fleet length. • The Baltic Index again gained ground, adding another 0.157 cents to last week's close. This is a reflection of current bullish sentiment stimulated by reports of a significant number of spot AG cargoes for loading next month, to-gether with owners enjoying more in-
fluence now that the overhang of trader tonnage has been reduced. The picture continues to be more favourable in the West where vessel availability is much tighter, and significant premiums over eastern rates remain firmly in place.
• Once more, no particular change can be reported for the chemicals market. The best news that can be reported is that, during September, benchmark rates have steadied so far. • Admittedly, this may be somewhat damning with faint praise, but in comparison with nearly a year of decline, first rapid, then slow and
inexorable, it offers a slightly brighter note. • Owners will hope that this might be a prelude to a rates improvement. However, such a trend would require an upturn in new spot cargoes. One market which offers an object lesson in this is the Middle East, where after a long period of decline, Clarksons brokers
have marked rates up for the first time since last summer. Whilst it is far too early to declare that this represents anything like the start of a recovery, there does seem to be a little more volume moving. A slight increase in activity, then, but any good news must be seized upon in the current market conditions.

Liner & Offshore MarketsLiner Market Rates ($,000's/day) Liner Market News
Container / MPP / Average 2009 Liner Markets ....
Short Sea Markets 2005 2006 2007 2008 Jun Jul Aug Sep Trends…*Container Vessels ($/Day) Feedermax, 725 teu grd. 12,775 9,817 9,054 7,563 3,500 3,500 3,500 3,500 STEADY... -1% Handy, 1,000 teu grd. 17,700 12,350 12,500 10,346 4,000 4,000 4,000 4,000 STEADY... -1% Handy, 1,700 teu grd. 27,146 17,079 16,613 14,108 4,700 4,500 4,400 4,400 WEAKER... -9% Sub-P'max, 2,000 teu g'less 28,750 18,392 19,696 16,313 4,800 4,700 4,600 4,600 WEAKER... -8% Sub-P'max, 2,750 teu g'less 34,813 22,646 26,292 21,958 5,250 5,150 5,150 5,150 SOFTER... -6% Panamax, 3,500 teu g'less 38,427 26,583 29,958 26,125 5,750 5,700 5,700 5,700 SOFTER... -6%MPP Tonnage ($/Day) 17,000 dwt, grd. 1 yr. t/c (liner) 14,983 12,083 14,792 17,792 7,250 7,500 7,500 7,500 FIRM....... 6% 9,000 dwt, 1 yr. t/c (liner) 12,213 10,192 10,708 9,328 5,500 5,500 5,500 5,500 STEADY... European Short Sea 3,000dwt($/t) ECUK/ARAG - N.Spain 24.40 21.64 28.61 32.67 14.88 15.45 15.88 20.50 FIRMER... 29% French Bay - ECUK 12.64 13.03 16.07 18.05 11.38 12.00 12.50 14.75 FIRMER... 18% Lower Baltic - ARAG 18.33 15.97 22.53 28.80 14.13 14.40 14.19 19.00 FIRMER... 34% UK/ARAG - W.Med 34.00 32.19 37.00 44.85 24.63 24.60 25.06 30.00 FIRMER... 20% W.Med - UK/ARAG 25.77 25.86 29.69 37.08 23.44 21.90 24.63 20.50 WEAKER... -17%*3 mth trend for Container + MPP markets, Change since previous month for Short Sea. See www.hcshipping.co.uk for Short Sea market report
Offshore Vessel Average 2009 Offshore Market …
Market 2005 2006 2007 2008 Jun Jul Aug 18 Sep This Month AHTS 7-12,000 Bhp 15,927 40,706 34,122 24,066 23,180 17,575 10,000 11,374 FIRMER... 14% AHTS 12,000+ Bhp 25,072 55,935 51,559 51,533 41,127 23,486 20,577 15,759 WEAKER... -23% PSV < 3,000 Dwt 13,593 22,170 21,601 15,535 7,705 5,223 3,269 2,300 WEAKER!!... -30% PSV > 3,000 Dwt 17,168 26,119 26,074 19,855 9,506 5,642 4,240 4,566 FIRM....... 8%Note: Rates are based on the averages of reported fixtures in the North Sea in £/day, supplied by One Offshore UK Ltd.
Offshore Fleet No. Vessels, end
& Orderbook…. 2006 2007 2008 Aug-09
Fleet:*Anchor Handling Tug/Supply 1,963 2,078 2,186 2,278PSV/Supply 1,635 1,711 1,823 1,886Crew/Workboat 380 392 408 416Other Types 1,580 1,630 1,689 1,708All Offshore Vessels 5,558 5,811 6,106 6,289
Orderbook:Anchor Handling Tug/Supply 434 669 610 519 PSV/Supply 236 319 283 236 Crew/Workboat 20 33 29 21 Other Types 159 232 233 209 All Offshore Vessels 847 1248 1152 985 *Due to ongoing development of our offshore database, offshore fleet and o/b figures have not been updated this month. End-June figures will be corrected retrospectively.
Clarkson Research Services Page 7 18-Sep-09
4
8
12
16
20
24
28
32
36
Sep
-05
Dec
-05
Mar
-06
Jun-
06
Sep
-06
Dec
-06
Mar
-07
Jun-
07
Sep
-07
Dec
-07
Mar
-08
Jun-
08
Sep
-08
Dec
-08
Mar
-09
Jun-
09
1,700 teu FCC725 teu FCC1,000 teu FCC17,000 dwt MPP
AHTS Freight Rates
0
30
60
90
120
150
180
Sep
-05
Dec
-05
Mar
-06
Jun-
06
Sep
-06
Dec
-06
Mar
-07
Jun-
07
Sep
-07
Dec
-07
Mar
-08
Jun-
08
Sep
-08
Dec
-08
Mar
-09
Jun-
09
Sep
-09
AHTS >12,000Bhp
£,000/day
3-week moving average
• Latest box volume estimates from the ELAA show that the rate of y-o-y decline in box shipment on several key container trades may eventually appear to be slowing. Head-haul Asia-Europe box trade is estimated to have contracted by 17.1% y-o-y in July 2009, to total 997,715 TEU, after having contracted by almost 21.0% y-o-y in June. Box volumes on the back-haul leg proved steady y-o-y, totalling 490,214 TEU in comparison to the 489,991 TEU handled in July 2008.
• Meanwhile, Intra-European box trade also rebounded somewhat in July, with shipment from the Eastern Med. and Black Sea to Northern Europe growing by 17.6% y-o-y according to ELAA estimates. Economic sentiment within the EU-27 countries soared in August, with a leading indicator tracked by Eurostat hitting its highest point in eleven months. Whether consumer demand for box shipment will continue to match this trend remains to be seen.

Secondhand Prices
Oil Tanker End Year, $m Asset Play in Focus
Prices… 2005 2006 2007 3-Oct310,000 dwt d/h * Resale 140.0 140.0 155.0300,000 dwt d/h 5 yrs 117.0 118.0 135.0300,000 dwt d/h 10 yrs 90.0 96.0 110.0250,000 dwt s/h 15 yrs 37.0 39.0 59.0160,000 dwt d/h " Resale 87.0 94.0 102.0150,000 dwt d/h 5 yrs 75.0 82.0 92.0150,000 dwt d/h 10 yrs 65.0 71.0 74.0105,000 dwt d/h Resale 70.0 75.0 80.0105,000 dwt d/h # 5 yrs 63.0 66.5 70.095-97k dwt d/h 10 yrs 54.0 53.0 60.095-97k dwt d/h ^ 15 yrs New timeseries70,000 dwt d/h 5 yrs 48.0 56.0 60.565,000 dwt d/h 10 yrs 39.0 42.0 50.565,000 dwt s/h 20 yrs 8.5 11.0 12.047,000 dwt d/h ~ 5 yrs 47.0 47.5 52.045,000 dwt d/h 10 yrs 38.0 39.0 42.045,000 dwt d/h 15 yrs 23.0 27.0 28.045,000 dwt s/h 20 yrs 10.0 13.0 10.037,000 dwt d/h § 5 yrs 40.0 44.0 44.535,000 dwt d/h 10 yrs 21.0 31.0 36.05-y-o Tanker Index 233 248 26612 month Change 17% 6% 7%Before Mar-08: *300k dwt "150k dwt #95-97k dwt ^86k dwt s/h ~45k dwt §35k dwt
Bulkcarrier End Year, $m
Prices... 2005 2006 2007 3-Oct170,000 dwt 5 yrs 57.0 81.0 150.0150,000 dwt 10 yrs 38.0 62.0 105.0150,000 dwt 15 yrs 28.0 43.0 88.0150,000 dwt * 20 yrs 18.5 21.0 59.073,000 dwt 5 yrs 29.5 45.5 88.572,000 dwt 10 yrs 24.0 37.0 72.069,000 dwt 15 yrs 18.5 27.5 61.060,000 dwt 20 yrs 10.5 16.0 44.552,000 dwt 3 yrs 29.5 42.5 75.052,000 dwt 5 yrs 25.5 40.0 75.042-45,000 dwt 10 yrs 20.5 32.0 60.042-45,000 dwt 15 yrs 16.5 22.0 46.542-45,000 dwt 20 yrs 10.0 15.5 36.028-30,000 dwt 5 yrs 26.0 28.5 44.028-30,000 dwt 10 yrs 19.0 23.0 40.028-30,000 dwt 15 yrs 15.0 18.0 33.027,000 dwt 20 yrs 8.0 11.5 26.05-y-o Bulker Index 178 239 42312 month Change -4% 34% 77%Before Oct-05: *120-130k dwt
Container & End Year, $m
Ro-Ro Prices 2005 2006 2007 3-Oct3,500 teu 10 yrs 37.0 41.0 49.51,700 teu 10 yrs 24.5 24.5 26.5725 teu 10 yrs 12.5 13.0 14.010-y-o Container Index 115.7 120.8 136.8Ro-Ro 2,500 lm* 10 yrs 22.0 23.3 25.0Ro-Ro 1,250 lm* 10 yrs 13.5 14.5 15.5*Ro-Ro prices in euros, historical data converted using historical exchange rates
Clarkson End Year, $m
Index … 2005 2006 2007 3-OctALL VESSELS 156 179 226 216 SOFTER... -6%The 3 month trend is the average of the last three months over the previous three months. All bulk indices have been re-based to start 2000 = 100.0 0 0 0 0 0 0 0 0Clarkson Research Services Page 8 18-Sep-09
If you require a valuation or would like to discuss, please contact Clarkson Valuations
Limited.
If you require a valuation or would like to discuss, please contact Clarkson Valuations
Limited.
If you require a valuation or would like to discuss, please contact Clarkson Valuations
Limited.
Long Term Price Trends
50
100
150
200
250
300
350
400
450
500
550
Oct
'98
Oct
'99
Oct
'00
Oct
'01
Oct
'02
Oct
'03
Oct
'04
Oct
'05
Oct
'06
Oct
'07
Oct
'08
Bulkers
Tankers
Index, Start 2000 = 100
Short Term Tanker Trends
-10%
-5%
0%
5%
10%
15%
20%
25%
30%
35%
40%
Oct
'05
Jan
'06
Apr
'06
Jul '
06
Oct
'06
Jan
'07
Apr
'07
Jul '
07
Oct
'07
Jan
'08
Apr
'08
Jul '
08
Oct
'08
% Year on Year
5-year-old Tanker Price Index
Percentage ChangeYear-On-Year
Short Term Bulk Trends
-30%
-10%
10%
30%
50%
70%
90%
Oct
'05
Jan
'06
Apr
'06
Jul
'06
Oct
'06
Jan
'07
Apr
'07
Jul
'07
Oct
'07
Jan
'08
Apr
'08
Jul
'08
Oct
'08
% Year on Year
5-year-old Bulker Price Index
Percentage ChangeYear-On-Year

Sale & Purchase Market
Tanker Y-t-d Aug
Sales* .... 2008 2009 2009
Type: VLCC 22 17 1Suezmax 27 14 2Aframax 66 21 1Handy/Pmax 164 64 5
Total No. Sales 279 116 9Total DWT (,000) 23,095 11,286 824Total Value ($ m) 10,307 3,209 241Revised: Suezmax = 120-200k dwt, Aframax = 80-120k dwt
Bulker Y-t-d Aug
Sales* .... 2008 2009 2009
Type: Capesize 35 49 2Panamax 72 94 8Handymax 86 108 8Handysize 153 206 12
Total No. Sales 346 457 30Total DWT (,000) 19,510 26,189 1,623Total Value ($ m) 12,965 6,613 546
Other Y-t-d Aug
Sales .... 2008 2009 2009
Total No. Sales 641 329 31Total dwt (,000s) 7,085 3,225 364Total Value ($ m) 10,163 2,191 102
Total Y-t-d Aug
Sales ..... 2008 2009 2009
Buyers: Greece 167 113 5Norway 56 21 1Germany 10 3 1China P.R. 76 128 17UK 52 13South Korea 32 12
Total No. Sales 1,268 903 70Total Dwt (,000) 49,820 40,700 2,811Total Value ($m.) 33,543 12,014 889Average $/Dwt 673 295 316* Includes vessels over 10,000 dwt only. Sales of bulk vessels under 10,000 dwt and of non-bulk vessels are included in "Other Sales".
Clarkson Research Services i 18-Sep-09
ALL DATA AND INFORMATION IN THIS REPORT ARE AS REPORTED UP TO NOON ON THE DATE OF PUBLICATION
Sales Volumes & Values
0500
1,0001,5002,0002,5003,0003,5004,0004,5005,0005,5006,0006,5007,000
Sep
-04
Jan-
05M
ay-0
5S
ep-0
5Ja
n-06
May
-06
Sep
-06
Jan-
07M
ay-0
7S
ep-0
7Ja
n-08
May
-08
Sep
-08
Jan-
09M
ay-0
9
$m.
0
20
40
60
80
100
120
140
160
180
200
220No.
Volume
Value
Tankers:
Despite offers having been made and received on the “SANKO UNITY” (298,920 dwt, built 2000 Kawasaki H.I.), the vessel remains unsold. A number of parties inspected, and speculation continues as to the origin of those who are still interested in the ship. We are lead to believe the predominant party are Indonesian based with the view to place her on timecharter to Pertamina.
Following inspections in Cyprus around mid August, K Line have finally sold their LR2 the “RIVER SPRING” (99,999 dwt, built 1997, Namura Zosensho), to Sanmar Shipping of India for $22 million. This vessel is uncoiled and has been trading clean since she delivered.
It is interesting to note that even vessels coming for sale from Japan are taking some time to get sold. Historically, when Japanese controlled ships have come on to the market, given the sale process, they would find ‘new homes’ extremely quickly. We are now in a situation where given the uncertainty of the market, buyers’ valuations are significantly lower than the sellers’ and subsequently ships remain on the market for a longer period of time. Both the “SANKO UNITY” (298,920 dwt, built 2000 Kawasaki H.I.) and “SANKO QUALITY” (95,628 dwt, built 1993 Imabari S.B.), remain unsold and as mentioned above it took a month for K Line to sell the “RIVER SPRING” (99,999 dwt, built 1997 Namura Zosensho).
Dry Cargo:
As a result of the significant influx of tonnage coming onto the market in the last few weeks and a lack of purchasing activity this week, the imbalance between supply and demand in the market is becoming more obvious - particularly in the Supramax and Panamax sectors. Whilst there is still enquiry in the market, for the time being there is a strong sense that the majority of buyers want to wait and see which direction the market takes as we approach the fourth quarter.
There are just three sales to report this week, all of Handysize tonnage:
The “QUEEN ASIA” (28,450 dwt, built 1996 Imabari S.B. C4X30T) was sold to Vietnamese interests at close to $14 million, “ECO PROGRESS” (18,820 dwt, built 2003 Hakata Zosen C3X30T) was sold to Turkish buyers at $13.5 million. The older Handysize “SUMANA NAREE” (23,423 dwt, built 1984 Uwajima Zosen C4X25T) was sold to Indian buyers for $4.3 million.
Baltic Sale & Purchase Assessments (weekly)
(Based on max. 5-year old vessels, as published by the Baltic Exchange) As of the 14th September 2009. VLCC (305,000 DWT): $80.028m Aframax (105,000 DWT): $39.321m MR Product tanker (45,000 DWT): $27.017m Capesize (172,000 DWT): $57.198m Panamax (74,000 DWT): $34.694m Super Handy (52,000 DWT): $28.963m Note: H. Clarkson brokers did not contribute to the above Baltic Sale & Purchase Assessment rates.

Recent Ship Sales by Vessel Type
Vessel Type Vessel name Dwt/Unit Blt. Yard Date Price $m. BuyersTanker D/Sides New Ambition 88,761 1987 Koyo Dock K.K. 18-Sep 5.3 Clients of Sea MaritimeTanker D/Hull River Spring 99,999 1997 Namura Zosensho 18-Sep uncoiled 22 Clients of Sanmar Shg.Tanker D/Hull El Phos 68,790 1996 Namura Zosensho 11-Sep 12.5 Clients of Fal ShippingTanker S/Skin Orpheus Orchid 258,080 1992 Mitsubishi H.I. 04-Sep 16 Clients of SinokorTanker D/Hull Meriom Wave 38,877 2004 Guangzhou S.Y. Int. 02-Sep 25 Clients of Ultragas GroupTanker D/Hull N/B RESALE HULL 2000 310,000 2009 Hyundai H.I. 02-Sep 98 Clients of NJ GoulandrisTanker S/Skin Sunrise V 264,164 1991 Mitsubishi H.I. 02-Sep For Conversion 18 Clients of ValeTankChem IMO III N/B RESALE HULL* 51,246 2009 STX Shipbuild. 11-Sep 33.5 Clients of UltagasTankChem IMO III N/B RESALE HULL* 51,246 2009 STX Shipbuild. 11-Sep 33.5 # Clients of UltragasTankChem IMO III Miss Marina 40,083 2007 SLS Shipbuilding 28-Aug 33 Clients of TeekayReefer 231,983 cu.ft Snowmass 5,538 1982 Fukuoka S.B. 15-Sep 0.9 Undisclosed interests
Pass./Car 800 pass. Viking 340 1997 Fincantieri 10-Sep circa 7.5 Clients of Hellenic SeawaysOffshore Support N/B Const. Freire* 2010 Const. Freire 17-Sep 68.61 Clients of GC RieberOffshore Support N/B Const. Freire* 2011 Const. Freire 17-Sep 68.61 # Clients of GC RieberOffshore PSV Sical Torino 3,600 2006 Aker Brattvaag 14-Sep 24.78 Clients of Farstad ShippingOffshore Support. Aquanos Enabler 4,250 2010 STX Brevik 02-Sep undisclosed Clients of TidewaterMini Bulk 2x25t cr. Royal Pisces 4,152 1992 Sedef Gemi End. 11-Sep 2.2 Undisclosed interestsGas C'rier 3,523 cu.m Nautica Segamat 4,421 1991 Usuki Zosensho 15-Sep 4.1 Clients of Lucky MarineDry MPP 2x22t cr. Sky L. 17,199 1979 I.H.I. 15-Sep 1.6 Undisclosed interestsDry MPP 428 teu. Safmarine Lisbon 12,680 1984 Neptun Rostock 11-Sep 2.5 Undisclosed interestsDry MPP 642 teu. Unitec 17,400 1982 Kv. Warnowwerft 02-Sep undisclosed Undisclosed interestsDry MPP 192 teu. Thor Harmon 3,511 1991 Volharding 21-Aug At Auction 2.5 Singaporean interestsDry Genl 2x30t cr. Milestone 7,758 1994 Nishi S.B. Co. 18-Sep 5.5 Philippine interestsDry Genl 1x40t dr. Pioner Litvy 6,070 1977 Vyborg SY 15-Sep undisclosed Undisclosed interestsDry Genl 1x20t dr. Tian Yu 6,269 1981 Kochi Jyuko Co. 10-Sep 1 Undisclosed interetstDry Genl 2x30t cr. Capital Queen 8,689 1995 Shin Kurushima 03-Sep 5.75 Korean interestsDry Genl 2x30t cr. Sentosa 8,663 1996 Shin Kurushima 02-Sep 6 Thai interestsDry Genl 1x15t dr. Chohkoh 3,610 1982 Sanyo Zosen 02-Sep 0.86 Far Eastern interestsDry Genl 2x30t cr. White Melati 7,963 2000 Unknown Yard 02-Sep 8 Asian interests
Container 2,680 teu. Patmos II* 45,696 1992 Bremer Vulkan 25-Aug 6 Clients of Grand China Logistics
Container 2,680 teu. Palermo Senator* 45,696 1992 Bremer Vulkan 25-Aug # Clients of Grand China Logistics
Container 703 teu. Rio Bogota 7,850 1994 Orskovs Staal. 25-Aug 2.5 Clients of Military SealiftContainer 366 teu. Heike* 4,834 1998 Kroeger Werft 21-Aug undisclosed Italian interestsContainer 2,680 teu. Pacific 45,696 1992 H.D.W. 21-Aug undisclosed Chinese interestsContainer 366 teu. Ute S. 4,814 1999 Kroeger Werft 21-Aug undisclosed Netherlands interestsContainer 1,560 teu. OOCL Ability 24,336 1997 Imabari S.B. 21-Aug 6.5 Clients of Victoria Ocean Way
Bulk 4x25t cr. Sumana Naree 23,423 1984 Uwajima Zosen 18-Sep 4.3 Indian interstsBulk Str. Hvy. Eco Progress 18,820 2003 Hakata Zosen 15-Sep 13.5 Turkish interestsBulk 4x30t cr. Queen Asia 28,450 1996 Imabari S.B. 15-Sep region 14 Vietnamese interestsBulk 4x30.5t cr. N/B RESALE HULL 1764 56,000 2009 Mitsui SB 11-Sep excess 36 Clients of Ikaros Shpg.Bulk 4x25r cr. Thor Jasmine 36,663 1985 Daewoo SB 11-Sep 5.5 Far Eastern interestsBulk 4x25t cr. Urana Naree 33,006 1983 Minami Nippon 11-Sep low 4 Far Eastern interestsBulk 4x30.5t cr. N/B RESALE HULL 1782 56,000 2009 Mitsui SB 10-Sep excess Clients of A.E. NomikosBulk 4x25t cr. Xanadu 40,891 1984 Mitsui SB 10-Sep excess 7 Chinese interestsBulk 4x25t cr. Kanok Naree 33,024 1985 Mitsubishi H.I. 10-Sep 4.95 Egyptian interestsBulk Str. Hvy. Aeolian Spirit 73,739 1999 Sumitomo H.I. 04-Sep excess 28 Undisclosed interestsBulk 4x25t cr. Vancouver Victory 64,310 1981 Hitachi Zosen 02-Sep 5.2 Chinese interestsBulk 4x25t cr. Thamisa Naree 34,072 1982 Mitsubishi H.I. 02-Sep 4 Undisclosed interestsBulk 4x16t cr. Bled 35,000 1983 A.E.S.A. 02-Sep 4.5 Greek interestsBulk 4x30t cr. K. Silver 43,775 1996 Daewoo SB 02-Sep DD Due Oct 16.5 Chinese interestsBulk 4x25t cr. Island Triangle 28,005 1984 Hitachi Zosen 01-Sep SS/DD Due 4.35 Chinese interestsBulk Str. Hvy. Ballangen* 41,399 1987 Hyundai H.I. 28-Aug 8.25 European interestsBulk Str. Hvy. Bauta* 41,399 1987 Hyundai H.I. 28-Aug 9.25 # European interestsBulk 4x30t cr. Anna-Johanna 58,500 2009 Tsuneishi Cebu 28-Aug 35.5 Undisclosed interestsBulk 4x30t cr. Norden 56,062 2005 Mitsui SB 28-Aug 31.5 Clients of IDCBulk Str. Hvy. Golden Joy 70,044 1994 Jiangnan S.Y. 28-Aug Surveys Due 16.5 Chinese interestsBulk 3x30t cr. Yakumo 15,502 2001 Kurinoura Dock 27-Aug 10.75 Vietnamese interestsBulk Str. Hvy. Fortune Ocean* 76,801 2006 Sasebo H.I. 21-Aug 36.5 Clients of FIGBulk Str. Hvy. Fortune Princess* 76,635 2007 Sasebo H.I. 21-Aug 38.5 # Clients of FIGBulk 4x25t cr. Yare 37,568 1985 Shin Kurushima 21-Aug 5.85 Greek interestsBulk 5x25t cr. Guler S 27,832 1977 Hayashikane 21-Aug 2.3 Chinese interestsBulk Str. Hvy. Theresa Hebei 76,423 2004 Tsuneishi Zosen 21-Aug 35 Turkish interestsBulk Str. Hvy. Brilliant Arc 177,643 2002 Mitsui SB 21-Aug circa 53.5 Chinese interests
* En bloc Sales. #En Bloc price shown under first ship of bloc
Clarkson Research Services ii 18-Sep-09

Bulk Fleet Changes
Bulk Fleet Oil Tanker Fleet Bulk Carrier Fleet Combo Fleet
Changes... 2008 2009 to date 2008 2009 to date 2008 2009 to date
(No. Vessels ,000dwt) No. Dwt No. Dwt No. Dwt No. Dwt No. Dwt No. Dwt
Fleet 1st January 4,582 385,590 4,922 406,708 6,670 390,676 6,976 417,795 84 8,080 81 7,847
Changes: Deliveries 504 35,304 424 36,242 333 23,434 290 23,180Sold For Scrap 71 3,989 73 4,719 93 5,017 183 7,542 3 233 8 628Losses 3 110 2 99Misc. Additions 13 757 37 1,437 90 9,417 85 8,937 1 76Misc. Removals 106 10,954 77 8,154 21 606 32 982 2 130
Net Change During Year 340 21,118 311 24,806 306 27,119 158 23,494 -3 -233 -9 -681
Fleet End Yr/ Yr to Date 4,922 406,708 5,233 431,514 6,976 417,795 7,134 441,288 81 7,847 72 7,166 Vessels over 10,000 dwt only are included in the analysis in this table. Great Lakes Only vessels are excluded.
Deliveries & Other Additions..Type Date Vessel Name Flag Year Dwt Owner Shipyard & Yard No. Contracted
Built PriceBulk Sep'09 Nikolaos LI. 2009 76,000 Dynacom Tankers Mngt Jiangnan ChangxingProducts Sep'09 Gulf Coral BS. 2009 74,999 Gulf Energy Maritime Hyundai Mipo 2072 $m 53.75GCargo Sep'09 Modulus 2 RS. 2009 4,500 Albros Denizcilik Gelibolu Shipyd 36L.P.G. Sep'09 Hiyoshi Maru No. 17 JA. 2009 1,140 Hiyoshi Kaiun Kegoya Dock 1127Bulk Sep'09 Ilia LI. 2009 58,000 White Sea Navigation Dayang S.B. DY3004 $m 36.00Bulk Sep'09 Tabor MA. 2009 58,000 Setaf-Saget Dayang S.B. DY3002 $m 36.00L.P.G. Sep'09 Joan H.K. 2009 3,996 Wah Kwong Shpg. Yamanishi Zosen 1078L.P.G. Sep'09 Helane H.K. 2009 5,360 Wah Kwong Shpg. Shitanoe Zosen 7055L.P.G. Sep'09 Tilos GR. 2009 25,710 Eletson Corp. Hyundai Mipo 8013 $m 61.95Ethy/LPG Sep'09 Gaschem Atlantic LI. 2009 9,525 Hartmann Schiff. Severnav S.A.L.P.G. Sep'09 Yuyo Spirits PA. 2009 49,999 Yuyo S.S. Mitsubishi H.I. 2240Chem & Oil Sep'09 Ozkan A M.I. 2009 7,718 Bromarine Denizcilik Hidrodinamik 29Chem & Oil Sep'09 Trefin Unity MA. 2009 5,700 Trefintankers Dortler Shipyard 05Bulk Sep'09 Andreas K CY. 2009 91,800 Safe Bulkers Inc. Sungdong S.B. S1039Tanker Sep'09 Yasa Polaris M.I. 2009 158,000 Yasa Shpg. Industry Samsung H.I. 1764 $m 83.00Bulk Sep'09 Lake Triview SG. 2009 32,400 Orient Marine Co. Kanda S.B. Co. 499
Bulk Sep'09 Rock Express 1 BH. 1978 41,378 Unknown Owner Misc.Add.Prev.Demo.PCC Sep'09 KY Frigg KO. 1989 3,559 Unknown Korean Misc.Add.Prev.Excld.L.P.G. Sep'09 Izumi Maru No. 17 JA. 2005 1,199 Kotoku Kisen Misc.Add.Prev.Excld.PCC Sep'09 Ariake Maru No. 18 JA. 1992 2,162 Shunzan Kaiun K.K. Misc.Add.Prev.Excld.PCC Sep'09 Tosei Maru JA. 1992 2,550 Fujitrans Corp. Misc.Add.Prev.Excld.MPP Sep'09 Bao Ying PA. 1983 23,300 Shantou Tongcheng Misc.Add.Prev.Loss.
Scrapping & Other Removals..Type Date Vessel Name Flag Year Dwt Owner Breakers Ldt Price
Built $/ldt $m.Reefer Sep'09 Ice Bell SV. 1976 11,093 Ost-West-Handel India 320.0Container Sep'09 OOCL Fair H.K. 1987 40,560 OOCL P.R.C. 14,731 280.0 4.12Bulk Sep'09 Frank Zhejiang M.I. 1986 65,330 Zhejiang Fuchzien Bangladesh 17,320Lumber Sep'09 Santiago RS. 1978 14,150 Alfamarine Shipping IndiaBulk Sep'09 Tenora MA. 1977 21,743 Priamos Maritime Bangladesh 5,876Bulk Sep'09 Svyatoy Pavel GG. 1976 30,696 Fedcomshipping India 7,812Chem & Oil Sep'09 Anawan BS. 1981 35,597 B + H Equimar Sing. Bangladesh 9,973 393.0 3.92Bulk Sep'09 Canopus MA. 1976 34,320 Leros Management P.R.C. 7,668Container Sep'09 Sea-Land Achiever AM. 1984 58,869 Maersk Line P.R.C.Container Sep'09 Sea-Land Quality AM. 1985 58,869 Maersk Line P.R.C.Container Sep'09 Sea-Land Atlantic AM. 1985 58,869 Maersk Line P.R.C.Container Sep'09 Sea-Land Motivator AM. 1984 46,987 Maersk Line P.R.C.Container Sep'09 Sea-Land Florida AM. 1984 58,869 Maersk Line P.R.C.Container Sep'09 YM Glory SG. 1980 31,208 Yang Ming P.R.C. 13,784Container Sep'09 Sea-Land Pride AM. 1985 46,987 Maersk Line P.R.C.Container Sep'09 Sea-Land Commitment AM. 1985 58,869 Maersk Line P.R.C.
GCargo Sep'09 Asian Forest H.K. 2007 14,434 P&F Marine LossGC Liner Sep'09 Asian Mars PA. 1992 6,831 Shenzhen Daxi Marine LossBulk Sep'09 Black Rose MG. 1977 37,657 Pacmar Shipping LossL.P.G. Sep'09 Cap Akritas GR. 1968 3,137 Paros Cia. Nav. Misc.RemBulk Aug'09 Chang Ying PA. 1976 61,375 Da Tong Shipping S.A LossAsp.& Bit. Aug'09 Xin An Hai PRC 1986 6,528 Unknown Owner Misc.Rem
Clarkson Research Services iii 18-Sep-09

Timecharter Fixture Record
Latest Tanker Timecharter Fixtures...Reported Charterer Vessel Name D / Year Dwt Spd Cons. Period Rate Delivery
C Built $ per Day Date Place11-Sep Emarat Petroleum High Consensus D 2005 45,800 15.1 12 Mths/12 Mths $ 12,250 / 1325001-Sep Essar Desh Shakti D 2004 115,000 2 Yrs $ 24,00031-Aug Statoil Sparto C 2004 115,000 15 2 Yrs $ 18,40027-Aug PDV Bareilly D 2005 105,000 14.8 3 Yrs $ 18,60027-Aug PDV Kanpur D 2005 106,054 14.8 3 Yrs $ 18,60027-Aug PDV Angelica Schulte D 2005 106,433 15.7 48 3 Yrs $ 18,60026-Aug China Oil Scf Sayan D 2002 159,417 15.5 67 5 Years $ 26,00018-Aug Pertamina Atlantic Hero D 1992 96,687 14.3 38.5 5-7 Yrs $ 15,25018-Aug Trafigura Desh Viraat D 2008 319,000 15.9 96.8 6+3+3 Mths $ 34/35/36,000 Central Mediterranean
18-Aug Trafigura Desh Vishaal D 2009 318,000 6+3+3 Mths $ 34/35/36,000 Sep 0918-Aug ST Shipping Horizon Thetis D 2009 50,000 14.9 35 12 Mths $ 10,50018-Aug Trafigura Usma D 2007 51,800 14 34.9 6 Mths $ 12,500 Central Med.18-Aug ST Shipping Horizon Athena D 2008 47,000 14.9 35 12 Mths $ 10,50011-Aug Trafigura Usma C 2007 51,000 6+6 Mths $ 12,50011-Aug Barcap Torm Louise C 2009 53,000 Yrs $13/14/15,00005-Aug Barcap Lu San D 2009 318,000 6-12 Mths $36,00003-Aug IOC Northern Jewel D 1993 298,033 15.5 92 2 Years $ 34,000 Aug 0931-Jul Bluelight Dubai Titan D 1993 299,999 14.9 6 Mths $ 24,000 - $ 25,000 Aug 09 Arabian Gulf28-Jul Clearlake Shpg Front Vanguard D 1998 300,058 15.5 90-150 Days $ 33,000 Aug 09 Us Gulf23-Jul Cosco C. Dream D 2000 298,522 15.5 84 3 Yrs $ 36,20013-Jul ST Shipping Ravnanger D 2000 46,271 14.5 2 Yrs $8/$13,00013-Jul ST Shipping Risanger D 2000 46,270 14.5 2 Yrs $8/$13,00003-Jul Reliance Formosapetro Challenger D 2001 281,395 15 79.9 3 Yrs $ 35,00001-Jul Koch Eagle Valencia D 2005 308,000 18 Mths/ 6 Mths $ 37,00024-Jun OSG Mare Tirrenum D 2004 110,000 14.9 6 Mths $ 17,00024-Jun Saras Valfoglia D 2009 110,000 14.5 3 Yrs $ 20,00024-Jun PTT Poul Spirit D 1995 98,600 14.6 6 Mths/6 Mths $ 15,000 / $ 16,000
24-Jun Petrobras Arctic D 2007 162,400 15.4 3 Yrs P/S $23,000/$30,000
Latest Dry Bulk Timecharter Fixtures...Reported Charterer Vessel Name Year Dwt Spd Cons. Period Rate Delivery
Built $ per Day Date Place17-Sep European charterer CMB Coralie 2009 53,000 2 Years $15,500 01Oct Far East17-Sep K2 Namrun 2007 55,500 3-5 Months $16,600 24Sep-29Sep South China17-Sep North China Shipping Maroudio 2003 56,020 3-5 Months $17,700 Prompt Kandla17-Sep Bunge Bahia 2004 76,801 3-5 Months $18,300 24Sep-30Sep Jintang17-Sep European chrtr Tai Prosperity 2006 77,747 2 Years $18,000 01Oct-01Nov Far East17-Sep Bunge Nord Destiny 2008 83,684 4-7 Months $27,750 23Sep-25Sep Valencia16-Sep Aquavita Nord Destiny 2008 83,684 11-13 Months $23,000 23Sep-24Sep Valencia15-Sep Bunge Amazon 2001 74,910 3-5 Months $18,500 14Sep-16Sep Kagoshima15-Sep Swiss Marine Nyon 1999 73,035 16-19 Months $17,500 18Sep-25Sep Mundra15-Sep WBC Jiu Hua Hai 2008 53,393 4-6 Months $23,000 Prompt Wc Mexico15-Sep Norden Bulk Saturn 2003 52,408 5-7 Months $18,000 Prompt Kohsichang15-Sep CNR Taxiarhis P. 1985 39,013 4-6 Months $16,000 Prompt Port Said14-Sep Cargill Genco Maximus 2009 170,000 4-6 Months $31,750 19Sep-21Sep Sundong14-Sep Bunge Goldmar 1984 39,697 3-5 Months $15,000 18Sep-20Sep Otranto14-Sep Great Pacific Inc Mineral Antwerpen 2003 172,316 6-8 Months $32,000 15Oct Far East14-Sep Cargill Bison 2005 76,773 11-13 Months $18,500 25Sep-05Oct Taiwan14-Sep Swiss Marine Teh May 2004 175,000 4-6 Months $35,000 01Sep-05Sep China10-Sep Vitol Angelic Peace 2001 74,764 4-6 Months $20,000 25Sep Singapore09-Sep Cargill Afovos 2001 74,350 4-6 Months $20,000 22Sep-23Sep Hong Kong09-Sep Vitol Garv Prem 2006 74,444 4-6 Months $19,000 15Sep-25Sep Qingdao09-Sep Cargill Achilles 2004 76,878 4-6 Months $20,250 19Sep-20Sep Qingdao08-Sep TMT Mineral Kyushu 2006 180,211 4-6 Months $35,000 15Sep-20Sep Nantong08-Sep Oldendorff Lissa Topic 2003 52,038 3-5 Months $17,000 15Sep Japan08-Sep CNR Fortune Rainbow 2008 82,372 3-5 Months $22,500 05Sep-10Sep Krishnapatnam07-Sep Rizzo Bottiglieri Prem Veena 2007 82,792 4-6 Months $20,250 06Sep-09Sep Jintang07-Sep Daiichi Aigaion 2004 171,480 33-34 Months $33,000 25Sep-05Oct China04-Sep Vitol Ikan Bilis 2004 75,729 4-6 Months $18,000 05Sep-07Sep Qingdao
Clarkson Research Services iv 18-Sep-09

The Timecharter Market Tanker Timecharter Market 1 Year T/C... Average Rate $/day To Date Sep T/C Activity & The Freight Market
2006 2007 2008 2009 18 VLCC (early 2000s)310,000 Dwt Modern 58,308 55,548 73,413 42,526 32,000150,000 Dwt Modern 43,173 44,452 47,192 32,684 24,000110,000 Dwt Modern 33,154 33,144 35,793 20,947 18,00074,000 Dwt Modern 31,144 29,317 29,221 20,645 17,00047-48,000 Dwt Modern 27,067 25,904 23,481 16,316 13,00037,000 Dwt Modern 24,731 23,269 21,952 14,947 11,000285,000 Dwt Early '90s* 68,519 37,743 28,000145,000 Dwt Early '90s* 42,260 29,079 21,50097,000 Dwt Early '90s* 32,692 19,342 14,000
3 Year T/C... Average Rate $/day To Date Sep2006 2007 2008 2009 18
310,000 Dwt Modern 47,279 48,385 58,644 39,579 33,000150,000 Dwt Modern 38,087 38,577 40,923 30,671 25,000110,000 Dwt Modern 28,635 29,625 30,500 21,349 19,00074,000 Dwt Modern 27,096 26,913 26,486 20,895 18,50047-48,000 Dwt Modern 22,279 23,288 22,322 16,822 14,50037,000 Dwt Modern 20,712 21,317 20,385 15,039 12,000
T/C Activity… To Date
...over 1 year 2005 2006 2007 2008 2009
VLCC 200,000 + 14 29 22 14 20Suezmax 120-200,000 19 22 16 28 8Aframax 80-120,000 39 40 34 53 30Panamax 60-80,000 10 16 11 9 7Handy 10-60,000 60 70 68 54 20Total No. Fixtures 142 177 151 158 85
Total in m. dwt 14.1 20.2 16.3 17.2 11.8Modern is taken to mean no more than 10 years old. * All tanker timecharter rates are now for Double Hulls. Data from start 2008 are available at www.clarksons.net
Bulk Carrier Timecharter Market 1 Year T/C... Average Rate $/day To Date Sep T/C Activity & The Freight Market
2006 2007 2008 2009 18 Capesize (Modern)Capesize Modern 45,246 106,918 111,529 32,372 28,000Panamax Modern 22,155 52,317 55,637 16,750 19,250Supramax Modern 21,881 45,702 45,510 13,612 16,000Handymax Modern 19,432 39,870 38,673 11,829 14,250Handysize Modern 14,710 28,120 29,486 9,954 11,750Capesize "CSBC" 37,624 90,327 89,582 26,215 24,000Capesize * 1980s 20,529 45,135Panamax 1980s 15,236 40,926 44,697 9,528 11,750
3 Year T/C... Average Rate $/day To Date Sep2006 2007 2008 2009 18
Capesize Modern 36,365 75,808 82,260 27,421 29,750Panamax Modern 17,736 39,774 44,356 14,895 15,750Supramax Modern 16,772 33,750 33,788 13,083 14,500Handysize Modern 12,520 21,863 21,837 10,300 11,250Capesize "CSBC" 29,413 63,077 70,053 21,211 25,000Panamax 1980s 10,101 28,168 28,837 6,868 6,500
T/C Activity… To Date
...over 1 year 2005 2006 2007 2008 2009
Capesize 100,000 + 57 111 144 91 44Panamax 60-100,000 98 183 282 188 81Handymax 40-60,000 22 74 110 66 52Handysize 10-40,000 8 9 8 8 2Total No. Fixtures 185 377 544 353 179Total in m. dwt 18.2 36.1 51.4 33.5 16.3Tanker and bulk carrier T/C activity size ranges reflect existing CRSL ship type definitions.
Modern is taken to mean no more than 10 years old. *Route no longer reported due to lack of liquidity.
Clarkson Research Services Page 9 18-Sep-09
Total Fixtures
Total Fixtures
0
1
2
3
4
5
6
7
8
Aug
-07
Oct
-07
Dec
-07
Feb-
08
Apr
-08
Jun-
08
Aug
-08
Oct
-08
Dec
-08
Feb-
09
Apr
-09
Jun-
09
Aug
-09
0
25
50
75
100
125
150
175
200
1 Year t/cSpot $/day
No. fixtures $,000/da
0
5
10
15
20
25
30
Aug
-07
Oct
-07
Dec
-07
Feb-
08
Apr
-08
Jun-
08
Aug
-08
Oct
-08
Dec
-08
Feb-
09
Apr
-09
Jun-
09
Aug
-09
0
40
80
120
160
200
240
1 Year t/c
Spot $/day
No. fixtures $,000/day
• Bulk carrier timecharter activity this week… There were seventeen new bulkcarrier fixtures reported this week. Four of the Panamax fixtures and one the Handymax fixtures were for duration one year or over. The 2006 built, 77,747 dwt ‘Tai Prosperity’ was taken for two years at a rate of $18,000/day.
• Tanker timecharter activity this week… A quiet week in terms of tanker timechartering saw only one fixture reported. Emarat Petroleum have taken the 2005 built, 45,800 dwt ‘High Consensus’ for 12 months at a rate of $12,350/day with an option for a further 12 at $13,250/day.

The Shipbuilding Market What's Been Ordered...
S Date Dwt/Unit Delivery Builder Price Owner/Manager*5 Sep-09 150,000 2013 Atlantico Sul Transpetro5 Shuttle Sep-09 150,000 Atlantico Sul Transpetro5 Shuttle Sep-09 150,000 Atlantico Sul Transpetro5 Shuttle Sep-09 107,000 Atlantico Sul Transpetro5 Sep-09 107,000 Atlantico Sul Transpetro5 Sep-09 107,000 Atlantico Sul Transpetro5 Sep-09 107,000 Atlantico Sul Transpetro5 Sep-09 50 Austal Ships Unknown Trinidad5 Sep-09 50 Austal Ships Unknown Trinidad5 Sep-09 50 Austal Ships Unknown Trinidad5 Fast PassCat Sep-09 50 Austal Ships Unknown Trinidad5 Bulk Sep-09 35,000 Shanghai S.Y. $m 26.0 Acemex5 Bulk Sep-09 35,000 Shanghai S.Y. $m 26.0 Acemex5 Bulk Sep-09 35,000 Shanghai S.Y. $m 26.0 Acemex5 Bulk Sep-09 35,000 Shanghai S.Y. $m 26.0 Acemex5 Bulk Sep-09 35,000 Shanghai S.Y. $m 26.0 Acemex5 Bulk Sep-09 35,000 Shanghai S.Y. $m 26.0 Acemex5 Bulk Sep-09 35,000 Shanghai S.Y. $m 26.0 Acemex5 Bulk Sep-09 35,000 Shanghai S.Y. $m 26.0 Acemex5 Bulk Sep-09 35,000 Shanghai S.Y. $m 26.0 Acemex5 Bulk Sep-09 35,000 Shanghai S.Y. $m 26.0 Acemex5 Bulk Aug-09 180,000 Sungdong S.B. $m 58.0 Vale5 Bulk Aug-09 180,000 Sungdong S.B. $m 58.0 Vale
S=Status, where: 5=confirmed order, 16=unconfirmed order, 17=option. Other units are: teu for containerships, cbm for gas vessels, numbers of cars or passengers.* The Primary Reference Company, as used in the Clarkson Fleet Database i.e. the company with the main commercial responsibility for the ship.
Year End, $m. Three Month Shipbuilding News
2006 2007 2008 Sep Trend ...TankersVLCC 320,000 dwt 129.0 146.0 150.0 110.0 WEAK…. -11.7%Suezmax 157,000 dwt 80.5 90.0 91.0 67.0 WEAKER!! -6.2%Aframax 115,000 dwt 65.5 72.5 75.0 50.5 WEAK…. -18.4%'MR' Tanker 51,000 dwt 47.0 52.5 47.5 37.0 WEAK…. -14.3%Bulk CarriersCapesize 180,000 dwt 68.0 97.0 88.0 59.0 WEAK…. -13.1%Panamax 76,000 dwt 40.0 55.0 46.5 33.0 WEAKER! -7.0%Handymax 57,000 dwt 36.5 48.0 42.0 30.0 WEAK…. -10.4%Handysize 35,000 dwt 29.5 38.0 32.5 25.0 WEAKER!! -7.8%Gas VesselsLPG 82,000m³ 92.0 93.0 92.0 76.0 WEAKER... -4.9%LNG 160,000m³ 222.0 237.0 245.0 219.0 WEAKER... -2.4%Dry CargoContainer 3,500 teu 51.0 53.0 60.0 37.0 WEAKER!! -9.7%Container 1,100 teu 22.0 27.5 25.0 19.0 SAME.......Clarkson Index 168 184 177 142 WEAKER!! -5.5%
Newbuilding Vessels Contracted Year-on-Year Newbuilding Price Index
2006 2007 2008 2009Oil Tankers 577 326 263 36 WEAKER!! -81%Chemical & Spec. Tankers 632 702 190 15 WEAKER!! -89%Combined Carriers 3 6LPG Carriers 92 74 58 WEAKER!! -100%LNG Carriers 36 25 5 WEAKER!! -100%Bulk Carriers 698 1934 1095 97 WEAKER! -88%Containerships 463 545 208 5 WEAKER!! -97%General Cargo vessels 362 387 282 25 WEAKER!! -88%Ro-Ro Vessels 87 137 87 1 WEAKER!! -98%Refrigerated Vessels 4 9 8 WEAKER!! -100%Offshore Vessels 622 660 251 32 WEAKER!! -82%FPSO/FSU 6 9 2 2 FIRMER... 40%Passenger & Cruise Ships 42 55 29 11 WEAKER!! -47%Other Misc. Vessels 299 239 54 4 WEAKER!! -90%TOTAL CONTRACTING 3,923 5,108 2,532 228 WEAKER!! -87%
Clarkson Research Services Page 10 18-Sep-09
Type
Trend ...
Shuttle
Note: Newbuilding prices vary as to country of build, delivery and ship specification. Prices here are end year/latest and from Jun-08 assume a "European spec", 20/20/20/20/20% payments and "first class competitive yards" quotations. The 3-month trend is the change of the last 3 months over the previous 3 months.
Activity ....
201320132013201320142014
Nov 2010Nov 2010Dec 2010Dec 2010
2011201120112012201220122012201220122013
Prices .... Newbuilding
Nov 2011Mar 2012
ShuttleShuttle
Fast PassCatFast PassCatFast PassCatShuttle
100
110
120
130
140
150
160
170
180
190
200
Jul '
99
Jul '
00
Jul '
01
Jul '
02
Jul '
03
Jul '
04
Jul '
05
Jul '
06
Jul '
07
Jul '
08
Jul '
09
Ten year trend innewbuilding prices
Index, Jan'88 = 100
• The newbuilding market is now starting to establish some consistency of value across a number of sectors, and with increased buying interest continuing to probe the shipyards, the question remains as to when the market will establish a firm bottom in terms of price. • The majority of enquiries have been targeted at the dry sector and as a result there is greater transparency of pricing in this sector, as yards have been offering and concluding with buyers at revised levels. Tanker sector values, although still representing an aggressive downward shift, remain marred by a lack of overall enquiry and are arguably still sitting at a slightly inflated premium in lieu of this factor. • With an extremely heavy forward orderbook still to contend with, buying sentiment remains that values will have to come off further to induce new transactions.

The Demolition Market What's Been Scrapped...
Type Date Vessel Name Flag Blt Dwt Ldt Owner Buyer $/ldt $ m.
Reefer Sep '09 Ice Bell SV. 1976 11,093 Ost-West-Handel India 320.0Container Sep '09 OOCL Fair H.K. 1987 40,560 14,731 OOCL P.R.C. 280.0 4.12Bulk Sep '09 Frank Zhejiang M.I. 1986 65,330 17,320 Zhejiang Fuchzien Private termsLumber Sep '09 Santiago RS. 1978 14,150 Alfamarine Shipping IndiaBulk Sep '09 Tenora MA. 1977 21,743 5,876 Priamos Maritime Private termsBulk Sep '09 Svyatoy Pavel GG. 1976 30,696 7,812 Fedcomshipping IndiaChem & Oil Sep '09 Anawan BS. 1981 35,597 9,973 B + H Equimar Sing. Bangladesh 393.0 3.92Bulk Sep '09 Canopus MA. 1976 34,320 7,668 Leros Management Old saleContainer Sep '09 Sea-Land Achiever AM. 1984 58,869 Maersk Line Old saleContainer Sep '09 Sea-Land Quality AM. 1985 58,869 Maersk Line Old saleContainer Sep '09 Sea-Land Atlantic AM. 1985 58,869 Maersk Line Old saleContainer Sep '09 Sea-Land Motivator AM. 1984 46,987 Maersk Line Old saleContainer Sep '09 Sea-Land Florida AM. 1984 58,869 Maersk Line Old saleContainer Sep '09 YM Glory SG. 1980 31,208 13,784 Yang Ming Old saleContainer Sep '09 Sea-Land Pride AM. 1985 46,987 Maersk Line Old saleContainer Sep '09 Sea-Land Commitment AM. 1985 58,869 Maersk Line Old saleBulk Sep '09 Atlantic Pride LI. 1978 64,900 18,986 European Navigation Old saleBulk Sep '09 Navitec H.K. 1978 33,790 7,432 Adani Shipping Old saleReefer Sep '09 Alcazar Carrier BS. 1979 15,200 10,431 Network Shipping Ltd India 320.0 3.34Reefer Sep '09 Frio Caribic PA. 1983 6,352 3,404 Laskaridis Shpg India 310.0 1.06Reefer Sep '09 Frio Oceanic PA. 1983 6,371 3,385 Laskaridis Shpg India 310.0 1.05GC Liner Sep '09 Xiang Rui Men PA. 1977 21,530 6,740 NASCO Pakistan 315.0 2.12MPP Sep '09 Thor Master TH. 1982 16,461 6,688 Thoresen Thai Agen. India
Scrap Year End ($/ldt) This Year Scrapping Price Trends
Prices... 2006 2007 2008 Latest %Tankers 410 510 285 320 12%Dry Cargo 390 470 270 300 11%
Buyer Year (m dwt) This Year
Activity... 2006 2007 2008 2009 %China 0.3 0.2 1.2 2.1 147%India 1.0 1.4 3.4 6.9 174%Bangladesh 4.7 2.5 7.1 7.2 38%Pakistan 0.2 0.6 0.6 2.4 452%Other 0.3 0.5 0.3 1.7 578%TOTAL 6.5 5.2 12.7 20.3 119%
Size & Year (m dwt) This Year
Type... 2006 2007 2008 2009 % Demolition Market News and Gossip
TankersVLCC - 0.8 1.8 216%Suezmax - 0.3 0.5 120%Aframax 0.9 0.9 1.1 0.7 -13%Handy 2.0 2.4 1.9 1.8 27%< 10,000 dwt 0.1 0.2 0.1 0.0 -70%Total Tankers 3.1 3.5 4.2 4.8 54%BulkcarriersCapesize 0.3 - 1.9 1.3 -10%Panamax 0.5 0.1 1.1 1.9 133%Handymax 0.1 0.1 0.4 0.7 147%Handysize 0.9 0.2 1.6 3.7 211%Total Bulkers 1.8 0.4 5.1 7.5 104%Combos 0.3 0.2 0.6 268%Gas Vessels 0.1 0.5 0.6 0.7 50%Other Dry 1.1 0.8 2.6 6.7 259%TOTAL 6.5 5.2 12.7 20.3 119%* The % change is based on annualised figures for this year against last year.
Clarkson Research Services Page 11 18-Sep-09
Note: The scrap prices ($/ldt) are based on Indian prices for VLCC tankers and a Handy dry bulk carrier of around 8,000 ldt.
150200250300350400450500550600650700750800
Sep'07
Nov'07
Jan'08
Mar'08
May'08
Jul'08
Sep'08
Nov'08
Jan'09
Mar'09
May'09
Jul'09
Sep'09
US$ per ldt
Tankers - IndiaTankers - B.DeshHandy Bulk - B.Desh
• Given the large number of VLCC deals concluded into Bangladesh over the last three weeks or so, it is unsurprising that this week has been somewhat quieter in terms of demolition activity. As yards bid heavily to secure the bonanza that the large tankers represents for the successful Bangladeshi yards, something of a differential emerged between prices for dry vessels and wet tonnage. It should now be expected that this differential will be eroded somewhat without the aggressive market competition which supported it. • Owners will doubtless want to resist the correction in prices. Steel resale prices on the subcontinent have offered them some succour, but there is no guarantee that these prices will continue to hold up. The demolition market has proven its propensity for renegotiations time and again. As a result, owners must judge carefully to what extent they wish to push hard for firm priced deals, which then might prove unsupportable on delivery.
Economic IndicatorsGDP Growth & Forecasts*
Germ U.K. USA Japan Euro Area World2005 0.8% 1.8% 3.1% 1.9% 1.5% 4.8%2006 2.9% 2.8% 2.9% 2.2% 2.8% 5.4%2007 2.4% 3.1% 1.9% 2.0% 2.5% 5.2%4Q08 -1.7% -1.9% -0.8% -4.6% -1.2%1Q09 -6.9% -4.9% -2.5% -8.8% -4.9%2Q09 -5.9% -5.5% -3.9% -6.4% -4.7%
2009 (f) -5.9% -4.2% -2.6% -6.4% -4.4% -1.4%2010 (f) 0.8% 1.0% 2.0% 1.1% 0.6% 2.5%
Industrial Production*: OECDavg: Germ U.K. USA Japan Europe OECD2006 5.2% -0.2% 4.2% 4.6% 2.5% 3.4%2007 5.5% 0.5% 2.0% 2.7% 2.4% 2.3%2008 0.1% -2.4% -1.5% -3.2% -2.2% -2.1%
Jul '09 -16.9% -9.3% -13.1% -22.7% -15.9% -16.0%Aug '09 -10.7%
Industrial Production*: Asiaavg: R.o K. China Taiwan Thailand Malay. India2006 9.4% 16.4% 5.0% 7.3% 4.8% 9.9%2007 8.2% 17.6% 7.3% 7.8% 1.9% 9.8%2008 3.3% 13.0% -1.5% 5.8% 0.0% 3.9%
Jun '09 -1.2% 10.7% -11.4% -7.8% -9.6% 7.8%Jul '09 0.7% 10.8% -8.1% -7.3% -8.4% 7.0%Aug '09 12.3%
Ind. Production*: E.Europe & S. Americaavg: Russia Czech. Hung. Poland Arge. Brazil2006 4.2% 10.0% 10.7% 12.4% 7.4% 3.0%2007 6.6% 8.5% 8.4% 9.6% 5.4% 5.9%2008 2.6% -0.7% -0.6% 3.9% 4.1% 2.8%
Jun '09 -12.1% -12.2% -18.6% -4.3% -2.7% -10.9%Jul '09 -10.8% -18.2% -19.4% -4.6% -9.0% -9.9%Aug '09 -12.6%
Currency Trends Spot ~ & Forward# ... Exchange Rate Trendsend: Euro U.K. Japan Switz. N'way China2006 1.32 1.96 119.05 1.22 6.27 7.812007 1.46 1.99 114.15 1.14 5.47 7.302008 1.41 1.47 90.67 1.07 7.19 6.84Jun 1.40 1.63 96.73 1.08 6.39 6.83Jul 1.41 1.64 94.57 1.08 6.36 6.83Aug 1.43 1.65 94.72 1.07 6.05 6.83
18-Sep 1.47 1.65 91.15 1.03 5.84 6.833mo.# 1.47 1.65 91.09
12mo.# 1.47 1.65 90.62
end: R.o K. H.Kong Sing. SDR India Australia2006 909.09 7.77 1.54 1.50 44.50 1.272007 940.60 7.80 1.45 1.57 39.42 1.142008 1,299.55 7.75 1.45 1.54 48.46 1.47Jun 1,264.55 7.75 1.45 1.54 47.90 1.24Jul 1,259.91 7.75 1.45 1.55 48.43 1.24Aug 1,238.84 7.75 1.44 1.56 48.35 1.20
18-Sep 1,205.15 7.75 1.41 1.59 48.16 1.14*% change year-on-year. Source: IMF, OECD, The Economist. ~Currency units per US$ except £, Euro and SDR. #Forward Rates: The FT.
Interest Rate Trends ... Inflation & Prices … Prices in $/bbl or $/tPrime Lending Rates: Consumer Prices Crude Grain Steel
$ Libor Oil Wheat Ship Plateavg: 6 mths. avg: Brent USG Japan2006 3.5% 6.0% 3.2% 1.5% 8.0% 5.3% 2006 2.3% 3.2% 0.5% 2.6% 56.35 169 7002007 4.0% 6.5% 4.1% 1.8% 8.1% 5.2% 2007 2.6% 2.9% 0.1% 2.4% 62.41 216 6002008 3.8% 5.6% 3.5% 1.9% 5.1% 3.0% 2008 3.9% 3.9% 1.4% 3.7% 98.67 343 1,118Jun 1.0% 1.5% 0.5% 1.5% 3.3% 1.2% Jun 0.9% -1.4% -1.8% -0.1% 66.14 265 650Jul 1.0% 1.5% 0.5% 1.5% 3.3% 1.0% Jul 0.5% -2.1% -2.2% -0.6% 64.81 232 602Aug 1.0% 1.5% 0.5% 1.5% 3.3% 0.8% Aug -1.5% 72.42 218 598
18-Sep 1.0% 1.5% 0.5% 1.5% 3.3% 0.7% Latest 68.56 201 600
Clarkson Research Services Page 12 18-Sep-09
#Forward Rates as of: 18-Sep
Eur USA Japan OECDU.S.A.Euro U.K. Switz. Japan
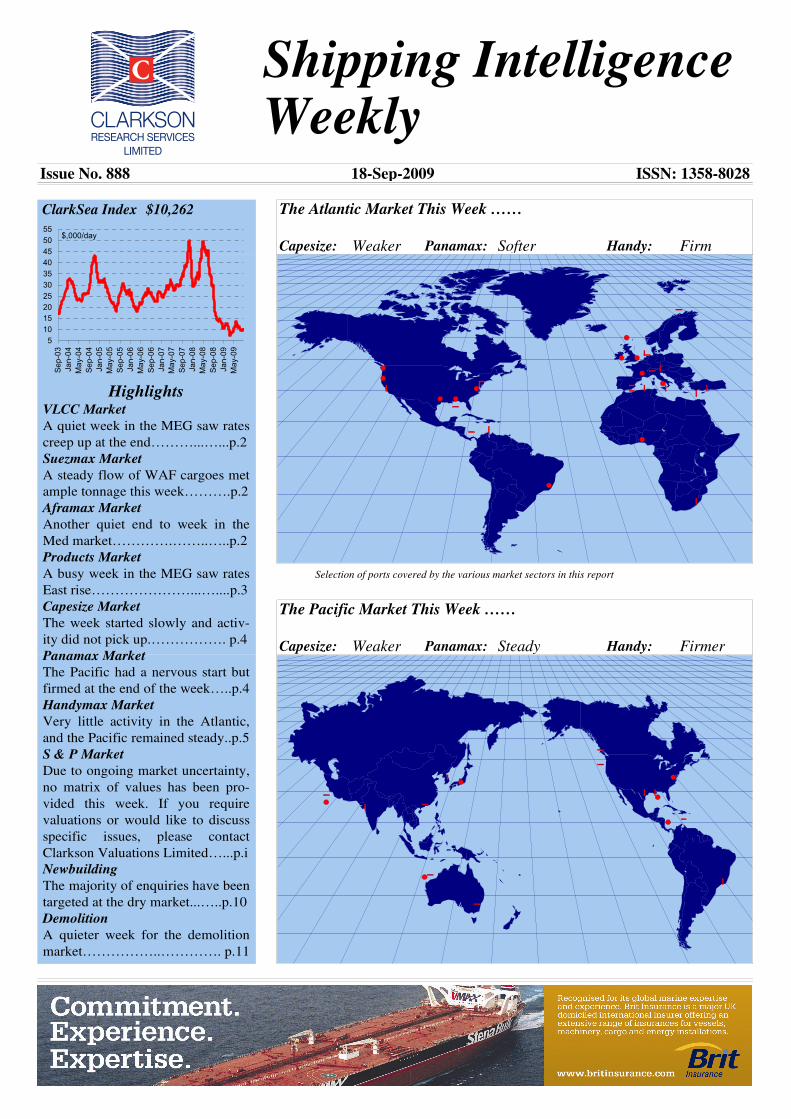
Industrial ProductionJun '09 -18.0% -11.0% -13.6% -23.5% -15.6% -16.2%
• Aided by rising petrol prices, US consumer prices rose by 0.4% in August, but remained down by 1.5% compared to the same month last year. An increase in consumer car sales, fuelled by government cash incentives, also influenced a 2.7% increase in retail sales in August. The increase in car sales in turn prompted stronger output from the car industry, which helped industrial production to increase by 0.8% in the month. • The governor of the Bank of England announced this week that the UK economy is growing again, even though some inflation measures, such as the Consumer Prices Index, fell in August (by 0.2% m-o-m). However, the decline in the Retail Prices Index slowed to -1.3% from -1.4% in August. The announcement came after the European Commission forecast on the 14th September that the UK economy would grow by 0.2% between July and September this year.
-26
-22
-18
-14
-10
-6
-2
2
6
10
14
Jan
'93
Jan
'94
Jan
'95
Jan
'96
Jan
'97
Jan
'98
Jan
'99
Jan
'00
Jan
'01
Jan
'02
Jan
'03
Jan
'04
Jan
'05
Jan
'06
Jan
'07
Jan
'08
Jan
'09
% change
Atlantic
Pacific
80
90
100
110
120
130
140
150
160
170
Oct
'07
Nov
'07
Jan
'08
Feb
'08
Mar
'08
May
'08
Jun
'08
Aug
'08
Sep
'08
Oct
'08
Dec
'08
Jan
'09
Feb
'09
Apr
'09
May
'09
Jul '
09A
ug '0
9S
ep '0
9
$/Sterling$/Yen$/Euro
Index Jan'00=100

Ship Demand Trends
Oil Tanker in million barrels per day % Chg
Demand .... 2006 2007 2008 2009 2009/08
Oil Production World 83.1 83.1 83.9 82.2 -2.1% N. America 7.8 7.8 7.6 8.1 5.9% W. Europe 4.3 4.1 3.9 3.7 -5.6% FSU 9.4 9.6 9.5 9.6 0.2% OPEC Crude Oil 29.7 30.5 31.5 28.2 -10.5%
NGL's/Cond. 5.0 4.9 5.0 5.2 3.0%
VLCC Demand Middle-East Output* 22.2 22.8 23.1 20.8 -10.3% Less: Red Sea export 0.3 0.3 0.3 0.3 0.0%
E.Med export 0.8 0.9 1.0 1.0 2.1%Refinery T'put 6.2 6.3 6.4 6.4 0.0%
Gulf Crude Exports 14.9 15.3 15.5 13.0 -15.6%
Crude Oil Trade Imports: USA 10.2 10.0 9.8 7.0 -28.2%
Eur-4 6.8 6.4 6.7 3.7 -44.0%Japan 4.2 4.1 4.2 2.0 -51.7%
Total Imports 21.2 20.5 20.6 12.8 -38.0%
Products Trade Imports: USA 3.6 3.4 3.1 2.2 -28.5%
Eur-4 2.3 2.0 2.1 1.4 -34.8%Japan 0.6 0.6 0.5 0.3 -51.2%
Total Imports 6.5 6.1 5.8 3.9 -32.9%
Dry Bulk in million tonnes % Chg
Demand .... 2006 2007 2008 2009 2009/08
Steel Production Japan 116.2 120.2 118.7 76.1 -35.9% S.Korea 48.5 51.2 53.5 46.5 -13.1% P.R. China 421.5 487.3 497.9 556.7 11.8% EU-12 152.9 156.6 148.1 90.0 -39.2% Total Steel Prod. 739.1 815.2 818.2 769.3 -6.0%
Iron Ore Trade Imports: Japan 134.3 139.0 140.4 97.5 -30.6%
S.Korea 43.9 46.2 49.5 40.2 -18.8%China 326.3 383.7 442.5 571.2 29.1%
Total Imports: 504.5 568.8 632.5 708.9 12.1% Exports: Australia 241.9 568.8 309.5 325.4 5.2%
Coal Trade Imports: Japan 177.0 186.1 190.5 153.4 -19.5%
S.Korea 75.1 83.4 98.2 94.6 -3.6%EU-25* 201.9 211.1 205.4 161.5 -21.3%
Total Imports: 454.1 480.6 494.0 409.5 -17.1% Exports: Australia 238.6 250.4 262.1 258.0 -1.5%
USA 25.6 36.5 51.8 37.5 -27.6%Canada 26.1 29.2 30.9 23.9 -22.7%South Africa 68.1 66.8 62.0 59.0 -4.8%
Total Exports: 358.5 382.9 406.8 378.4 -7.0%
Grain Trade Exports: USA (ex soya) 86.5 96.9 90.4 73.6 -18.5%
Canada 22.5 22.4 20.9 24.2 15.5%Australia 20.6 9.6 14.4 22.9 59.2%Arg. (ex soya) 20.4 26.9 26.5 16.2 -38.8%EU-25* 18.7 16.3 27.2 25.7 -5.4%
Total Exports 168.7 172.2 179.4 162.7 -9.3% 2009 data are annualised figures, seasonally adjusted from latest year-to-date figures. *EU 25 to 2006, then EU27.
0 0 0 0 0 0 0 0 Clarkson Research Services Page 13 18-Sep-09
World Total includes NGL's; *Mid-E output is sum of OPEC and non-OPEC crude production. Oil production data sourced from IEA. 2009 data are latest year-to-date figures.
Major Oil Trades News: • October Nymex light sweet crude futures settled at $72.47/bbl, up $0.53 on the week. Optimism continues to grow for a global economic recovery, and the resultant ef-fect this will have on oil demand. Indeed, inventory data for the US indicated a larger than expected drawdown in crude stocks by some 4.7m bbl in the week ending the 11th Sep-tember. However, US product inventories rose with gaso-line up 0.5m bbl and distillates up by 2.2m bbl.
Major Dry Bulk Trades News: • Mining giant BHP Billiton has announced that it will begin its 2010 iron ore contract price talks with Asian steel mills next month, even though 2009 prices are yet to be settled. However, BHP reportedly wishes for shorter-term contract prices, unlike the year long pricing agreements currently negotiated. If this becomes reality, BHP has agreed to sell 30% of its ore under the shorter-term prices. • The recovery in Canadian coking coal exports (excluding those to the US) continued in July, fuelled by recovering demand from Asia. Exports increased by 13.0% m-o-m and 7.0% y-o-y to stand at 2.2mt for the month.
OPEC Production & VL Earnings
26
27
28
29
30
31
32
33
34
Aug
-05
Dec
-05
Apr
-06
Aug
-06
Dec
-06
Apr
-07
Aug
-07
Dec
-07
Apr
-08
Aug
-08
Dec
-08
Apr
-09
Aug
-09
m. bpd
0
25
50
75
100
125
150
175
200$,000/day
OPEC Oil ProductionVLCC Earnings
Steel Production & Cape Earnings
100
110
120
130
140
150
160
170
180
Jul-0
5
Nov
-05
Mar
-06
Jul-0
6
Nov
-06
Mar
-07
Jul-0
7
Nov
-07
Mar
-08
Jul-0
8
Nov
-08
Mar
-09
Jul-0
9
Index
0
20
40
60
80
100
120
140
160
180$,000/daySteel ProductionIndexCapesize Earnings

World Fleets & Orderbooks
Total Cargo Year End Orderbook & Delivery Schedule
Fleet ..m. Dwt 2005 2006 2007 2008 No. m.Dwt No. m.Dwt % Fleet 2009 2010 2011+
OIL TANKERS >10k dwt 320.3 337.5 355.8 372.6 3,768 395.5 936 127.1 32.1% 21.4 46.7 59.1OIL TANKERS <10k dwt 10.6 10.9 11.1 11.4 4,790 11.4 101 0.6 5.0% 0.4 0.2 0.0CHEMICAL TANKERS 26.6 29.7 33.7 38.7 3,333 41.2 785 15.6 37.9% 5.2 6.1 4.3OTHER TANKERS 3.5 3.5 3.6 3.5 636 3.4 44 0.4 11.7% 0.1 0.2 0.1BULKERS 344.9 368.2 392.3 418.6 7,131 440.7 3,288 287.2 65.2% 43.2 109.8 134.1COMBOS 9.4 8.9 8.2 7.9 72 7.2 9 2.8 39.7% 0.0 1.6 1.3LPG CARRIERS 12.7 13.3 13.9 14.2 1,139 14.2 145 2.1 14.7% 0.7 0.8 0.6LNG CARRIERS 12.8 14.9 17.5 22.2 327 24.9 55 4.6 18.4% 1.9 1.8 0.9CONTAINERSHIPS 111.5 128.1 144.2 160.9 4,801 167.3 962 61.2 36.6% 12.2 21.4 27.6MULTI-PURPOSE 23.9 24.5 25.4 26.2 2,907 25.7 611 7.9 30.6% 2.5 3.4 1.9GENERAL CARGO 35.8 35.9 36.5 36.5 14,223 36.1 220 1.5 4.1% 0.66 0.48 0.36RO-RO 10.2 10.4 10.5 10.5 3,390 10.5 103 1.3 12.1% 0.2 0.4 0.7CAR CARRIERS 7.4 8.1 8.9 10.0 668 10.0 171 2.8 28.3% 0.7 1.1 1.1REEFERS 7.3 7.3 7.2 7.0 1,835 7.0 17 0.2 3.3% 0.06 0.06 0.11OFFSHORE (AHTS/PSV) 4.2 4.5 4.9 5.4 4,164 5.7 755 1.9 34.0% 0.94 0.68 0.33OTHER CARGO 8.1 8.1 8.1 8.1 1,402 8.1 42 0.6 6.8% 0.14 0.30 0.11WORLD CARGO FLEET 949.2 1,013.8 1,081.7 1,153.8 54,586 1,208.9 8,244 517.8 42.8% 90.3 194.9 232.7
]
Tanker Year End Orderbook & Delivery Schedule Fleet ..m. Dwt 2005 2006 2007 2008 No. m.Dwt No. m.Dwt % Fleet 2009 2010 2011+
VLCC 200,000+ 137.8 142.4 148.2 153.4 542 162.0 208 64.6 39.9% 7.3 21.9 35.3Suezmax 120-200,000 49.2 52.8 55.0 55.5 380 58.0 148 23.1 39.8% 5.6 7.2 10.4Aframax 80-120,000 67.7 71.4 76.5 80.9 836 87.4 175 19.3 22.0% 3.5 9.2 6.5Panamax 60-80,000 18.7 21.3 23.9 26.1 393 27.9 88 6.4 23.0% 1.5 1.9 3.0Small 10-60,000 70.1 75.6 81.8 90.6 3,087 96.6 839 27.8 28.8% 7.6 12.2 8.0
23.0 25.9 29.5 33.8 1,470 36.4 522 14.0 38.5% 4.2 5.7 4.1<10,000 17.5 17.9 18.6 19.5 7,289 20.0 408 2.6 13.1% 1.5 0.8 0.3
TOTAL FLEET >10,000 343.4 363.5 385.4 406.5 5,238 431.8 1,458 141.1 32.7% 25.5 52.4 63.2of which: Single Hull 99.3 93.3 84.3 67.3 845 61.3
Double Hull 244.1 270.2 301.0 336.4 4,393 370.6Combos in Oil 5.5 4.0 1.2 2.6 37 3.6 Increase in size of Tanker Fleet:
Laid-up 0.4 1.0 0.8 0.6 20 2.2 2008/2007 5.5%Storage 2.8 1.5 1.1 0.6 13 2.7 2009*/2008 6.2% * year to date
ACTIVE FLT. >10,000 345.8 365.1 384.7 407.9 5,242 430.6
Bulk Carrier Year End Orderbook & Delivery Schedule Fleet ..m. Dwt 2005 2006 2007 2008 No. m.Dwt No. m.Dwt % Fleet 2009 2010 2011+
Capesize 100,000+ 110.8 121.0 131.3 143.6 896 158.2 799 149.7 94.6% 20.3 57.7 71.7Panamax 60-100,000 93.7 101.7 108.2 114.7 1,601 118.6 733 59.7 50.3% 5.7 22.5 31.4Handymax 40-60,000 66.9 71.7 77.1 83.3 1,801 88.2 896 50.4 57.1% 11.0 20.4 19.0Handysize 10-40,000 73.5 73.8 75.7 77.0 2,833 75.7 860 27.4 36.3% 6.2 9.2 12.0TOTAL FLEET 344.9 368.2 392.3 418.6 7,131 440.7 3,288 287.2 65.2% 43.2 109.8 134.1Combos in Dry 4.5 5.1 6.7 5.3 31 3.3 Increase in size of Bulkcarrier Fleet:
Laid-up 0.4 0.4 0.3 0.6 19 0.8 2008/2007 6.7%Storage 0.3 0.3 0.3 0.3 5 0.2 2009*/2008 5.3% * year to date
ACTIVE FLEET 348.7 372.6 398.4 423.0 7,138 443.0
LPG Carrier Year End Orderbook & Delivery Schedule Fleet ,000m³ 2005 2006 2007 2008 No. ,000m³ No. ,000m³ % Fleet 2009 2010 2011+
<5,000 cbm 1,285 1,321 1,370 1,396 628 1,422 42 141 9.9% 62 62 175-20,000 cbm 1,791 1,902 2,027 2,210 263 2,232 63 509 22.8% 151 196 16120-40,000 cbm 1,800 2,026 2,300 2,479 90 2,611 22 627 24.0% 181 274 17340-60,000 cbm 1,466 1,466 1,360 1,368 21 1,221 0 0 0.0% 0 0 0>60,000 cbm 8,054 8,548 8,904 10,582 137 10,933 18 1,460 13.4% 486 489 485TOTAL FLEET 14,395 15,263 15,960 18,034 1,139 18,419 145 2,737 14.9% 881 1,021 836TOTAL M. DWT 12.7 13.3 13.9 14.2 1,139 14.2 145 2.08 14.7% 0.69 0.79 0.61
Clarkson Research Studies Page 14
"Oil Tankers" covers vessels in the crude oil & oil products sectors, including tankers with IMO 3 grade specification. "Chemical" includes tankers with IMO 1&2 grade specification. "Specialised" covers IMO 1&2 chemical tankers and other tankers designed for the carriage of specialist liquids..
18-Sep-09
of which: Specialised >10,000
01-Sep-09
01-Sep-09
01-Sep-09
01-Sep-09

World Fleets & Orderbooks
LNG Carrier Year End Orderbook & Delivery Schedule Fleet ,000m³ 2005 2006 2007 2008 No. ,000m³ No. ,000m³ % Fleet 2009 2010 2011+
<40,000 cbm 262 262 252 197 14 206 6 64 31.0% 10 54 040-60,000 cbm 253 253 253 163 4 163 0 0 0.0% 0 0 060-100,000 cbm 1,071 1,145 1,220 1,295 17 1,295 0 0 0.0% 0 0 0>100,000 cbm 21,236 25,160 29,865 38,901 292 44,031 49 8,569 19.5% 3,479 3,317 1,773TOTAL FLEET 22,822 26,820 31,590 40,556 327 45,696 55 8,633 18.9% 3,489 3,371 1,773TOTAL M. DWT 12.8 14.9 17.5 22.2 327 24.9 55 4.6 18.4% 1.9 1.8 0.9
Containership Year End Orderbook & Delivery Schedule Fleet ,000 Teu 2005 2006 2007 2008 No. ,000teu No. ,000teu % Fleet 2009 2010 2011+100-999 teu 619.4 665.7 715.4 752.4 1,268 748.2 89 72.6 9.7% 47.1 21.8 3.81-1,999 teu 1,378.0 1,478.8 1,637.8 1,777.6 1,251 1,769.3 174 252.7 14.3% 117.7 78.9 56.12-2,999 teu 1,438.7 1,591.3 1,700.5 1,815.5 715 1,813.3 90 233.6 12.9% 69.6 107.6 56.43,000 &+ teu (Panamax) 2,284.8 2,544.7 2,938.4 3,339.5 870 3,530.7 198 826.7 23.4% 273.8 371.1 181.93-7,999 teu (Post-Pmax) 2,163.8 2,395.9 2,566.5 2,835.4 472 2,835.4 155 894.5 31.5% 153.2 259.0 482.28,000 &+ teu (Post-Pmax) 659.3 1,210.5 1,621.7 2,041.8 225 2,041.8 256 2,881.6 141.1% 326.6 957.0 1,598.0TOTAL FLEET 8,121.3 9,464.2 10,762.7 12,144.4 4,801 12,738.6 962 5,161.7 40.5% 988.0 1,795.4 2,378.3TOTAL M. DWT 111.5 128.1 144.2 160.9 4,801 167.3 962 61.2 36.6% 12.2 21.4 27.6
Multipurpose Year End Orderbook & Delivery Schedule Fleet ,000 Teu 2005 2006 2007 2008 No. ,000teu No. ,000teu % Fleet 2009 2010 2011+100 - 199 teu 97.3 100.3 104.2 109.3 735 112.0 87 12.8 11.4% 7.1 3.8 1.9200 - 349 teu 171.2 179.2 187.9 196.6 765 199.7 124 33.9 17.0% 17.5 13.2 3.3350 - 499 teu 184.1 189.6 195.0 196.1 478 192.0 54 20.8 10.8% 12.2 6.1 2.6500 - 749 teu 338.3 349.2 367.8 392.9 627 383.4 121 75.6 19.7% 37.0 20.3 18.4750 - 999 teu 112.1 118.4 129.6 137.7 153 135.2 109 97.6 72.2% 11.0 53.5 33.11000 &+ teu 186.2 189.1 190.5 191.8 149 192.0 116 184.6 96.2% 46.4 86.4 51.9TOTAL FLEET 1,089.2 1,125.8 1,175.0 1,224.3 2,907 1,214.4 611 425.4 35.0% 131.1 183.2 111.1MPP FLEET M. DWT 23.9 24.5 25.4 26.2 2,907 25.7 611 7.9 30.6% 2.5 3.4 1.9GC FLEET M. DWT 35.8 35.9 36.5 36.5 14,223 36.1 220 1.49 4.1% 0.66 0.48 0.36
Ro-Ro Vessel Year End Orderbook & Delivery Schedule Fleet, m. Dwt 2005 2006 2007 2008 No. m.Dwt No. m.Dwt % Fleet 2009 2010 2011+<2,000 dwt 0.7 0.7 0.7 0.7 2,397 0.7 0 0.0 0.0% 0.00 0.00 0.002,000-5,000 dwt 1.2 1.2 1.2 1.2 312 1.2 4 0.0 1.3% 0.01 0.00 0.005,000-7,500 dwt 1.5 1.6 1.6 1.6 248 1.6 24 0.1 9.2% 0.02 0.01 0.127,500-10,000 dwt 1.1 1.1 1.1 1.2 131 1.2 13 0.1 9.9% 0.04 0.05 0.0310-15,000 dwt 1.6 1.7 1.8 1.8 148 1.8 39 0.5 25.5% 0.06 0.18 0.2215,000&+ dwt 4.0 4.0 4.1 4.1 154 4.1 23 0.5 13.1% 0.06 0.15 0.33TOTAL FLEET 10.2 10.4 10.5 10.5 3,390 10.5 103 1.27 12.1% 0.20 0.39 0.69CAR CARRIERS 7.4 8.1 8.9 10.0 668 10.0 171 2.84 28.3% 0.70 1.05 1.08
Reefer Vessel Year End Orderbook & Delivery Schedule Fleet m. ft³. 2005 2006 2007 2008 No. m.ft³ No. m.ft³ % Fleet 2009 2010 2011+< 100,000 cu ft 22.2 21.9 21.8 21.5 947 21.4 0 0.0 0.0% 0.0 0.0 0.0100-199,999 cu ft 38.8 38.7 39.3 39.0 258 39.0 0 0.0 0.0% 0.0 0.0 0.0200-299,999 cu ft 51.4 50.6 50.6 49.3 196 48.9 0 0.0 0.0% 0.0 0.0 0.0300-449,999 cu ft 74.9 74.1 73.3 68.0 172 64.7 0 0.0 0.0% 0.0 0.0 0.0450-549,999 cu ft 94.7 94.2 93.7 89.4 173 85.7 1 0.5 0.6% 0.5 0.0 0.0> 550,000 cu ft 56.4 55.8 57.1 57.4 89 54.9 16 10.0 18.2% 2.5 3.0 4.6TOTAL FLEET 338.4 335.4 335.7 324.7 1,835 314.6 17 10.50 3.3% 2.96 2.99 4.55TOTAL M. DWT 7.3 7.3 7.2 7.0 1,835 7.0 17 0.23 3.3% 0.06 0.06 0.11
Clarkson Research Studies Page 15
01-Sep-09
01-Sep-09
01-Sep-09
01-Sep-09
01-Sep-09
18-Sep-09
A "Sources & Methods" document which describes the methodology by which Clarkson Research gathers and manipulates the data set out in thisreport, including the calculation of the time charter equivalent (TCE) earnings for tankers and bulk carriers, is available on our website atwww.clarksons.net. Further enquiries may be made to the addresses set out on the back page.
Note: All fleet figures are from the Clarkson Research Ship and Orderbook Databases, expressed in the units indicated. All dwt figures are metric.Annual data are as at year end, monthly data at the beginning of the month. The databases comprise vessels of 100gt and above.
Analysis
Miraculously the sting seems to have gone from the global recession. We may not be back to normal, but stock markets are booming, purchasing in-dices are turning up, banking bonuses have survived and even US house prices are recovering. The jury may be out on how long it lasts, but at least there is something to debate. How Supple is Supply? But for shipping companies good economic news is not enough. Their problem, the excessive orderbook, has still to be resolved. With half a billion deadweight of ships on order, it doesn't matter what happens, de-
mand will be buried in a torrent of supply. But for serious analysts the devil is in the detail. Supply, like de-mand, is a variable and the issue is how it will respond as the crisis bites. Markets are programmed to react to oversupply, and the central issue is how this mechanism will work in to-day's credit-crisis driven world. Supply Adjustment Model Three issues will determine the ad-justment. Firstly by how much is the orderbook too big? Secondly how much of the over-ordering will get built and thirdly how much of the old fleet will get scrapped? To quantify
the over-ordering issue our graph shows the order book as a percent of the tanker and bulker fleets. Until 2002 both sectors managed perfectly well with an order book of about 12% of the fleet. Tankers slumped to 6% in 1996, triggering a boom and bulkers to 7% in 1992 and 1999. In comparison with today’s tanker order-book of 32% of the fleet and bulkers 65%, these are tiny numbers. So a lot needs to go. How Much Built? Re-jigging the orderbook is now the hottest topic in town. The shipyards got
through the first year of the crisis ok, but circumstantial evidence says things are now getting tough. Stage payments are due on an expanding delivery schedule and contract values way above collateral values mean owners have problems raising cash to meet them. Re-scheduling would de-fer the problem but yards face prob-lems in adjusting their production schedules, not least due to stage pay-ment hedging commitments. The re-sult is a complex network of negotia-tions from which there are unlikely to be few outright winners. How Much Will Be Scrapped? Finally, there is a demolition. Only 16m dwt scrapped so far in 2009, compared with 63m dwt deliveries. But as the recession deepens scrap-ping will increase. In recessions the cost of the 5th or 6th survey pushes out ships over 20 years. Currently 110m dwt of bulkers are over 20 years of age and 37m dwt of tankers. If they all go, it would neutralise 26% of the tanker orderbook and 38% of the bulkers orderbook. The Long Slow Squeeze So there you have it. Recovery by China and the world economy will help, but if previous recessions are anything to go by, a long slow finan-cial squeeze is needed to reduce de-liveries and increase demolition. It will be painful, but you can’t have fun all the time. Have a nice day.
Too Much Orderbook - But How Much Too Much?
Graph of the Week
Building For A Bigger Future
0%
10%
20%
30%
40%
50%
60%
70%
80%
90%
Jan
'92
Jan
'93
Jan
'94
Jan
'95
Jan
'96
Jan
'97
Jan
'98
Jan
'99
Jan
'00
Jan
'01
Jan
'02
Jan
'03
Jan
'04
Jan
'05
Jan
'06
Jan
'07
Jan
'08
Jan
'09
Source: Clark son Research Services
Bulk carriers Tankers
Lines show orderbook in dw t as % f leet
C ap e2 2 %
P'max2 2 % Hm a x
16%
Ha ndy40%
Tank ers down to
32% fleet
% dry bulk fleet over 20 yrs
Shipping Intelligence Weekly, 18 September, 2009 Editorial Board: Published by: Managing Director Martin Stopford Clarkson Research Services Ltd. Publisher Cliff Tyler St. Magnus House, Editor A. Lovelock 3, Lower Thames Street, Production H. Patel London EC3R 6HE, England. S & P K. Taylor Tel: + (44) (0) 20 7334 3134 Tankers R. Knight Fax: + (44) (0) 20 7522 0330 Specialised R. Whittet Telex: 8812927 CLTNKA G Gas J. R. Evans Dry Cargo G. Campbell E-mail: [email protected] Freight Derivatives A. Gray Web-site: http://www.crsl.com Singapore G. Lane Sydney, Australia P. M. Quirk
Shipping Intelligence Weekly is published 50 times a year. It reviews the markets for Crude, Products, Specialised and Gas tankers, Bulk carriers, Offshore and Liner vessels as well as the second-hand, new building and demolition markets. It provides details of freight rates, earnings, prices and activity in all these markets; fleet statistics; trade, financial and economic indicators. It is available on subscription at a price of £595/£625 a year (within Europe/outside Europe) including postage. Whilst care has been taken in the production of this review, no liability can be accepted for any loss incurred in any way whatsoever by any person who may seek to rely on the information contained herein. The information in this report may not be reproduced without the written permission of Clarkson Research Services.


![4 3 2 1 D R.0750 (all) [1,143]dlnmh9ip6v2uc.cloudfront.net/.../Prototyping/deans_connector_PRT-… · 4 3 2 1 4 3 2 1 B CAD APLICATION: Creo Parametric 2.0.4040 [10,262].5200 [13,208].6100](https://img.pdfslide.us/doc/110x75/5f055d347e708231d4129896/4-3-2-1-d-r0750-all-1143-4-3-2-1-4-3-2-1-b-cad-aplication-creo-parametric.jpg)