Embed Size (px)
Citation preview

Shipbuilding/Repair andBoatbuilding Industry:
**************m*e6_OQ*_Q,_D_*_*OO*_Oe_6***
Impact of Trade PolicyReformson Performance, Competitiveness
and Structure****o* o *o **o** *o_ **** ****_*l B ¢** * ***, ot oo*.*o
Edwin Gil Q. Mendoza
KESmRCH PAPm_,Smuts No. 94-.07
n,4sPhilippineInstituteforDevelopmentStudies

Copyright © 1994 by thePhilippine Institute for Development Studies
Printed in the Philippines.All rights reserved.The findings, interpretationsand conclusions in this paper are those of the author and do notnecessarily reflect those of PIDS and other institutions funding end/orassociated Withthe Project.
The publication of this study is made possible by a financial grant from theUnited StatesAgency for InternationalDevelopment through the TechnicalResources Project of the National Economic and Development Authority.
Please address all inquiries to the:
Philippine Institute for DevelopmentStudies4th.Roor,NEDAsa Makati Building106AmorsoloStreet,LegaspiVillage1229 Makati,MetroManila,PhilippinesFax No. (632) 816-1091Tel,Nos.893-5705 and 892-4059
ISBN 971-564-008-7RP - 9 - 94 - 500
Contents#oo# #6 ## ##_o _#oo oo_#ot a moe_#Q _
1. Introduction ............................................................... 1
2. Survey of Literature ..................................................... 3
3. Conceptual Framework .............................................. 7Industrial Performance ...................................................... 7Market Structure .............................................................. 8
Industrial Competitiveness .............................................. 10Trade Reforms, Market Structure, and Performance ....... 11
4. Data Sources and Estimation Methodology .............. 15Data Sources .......................................................... _........ 15Protection Measures ........................................................ 16
Efficiency Indicators ....................................................... 20Market Structure Indicators and Profitability Measures .... 32Discriminant Analysis ...................................................... 33
5. Industry Background ................................................ 37A. Shipbuilding and Ship Repair Industry ....................... 37B. Boatbuilding Industry ................................................. 43Government Policies and Protection Indicators ............... 45
6. Industrial Performance ........................................ :.... 53Growth Indicators ........................................................... 53
Industry Structure Changes ............................................. 62Efficiency Performance ................................................... 67Discrilninant Analysis ...................................................... 77Factors Affecting Industrial Performance ......................... 78
7. Conclusion and Recommendations ........................ 83
Bibliography .................................................................. 87
List of Tables
1 Licensed Shipbuilding and Ship RepairCompanies: 1985-1992 ............................................... 38
2 Industry Composition: 1972-1988 ................................ 383 Distribution of Plants by
Major Regions: 1983 and 1988 ................................... 404 Employment Size by Subsector: 1983 and 1988 ............ 405 Concentration Ratios by Subsector: 1983 and 1988 ...... 416 Protection Indicators by Subsector ................................ 487 Imports of Ships and Pleasure Crafts: 1977-1991 .......... 548 Subsector Shares in Total Output, CensusValue-Added
and Employment: 1972-1988 ...................................... 589 MARINA-Registered Shipbuilding
Projects: 1980-1991 .................................................... 6010 Exports of Ships and Pleasure Crafts: 1977-1992 ........... 6311 Plant Size by Subsector: 1983 and 1988 ........................ 6412 Indicators of Industry Structure: 1983 and 1988 ........... 6513 Efficiency and Protection Indicators by Subsector ......... 6814 Domestic Resource Costs (DRC) by Plant Size ............ 6915 Domestic Resource Costs ............................................. 71
16 Performance Indicators by Subsectors: 1983 and 1988 .. 7617 Results of Canonical Discriminant Analysis ................... 77
Figures1 Imports of Ships and Boats ........................................... 562 Exports of Ships andBoats ........................ .................... 56
Appendices1 "FopSeven Shipyards in the Philippines ........ _................. 932 Government Policies Affecting the Shipbuilding/
Repair and Boatbuilding Industry ............................... 943 Government Policies Affecting the Shipping Industry ... 100
4 Recipients of Board of InvestmentsIncentives: 1967-1991 ................................................ 102
5 Tariff Rates for the Shipbuilding/RepairSubsector ................................................................... 103
6 Tariff Rates for the BoatbuildingSubsector: 1972-1995 ................................................ 106
7 List C: Items for Continued Regulation for theShipbuilding/Ship Repair and Boatbuilding Industry.. 108
8 Imports of.Ships: 1977-1991 ....................................... 1099 Exports of Ships: 1977-1992 ....................................... 11310 Exports of Ple:/sure Boats: 1977-1991 .......................... 11711 imports of Pleasure Boats: 1977-1992 .......................... 11812 Tariff Rates and otherVariables Used
in DR.C, EPR and TEl Estimations ............................ 119
13 Price Indices Used in DRC Computations .................. 122
Abbreviations### oo_ o #ia #aeeot QIQ_OOQ # #####_#
AFTA Asean Free Trade AreaAsean Association of Southeast Asian Nations
BETP Bureau of Exports Trade and PromotionBOI Board of InvestmentsBIAP Boat Industry Association of the PhilippinesCCC canonical correlation coefficient
CIF cost, insurance, freightCVA census value-added
DBP Development Bank of the PhilippinesDR.C domestic resource cost
DR.CM domestic resource cost at market pricesDTI Department of Trade and IndustryDWT deadweight tonsEPR. effective protection rateFR.P fiberglass-reinforced plasticGlUT gross registered tonsIBRD International Bank for.Reconstruction and
DevelopmentILP Import Liberalization ProgramIPR. import penetration ratioJICA Japan International Cooperation AgencyMarina Maritime Industry AuthorityNEDA National Economic and Development AuthorityNSCB National Statistical Coordination BoardNSO National Statistics Office
PCM price-cost marginPDCP Private Development Corporation of the PhilippinesPhilsar Philippine Shipbuilders and R.epairers AssociationPSIC Philippine Standard Industrial Classification

viii ._
QRs quantitative restrictionsR&D researchand developmentSER shadow exchange rateSKA ship repair afloatTDP total domestic productionTEl technical efficiency indexTRP Tariff Reform ProgramUPSE University of the Philippines School of Economics
1ooot ooo • _#oQ ###o_Q_o###_ _i#_#t
Introduction
Ot,m of the primary objectives of the trade reforms implemented inthe Philippines during the early 1980s was to adjust the tradeprotection enj.oyed by domestic industries to more uniform levels.These policy revisions were expected to decrease if not eliminate themarket distortions caused by the restrictive trade policies of the pastdecades. Moreover, with the industrial climate becoming conduciveto both internal and external competition, improvements in theproductivity and international competitiveness of industries will beattained (Kirkpatrick and Maharaj 1992). Successful implementationof such policies, however, are conditioned by market-related andinstitutional factors which are specific to the industry or which affectall industries.
This paper focuses on the impact of the trade reforms onperformance, as measured by efficiency improvements, andcompetitiveness Of the Shipbuilding and Ship Repair (SB/SR)Industry (Philippine Standard Industrial Classification [PSIC] Codes38412-38419) and its subsector, the Boatbuilding Industry (PSICCode 38411).Although the boatbuilding industry is a subsector of theSB/SR industry, it is treated separately because of its export potentialsand the fact that it received less fiscal incentives than the SB/SR
sector. Since the successful implementation of these trade reforms andother industrial policies are affected by market-related andinstitutional factors, it becomes equally important that these elementsbe identified in order to come up with the proper policyrecommendal:ions needed to neutralize or enhance the impact of thesefactors. The :;tudy will also verify the hypothesis that exposure toforeign competition will lead to improvements in industrial efficiency
2 _1 Edwin Gil Q. Mendoza
via improved access to imported intermediate goods as well as in thelevel of intra-industry competition. Better access to imported goodswill lessen production time, making the firms more productive,which, in turn, enhances competitiveness.
Development of these industries are vital for the country'seconomic advancement primarily due to their key roles in supportingthe shipping industry. The shipping industry accounts forapproximately 85 percent of the country's domestic and internationaltrade because of the nation's archipelagic configuration and theunderdeveloped aviation industry (Leverage International[Consultants], Inc. 1991). The efficient transport of goods and servicesacross the various islands thus requires a serviceable SB/SR. industry.With the present domestic maritime fleet comprised of water vessels,averaging 26 yeats in age, the sector_ development becomes critical.Furthermore, growth of the sector becomes extremely vital if thecountry desires to become an active member of the Asean Free Trade
Area '(AFTA).Other economic gains include employment generation,reduction in foreign exchange drainage from the importation of watervessels and freight payments, and support in the advancement ofancillary industries such as iron and steel. Growth of the boatbuildingsector is significantdue to its foreign exchange-earning andemployment-generating potentials-
The next chapter reviews the body of theoretical and empiricalliterature relating protection, market structure, and efficiency.Chapter3 covers the conceptual framework used in the analysis while Chapter4 details the methodology and defines the terms used in the study.Chapter 5 discusses the current situation of the industry and thegovernment policies which have affected it. Chapter 6 shows andexplains the results of the analysis and highlights the factors whichmay explain the industry's performance. Finally, Chapter 7summarizes the findings of the study and proffers some policyrecommendations.
2..###ooooageee# ####e_.o _#_eeooo
Survey of Literature
PAST studies covering the relationship between trade policy reformsand industrial performance focus on how these policy changes lead toreductions in market distortions inherent in restrictive trade regimes.
Protectionist policies may result in allocative inefficiencies by causingthe promoted sectors to be highly profitable and by shielding domesticproducers from competition which may lead to complacency on thepart of managers (X-inefftciency) (Tybout, De Melo, and Corbo1991). Philippine studies focusing on efficiency and industrial policiesreveal that the "protection structure induced resource misallocationby favoring tile inefficient industries over the efficient ones...,i.e., theexport-oriented sectors" (Bautista, Power et al. 1979). With tradeliberalization, increased import competition and reduced domesticprotection will result in a reduction of these inefficiencies.
The diverse literature on the linkages between more open traderegimes and efficiency gains have been the subject of recent surveys inthe field (Havrylyshyn 1990, Kirkpatrick and Maharaj 1992, andTybout 1992). The literature review of Kirkpatrick and Maharaj(1992) partly traces the theoretical evolution from the neoclassicaltheory of gains from trade liberalization (via the 'import-discipline'hypothesis) to the "new" trade theory which links industrialorganization :o international economics.What is currently known asthe 'new' traJe theory was developed by Helpman and Krugman(1985), Dixit and Norman (1980), among others.They incorporatedin the analysis the assumptions of imperfect competition, increasingreturns to scale and product differentiation. Among their argumentsare that the economies of scale will lead to reductions in average costsas the market expands through trade and that incumbent oligopolistic
4 ,,i Edwin Gil Q. Mendoza.................... . ....................... ° .................. , ......
firms will be forced to adopt competitive prices due to the threat ofentry (contestable markets' theory). However, these gains depend ondema_adshifts accompanying trade liberalization and the nature of themarket structure, e.g., ease of entry and exit and the level of intra-industry competition (Kirkpatrick and Maharaj 1992). Power (1986)adds that the existence of barriers to importation and exportation alsoplay a significant role. Other segments of the argument emphasize therole of research and development (P,.&D) in enhancing productivityand contributing to public knowledge.
Havrylyshyn's survey discloses that empirical studies on developedcountries verify the hypothesis that import competition reducesmarket power, but "weak and ambiguous" findings result from studieson developing countries. He also finds that positive gains result fromstudies which directly correlate measures of efficiency with tradereforms (Nishimizu and Page 1982) and that time series country-specific studies yield clearer results than cross-country comparisons.Using the efficiency-frontier and domestic resource costs (DI_C)methods, Page (1984) finds a significant relationship betweentechnical efficiency and economic performance. Hill and Kalirajan(1991), using a modified version of Farrell's efficiency-frontiermethodology, identify export orientation and sources of finance,among others, as closely associated with high levels of technicalefficiency, saying that "a policy of export promotion ... will have asignificant positive effect on efficiency as firms subject themselves tothe discipline of the international market place" (Hill and Kalirajan1991).
But there are also studies which show skepticism over theempff ical proo_ presented. Kirkpatrick and Maharaj (1992) assert thatthe existing theories and empirical evidence supporting tradeliberalization are ambiguous and inconsistent. They claim that thisindeterminacy ste,_ from the uncertainty of the behavior of firmstoward the more open trade policies so that more research must bemade at the micro-level to determine how the firms actually respondto the policy changes. They a,2_.that the reaction of firms will be"conditioned" by the existing structure of the industry (Kirkpatrickand Maharaj 1992). Page (1984), using data on small and large scale
Shipbuilding/Repair and Boatbuilding Industry I=, 5
enterprises of four Indian manufacturing industries, asserts that thereis "little evidence of a systematic relationship between firm size andtechnical efficiency." Rodrik (1992) further adds that currentempirical evidences are not as solid as some sectors claim since theeffects of other macroeconomic policies are not "disentangled" fromthat of trade policies proper.
The empirical verifications of the trade liberalization-productivitynexus in the Philippines include the firm-level studies of thePhilippine Institute for Development Studies-Tariff Commission(PIDS-TC) on selected manufacturing industries.These studies revealthat there are indeed efficiency gains from the relaxation of tradepolicies and r.hat further tariff reforms and removal of quantitativerestrictions are required for the industries to gain comparativeadvantage (_ecson 1992). They also recommend that governmentshould consider sector-specific factors like monopolies and theexistence of economies of scale in certain industries. Not much
emphasis, however, is placed on the industry-specific factors,especially market structure-related variables, which may explain howfirms differ in their responses toward the change in policies.
The study on Barriersto Entry (1992) by the Sycip, Gorres,VelayoInc. (SGV) identifies trade and industrial policies as having effectivelylimited intra-industry competition in some manufacturing industries.The study further asserts that these policy-induced entry barriers havealso caused structural barriers, such as excess capacity and limit pricingthrough rate and price regulation (as in the case of the shippingindustry),which had negative effects on the efficiency of some sectors.The report men recommends that 'reforms in the incentive policyscheme, establishment of a central anti-trust authority, and overhaulof the bureaucracy' must be the main components of a competitivepolicy leading to productivity improvements (SGV 1992).
Numerous studies on the domestic SB/SR industry focusparticularly on the technical aspects of ship manufacturing anddrydocking (see Marina Technical Notes Series). Other reports delveinto the financial viability and future directions of these
manufacturing activities (International Bank for Reconstruction andDevelopment or IBRD 1980, Private Development Corporation of
6 _1 Edwin Gil Q. Mendoza
the Philippines or PDCP 1972). A 1972 PDCP study on theshipbuilding sector details the various problems facing the subsectorand the government policies affecting it. The 1990 "DBP IndustrialRestructuring Studies on the Shipping and Ship Repair Sector"compiles firm-level data on the existing financial, material, andhuman resources of the two sectors with the view of formulatingpolicies which will help improve efficiency and growth. Anotherreport on the shipbuilding and ship repair sector is presented in theBoard of Investments (BOI) Ten-YearDevelopmentPlanfor Shipbuilding,Repairing and Breaking Industry (Leverage International [Consultants]Inc. 1990). The study gives an overview of the structure and
performance of the sector in _therecent past. It explains that the mostimportant entry and exit barriers for the sector are in the capital,technology, and marketing. As to macroeconomic issues, the reportclarifies that the exchange rate fluctuations have the most pronouncedimpact on the industry since 70 percent of its inputs are imported.Finally, the report gives suggestions on the key issues which thegovernment should address if it decides to assist the sector. The study,however, fails to provide an assessment of the sector's intra-industrylevel of competition. It is also interesting to note that the problemsdescribed in the report are still the same difficulties which the industryfaced in the 1970s as described in the 1972 PDCP report.
In:a similar vein, studies on the boatbuilding subsector have oftencentered on the sector's financial viability arid future.1 A case studypublished by the BOI shows thatthe problems faced by the industryare also related to th e problems of the SB/SR sector. In the productguide on pleasure boats, the Bureau of ExportsTrade and Promotion(13ETP) of the Department ofTrade and Industry (DTI) indicates that
the country has been able to penetrate the export market of theUnited States for sail-propelled boats. Potential export markets arealso described in the guide report.
1. Among these include the unpublished thesis of C. Custodio (1992) and thePDCP Study on Boatbuilding (1980).
3#o o _) o _ Q # # # _ t o_ . o • o# o ##4) ol) al # # ##
Conceptual Framework
A rationale for trade liberalization, most especially in developingcountries, stems from the fact that there are inefficiencies in protectedeconomies. The literature on international trade describes explicitlythe numerous 'biases' in resource allocation resulting from tariffs,
exchange rate controls, and non=tariffbarriers (e.g., quotas) which areinherent in protectionist trade regimes (Krueger 1972). Basically,
inefficiencies result as competition from foreign firms is restricted andas monopolistic power results when incumbent firms maintain excesscapacity. Although there have been gains in pursuing inward-orientedtrade policies; many studies have shown that the costs far outweighthe benefits. A logical consequence of the removal of these tradebarriers would then be improvements in welfare and productivityperformance.
INDUSTRIAL PBKFOP,MANCE
Industrial performance in this study considers efficiencyperformance or productivity growth at both the firm/p.lant andindustry levels. Specifically,the analysis concentrates on improvementsin productivity performance due to static efficiency and nottechnological progress (dynamic).z Static efficiency at the plant levelcan also be further subdivided into (a) technicalq_iciencygains or
2. Microeconomic theory elucidates that efficiency can be analyzed using isoquantsand isocost lines. While static efficiency exemplifies the efficient use of resourcesand managerial expertise which allows phnts or firms to reach the least-cost
isoquant, technological progress refersto movements in the least-cost isoquant.
8 ,i Edwin Gil Q. Mendoza
maximizing the plant;s output, given a particular mix of inputs andtechnology; and (b) efficiency gains due to the use of the mostappropriate technique, given the production environment.
Another type is allocativeefficiency,referring to the distribution offactors of production into economic activities which will yield thehighest returns at undistorted relative prices. At the industry level,aUocative efficiency can be illustrated by the gains in efficiency whentrade barriers are relaxed, leading to the movement of resourcestoward the production of goods which are in line with the country'scomparative advantage.
To account for how the entire tariffsystem gives protection to anindustry, the effective protection rate (EP1L)framework is used. Thestudy employs two measures of efficiency: (a) domestic resource costs(DRC) of foreign exchange; and b) the technical efficiency index(TEI).The DRC is evaluated at shadow prices in order to account forthe distortions in product and factor markets inherent in developingeconomies. Shadow prices are prices reflective of society's valuationof goods.The TEl is based on the works of Farrel (1957) and Aigner,LoveU and Schmidt (1977), and gives a measure of how far plants arefrom the efficiency frontier. Since higher protection results ininefficiencies, it is presumed that the sector with a low DRC (i.e.,more efficient) will also have a low EPR.
MARKET STRUCTURE
/
Developments in econo_mic theory reveal that the impact of tradeliberalization on industrial performance is also influenced by theexisting industrial structure. This theory is based on the structure-conduct-performance paradigm which asserts that certaincharacteristics of the industry condition the behavior of the firms,which then determines their performance within their respectivemarkets2 Structural elements and conditions, like the degree of
3. This relationship should not be treated as flowing onlyin one but rather in manydirections. As certain models suggest, the behavior of firms help shape the structureof the industry (Lee 1984).

Shipbuilding/Repairand .BoatbuildingIndustry I_ 9
domestic seller concentration, conditions of entry and exit, existenceof economies of scale,and the existence of multinational corporationsin the industry, will affect the productivity and efficiency of the firmsdirectly or affect them by way of altering the degree of competitionwithin the industry. Hence, any policy changes (e.g., trade policyreforms) which affect these elements Will lead to changes in theperformance of the firms.
In particular, entry and exit conditions can determine whethertrade policy changes will be successful in promoting efficiencyimprovements. In industries where barriers to entry and exit are veryhigh or very restrictive, it is theorized that incumbent firms will nothave any incentives to innovate or improve efficiency even if faced bygreater foreign competition. Policies such as capacity-licensing, prioroperator and protection of investment rules (applied to the shippingindustry) have successfully limited the number of participants in theindustry.' Protectionist trade policies have been effective deterrents toentry by way of limiting foreign competition. The existence ofstructural barriers to entry (i.e., arising from the inherent nature ofthe industry and actions of incumbents) such as absolute costadvantages, capital requirements, access to distribution channels havealso limited entry into the industry,s
It is also theorized that industrial concentration will have
detrimental effects on the performance of the firms since a marketcharacterized by few sellers will not perform competitively so thatoutput will be limited and prices will not equal their opportunitycosts. Moreover, firms in concentrated industries respond differently
from their competitive counterparts in making price and outputadjustments in response to disturbances (Caves 1980). Albeit sucharguments have merits, the real issue is the cause of concentration. 6
4. See SGV study on Ban/ers to Entry for a listing of these rules.
5. A comprehensive discussion of these element3 arepresented in the SGV study onBarr/ersto Entry
6. l_odrik (1900) provides reasons for the high concentration in less developedcountries (LDCs).
1 0 4 Edwin Gil Q. Mendoza.... . ...................... . ............ . ...................... . ..... .
Let us suppose that the concentration of the industry results from therelative size of the domestic market in comparison with the minimumefficient scale of the technology used in the industry.Then economiesof scale imply that an efficient industry will necessarily be a
concentrated one (SGV !992)" It can be qualified, however, that sinceprice is greater than marginal costs as output is restricted, firms in theindustry exhibit inefficiencies in resource allocation even if they aretechnically efficient. But if concentration results from directinterventions by the government to promote and protect particularindustries, then the inefficiencies cited above may very well result,and th.e concern becomes real.What is important then is to examinethe causes of concentration in the industry and whether theperformance of the firms reveal improvements or not.
INDUSTRIAL COMPETITIVENESS
The concern for improvements in efficiency is actually related tothe need to become competitive in the marketplace. Competitivenessis rooted on the theory of comparative advantage, which implies thatan economy should produce the goods and services which it canproduce efficiently relative to other goods and services. Exploitationof this comparative advantage will then lead to the attainment of'international competitiveness', the ability of firms to competewithout government interventions, in both domestic and foreignmarkets.
Private profitability is implied by competitive advantage whilecomparative advantage refers to social profitability. Because of marketdistortions, comparative advantage differs from competitiveadvantage. A firm or industry may be socially profitable but may notexhibit competitive advantage because of such distortions. One suchdistortion arises from an overvalued exchange rate which maypenalize exporters by lowering their "private" profits.
The most important factors leading to the achievement ofinternational competitiveness include productivity improvements andgovernment policies. Pack and Westphai (1986) argue that
Shipbuilding/Repair and Boatbuilding Industry I_ 1 1............. • ............................. ,., ......... 4=***.*--.**...
technological effort will lead to substantial productivity gains_allowingfirms to become internationally competitive in production. Hence,efforts must be made to enhance the acquisition of technology byindustries.
TRADE REFORMS, MARKET STIglJCTURE, AND PERFORMANCE
Trade protection, by increasing the prices of foreign products, willincrease profitability of domestic firms, thereby attr:/cting manyentrants into the industry.This eventually leads to the proliferation oftoo many firms producing output at levels below the minimumefficient scale (Kirkpatrick and Maharaj 1992). Hence, the absence offoreign competition allowsdomestic firms to operate below efficientscale (scale inefficiency) (P,odrik 1988). With more liberal tradepolicies, market prices will go down, reducing the profitability of thefirms, and result in the exit of the inefficient producers.The remainingfirms will then produce at higher output levels,which means movingdown their average cost curves to coincide with the lover domesticprices and at higher levels of productivity (Kirkpatrick and Maharaj1992). ILodrik (1988), however, cautions that these will result onlyunder assumptions of free entry and exit and increasing returns toscale.
Where exit and entry is problematic, the case for tradeliberalization will depend on the so-called import-disciplinehypothesis, which asserts that the challenge brought about by foreigncompetition will adversely affect the market power of producers,making them change their production and pricing decisions=IncreasedimpOrts will force these firms to adopt new technologies which willimprove efficiency and minimize costs (Nishimizu and Page 1982).Even if demand for domestic goods are restricted, the increasedCompetition due to more liberal trade policies will induce animprovement in production efficiency.An important variation _f,_his itheory relevant to the current study is that entry barriers are also.prevalent in the input fide, which effectively limit entry, especially forsmall firms which do not have the resources to acquire imported raw
12 ,,_ EdwinGilQ.Mendoza
materials efficiently.With trade liberalization, imported raw materialsbecome accessible, leading to productivity improvements.
Another theory focuses on contestable markets where it is arguedthat, even with high seller concentration (or existence of monopolistsor oligopolists), entry and exit barriers (perfect contestability) andquantitative restrictions (Qtks) do not block imports, the incumbentsellers will behave as perfect competitors because of the threat ofpotential competition from imports (Lee 1984).
These gains in trade liberalization will be affected by the structuralimpediments to resource allocation. In situations where the importersare also major sellers,an increase in imports only result in higher sellerconcentration (Kirkpatrick and Maharaj 1992). The hypothesizeddecline in profitability will not materialize if these sellers are able tomaintain the level of domestic prices, given the lower cost of importedsupplies. Collusive behavior between producers and importers willnot lead to the hypothesized efficiency gains theorized in thepreceding discussion. In short, the purported benefits from tradeliberalization will depend on how the incumbent firms will behave.R.odrik (1988) points out that because of the indeterminacy ofoligopolistic market structures, the results will not be clear-cut.
A:; stated earlier, there are many determinants of the efficientperformance of the firms which may or may not be affected by tradepolicy reforms. These include the forward and backward linkages ofthe ir,dustry, which have remained underdeveloped due to financialand technological constraints (e.g., the local iron and steel industry).Although lower tariffrates may help the SB/SR. industry, this may notbe enough since the importation activities would require time andfinancial considerations which may adversely affect the ability of thefirms to deliver their services or products and hence theircompetitiveness.
Albeit demand for repair jobs is more than adequate, demandconditions facing domestic shipbuilders and boat ,nanufacturers haveprevented them from exploiting the potential economies of scale from
•ship or boat construction. The limited domestic demand for shipsgenerally arise from domestic shipping policies which favor shipimportation than domestic production and the existence of alternative
Shipbuilding/RepairandBoat:buildingIndusW I_ 13*_O_**4"O'''* ............ *''4 ............................ *'44*.* .....
markets of ships. Furthermore, the geographic location of the countryalso determines the activities of the shipyards with countries situatedin areas of gr,._wingtrade and commerce experiencing greater trafficof water vesselsand thus, more shipbuilding or repair activities. As forthe boatyards, their products are designed to cater to certain segmentsof the market which require special marketing activities. Anotherfactor which affects the competitiveness of domestic yards, butsomewhat unrelated to trade policy changes, is the nature of theinfrastructure services in the country.
All these factors will have a bearing on how trade policy reformswill affect the performance of the industry. Basically,this paper willshow that the channels, through which trade policy reforms impacton the industry's performance, are mainly through an improvement inits access to non-substitutable imported material inputs and amovement toward greater intra-industry competition. Moreefficiency gains also result if more "pro-competition" domesticpolicies exist.
4O############t #O_tit #OO###OOOOm
Data Sources
and Estimation Methodology
DATA SOURCES
Mostof the observations employed in this study were taken from theNational Statistics Office (NSO) 1983 and 1988 Census of LargeEstablishments (i.e., plants employing more than five persons) (censusdata) and the surveys of manufacturing firms belonging to theshipbuilding, ship repair, and boatbuilding sectors for the years 1986and 1991 (surveydata).Since the census data are gathered at the plantlevel, it is possible that two observations may yield similarcharacteristics if both plants were owned by the same firm.Furthermore, the confidentiality clause in the NSO survey prevented.the study group from identifying which plants were operationalduring the two years. For the survey data, only SB/SR firms registeredwith the Marina and boatbuilders belonging to the Boating IndustriesAssociation oFthe Philippines (BIAP) were given questionnaires. Only22 firms (20 SB/S1L and two boatbuilders) responded to thequestionnaires with 12 of these completely answered. An advantageof this data set is that a comparison of the same set of firms for the twoyears can be clone.
Other data were retrieved from the Marina Offices, BOI andBETP-DTI.. PIDS, University of the Philippines School ofEconomics (UPSE), National Economic and Development Authority(NEDA), Development Bank of the Philippines (DBP), PDCP,National Statistical Coordination Board (NSCB) and PhilippineShipbuilders and Repairers Association (Philsar).
16 ,4 EdwinGitQ,Mendoza
PROTECTIONMEASURES
As the primary measure of the structure of protection, the studyuses the EPR framework (MedaUa 1986). EPRs are estimated usingtaxes, import mark-ups, and tariffs,since EPRs based on prices cannotbe computed due to insufficient data. EPR calculations consist ofidentifying the tariff rates, sales taxes and mark-ups for the sectors'products, and material inputs, and using these to estimate theirimplicit tariff rates (Appendix 12).
ImplicitTariffs
Implicit tariffs measure the "proportional difference betweendomestic prices and border prices of homogeneous goods" (Medalla1986) due to the many instruments of protection.The general formulais
T = (1+011+f(1 +m]- 1
where f = advance salestax which differed between domestic andimported goods. (After 1986, the sales taxes for bothgoods were made equal);
m = percentage mark-up applied to compute the advancesales tax,f which was abolished after 1986;
t = representative tariff rate for the sector; andT = implicittariffrate.
To come up with the representative tariff rates, the tariff rates forthe products are averaged. Ideally, weights based on the elasticities ofdemand and supply for the goods in question should have been used,but since these cannot be computed given the available data, simpleaveraging is used for the tariff rates on outputs. Tariff rates for inputsare weighted by their shares in total production based on data obtainedfrom past technical studies (Leverage International [Consultants], Inc.1990, Custodio 1992). These average tariff rates are then used tocompute for the implicit tariffs for outputs and inputs.
Shipbuilding/RepairandBoatbuildingIndustry _ 17
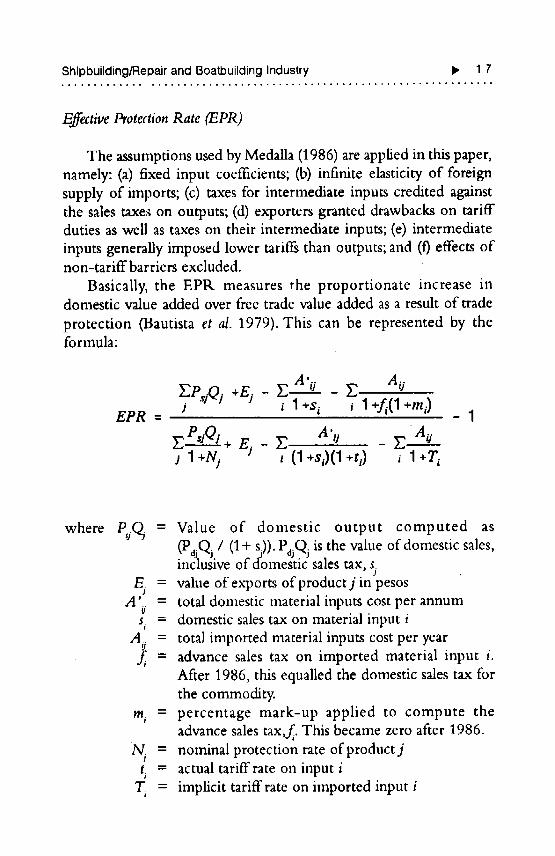
EffectiveProtectionRate (EPR)
The assumptions used by Medalla (1986) are applied in this paper,namely: (a) fixed input coefficients; (b) infinite elasticity of foreignsupply of imports; (c) taxes for intermediate inputs credited againstthe sales taxe:_on outputs; (d) exporters granted drawbacks on tariffduties as well as taxes on their intermediate inputs; (e) intermediateinputs generally imposed lower tariffs than outputs; and (0 effects ofnon-tariffbarriers excluded.
Basically, the EPIk measures the proportionate increase indomestic value added over free trade value added as a result of trade
protection 0]autista et al. 1979). This can be represented by theformula:
EPR = J • 1+$i i 1 +fi(1 +mi) - 1
PsiO/ A',i "Ao"E +/rj - E -Ej 1 +Ni , (1 +sl)(1+t_) i 1 +Ti
where Pj(_ = Value of domestic output computed as(P..Q / (1+ s)). P.Q. is the value of domestic sales,
ql J j aj..I
inclusive of domesuc sales tax, sjE_ = value of exports ofproductj in pesos
A' = total domestic material inputs cost per annumsi = domestic sales tax on material input i
A = total imported material inputs cost per year
= advance sales tax on imported material input i.After 1986, this equalled the domestic sales tax forthe commodity.
mi = percentage mark-up applied to compute theadvance sales tax,f. This became zero after 1986.
N. = nominal protection rate ofproductjJ
t, = actual tariff rate on input iT_ = implicit tariff rate on imported input i
18 ,,q Edwin Gil Q, Mendoza....................... , ....................... 0 .................. ,,
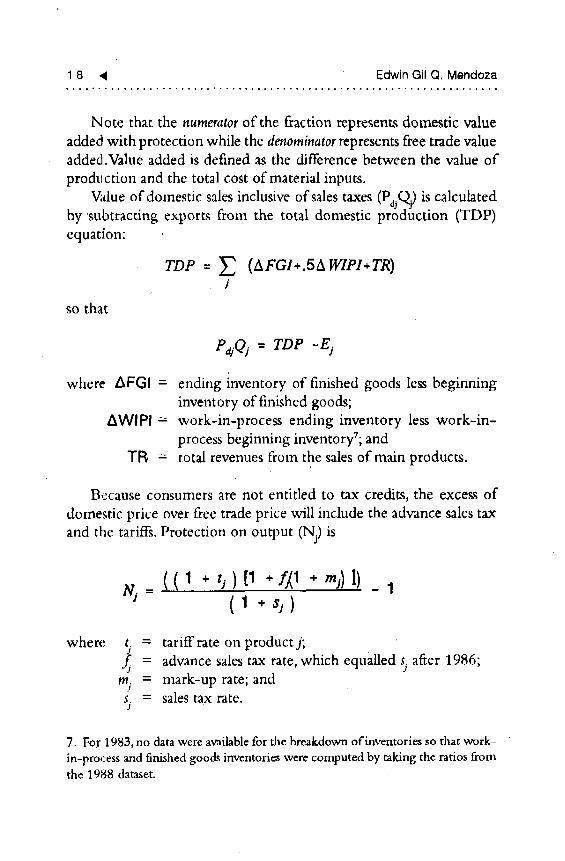
Note that the numeratorof the fraction represents domestic valueadded with protection while the denominatorrepresents free trade valueadded .Value added is defined as the difference between the value of
production and the total cost of material inputs.
_due of domestic sales inclusive of sales taxes (PaQj) is calculatedby subtracting exports from the total domestic production (TDP)equation:
J
so that
e,jqj=TOe-ej
where AFGI = ending inventory of finished goods less beginninginventory of finished goods;
AWlPI = work-in-process ending inventory less work-in-process beginning inventoryT; and
TR = total revenues from the sales of main products.
Because consumers are not entitled to tax credits, the excess ofdomestic price over free trade price will include the advance sales tax
and the tariffs. Protection on output (Nj) is
t¢_: (( !_+.t_) [1 + ,.j) l) _ 1(1 +,j)
where t. = tariffrate on productj;
= advance sales tax rate, which equalled sj after 1986;mj = mark-up rate; ands -- sales tax rate.J
7. For 1,983, no data were available for the breakdown of inventories so that work-
in-process and finished goods inventories were computed by taking the ratios fromthe 1988 dataset.
Shipbuilding/Repairand BoatbuildingIndustry I_ 1 9
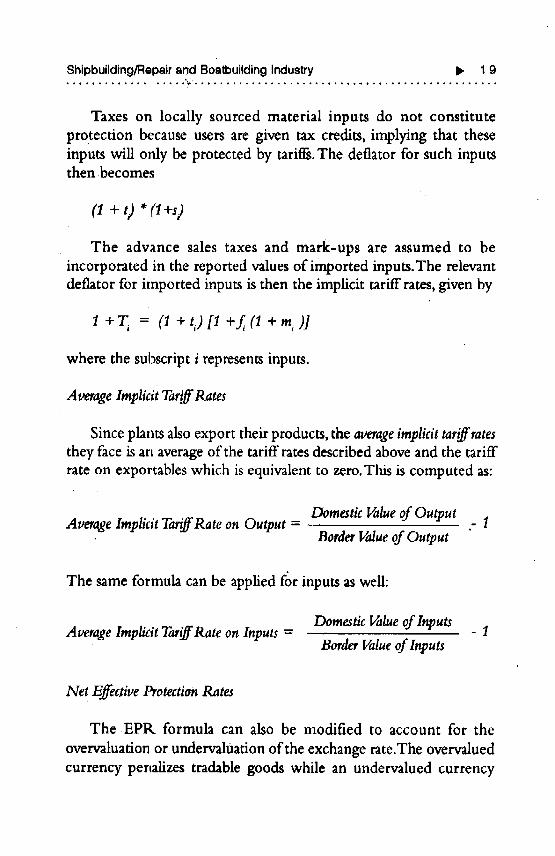
Taxes on locally sourced material inputs do not constituteprotection because users are given tax credits, implying that theseinputs will only be protected by tariffs.The deflator for such inputsthen becomes
(1+ t)
The advance sales taxes and mark-ups are assumed to beincorporated in the reported values of imported inputs.The relevantdeflator for imported inputs is then the implicit tariff rates, given by
I + T_ = (I + t,) [l +f_ (l + m, )]
where the subscript i represents inputs.
Average ImplicitTariff'Pates
Since phnts also export their products, the averageimplicittariffratesthey face is an average of the tariff rates described above and the tariffrate on exportables which is equivalent to zero.This is computed as:
Average ImplicitTariff'Rate on Output = DomesticValueof Output . 1BorderValueof Output
The same formula can be applied for inputs as well:
DomesticValueof InputsAverage ImplicitTariffRate on Inputs = - 1
BorderValueof Inputs
Net EffectivetgotectionPates
The EPK formuh can also be modified to account for the
overvaluation or undervaluation of the exchange rate.The overvaluedcurrency perlalizes tradable goods while an undervalued currency
2 0 ,11 Edwin Gil Q. Mendoza
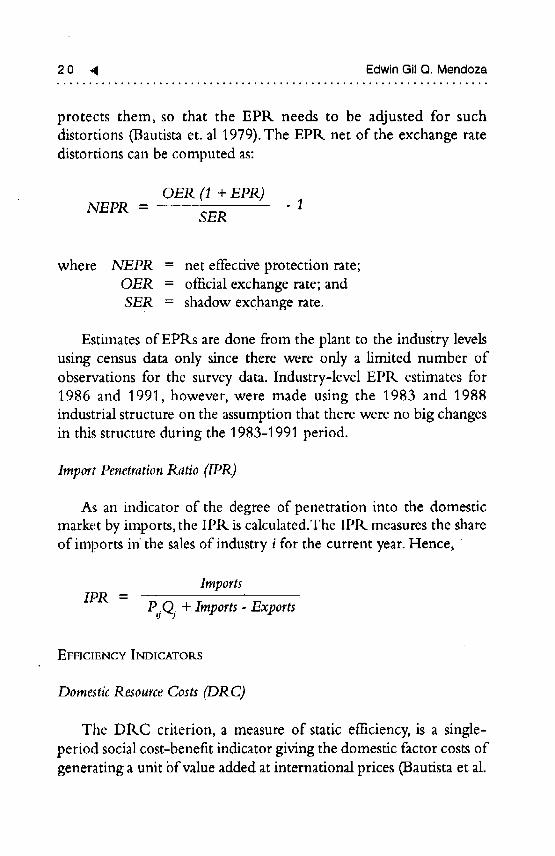
protects them, so that the EPR needs to be adjusted for suchdistortions (Bautista et. al 1979). The EPR net of the exchange ratedistortions can be computed as:
OER (1 + EPR)NEPR = - 1
SER
where NEPR = net effective protection rate;OER = official exchange rate; andSER = shadow exchange rate.
Estimates of EPRs are done from the plant to the industry levelsusing census data only since there were only a limited number ofobservations for the survey data. Industry-level EPR estimates for1986 and 1991, however, were made using the 1983 and 1988industrial structure on the assumption that there were no big changesin this structure during the 1983-1991 period.
Import PenetrationRatio (IPR)
As an indicator of the degree of penetration into the domesticmarket by imports, the IPtk is calculated.The IPR measures the shareof imports in the sales of industry i for the current year. Hence, •
ImportsIPR =
PjQj + Imports- Exports
EFFICIENCY INDICATORS
DomesticResourceCosts (DR C)
The DRC criterion, a measure of static efficiency, is a single-period social cost-benefit indicator giving the domestic factor costs ofgenerating a unit bfvalue added at international prices (Bautista et al.
Shipbuilding/Repair and Boatbuilding Industry II, 2 1
1979). When compared with the economy's shadow exchange rate(SER) or the social value of foreign exchange, the DRC provides anindication of the relative efficiency position of the firm or industry.Apositive DRC/SER less than or equal to one means the plant orindustry has a comparative advantage in its economic activities. ADILC/SER greater than one implies that the price of foreignexchange is lower than the social value of foreign exchange saved (orearned) in producing the import-substitute (exportable good) andthus, the plant or industry exhibits comparative disadvantage. As an'ex post measure of the opportunity cost' incurred by the economy insustaining its import substitutes or exports, the DR.C can be a goodindicator of how the sectors' eftlciency performance changed whenthe existing protection structure was altered (Bruno 1972).
Shadow prices are used because, in economies with distorted tradestructures such as in developing countries, market prices do not reflectthe true opportunity costs of goods and services_These distortionsarise because of market failures (e.g., monopolies and externalities)and government policies (e.g., foreign exchange controls). Specifically,shadow prices of hbor, capital, and foreign exchange are required forestimating DRCs.The shadow prices utilized in the study stem fromestimates of past studies (specificallyMedalla 1986).These are outlinedin Appendix 12.
The sectors under study are basically considered as importsubstituting, although some firms from the survey were found to beexporter_, particuhrly the large SB/SR firms which service foreignships and the boatbuilders.
The DRC estimation follows the methodology used by Bautistaet al. (1979), and the PIDS-TC series of industry studies? DRCestimates are done for four years and the term currentyearwill refer toany one of these: 1983, 1986, 1988, or 1991.
The varied production cost components are first expressed interms of their social opportunity costs, and then allocated into either
8. There were some changes which the study group made, however, with regards
to certain assumptiom. Details of fire methodology used will be presented in aforthcoming Development Incentives Assessment (DIA) project volume.
2,2 _1 Edwin Gil Q. M_ndoza
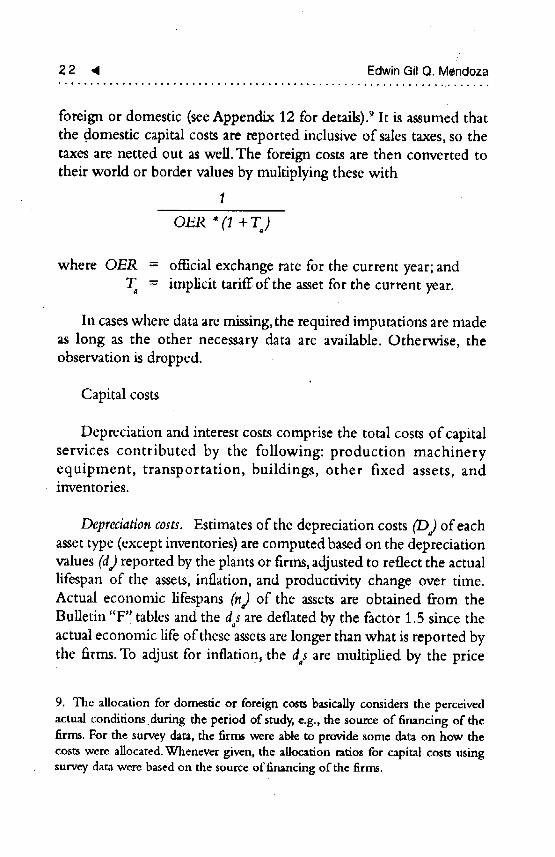
foreign or domestic (seeAppendix 12 for details).9 It is assumed thatthe domestic capital costs are reported inclusive of sales taxes, so thetaxes are netted out as well. The foreign costs are then converted totheir world or border values by multiplying these with
1
O_.R * (1 + T)
where OER = official exchange rate for the current year; andT = implicit tariff of the asset for the current year.
In caseswhere data are missing,the required imputations are madeas long as the other necessary data are available. Otherwise, theobservation is dropped.
Capital costs
Depreciation and interest costs comprise the total costs of capitalservices contributed by the following: production machineryequipment, transportation, buildings, other fixed assets, andinventories.
Depreciationcosts. Estimates of the depreciation costs (D) of eachasset type (except inventories) are computed based on the depreciationvalues (d) reported by the plants or firms, adjusted to reflect the actuallifespan of the assets, inflation, and productivity change over time.Actual economic lifespans (n) of the assets are obtained from theBulletin "F'! tables and the ds are deflated by the factor 1.5 since theactual economic life of these assetsare longer than what is reported bythe firms. To adjust for inflation, the ds are multiplied by the price
9. The allocation for domestic or foreign costs basically considers the perceivedactual conditions during the period of study, e.g., the source of financing of thefirms. For the survey data, the firms were able to provide some data on how thecosts were allocated. Whenever given, the allocation ratios for capital costs usingsurvey data were based on the source of financing of the firms.
Shipbuilding/Repair and Boatbuilding Industry I_ 2 3.,.,.,,,..,,..**. ...................................................
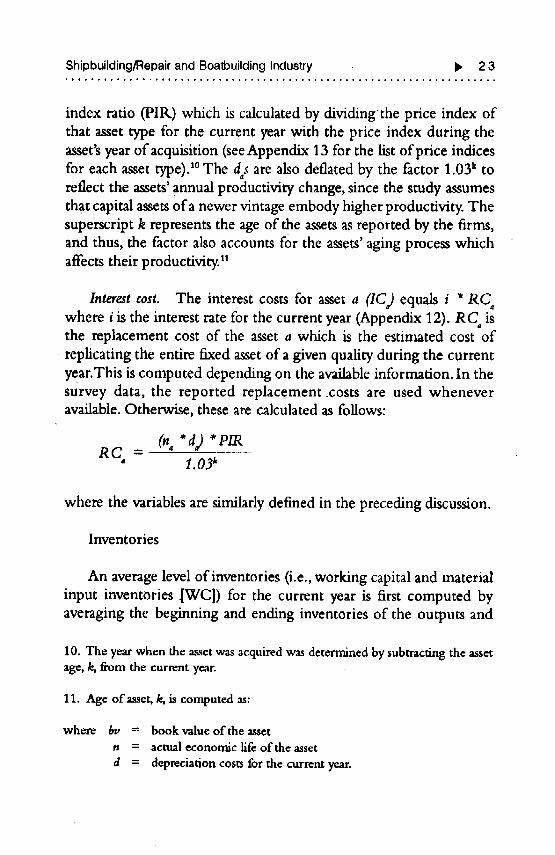
index ratio (PILL)which is calculated by dividingthe price index ofthat asset type for the current year with the price index during theasset'syear of acquisition (seeAppendix 13 for the list of price indicesfor each asset type).1°The ds are also deflated by the factor 1.03* toreflect the assets' annual productivity change, since the study assumesthat capital assetsof a newer vintage embody higher productivity. Thesuperscript k represents the age of the assets as reported by the firms,and thus, the factor also accounts for the assets' aging process whichaffects their p roductivity.*l
Interest cost. The interest costs for asset a (IC) equals i * RCwhere i is the interest rate for the current year (Appendix 12). RC isthe replacement cost of the asset a which is the estimated cost of
• replicating the entire fixed asset of a given quality during the currentyear.This is computed depending on the available information. In thesurvey data, the reported replacement .costs are used wheneveravailable. Otherwise, these are calculated as follows:
(.*a) *VIRRC= 1.03k
where the variables are similarly defined in the preceding discussion.
Inventories
An average level of inventories (i.e., working capital and materialinput inventories [WC]) for the current year is first computed byaveraging the beginning and ending inventories of the outputs and
10. The year when the asset was acquired was determined by subtracting the assetage, k, fi'om the current year.
11. Age of asset, k, is computed as:
where bv = book value of the assetn = actual economic life of the asset
d = depreciation costs for the current year.
24 ,I Edwin Gil Q, Mendoza
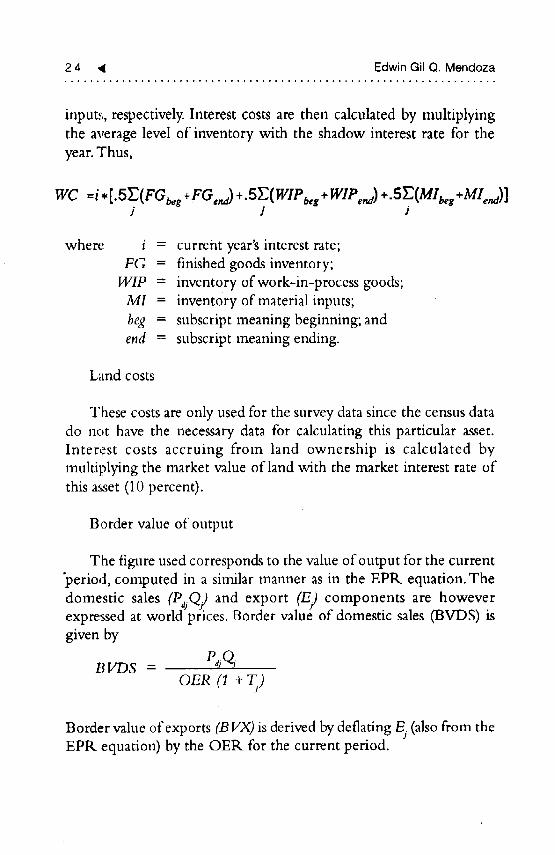
input.,_,respectively. Interest costs are then calculated by multiplyingthe average level of inventory with the shadow interest rate for theyear.Thus,
wc =i•[.5E(FG_,,+FG,,_)+.S}2(Wmb,, �Win,.,)+.SE(M1b,,+MZ,,.,)]] J J
where i = current year's interest rate;FG = finished goods inventory;
WIP = inventory of work-in-process goods;MI = inventory of material inputs;beg = subscript meaning beginning; andend = subscript meaning ending.
Land costs
These costs are only used for the survey data since the census datado not have the necessary data for calculating this particular asset.Interest costs accruing from land ownership is calculated bymultiplying the market value of land with the market interest rate ofthis asset (10 percent).
Border value of output
The figure used corresponds to the value of output for the current"period, computed in a similar manner as in the EPI_ equation. The
domestic sales (P_jQ_ and export (E:,)components are howeverexpressed at world prices. Border value of domestic sales (BVDS) isgiven by
- I' jQjOV,R(1+T)
Border value of exports (B VX) is derived by deflating E_(also from theEPR equation) by the OER for the current period.

Shipbuilding/Repairand Boa_buildingindustry I_ 2 5
World value of output (W) can then be expressed as
W = ,XBVX+ BVDS./
Laborcos_
The costs of labor services are divided into wages and benefits forunskilled labor, skilled labor, and family members. Since the censusdata do not indicate the number of unskilled workers, it is assumed tobe 5 percent of the total workforce (TW).
The shad._w wage rate (SWj) of unskilled workers is assumed tobe 60 percent of the minimum wage rate) =The market wage rates ofskilled workers (SWI) are taken to reflect the social productivity oftheir services so that no adjustments are required. Their wages arecomputed by subtracting SSS benefits and wages of unskilled workersfrom the reported total compensation of all workers. The shadow
wage of working owners (SW=) is obtained by applying the averagewage rate of skilled workers on the number of work-owners.
Total domestic labor costs is then given by:
SW,t = SW_ + sw_ + SW=
Foreign 1.'tborcosts (SWfl) arise whenever foreign consultants andtechnical personnel visit local yards. These costs do not requireadjustments.
Material inputs and other costs
Materialinputs. The required figures for the raw and intermediatematerials (hereon referred to as material inputs) are the value ofmaterial inputs actually used during the year. The domestic
component of the material inputs (MI) isdivided into tw6 equal parts.
12. These factors were estimated in past studies (see Medalla 1986). See Appendix12 for the respective factors applicable for each period under study.
26 4 EdwinGilQ.Mendoza............................. _,.* ................... _.*.4o***...*.46o.
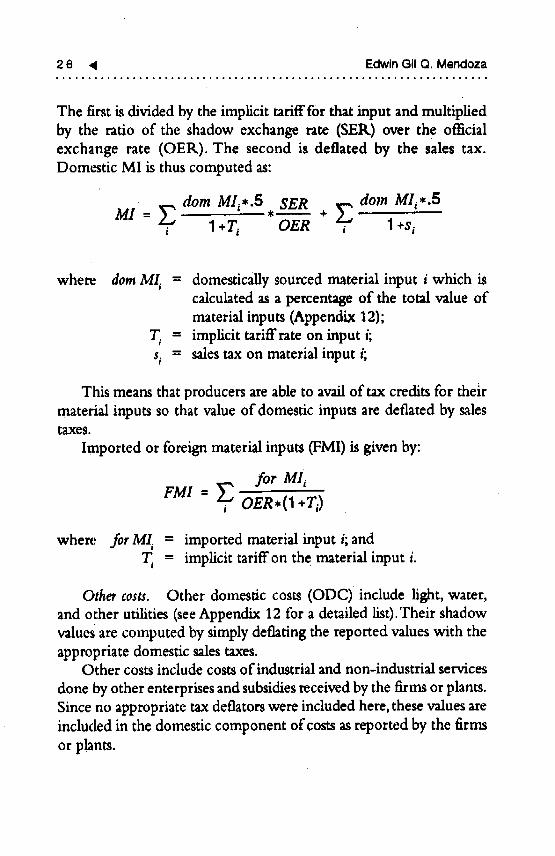
The first is divided by the implicit tarifff0r that input and multipliedby the ratio of the shadow exchange rate (SEK) over the officialexchange rate (OER). The second is deflated by the sales tax.Domestic MI is thus computed as:
dora Mli*.5 * SER dora MIi,.53/11
where doraM/_ = domestically sourced material input i which iscalculated as a percentage of the total value ofmaterial inputs (Appendix 12);
T, = implicit tariffrate on input i;si = sales tax on material input i;
This means that producers areable to avail of tax credits for theirmaterial inputs so that value of domestic inputs are deflated by salestaxes.
Importedorforeignmaterialinputs(FMI)isgivenby:
for MI,
OER*(I +TI)
where for MI_ = imported material input i;andT_ = implicit tariff on the material input i.
Other costs. Other domestic costs (ODC)include light, water,and other utilities (seeAppendix 12 for a detailed list).Their shadowvalues are computed by simply deflating the reported values with thezppropriate domestic sales taxes.
Other costs include costs of industrial and non-industrial services
done by other enterprises and subsidiesreceived by the firms or plants.Since no appropriate tax deflators were included here, these values areincluded in the domestic component of costs as reported by the firmsor plants.
Shipbuilding/RepairandBoatbuildingIndustry I_ 2 7
Other foreign costs (OFC) include licensing fees, dividends onforeign shares, packaging materials, fuels, and lubricants. These areexpressed in border prices by deflating with the OEI_ and theirrespective implicit tariffs. Hence,
for OCOFC =
OER *(1 + T)
where for OC = foreign component of other production costs;andT = implicit tariffs for other foreign costs.TM
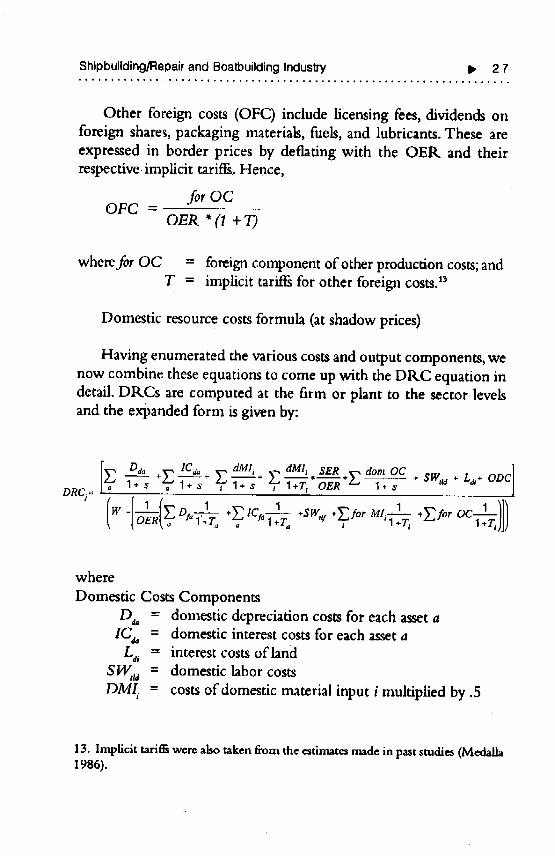
Domestic resource costs formula (at shadow prices)
Having enumerated the various costs and output components, wenow combine these equations to come up with the DRC equation indetail. DILCs are computed at the firm or plant to the sector levelsand the expanded form is given by:
rx-_ Da,_+r.._lC,_ x--,dMl_ ,r.-,dMii SER _ doraOC .. . ]IZ-,_. _ z, _. * 2_,_. ,+ 2_,, _ *_--+L, T -- * a_,,u+ %+ OOCl
oRc_=_' ° _ " ° ' ' " ' '+" Y'_" "" /(.,-[±(v:.1-- .,.,...r:o,,,'-- .r:o, ' )])k [OERt_""l+r_ _, "l+r, " T l+r, _ l+r,)j)
where
Domestic Costs ComponentsD_ = domestic depreciation costs for each asset a
IC_ = domestic interest costs for each asset aLa_ = interest costs ofhnd
SW, u = domestic hbor costs
DMI_ = costs of domestic material input i multiplied by .5
13. Implicittarit_werealsotakenfromtheestimatesmadein paststudies(Medalh1986).

28 ,11 EdwinGilQ.Mendoza
dom OC = other domestic costs, including utilities such as water,electricity, and other utilities subjected to domesticsales taxes
ODC = other domestic costs not subjected to sales taxess = sales tax applicable for each cost component for the
current yearW = border value ofoutput
Foreign Costs ComponentsD__ -- foreign depreciation costs for each asset a
IC_ = foreign interest costs for each asset aSW¢ = foreign labor costs
for M/_ = costs of foreign material input ifor OC = other foreign costs
T = implicit tariff rate for each foreign cost item
While plant and industry DtLCs are computed using census data,only flrm-level DRCs are computed using survey data. Sensitivity tochanges in the interest costs components are analyzed using twointerest rates: 10 and 12 percent.
Domestic resource costs at market prices (DRCM)
The DR.C formula can also be used to measure the competitive
advantageof particular firms by converting the shadow values of thenumerator in the DRCs equation to their market values.This yieldsthe equation:
w - oE_[o _I*L 1.r, , 1.r,
Shipbuilding/Repairand BoatbuildingIndustry p 2 9ooo_ ....... *,,**o**,#,_.4 .............. ,°°**4 ...................... *
Competitive advantage can be determined by comparing thecomputed DtLCm with the OER. If the ratio yields a positive valueless than or equal to one (greater than one), the firm or industry is saidto have competitive advantage (disadvantage).
Owing to computational errors, we include in the definition offirms having competitive advantage those which have positiveDKCm/OER. less than or equal to 1.2 and firms with comparativeadvantage those which have positive DRCs/SER less than or equal to1.2.
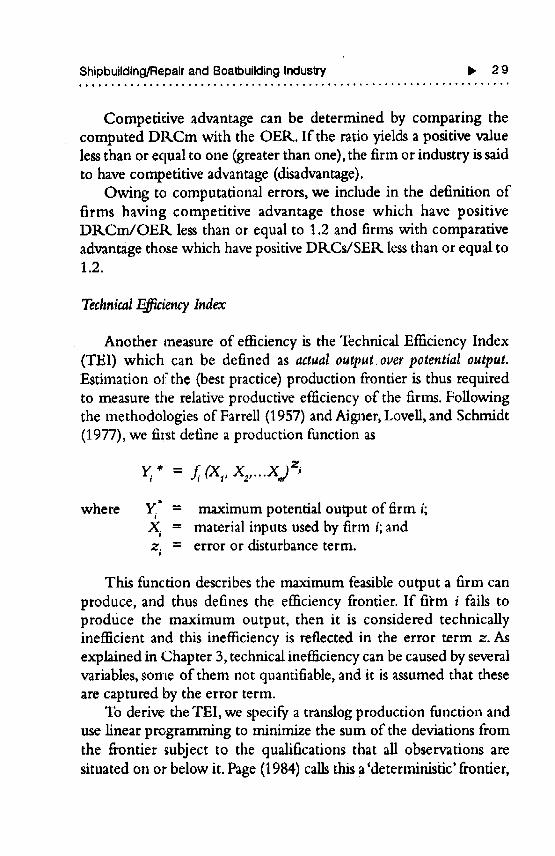
TechnicalEfficiencyIndex
Another measure of efficiency is the Technical Efficiency Index(TEl) which can be defined as actual output over potential output.Estimation of the (best practice) production frontier is thus requiredto measure the relative productive efficiency of the firms. Followingthe methodologies of FarreU (1957) and Aigner, LoveU,and Schmidt(1977), we first define a production function as
, = f, cx,,x2,..xj =,
where Y_" = maximum potential output of firm i;X = material inputs used by firm i; andz_ = error or disturbance term.
This function describes the maximum feasible output a firm canproduce, and thus defines the efficiency frontier. If fii:m i fails toproduce the maximum output, then it is considered technicallyinefficient and this inefIiciency is reflected in the error term z. Asexplained in Chapter 3, technical inefficiency can be caused by severalvariables, some of them not quantifiable, and it is assumed that theseare captured by the error term.
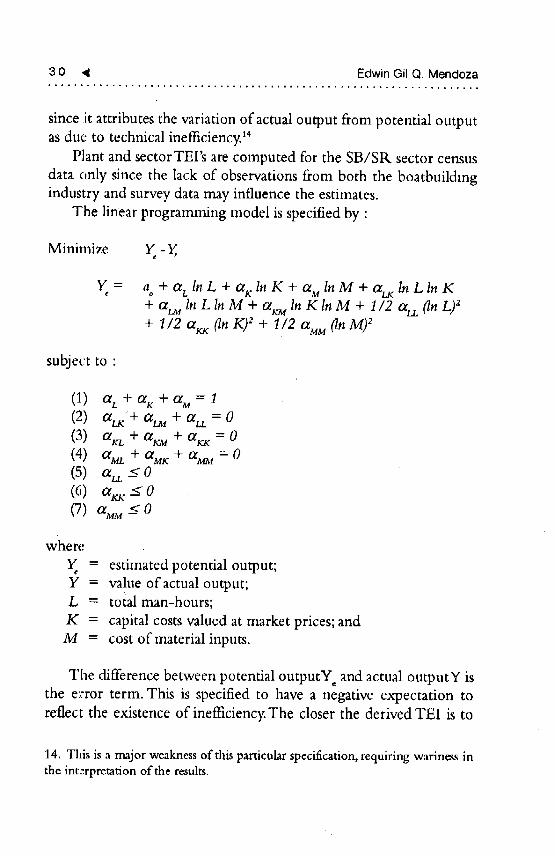
To derive the TEl, we specify a translog production function anduse linear programming to minimize the sum of the deviations fromthe frontier subject to the qualifications that all observations aresituated on or below it. Page (1984) calls this a'deterministic' frontier,
3 0 ,11 Edwin Gil Q. Mendoza
since it attributes the variation of actual output from potential outputas due to technical inefficiency.1_
Plant and sectorTEI's are computed for the SB/SP,, sector census
data only since the lack of observations from both the boatbuildingindustry and survey data may influence the estimates.
The linear programming model is specified by :
Minimize Y - Y,
Y = ao+ a LIn L + a KIn K + a MIn M + ct_ In Lln K+ ctLuln L ln M + Ctr_ In K ln M + 1/2 au, (In L)z+ 1/2 err,x (InK)2 + 1/2 aMM(InM)2
subject to:
(1) aL+ar+aM=l(2) a_'+ a_ + at,, = 0(3) arL + ar._ + a_ = O(4) aML+ %_:+ a,_ =0(5) a,, _<0(6) a_ _<o(7) aMM_<0
where
Y = estimated potential output;Y = value of actual output;L = total man-hours;
K = capital costs valued at market prices; andM = cost of material inputs.
The difference between potential outputY and actual outputY isthe error term. This is specified to have a negative expectation toreflect the existence of inefficiency.The closer the derived TEl is to
14. This is a major weakness of this particular specification, requiring wariness inthe interpretation of the results.

Shilobuilding/Ret)aJrand BoatbuildingInduslry i_ 3 1
one, the nearer the plant is to the frontier, and hence the moreeffcient it is. The criterion that plant TE'rs in the 75 to 100 rangeconstitutes technical efficiency is followed here.
PartialProductivityand Factor-IntensityIndicators
Factor intemity
The capital-labor (K/L) ratio measures the capital intensity ofdomestic production in a given year. It is constructed by adding therephcement costs of production machinery and equipment, buildings,and transport equipment, then deflating it by the appropriate priceindex for the current year.The denominator L refers to the actualnumber of workers for the current year.
The data tbr total employment for 1983 is obtained by subtractinghomeworkers from the total employees.The figure for 1988 is alreadyadjusted for homeworkers.
Factor productivity
Partial factor productivities are given by the ratio of census value-added (CVA) to the number of workers (CVA/L) to indicate laborproductivity; and census value-added over the replacement costs ofcapital (CVA/K) to indicate capital productivity. K and L are definedsimilarly _/bovewhile CVA is computed asvalue of output, minus thetotal of cost of raw material inputs, supplies, fuels, electricity, contractwork, industrial services done by others, and goods for resale. It isthen deflated by the gross national product (GNP) deflator for thecurrent year to adjust for inflation.
Other partial productivity measures included in the study are valueof output per capital (VO/K) and value of output per worker (VO/L).Output values (3/0) are deflated by the GNP deflator for the currentyears.

3 2 ,11 Edwin Gil Q, Mendoza..... • ......... _ ........................................ ..4 .........
MAILK_T STRUCTURE INDICATORSAND PROFITABILITYMEASURES
All measures described here are computed at the plant andindustry levels.
ConcentrationRatios
Two measures of concentration are computed, 4_PlantConcentration Ratio (CtL-4) and the Herfindahl Index (HI). TheCR-4 measures the total shares of the four largest plants in the sectorin terms of value-added and product sales.On the other hand, the HIgives an indication of how dispersed the plants are within an industry.It is defined as the sum of the squares of the market shares of all plantsin industry i in terms of value-added and sales.Thus,
/--/,= Xs,,Y
overj = 1 ... n plants in industry i.
A CR-4 ratio higher than 60 percent and an HI value far from the1/N ratio imply that the industry is highly concentrated, which mayor may not indicate oligopolistic power, depending on the perceivedreasons for such indices. HI is preferred over the CR-4 index becausethe former takes into account the variations in size structure between
plants and the total number of plants in the industry (Lee 1984).Concentration ratios are measured for small and medium plants as
one group, and large plants as another group, since industry sourcesexplain that both groups cater to different markets. Large shippinglines and foreign vesselsare serviced by the large shipyards, while smalldomestic ships are serviced by the small and medium repair yards.
Pr_tability
The price-cost margin (PCM) is used here to indicate the relativeprofitability of the different plants. PCM is derived by subtracting
Shipbuilding/Repair and E_atbuilding Industry P, 3 3.....****., ..... , ....... . ............. . ....... "°" ..... • ............. ,*
compensation from census value-added over the value of output.Hence,
CensusValue-Added- CompensationPrice.CostMargin =
Valueof Output
DISCRIMINANT ANALYSIS
One way of identifying which industry characteristics andvariables are closely related to efficiency indicators is through the useof discriminant function analysis. The analysis basically tries tostatistically differentiate between two groups, i.e., phnts with positiveDtkC/SER_less than or equal to 1.2, and the rest, with respect toparticular ._riables. The Canonical discriminant function thusidentifies the most important variables which can discriminatebetween the efficient and the inefficient plants,is
Among the industry characteristics which might effectivelydiscriminate between efficient and inefficient plants are the following:
• PartialFactorProductivities.CVA/L and CVA/K are theorized to
have positive imPacts on efficiency, as plants are able to producemore based on the intensive use of their resource endowments.
• Capital Intensity. The relationship is hypothesized to be positivesince the use of more capital-intensive techniques will speed upthe production processes as well as provide quality results.
• Plant Size. The link is not clear since small and large SB/SR.plants cater to different customers (i.e., in terms of ship size).However, the nature of competition faced by small and large plantsdiffer for the SB/StL sector so that small plants are expected to bemore efficient.
15. See Hill and Kalirajan (1991) for a clear exphnation and example of anapplication of this technique.

34 ,q EdwinGilQ Mendoza............ .°, .............. , ................................. , ....
• I_'ice-CostMargin. The relation is presumed negative since plantswith high PCMs tend to have oligopolistic powers and have noincentive to perform efficiently.
• Dummy Variables.
a) Legalorganization"1" means plant is a single proprietorship; "0" means otherwise.
A firm or plant which is managed by yard owners tends toperform inefficiently as no room for advancement exists for otherpersonnel.
b) Periodof Operation"1" means plant has been operating since 1983; "0" meansotherwise.
This durruny variable serves to ascertain whether entrants afterthe trade reform program are more efficient or not.
Discriminant analysis therefore aims to weigh and linearlycombine these discriminating factors in such a way that the twogroups are forced to become as distinct as possible. The analysistheretbre comes up with one or more linear combinations of thesevariables of the form
D, = dt,Z 1 + d,.,Zs +... p
where
D_ = score on discri_rfinant function I;d = weighing coefficients; andZ = standardized values of the p discriminating variables used in
the analysis.
For this study, the statistical gauges, which are used to determinewhether the discriminant function can distinguish the two subgroups,
Shipbuilding/Repairand BoatbuildingIndustry I_ 3 5
are: low Wilk's lambda and the canonical correlation coefficient(CCC). The CCC is interpreted in a similar manner as the K2 instandard ordilaary least squares (OLS) regression analysis,while a lowWilk's lambda indicates that the functions are reliable for
discriminating between the two subgroups.To determine the relationship between the variables and the two
subgroups, efficient and inefficient, the mean of the two subgroups iscompared to the values of the coefficients of the variables.The closer
the value of the variable is to the value of the subgroup mean, themore related that particular variable is to the subgroup. This impliesthat variables with values closer to the mean of the efficient subgroupis directly related to efficiency and vice-versa.
The discriminant function was applied to a single set of plant-levelobservations for both SB/SR. and boatbuilding sectors. Since CVA/Kand CVA/L are correlated, two equations are made, one for each ofthese variables.

5
.. Industry Background
AN overview of the prevailing economic situation of the shipbuildingand ship repair sector is presented first, followed by that of theboatbuilding sector. The final part describes the industrial and wadepolicy environment encompassing the two sectors.
A. SHIPBUILDING AND SHIP REPAIR INDUSTKY
The shipbuilding industry refers to the sector involved in theconstruction, launching, and outfitting of watercrafts, while the shiprepair industry deals with the overhaul, improvement, alteration, andreconditioning of water vessels (PDCP 1972).
Structure
Table 1 summarizes the composition of the Philippine SB/SRindustry which was comprised of152 firms in 1992 (Marina AnnualReport 1992). A significant component of the subsector is the ShipRepair Afloat (SR.A), composed of 57 small enterprises, whichprovides mainly manpower services to shipping lines and toshipbuilders and repairers. During the 1985 to 1992 period, there wasa general increase in the number of Marina-licensed firms involved in
ship repair, combined shipbuilding and ship repair and shipbuildingoperations. Tables 1 and 2 show markedly different figures becauseTable 1 (from Marina) includes small and large firms while Table 2(from NSO) includes plants or firms employing more than fivepersons.

3 8 4 EdwinGilQ. Mendoza
I I I
Table1
Ue_tsedShipbuildingandShipRepairCompanies:1985-1992
TypeofOperationorLicense NumberofCompanies1985 1989 1992
Shiprepair 22 84 92*Shipl_ilding 1 3 3Shiprepairandshtp_Jikling 18 38 57
Total 41 125 182
*APl_mately57firmsareclassifiedasShipRepairMoat.
Source:MARINAAnnua/Repode,19,8S,IggO,1992
Table2
Indusl_/Composition:1972.1988
Typeof OperaUons Numberof Plants1972 1978 1978 1983 1988
Shipbuilding 9 59 14 15Boatlouilding 9 10 10 4 6Shipl_Jildingandrepair 23 38 6 18 31
Total 32 57 75 36 52
$ouroe; Census of Estab//shments, Censal Years 1972-1988. National Statistics Office,
I
Shipbuildlng/Repairand BoatbuildingIndustry I_ 3 9
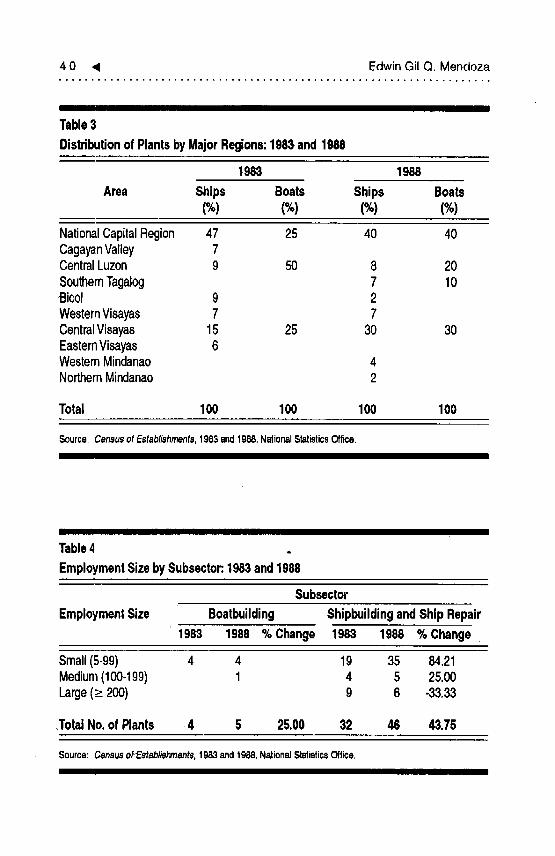
in terms of employment size, the number of small and me,dium-sized plants increased over the 1983 to 1988 period, while the numberofhrge plants decreased (Table 4). Share of small or medium phnts inaggregate output increased by 60 percent, while that oftbe large plantsdecreased by 14 percent.
Ownership structure
The large shipyards in the country are mainly joint ventures withforeign nationals.The largest shipyard,Subic Shipyard & Engineering,Inc., formerly PHILSECO, is owned by a consortium of Philippineenterprises and some Japanese and Singaporean multinationals, whilethree other hrge shipyards are subsidiaries ofa Singaporean company.Some of the medium- and smaU-sized firms are owned by localshipping companies which use them to service their own shippingvessels.
Location
Table 3 shows that most shipyards are concentrated in MetroManila and Cebu.Together, these two areas constituted 69 percent ofall plants nationwide in 1988. Other hrge shipyards are located inBatangas, Zambales and Bataan although their head offices are inMetro Manila. The geographical compactness of the sectors can beattributed to the availability of"raw materials and supplies in thesetrade centers which can affect significantly the efficient delivery ofservices by the yards.
Level of Competition
As an approximation of the level of intra-industry competition,concentration indices, in terms of value-added and total revenues, aremeasured for 1983 and 1988 (Table 5).The concentration measures(CR.-4) incrvased during this period reaching 63 percent, which isslightly greater than what is considered as a high degree ofconcentration (60 percent). Moreover, the equivalent numbers
4 0 ,i EdwinGil Q. Mendoza
I
Table3
DistributionofPlantsbyMajorRegions:1983and1988
1983 1988
Area Ships Boats Ships Boats(%) (%) (%) (%)
NationalCapitalRegion 47 25 40 40CagayanValley 7CentralLuzon 9 50 8 20SouthernTagalog 7 10Bicol 9 2WesternVisayas 7 7CentralVisayas 15 25 30 30EasternVisayas 6WesternMindanao 4NorthernMindanao 2
Total 100 100 100 100
Source: Censusof Establishments,1983and1988,NationalStatisticsOffice.
Table4
EmploymentSizebySubsector:1983and1988
Subsector
EmploymentSize Boatbuilding ShipbuildingandShipRepair
1983 1988 %Change 1983 1988 %Change
Small(5-99) 4 4 19 35 84.21Medium(100-199) 1 4 5 25.00Large(>__200) 9 6 -33.33
,TotalNo.of Plants 4 5 25.00 32 46 43.75
Source: Censusof Establishments,1983and1988,NationalStatisticsOffice,

Shipbuilding/Repairand BoatbuildingIndustry I_ 4 1
III I II
TableS
ConcentrationRatiosbySubsector.1983and1988
Subsector
ConcentrationRatios Soatbuilding ShipbuildingandShipRepair1983 1988 %Change 1983 1988 %Change
a. Conoanbationratio4Totalrevenues 1.00 0.97 -2.90 059 0.63 6.12Censusvalue.added 1.00 1.00 0.00 0.56 0.62 12.53
b.HerfindahlIndexTotalRevenues 0,90 0.45 .50.49 0.12 0.14 23.16Censusvalue-added0,85 0.79 -7.01 0.10 0.12 18,26
l/N* 0.25 0.2 0,03 0.02
* TheHIwillequalthisvalueifallfirmsinthesectorareapproximatelyofthesamesizes.
Source:ComputedfromtheCensusofEstablishments,1983and1988,NationalStatisticsOff'me.II I I1! IIIIIIII I I III
derived from the Herfindahl Indices, i.e., l/H, indicate that in 1983,
the industry was about as concentrated as an industry with only nine
equal-sized firms, although there were really 32 firms. 16This could
mean that few large shipyards have control over the market but as
pointed out by Porter (1990), the reason for the concentration is a
more important factor in explaining the degree of intra-industry
competition.As will be pointed out later, the industry is characterized
by market segmentation. Large shipyards cater to large ships, whilemedium and small yards service the smaller vessels. Thus, it is not
certain whether the large firms exercise oligopolistic powers based onthe measures used here.
Production Activities
Current shipyard activities are focused on repairing and
drydocking _ratercrafts with the existing supply less than the demand
16. The author wishes to acknowledge Dr. E. Patalinghug for his commen_sregarding tiffsmatter.

4 2 _1 Edwin Gil Q. Mendoza
for yard work. A 1990 BOI study ascertains that there is an averagewaiting period of 2 1/2 months for drydocking. Small- and medium-sized firms concentrate on domestic ships,which are generally small,while large firms cater to both foreign and domestic vessels.Construction of small vessels is done by very few shipyards and onlyoccasionally. Ship construction and repair activities use the sameequipment and supplies so that most shipbuilders also engage in repairoperations.
There is clearly economies of scale in ship production since thesurface area of a ship does not increase in direct proportion to itsvolume.That is, a 200,000 deadweight tons (dwt) can carry ten timesthe cargo of a 20,000 dwt ship although the former is only abouttwice as long as the latter (Patahnghug 1994). Because constructioncosts are tied to surface area and not to volume, such costs are reduced
for large vessels.Moreover, engine size and complexity of machinerydo not increase dramatically in proportion to the size of the shipleading to power efficiency for large vessels.
Technology
Present technological capabilities are limited to constructingvessels below the 5,000 dwt range while repair capacities reach up tothe 10,000 dwt to 300,000 dwt range. Seven shipyards account forapproximately 82 percent of the overall capacity Of 570, 153 dwt(Appendix 1) while only 32 firms (or 21 percent of all firms) havedrydocking facilities. The other firms are small repair firms whichservice the sman inter-island vessels using manpower and smallmachine shops.Although ship repair is relatively more labor-intensivethan shipbuilding, current techniques used by local shipbuilders arelabor-intensive, which has prolonged the construction time of thesesmall vessels. Foreign tie-ups have been important channels forinfusing new technology into the industry by way of capitalinvestments and foreign technical personnel. Leverage International(Consultants) Inc. (1990) assessed that the large shipyards lead theindustry in terms of technology but, in general, local technology stilllags behind that of other countries.
Shipbuilding/Repair and Boatbuilding Industry Ii, 43
Market Orientation
Demand for vessels depends on the growth of the country'smerchant fleet (Marina Development Plan for Maritime Industry1988).Thus, domestic shipbuilding and ship repair activities are closelyintertwined with the sectoral requirements of the shipping industry.The major market of the SB/SR firms is the different shippingcompanies. Local shipbuilders must necessarily compete with foreignshipyards in getting the orders of the shipping companies.
Local shipping companies continue to source their bottoms fromthe foreign market of used vessels,mostly from Japan, resulting in theconcentration of shipyard operations on ship repair, as in previousyears (FookienTimes PhilippinesYearbook1991).
B. BOATBUILDING INDUSTRY
The boatbuilding subsector deals with the manufacture ofwatercrafts having gross tonnages of less than 3 gross registered tons(grt). Most of the boat manufacturers' products are fiberglass-reinforced plastic (FRP) boats, yachts, and other vessels for both
domestic and export markets. Some of them also import outboardengines and engage in boat repairs.
Structure
The actual number of boatbuilders, most of which are singleproprietorships, is not known since they are not required to registerwith Marina or any government agency. In 1992, there were at leastsix boatbuilders belonging to the Boating Industries Association ofthe Philippines (BIAP) located in Metro Manila and Cavite, althougharound three foreign-owned companies were also in Cebu andBataan. The boatbuilders in Bataan are located in the export-processing zone, giving them access to duty-free raw materials andequipment. Over the 1983 to 1988 period, new hoatbuilders enteredthe sector, signifying an expansion of activities (Table 2).
4 4 4 Edwin Gil Q. Mendoza
Level _ Competition
The sector is highly concentrated as shown by the large differencebetween the HI measures of.45 and .79 and the ratio 1/N or .16.17
The computed 1/H for this sector shows that although there werefour boat manufacturing firms in 1988, the equivalent numbers revealthat the industry is as concentrated as if only one firm existed then.There was, however, a substantial decline in the concentration indexduring the 1983 to 1988 period, indicating an improvement in thelevel of competition faced by the incumbent firms.
ProductionActivities
Local boatbuilders produce boats with sizes ranging from 8 to 100feet although the bulk of commercial production is on the 8- to 30-footer pleasure crafts. Much of the production activities revolvearound motorboats and sailboats,with the latter comprising the majorvolume of production. Current manufacturing activities include FR.Pboats or speedboats, and wood power boats.
Technology
The construction of boats in the local industry is generally a labor-intensive activity with skills in sculpture and carpentry as importantrequirements.The production of boats does not require graving docksor building berths. It does not require immediate access to rivers orseas although it would be an added advantage to the manufacturer tobe located near bodies of water. There are virtually no significantstructural barriers existing within the industry.
Market Orientation
Since pleasure boats are generally considered luxury items, foreignvisitors or residents and the local elite are the primary customers.
17. An explanation for the 1/n rule of thumb is that, if the firms are of equal sizes,then the HI is closer to the 1/n value.
Shipbuilding/Repair and Boatbuilding Industry I_ 4 5
Other buyers include resort owners and boat racers. Income and priceelasticities of luxury items such as these products are high, makingtheir demand susceptible to changes in the overall economic andpolitical climate. Thus, the 1989 political problem of _the countryadversely affected_the sales of the local manufacturers.
The high demand for quality sea transport in the archipelago hasled some boatbuilders to diversify into seacrafts which are for ferryingpassengers between islands.The latest of these is the Supercats, a 280-seater catamaran targeted for plying the Bacolod-Iloilo route (BusinessDay, February 3, 1993).
A major reason for the preference of some local builders for FR.Pboat production is its great demand in the international market. Sincethe early 1980s, domestic boatbuilders have been exportingtocountries like the United States,Japan, and Guam.
GOVE_q_mNTPOLICIES AND PROTECTION INDICATORS
Government assistance and regulation of the sector becameintensive in the early 1970s as the government realized the need tomodernize the domestic maritime fleet.
SectoralPolicies
The 1968 Investments Priorities Plan of the Board of Investments
03OI) proffered numerous incentives such as accelerated depreciation,tax credit on domestic capital equipment, and pre-operating taxexemptions t3 the sector (Appendix 2). Capacities of local shipyardswere increased to accommodate the growing domestic fleet. TheMaritime Industry Authority (Marina) was established in 1974 toregulate and monitor the sector as well asadminister the tax incentivesunder Presidential Decree (P.D.) 666. All domestic shipyards wererequired to acquire licenses from Marina before they could operate.Financial assi.,,tancewas made-available mainly through loans from theWorld Bank and the Development Bank of the Philippines (DBP).However, incentives were not only granted to local shipyards but also
4 6 ,q EdwinGilQ.Mendoza
to the shipping sector. Such laws allowed local shipping lines access tolow cost imported used vessels to the detriment of local shipmanufacturers. As a result, local shipyards concentrated on ship repairactivities. Being a subsector of the SB/SR industry, the boatbuildingsector was also entitled to these benefits, but only a few boatbuildersavailed of these incentives.
The worldwide econotnic recession of the early 1980s and thecapital flight experienced by the country in 1983 led to the adoptionof stabilization policies which included measures aimed at reducingthe balance of payments and government budget deficits. Thus, theincentives under PD. 666 were removed in 1984, which adverselyaffected the costs of shipyard operations, especially since 70 percent ofraw material requirements are imported.Although MARINA revivedthese incentives in 1986, they were rescinded again after a few monthsby a ruling of the Department of Finance pertaining to foreignexchange problems.
At present, shipyards having capacities of 10,000 dwt and aboveare granted "pioneer" status, and those which locate outside MetroManila are entitled to several incentives under the 1987 Onmibus
Investments Code of the BOI. As of this writing, there is also a billpending in the Senate which seeks to restore the duty and tax-freeincentives formerly granted under P.D. 666. Again, the boatbuildingindustry can also avail of these incentives provided they meet thecriteria set by the BOI. One common incentive for both sectors is theduty drawback system, which entitles exporters reimbursement oftheir import duties.
Recent policy changes in the shipping sector which might affectthe SB/SP,. sector include the deregulation of shipping routes and therequirement that allvesselsbe classedby an internationally recognizedclassification society. Many studies have made the observation that
one of the root causes of the inefficiencies in the shipping sector hasbeen the regulated shipping rates and routes which have rendered theactivity uneconomical.The artificially-low freight rates have made thebusiness unprofitable so that only the ineumbent firms, which controlvarious routes, could operate with profits (Nathan &Associates 1991).The recent deregulation policies implemented by the government
/
Shipbuilding/Repair and Boatbuilding Industry _ 4 7
may help increase the efficiency of the shipping sector, which mayindirectly prove helpful to the SB/SR sector as well.
TariffR_orm Program
In 1978, tariff rates for ships and boats ranged from 10 to 30percent with an unweighted mean of 21 percent. The 1981 TariffReform Program (TRP), which aimed at an equal tariff protectionsystem for all products, resulted in a 30 percent tariff rate increase forships and 37 for pleasure boats (Appendices 5 and 6). Pleasure craftsare levied higher tariff rates than ships because they are considered asluxury items. Over the 1983 to 1988 period, tariff rates for ships andboats did nm change. For reasons of quality and safety, used vesselswere charged higher tarif_ than new vessels.
A slightly different situation occurred for the tariff rates of theirmaterial inputs. Table 6 indicates a notable decline in nominalprotection for the material inputs ofboatbuiiders from 27.88 percentin 1983 to only 22.87 percent in 1988.That of ship manufacturersand repairers, however, decreased slightly to 15.6 percent in 1988from 15.7 percent in 1983.The sharp reduction in the tariff rates offiberglass, resin products, and building boards of wood were the majorreasons for the decline in nominal tariff rates for boatbuilders. On the
other hand, the small reductions in the tariff rates of sheet pilings ofiron or steel and transmission apparatus for navigational use led to thelowering of protection for the material inputs of the SB/SR sector. Inthe 1983 to 1988 interval then, there was no change in the level oftariff protection for the outputs of the two sectors, althoughprotection of their inputs declined.
In July 1991, another major tariff rationalization scheme waseffected which further reduced the tariff rates for water vessels to the
3 to 10 percent range. Tariff rates for pleasure boats, however, wereinitially increased to the 50 percent level in 1991, but decreasedgradually to 30 percent in 1995. While the tariff structure forboatbuilders remained basically the same, i.e., higher rates for outputsthan for inputs, nominal protection for the SB/SIL sector underwenta drastic reve:_al: nominal protection for inputs of 15.14 percent but

Table6 ._ProtectionIndicatorsbySubsector9np.er,-.,ent) •
Subsectors
Boatbuilding "Shipbuilding/ShipRepair1983 1986 1988 1991 1983 1986 1988 1981
OutputsNominaltariffs(Average) 37 37 37 50 30 30 30 6.5Implicittariffsfor
importsubstitutes(Nj) 54.12 64.4 50.7 65 46.25 56 43 15,78ImplidtTariffsforF_xportables 0 0 0 0 0 0 0 0InputsNominaltanffs(weightedby
productioncoeffidents) 27.88 22.87 22.87 16.26 15,7 15.6 15.6 15.14Implicittariffs(Ti) 43.87 47.45 35.16 27.89 30 38.69 27 26.65Averageimplicittariffrates
onoutputs* 44.6 33.04 21.65 28.15 41.54 29.66 29.66 5.21Averageimplicittariffrates
I-I1oninputs* 27.88 22.87 22.87 16.26 15.56 15.58 15.45 15.14 o_
Effectiveprotectionrate(EPR) 59.48 43.05 20.23 42.86 50.47 36,92 34.75 1.74 -_-_Neteffectiveprotectionrate
(NEPR) 27.58 14.44 -4.58 1429 20.37 9.54 6.94 -18.61 o
* Thesetariffratesareaveragesoftheimplicittariffratesonimportsubstitutesandtheimplicittariffratesonexportablegoods."-zCL
Source:.TariffsandCusfornsCodeof_he.Ph_Tipl_nes,1982-1991.Tap;ffCom_ssion. N°
Shipbuilding/R6pair and Boatbuilding industry I_ 49
only 6.5 percent for outputs. These changes meant an increment inprotection for boatbuilders but a drastic decrease for the SB/SR
sector.
Import LiberalizationProgram
A complementary policy of the TRP is the Import LiberalizationProgram (II,P) which worked for the removal of quantitativerestrictions on imported items.While pleasure crafts were liberalizedin 1986, new ships and other vessels subjected to quantitativerestrictions since 1977 were only liberalized in 1989. In consonancewith the TRP, used vesselsare still included in the List C of RestrictedItems (i.e., items for continued regulation) for reasons of quality andsafety (Appendix 7). MARINA officials assert that importation ofused vessels have to meet particular age and size requirements toensure their seaworthiness (MARINA Memo Circular 25-D).
The observed rise in nominal protection for the boatbuildingsector described in the preceding section can be interpreted as the"tariffication" of the quantitative restrictions for pleasure crafts whichwere removed in 1986.
As for the material inputs, the steel requirements of the SB/SRsector were gradually liberalized from 1986 to 1988 while radionavigational instruments were only liberalized in the latter part of1988. Outboard engines used by boatbuilders were liberalized in1989. Most of the maj or inputs of both sectors were liberalized duringthe ILP,which may prove helpful, especially since local manufacturersstill do not have the technology to manufacture these materials.
ProtectionIndicators
A more rele_iant indicator of the protection given to the domesticsectors is the EPR, which considers protection for both inputs andoutputs.
In 1974, the EPR of both sectors averaged 26 percent which issignificantly lower than the manufacturing average of 44 percent(IPPP 1979). Although the EPRs for ships and boats increased to
5 0 i Edwin Gil Q, Mendoza
50.47 percent and 59.48 percent, respectively_these declined duringthe period 1983 to 1988 as shown in Table 6. From an EPR of 59.48percent in 1983, the boatbuilding sector's EPR went down to 20.23percent in 1988, even lower than that of the SB/SR sector's figure of34.75 percent. These results may prove puzzling, considering that nochanges in nominal tarif_ occurred during the period 1983 to 1988.Moreover, implicit tariff rates (and hence, EPRs) changed because ofthe removal of the 25 percent markups over cost, insurance, freight(CIF) import prices which prevailed in 1983.A reason for these resultscould be the fact that both sectors were exporting their products sothat the "actual" tariff rates which these sectors faced were an averageof their products' implicit tariff rates and that for exports, which isequal to zero. Table 6 shows these averageimplicit tariff ratesfor bothoutputs and inputs using census data. Although the average implicittariff rates for the inputs of the boatbuilders decreased to 22.87percent in 1988 from 27.88 percent in 1983 (which meant higherprotection), its outputs' average implicit tariffrates declined sharply to21.65 percent resulting in the low EPR. In the case of the SB/SRsector, its outputs' average tariff rates also declined drastically from41.54 percent in 1983 to only 29.66 percent in 1988. But its inputs'average implicit tariff rates hardly changed, resulting in a smaUdeclinein EPR from 55.10 percent to 36.28 during the 1983 to 1988 period.
Table 6 also gives the sectoral net EPRs (NEPRs) which indicateprotection to domestic plants or sectors afforded by the tariff or taxsystem without the disincentive effects of the overvalued currency(IPPF 1979).Adjusting the EPR values for the currency overvaluationsignifies that the protection levels actually enjoyed by the two sectorswere really low. From 1983 to 1988, NEPR for the boatbuildingsector was reduced from 27.58 percent to only -4.58 percent, whilethat cf the SB/SR sector became 6.94 percent from 20.37 percent.These results imply that the boatbuilding sector was actually beingpenalized by the tariff system as shown by its negative NEPR.
EPR estimates for 1986 and 1991 were made using the industrystructures of 1983 and 1988 respectively.The implicit assumption hereis that the industrial structure was not altered during these years.Table6 rew._alsan increase in protection for the boatbuilding sector from
Shipbuilding/RepairandBoatbuildingindustry I_ 5 1
20.23 percent in 1988 to 42.86 percent in 1991. The 1991 figure,however, is slightly lower than the 1986 figure of 43.05 percent. Onthe other hand, the SB/SR sector experienced a tremendousreduction in tariffprotection from 36.92 percent in 1986 to only 1.74percent in 1991.The main reason for these changes is that there was areduction in output tariff rates from an average of 30 percent in 1986to 6.5 percent in 1991 for the SB/SR sector, and an increase from 37to 50 percent for the boatbuilding sector.Tariff rates on the inputs ofthe SB/SR sector hardly changed, although that of the boatbuildingsector declined from 22.87 to 16.26 percent.
Looking at the NEPRs, one finds that the SB/SR sector isreceiving negative protection while the boatbuilding sector is stillreceiving protection. The 1991 TRP therefore increased the tariffprotection received by the boatbuilding sector, while it reduced thatof the SB/SR sector. How these trade policy developments will affectthe performance of the firms will be discussed in the next chapter.
6,m# • # ## # o_,Q # • Q# #i i B.i..amlooaao_
Industrial Performance.
D_.V_LOPM_N'rSin the industry from 1972 until 1991 are examined inthis chapter with much of the discussion focusing on the 1983 to1988 adjustment period.
GROWTH INDICATORS
Imports
Imported vessels, especially second-hand vessels, have been themain bulk of the Philippine Maritime fleet. In the 1970s, importationof second-hand vesselswas given added impetus through governmentincentives in order to replace the old domestic fleet. Despite importrestrictions in 1977, the share of used vessels in the total value ofsectoral imports even increased from 15 to 90 percent in 1978 (Table7 and Figure 1).
In 1984, the government instituted the policy of bareboatchartering as an alternative to the purchase of the ship users' vesselrequirements. This further biased the shipping lines from procuringnew ships locally, and instead, they opted for the less expensivesecond-hand vessels. For the succeeding years, importation of newships declined. Even with the implementation of Executive Order226 in 1987 providing incentives to individuals who procured vesselsabroad, and even with the lifting of quantitative restrictions onimported new vesselsin 1989, used vesselscontinued to dominate thecountry's ship imports. As shown in Table 7, the country's importationof vessels in 1990 in terms of quantity were accounted for by used
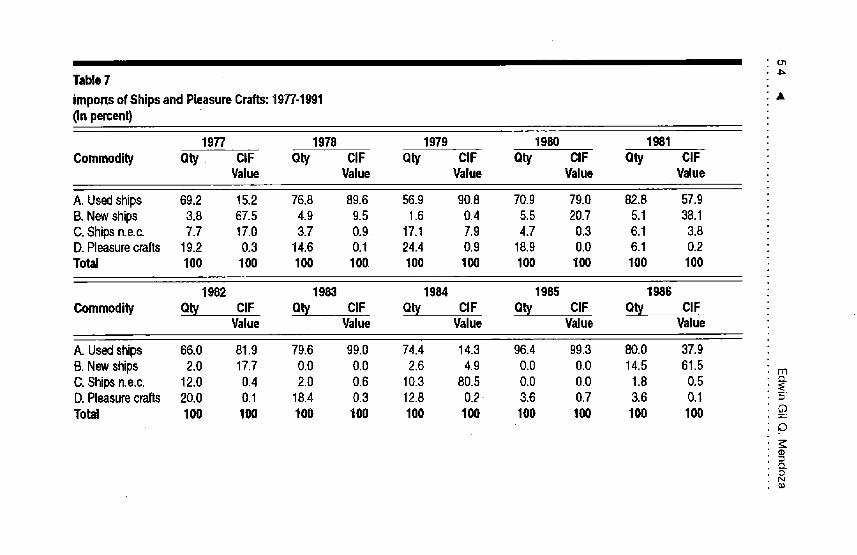
Talde7
importsofShipsand PleasureCrafts:1977-1991 ,L(In percent)
1977 1978 1979 1980 1981
Commodity Oty. CIF Qty ClF Oty CIF Oty CIF Oty CIFValue Value Value Value Value
A. Usedships 69.2 15.2 76.8 89.6 56.9 90.8 70.9 79.0 82.8 57.9B.Newships 3.8 67.5 4.9 9.5 1.6 0.4 5.5 20.7 5.1 38.1C.Shipsn.e.c. 7.7 17.0 3.7 0.9 17.1 7.9 4.7 0.3 6.1 3.8D. Pleasurecrafts 19.2 0.3 14.6 0.1 24.4 0.9 18.9 0.0 6.1 0.2Total 100 100 100 100. 100 100 100 100 100 100
1982 1983 1984 1985 1986
Commodity Qty CIF Qty CIF Qty CIF Oty ClF Oty CIFValue Value Value Value Value
A. Usedships 66.0 81.9 79.6 99.0 74.4 14.3 96.4 99.3 80.0 37.9B. Newships 2.0 17.7 0.0 0.0 2.6 4.9 0.0 0.0 14.5 61,5 m
C. Shipsn.e.c. 12.0 0.4 2.0 0.6 10.3 80.5 0.0 0.0 1.8 0.5D.Pleasurecrafts 20.0 0.1 18.4 0.3 12.8 0.2 3.6 0.7 3.6 0.1 =Total 100 100 100 100 100 100 100 100 100 100
o
.D.oN'm,
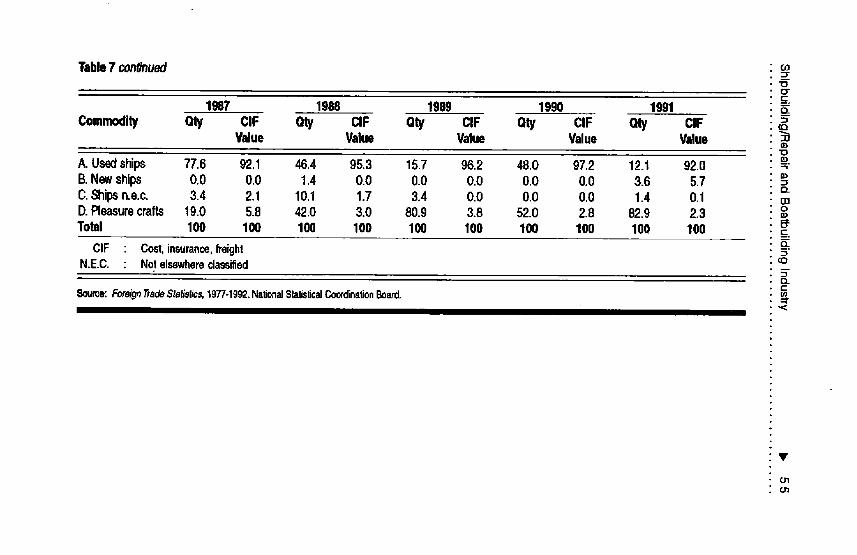
Table7 continued"0O"
1987 1988 1989 1990 1991Commodity Qty CIF Qty CIF Qty CIF Qty CIF Qty CIF _'_
Value Value Value Value Value"0
A.Usedships 77.6 92.1 46.4 95.3 15.7 96.2 48.0 97.2 12.1 92.0 _B.Newships 0.0 0.0 1.4 0.0 0.0 0.0 0.0 0.0 3.6 5.7 -_
EL
C.Shipsn.e.c. 3.4 2.1 10.1 1.7 3.4 0.0 0.0 0.0 1.4 0.1 mD.Pleasurecrafts 19.0 5.8 42.0 3.0 80.9 3.8 52.0 2.8 82.9 2.3 oTotal 100 100 100 100 100 100 100 100 100 100 5_
CIF • Cost,insurance,ImighlN.E.C. : Notelsewhereclassflied ©
5"EL=,-
Source: ForeignTradeSta_f/c,s,'1977-1992.NationalStalLsticalCoor_nationBoard,
V
O1O1
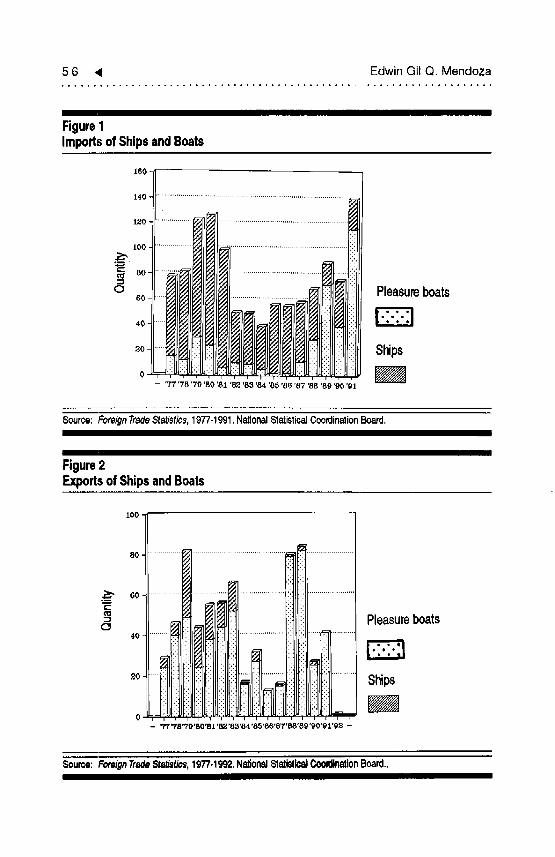
5 6 ,q Edwin Gil Q. Mendoza
Figure1Importsof ShipsandBoats
160
140 ]J'" ...........................................................................................
,2°............................................................................._1@1
100 - '............. -.....
._".
"_ 80- ...........
o _I Pleasureboats60
40
_o- Ships
0 i i . i i r , ! r i-- "1'7'78 '79 '80 '81 '8,,3'83 '84 '8_ '86 '87 '88 '89 '90 '91
Source: Foreign Trade Statistics, 1977-1991. National Statistical Coordination Board.
Figure2Exports of Ships and Boats
.tOO-
80-
Source: Foreign Trade Sta_etics, 1977.1992. National StatisticalCoordlnalion Board,,II Ill[l
Shipbuilding/Repairand Boatbuilding Industry It, 5 7
vessels (97 percen0 and pleasure boats (3 percen0, is In contrast, theshare of new vessels in the total volume of vessel imports rose only by
6 percent from zero in 1989.Pleasure craft importations comprised a minor role in the
country's volume of water vessel imports in the 1970s. But thisdecreased further with the 1981 TILP as tariff rates on these items
were raised by an average of 42 percent.The economic crisis in 1983further decreased demand for these luxury goods and only with theeconomic recovery in 1'986 did imports begin to rise anew.Anotherreason for the increase could have been the removal of quantitativerestrictions (QP,s) in the same year.
The protection structure seemed to have a minimal effecton theimportation of ships, although it contributed effectively in curtailingpleasure boats importation.
The reduction in tariffrates for some items, considered as material
inputs, seemed to have increased their importation. Importation ofsome steel materials, such as hot-rolled metal plates and steel bars(majority of which are used mainly by the SB/StL industry) showedincrements afi:erthese were liberalized in 1988. But in 1990, importsof these items declined by 37 percent which can be ascribed to thepolitical and natural calamities experienced by the nation during theperiod and the ensuing Gulf Crisis.
Despite the removal of QRs for other material inputs, there wereno remarkable increases in their importations except for watercraftengines (used by both boatbuilders and SB/SR firms) which wereliberalized only in 1989.
Output
Value of output at constant prices for the entire shipbuilding, shiprepair, and boatbuilding industry grew at different rates over the 1972to 1988 period (Table 8).The oil price shocks in 1973 to 1974 causedoutput to fluctuate during the period. With the granting of severalincentives and government assistance to the sector starting 1975,
18. Figures refer to the share of these vessels to the total value of imported vessels.

5 8 4 EdwinGil Q. Mendoza
i
Table8
SubsectorShamsinTotalOutput,CensusValue-addedandEmployment:1972-1988
Subsectors IndustryYear Shipbuilding Bostbullding Aggregate
andShipRepair
ValueofOutput*%ofTotal %ofTotal
1972 99,589,000 94.65 5,634,000 5.35 105,223,0001975 14,368,138 86.46 2,250,000 13.54 16,618,1381978 44,157,968 98.44 701,771 1.56 44,859,7391983 114,127,014 99.63 423,622 0.37 114,550,6371988 96,871,047 96.75 3,253,810 3.25 100,124,857
CensusValue-added*1972 81,270,000 96.63 2,835,000 3.37 84,105,0001975 32,705,251 77.16 9,679,594 22.84 42,384,8451978 181,143,523 99.35 1,182,199 0.65 182,325,7221983 54,701,118 99.79 112,441 0.21 54,813,5591988 42,063,051 98.40 681,904 1.60 42,744,955
TotalEmployment1972 4,769 88.84 599 11.16 5,3681975 4,102 83.68 800 16.32 4,9021978 12,017 98.17 224 1.83 12,2411983 5,432 99.32 37 0.68 5,4691988 4,82493.15 355 6.85 5,179
*Baseyear= 1972
Source:CensusofLargeEstablishments,CensalYears1972-1988,NationalStatisticsOffice.

Shipbuilding/Re'pairandBoatbuildingIndustry i_ 59
output composition changed. From nine shipbuilders in 1975, thenumber jumped to 31 in 1978, contributing 43 percent of totaloutput. Despite these incentives, there was no change in the numberofboatbuilders, and their output even decreased by 49 percent duringthe period 1975 to 1978.
With the foreign exchange controls in 1983 and the lifting ofincentives in 1984, declines in shipbuilding projects occurred (Table9).The worldwide recession and the stiff competition offered by thesecond-hand market for ships also contributed to the decline. Facedwith the foreign exchange controls and slowdown in productionactivities resulting from the depressed demand for new ships, severalshipyards shifted to ship repair activities. Despite the economicrecovery in 1986, no resurgence in building activities surfaced sincedemand for ships was adequately met by used vessels from Japan.Growth in the sector's output was mainly due to repair activitieswhich, because of the aging domestic fleet, flourished rapidly. In1988, approximately 97 percent of the sector's output was contributedby SB/SIL firms. Although the boatbuilders' share in industry outputWasonly 3 percent in 1988, they experienced a 670 percent increaseduring the period 1983 to 1988.
Census Value.Addedand Employment
Value-added ana employment indicators during the 1972 to 1988interval reveal varied trends basically analogous to the entireeconomy's growth pattern.As the economy picked up in 1988, theboatbuilding subsector increased its census value-added (CVA) fromPl12,441 in 1983 to P681,904. However the SB/Stk sector's CVA
decreased from P54,701,118 to only P42,063,051 (Table 8). In spiteof the remarkable increments in the boatbuilding sector's value-added,its share in aggregate industry CVA remained low (0.37 percent in1983 and 3.25 in 1988):The employment situation showed a similarpattern with the boatbuilding sector's share in total industry workforceincreasing from 0.68 to 6.85 percent during the same period.
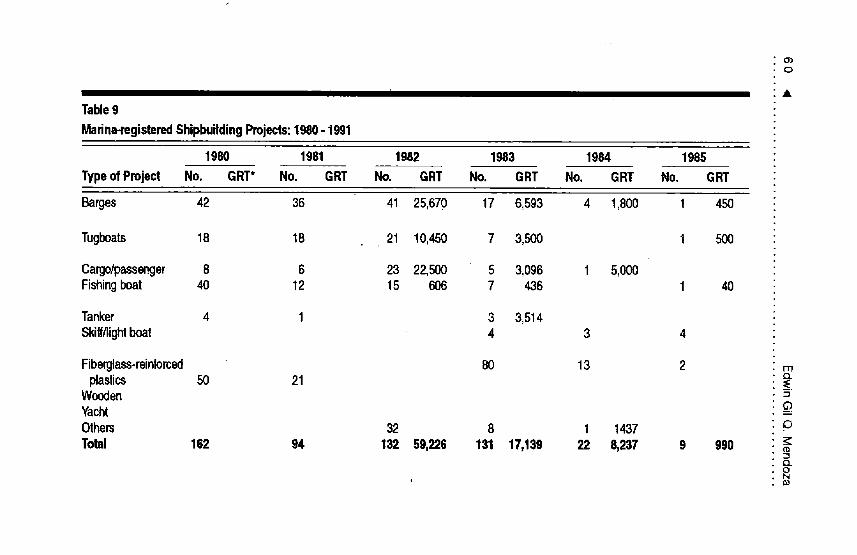
O30
Table9
Marina-registeredShipbuildingProjects:1980-1991
1980 1981 1982 1983 1984 1985
TypeofProject No. GRT* No. GilT No. GRT No. GRT No. GRT No. GRT
Barges 42 36 41 25,670 17 6,593 4 1,800 1 450
Tugboats 18 18 21 10,450 7 3,500 1 500
Cargo/pass_ger 8 6 23 22,500 5 3,096 1 5,000Fishingboat 40 12 15 606 7 436 1 40
Tanker 4 1 3 3,514Skiff/lightboat 4 3 4
Fibergtass-reinforcod 80 13 2 mplastics 50 21
Wooden -'Yacht =Others 32 8 1 1437 oTotal 162 94 132 59,226 131 17,139 22 8,237 9 990 _:('D.
Q.0N
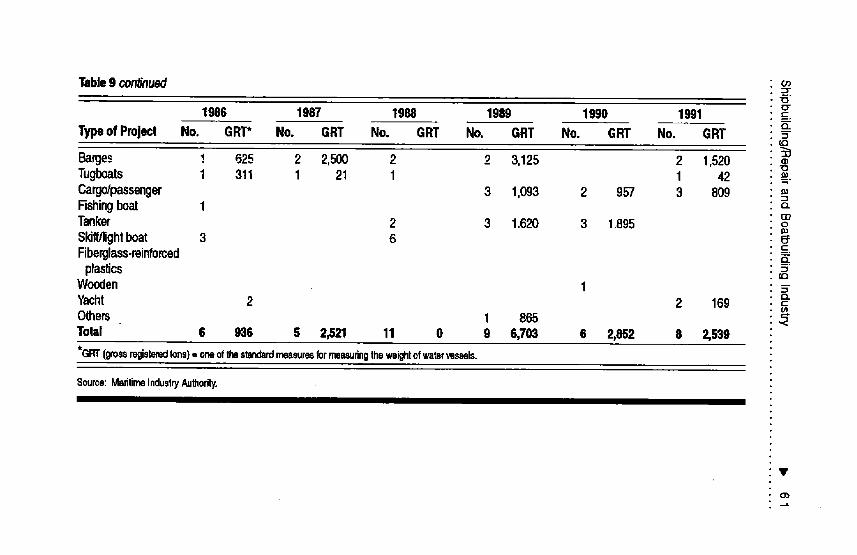
Table9 continued oo
O"1986 1987 1988 1989 1990 1991 _=.
TypeofProject No. GRT* No. GRT No. Gift No. GRT No. GRT No. GRT
Barges ! 625 2 2,500 2 2 3,125 2 1,520 "OTugboats 1 311 1 21 1 1 42 _.-.q
Cargo/passenger 3 1,093 2 957 3 809 "Fishingboat 1 o.ooTanker 2 3 1.620 3 1.895 oSkiff/lightboat 3 6Fiberglass-reinforced D.
plastics =r,4Q
Wooden 1D.
Yacht 2 2 169 _-Others 1 865 ,<:
Total 6 936 S 2,521 11 0 9 6,703 6 2,852 8 2,539
*GRT(grossregisleredtons)= _w ofh standardmeasuresformeasuringtheweightofwatervessels.
S_rce: MsrilimeInduslryAu_orily.
V
O_
6 2 ,q Edwin Gil Q. Mendoza
Exports
The country's exports of water vessels have been dominated bypleasure boats and small cargo ships since the 1970s. Other exportsincluded small-sized fishing vessels. Industry informants, however,clarify that some of these ships were imported vessels whichunderwent conversion prior to export.Table 10 shows a comparisonof the export performance of the SB/SR industry relative to theboatbuilding sector. Before 198i, ships, including used barges, cargovessels,and ships below 3,000 gross tons dominated the total value ofwater vessel exports of the country, except in 1979 when exports ofpleasure crafts amounted to $765,109 against $20,629 for ships.During the 1982 to 1984 period, exports 0fpleasure boats increasedwhile that of ships declined. In 1983, exports of the sector werereduced, although pleasure boats still occupied a large part of thesector's export products. The succeeding years showed changingpatterns, albeit after 1988, exports of ships became minimal. In 1991, jthe country exported pleasure crafts amounting only to $17,895 downfrom a peak of $759,737 in 1982.This can partly be explained by theeconomic slump which the country experienced in 1991.
INDUSTRY STKUCTURE CHANGES
Table 11 shows that, in terms of employment size, there was adistinctive increase in the number of small firms from 1983 to 1988,
supporting the view that no substantial entry barriers existed for smallrepair and building yards. While there was no increment in thenumber of medium-sized plants, the large plants decreased from 10 toonly six in 1988. Although these changes indicate an exit of largeplants, another plausible reason is the decline in the number ofemployees, as plants moved to more capital-intensive productiontechniques.To verify this, the plants were again classified according totheir capital assets.19Table 11 reveals that with the new classification,
19. Capital assets are measured in terms of the rephcement costs of the firms'agscts.

Shipbuilding/Repairand BoatbuildingIndustry I_ 6 3• ,,bo.a ......... * ............ * ................................ ,,,*+.*
I I I I II III
Table10
ExportsofShipsandPleasureCrafts:1977-1992(Inpercent)
1977 1978 1979 1980Commodity Qty CIF Qty CIF " Qty CIF Qty CIF
Value Value Value Value
A.Usedships 6.9 34.9 0.0 0.0 0.0 0.0 2,3 33.5B.Newships 0.0 0,0 0.0 0.0 0.0 0.0 2.3 56.7C,Shipsn.e.c. 10.3 3.1 13,0 80.7 40.2 2.6 40,9 7.7D.Pleasurecrafts 82,8 62.0 87.0 19.3 59.8 97.4 54.5 2.2Total 100 100 100 100 100 100 100 100
1981 1982 1983 1984Commodity Qty CIF Qty CIF Qty CIF Qty CIF
Value Value Value Value
A.Usedships 0.0 0.0 0.0 0.0 0,0 0.0 0.0 0.0B.Newships 3.6 58.4 0.0 0.0 0.0 0.0 0.0 0.0C.Shipsn.e.c. 27.3 15.4 21.4 35.0 21.2 8.0 5.9 7.7D.Pleasurecrafts 69,1 26.1 78.6 65.0 78.8 92.0 94.1 92.3Total 100 100 100 100 100 100 100 100
1985 1986 1987' 1988Commodity Oty ClF Oty ClF Oty CIF Oty ClF
Value Value Value Value
A.Usedships 0.0 0.0 0.0 0.0 0.0 0.0 0.0 0.0B.Newships 0.0 0.0 0.0 0.0 0.0 0.0 0.0 0.0C.Shipsn.e.c. 15.6 71.3 0.0 0.0 6.3 87.4 12.5 1.9D.Pleasurecrafts 84.4 28.7 100.0 100.0 93.8 12.6 87.5 98.1Total 100 100 100 100 108 100 100 100
1989 1990 1991 1992Commodity Oty ClF Oty ClF (]ty ClF Oty CIF
Value Value Value Valuelr
A. Usedships 0.0 0.0 0.0 0.0 0.0 0.0 0.0 0.0B.Newships 0.0 0.0 0.0 0.0 0.0 0.0 0.0 0.0C.Shipsn,e.c. 20.0 10.7 40.7 0.4 0.O 0.0 0.0 0,0D.Pleasurecrafts 80.0 89.3 59.3 99,6 100.0 100.0 100.0 100.0Total 100 100 100 100 100 100 100 100
Source: ForeignTradeSlatisti_, 1977-1992.NationalStatisticalCoordinationBoard,iiii i ! i i i

6 4 ,9 EdwinGil Q Mendoza
I I I I I
Table11
PlantSizebySubsector:1983and1988
Subsector
Boatbuilding ShipbuildingandRepair
1983 1988 Change(%) 1983 1988 Change (%)
EmploymentsizeSmall (5.99) 4 4 19 35 84.21Medium(100-199) 1 4 5 25.00Large (>_200) 9 6 -33.33Totalno.ofplants 4 5 25.00 32 46 43.75
CapitalAssets(Pesos)Small ( <5 Million) 4 5 25.00 11 31 181.82Medium( 5 -20Million) 11 9 -1818Large (>_20Million) 10 6 -40.00Totalno.ofplants 4 5 25.00 32 46 43.75
Source: Census of Establishments, 1983 and 1988, National Statistics Office,
BI i iu i i I
the number of medium and large plants still declined signifying that
the industry's structurb was rationafized as the large inefficient plantswere eased out.
Even with the absence of high entry barriers, the number of
boatbuilders slightly increased from four in 1983 to only five in 1988.
Majority of the plants in 1988 were all relatively larger than those in1983.
To examine whether there was an increase in import competition,
IPRs for the boatbuilding sector during 1983 and 1988 were
computed. Note that Phase II of the ILP removed Qlks for pleasureboats in 1986 while QR.s for new ships remained until 1989. From a
negative index in 1983, the IPRs became significantly high in 1988:1.284 (Table 12).The negative IPK for 1983 can be explained by the
fact that some imported pleasure boats were re-exported after these
were "modified" by local boatbuilders. Since importation of these
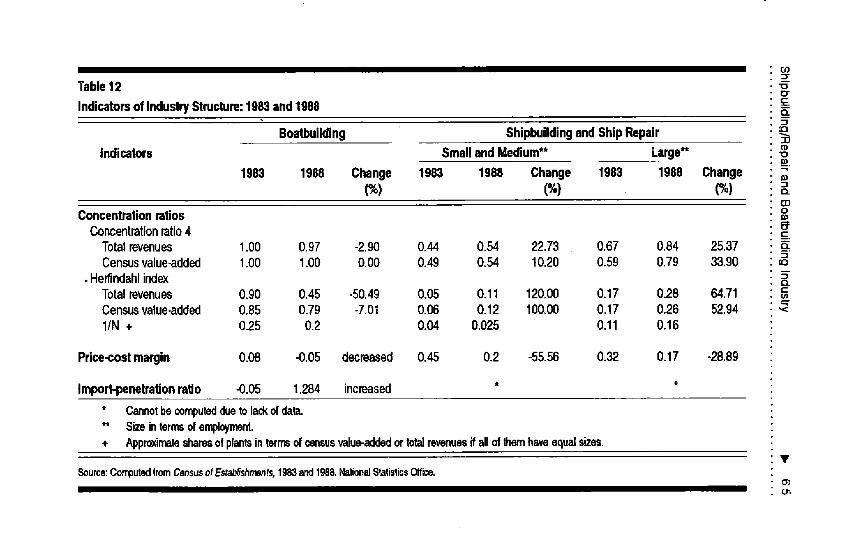
:3"
Table12 _CT
IndicatorsofindustryStructure:1983and1988 =O."-1
Boatbuilding ShipbuildingandShipRepair -_Indicators SmallandMedium_ Ladle_ _
1983 1988 Change 1983 1988 Change 1983 1988 Change(%1 (%) (%1 -'EL
(33
Concentrationratios _oConcentrationratio4 EYE
Totalrevenues 1.00 0.97 -2.90 0.44 0.54 22.73 0.67 0.84 25.37 __.Censusvalue-added 1.00 1.00 0.00 0.49 0.54 t0.20 0.59 0.79 33.90
, Hedindahlindex _.Totalrevenues 0.90 0.45 -50.49 0.05 0.11 120.00 0.17 0.28 64.71 ==Censusvalue-added 0.85 0.79 -7.01 0.06 0.12 100.00 0.17 0.26 52.94 ,2I/N + 0.25 0.2 0.04 0.0'25 0.11 0.16
Price-costmargin 0.08 -0.05 decreased 0.45 0.2 -55.56 0.32 0.17 -2B.89
Import-penetraUonmUo -0.05 1284 increased * *
• Cannotbecomputedduetolackofdata." Sizeintermsofemployment.+ Approximateshamsofpiantsintermsofcensusva]ue-addedortotalrevenuesifairof_ haveequalsizes.
Source:ComputedIromCensusofEstabUshments,1983and1988.NationalS_i_icsOffice.O_C._
66 4 Edwin Gil Q. Mendoza6 ...................................... "...... ;'. ........ 4 ............
pleasure crafts were not done during the current year, this indicatedthat there was some increase in the sector's external competition.
Table 12 shows that during the 1983 to 1988 period, theconcentration indices for the boat manufacturing sector declined,which may have been caused by increased internal competition. Asnoted earlier, the market for the SB/SR sector is segmented so thatseparate concentration indices for small or medium plants and hrgeones need to be calculated. Despite the increase in the number ofsmall plants, their concentration indices rose, although the CR-4values are still below the 60 percent benchmark for highconcentration.A reason for this increase could be that highly efficientnew entrants were able to get a large share of the market. For thissegment of the sector then, there was an improvement in competition.The increased concentration for the large plants can be explained bythe remaining plants' acquisition of the market shares of those whichceased operations. CR-4 indices for large plants, however, weregreater than 60 percent in 1988. Although this might indicate an
oligopolistic structure, industry sources elucidate that large plants,which have more advanced technology and bigger facilities, wouldhave an advantage since they can service larger vesselsmore efficientlythan other large plants with inferior technology and facilities withlower capacities. ConcentrationindicestheroCoreare not su_cient to provecollusivebehavioramong the plants. Over this adjustment period then,the expansion and entry ofsmaU plants and the exit of inefficient hrgeand medium ones occurred. Price-cost margins for the two sectors,however, declined implying a reduction in the profitability of thesemanufacturing activities.
Based on these findings, it could be inferred that the ILPcontributed to better competitive conditions for the boatbuildingsector while changes in the structure for the SB/SR. sector were notdirectly influenced by the trade liberalization episode.
Shipbullding/R_pair and BoatbuildingIndustry I_ 6 7
EFFICIENCY PF.B.FOI_vIANCE
DomesticResourceCosts
A commonly used measure of efficiency in distorted economies isthe domestic resource costs (DRC) criterion, which indicates thequantity of domestic resources used for everyunit of foreign exchangeearned or saved in the production of an economic good (Bautista etal. 1979). Comparative advantage of the producing sector isdetermined by comparing the DP,.C with the shadow exchange rate(SER).A positive DlLC less than or equal to SElL (DlLC greater thanSELL)implies comparative advantage (disadvantage).
1983-1988 census of establishments data
Table 13 reveals that the DRCs of both sectors improved (i.e.,decreased), with the boatbuilding industry showing a remarkabledecrease in shadow DlLC from 40.00 in 1983 to 33.11 in 1988.
Compa/ison of the absolute values of the DRCs of the two sectorsshow that the boatbuilding sector has relatively lower DlLCs than theSB/StL sector for both years.This means that the 66 percent reductionin EPR for the boatbuilding sector helped it in remaining lessinefficient than the SB/SR sector in allocating its resources.
However, both subsectors did not meet the efficiency criteriondefined by a DILC less than or equal to SER.,signifying that.they stillhad a comparative disadvantage in their respective activities in rUationto other manufacturing activities. But the boatbuilding subsector'sDR.C/SEIL was lower than that of the SB/SlL for both yeats implyingthat the former was a more efficient saver or earner of foreignexchange than the latter sector.
Results of the sensitivity analysis with respect to the interest rateshow that higher interest rates lead to higher DlLCs.
At the plant level, the number of efficient (or low-cost) SB/SlLplants rose wath 11 plants becoming efficient in 1988 from only ninein 1983 (Table 14). Moreover, from six small efficient plants in 1983,this increased to seven in 1988, although it could not be determined
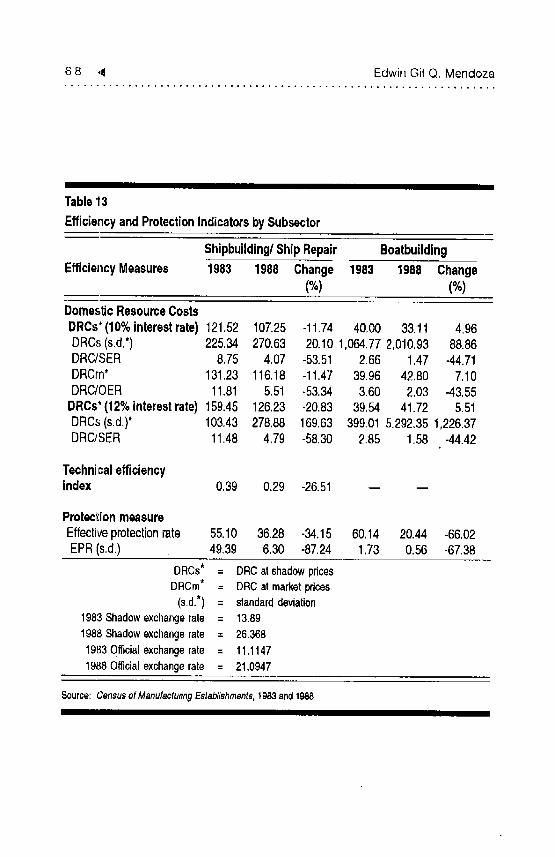
68 ,_ Edwin Gil Q, Mendoza
II I illll I I
Table13
EfficiencyandProtectionIndicatorsbySubsector
Shipbuilding/ShipRepair Boatbuilding
Efficie,¢y Measures 1983 1988 Change 1983 1988 Change(%) (%)
DomesUcResourceCosts
DRCs' (10%interestrate) 121.52 107.25 -11.74 40.00 33.11 4,96DRCs(s.d,*) 225.34 270.63 20.10 1,064.772,010.93 88.86DRC/SER 8.75 4.07 -53.51 2.66 1.47 -44.71DRCrn* 131.23 116.18 -11.47 39.96 42.80 7,10DRC/OER 11.81 5.51 -53.34 3.60 2.03 -43.55
DRCs*(12%interestrate) 159,45 126.23 -20.83 39.54 41.72 5.51DRCs(s.d,)* 103.43 278.88 169.63 399.01 5,292,35 1,226.37DRC/SER 11.48 4,79 -58.30 2.85 1.58 -44.42
Technicalefficiencyindex 0,39 0.29 -26.51 -- --
Protectionmeasure
Effectiveprotectionrate 55.10 36.28 -34.15 60.14 20.44 -66,02EPR(s.d,) 49.39 6.30 -87.24 1.73 0.56 -67.38
DRCs* = DRCatshadowpricesDRCm* = DRCatmarketprices
(s,d.*) = standarddeviation1983Shadowexchangerate = 13.891988Shadowexchangerate = 26.3681983Officialexchangerate = 11.11471988Officialexchangerate = 21.0947
Source:CensusofManufactunngEstab/ishments,1983and1988.III I
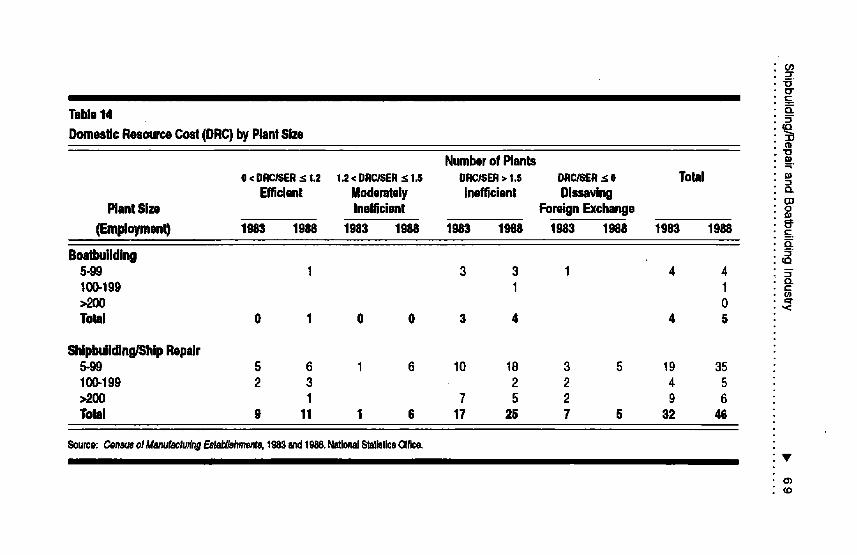
Co
"oo"
i c_
Table14 _"
DomesticResourceCost(DRC)by PlantSize "_'u
NumberofPlants0 <DRC/SF.R< t.2 1.2 <DRC/SER< 1.S ORC/SB_> ;.S ORC/SER < 0 Total
Efficient Moderately Inefficient Dissaving Q-wWantSize Inefficient ForeignExchange o_0
(Employment) 1983 1988 1983 1988 1983 1988 1983 1988 1983 1988 =Q,.
Boatbuilding =CQ5-99 1 3 3 1 4 4 5-11111-199 1 1 _">200 0Total 0 1 0 0 3 4 4 5
Shlp_ld]ng/ShipRepair5-99 5 6 1 6 10 18 3 5 19 35100-199 2 3 2 2 4 5>200 1 7 5 2 9 6Total 9 11 I 6 17 25 7 5 32 46
Source: CwtwJeof _w/ng Eafabf/shmente,1_ and1988.NationalSta_llcsOffice,
o_(.o
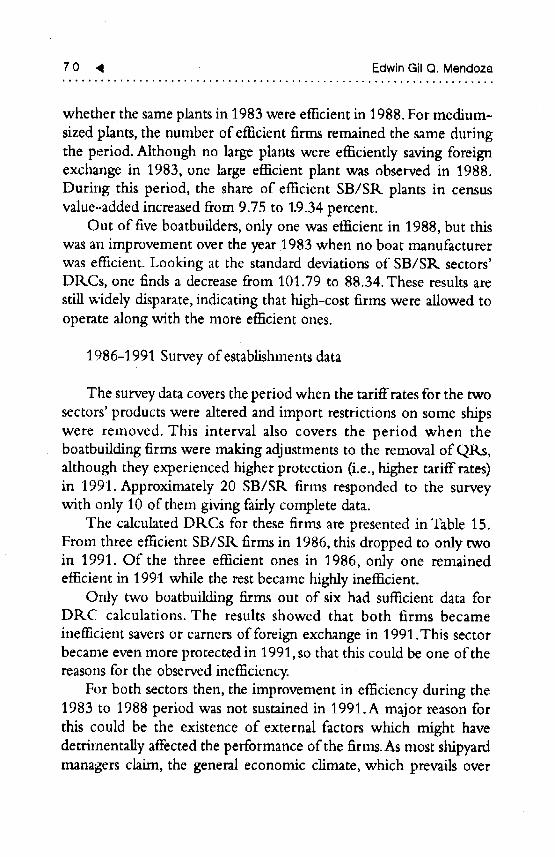
70 ,11 Edwin Gil Q Mendoza
whether the same plants in 1983 were efficient in 1988. For medium-sized plants, the number of efficient firms remained the same duringthe period. Although no large plants were efficiently saving foreignexchange in 1983, one large efficient plant was observed in 1988.During this period, the share of efficient SB/SR plants in censusvalue..added increased from 9.75 to 1.9.34 percent.
Out of five boatbuilders, only one was efficient in 1988, but thiswas an improvement over the year 1983 when no boat manufacturerwas efficient. Looking at the standard deviations of SB/SR. sectors'DRCs, one finds a decrease from 101.79 to 88.34. These results are
still widely disparate, indicating that high-cost firms were allowed tooperate along with the more efficient ones.
1986-1991 Survey of establishments data
The survey data covers the period when the tariffrates for the twosectors' products were altered and import restrictions on some shipswere removed. This interval also covers the period when theboatbuilding firms were making adjustments to the removal of QRs,although they experienced higher protection (i.e., higher tariff rates)in 1991. Approximately 20 SB/SR firms responded to the surveywith only 10 of them giving fairly complete data.
The calculated DRCs for these firms are presented in Table 15.From three efficient SB/SP_ firms in 1986, this dropped to only twoin 1991. Of the three efficient ones in 1986, only one remainedefficient in 199.1while the rest became highly inefficient.
Only two boatbuilding firms out of six had sufficient data forDRC calculations. The results showed that both firms became
inefficient savers or earners of foreign exchange in 1991.This sectorbecame even more protected in 1991, so that this could be one of thereasons for the observed inefficiency.
For both sectors then, the improvement in efficiency during the1983 to 1988 period was not sustained in 1991.A major reason forthis could be the existence of external factors which might havedetrimentally affected the performance of the firms.As most shipyardmanagers chim, the general economic climate, which prevails over
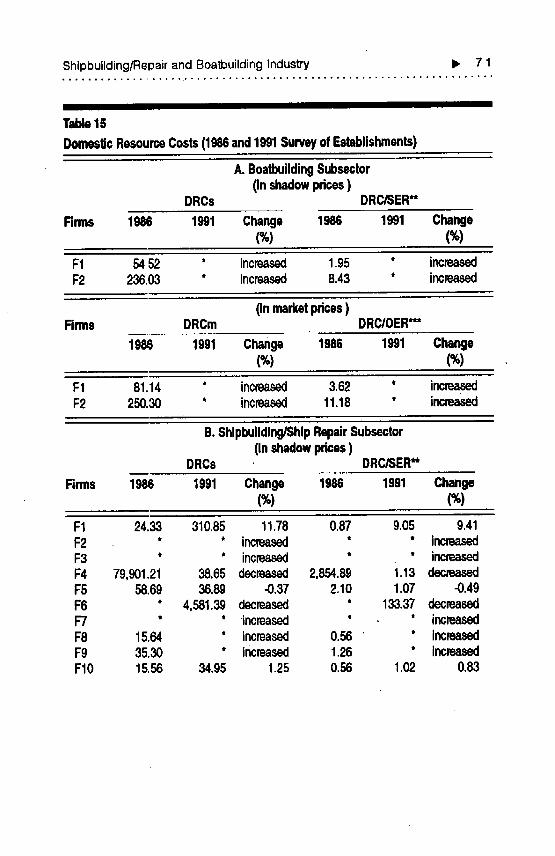
Shipbuilding/Repairand Boa_uildingIndustry I_ 7 1
II I IIIIII II I IIII
Table15
DomeslicResourceCosts(1986and1991Surveyof Establishments)
A.BoalbuildingSubsector(Inshadowprices)
DRCs DRC/SER**
Rrms 1986 1991 Change 1986 1991 Change•
F1 54.52 * increased 1.95 • increasedF2 236.03 * increased 8.43 * increased
(inmarketprices)Firms DRCm DRC/OER*'*
1986 1991 Change 1986 1991 Change(%) (%)
F1 81.14 * increased 3.62 * increased1:2 250.30 * increased 11.18 * increased
B.Shipbuilding/ShipRepairSubsector(Inshadowprices)
DRCs DRC/SER**
Firms 1986 1991 Change 1986 1991 Change(%) (%)
F1 24.33 310.85 11.78 0.87 9.05 9.41F2 * * increased * * incn_asedF3 * * increased * • increasedF4 79,901.21 38.65 decreased 2,854.89 1.13 decreasedF5 58.69 36.89 -0.37 2,10 1.07 -0.49F6 * 4,581.39 decreased • 133.37 decreasedF7 ° * increased " * incRJasedF8 15.64 * increased 0.56 " * IncreasedF9 35.30 * increased 1.26 * increasedFIO 15.56 34.95 1.25 0.56 1.02 0.83
7 2 .,_ Edwin Gil Q. Mendoza
Table15 continued ,
C,Shipbuilding/ShipRepairSubsector(In marketprices)
DRCn DRC/OER***Firms 1986 1991 Change 1986 1991 Change
(%) (%)
F1 28,86 349.48 11.11 1.29 12,72 8,87F2 * * increased * * increasedF3 * * increased * * increasedF4 * 46.55 decreased * 1,69 decreasedF5 138,95 43.61 -0,69 6,21 1.59 -0,74F6 116.02 5,522.42 increased 5.18 200.96 increasedF7 * * increased " * increasedF8 19.97 * increased 0.89 * increasedF9 38.72 * increased 1.73 * increasedFIO 19.01 39.43 1.07 0,85 1,43 0.69
• Indicatesthatfirmsarenegativesavers/earnersof foreignexchange•* 1986Shadowexchangerate($ER)= 27.988•* 1991Shadowexchangerate(SER)= 34.35
•** 1986Officialexchangerate(OER)= 22.39•** 1991OfficialExchangeRate(OER)= 27.48
Ifa firmhasaDRC/SER_<12, ithascomparativeadvantageoverotherfirms,Ifa firmhasa DRC/O'ER.._1.2,it hascompetitiveadvantageoverotherfirms.
Source:$urveyofManufacturingEstab/ishrnents,1983and1988.III I II I
the year, greatly affects their operations. While the economy grew by1.86 percent in 1986, the country posted only a .32 percent GNPgrowth rate for 1991 (NEDA 1992). The low growth rate in 1991,coupled with natural calamities and political instabilities, might haveinduced firms to perform less productively. Boatbuilders also explainthat such problems damage their business as less people are likely toengage in cruising or yachting.
Snlall yards, however, blame too much competition as the reasonfor their underutilized facilities. Interviews with industry peoplereveal that trade policy changes affected their operations differently.With the increased imports of vessels, the small firms, which
Shipbuilding/RepairandBoatbuildingIndustry I_ 73.......... ,,, ...................... , .... ****** ................. *6***
constructed small fishing vesselsand tugboats, had to institute certaincost-cutting measures,while firms engaged primarily in repair servicesfelt that they benefited from the proliferation of imported vessels.
Most of them claim, however, that it was the institution of thevalue-added tax and the removal of incentives similar to P.D. 666
which adversely affected their operating costs. Faced with highercosts, they simply adjusted their prices upward, which again affectedtheir ability to compete with other yards, especially foreign ones.Given that most of them are engaged in fairly the same repair jobs,this would have minimal repercussions on tl_eir competitive positionsif not for some yardswhich practiced underpricing.
One firm alsopointed out that it was unable to perform efficientlybecause of some government policies, which prohibited its servicingof foreign ve_els with a crew espousing different ideological beliet_.In effect, their facilities were often underutilized because of this clausein the firm's Charter.
Most shipyard managers maintain that they have minimalproblems with workers in terms of training and sells. However, therehas been a growing shortage of qualified technical personnel in recentyears because of the more lucrative opportunities offered by jobsabroad, especially in the Middle East.
The respondent boatbuilders explained that the recent tradereforms affected their operations in diverse ways. Although they
,benefitted from the reduction of tariff rates on their inputs, they feltthat these were not enough to make them competitive internationally.Compared to other Asian boatbuilders who have duty-free privilegesin importing raw materials and access to automated buildingequipment, local boatbuilders can not compete effectively.
TechnicalEfficiency
The Technical Efficiency Index (TEl) depicts how the resourcesof the plant were used effectively.A TEl close to one means that theplant is using its resources efficiently, or it is near the frontier whichindicates the domestic 'best practice' technology. Due to the limitednumber of sample plants for the boatbuilding industry, TEl estimates
7 4 _1 Edwin Gil Q. Mendoza
were done for the SB/StL subsector only. Table 13 reveals that thesubsector'sTEI showed a decrease from 39.46 percent in 1983 to only29 in 1988. This means that the sector's efficiency in maximizing itsoutput, given its resources, declined in spite of the fact that it becameefficient in allocating its resources.The number of plants which hadTEI's of 75 to 100 percent, i.e., the range of technically efficient phntsaccording to Hill and Kalirajan (1991), dwindled from seven efficientplants (or 25 percent of the total plants) in 1983, to only two plants(or 4.3 percent of the total plants) in 1988. This decline could beattributed to the reduction in the number of technical and skilled
personnel such as naval architects or engineers who were lured bymore financially rewarding jobs abroad (Marina-JICA 1991).Anothercause was the aging facilities of the shipyards which could not beupgraded immediately because of the large sums of money such anactivity entailed.
CompetitiveAdvantage
An industry's private profitability in the marketplace can bemeasured by the DR.C, expressed in market prices (DRCm). Firmsor plants with positive DRCm/OER less than or equal to 1.2 areconsidered efficient in the marketplace, relative to those havingDRCm/OER greater than 1.2. Computations based on census datashow that the two sectors were not performing profitably as shown bytheir high DRCms (Table 13).The decline in DRCm/OER over theadjustment period was not enough to make the two sectorscompetitive.The boatbuilding sector still had a competitive edge overthe SB/SR sector as shown by its DRCm/OER ratio of 1.68, whichis lower than the SB/S/L sector's figure of 4.9 in 1988.
Looking at specific plants in the SB/SR sector, the number ofplants having comparative advantage increased from seven to 10 plantsduring the 1983 to 1988 period. Only three plants showedcompetitive advantage during the same time interval. This indicatesthat socially efficient plants were not necessarily earning privateprofits.
Shipbuilding/RepairandBoatbuildingIndustry i> 75
Albeit no boatbuilder was performing profitably in 1983, oneplant which showed a DR.Cm less than or equal to OER. was observedin 1988.This plant also showed a comparative advantage over otherplants.
Looking at specific factors which raised DRCm above shadowDR(;, one finds that value of fixed assets and working capitalincreased, signifying that the high capital costs incurred by both sectorsaffected their competitiveness. Labor costs also il_creasedby more thancapital costs ¢br the boat uaanuf3_cturers,which may indicate that thedistortive effects on wages of labor laws also had a negative impact onthe efficiency of the sector in the market. For the SB/SIk sector, itslabor costs increased as well, but not as much as its capital costs.
The survey data revealed a similar pattern with the firms whichwere socially t,nprofitable, not earning as well in terms of privateprofits (/'able 15).
Factorintensity and l#o,tuctivityhzdicators
Both subsectors showed increases in their capital productivities (inreal terms) with that of the boatbuilding sector increasing from .10 in1983 to .14 in 1988 (Table 16). Capital prodt, ctivity for the SB/SR.sector rose slightly to .038 in 1988 from .037 in 1983.This could haveresulted.from the greater utilization of excesscapacity which the firmsmaintained in 1983. During the same period, labor productivity forboth sectors decreased with that of the boatbuilding sector decliningfrom P3,038.95 to only P1,920.86 and that of the SB/SR. falling fromP10,070 to P8,719.The SB/SR sector, however, still remained morelabor-intensive than the boatbuilding sector in absolute terms. Theexpansion of the boatbt, ilding sector's ot,tput was tht,s accompaniedby an increase in its capital productivity, which could explain the tablewith observed i,nprovement in efllciency performance. The rise incapital productivity for the SB/Stk subsector could also be the causeof the improvement in the sector's efficiency. C.apital-intensity forboth subsectors declined, which might have caused the decrease intheir labor productivity indices.
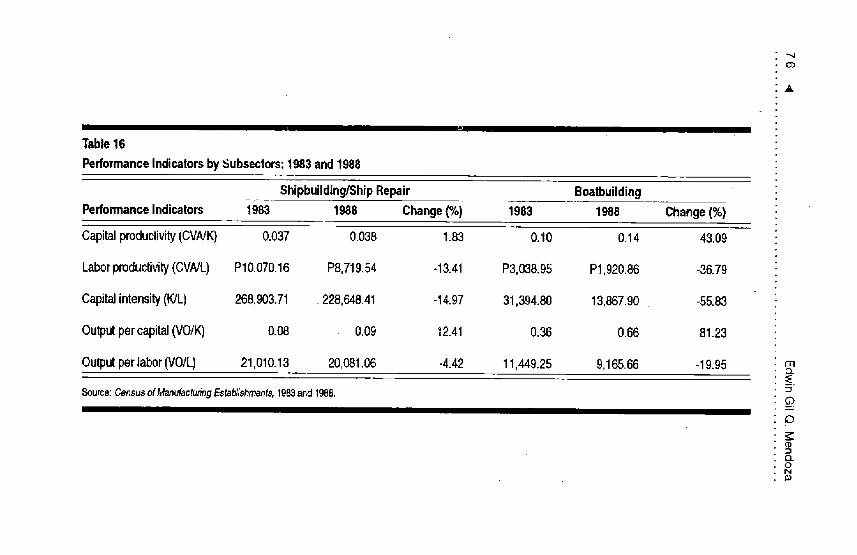
O'3.
A
Table16
PerformanceIndicatorsbySubsectors:1983and1988
Shipbuilding/ShipRepair Boatbuild[ng
PerformanceIndicators 1983 1988 Change(%) 1983 1988 Change(%)
Capitalproductivity(CVNK) 0.037 0.038 1.83 0.10 0.14 43.09
Laborproductivity(CVNL) P10,070.16 P8,719.54 -13.41 P3,038.95 P1,920.86 -36.79
Capitalintensity(WL) 268,903.71 .228,648.41 -14.97 31,394.80 13,867.90 -55.83
Outputpercapital(VO/K) 0.08 0.09 12.41 0.36 0.66 81.23
Outputperlabor(V0/L) 21,010.13 20,081.06 -4.42 11,449.25 9,165.66 -19.95 rnQ_
__Source:Censusof ManufacturingEstablishments,1983ar,,c11988.
Gb
£)
('D
ON
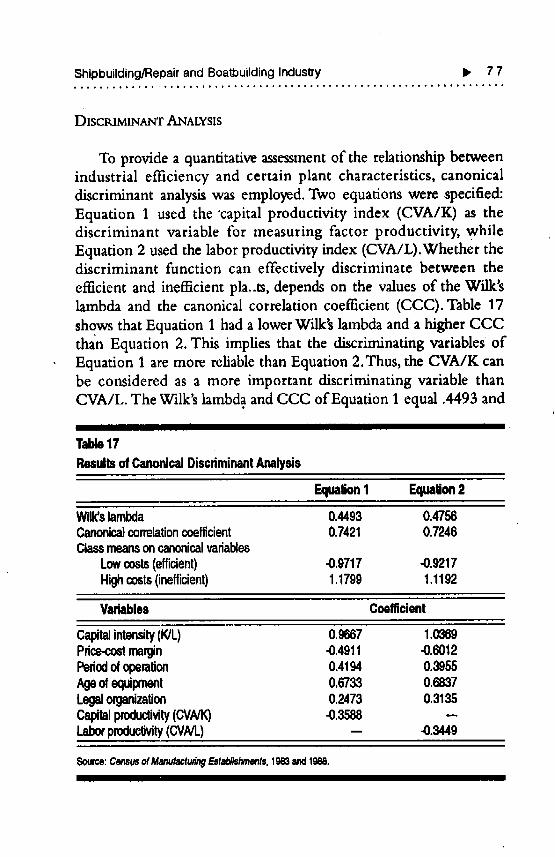
Shipbuilding/RepairandBoa_uildingIndustry I_ 7 7
DISCI:UMINANTANALYSIS
To provide a quantitative assessment of the relationship betweenindustrial efficiency and certain plant characteristics, canonical
discriminant analysis was employed. Two equations were specified:
Equation 1 used the "capital productivity index (CVA/K) as thediscriminant variable for measuring factor productivity, while
Equation 2 used the labor productivity index (CVA/L).Whether thediscriminant function can effectively discriminate between the
efficient and inefficient ph..ts, depends on the values of the Wilk'slambda and the canonical correlation coefficient (CCC). Table 17
shows that Equation 1 had a lower Wilk's lambda and a higher CCCthan Equation 2. This implies that the discriminating variables of
Equation 1 are more reliable than Equation 2. Thus, the CVA/K can
be considered as a more important discriminating variable than
CVA/L. The Wilk's lambda and CCC of Equation 1 equal .4493 and
Table17
ResultsofCanonicalDiscdminantAnalysis
F..q_lJonI Eclualon2
WilWslambda 0.4493 0.4756Cano_a]conelationcoefficient 0.7421 0.7246Qassmeansoncanonicalvariables
Lowcosts(efficient) -0.9717 -0.9217Highcosts(inefficient) 1.1799 1.1192
Variables Coefficient
Capitalintensity(K/L) 0.9667 1,0889Price-costmargin -0.4911 -0.6012Pedodofoperation 0.4194 0.3955Ageofequipment 0.6733 0.6837Legalon_mization 0,2473 0.3135c_l prod_/(CVNK) -0.3568 -LaborproduolJvity(CMNL) -- -0.3449
SOUrCe:Census of Manufacturing Establishments, 1983 and 1988.
i ii
78 _ Edwin Gil Q. Mendoza
.74, respectively,which means that the discriminating variables can berelied upon in distinguishing between low cost and high cost plants.
The variable that can discriminate effectively between the efficientplants and the inefficient ones (i.e., variables with high coefficients inabsolute terms) is the capital-labor ratio (or capital-intensity) for bothequations. For equation 1, the age of equipment index is the secondmost important variable, while in Equation 2, capital-intensity is thesecond most critical.These results suggest that capital is a vital elementin determining the efficiency of the plants. They also imply thatefficient and inefficient plants vary considerably in the amount ofcapitad equipment which they employ. The existence of the PCM asa significant discriminating variable indicates the importance of theindustrial structure in determining the relative efficiency of the plants.
The subgroup or class designated as efficient has a mean bearingthe negative sign for both equations. Thus, coefficients of variableswith values close to the value of the subgroup efficient (i.e., negativevalue_) are directly correlated with efficiency.The farther the values ofthe coefficients are (i.e., the higher positive values of the variables)from the subgroup efficient, the more correlated they are with thesubgroup inefficient. Two variables show negative signs for bothequations: PCM and the factor productivity indices. This, therefore,implies that the factor productivity and the profitability measure(PCM) played an important role in the efficient performance of theplants. The positive value of the capital-intensity index signifies thatplants, which used more capital-per unit of labor, were not necessarilyefficient. The positive relationship between the PCM and efficiencyimplies that the more efficient plants were also operating profitably.
FACTORS AFFECTING INDUSTRIAL PEKFORMANCE
External factors, such as demand conditions and the production,environment, can have distinctive influences on the efficiency of thefirms. Not all of these factors, however, can be influenced by policiesso that any trade policy changes may not be adequate to make firmsperform efficiently.
Shipbuilding/Repair,andBoalbuildingIndustry I_ 79
Demand Conditions
Although there are minimal problems with respect to the demandfor ship repair, demand for new local ships has been low. As statedearlier, the primary constraints for local domestic construction includelimited financing and the competition proffered by imported used"vessels.Industry sources explain that domestic construction of a 1,000dwt tanker in 1992 would reach around P35 to P40 million, while
importation of second-hand 1,000 dwt tankers would cost onlyaround P20 million. Furthermore, local construction would take
approximately eight to 13 months, while importation of vessels wouldtake only three to five months with lesser capital risks involved, Atpresent, bareboat chartering provides the cheapest way for importingvessels, since it entails paying only a 4.5 percent tax as compared tobuilding new vesselswhich leads to paying 35 percent in import dutiesand taxes (Study on Shipbuilding Industry 1989).The 12 percent limiton the rate of return on shipping investments and the numerousadministrative problems regarding shipping rates and voyage routeshave rendered the construction of new vessels not viable (LeverageInternational [Consultants], Inc. 1990).This lack of demand for newship construction has not allowed the shipyards to gain the benefits ofeconomies of scale which can lead to more efficiency gains.
Industry sources also claim that the long run costs of importingsecond-hand vessels are roughly equivalent to the long run costs ofhaving ships locally built, because imported vesselshave higher qualitydue to the technology applied in their construction:Thus, shippinglines prefer to buy second-hand vessels which require low initialcap!tal requirements.
Some shipyard managers believe that growth of the SB/SRindustry depends on developments in the shipping sector, and that therecent move to deregulate the shipping industry will have a positiveimpact on their operations.
As for the boatbuilding subsector, domestic demand has also beenlimited because of the higlf costs of these pleasure crafts. But theexport market has been favorable for certain types of boats.
80 _ EdwinGilQ.Mendoza
Barriersto Entry /F.xpansion
Entry barriers for the SB/SIL sector include the large capitalrequirements for setting upthe drydocking facilities. Based on surveydata, high interest rates prove to be the most significant barrier to
"both entry and expansion,followed by technology acquisition, accessto finance, and excessive competition. The last barrier is morepronounced in the case of small firms engaged mostly in repairjobs,where entry does not require much capital. New technologyacquisition has also became an important entry barrier,since demandfor quality repair jobs require the latest technology. One policy-relatedentry barrier, which foreigners find restrictive, is the constitutionalprohibition of sole ownership by foreign nationals of firms engaged inparticular production activities,
For the respondent boatbuilding firms, the most importantbarriers to entry are the limited domestic demand for their products,control by existing firms of the distribution channels, and bureaucraticprocedures (for the new entrant). The limited local demand forpleasure boats arise from its nature as a luxury commodity and henceits high cost.
Technology-RelatedFactors
Most of the equipment and facilities found in domestic shipyardsare old and require upgrading.This situation has effectively decreasedthe shipyards' ability to compete with other foreign yards. Only firmswith foreign tie-ups enjoy the latest technology in their respectivefields of operations.
Unlike shipbuilding nations such asJapan and South Korea whereshipyards have close links with research institutions, the country hasno research institution which caters to the technology needs of theindustry.
The present technology practiced by boatbuilders may be labor-intensive but their products are competitive in the world market interms of quality. Their main problem is the delivery time of theirproducts, which is determined by the labor-intensive nature of theirproduction techniques.
Shipbuilding/Repair and Boatbuilding Industry I_ " 8 1
Antillary Industries
Most of the SB/SR.'s raw material requirements are importedbecause the local support industries are unable to meet the qualitystandards required by the shipyards.The local iron and steel industrym
can only provide steel sheets and structures up to a certain thickness(Leverage International [Consultants] Inc. 1990). No industrialmachinery industries exist in the country which caters to the specificneeds of the sector so that engines and other equipment have to beimported. Faced with high tariff rates and numerous bureaucraticrequirements, most firms are unable to meet the delivery schedules setby the client ships.
All these elements affecting industrial productivity dearly supportsthe idea that the industry faces several constraints in their productivitygrowth, .which may not be effectively minimized by trade policyreforms. Assistance programs aimed at helping the sector should begeared towards reducing or even eliminating these bottlenecks towardthe sector's productivity growth.
SHIPBUILDING/I_PAIIk POLICIES OF SELECTBD ASIAN COUPES
Among the leading SB/SR. nations in the world, Korea and Japanhave successfully implemented policies geared at improving their SB/SIk sectors. The current policies of the Korean government revolvearound three aspects: upgrading and maintenance of present facilities,technology development, and "localization" of equipment andmachineries. Similarly, the Japanese government puts emphasis ontechnological development, specifically, manpower developmenttraining, and the development of "ships of the next generation"Another policy currently pursued by Japan is the provision oftechnology-related assistance grants to other countries throughmanpower training schemes.This has been a major source of assistancefor Philippine shipbuilders and repairers.
The Indonesian andThailand governments are actively promotingtheir SB/SR industries through several fiscaland marketing assistance
82 .i EdwinGil Q.Mendoza
schemes. Both countries offer duty-free importations of equipment,machineries, and raw materials used by the sector. What is veryimportant in these laws are that they are effectively followed andexecuted by the itnplementing agencies.
Singapore also promotes its SB/SR industry, but the development .of its maritime industry, however, is due to its location as theCrossroadsfor major shipping lanes in the Asia Pacific. Industry expertsassess that Singaporean yards are able to compete effectively in termsof price and quality,so that current policies are addressed at optimizingand enhancing skills training, application of mechanized technologyto shipyard operations, closer cooperation between specialized tertiaryinstitutions and shipyards, and continued government investment inresearch and development (R.&D) infrastructure.
These policies show some similarities with Philippine SB/SR lawsand regulations.What is hcking is strict enforcement and sustainabilityin policy implementation. The Marina is tasked with regulating thesector, but its limited resources has severely restricted its efficiency. Itsregulatory decisions may alsohave introduced some distortions whichhave affected the sector adversely (Balisacan 1990).
7
Conclusion, and Recommendations
study reveals that the 1981 trade reforms resulted in lowerprotection levels for the SB/SR and boatbuilding sectors during the1983 to 1988 period, but the changes were minimal because the tariffrates for the two sectors' outputs were not altered. Quantitativerestrictions were still pervasive in the SB/SR. during this period, whileimportation of pleasure boats were liberalized only in 1986. Estimatesof the EPRs, however, reveal that the boatbuilding sector became lessprotected than the SB/SR sector in 1988 and the EPRs within thetwo sectors were narrowed down. But the 1991 TRP resulted in a
different outcome: very low tariff rates for ships and high tariff ratesfor pleasure boats. This implies that the effective protection receivedby the SB/SR sector continued to decline while that of theboatbuilding sector increased.
Trade liberalization benefitted the sectors by lowering high tariffrates and removing non-tariff barriers on imported raw materials,making these more accessible to domestic producers.As a result, bothsectors posted gains in their productivity performance between 1983and 1988 with the boatbuilding subsector performing relatively better.Capacity utilization and capital productivity were raised. Morecompetition from foreign pleasure boats also induced domesticboatbuilders to adopt cost-cutting measures, thereby improving theirefficiency and competitiveness. These results, along with thenormalization of economic and political activities in 1986, led to theexpansion of the outputs of firms in both sectors.
While ship repair operations expanded, shipbuilding activitiesfurther declined because of market conditions and governmentpolicies which discouraged ship manufacturing activities. Unable to
8 4 _1 Edwin Gil Q. Mendoza
compete efficiently with imported used vessels, local ship producersshifted to repair activities. This flexibility in shipyard operations hasbeen the main reason why shipyards continue their activities evenwith the decline of orders for new ships.
Mixed changes in the structure of the two sectors occurred duringthe adjustment period. Concentration in the boatbuilding sectordeclined, but that in the SB/SR sector increased despite the rise inthe number of small- and medium-sized SB/SR plants. Anexplanation for this could be that some of the new entrants were veryefficient, which allowed them to take a large share of the market,resulting in the increase in concentration. Profitability for bothsubsectors, however, declined.
All these findings can only be partly attributed to the relaxation oftrade policies, since there were other macroeconomic events and non-price factors which might have influenced the firms' responses.Thus,despite some favorable developments on the trade policy side, theindustry still did not attain the efficiency level (defined by a positiveDRC/SER less than or equal to one which would have allowed it togain comparative advantage. One should note, howeveq_ that theanalysis covers the 1983 to 1988 period which is considered onlyas atransition period, since the TRP is still in progress. Results of theanalysis show that the observed improvement in 1988 were notsustained in 1991. Structural- and policy-related factors have probablybeen responsible for these inefficiencies. On the supply side, outdatedtechnologies, huge capital requirements for expansion or technologyacquisition, and lack of quality raw materials are among the structuralimpediments to the better performance of the sectors. Under strongdemand growth conditions, these impediments would normally beovercome but obstacles on the demand side, such as scarcity of capitalfor ship construction, ship financing, and the oligopolistic nature ofthe domestic shipping industry, proved to be problematic as well. Likethe SB/SR sector, the boatbuilders also faced serious constraints suchas lack of information and scarce domestic marketing channels andinfrastructure problems, specifically,the lack of marinas for launchingtheir boats. In addition, inconsistent and restrictive government
policies have adversely affected the performance of th_ sectors. One
,Shipbuilding/RspairandBoatbuildingindustry I_ 85........................................ *...t .................. _-.,_
glaring example of this was the implementation and withdrawal ofincentives under P.D. 666 over a few months.
These concerns were pointed out in past studies and most of themconcluded that government should actively participate in developingthe industry.The SB/SR sector plays a vital role in the growth of theentire maritime industry, and the shipping sector cannot performe_ciently without its capable support.A review of SB/SR policies ofourAsian neighbors also reveals active government involvement withthe sector. Whatever decisions the government make, seriousconsideration must first be made as to whether the promoted sectorhas a potential dynamic comparative advantage or not.
Results of the study indicate that the boatbuilding sector is arelatively less inefficient foreign exchange earner or saver than theSB/SR. sector. This supports the view that manufacturers of watervessels in the country have the potential for being competitive in theconstruction of small boats. It is recommended then that shipyards taptheir resources in the production of boats.Just recently, some foreignboatbuilders successfully manufactured yachts to ply the inter-islandroutes. This practice can be a starting point before construction oflarger vessels is undertaken. Besides, the favorable export market forthese boats will allow the firms to take advantage of scale economies.Shipbuilders and repairers should also continue to upgrade theirtechnology to become competitive. Boatbuilders should also considerentering into joint ventures with foreign partners for purposes oftechnology acquisition and marketing coUaboration.They'should alsocontinue joining international pleasure boats exhibits to improve theirdesigns and image.
It is also recommended that further studies be made on the impactof domestic policies, especially with the 1991 trade policy reformswhich have further decreased trade protection for the SB/SR sectorbut increased that for the boatbuilding sector. It is also interesting tolook into how the recent deregulation of the shipping industry affectsthe SB/SR sector.
The policy implications of the study include the continuedliberalization of the sectors concerned, especially on the input side, toimprove access to necessary material inputs. Policy reforms should

8 6 _1 Edwin Gil Q. Mendoza
also be made to address the high interest rates, foreign exchangecontrols, and wage distortions which have prevented the firms fromachieving international competitiveness. Government should also:
1) Improve customs administration;2) Foster and strengthen the access of local firms to more advanced
technologies by continuing its programs on developing appropriatetechnologies through the Marina and the large shipyards;
3) Develop the sectors' access to financial resources, especially foracquiring new technologies;
4) Help in the dissemination of information regarding governmentpolicies affecting the industry (e.g., duty drawbacks);
5) hnplement efficiently the duty drawback system and otherincentive policies so as to encourage domestic firms to exporttheir products, and to remove the bias against small firms; and
6) Assist in the dissemination of market information.
More significantly, the government should continue to develop thecountry's infrastructure services (telecommunications, power supply,marinas for boats, ports and wharves) which are dismally inadequate.
Recent developments_in the SB/SK sector reveal that foreignshipyards are interested in investing in the country due to its abundantlabor force. From a policy viewpoint, it is beneficial then if thegovernment continue to simplify its investment procedures. Owing tothe large capital outlays needed by the SB/SR sector, foreign capital isof great help in alleviating the sector's plight.
A

Bibliographyq,_ o o o o o Q oo o o oo o 4, g oo o o oooo o,J 4, o o o
Aigner, D.J. and S.E Chu. "On Estimating the Industry Production
Function." American EconomicReview 58, 4 (1968): 826-39.
Aigner, Dennis, C.A. Knox LoveU, and Peter Schmidt. "Formulation and
Estimation of Stochastic Frontier Production Function Modds:'Journal
of Econometrics6 (1977):21-37.
Bacani, ILamon C. et al. The Philippine ShipbuildingIndustry.Manila: NationalEconomic and Development Authority, University of the Philippines andPrivate Development Corporation ot: the Philippines, 1974.
Bain, Joe. Baniers to New Competition. Cambridge, Massachusetts: HarvardUniversity Press, !956.
Balisacan, Arsenio M."An Analysis of the Philippine Inter-Island ShippingIndustry."Journal ofAgriculturalEconomicsand Development XX (1990).
Barlindhango8 Fuglum A/S. IndustrialRestmauring Programof the Philippines
Subsector Study on the Inter-island Shipping�Ship Repair. Manila:
Development Bank of the Philippines, i990.
Bautista, Komeo M., John H. Power and Associates. Industrial Promotion
Polities in the Philippines. Makati: Philippine Institute for DevelopmentStudies, 1979.
Board of Investments Institute of Export Development. "Pleasure BoatsIndustry in the Philippines." Primer. BOI, March 24, 1980.
Bruno, Michael P."Domestic Resource Costs and Effective Protection:
Clarification and Synthesis." Journal ofPoliticalEconomy80 (1972): 16-33.
Bureau of Exports Trade and Promotion, Department of'Trade and Industry
(DTI). Marl_ting Guide on the Exports of PleasureBoats.Manila: DTI, 988.
Bureau of Internal Revenue (BIR.), Republic of the Philippines. National
Internal Revenue Codes. 1983, 1986, 1988. Manila: BIR, various years.Business Day. "Filipino boat manufacturers develop new type of ferry."
February 3, 1993.
Caves, Richard and Michael E. Porter. "The Dynamics of Changing SellerConcentration" TheJournal of Industrial Economics29 (1980): 1-15.
8 8 _i EdwinGil Q. Mendoza
Custodio, Christian."Feasibility Study on the Production of Pleasure Boats."
Unpublished thesis. Mapua Institute of Technology, 1992.
De Melo, Jaime and Shujiro Urata. "The Influence of Increased Foreign
Competition on Industrial Concentration and Profitability." InternationalJournal of Industrial Organization 4 (1986): 287-304.
Dixit, A. andV. Norman. Theory of InternationalTrade.Cambridge UniversityPress, 1980.
Farrell, Michael J. "The Measurement of Productive Efficiency." Journal ofthe Royal StatisticalSodety 120 (1957):11-181.
FookienTimes PhilippineYearbook,1991.
Forsund, Finn R., C.A. Knox Lovell, and Peter Schmidt. "A Survey of
Production Functions and of Their Relationship to EfficiencyMeasurement."Journal of Econometrics13 (1980): 5-25.
Gwlier Encyclopedia,1991.Vol. 15, 8th Edition, USA.
Grossman, Gene and Elhanan Helpman."ComparativeAdvantage and Long-Run Growth." AmericanEconomicReview 80 (September 1990).
Havrylyshyn, Oli. "Trade Policy and Productivity Gains in DevelopingCountries: A Survey of the Literature." The World Bank Research Observer
5, 1 (1990): 1-24.
Helpman, Elhanan and Paul Krugman. Market Stmaure and ForeignTrade.Cambridge, Massachusetts: MIT Press, 1985.
Hill, Hal and K.P. Kalirajan. "Small Industry and Firm-Level Efficiency: A
Developing Country Case Study." Working Paper in Trade and
Development No. 91/3. Canberra: Australian National University, July1991.
Industrial Promotion Policies Project (IPPP) Technical Note No. 11.
"Procedure for DRC Calculation Using Establishment Data." PhilippineInstitute for Development Studies, 1979.
International Bank for Reconstruction and Development. "The Philippine
Shipbuilding Industry." Board of Investments Report, 1980.
Kirkpatrick, Colin and Jassodra Maharaj."The Effect of Trade Liberalization
on Industrial-sector Productivity Performance in Developing Countries."
In Jean-Marz Fontana (ed.) ForeignTradeReform and Development Strategy.London: Roudedge, 1992.
...... N. Lee, and E Nixson. Industrial Stmaure and Policy in LessDeveloped Countries.London:Allen and Unwin, 1984.

Shipbuilding/RepairandBoatbuildingIndustry IP. 89
Krueger, Anne O. "Evaluating Restrictionist Trade Regimes: Theory and
Measurement."Joumal of PoliticalEconomy80 (1972): 49-62.
Lee, Norman. "Market Structure and Trade in Developing Countries" In
R. Albert Berry (ed.) Market Struaure in Developing Countries. London:Allen and Unwin, 1984.
Leverage International (Consultants) Inc. with the collaboration of the
Philippine Shipbuilders and Repairers Association (PHILSAR). 10-Year
Development Planfor Shipbuilding,Repairingand Breaking.Manila: Board ofInvestments, 1990.
Malaya Shipping Special Feature."Shipyard business in the Philippines."June28, 1993.
Maritime Industry Authority (Marina). Marina Annual Accomplishment
Reports, 1983-1992. Manila: Marina, Department of Transportation andCommunicadons, various years.
"Maritime Industry Authority (Marina) Accomplishment Reports 1983-1992." Republic of the Philippines. Department of Transportation andCorrtrnunic _tions, Marina.
"Memorandum Circulars and Technical Notes" undated.
."Development Plan for 1988." Mimeographed.
Maritime Industry Authority-Japan International Cooperation Agency(Marina-JICA). "Study on the Philippine Maritime Sector." Report,1991.
Medalla, Erlinda M. "Assessment of the Tariff Reform Program and Trade
Liberalization." Tariff Commission-PIDS Joint Research Project Staff
Paper Series No. 86-03. Makati: Philippine Institute for DevelopmentStudies, 1986.
Nathan and Associates, Inc. "Inter-Island Shipping Rate RationalizationStudy." Drafx Final Report for the Board of [nvesunents, United States
Agency for International Development, 1991.
National Census and Statistics Office (NCSO). Annual Census of
Establishments,censal years 1972-1988. Manila: NCSO, various years.
National Economic and Development Authority (NEDA). Statistical
Yearbooks198I-I992. Manila: NEDA, various years.
Nishimizu, Mieko and John M. Page, Jr. "Productivity Change and
Dynamic Comparative Advantage." Review ofEconomicsand Statistics68, 2
(1986): 241-47.
9 0 _1 EdwinGil Q, Mendoza
. "Total Factor Productivity Growth, Technological Progress,
andTechnical Efficiency Change: Dimensions of Productivity Change in
Yugoslavia: 1965-78" The EconomicJournal 92, 368 (1982): 920-36.
Nishinfizu, Mieko and Sherman Robinson. "Productivity Growth in
Manufacturing:' In H. Chenery, S. Robinson, and M. Syrquin (eds.)
Industrialization and Growth: A Comparative Study. Oxford: OxfordUniversity Press, 1986.
. "Trade Policies and Productivity Change in Semi-industrialized Countries."Joumal of Development Economics16, 1 and 2(1984): 177-206.
Pack, Howard and Larry Westphal. "Industrial Strategy and TechnologicalChange: Theory versus Reality:'Joumal of Development Economics22, 1(1986): 87-128.
"Industrialization and Trade." In H. Chenery and T.N.Srinivasan (eds.) Handbook of Development Economics,Vol. 1.Arnsterdam:North-Holland, 1988.
Page, John M, Jr. "Firm Size and Technical Efficiency: Application of
Production Frontiers to Indian Survey Data." Journal of DevelopmentEconomics16 (1984): 129-52.
. "Technical Efficiency and Economic Performance: Some
Evidence from Ghana." Oxford EconomicPapers32, 2 (1980): 319-39.
Pante; Filologo, Jr. and Erlinda M. Medalla. "The Philippine Industrial
Sector: Policies, Programs, and Performance." PIDSWorking Paper Series
No. 90-18. Makati: Philippine Institute for Development Studies, 1990.
Patalinghug, Epictetus E. "A Comment: Trade Policy Reforms and the
Performance, Competitiveness and Structure of the Ph!lippine
Shipbuilding/Repai r and Boatbuilding Industry." Comments on _,uthor'spaper, May 1994.
Pineda,Virginia S."A Study of the Effects of the Tariff RefOrm and Import
Liberalization on the Paper Industry." Tariff Commission-PlDS Joint
Research Project Staff Paper Series No. 86-13. Makati_ PhilippineInstitute for Development Studies, 1986. ?
Power, John H. "The Implementation of Import Liberalization and Tariff
Reform in the Philippines: Phasing and Complementary Measures."Tariff
Commission-PlDS Staff Paper Series No. 86-06. Makati: PhilippineInstitute for Development Studies, 1986.
Shipbuilding/Repairand BoatbuildingIndustry Ilb 9 1
"Tariffs and Economic Development: The ILationale for Philippine Tariff
Reform."Tariff Conunission-PlDS StaffPaper Series No. 86-02. Makad:
Philippine Institute for Development Studies, 1986.
Porter, Michael E. Competitive Advantage of Nations. New York: The FreePress, 1990.
Private Development Corporation of the Philippines (PDCP). Industry
Studies (ShipbuildingIndustry). Manila: PDCP, 1972.BoatbuildingIndustry. Manila: PDCP, 1972.
ILodrik, Dani. "Closing the Technology Gap: Does Trade Liberalization
Really Help?" National Bureau of Economic Research Working PaperNo. 2654. Cambridge, Massachusetts: National Bureau of EconomicResearch, 1988.
. ":Imperfect Competition, Scale Economies, and Trade Policy
in Developing Countries." In Robert Baldwin (ed.) TradePolicyIssuesand
EmpiricalAnalysis. Chicago: Chicago University Press, 1988.
. "The Limits of Trade Policy Reform in DevelopingCountries." Joumal of EconomicPetspeaives6, 1 (1992): 8%105.
Sycip, Gorres, and Velayo (SGV). Ban/ers to Entry. Manila: SGV, 1992.
Tan, Elizabeth S. "A Study of the Comparative Advantage of the Home
Appliance Industry." Tariff Commission-PIDS Joint Research ProjectStaff Paper Series No. 86-12. Makati: Philippine'Institute forDevelopme:at Studies, 1986.
Tariff Commi,sion. Tariffs and Customs Code, 1983, 1986, 1988. Manila:
Tariff Coml_ssion, various years.
The 15thAsian and Pacific Shipbuilding Experts Meeting, Country Reports
from-the Philippines, Japan, South Korea, Thailand, Indonesia, China,
Singapore. October, 1991.
Tecson, Gwendolyn R. "Performance, Competitiveness, and Structure of
Philippine Manufacturing Industries:A Research Design." PlDSWorking
Paper Series No. 92-02. Makati: Pitilippine Institute for DevelopmentStudies, 1992.
Tybout, James, Jaime de Melo, and Vittorio Corbo. "The Effects of TradeReforms orl Scale and Technic_ E_ciencv: New Evidence from Chile,"
Journal of InternationalEconomics31 (1991): 231-250.
." Linking Trade and Productivity: New Research Directions?'The World[:'_nk EconomicReview 6, 2 (1992): 189-211.

9 2 ,,II EdwinGil Q. Mendoza
World Bank."Colombia: Industrial Competition and Performance." Reportfor World Bank research project "Industrial Competition, Productive
Efficiency, and Their Relation to Trade Regimes" (RPO 674--46).
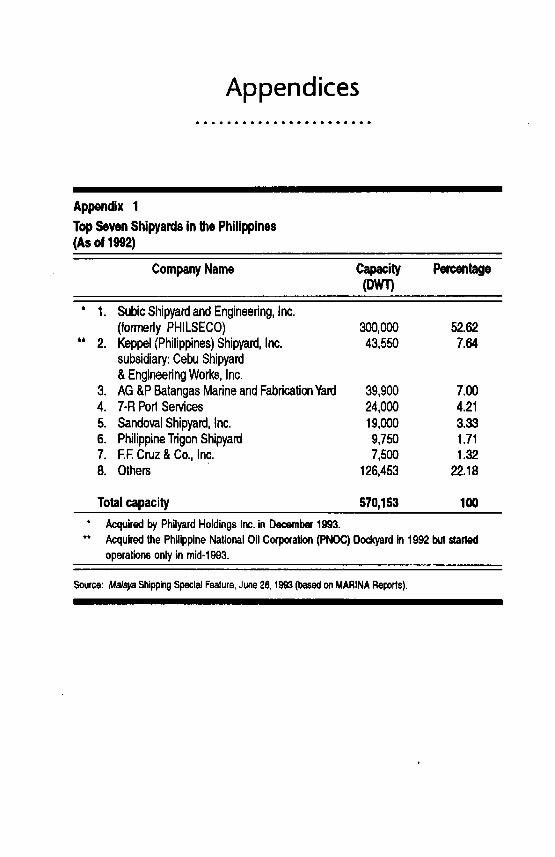
Appendices_ 61_ _o e eoo e oe o ee eeoe oo4,
IIIII IIImm|
Appendix 1
TopSevenShipyardsinthePhilippines(Asof1992)
CompanyName Capacity Percentage(DWT)
" 1. SubicShipyardandEngineering,Inc.(formerlyPHILSECO) 300,000 52.62
'* 2. Keppet{Philippines)Shipyard,Inc. 43,550 7.64subsidiary:CebuShipyard&EngineeringWorks,Inc.
3. AG&PBatangasMarineandFabdcationYard 39,900 7.004. 7-RPortServices 24,000 4.215. SandovalShipyard,Inc. 19,000 3.336. PhilippineTdgonShipyard 9,750 1.717. F.F.Cruz&Co.,Inc. 7,500 1.328. Others 126,453 22.18
Totalcapacity 570,153 100
* Acquired by Philyard Holdings Inc. in December 1993.
** Acquired the PhilippineNational Oil Corporation(PNOC) Dockyard in 1992 but started
operations only in mid-1993.
Source:Ma/ayaShippingSpeclaJFeature,June28, 199_(basedonMARINAReports).
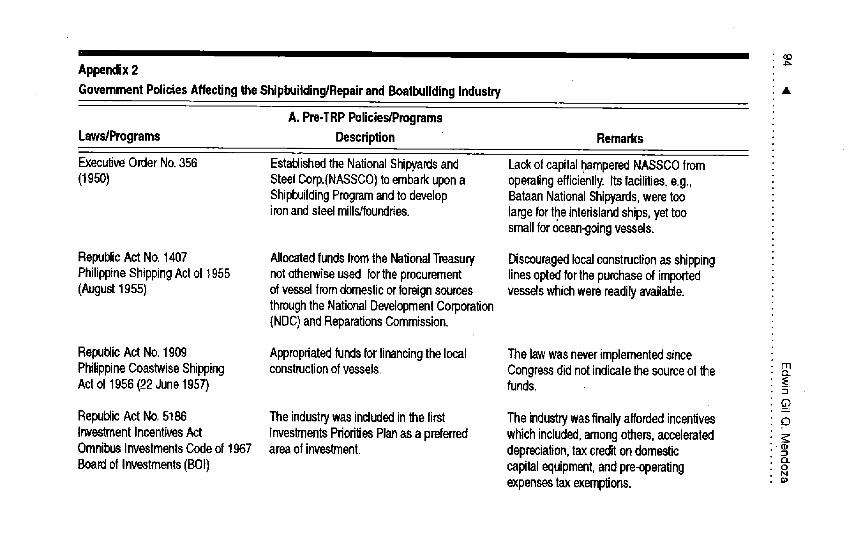
C.D
Appendix2 "_
GovernmentPoliciesAffectingtheShipbuitding/RepairandBoatbuildingIndustry A
A. Pre-TRPPolicies/ProgramsLaws/Programs Description Remarks
ExecutiveOrderNo.356 Esta_ishedtheNationalShipyardsand LackofcapitalhamperedNASSCOfrom(1950) SteelCorp.(NASSCO)toembarkupona operatingefficiently.Itsfacilities,e.g.,
Ship_ildingProgramandto develop BataanNationalShipyards,weretooironandsteelmills/foundries, largefortheinterislandships,yettoo
smallfor_ean-goingvessels.
RepublicActNo.1407 AllocatedfundsfromtheNationalTreasury DiscouragedlocalconstructionasshippingPhilippineShippingActof t955 nototherwiseusedfortheprocurement linesoptedforthepurchaseofimported(August1955) ofvesselfromdomesticorforeignsources vesselswhichwerereadilyavailable.
throughtheNationalDevelopmentCorporation(NDC)andReparationsCommission.
Repui:licActNo.1909 Appropriatedfundsforfinancingthelocal ThelawwasneverimplementedsincePhilippineCoastwiseShipping constructionofvessels. Congressdidnotindicatethesourceof the o_rnActof1956(22June1957) funds. _-
G;RepublicActNo.5186 Theindustrywasincludedinthefirst TheindustrywasfinallyaffordedincenfivesinvestmentIncentivesAct InvestmentsPrioritiesPlanasa preferred whichincluded,amongothers,acceleratedOmnibusInvestmentsCodeof1967 areaof inveslment, depreciation,taxcreditondomestic =_
£)..
Boardof Investments(BOt) capitalequipment,andpre-operating oNexpensestaxexemptions. =
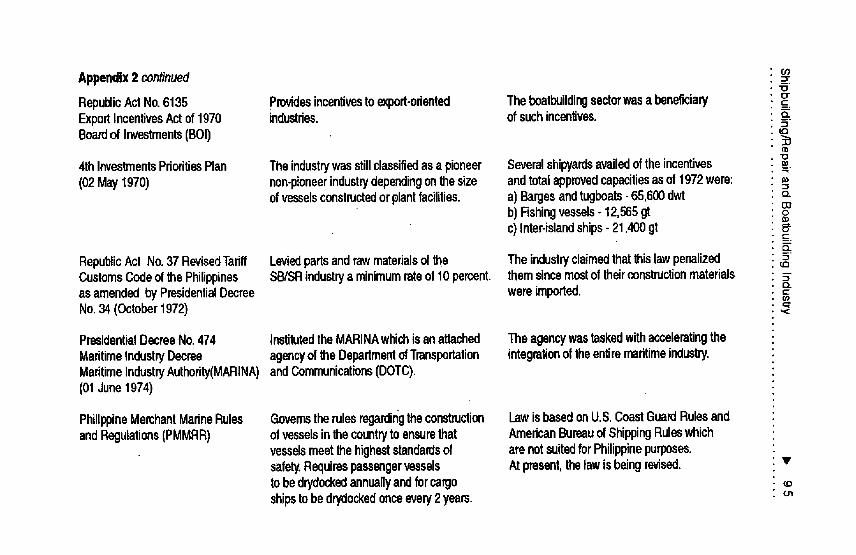
Appendix2 continued __.'10
RepublicActNo.6135 Providesincentivestoexport.odented Theboatbuildingsectorwasa beneficiary _c.°-ExportIncentivesActof1970 industries, ofsuchincentives. _:Boardof Investments(8OI) -_
tb"O
4thInvestmentsPrioritiesPlan Theindustrywasstillclassifiedasa pioneer Severalshipyardsavailedoftheincentives =(02May1970) non-pioneerindustrydependingonthesize andtow approvedcapacitiesasof1972were:
ofvesselsconstructedorplantfacilities, a)Bargesandtugboats-65,600dwt o.mb)Fishingvessets- 12,565gt oc) Inter-islandships- 21,400gt _-
0..
RepublicActNo.37RevisedTariff Leviedpartsandrawmaterialsofthe Theindustryclaimedthatthistawpenalized _5CustomsCodeofthePhilippines SB/SRindustrya minimumrateof10percent, themsincemostof theirconstructionmaterials _.asamendedbyPresidentialDecree wereimported. ,-No.34(October1972) ,<
PresidentialDecreeNo.474 institutedtheMARINAwhichisanattached TheagencywastaskedwithacceteratingtheMaritimeIndustryDecree agencyoftheDepartmentofTransportation integrationoftheentiremaritimeindustry.MaritimeIndustryAuthodly(MARlNA)andCommunications(DOTC).(01June1974)
PhilippineMerchentMarineRules Governstherulesregardingtheconstruction LawisbasedonU.S.CoastGuardRulesandandRegulations(PMMRR) ofw,sselsinthecountrytoensurethat AmericanBureauofShippingRuleswhich
vesselsmeetthehigheststandardsof arenotsuitedforPhilippinepurposes.safety.Requirespassengervessels Atpresent,thetawisbeingrevised. •tobedrydockedannuallyandforcargo ,.oshipstobedrydockedonceevery2 years, o,
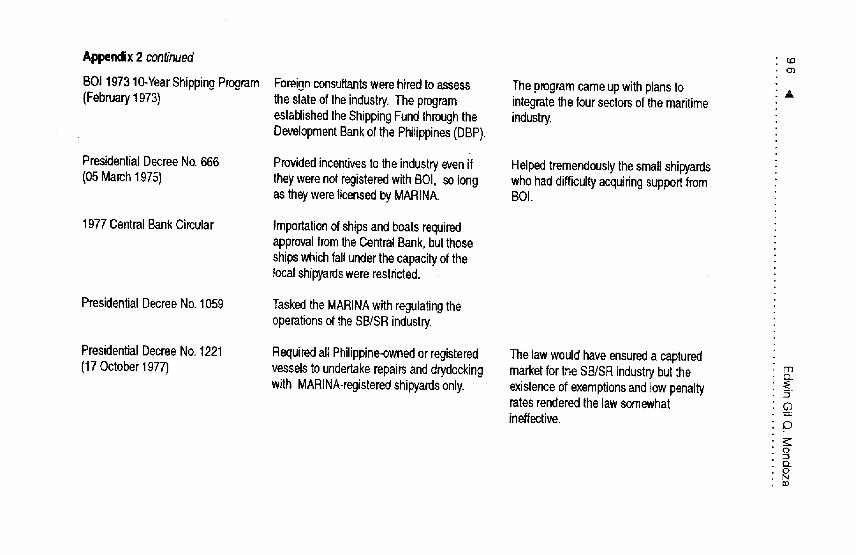
Appe_iix2 conUnued :o,0;,
BOI1973lO-YearShippingProgram Foreignconsultantswerehiredtoassess Theprogramcameupwithplansto ,t,,(February1973) thestateof theindustry.Theprogram integratethefoursectorsof themaritime
establishedtheShippingFundthroughthe industry.DevelopmentBankofthePhilippines(DBP).
PresidentialDecreeNo.666 Providedincentivestotheindustryevenif Helpedtremendouslythesmallshipyards(05March1975) theywerenotregisteredwithBOI,solong whohaddifficultyacquiringsupportfrom
astheywerelicensedbyMARINA. BOI.
1977CentralBankCircular ImportationofshipsandboatsrequiredapprovalfromtheCentralBank,butthoseshipswhichfallunderthecapacityofthelocalshipyardswererestricted.
PresidentialDecreeNo.1059 TaskedtheMARINAwithregulatingtheoperationsoftheSE_SRindustry.
PresidentialDecreeNo.12.21 RequiredallPhilippine-ownedorregistered Thelawwouldhaveensureda captured(17October1977) vesselstoundertakerepairsanddrydocking marketfortheSB/SP,industrybutthe m
with MARINA-registeredshipyardsonly. existenceofexemptionsandtowpenalty _--E3
ratesrenderedthelawsomewhatineffective. D
(b
0

Appendix2 con_nued o_"OET__.
B.TradeReformProgram _.
1981TariffReformProgram Revisedthetariffratesfortheimportation RefertoAppendices5and6 fordetails. 3D(TRP) ofvesselstoIhe10to50percentrange ,D"O
overa5-yearperiod. _-
CL1981ImportUbaralizationProgram Aimedfortheremovalofquantitative Shelvedbecauseoftheforeign oo(tLP) restrictionsonseveralimporteditems, exchangecrisisin1983. =°
c'-
C.Post-TRPPolicies/Programs"1
P.D.No.1955 Cancellationof P.D.666 Theincreaseinoperatingcostsforthesmall 5(15October1984) shipyardsadverselyaffectedtheiroperations. ,-_-
CO
MarinaMemoCircular(MC)No.32 RestoredtheincentivesunderP.D.666 TheSB/SRwereagaingivenincentives '<FIRBResolutionNo.3-86 formeriygrantedto theindustry, suchas tax-f_ importationofrawmaterials.(_ February1986)
MarinaMCNo.25-D Revisedtheagelimitation(vesselsmust Totallyrestrictedtheimportationof(01July1986) be<15years)andotherguidelinesin pleasurecraltsandbarges.
theimportationorbareboatcharterofinter-islandvessels.
ImportUberalizationProgramPhase Removedthequantitativerestrictions ApprovalfromCentralBankisnolonger •(Apd11986-Aprit1988) ontheimportationofpleasure requiredwhenimportingpleasurecrafts. ©C8Circular1109(18Juty1986) craftsandyachts. -._
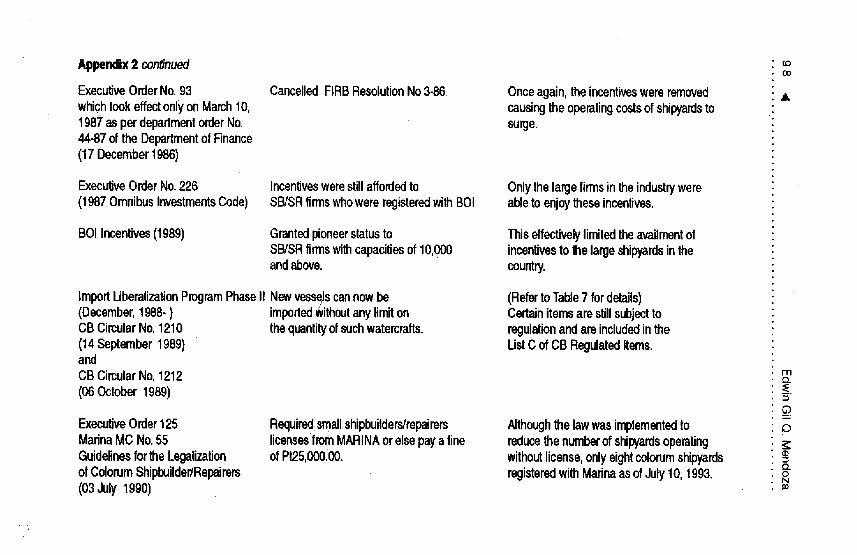
Appendix2 cor#nued ©Co
ExecutiveOrderNo.93 CancelledFIRBResolutionNo3-86. Onceagain,theincentiveswereremoved •whichtookeffectonlyonMarch10, causingtheoperatingcostsofshipyardsto1987asperdepartmentorderNo. surge.44-87oftheDepartmentofFinance(17December1986)
ExecutiveOrderNo.228 Incentiveswerestillaffordedto Onlythelargefirmsintheindustrywere(1987OmnibusInvestmentsCode) SB/SRfirmswhowereregisteredwithBOt abletoenjoytheseincentives.
BOIIncentives(1989) Grantedpioneerstatusto ThiseffectivelylimitedtheavailmentofSB/SRfirmswithcapacitiesof10,000 incentivestothelargeshipyardsintheandabove, country.
ImportUberalizationProgramPhaseII Newvess_scannowbe (RefertoTable7 fordetails)(December,1988-) impartedWithoutanylimiton CertainitemsarestillsubjecttoC8CircularNo.1210 thequantityofsuchwatercrafts, regulationandareincludedinthe(14September1989) UstC ofCBRegulatedItems.andCBCircularNo.1212(06October1989) -_-
ExecutiveOrder125 Requiredsmallshipbuilders/repairers AlthoughthelawwasimplementedtoMarinaMCNo.55 licensesfromMARINAorelsepayaline reducethenumberofshipyardsoperating _:GuidelinesfortheLegalization ofPt,?.5,000._. withoutlicense,onlyeightcolorumshipyards =_'
Q.
of ColorumShipbuilder/Repairers registeredwithMarinaasofJulyt0, 1993. o(03July1990)
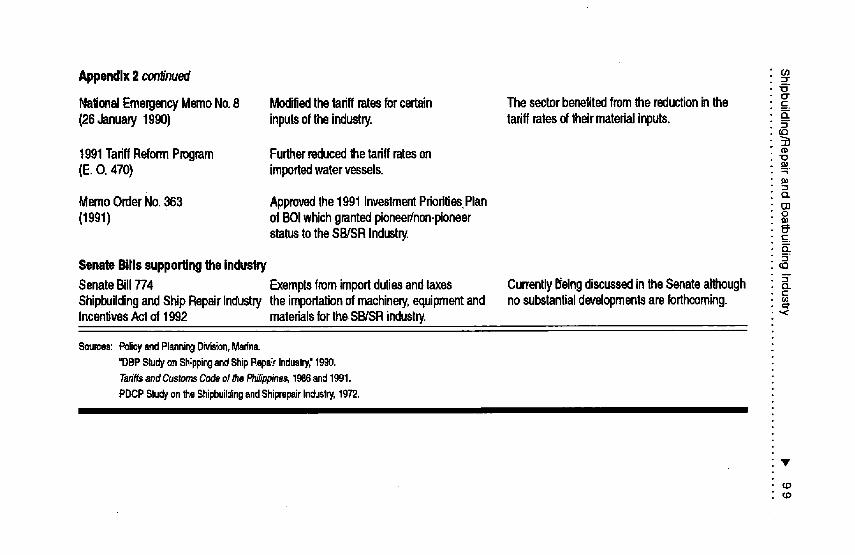
Appendix2 cor_nued"4Oo"
NationalEmergencyMemoNo.8 Modifiedthetariffratesforcertain Thesectorbenefitedfromthereductioninthe c_(26Januaryt990) inputsoftheindustry, tariffratesoftheirmaterialinputs.
t_
t991TariffReformProgram Furtherreducedthetariffrateson -o(E.O.470) importedwatervessels. _
CLMemoOrderNo.363 Approvedthe1991InvestmentPriorities.Plan _o(1991) ofBOIwhichgrantedpioneer/non-pioneer o
statustotheSB/SRIndustry. ,-5_t-_
SenateBills supportingtheindustry _0
SenateBill774 Exemptsfromimportdutiesandtaxes CurrentlyI_e]ngdiscussedintheSenatealthough n5-ShipbuildingandShipRepairIndustrytheimportationofmachinery,equipmentand nosubstantialdevelopmentsareforthcoming. =Incenl_vesActof1992 materialsfortheSB/SRindustry. "<
Sources: PdicyandPlanningDivisbn,Marina.
"DBPS_JdyonShippingandShipRepe_"Industry:lggO.
TariffsandCustoms Code#the Ph//ipp/ne$,1_6 and1991.
PDCPStudyontheShipbuildingandShiprepeJrIndustry,1972.
V
¢D
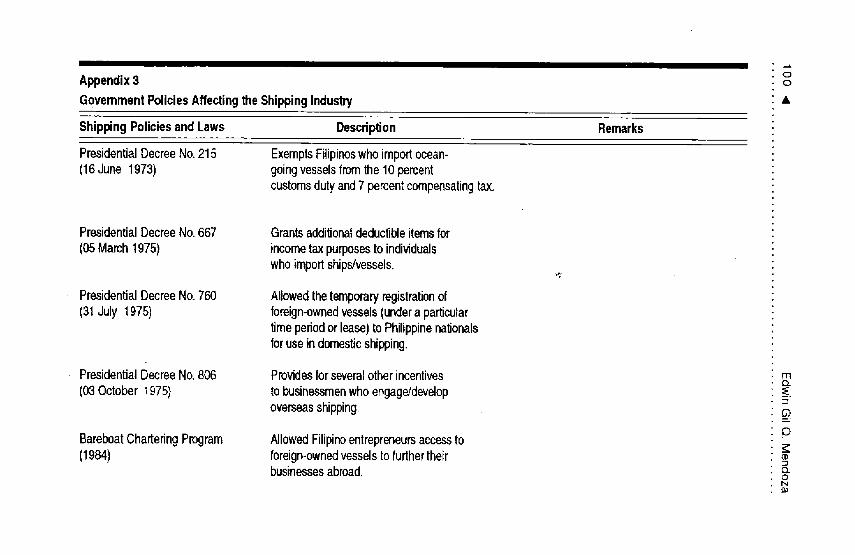
oAppendix3 o
GovernmentPoliciesAffectingtheShippingIndustry •
ShippingPoliciesandLaws Descdption Remarks
PresidentialDecreeNo.215 ExemptsRiipinoswhoimportocean-(16June1973) goingvesselsfromthe10percent
customsdutyand7 percentcompensatingtax.
PresidentialDecreeNo.667 Grantsadditionatdeductibleitemsfor(05March1975) incometaxpurposesto indi_duals
whoimportships/vessels.
PresidentialDecreeNo.760 Allowedthetemporaryregistrationof(3t July 1975) foreign-ownedvessels(undera pa_cular
timepedodorlease) toPhilippinena_onalsforuseindomesticship_ng.
PresidentialDecreeNo.806 Providesforseveralotherincentives rno_(03October 1975) tobusinessmenwhoengage/develop __.
::3
overseasshipping,o
BareboatCharteringProgram AllowedFilipinoentrepreneursaccessto E(1984) foreign-ownedvesselstofurthertheir
businessesabroad, aON
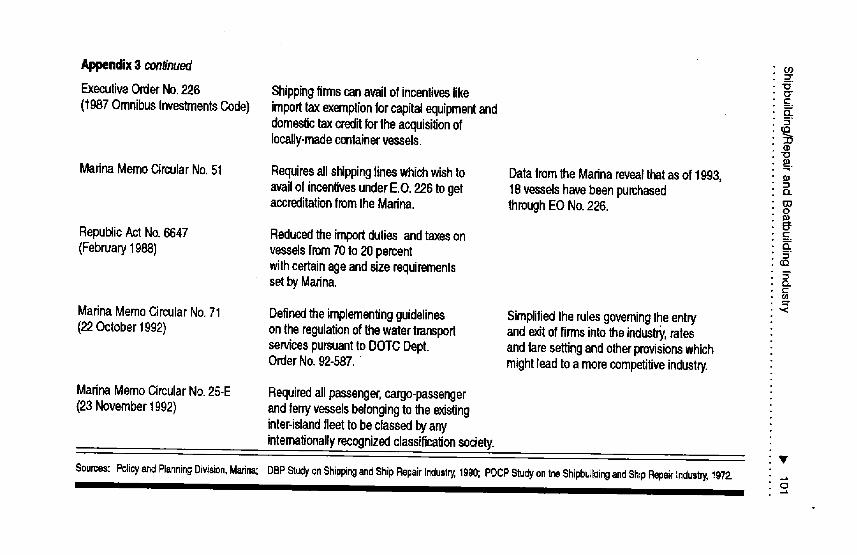
Appendix3 coMnued _"0
ExecutiveOrderNo.226 Shippingfirmscanavailof incentiveslike cr_c.(1987OmnibusInves_entsCode) impodtaxexemptionforcapitalequipmentand
domesSctaxcreditfortheacquisitionofIocafly-madecontainervessels, a,
nO_.-_r
MarinaMemoCircularNo.51 Requiresallshippinglineswhichwishto DatafromtheMannarevealthatasof1993, _,availol incenlJvesunderE,O.226toget 18vesselshavebeenpurchased naccreditationfromtheMarina. throughEONo.226. om
_c.RepublicActNo.6647 Reducedtheimportdutiesandtaxeson _-(February1988) vesselsfrom70to20percent 5r_
withcertainageandsizerequirements 5-setbyMarina. Q=0')
MarinaMemoCircularNo.71 Definedtheimplementingguidelines $impJifiedtherulesgoverningtheentry(22October1992) ontheregulationofthewatertransport andexitoffirmsintotheindustry,rates
servfcespursuanttoDOTCDept. andfaresettingandotherprovisionswhichOrderNo.92-587. mightleadtoa morecompetitiveindustry.
MarinaMemoCircularNo.25-E Requiredallpassenger,cargo-passenger(23November1992) andterryvesselsbelongingtotheexisting
inter-islandfleettobeclassedbyanyinternationallyrecognizedclassificationsociety.
Sources:PolicyandPl_mningDivision,Marina;DSPStudyonShippingandShipRepairInduslry,1990;PDCPSludyontheShipbui_iingandShipRepairlndustq,'1972.._e,
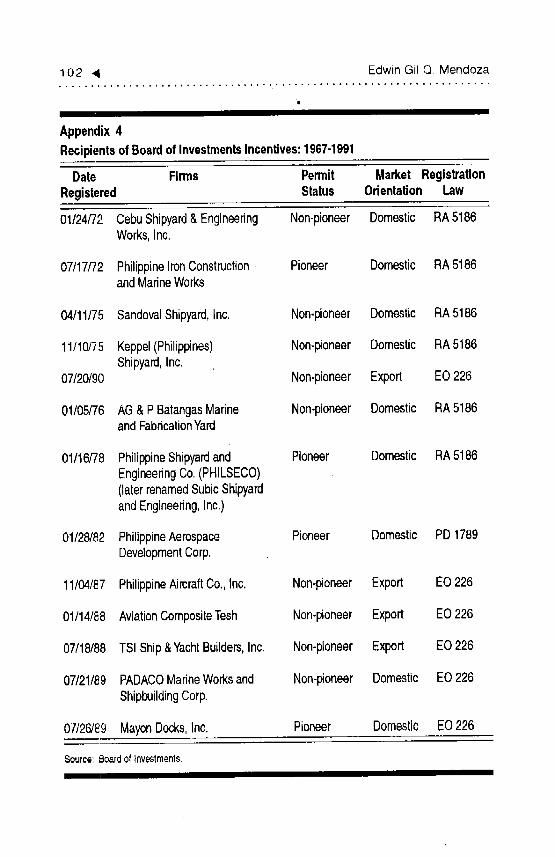
102 4 EdwinGil Q Mendoza
'!
I II I I II
Appendix4RecipientsofBoardofInvestmentsIncentives:1967-1991
Date Firms Permit Market RegistrationRegistered Status Orientation Law
01/24/72 CebuShipyard&Engineering Non-pioneer Domestic RA5186Works,Inc.
07/17/72 PhilippineironConstruction. Pioneer Domestic RA5186andMarineWorks
04/11/75 SandovalShipyard,Inc. Non.pioneer Domestic RA5186
11/10/75 Keppel(Philippines) Non-pioneer Domestic RA5186Shipyard,inc.
07/20/90 Non.pioneer Export EO226
01/05/76 AG&PBatangasMarine Non.pioneer Domestic RA5186andFabricationYard
01/16/78 PhilippineShipyardand Pioneer Domestic RA5186EngineeringCo.(PHILSECO)(laterrenamedSubicShipyardandEngineering,Inc,)
01/28/82 PhilippineAerospace Pioneer Domestic PD1789DevelopmentCorp.
11/04/87 PhilippineAJrcraftCo.,Inc. Non-pioneer Export EO226
01/14/88 AviationCompositeTesh Non-pioneer Export EO226
07/18/88 TSlShip&YachtBuilders,Inc. Non-pioneer Export EO226
07/21/89 PADACOMarineWorksand Non-pioneer Domestic EO226ShipbuildingCorp.
07/26/£9 MayonDocks,Inc. Pioneer Domestic EO226
Source:_oardof Investments,
III I I I II
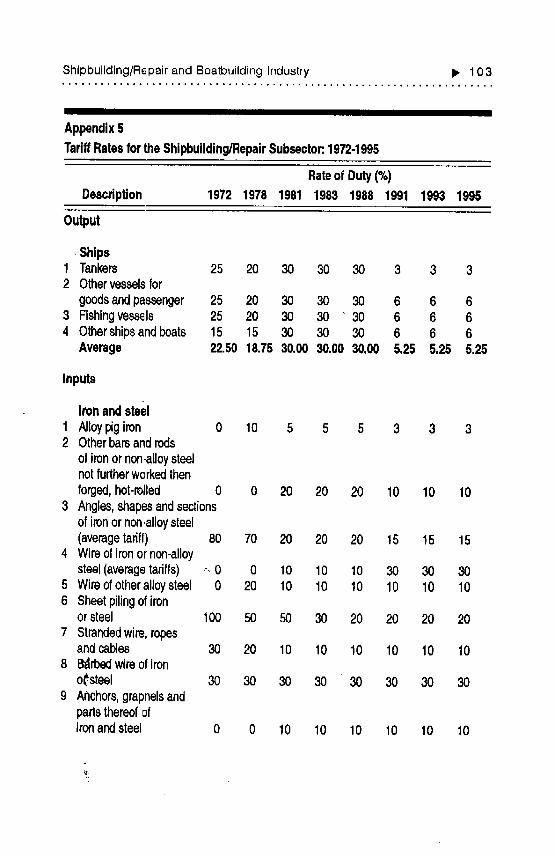
Shipbuilding/R_pairand BoatlouildingIndustry IP. 103......... 4_ .........................................................
III III IIII IIIII III I
Appendix5
TariffRatesfortheShipbuilding/RepairSubsector:1972-1995
Rateof DuLy(%)Description 1972 1978 1981 1983 1988 1991 1993 1995
Output
Ships1 Tankers 25 20 30 30 30 3 3 32 Othervesselsfor
goodsandpassenger 25 20 30 30 30 6 6 63 Fishingvessels 25 20 30 30 " 30 6 6 640therships andboats 15 15 30 30 30 6 6 6
Average 22.50 18.7530.00 30.00 30.00 5,25 5.25 5.25
Inputs
Ironandsteel1 Alloypigiron 0 lO 5 5 5 3 3 32 Otherbarsandrods
ofironornon-alloysteelnotfurtherworkedthenforged,hot-rolled 0 0 20 20 20 10 10 10
3 Angles,shapesandsectionsof ironornon.alloysteel(averagetariff) 80 70 20 20 20 15 15 15
4 Wireofironornon-alloysteel(averagetariffs) -. 0 0 10 10 10 30 30 30
5 Wireofotheralloysteel 0 20 10 10 10 10 10 106 Sheetpilingof iron
orsteel 100 50 50 30 20 20 20 207 Strandedwire,ropes
andcables 30 20 10 10 10 10 10 108 I_rbedwireofiron
o_steel 30 30 30 30 30 30 30 309 Anchors,grapnelsand
partsthereofofironandsteel 0 0 10 10 10 10 10 10
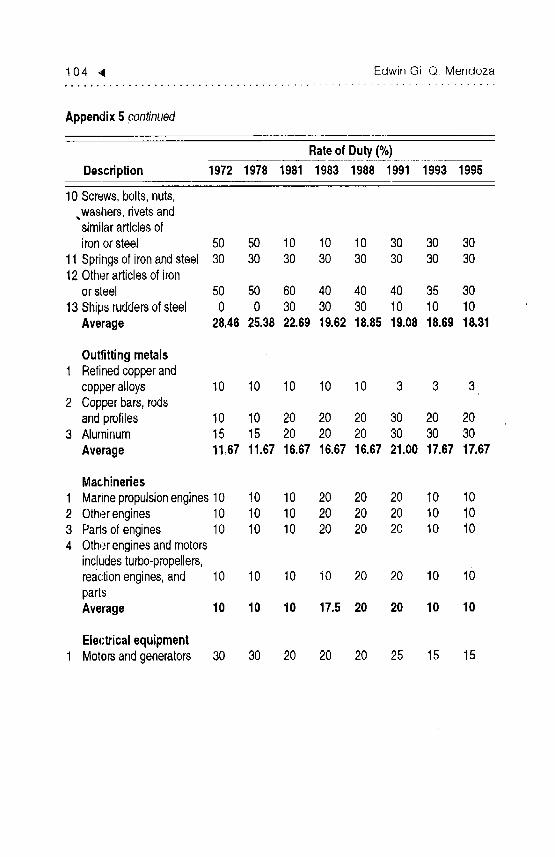
104 4 EdwinGil Q, Mendoza
Appendix5 continued
Rateof Duty(%)
Description 1972 1978 1981 1983 1988 1991 1993 1995
10Screws,bolts,nuts,washers,rivetsandsimilararticlesofironorsteel 50 50 10 10 10 30 30 30
11Springsof ironandsteel 30 30 30 30 30 30 30 3012Otherarticlesofiron
orsteel 50 50 60 40 40 40 35 3013Shipsruddersofsteel 0 0 30 30 30 10 10 10
Average 28.4625.38 22.69 19.62 18.85 19.08 18.69 18.31
Outfittingmetals1 Refinedcopperand
copperalloys 10 10 10 10 10 3 3 32 Copperbars,rods
andprofiles 10 10 20 20 20 30 20 203 Aluminum 15 15 20 20 20 30 30 30
Average 11.67 11.6716.67 16.67 16.67 21.00 17.67 17.67
Machineries1 Marinepropulsionengines10 10 10 20 20 20 10 102 Otherengines 10 10 10 20 20 20 10 103 Partsofengines 10 10 10 20 20 20 10 104 Otherenginesandmotors
includesturbo-propellers,reactionengines,and 10 10 10 10 20 20 10 10partsAverage 10 10 10 17.5 20 20 10 10
Electricalequipment1 Motorsandgenerators 30 30 20 20 20 25 15 15
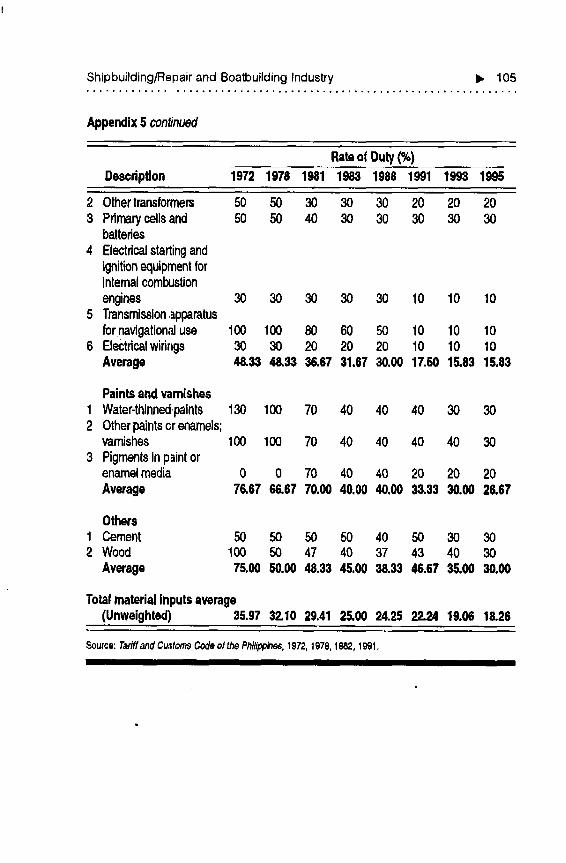
Shipbuilding/Repairand Boa_buildingIndustry I_ 105
Appendix5 continued
Rateof Duty(%)Description 1972 1978 1981 1983 1988 1991 1993 1998
2 Othertransformers 50 50 30 30 30 20 20 203 Primarycellsand 50 50 40 30 30 30 30 30
batteries4 Electricalstartingand
ignitionequipmentforinternalcombustionengines 30 30 30 30 30 10 10 10
5 Transmission,tpparatusfornavigation,'duse 100 100 80 60 50 10 10 10
6 Electricalwirings 30 30 20 20 20 10 10 10Average 48.33 48.33 36.67 31.67 30,00 17.5015.83 15.83
Paintsandvarnishes1 Water-thinned,paints130 100 70 40 40 40 30 302 Otherpaintsorenamels;
varnishes 100 100 70 40 40 40 40 303 Pigmentsinp,_intor
enamelmedia 0 0 70 40 40 20 20 20Average 76.8766.67 70.50 40.0040.50 33.33 30.00 26.67
OthersI Cement 50 50 50 50 40 50 30 302 Wood 100 50 47 40 37 43 40 30
Average 75,00 50.0048.33 45.50 38.33 46.67 35.00 30.50
Totalmaterialinputsaverage(Unweighted) 35.97 32.10 29.41 25.0024.25 22.24 19.06 18.26
Source: Taziffand Customs Code of the Phllipp_es, 1972, 1978, 1982, 1991.
i i I I I I
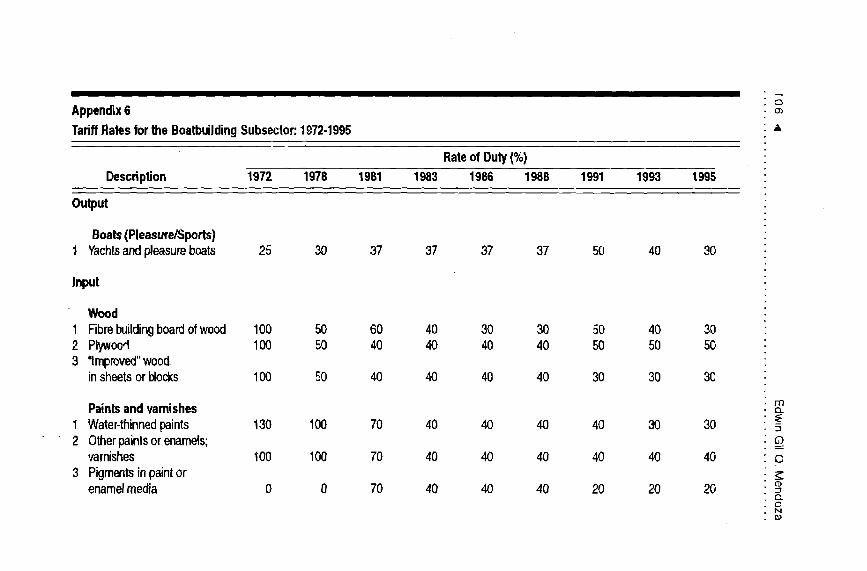
Appendix6
TariffRatesfortheBoatbuildingSubsector:1972-1995 ,_
RateofDuty(%)
Descdption 1972 1978 1981 1983 1986 1988 1991 1993 1995
Output
Boats(Pleasure/Sports)1 Yachtsandpleasureboats 25 30 37 37 37 37 50 40 30
Input
Wood1 Fibrebuildingboardofwood 100 50 60 40 30 30 50 40 302 Plywood 100 50 40 40 40 40 50 50 503 =Improved"wood,
insheetsorblocks 1C0 50 40 40 40 40 30 30 30
Paintsandvamishes1 Water-thinnedpaints 130 100 70 40 40 40 40 30 30 5
° 2 Otherpaintsorenamels;varnishes 100 100 70 40 40 40 40 40 40 o
3 Pigmentsinpaintor z_enamelmedia 0 0 70 40 40 40 20 20 20
Q.ON
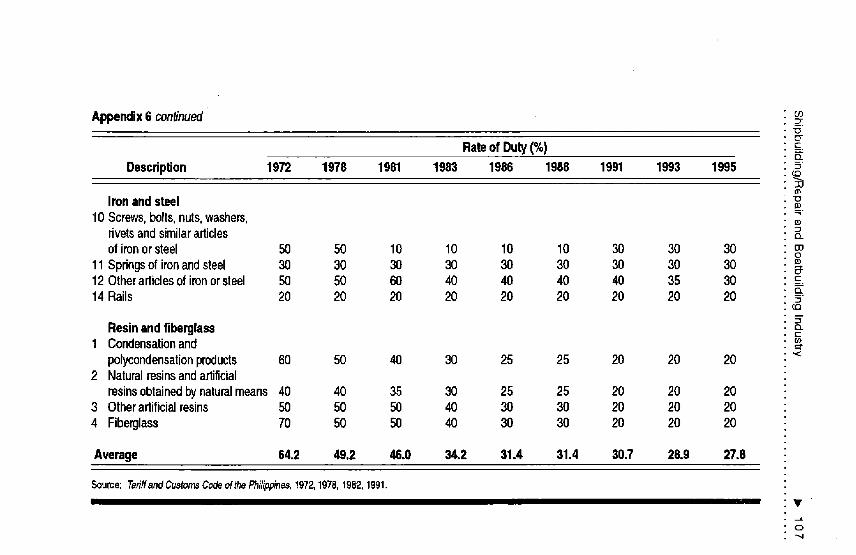
Appendix6 con_'nued"0o-
Rate of Duty(%) -=Q.
Description 1972 1978 1981 1983 1986 1988 1991 1993 1995 5-(II
Ironandsteel 2.
10Screws,bolts,nuts,washers,rivetsandsimilararticles o_of ironorsteel 50 50 10 10 10 10 30 30 30 m
0
11Spnngsof ironandsteel 30 30 30 30 30 30 30 30 30 _:12Otherarticlesof ironorsteel 50 50 60 40 40 40 40 35 30 c
Q..14Rails 20 20 20 20 20 20 20 2.0 20 5
r_Q
Resinandfiberglass cL(--
1 Condensationandpotycondensationproducts 60 50 40 30 25 25 20 20 20 '<
2 Naturalresinsandartificialresinsobtainedbynaturalmeans 40 40 35 30 25 25 20 20 20
3 Otherartificialresins 50 50 50 40 30 30 20 20 204 Fiberglass 70 50 50 40 30 30 20 20 20
Average 64.2 49.2 46.0 34.2 31.4 31.4 30.7 28.9 27.8
Source: Tariffand CustomsCodeof the Ph_ippines,1972,1978, 1982,1991.
V.--L
0
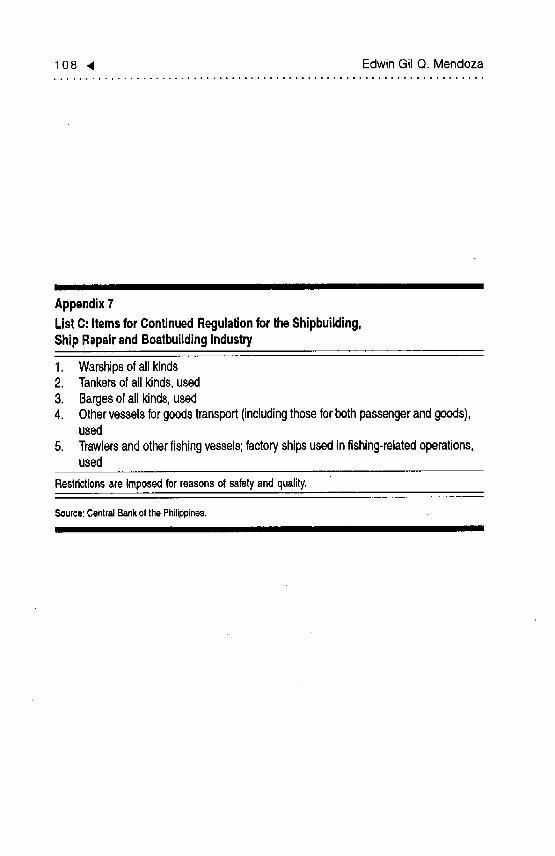
108 _ Edwin Gil Q, Mendoza
Appendix7
ListC: Itemsfor ContinuedRegulationfor theShipbuilding,Ship R_palrand BoatbuildingIndustry
1. Warshipsofall kinds2. Tankersof allkinds,used3. Bargesof all kinds,used4. Othervesselsfor goodstransport(includingthosefor bothpassengerandgoods),
used
5. Trawlersandotherfishingvessels;factoryshipsusedin fishing-relatedoperations,used
RestrictionsareImposedforreasonsofsafetyandquality.
Source:CentralBankofthePhilippines,lllll Ill _ ......
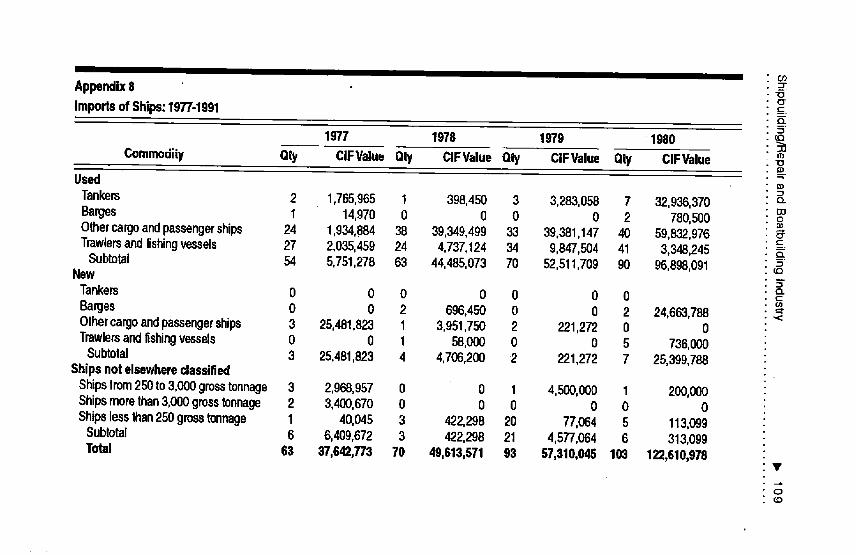
CO
Appendix8ImportsofShips:1977-1991 _-_
1977 1978 1979 1980Commodity Oty CIFValueOly CIFValueOly CIFValue Qty CIFValue _o
UsedTankers 2 1,765,965 1 398,450 3 3,283,058 7 32,936,370 o._oBarges I 14,970 0 0 0 0 2 780,500 omOthercargoandpassengerships 24 1,934,884 38 39,349,499 33 39,381,147 40 59,832,976TrawlersandI_shingvessels 27 2,035,459 24 4,737,124 34 9,847,504 41 3,348,245
Subtotal 54 5,751,278 63 44,465,073 70 52,511,709 90 96,898,091New
Tankers 0 0 0 0 0 0 0rj)
Barges 0 0 2 696,450 0 0 2 24,663,788 ,._Othercargoandpassengerships 3 25,481,823 1 3,951,750 2 221,272 0 0Trawlersandfishingvessels 0 0 1 58,000 0 0 5 736,000
Subtotal 3 25,481,823 4 4,706,200 2 221,272 7 25,399,788Shipsnotelsewhereclassified
Shipsfrom250to3,000grosstonnage 3 2,968,957 0 0 1 4,500,000 1 200,000Shipsmorethan3,000grosstonnage 2 3,400,670 0 0 0 0 0 0Shipslessthan250grosstonnage 1 40,045 3 422,298 20 77,064 5 113,099
Subtotal 6 6,409,672 3 422,298 21 4,577,064 6 313,099Total 63 37,642,773 70 49,613,571 93 57,310,045 103 122,610,978
r,D
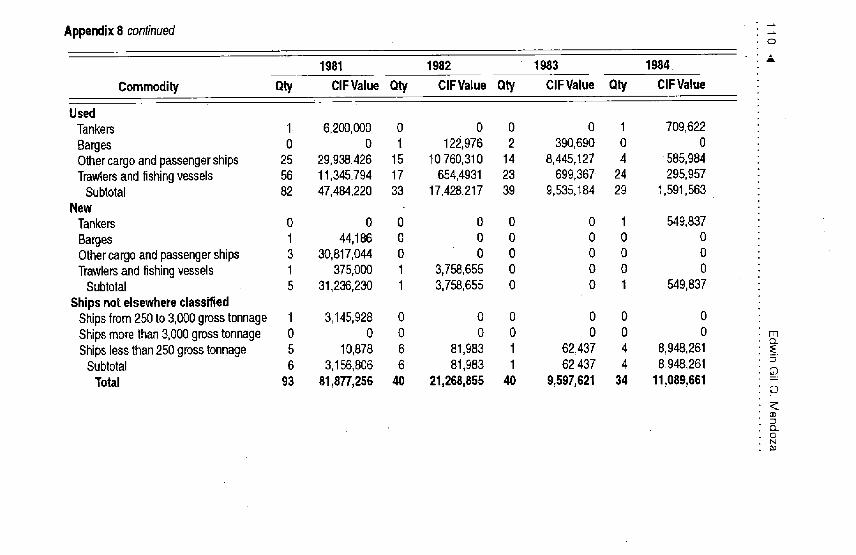
Appendix8 continued o
1981 1982 1983 1984. • ""
Commodity Oty ClFValue Qty ClFValue Oty CIFValue Oty CIFValue
UsedTankers 1. 6,200,000 0 0 0 0 1 709,622
Barges 0 0 1 122,976 2 390,690 0 0Othercargoandpassengerships 25 29,938,426 15 t0,760,310 14 8,445,127 4 -585,984Trawlersand fishingvessels 56 11,345,794 17 654,4931 23 699,367 24 295,957
Subtotal 82 47,484,220 33 17,428,217 39 9,535,184 29 1,591,563New
Tankers 0 0 0 0 0 0 1 549,837
Barges 1 44,186 0 0 0 0 0 00ther cargoandpassengerships 3 30,817,044 0 0 0 0 0 0Trawlersandfishingvessels 1 375r000 1 3,758,655 0 0 0 0
Subtotal 5 31,236,230 1 3,758,655 0 0 1 549,837
Shipsnot elsewhereclassifiedShipsfrom250 to3,000grosstonnage 1 3,t45,928 0 0 0 0 0 0Shipsmorethan3,000grosstonnage 0 0 0 0 0 0 0 0 mc'_
Shipslessthan250grosstonnage 5 10,878 6 81,983 1 62,437 4 8,948,261 _.Subtotal 6 3,156,806 6 81,983 1 62,437 4 81948,261
Total 93 81,8T'/',256 40 21,268,855 40 9,597,621 34 11,089,661 =O
O._ON
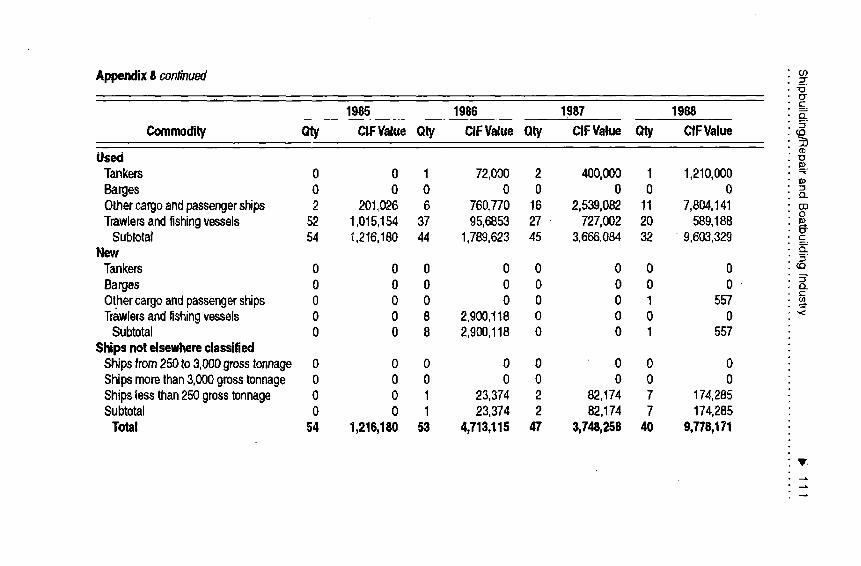
Appendix8 continued :_c_'oETc-
1985 1986 1987 1988
Commodity Qty CIFValueOty CIFValueQty CIFValue Oty ClFValue ¢_=(13
UsedTankers 0 0 1 72,000 2 400,000 1 1,210,000Barges 0 0 0 0 0 0 0 0 =o_Olhercargoandpassengerships 2 201,026 6 760,770 16 2,539,082 11 7,804,141 moTrawlersandfishingvessels 52 1,015,154 37 95,6853 27 • 727,002 20 589,188
Subtotaf 54 1,216,180 44 1,789,623 45 3,666,084 32 9,603,329 ___.New
Tankers 0 0 0 0 0 0 0 0Barges 0 0 0 0 0 0 0 0 • _.EE
Othercargoandpassengerships 0 0 0 0 0 0 1 557Trawlersandfishingvessels 0 0 8 2,900,118 0 0 0 0 '<
Subtotal 0 0 8 2,900,118 0 0 1 557Shipsnotelsewhereclassified
Shipsfrom250to3,000grosstonnage 0 0 0 0 0 0 0 0Shipsmorethan3,000grosstonnage 0 0 0 0 0 0 0 0Shipslessthan250grosstonnage 0 0 1 23,374 2 82,174 7 174,285Subtotal 0 0 1 23,374 2 82,174 7 174,285
Total 54 1,216,180 53 4,713,115 47 3,748,258 40 9,778,171
liar.
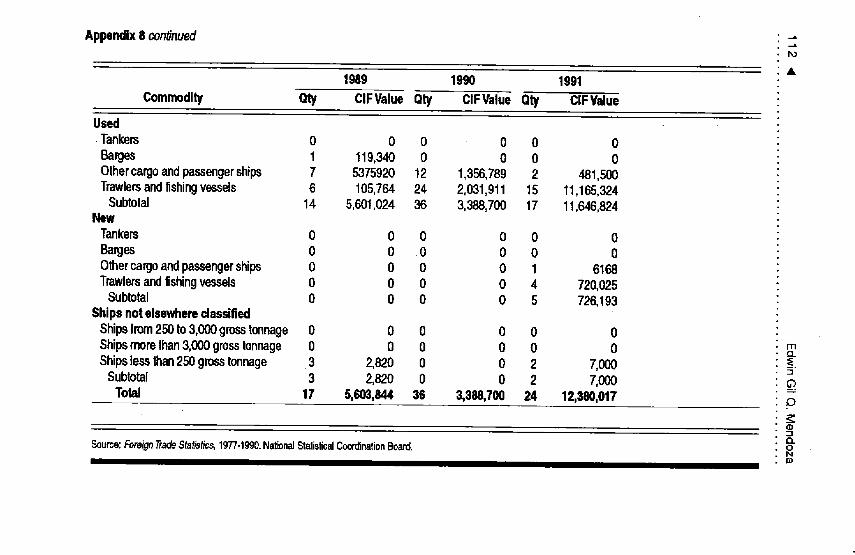
Appendix8 conUnued ..,t._¢PO
1989 1990 1991
Commodity Qty ClFValue Qty ClFValue Qty CiFValue
Used
•Tankers 0 0 0 0 0 0Barges 1 119,340 0 0 0 0Othercargoandpassengerships 7 5375920 12 1,356,789 2 481,500Trawlersandfishingvessels 6 105,764 24 2,031,911 15 11,165,324
Subtotal 14 5,601,024 36 3,388,700 17 11,646,824New
Tankers 0 0 0 0 0 0Barges 0 0 .0 0 0 0Othercargoandpassengerships 0 0 0 0 1 6168Trawlersandfishingvessels 0 0 0 0 4 720,025
Subtotal 0 0 0 0 5 726,193Shipsnotelsewhereclassified
Shipsfrom250to3,000grosstonnage 0 0 0 0 0 0Shipsmorethan3,000grosstonnage 0 0 0 0 0 0 rn
O..
Shipslessthan250grosstonnage 3 2,820 0 0 2 7,000 -_.Subtotal 3 2,820 0 0 2 7,000
Total 17 5,603,844 36 3,388,700 24 12,380,017
E).Source:.ForeignTradeStatistics,1977-1990.NationalStatisticalCoor_nationBoard, o
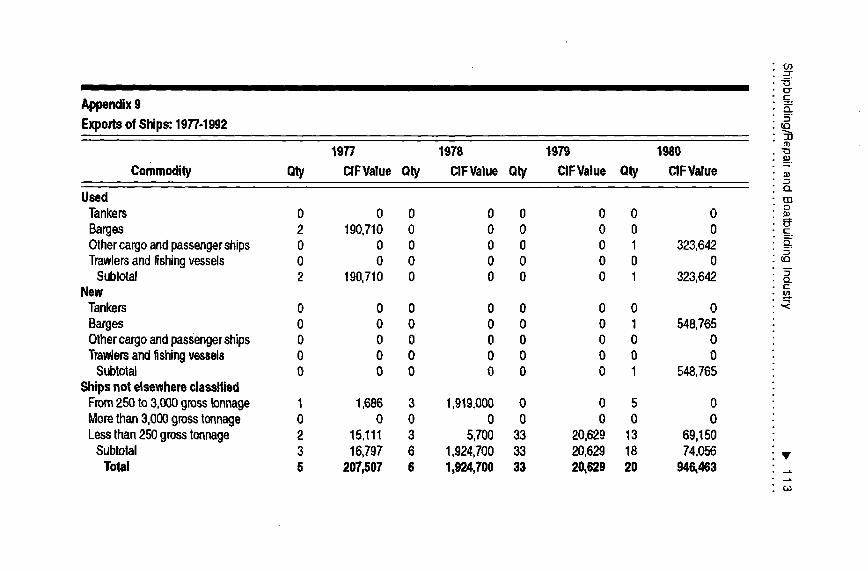
CO
O"c:
Appendix9 _.
ExportsofShips:1977-1992 _=if)
1977 1978 1979 1980 "o_.
Commodity Oty ClFValueOty CIFValueOty CIFValue Oly CIFValue _,£Z
Used mTankers 0 0 0 0 0 0 0 0 oBarges 2 190,710 0 0 0 0 0 0Othercargoandpassengerships 0 0 0 0 0 0 1 323,642TrawlersandIfshingvessels 0 0 0 0 0 0 0 0
Subtotal 2 190,710 0 0 0 0 1 323,642 __t.-
NewTankers 0 0 0 0 0 0 0 0 <Barges 0 0 0 0 0 0 1 548,765Othercargoandpassengerships 0 0 0 0 0 0 0 0Trawlersandfishingvessels 0 0 0 0 0 0 0 0
Subtotal 0 0 0 0 0 0 1 548,765Shipsnotelsewheredas_ied
From250to3,000grosstonnage 1 1,686 3 1,919,000 0 0 5 0Morethan3,0_ grosstonnage 0 0 0 0 0 0 0 0Lessthan250grosstonnage 2 15,111 3 5,700 33 20,629 13 69,150
Subtotal 3 16,797 6 1,924,700 33 20,629 18 74,056 •Total 5 207,507 6 1,924_700 33 20,629 20 946,463 __
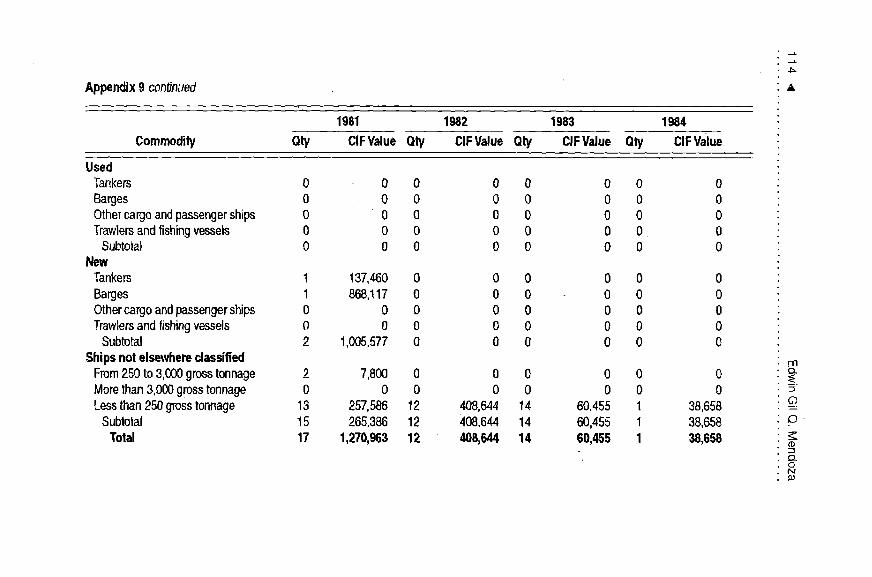
Appendix9 continued ,=
1981 1982 1983 1984
Commodity Oty CIFValueQty CiFValue Qty CIFValue Qty CIFValue
UsedTankers 0 0 0 0 0 0 0 0
Barges 0 0 0 0 0 0 0 0Othercargoandpassengerships 0 "0 0 0 0 0 0 0Trawlersandfishingvessels 0 0 0 0 0 0 0. 0
Subtotal 0 0 0 0 0 0 0 0New
Tankers t 137,460 0 0 0 0 0 0Barges 1 868,t17 0 0 0 0 0 0Othercargoandpassengerships 0 0 0 0 0 0 0 0Trawlersandfishingvessels 0 0 0 0 0 0 0 0
Subtotal 2 1,005,577 0 0 0 0 0 0Shipsnotelsewhereclassified rn
From250to 3,000grosstonnage 2 7,800 0 0 0 0 0 0Morethan3,000grosstonnage 0 0 0 0 0 0 0 0 =Lessthan250grosstonnage 13 257,586 12 408,644 14- 60,455 1 38,658
Subtotal t5 265,386 12 408,644 14 60,455 1 38,658 c)Total 17 1,270,963 12 408,644 14 60,455 1 38,658 -_CD
c)ON
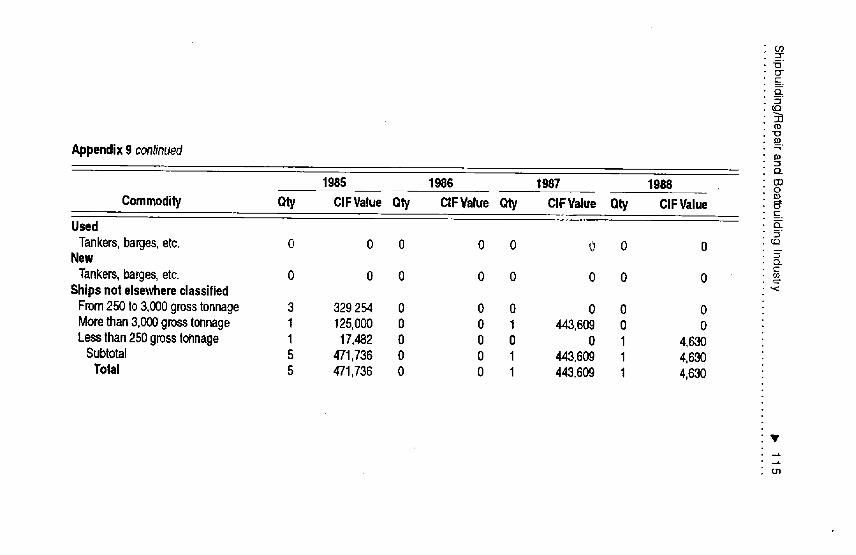
03
"100"
r_Q
,rc."0£0
Appendix9 continued __o
O_
1985 1986 1987 1988 0
Commodity Oty ClFValueOty CtFValueOty ClFValue Oty CIFValue(-
Used
Tankers,barges,etc. 0 0 0 0 0 0 0 0New D.
Tankers,barges,etc. 0 0 0 0 0 0 0 0Shipsnotelsewhereclassified
From250to3,000grosstonnage 3 329,254 0 0 0 0 0 0Morethan3,000grosstonnage 1 125,000 0 0 1 443,609 0 0Lessthan250grosstonnage 1 17,482 0 0 0 0 1 4,630
Subtotal 5 471,736 0 0 1 443,609 1 4,6;30Total 5 471,736 0 0 1 443,609 1 4,630
0"1
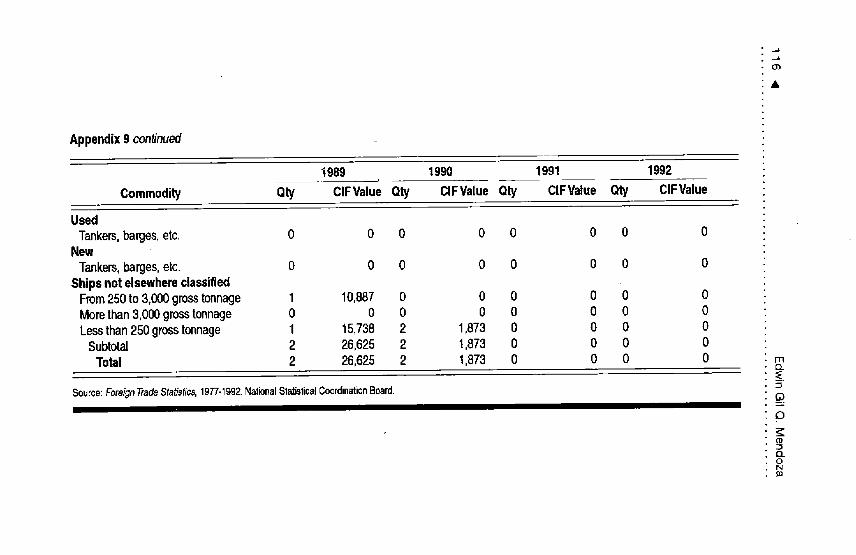
Appendix9 continued
1989 1990 1991 1992
Commodity Oty ClFValueOty ClFVatueOty ClFVatue Oty CIFValue
UsedTankers,barges,etc. 0 0 0 0 0 0 0 0
NewTankers,barges,etc. 0 0 0 0 0 0 0 0
ShipsnotelsewhereclassifiedFrom250to3,000grosstonnage 1 10,887 0 0 0 0 0 0Morethan3,000grosstonnage 0 0 0 0 0 0 0 0Lessthan250grosstonnage 1 15,738 2 1,873 0 0 0 0
Subtotal 2 26,625 2 t ,873 0 0 0 0Total 2 26,625 2 1,873 0 0 0 0
Source:ForeignTradeStatistics,1977-1992.NationalS_stioatCoordinationBoard. =
O
_D
O..O
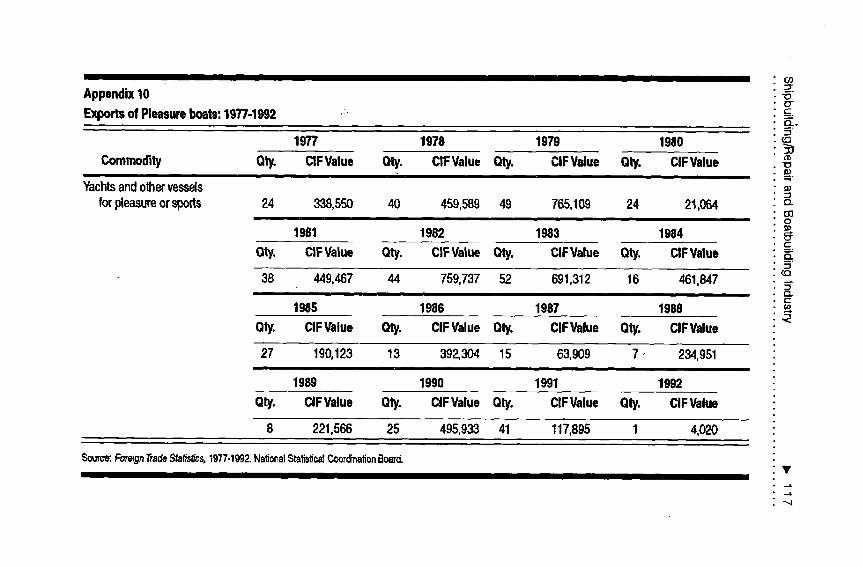
CO
Appendix10 _O"
Exportsof Pleasureboats:1977-1992 ,: _._..
1977 1978 1979 1980Commodity Qty. CIFValue Qty. CIFValue Qty. CIFValue Qty. CIFValue
_,,"
Yachtsandothervessels-1
forpleasureorsports 24 338,550 40 459,589 49 765,109 24 21,064 o.030
1981 1982 1983 1984 E_t,-
Qty. CIFValue Qty. CIFValue Qty. CIFValue Qty. CIFValue"1
(,Q
38 449,467 44 759,737 52 691,312 16 461,847 _.r-_¢-.
1985 1986 1987 1988
Qty. CiFValue Qty. CIFValue Qty. CIFValue Qty. ClFValue
27 190,123 t3 392,304 15 63,909 7. 234,951
1989 1990 1991 1992
Qty. CIFValue Qty. ClFValue Qty. CIFValue Qty. CJFValue
8 221,566 25 495,933 41 117,895 1 4,020
Source: Fo_'_gn Trade Stafisfics, '_977-1992. Nalional Sta_tica_ Coord_alion Board.V
._L
._L--4

.-L
Appendix 11 oo
imports of PleasureBoats: 1977-1991 •
1977 1978 1979 1980
Commodity Qty. CIFValue Qty. CIFValue Qty. CIFValue Qty. CIFValue
Yachtsandothervessels
forpleasureorsports 15 125,868 12 40,795 30 521,145 24 21,064
1981 1982 1983 1984
Qty. CIFValue Qty. CIFValue Qty. ClFValue Qty. CIFValue
6 201,118 10 23,491 9 33,087 5 25,029
1985 1986 1987 1988
Qty. CIFValue Qty. CIFValue Qty. CIFValue Qty. CIFValue
2 8,890 2 2,8T7 11 230,250 29 301,078
1989 1990 1991 rnEL
Qty. CIFValue Qty. CIFValue Qty. CIFValue __.
72 219,085 39 95,986 " 116 285,406o
Source:Fom.._Trade5"ta_s,1977-1990.Na_onaiSta_ticsCoordinationBoard.
ELON£C.

Shipbuilding/Repairand BoatbuildingIndustry _. 119
Appendix12TariffRatesandOtherVariablesUsedin DRC-EPRandTElEstimations
Boatbuilding ShipbuildingandRepair1983 1986 1988 1991 1983 1986 1988 1991
Salestaxes*(%)Outputj 10.00 20.00 10.00 10,00 10.00 20.00 10.00 10.00Inputsi 10.00 20.00 10,00 10,00 10.00 20.00 10.00 10.00Importmark-up 25,00 0.00 0.00 0.00 25.00 0.00 0.00 0.00Assets 10,00 20.00 10.00 10.00 10.00 20.00 10.00 10.00
Nominaltariffrates(%)Outputj 37.00 37.00 37.00 50.00 30.00 30.00 30.00 6.50Inputsi 27.88 22,87 22,87 16.26 15.70 15.60 15.60 15.40
Implicittariff rates(%)Outputj 53.75 64.00 50.34 65.00 45,13 54.80 41.90 17.15Inputsi 43.87 47.45 35.16 27.89 30.00 38.69 27.00 26.65Machineryand
equipment 57.22 42.93 30.93 28.81 57.22 42.93 30.93 28.81Otherfixedasset_ -- 76.00 61.70 61.00 -- 76.00 61.70 61.00Transportation
equipment 63.24 45.00 42.00 26.00 63.24 45.00 42.00 26.00
Estimatedusefullifeofassets(inyears)Buildings 50 50 50 50 50 50 50 50Productionmachinery
andequipment 20 20 20 20 25 20 25 20Officeequipment
andothersupplies 20 20 20 20 20 20 20 20Transportation
equipment 15 15 15 15 15 15 15 15
ShadowpdcefactorsLabor(%) 70 70 70 70 70 70 70 70Capitalinterest_te (%) 10 10 10 10 10 10 10 10Foreignexchange
(inpesoterms) 13,89 27.99 26.37 33.59 13,89 27.99 26.37 33.59

120 4 EdwinGil Q Mendoza
Appendix12continued
Boatbuilding ShipbuildingandRepair1983 1986 1968 1991 1983 1986 1988 1991
OtherconstantsOfficialexchangerate
(inpesoterms) 11.11 22.39 21.09 26.87 11.11 22.39 21.09 26.87Export-output
ratio(%) 16.00 + 16.00 + 4.00 + 4.00 +Ratioof imported
rawmaterial 90.00 + 90.00 + 70.00 + 70.00 +Ratiool 1988inventories(%)(applicableJ'or1983only) 23.49 -- -- -- 92.00 -- -- --
Minimumwagerates(inpesoterms) 34.22 57.08 69.33127.83 34.22 57.08 69.33127.83
AllocationRaUosfortheAssetsforAllYears(Inpercent)
DepreciationCosts InterestCosts
Foreign Domestic-ForeignDomestic
Costcomponents(%)Buildings 100 100Productionmachineryandequipment 100 15 85Otherfixedassets 85 15 100Transportationequipment 80 20 15 85Inventories
Materialinputs 85 15Finisl'edgoodsandwork-in-processgoods 85 15
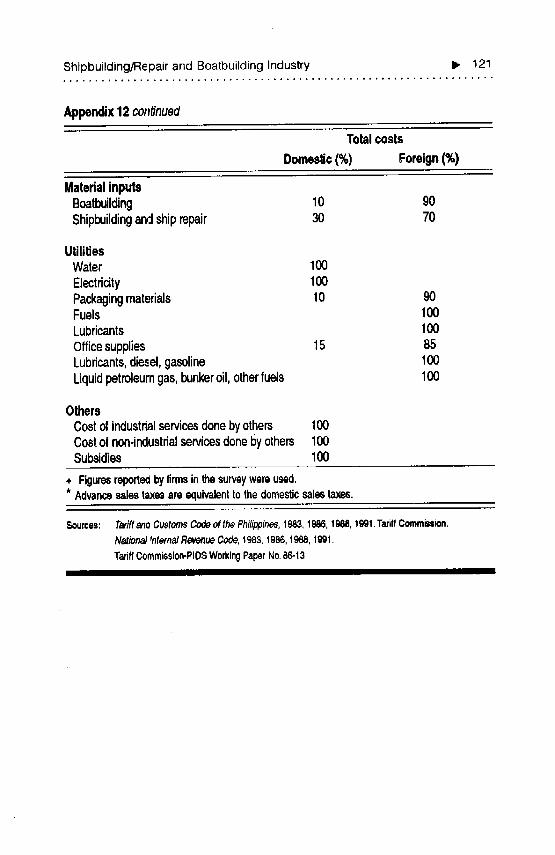
Shipbuilding/Repair and Boatbuilding Industry i_ 121
Appendix12continued
Totalcosts
Domestic(%) Foreign(%)
MaterialinputsBoatbuilding 10 90Shipbuildingandshiprepair 30 70
UtilitiesWater 100
Electridty 100Packagingmaterials 10 90Fuels 100Lubricants 100
Officesupplies 15 85Lubricants,diesel,gasoline 100Liquidpetroleumgas,bunkeroil, otherfuels 100
OthersCostof industrialservicesdonebyothers 100Costof non-industrialservicesdonebyothers 100Subsidies 100
+ Figuresreporte_byfirmsinthesurveywereused.* Advancesalestaxes,,,reequivalenttothedomesticsalestaxes.
Sources: TariffanoCustomsCodeofthe Philippines,1983,1986,1988,1991.TariffCommission,
National fntemalRevenueCode,1983,1986,1988,1991.
TariffCommission-PIOSWorkingPaperNo.86-13lib IIIII II I I
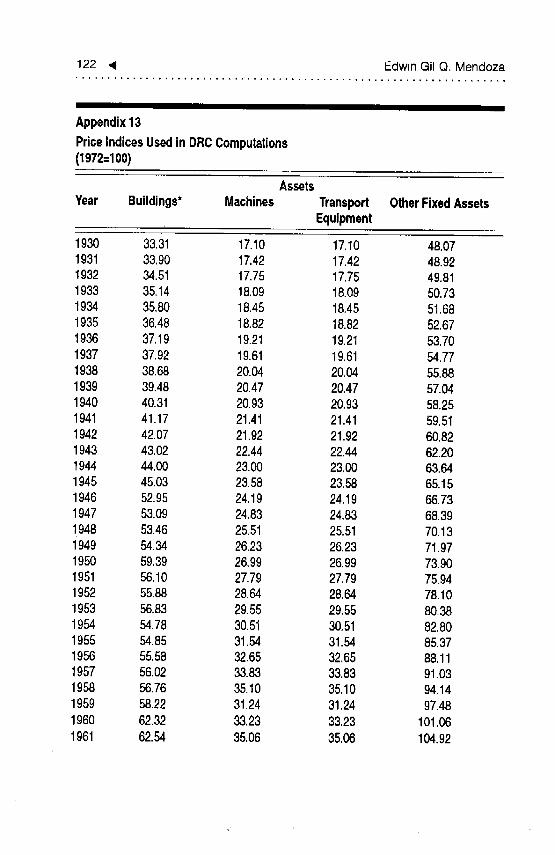
122 .i EdwinGil Q, Mendoza
III Ill
Appendix13
PriceIndicesUsedinDRCComputations(1972=100)
AssetsYear Buildings* Machines Transport OtherFixedAssets
Equipment
1930 33.31 17.10 17.10 48,071931 33.90 17.42 17.42 48.921932 34.51 17.75 17,75 49,811933 35,14 18,09 18.09 50,731934 35,80 18,45 18,45 51.681935 36.48 18,82 18,82 52,671936 37,19 19.21 19.21 53,701937 37.92 19.61 19,61 54,771938 38.68 20.04 20.04 55.881939 39.48 20.47 20.47 57,041940 40.31 20.93 20.93 58,251941 41.17 21,41 21,41 59,511942 42.07 21,92 21.92 60.821943 43,02 22,44 22,44 62,201944 44,00 23,00 23,O0 63,641945 45.03 23,58 23.58 65,151946 52.95 24,19 24.19 66.731947 53.09 24,83 24.83 68.391948 53.46 25.51 25.51 70.131949 54.34 26.23 26.23 71.971950 59,39 26.99 26.99 73.901951 56.10 27,79 27,79 75,941952 55.88 28.64 28.64 78,101953 56.83 29.55 29,55 80.381954 54,78 30.51 30.51 82,801955 54.85 31.54 31.54 85.371956 55,58 32,65 32,65 88,111957 56.02 33.83 33.83 91.031958 56.76 35.10 35,10 94.141959 58.22 31.24 31.24 97.481960 62.32 33,23 33,23 101,061961 62,54 35,06 35,06 104,92
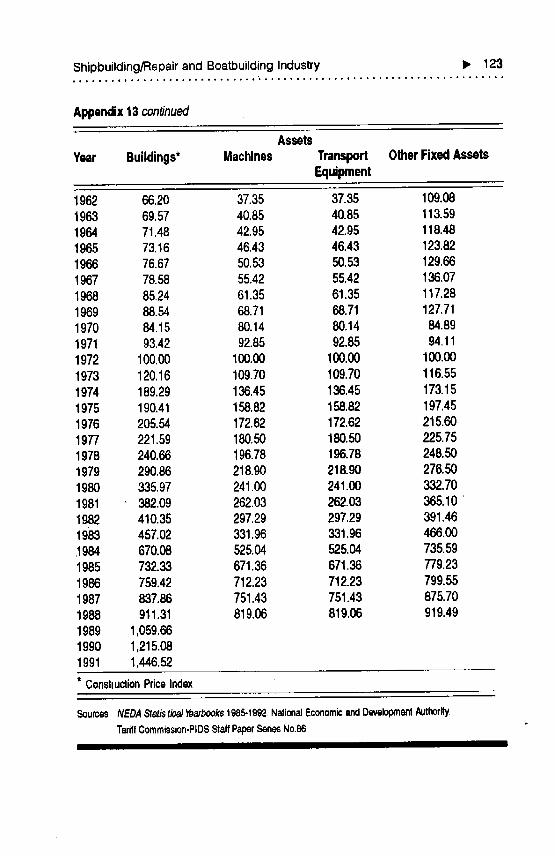
Shipbuilding/Repair and Boatbuilding industry I_ 123
Appendix13continued
Assets
Year Buildings* Machines Transport OtherFixedAssetsEquipment
1962 66.20 37,35 37.35 109.081963 69.57 40,85 40.85 113.591964 71,48 42.95 42.95 118.481965 73,16 46.43 46.43 123,821966 76.67 50.53 50.53 129.661967 78.58 55.42 55.42 136.071968 85.24 61.35 61.35 117.281969 88.54 68.71 68.71 127,711970 84.15 80.14 80.14 84.891971 93,42 92,85 92.85 94.111972 100,00 100.00 100,00 100,001973 120,16 109.70 109.70 116.551974 189,29 136,45 136,45 173.151975 190.41 158.82 158.82 197.451976 205.54 172,62 172.62 215.601977 221,59 180,50 180.50 225.751978 240,66 196.78 196.78 248.501979 290.86 218.90 218.90 276.501980 335.97 241.00 241.00 332.701981 382.09 262.03 262.03 365.101982 410.35 297,29 297,29 391.461983 457,02 331.96 331.96 466.00_1984 670.08 525,04 525,04 735.591985 732.33 671,36 671,38 779.231986 759,42 712,23 712.23 799.551987 837.86 751,43 751,43 875,701988 911.31 819.06 819.06 919.491989 1,059,661990 1,215.081991 1,446,52
* ConstructionPriceIndex
Sources /VEDA Statis tical Yearbooks 1985-1992, National Economic and Development Authority,
Tariff Commission-PIDS Staff Paper Series No,98
I II IIBB III I I