Embed Size (px)
Citation preview
SHIP TO SHIP INTERACTION FORCES DURING LIGHTERING OPERATIONS
E Lataire, M Vantorre and J Vandenbroucke Ghent University – Maritime Technology Division, Belgium
K Eloot, Flanders Hydraulics Research, Flemish Government, Antwerp, Belgium
SUMMARY
For a better understanding of the hydrodynamic phenomena involved in ship to ship interaction during cargo transfer the
research project entitled “Investigating hydrodynamic aspects and control strategies for ship-to-ship operations” has
been initiated. In the frame of this project more than two thousand captive model tests were carried out in 2008 [1] in the
Towing tank for manoeuvres in shallow water (co-operation Flanders Hydraulics Research – Ghent University) in
Antwerp, Belgium. During these tests a scale model of a VLCC was attached to the main frame of the towing carriage
while a model of an Aframax tanker was attached to the computer controlled planar motion carriage. Forces, moments
and positions were measured on both models.
The current paper analyses the extensive model test data and the influence of different parameters on the manoeuvre. For
training purposes with a ship manoeuvring simulator a mathematical model for lightering operations is proposed based
upon [2].
NOMENCLATURE
B [m] beam of the ship
FNR [N] rudder normal force
FTR [N] rudder tangential force
g [m/s²] earth’s gravity acceleration
h [m] water depth
LPP [m] length between perpendiculars
K [Nm] roll moment
N [Nm] yaw moment
n [rpm] propeller rate
QP [Nmm] torque on the propeller shaft
QR [Nmm] torque on the rudder shaft
TA [m] draft aft (APP)
TF [m] draft fore (FPP)
TP [m] thrust of the propeller
UKC [-] under keel clearance
V [m/s] ship speed
X [N] longitudinal force
xcc [m] longitudinal distance between midships sections
(>0 if midship SS is ahead of STBL)
Y [N] sway force
ybb [m] lateral distance between ship sides
ycb [m] lateral distance between service ship centre line
and side of ship to be lightered
ycc [m] lateral distance between ship centre lines
zA [m] sinkage aft
zF [m] sinkage fore
[°] rudder angle
corr [-] correction term
ξ [-] longitudinal distance between the ships’ midships
section xcc divided by a reference ship length
[kg/m³] density
[m³] displacement volume
[°] heading
Subscripts: SS service ship
STBL ship to be lightered
O own ship
ref reference
T target ship
0 earth bound coordinate system
1. INTRODUCTION
Larger ship dimensions have economical advantages for
most parties involved in maritime transport, but also
cause restrictions when calling ports or when navigating
in shallow water. Fully loaded ultra and very large crude
oil carriers (ULCC, VLCC) can only reach harbours if
the access channels have a sufficient width and depth.
Alternatively, large tankers can be lightered underway,
so that shore based handling equipment is not required.
Typically, lightering takes place with the ship to be
lightered (STBL), mostly a VLCC (about 300 000 DWT),
heading at a straight course maintaining a low, constant
speed while the service ship (SS), mostly an Aframax
type tanker (about 100.000 DWT) performs a slow lateral
approach. Lightering operations are not only carried out
for transfer of crude oil; recently also liquefied natural
gas (LNG) is regularly transferred from ship to ship.
The hydrodynamics of lightering manoeuvres are seldom
discussed in literature. So far, most research has been
focused on meetings (encounters), overtaking
manoeuvres and passing of moored vessels. Various
numerical [3], empirical [4] and semi-empirical [5]
methods have been developed for the prediction of
hydrodynamic forces and moments acting on both ships
during such manoeuvres.
To some extent, these publications can contribute to a
better understanding of the hydrodynamic phenomena
occurring during lightering manoeuvres. Indeed,
lightering can be considered as a special case of an
overtaking manoeuvre during which both ships sail on
parallel courses and with equal speed. For manoeuvring
simulation applications, Flanders Hydraulics Research
makes use of a mathematical model based on the results
of a comprehensive captive model test program, [1].
However, it should be borne in mind that during the
experimental program the speed difference between both
ships was never less than four knots due to the length
limitations of the towing tank. Therefore, it will be
investigated whether this mathematical model can be
used for lightering operations.
A validation of the mathematical model for the specific
case of zero speed difference could be carried out after
the execution of a series of captive model tests in 2008
focusing on lightering applications. During this program,
carried out in the frame of a research project
concentrating on ship-to-ship interaction effects during
lightering operations, there was no forward speed
difference between both ship models.
In the present paper it is shown that the existing
mathematical model for overtaking manoeuvres is not
sufficiently accurate for use in simulations of lightering
operations. Therefore a new mathematical model is
proposed specifically for the lightering manoeuvre, based
upon the extensive model tests carried out in 2008.
2. MODEL TESTS
For a better understanding of the complex
hydrodynamics involved in a lightering manoeuvre a
research project entitled “Investigating Hydrodynamic
Aspects and Control Strategies for Ship-to-Ship
Operations”, co-ordinated by MARINTEK (Trondheim,
Norway) and supported financially by the Research
Council of Norway was initiated. In the frame of this
project, an extensive series of model tests was carried out
in the Towing Tank for Manoeuvres in Shallow Water
(cooperation Flanders Hydraulics Research – Ghent
University) in Antwerp, Belgium. A description of these
model tests as well as a very limited selection of test
results is published in [1]. The test program is briefly
summarised below.
2.1 TEST FACILITIES
At present the shallow water towing tank, with main
dimensions 88 x 7 x 0.5 m³, is equipped with a planar
motion carriage (consisting of a longitudinal or main
carriage, a lateral carriage and a yaw table), a wave
generator and an auxiliary carriage for ship-to-ship
interaction tests with ship models towed at different
forward speeds (overtaking, overtaken and meeting
vessels). Thanks to full computer control, the facilities
are operated in an unmanned way, so experimental
programs are running day and night, seven days a week.
An average of 35 tests a day can be achieved.
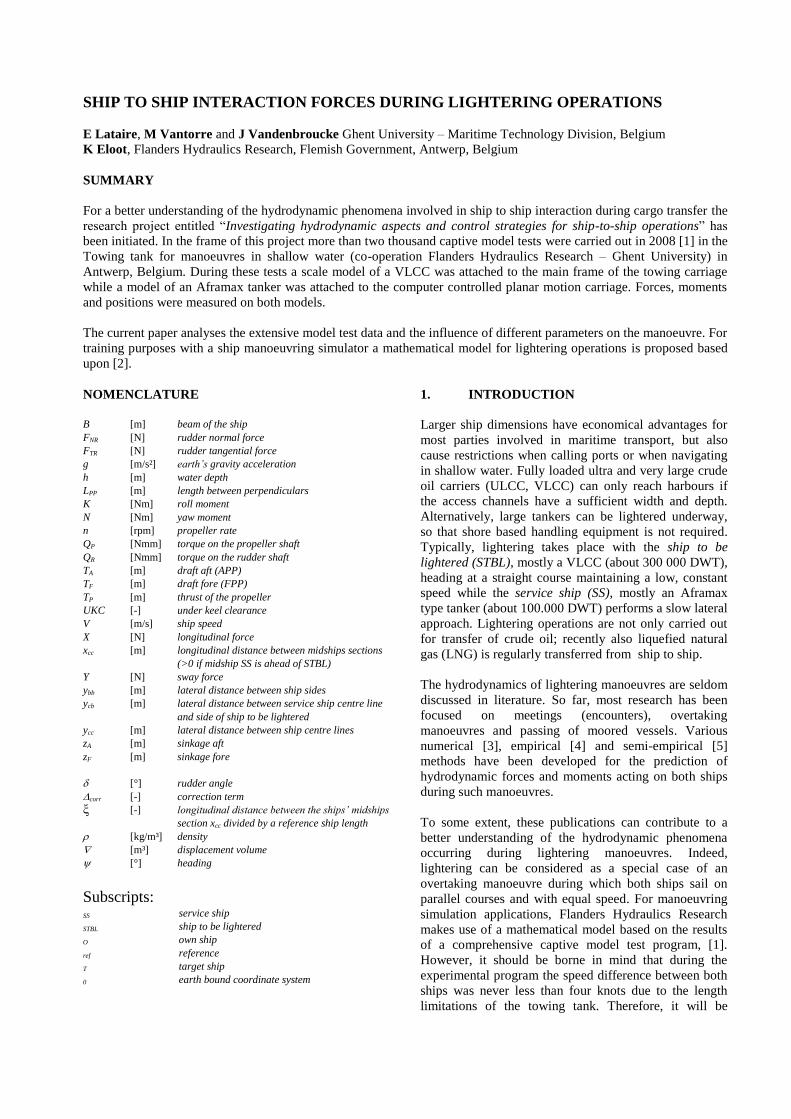
Figure 1 Planar motion mechanism with service ship (left) and new Rose Krieger construction with ship to be lightered (right) both
attached to the main carriage of the towing tank.
For the lightering manoeuvre model test program, the
tank facility was adapted to enable the attachment of two
ship models to the main carriage. Indeed, it was decided
not to make use of the auxiliary carriage that allows the
execution of meeting and overtaking scenarios, in order
to avoid any speed differences between the main carriage
and the auxiliary carriage. The model of the service ship
(Aframax type) was attached to the planar motion control
mechanism (PMM), while the ship to be lightered
(VLCC) was mounted to the main (longitudinal) carriage
by means of a new rigid Rose-Krieger construction
(Figure 1). Both models are free to heave and pitch but
restricted with respect to the carriage mechanism in all
other directions. This implies that the STBL can only
perform a motion in the longitudinal direction of the
tank, while the service ship can perform any motion in
the horizontal plan applied by the PMM. The speed
component of both ships in the direction of the axis of
the tank is equal for both models. All forces, moments
and motions measured on both ship models are
summarised in Table 1.
Table 1 Measured forces, moments and motions
Hull: SS STBL
Sinkage fore and aft zF,SS zA,SS [m]
Longitudinal force XSS XSTBL [N]
Sway force YSS YSTBL [N]
Yaw moment NSS NSTBL [Nm]
Roll moment KSS [Nm]
Propeller:
Propeller thrust TP,SS TP, STBL [N]
Propeller torque QP,SS QP, STBL [Nm]
Propeller rate nSS nSTBL [rpm]
Rudder:
Rudder normal force FNR,SS [N]
Rudder tangential force FTR,SS [N]
Rudder torque QR,SS [Nm]
Rudder angle δSS [deg]
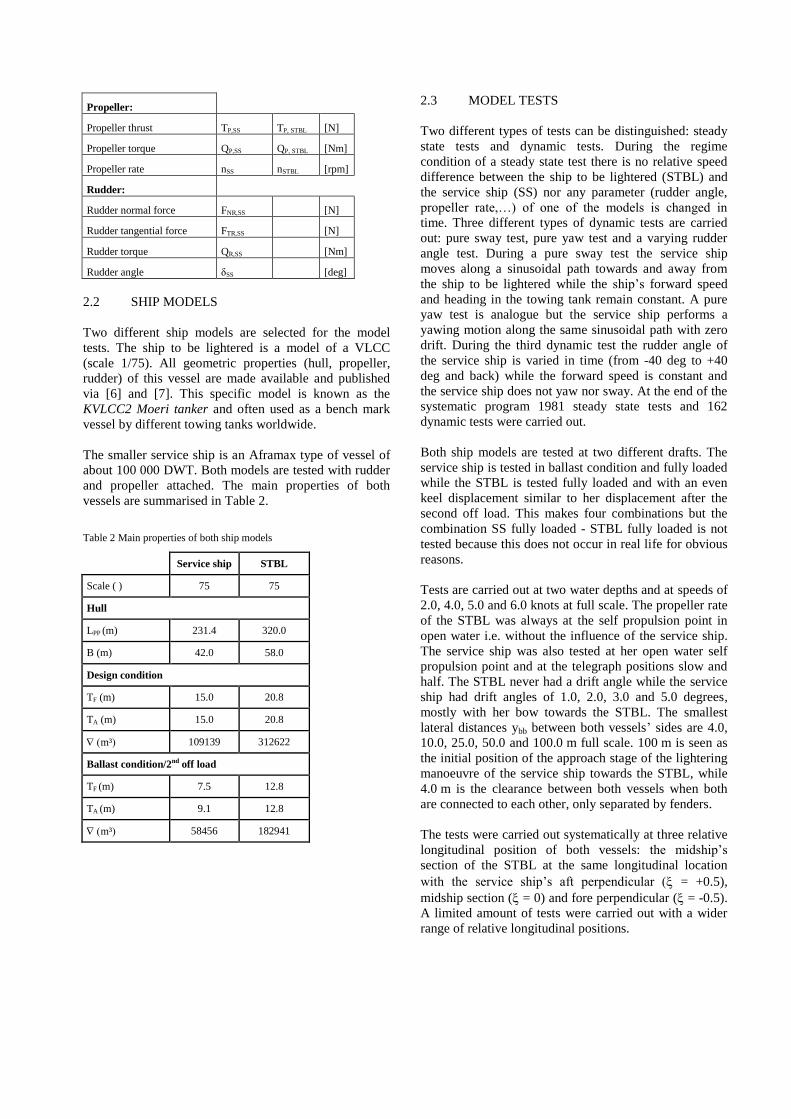
2.2 SHIP MODELS
Two different ship models are selected for the model
tests. The ship to be lightered is a model of a VLCC
(scale 1/75). All geometric properties (hull, propeller,
rudder) of this vessel are made available and published
via [6] and [7]. This specific model is known as the
KVLCC2 Moeri tanker and often used as a bench mark
vessel by different towing tanks worldwide.
The smaller service ship is an Aframax type of vessel of
about 100 000 DWT. Both models are tested with rudder
and propeller attached. The main properties of both
vessels are summarised in Table 2.
Table 2 Main properties of both ship models
Service ship STBL
Scale ( ) 75 75
Hull
LPP (m) 231.4 320.0
B (m) 42.0 58.0
Design condition
TF (m) 15.0 20.8
TA (m) 15.0 20.8
m³ 109139 312622
Ballast condition/2nd off load
TF (m) 7.5 12.8
TA (m) 9.1 12.8
m³ 58456 182941
2.3 MODEL TESTS
Two different types of tests can be distinguished: steady
state tests and dynamic tests. During the regime
condition of a steady state test there is no relative speed
difference between the ship to be lightered (STBL) and
the service ship (SS) nor any parameter (rudder angle,
propeller rate,…) of one of the models is changed in
time. Three different types of dynamic tests are carried
out: pure sway test, pure yaw test and a varying rudder
angle test. During a pure sway test the service ship
moves along a sinusoidal path towards and away from
the ship to be lightered while the ship‟s forward speed
and heading in the towing tank remain constant. A pure
yaw test is analogue but the service ship performs a
yawing motion along the same sinusoidal path with zero
drift. During the third dynamic test the rudder angle of
the service ship is varied in time (from -40 deg to +40
deg and back) while the forward speed is constant and
the service ship does not yaw nor sway. At the end of the
systematic program 1981 steady state tests and 162
dynamic tests were carried out.
Both ship models are tested at two different drafts. The
service ship is tested in ballast condition and fully loaded
while the STBL is tested fully loaded and with an even
keel displacement similar to her displacement after the
second off load. This makes four combinations but the
combination SS fully loaded - STBL fully loaded is not
tested because this does not occur in real life for obvious
reasons.
Tests are carried out at two water depths and at speeds of
2.0, 4.0, 5.0 and 6.0 knots at full scale. The propeller rate
of the STBL was always at the self propulsion point in
open water i.e. without the influence of the service ship.
The service ship was also tested at her open water self
propulsion point and at the telegraph positions slow and
half. The STBL never had a drift angle while the service
ship had drift angles of 1.0, 2.0, 3.0 and 5.0 degrees,
mostly with her bow towards the STBL. The smallest
lateral distances ybb between both vessels‟ sides are 4.0,
10.0, 25.0, 50.0 and 100.0 m full scale. 100 m is seen as
the initial position of the approach stage of the lightering
manoeuvre of the service ship towards the STBL, while
4.0 m is the clearance between both vessels when both
are connected to each other, only separated by fenders.
The tests were carried out systematically at three relative
longitudinal position of both vessels: the midship‟s
section of the STBL at the same longitudinal location
with the service ship‟s aft perpendicular ( = +0.5),
midship section ( = 0) and fore perpendicular ( = -0.5).
A limited amount of tests were carried out with a wider
range of relative longitudinal positions.
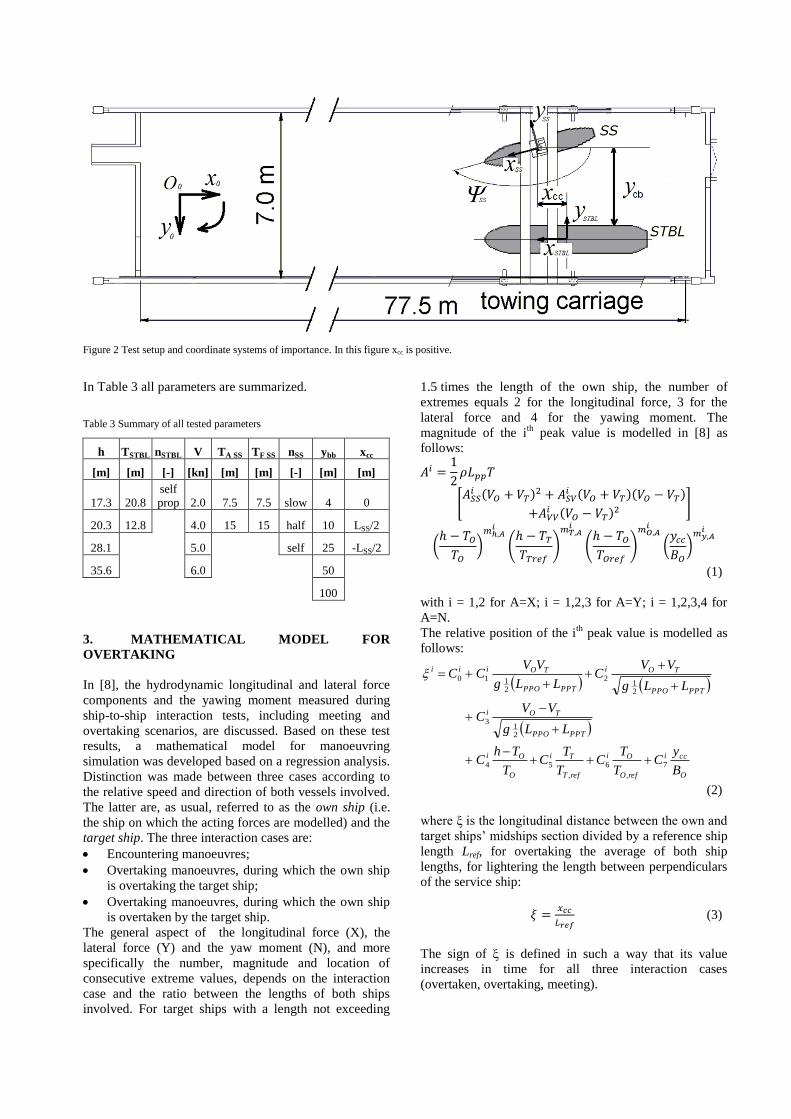
Figure 2 Test setup and coordinate systems of importance. In this figure xcc is positive.
In Table 3 all parameters are summarized.
Table 3 Summary of all tested parameters
h TSTBL nSTBL V TA SS TF SS nSS ybb xcc
[m] [m] [-] [kn] [m] [m] [-] [m] [m]
17.3 20.8
self
prop 2.0 7.5 7.5 slow 4 0
20.3 12.8 4.0 15 15 half 10 LSS/2
28.1 5.0 self 25 -LSS/2
35.6 6.0 50
100
3. MATHEMATICAL MODEL FOR
OVERTAKING
In [8], the hydrodynamic longitudinal and lateral force
components and the yawing moment measured during
ship-to-ship interaction tests, including meeting and
overtaking scenarios, are discussed. Based on these test
results, a mathematical model for manoeuvring
simulation was developed based on a regression analysis.
Distinction was made between three cases according to
the relative speed and direction of both vessels involved.
The latter are, as usual, referred to as the own ship (i.e.
the ship on which the acting forces are modelled) and the
target ship. The three interaction cases are:
Encountering manoeuvres;
Overtaking manoeuvres, during which the own ship
is overtaking the target ship;
Overtaking manoeuvres, during which the own ship
is overtaken by the target ship.
The general aspect of the longitudinal force (X), the
lateral force (Y) and the yaw moment (N), and more
specifically the number, magnitude and location of
consecutive extreme values, depends on the interaction
case and the ratio between the lengths of both ships
involved. For target ships with a length not exceeding
1.5 times the length of the own ship, the number of
extremes equals 2 for the longitudinal force, 3 for the
lateral force and 4 for the yawing moment. The
magnitude of the ith
peak value is modelled in [8] as
follows:
(1)
with i = 1,2 for A=X; i = 1,2,3 for A=Y; i = 1,2,3,4 for
A=N.
The relative position of the ith
peak value is modelled as
follows:
O
cci
refO
Oi
refT
Ti
O
Oi
PPTPPO
TOi
PPTPPO
TOi
PPTPPO
TOiii
B
yC
T
TC
T
TC
T
ThC
LLg
VVC
LLg
VVC
LLg
VVCC
7
,
6
,
54
21
3
21
2
2110
(2)
where ξ is the longitudinal distance between the own and
target ships‟ midships section divided by a reference ship
length Lref, for overtaking the average of both ship
lengths, for lightering the length between perpendiculars
of the service ship:
(3)
The sign of is defined in such a way that its value
increases in time for all three interaction cases
(overtaken, overtaking, meeting).
To investigate the validity of this model for a lightering
manoeuvre, the latter can be considered as a special case
of an overtaking manoeuvre during which the own ship
and the target ship have the same speed (VO=VT). If
equation (1) is applied to this special case (VO = VT = V),
the magnitudes of the peak forces and moment only
depend on V²:
(4)
while equation (2), resulting into the relative positions of
the peak values is simplified to:
O
cci
refO
Oi
refT
Ti
O
Oi
PPTPPO
i
PPTPPO
iii
VVV
B
yC
T
TC
T
TC
T
ThC
LLg
VC
LLg
VCC
TO
7
,
6
,
54
21
2
21
2
10
2
(5)
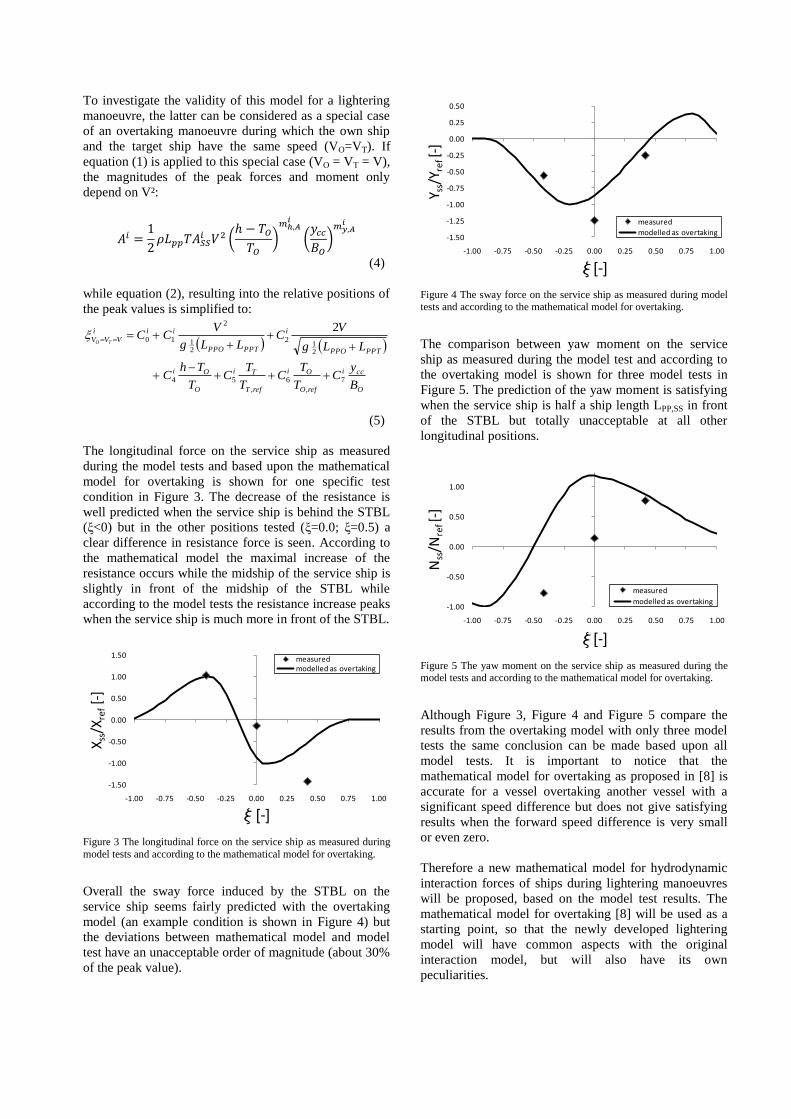
The longitudinal force on the service ship as measured
during the model tests and based upon the mathematical
model for overtaking is shown for one specific test
condition in Figure 3. The decrease of the resistance is
well predicted when the service ship is behind the STBL
(ξ<0) but in the other positions tested (ξ=0.0; ξ=0.5) a
clear difference in resistance force is seen. According to
the mathematical model the maximal increase of the
resistance occurs while the midship of the service ship is
slightly in front of the midship of the STBL while
according to the model tests the resistance increase peaks
when the service ship is much more in front of the STBL.
Figure 3 The longitudinal force on the service ship as measured during
model tests and according to the mathematical model for overtaking.
Overall the sway force induced by the STBL on the
service ship seems fairly predicted with the overtaking
model (an example condition is shown in Figure 4) but
the deviations between mathematical model and model
test have an unacceptable order of magnitude (about 30%
of the peak value).
Figure 4 The sway force on the service ship as measured during model tests and according to the mathematical model for overtaking.
The comparison between yaw moment on the service
ship as measured during the model test and according to
the overtaking model is shown for three model tests in
Figure 5. The prediction of the yaw moment is satisfying
when the service ship is half a ship length LPP,SS in front
of the STBL but totally unacceptable at all other
longitudinal positions.
Figure 5 The yaw moment on the service ship as measured during the model tests and according to the mathematical model for overtaking.
Although Figure 3, Figure 4 and Figure 5 compare the
results from the overtaking model with only three model
tests the same conclusion can be made based upon all
model tests. It is important to notice that the
mathematical model for overtaking as proposed in [8] is
accurate for a vessel overtaking another vessel with a
significant speed difference but does not give satisfying
results when the forward speed difference is very small
or even zero.
Therefore a new mathematical model for hydrodynamic
interaction forces of ships during lightering manoeuvres
will be proposed, based on the model test results. The
mathematical model for overtaking [8] will be used as a
starting point, so that the newly developed lightering
model will have common aspects with the original
interaction model, but will also have its own
peculiarities.
-1.50
-1.00
-0.50
0.00
0.50
1.00
1.50
-1.00 -0.75 -0.50 -0.25 0.00 0.25 0.50 0.75 1.00
Xss
/Xre
f[-
]
x [-]
measuredmodelled as overtaking
-1.50
-1.25
-1.00
-0.75
-0.50
-0.25
0.00
0.25
0.50
-1.00 -0.75 -0.50 -0.25 0.00 0.25 0.50 0.75 1.00
Y ss/
Y ref
[-]
x [-]
measured
modelled as overtaking
-1.00
-0.50
0.00
0.50
1.00
-1.00 -0.75 -0.50 -0.25 0.00 0.25 0.50 0.75 1.00
Nss
/Nre
f[-
]
x [-]
measured
modelled as overtaking
4. GENERAL ASPECTS
In the previous chapter it is shown that the assumption
that a lightering manoeuvre (or any other manoeuvre
characterised by a zero longitudinal speed difference
between two vessels in close proximity of each other)
can be modelled as an overtaking manoeuvre by
extrapolating the mathematical models derived in [8]
with both vessels at the same speed is not valid.
Therefore a new mathematical model is proposed
specifically for the lightering manoeuvre. This
mathematical model is based on the extensive model
tests as described in Chapter 2 and in [1].
4.1 RELATIVE LONGITUDINAL POSITION
Unlike an overtaking manoeuvre, lightering can be
interpreted as a quasi-steady process because of the
rather slow approach of the service ship towards the ship
to be lightered.
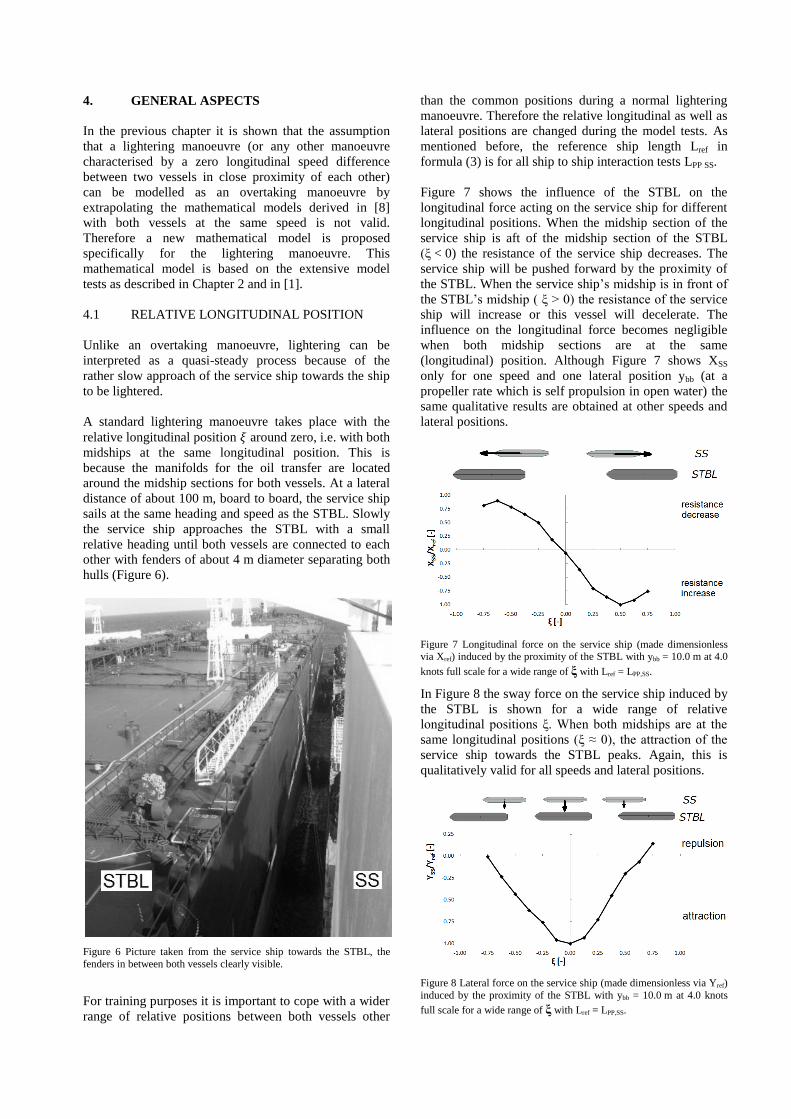
A standard lightering manoeuvre takes place with the
relative longitudinal position around zero, i.e. with both
midships at the same longitudinal position. This is
because the manifolds for the oil transfer are located
around the midship sections for both vessels. At a lateral
distance of about 100 m, board to board, the service ship
sails at the same heading and speed as the STBL. Slowly
the service ship approaches the STBL with a small
relative heading until both vessels are connected to each
other with fenders of about 4 m diameter separating both
hulls (Figure 6).
Figure 6 Picture taken from the service ship towards the STBL, the
fenders in between both vessels clearly visible.
For training purposes it is important to cope with a wider
range of relative positions between both vessels other
than the common positions during a normal lightering
manoeuvre. Therefore the relative longitudinal as well as
lateral positions are changed during the model tests. As
mentioned before, the reference ship length Lref in
formula (3) is for all ship to ship interaction tests LPP SS.
Figure 7 shows the influence of the STBL on the
longitudinal force acting on the service ship for different
longitudinal positions. When the midship section of the
service ship is aft of the midship section of the STBL
(ξ < 0) the resistance of the service ship decreases. The
service ship will be pushed forward by the proximity of
the STBL. When the service ship‟s midship is in front of
the STBL‟s midship ( ξ > 0) the resistance of the service
ship will increase or this vessel will decelerate. The
influence on the longitudinal force becomes negligible
when both midship sections are at the same
(longitudinal) position. Although Figure 7 shows XSS
only for one speed and one lateral position ybb (at a
propeller rate which is self propulsion in open water) the
same qualitative results are obtained at other speeds and
lateral positions.
Figure 7 Longitudinal force on the service ship (made dimensionless via Xref) induced by the proximity of the STBL with ybb = 10.0 m at 4.0
knots full scale for a wide range of ξ with Lref = LPP,SS.
In Figure 8 the sway force on the service ship induced by
the STBL is shown for a wide range of relative
longitudinal positions ξ. When both midships are at the
same longitudinal positions (ξ ≈ 0), the attraction of the
service ship towards the STBL peaks. Again, this is
qualitatively valid for all speeds and lateral positions.
Figure 8 Lateral force on the service ship (made dimensionless via Yref)
induced by the proximity of the STBL with ybb = 10.0 m at 4.0 knots
full scale for a wide range of ξ with Lref = LPP,SS.
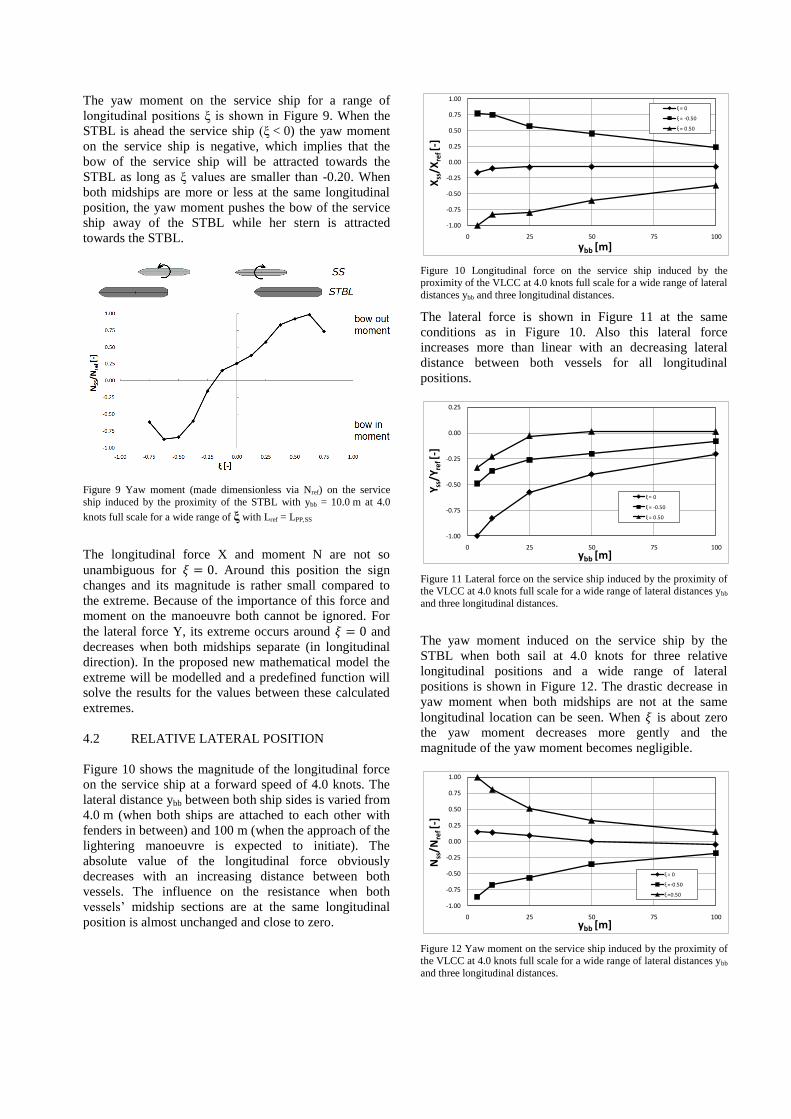
The yaw moment on the service ship for a range of
longitudinal positions ξ is shown in Figure 9. When the
STBL is ahead the service ship (ξ < 0) the yaw moment
on the service ship is negative, which implies that the
bow of the service ship will be attracted towards the
STBL as long as ξ values are smaller than -0.20. When
both midships are more or less at the same longitudinal
position, the yaw moment pushes the bow of the service
ship away of the STBL while her stern is attracted
towards the STBL.
Figure 9 Yaw moment (made dimensionless via Nref) on the service
ship induced by the proximity of the STBL with ybb = 10.0 m at 4.0
knots full scale for a wide range of ξ with Lref = LPP,SS
The longitudinal force X and moment N are not so
unambiguous for . Around this position the sign
changes and its magnitude is rather small compared to
the extreme. Because of the importance of this force and
moment on the manoeuvre both cannot be ignored. For
the lateral force Y, its extreme occurs around and
decreases when both midships separate (in longitudinal
direction). In the proposed new mathematical model the
extreme will be modelled and a predefined function will
solve the results for the values between these calculated
extremes.
4.2 RELATIVE LATERAL POSITION
Figure 10 shows the magnitude of the longitudinal force
on the service ship at a forward speed of 4.0 knots. The
lateral distance ybb between both ship sides is varied from
4.0 m (when both ships are attached to each other with
fenders in between) and 100 m (when the approach of the
lightering manoeuvre is expected to initiate). The
absolute value of the longitudinal force obviously
decreases with an increasing distance between both
vessels. The influence on the resistance when both
vessels‟ midship sections are at the same longitudinal
position is almost unchanged and close to zero.
Figure 10 Longitudinal force on the service ship induced by the proximity of the VLCC at 4.0 knots full scale for a wide range of lateral
distances ybb and three longitudinal distances.
The lateral force is shown in Figure 11 at the same
conditions as in Figure 10. Also this lateral force
increases more than linear with an decreasing lateral
distance between both vessels for all longitudinal
positions.
Figure 11 Lateral force on the service ship induced by the proximity of the VLCC at 4.0 knots full scale for a wide range of lateral distances ybb
and three longitudinal distances.
The yaw moment induced on the service ship by the
STBL when both sail at 4.0 knots for three relative
longitudinal positions and a wide range of lateral
positions is shown in Figure 12. The drastic decrease in
yaw moment when both midships are not at the same
longitudinal location can be seen. When is about zero
the yaw moment decreases more gently and the
magnitude of the yaw moment becomes negligible.
Figure 12 Yaw moment on the service ship induced by the proximity of the VLCC at 4.0 knots full scale for a wide range of lateral distances ybb
and three longitudinal distances.
-1.00
-0.75
-0.50
-0.25
0.00
0.25
0.50
0.75
1.00
0 25 50 75 100
Xss
/Xre
f [-]
ybb [m]
ξ = 0
ξ = -0.50
ξ = 0.50
-1.00
-0.75
-0.50
-0.25
0.00
0.25
0 25 50 75 100
Y ss/
Y ref
[-]
ybb [m]
ξ = 0
ξ = -0.50
ξ = 0.50
-1.00
-0.75
-0.50
-0.25
0.00
0.25
0.50
0.75
1.00
0 25 50 75 100
Nss
/Nre
f [-
]
ybb [m]
ξ = 0
ξ =-0.50
ξ =0.50
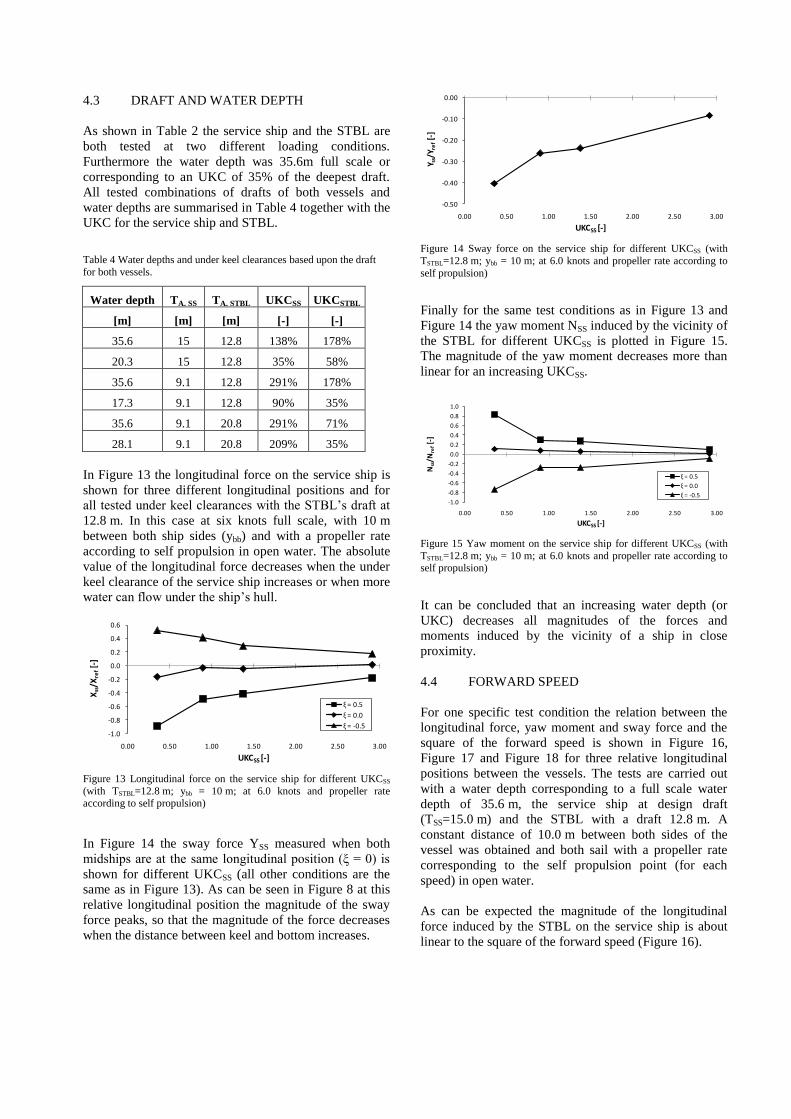
4.3 DRAFT AND WATER DEPTH
As shown in Table 2 the service ship and the STBL are
both tested at two different loading conditions.
Furthermore the water depth was 35.6m full scale or
corresponding to an UKC of 35% of the deepest draft.
All tested combinations of drafts of both vessels and
water depths are summarised in Table 4 together with the
UKC for the service ship and STBL.
Table 4 Water depths and under keel clearances based upon the draft
for both vessels.
Water depth TA, SS TA, STBL UKCSS UKCSTBL
[m] [m] [m] [-] [-]
35.6 15 12.8 138% 178%
20.3 15 12.8 35% 58%
35.6 9.1 12.8 291% 178%
17.3 9.1 12.8 90% 35%
35.6 9.1 20.8 291% 71%
28.1 9.1 20.8 209% 35%
In Figure 13 the longitudinal force on the service ship is
shown for three different longitudinal positions and for
all tested under keel clearances with the STBL‟s draft at
12.8 m. In this case at six knots full scale, with 10 m
between both ship sides (ybb) and with a propeller rate
according to self propulsion in open water. The absolute
value of the longitudinal force decreases when the under
keel clearance of the service ship increases or when more
water can flow under the ship‟s hull.
Figure 13 Longitudinal force on the service ship for different UKCSS
(with TSTBL=12.8 m; ybb = 10 m; at 6.0 knots and propeller rate according to self propulsion)
In Figure 14 the sway force YSS measured when both
midships are at the same longitudinal position (ξ = 0) is
shown for different UKCSS (all other conditions are the
same as in Figure 13). As can be seen in Figure 8 at this
relative longitudinal position the magnitude of the sway
force peaks, so that the magnitude of the force decreases
when the distance between keel and bottom increases.
Figure 14 Sway force on the service ship for different UKCSS (with
TSTBL=12.8 m; ybb = 10 m; at 6.0 knots and propeller rate according to
self propulsion)
Finally for the same test conditions as in Figure 13 and
Figure 14 the yaw moment NSS induced by the vicinity of
the STBL for different UKCSS is plotted in Figure 15.
The magnitude of the yaw moment decreases more than
linear for an increasing UKCSS.
Figure 15 Yaw moment on the service ship for different UKCSS (with
TSTBL=12.8 m; ybb = 10 m; at 6.0 knots and propeller rate according to self propulsion)
It can be concluded that an increasing water depth (or
UKC) decreases all magnitudes of the forces and
moments induced by the vicinity of a ship in close
proximity.
4.4 FORWARD SPEED
For one specific test condition the relation between the
longitudinal force, yaw moment and sway force and the
square of the forward speed is shown in Figure 16,
Figure 17 and Figure 18 for three relative longitudinal
positions between the vessels. The tests are carried out
with a water depth corresponding to a full scale water
depth of 35.6 m, the service ship at design draft
(TSS=15.0 m) and the STBL with a draft 12.8 m. A
constant distance of 10.0 m between both sides of the
vessel was obtained and both sail with a propeller rate
corresponding to the self propulsion point (for each
speed) in open water.
As can be expected the magnitude of the longitudinal
force induced by the STBL on the service ship is about
linear to the square of the forward speed (Figure 16).
-1.0
-0.8
-0.6
-0.4
-0.2
0.0
0.2
0.4
0.6
0.00 0.50 1.00 1.50 2.00 2.50 3.00
Xss
/Xre
f[-
]
UKCSS [-]
ξ = 0.5
ξ = 0.0
ξ = -0.5
-0.50
-0.40
-0.30
-0.20
-0.10
0.00
0.00 0.50 1.00 1.50 2.00 2.50 3.00
Y ss/
Y re
f[-
]
UKCSS [-]
-1.0
-0.8
-0.6
-0.4
-0.2
0.0
0.2
0.4
0.6
0.8
1.0
0.00 0.50 1.00 1.50 2.00 2.50 3.00
Nss
/Nre
f[-
]
UKCSS [-]
ξ = 0.5
ξ = 0.0
ξ = -0.5
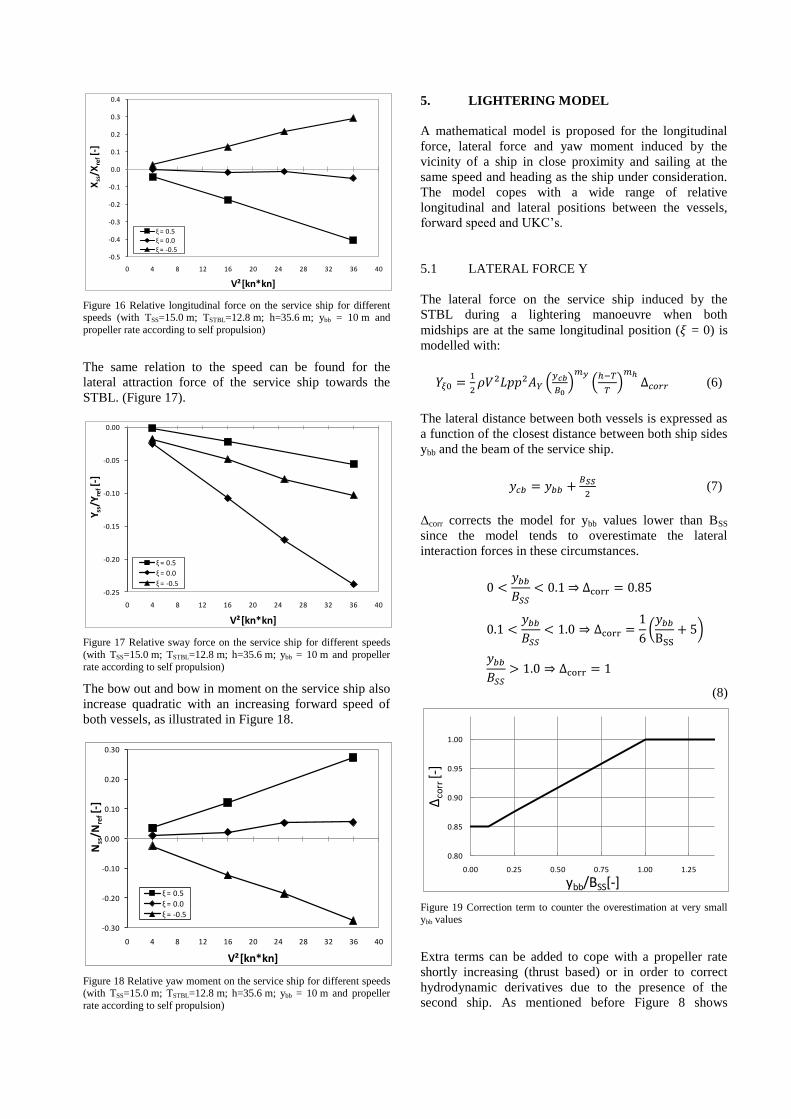
Figure 16 Relative longitudinal force on the service ship for different speeds (with TSS=15.0 m; TSTBL=12.8 m; h=35.6 m; ybb = 10 m and
propeller rate according to self propulsion)
The same relation to the speed can be found for the
lateral attraction force of the service ship towards the
STBL. (Figure 17).
Figure 17 Relative sway force on the service ship for different speeds
(with TSS=15.0 m; TSTBL=12.8 m; h=35.6 m; ybb = 10 m and propeller
rate according to self propulsion)
The bow out and bow in moment on the service ship also
increase quadratic with an increasing forward speed of
both vessels, as illustrated in Figure 18.
Figure 18 Relative yaw moment on the service ship for different speeds (with TSS=15.0 m; TSTBL=12.8 m; h=35.6 m; ybb = 10 m and propeller
rate according to self propulsion)
5. LIGHTERING MODEL
A mathematical model is proposed for the longitudinal
force, lateral force and yaw moment induced by the
vicinity of a ship in close proximity and sailing at the
same speed and heading as the ship under consideration.
The model copes with a wide range of relative
longitudinal and lateral positions between the vessels,
forward speed and UKC‟s.
5.1 LATERAL FORCE Y
The lateral force on the service ship induced by the
STBL during a lightering manoeuvre when both
midships are at the same longitudinal position ( = 0) is
modelled with:
(6)
The lateral distance between both vessels is expressed as
a function of the closest distance between both ship sides
ybb and the beam of the service ship.
(7)
Δcorr corrects the model for ybb values lower than BSS
since the model tends to overestimate the lateral
interaction forces in these circumstances.
(8)
Figure 19 Correction term to counter the overestimation at very small ybb values
Extra terms can be added to cope with a propeller rate
shortly increasing (thrust based) or in order to correct
hydrodynamic derivatives due to the presence of the
second ship. As mentioned before Figure 8 shows
-0.5
-0.4
-0.3
-0.2
-0.1
0.0
0.1
0.2
0.3
0.4
0 4 8 12 16 20 24 28 32 36 40
Xss
/Xre
f[-
]
V²[kn*kn]
ξ = 0.5ξ = 0.0ξ = -0.5
-0.25
-0.20
-0.15
-0.10
-0.05
0.00
0 4 8 12 16 20 24 28 32 36 40
Y ss/
Y re
f[-
]
V²[kn*kn]
ξ = 0.5
ξ = 0.0
ξ = -0.5
-0.30
-0.20
-0.10
0.00
0.10
0.20
0.30
0 4 8 12 16 20 24 28 32 36 40
Nss
/Nre
f[-
]
V²[kn*kn]
ξ = 0.5
ξ = 0.0
ξ = -0.5
0.80
0.85
0.90
0.95
1.00
0.00 0.25 0.50 0.75 1.00 1.25
Δco
rr [-
]
ybb/BSS[-]
extended measurements on the service ship during a
lightering manoeuvre: a symmetric function with high
attraction midships abeam is found for different lateral
distances.
The proposed lightering model can be compared with the
measurements and a good comparison is found.
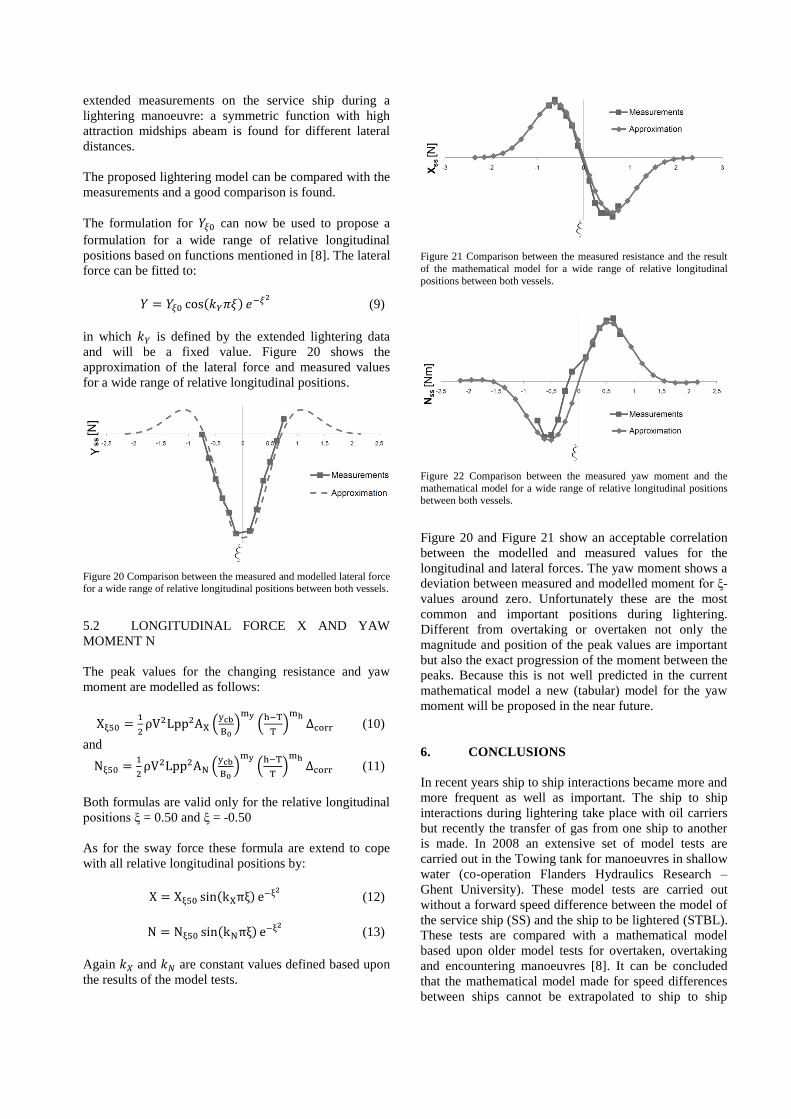
The formulation for can now be used to propose a
formulation for a wide range of relative longitudinal
positions based on functions mentioned in [8]. The lateral
force can be fitted to:
(9)
in which is defined by the extended lightering data
and will be a fixed value. Figure 20 shows the
approximation of the lateral force and measured values
for a wide range of relative longitudinal positions.
Figure 20 Comparison between the measured and modelled lateral force for a wide range of relative longitudinal positions between both vessels.
5.2 LONGITUDINAL FORCE X AND YAW
MOMENT N
The peak values for the changing resistance and yaw
moment are modelled as follows:
(10)
and
(11)
Both formulas are valid only for the relative longitudinal
positions ξ = 0.50 and ξ = -0.50
As for the sway force these formula are extend to cope
with all relative longitudinal positions by:
(12)
(13)
Again and are constant values defined based upon
the results of the model tests.
Figure 21 Comparison between the measured resistance and the result
of the mathematical model for a wide range of relative longitudinal
positions between both vessels.
Figure 22 Comparison between the measured yaw moment and the
mathematical model for a wide range of relative longitudinal positions between both vessels.
Figure 20 and Figure 21 show an acceptable correlation
between the modelled and measured values for the
longitudinal and lateral forces. The yaw moment shows a
deviation between measured and modelled moment for ξ-
values around zero. Unfortunately these are the most
common and important positions during lightering.
Different from overtaking or overtaken not only the
magnitude and position of the peak values are important
but also the exact progression of the moment between the
peaks. Because this is not well predicted in the current
mathematical model a new (tabular) model for the yaw
moment will be proposed in the near future.
6. CONCLUSIONS
In recent years ship to ship interactions became more and
more frequent as well as important. The ship to ship
interactions during lightering take place with oil carriers
but recently the transfer of gas from one ship to another
is made. In 2008 an extensive set of model tests are
carried out in the Towing tank for manoeuvres in shallow
water (co-operation Flanders Hydraulics Research –
Ghent University). These model tests are carried out
without a forward speed difference between the model of
the service ship (SS) and the ship to be lightered (STBL).
These tests are compared with a mathematical model
based upon older model tests for overtaken, overtaking
and encountering manoeuvres [8]. It can be concluded
that the mathematical model made for speed differences
between ships cannot be extrapolated to ship to ship
interaction without a forward speed difference between
the vessels.
Therefore the influence of the relative longitudinal and
lateral position between the ships as well as forward
speed and UKC on the ship to ship interactions (here
longitudinal force X, sway force Y and yaw moment N)
are investigated. Based upon this research a new
mathematical model is proposed specific for ship to ship
interaction where both vessels have the same forward
speed. This model is roughly based upon the overtaking
model as published in [8]. The results of this new
mathematical model comply for both longitudinal and
transversal force. The yaw moment shows some
discrepancy between model and test results when is
small or when the relative longitudinal position is small.
Unfortunately this is the most important situation for
lightering. Therefore in the near future model for the yaw
moment will be more accurately modelled for small
values.
7. ACKNOWLEDGEMENTS
The project "KMB Investigating hydrodynamic aspect
and control systems for ship-to-ship operations" is co-
ordinated by MARINTEK (Trondheim, Norway) and
financially supported by the Research Council of
Norway.
8. REFERENCES
[1] LATAIRE, E., VANTORRE, M., DELEFORTRIE
G., „Captive Model Testing for Ship to Ship Operations‟,
International Conference on Marine Simulation and Ship
Manoeuverability (MARSIM 2009), Panamà city,
Panamà, August 17-20 2009.
[2] VANDENBROUCKE, J., „Krachtwerking op tankers
tijdens lightering operaties‟, Master thesis, Ghent,
Belgium, June 2010
[3] NEWMAN, J., TUCK E., „Hydrodynamic Interaction
between Ships.‟ 10th
Symposium on Naval
Hydrodynamics, Pag 35-69. June 24-28 1974.
[4] VARYANI, K., VANTORRE, M., „Development of
New Generic Equation for Interaction Effects on a
Moored Container Ship due to Passing Bulk Carrier.‟
Transactions Vol. 147, International Journal of Maritime
Engineering Part A2, 2005
[5] BRIX, J.,‟ Manoeuvring Technical Manual‟ Seehafen
Verlag. Pag 50-52 1993
[6]
www.simman2008.dk/KVLCC/KVLCC2/tanker2.html
[7] SIMMAN 2008, Workshop on Verification and
Validation of Ship Manoeuvring Simulation Methods,
Copenhagen, Denmark, April 14th-16th 2008
[8] VANTORRE, M., VERZHBITSKAYA, E;
LAFORCE, E., „Model Test Based Formulations of Ship
- Ship Interaction Forces’. Ship Technology Research,
2002
9. AUTHORS BIOGRAPHY
Evert Lataire is currently assistant at the division of
Maritime Technology at Ghent University and
responsible for limited teaching tasks. He is making a
PhD on the topic of bank effects mainly based upon
model tests. His experience includes research on ship
manoeuvring simulators and model tests with ship to ship
interaction.
Marc Vantorre holds the current position of senior full
professor of marine hydrodynamics at Ghent University,
where he is head of the Maritime Technology Division.
His research, in close co-operation with Flanders
Hydraulics Research, Antwerp, mainly focuses on ship
hydrodynamics in shallow and restricted waters,
including captive model testing, simulation and access
channel policy.
Joost Vandenbroucke holds a Master degree in
Mechanical Engineering from KaHo Sint-Lieven in
2008, graduated in 2010 as an MSc. in naval architecture
from Ghent University on the subject "Interaction Forces
on Tankers During Lightering Operations" and is
currently enrolled at the Vlerick Business School.
Katrien Eloot is co-ordinator of the nautical research
group at Flanders Hydraulics Research and professor in
ship hydrodynamics, specialism of ship manoeuvrability,
at Ghent University, Belgium. This cooperation between
FHR and UGent led in 2008 to the formation of the
Knowledge Centre for Manoeuvring in Shallow and
Confined water (www.shallowwater.be). Her experience
includes modelling of ship behaviour based on model
tests, fast- and real-time simulation and training through
ship manoeuvring simulators.


![Mathematical modelling of forces acting on ships during ...Mathematical modelling of forces acting on ships during lightering operations Evert Latairea,n, ... Nomenclature B [m]](https://img.pdfslide.us/doc/110x75/5a934e9f7f8b9a8b5d8c3077/mathematical-modelling-of-forces-acting-on-ships-during-mathematical-modelling.jpg)