Embed Size (px)
Citation preview
OFFERING CIRCULAR
US$500,000,000
(incorporated with limited liability under the laws of the Republic of Korea)
6.0% Senior Notes due 2012
Issue Price: 99.835%
Shinhan Bank (the “Bank”) will issue an aggregate principal amount of US$500,000,000 of 6.0% Senior Notesdue 2012 (the “Notes”). The Notes will bear interest semi-annually in arrears on June 29 and December 29 ofeach year, commencing June 29, 2009 until redemption or maturity. The Notes will mature on June 29, 2012.The Bank may not redeem the Notes in whole or in part prior to maturity except upon the occurrence of certainevents related to Korean tax law as described herein. The Notes will be issued in registered form indenominations of US$100,000 and integral multiples of US$1,000 in excess thereof.
The Notes will be the Bank’s direct, unconditional and unsecured senior obligations and will rank pari passuwith all of its other unsecured senior indebtedness, except as may be required by mandatory provisions of law.
There is currently no market for the Notes. Application has been made to list the Notes on the SingaporeExchange Securities Trading Limited (the “Singapore Stock Exchange”). The Singapore Stock Exchangeassumes no responsibility for the correctness of any statements made, opinions expressed or reports containedherein. The approval in-principle from, and the admission of the Notes to the Official List of, the SingaporeStock Exchange are not to be taken as an indication of the merits of the Issuer or the Notes.
The Notes are expected to be rated A2 by Moody’s Investors Service, Inc. (“Moody’s”) and A- by Standard &Poor’s Rating Services, a division of The McGraw-Hill Companies, Inc. (“S&P”). Such ratings do notconstitute a recommendation to buy, sell or hold the Notes and may be subject to revision or withdrawal at anytime by such rating organizations.
Investing in the Notes involves risks. See “Risk Factors” beginning on page 11 for a discussion of certainfactors to be considered in connection with investing in the Notes.
The Notes have not been and will not be registered under the United States Securities Act of 1933 (the“Securities Act”) or any state securities laws and may not be offered or sold within the United Statesexcept pursuant to an exemption from, or in a transaction not subject to, the registration requirementsof the Securities Act. Accordingly, the Notes may be offered for sale only (i) in the United States, toqualified institutional buyers (“QIBs”) within the meaning of, and in reliance on, Rule 144A under theSecurities Act; or (ii) outside the United States in reliance on, and in accordance with, Regulation S, ineach case, in compliance with applicable laws, regulations and directives. See “Plan of Distribution —Selling Restrictions” and “Notice to Investors”.
Delivery of the Notes in book-entry form will be made on or about June 29, 2009. The Global Notes will bedeposited with a custodian for and registered in the name of a nominee of The Depository Trust Company(“DTC”). Except as described herein, interests in the Global Notes will be shown on, and transfers thereof willbe effected only through, records maintained by DTC and its participants, including Euroclear Bank S.A./N.V.(“Euroclear”) and Clearstream Banking, société anonyme (“Clearstream”) and their accountholders. Definitivecertificates in respect of beneficial interests in the Notes will not be issued except as described herein.
Joint Bookrunners and Joint Lead Managers
BNP PARIBAS Deutsche Bank HSBC Merrill Lynch & Co. The Royal Bank of Scotland
Joint Lead Manager
Goodmorning Shinhan Securities
The date of this offering circular is June 22, 2009.
TABLE OF CONTENTS
Page
CERTAIN DEFINED TERMS AND CONVENTIONS . . . . . . . . . . . . . . . . . . . . . . . . . . . . . . . . . . . . . . . . . iv
PRESENTATION OF FINANCIAL AND OTHER INFORMATION . . . . . . . . . . . . . . . . . . . . . . . . . . . iv
ENFORCEABILITY OF CIVIL LIABILITIES . . . . . . . . . . . . . . . . . . . . . . . . . . . . . . . . . . . . . . . . . . . . . . . . v
AVAILABLE INFORMATION . . . . . . . . . . . . . . . . . . . . . . . . . . . . . . . . . . . . . . . . . . . . . . . . . . . . . . . . . . . . . . . v
FORWARD-LOOKING STATEMENTS . . . . . . . . . . . . . . . . . . . . . . . . . . . . . . . . . . . . . . . . . . . . . . . . . . . . . . vi
SUMMARY . . . . . . . . . . . . . . . . . . . . . . . . . . . . . . . . . . . . . . . . . . . . . . . . . . . . . . . . . . . . . . . . . . . . . . . . . . . . . . . . . . 1
RISK FACTORS . . . . . . . . . . . . . . . . . . . . . . . . . . . . . . . . . . . . . . . . . . . . . . . . . . . . . . . . . . . . . . . . . . . . . . . . . . . . . 11
USE OF PROCEEDS . . . . . . . . . . . . . . . . . . . . . . . . . . . . . . . . . . . . . . . . . . . . . . . . . . . . . . . . . . . . . . . . . . . . . . . . . 25
EXCHANGE RATES . . . . . . . . . . . . . . . . . . . . . . . . . . . . . . . . . . . . . . . . . . . . . . . . . . . . . . . . . . . . . . . . . . . . . . . . . 26
CAPITALIZATION AND INDEBTEDNESS . . . . . . . . . . . . . . . . . . . . . . . . . . . . . . . . . . . . . . . . . . . . . . . . . . 27
SELECTED FINANCIAL INFORMATION . . . . . . . . . . . . . . . . . . . . . . . . . . . . . . . . . . . . . . . . . . . . . . . . . . . 28
UNAUDITED NON-CONSOLIDATED PRO FORMA INCOME STATEMENT . . . . . . . . . . . . . . . . 30
MANAGEMENT’S DISCUSSION AND ANALYSIS OF FINANCIAL CONDITION ANDRESULTS OF OPERATION . . . . . . . . . . . . . . . . . . . . . . . . . . . . . . . . . . . . . . . . . . . . . . . . . . . . . . . . . . . . . . . 32
THE KOREAN BANKING INDUSTRY . . . . . . . . . . . . . . . . . . . . . . . . . . . . . . . . . . . . . . . . . . . . . . . . . . . . . . . 69
BUSINESS . . . . . . . . . . . . . . . . . . . . . . . . . . . . . . . . . . . . . . . . . . . . . . . . . . . . . . . . . . . . . . . . . . . . . . . . . . . . . . . . . . . 70
DESCRIPTION OF ASSETS AND LIABILITIES . . . . . . . . . . . . . . . . . . . . . . . . . . . . . . . . . . . . . . . . . . . . . 87
RISK MANAGEMENT . . . . . . . . . . . . . . . . . . . . . . . . . . . . . . . . . . . . . . . . . . . . . . . . . . . . . . . . . . . . . . . . . . . . . . . 110
MANAGEMENT AND EMPLOYEES . . . . . . . . . . . . . . . . . . . . . . . . . . . . . . . . . . . . . . . . . . . . . . . . . . . . . . . . . 128
CERTAIN RELATIONSHIPS AND RELATED PARTY TRANSACTIONS . . . . . . . . . . . . . . . . . . . . 135
SHINHAN FINANCIAL GROUP . . . . . . . . . . . . . . . . . . . . . . . . . . . . . . . . . . . . . . . . . . . . . . . . . . . . . . . . . . . . . 136
SUPERVISION AND REGULATION . . . . . . . . . . . . . . . . . . . . . . . . . . . . . . . . . . . . . . . . . . . . . . . . . . . . . . . . . 141
DESCRIPTION OF THE NOTES . . . . . . . . . . . . . . . . . . . . . . . . . . . . . . . . . . . . . . . . . . . . . . . . . . . . . . . . . . . . . 154
TAXATION . . . . . . . . . . . . . . . . . . . . . . . . . . . . . . . . . . . . . . . . . . . . . . . . . . . . . . . . . . . . . . . . . . . . . . . . . . . . . . . . . . 165
PLAN OF DISTRIBUTION . . . . . . . . . . . . . . . . . . . . . . . . . . . . . . . . . . . . . . . . . . . . . . . . . . . . . . . . . . . . . . . . . . . 170
NOTICE TO INVESTORS . . . . . . . . . . . . . . . . . . . . . . . . . . . . . . . . . . . . . . . . . . . . . . . . . . . . . . . . . . . . . . . . . . . 174
CERTAIN ERISA CONSIDERATIONS . . . . . . . . . . . . . . . . . . . . . . . . . . . . . . . . . . . . . . . . . . . . . . . . . . . . . . . 177
LEGAL MATTERS . . . . . . . . . . . . . . . . . . . . . . . . . . . . . . . . . . . . . . . . . . . . . . . . . . . . . . . . . . . . . . . . . . . . . . . . . . 179
INDEPENDENT ACCOUNTANTS . . . . . . . . . . . . . . . . . . . . . . . . . . . . . . . . . . . . . . . . . . . . . . . . . . . . . . . . . . . 179
SUMMARY OF CERTAIN DIFFERENCES BETWEEN KOREAN GAAP AND U.S. GAAP . . . 180
INDEX TO FINANCIAL STATEMENTS . . . . . . . . . . . . . . . . . . . . . . . . . . . . . . . . . . . . . . . . . . . . . . . . . . . . . F-1
i
You should rely only on the information contained in this offering circular or to which the Bank hasreferred you. We have not authorized anyone to provide you with information that is different. Thisoffering circular may only be used where it is legal to sell the Notes. You should not assume that theinformation in this offering circular is accurate as of any date other than the date at the front of thisoffering circular. This offering circular is confidential. You are authorized to use this offeringcircular solely for the purpose of considering the purchase of the Notes described in this offeringcircular. You may not reproduce or distribute this offering circular in whole or in part, and you maynot disclose any of the contents of this offering circular or use any information herein for any purposeother than considering a purchase of the Notes. You agree to the foregoing by accepting delivery ofthis offering circular.
IN CONNECTION WITH THIS OFFERING, MERRILL LYNCH, PIERCE, FENNER & SMITHINCORPORATED OR ANY PERSON ACTING FOR OR ON ITS BEHALF, TO THE EXTENTPERMITTED BY APPLICABLE LAWS AND REGULATIONS, MAY OVERALLOT OR EFFECTTRANSACTIONS WITH A VIEW TO SUPPORTING THE MARKET PRICE OF THE NOTES AT ALEVEL HIGHER THAN THAT WHICH MIGHT OTHERWISE PREVAIL FOR A LIMITED PERIOD OFTIME AFTER THE ISSUE DATE. HOWEVER, THERE IS NO ASSURANCE THAT MERRILL LYNCH,PIERCE, FENNER & SMITH INCORPORATED OR ITS AGENT WILL UNDERTAKE SUCHSTABILIZATION. SUCH STABILIZATION, IF COMMENCED, MAY BE DISCONTINUED AT ANYTIME AND MUST BE BROUGHT TO AN END AFTER A LIMITED PERIOD. SEE “PLAN OFDISTRIBUTION”.
The Bank, having made all reasonable inquiries, confirms that this offering circular contains all informationwith respect to it and the Notes which is material in the context of the issue and offering of the Notes, thatthe information contained in this offering circular is true and accurate in all material respects and is notmisleading in any material respect, that the opinions and intentions expressed in this offering circular arehonestly held and have been reached after considering all relevant circumstances and are based onreasonable assumptions, and that there are no other facts, the omission of which would, in the context of theissue and offering of the Notes, make this offering circular as a whole or any information or the expressionof any opinions or intentions expressed in this offering circular misleading in any material respect. TheBank accepts responsibility accordingly. Information provided in this offering circular with respect toKorea, its political status and economy, has been derived from information published by the Governmentand other public sources, and the Bank accepts responsibility only for the accurate extraction of informationfrom such sources.
In making an investment decision, prospective investors must rely on their own examination of us and theterms of the offering of Notes, including the merits and risks involved. We are not making anyrepresentation to any purchaser of the Notes regarding the legality of an investment in the Notes by suchpurchaser under any legal investment or similar laws or regulations. The contents of this offering circularshould not be construed as providing legal, business, accounting or tax advice. An investor should bear theeconomic risk of an investment in the Notes.
This offering circular is based on the information provided by the Bank. Accordingly, no representation,warranty or undertaking, express or implied, is made and no responsibility or liability is accepted by theInitial Purchasers as to the accuracy or completeness of the information contained in this offering circularor any other information provided by us in connection with the offering of the Notes.
No person is authorized in connection with any offering of the Notes to give any information or make anyrepresentation other than as contained in this offering circular and, if given or made, that information orrepresentation must not be relied upon as having been authorized by us or by the Initial Purchasers (asdefined in “Plan of Distribution”). This offering circular does not constitute an offer to sell or a solicitationof an offer to buy any Notes by any person except in compliance with all applicable laws and regulations.Neither the delivery of this offering circular nor any sale made in connection with this offering circularshall under any circumstances imply that the information in this offering circular is correct as of any datesubsequent to the date of this offering circular or constitute a representation that there has been no changeor development reasonably likely to involve a material adverse change in our affairs since the date of thisoffering circular.
ii
The distribution of this offering circular and the offering of the Notes in certain jurisdictions may berestricted by law. It may not be used for or in connection with any offer to, or solicitation by, anyone in anyjurisdiction in which it is unlawful to make such an offer or solicitation. Persons into whose possession thisoffering circular may come are required by us and the Initial Purchasers to inform themselves about and toobserve the relevant restrictions. No action is being taken in any jurisdiction to permit an offering to thegeneral public of Notes or the distribution of this offering circular in any jurisdiction where action would berequired for those purposes.
A REGISTRATION STATEMENT FOR THE OFFERING AND SALE OF THE NOTES HAS NOTBEEN FILED WITH THE FINANCIAL SERVICES COMMISSION OF KOREA. ACCORDINGLY,THE NOTES MAY NOT BE OFFERED, SOLD OR DELIVERED, DIRECTLY OR INDIRECTLY,IN KOREA OR TO, OR FOR THE ACCOUNT OR BENEFIT OF, ANY RESIDENT OF KOREA (ASSUCH TERM IS DEFINED UNDER THE FOREIGN EXCHANGE TRANSACTION LAW ANDREGULATION OF KOREA AND ITS ENFORCEMENT DECREE), FOR A PERIOD OF ONEYEAR FROM THE DATE OF ISSUANCE OF THE NOTES, EXCEPT AS OTHERWISEPERMITTED BY APPLICABLE KOREAN LAWS AND REGULATIONS. FURTHERMORE, AHOLDER OF THE NOTES SHALL BE PROHIBITED FROM OFFERING, DELIVERING ORSELLING ANY NOTES, DIRECTLY OR INDIRECTLY, IN KOREA OR TO, OR FOR THEACCOUNT OR BENEFIT OF, ANY RESIDENT OF KOREA OTHER THAN CERTAINQUALIFIED PROFESSIONAL INVESTORS AS SET FORTH IN ARTICLE 11, PARAGRAPH 1,ITEM 1, SUB-ITEMS KA AND NA OF THE PRESIDENTIAL DECREE OF THE FINANCIALINVESTMENT SERVICES AND CAPITAL MARKETS ACT FOR A PERIOD OF ONE YEARFROM THE DATE OF ISSUANCE OF THE NOTES, EXCEPT AS OTHERWISE PERMITTED BYAPPLICABLE KOREAN LAWS AND REGULATIONS.
NOTICE TO PROSPECTIVE INVESTORS IN THE UNITED STATES
NEITHER THE UNITED STATES SECURITIES AND EXCHANGE COMMISSION (THE “SEC”)NOR ANY STATE SECURITIES COMMISSION HAS APPROVED OR DISAPPROVED OF THENOTES OR DETERMINED IF THIS OFFERING CIRCULAR IS TRUTHFUL OR COMPLETE.ANY REPRESENTATION TO THE CONTRARY IS A CRIMINAL OFFENSE.
THE NOTES ARE SUBJECT TO RESTRICTIONS ON TRANSFERABILITY AND RESALE ANDMAY NOT BE TRANSFERRED OR RESOLD EXCEPT AS PERMITTED UNDER THESECURITIES ACT AND THE APPLICABLE STATE SECURITIES LAWS PURSUANT TOREGISTRATION OR EXEMPTION THEREFROM. AS A PROSPECTIVE PURCHASER, YOUSHOULD BE AWARE THAT YOU MAY BE REQUIRED TO BEAR THE FINANCIAL RISKS OFTHIS INVESTMENT FOR AN INDEFINITE PERIOD OF TIME. PLEASE REFER TO THESECTIONS IN THIS OFFERING CIRCULAR ENTITLED “PLAN OF DISTRIBUTION” AND“NOTICE TO INVESTORS”.
NOTICE TO NEW HAMPSHIRE RESIDENTS
NEITHER THE FACT THAT A REGISTRATION STATEMENT OR AN APPLICATION FOR ALICENSE HAS BEEN FILED UNDER RSA 421-B WITH THE STATE OF NEW HAMPSHIRE NORTHE FACT THAT A SECURITY IS EFFECTIVELY REGISTERED OR A PERSON IS LICENSEDIN THE STATE OF NEW HAMPSHIRE CONSTITUTES A FINDING BY THE SECRETARY OFSTATE OF NEW HAMPSHIRE THAT ANY DOCUMENT FILED UNDER CHAPTER 421-B ISTRUE, COMPLETE AND NOT MISLEADING. NEITHER ANY SUCH FACT NOR THE FACTTHAT AN EXEMPTION OR EXCEPTION IS AVAILABLE FOR A SECURITY OR ATRANSACTION MEANS THAT THE SECRETARY OF STATE HAS PASSED IN ANY WAY UPONTHE MERITS OR QUALIFICATIONS OF, OR RECOMMENDED OR GIVEN APPROVAL TO,ANY PERSON, SECURITY OR TRANSACTION. IT IS UNLAWFUL TO MAKE, OR CAUSE TOBE MADE, TO ANY PROSPECTIVE PURCHASER, CUSTOMER OR CLIENT ANYREPRESENTATION INCONSISTENT WITH THE PROVISIONS OF THIS PARAGRAPH.
iii
CERTAIN DEFINED TERMS AND CONVENTIONS
Unless otherwise specified or the context otherwise requires, in this offering circular:
Š all references to “we”, “us”, “our”, “Shinhan Bank” and the “Bank” shall mean the surviving entityfollowing the merger of former Shinhan Bank into Chohung Bank, effective April 3, 2006;
Š all references to “former Shinhan Bank” shall mean Shinhan Bank as in existence prior to its mergerwith Chohung Bank, effective April 3, 2006;
Š all references to “Chohung Bank” shall mean Chohung Bank as in existence prior to its merger withformer Shinhan Bank, effective April 3, 2006; and
Š all references to “Shinhan Financial Group Co., Ltd.,” “Shinhan Financial Group” and “our holdingcompany” shall mean Shinhan Financial Group Co., Ltd., of which the Bank is a wholly-ownedsubsidiary.
All references to “Korea” and the “Republic” contained in this offering circular shall mean The Republic ofKorea. All references to the “Government” shall mean the government of The Republic of Korea. The“Financial Supervisory Service” is the executive body of the Financial Services Commission, which wasrenamed as such as of February 29, 2008, from the Financial Supervisory Commission.
All references to “Won” or “W” in this offering circular are to the lawful currency of Korea; all referencesto “Dollars”, “$” or “US$” are to the lawful currency of the United States of America; and all references to“Yen” or “¥” are to the lawful currency of Japan.
For convenience only, certain Won amounts have been translated into U.S. dollars. Unless otherwisespecified, all such conversions were made at the market average exchange rate announced by SeoulMoney Brokerage Services, Ltd. in Seoul for U.S. dollars against Won (the “Market Average ExchangeRate”). Unless otherwise stated, the translations of Won into U.S. dollars as of March 31, 2009 weremade at the Market Average Exchange Rate in effect on such date, which was W1,377.1 = U.S.$1.00. TheMarket Average Exchange Rate has been highly volatile recently and the U.S. dollar amounts referred toin this offering circular should not be relied upon as an accurate reflection of our results of operations.We expect this volatility to continue in the near future. No representation is made that the Won or U.S.dollar amounts referred to herein could have been or could be converted into U.S. dollars or Won, as thecase may be, at any particular rate or at all. The Market Average Exchange Rate on June 19, 2009 wasW1,263.2 = U.S.$1.00.
Any discrepancies in any table between totals and the sums of the amounts listed are due to rounding.References to billions are to thousands of millions.
PRESENTATION OF FINANCIAL AND OTHER INFORMATION
We prepare our financial statements in Won in accordance with generally accepted accounting principles inKorea (“Korean GAAP”), together with, where applicable, accounting and reporting guidelines underKorean accounting standards applicable to the banking industry, which differ in certain important respectsfrom generally accepted accounting principles in certain other countries, including the United States. For adiscussion of certain differences between Korean GAAP and generally accepted accounting principles in theUnited States (“U.S. GAAP”) as they relate to the Issuer, see “Summary of Certain Differences betweenKorean GAAP and U.S. GAAP”. We have made no attempt to identify or quantify the impact of thesedifferences.
All financial information contained in this offering circular is presented on a non-consolidated basis, unlessstated otherwise. Financial and other information contained in this offering circular regarding individualborrowers, groups or categories of borrowers or classifications by industry, geography, size or other factors,including information as to loans, credits, total exposures, allowances, collateral values, non-performingloans and other items, is derived solely from our internal management information systems.
iv
Under the Korean Banking Act of 1950, as amended (the “Banking Act”), assets accepted in trust by a bankin Korea must be segregated from its other assets in the accounts of that bank. Accordingly, banks,including the Bank, engaged in the banking and trust businesses must maintain two separate accounts, thebank account and the trust account, and two separate sets of records, which provide details of theirrespective banking and trust businesses. All financial information contained in this offering circular relatingto the Bank is presented with respect to the Bank’s bank account only, unless stated otherwise.
On August 19, 2003, Shinhan Financial Group acquired 80.04% of Chohung Bank’s common shares.Subsequently, Shinhan Financial Group acquired additional common shares of Chohung Bank, and in June2004, acquired all remaining common shares of Chohung Bank. As of April 3, 2006, Shinhan FinancialGroup merged former Shinhan Bank into Chohung Bank, with the latter being the surviving legal entity, andsplit-merged the credit card business of Chohung Bank into Shinhan Card Co., Ltd. (“Shinhan Card”), asubsidiary of Shinhan Financial Group. On the same date, the surviving entity from the merger of formerShinhan Bank and Chohung Bank changed its name to Shinhan Bank. Accordingly, unless otherwise stated,the financial and statistical information of the Bank for the year ended December 31, 2006 contained in thisoffering circular does not include information for former Shinhan Bank prior to the merger on April 3,2006. See also “Unaudited Non-consolidated Pro Forma Income Statement”.
ENFORCEABILITY OF CIVIL LIABILITIES
The Bank is a corporation organized under the laws of Korea. All of the Bank’s directors and officers andcertain other persons named in this offering circular reside in Korea, and all or a significant portion of theassets of the directors and officers and certain other persons named in this offering circular andsubstantially all of the Bank’s assets are located in Korea. As a result, it may not be possible for you toeffect service of process within the United States upon such persons or to enforce against them or against usin U.S. courts judgments predicated upon the civil liability provisions of the federal securities laws of theUnited States. There is doubt as to the enforceability in Korea, either in original actions or in actions forenforcement of judgments of U.S. courts, of civil liabilities predicated on the U.S. federal securities laws.
AVAILABLE INFORMATION
To permit compliance with Rule 144A under the Securities Act in connection with sales of the Notes, theBank will be required under the Fiscal Agency Agreement to be entered into as of the closing date of thisoffering (the “Fiscal Agency Agreement”) between the Bank and The Bank of New York Mellon, as thefiscal agent (the “Fiscal Agent”), to furnish, upon request, to a Holder (as defined in “Description of theNotes — General”) of a Note and a prospective investor designated by such Holder, the informationrequired to be delivered under Rule 144A(d)(4) under the Securities Act unless at the time of the request weare a reporting company under Section 13 or Section 15(d) of the United States Securities Exchange Act of1934, as amended (the “Exchange Act”), or the Bank is exempt from the registration requirements ofSection 12(g) of the Exchange Act (and therefore are required to publish on its Web site, in English, certaininformation pursuant to Rule 12g3-2(b) under the Exchange Act). In accordance with the Fiscal AgencyAgreement, the Fiscal Agent also will make available for inspection by Holders of the Notes or, in certaincases, arrange for the mailing to such Holders, certain reports or communications received from us. See“Description of the Notes — Notices”.
Copies of the Bank’s articles of incorporation and the Fiscal Agency Agreement are available free of chargefrom the specified offices of the Fiscal Agent. We prepare audited annual financial statements andunaudited interim financial statements in accordance with generally accepted accounting principles in Korea(“Korean GAAP”), which will be available at the office of the Fiscal Agent.
v
FORWARD-LOOKING STATEMENTS
This offering circular contains certain “forward-looking statements” that are based on the Bank’s currentexpectations, assumptions, estimates and projections about it and its industry. The forward-lookingstatements are subject to various risks and uncertainties. Generally, these forward-looking statements can beidentified by the use of forward-looking terminology such as “anticipate”, “believe”, “estimate”, “expect”,“intend”, “target”, “seek”, “aim”, “contemplate”, “project”, “plan”, “goal”, “should” and similarexpressions or the negatives thereof. Those statements include, among other things, the discussions of theBank’s business strategy and expectations concerning its market position, future operations, cash flows,margins, profitability, liquidity and capital resources. The Bank cautions you that reliance on any forward-looking statement involves risks and uncertainties, and that although the Bank believes that the assumptionson which its forward-looking statements are based are reasonable, any of those assumptions could prove tobe inaccurate, and, as a result, the forward-looking statements based on those assumptions could beincorrect. The uncertainties in this regard include, but are not limited to, those identified in the risk factorsdiscussed elsewhere in this offering circular. See the section entitled “Risk Factors” beginning on page 11.In light of these and other uncertainties, you should not conclude that the Bank will necessarily achieve anyplans and objectives or projected financial results referred to in any of the forward-looking statements. TheBank does not undertake to release the results of any revisions of these forward-looking statements toreflect future events or circumstances, except as required by law.
vi
SUMMARY
You should read the following summary as an introduction to and in conjunction with the more detailedinformation about the Bank and its financial statements contained elsewhere in this offering circular.
The Bank
Introduction
The Bank is the third largest commercial bank in Korea in terms of total assets as of March 31, 2009. TheBank provides a wide range of banking products and services to small- and medium-sized enterprises, largecorporations and individuals in Korea. As of March 31, 2009, the Bank served approximately 5.2 millionactive customers (meaning customers who maintain a monthly average deposit balance of W300,000 ormore or who have a positive monthly average loan balance with the Bank), through a nationwide network of944 branches and 7,147 automated banking terminals, as well as fixed line, mobile telephone and Internetbanking. As of March 31, 2009, the Bank’s non-consolidated total assets, net loans (after deductingallowance for loan losses) and bank account deposits, which do not include the assets and liabilities of trustaccounts, were W216,249 billion, W140,634 billion and W126,849 billion, respectively.
Lending to small- and medium-sized enterprises in Korea has been a principal focus of the Bank’soperations and the Bank remains one of the largest lenders in Korea to these customers. As of March 31,2009 and December 31, 2008, the Bank’s loans to small- and medium-sized enterprises totaled W62,144billion and W61,813 billion, respectively, which accounted for 43.4 % and 41.8% of the Bank’s total loans.This customer segment represents a broad spectrum of corporations in Korea, both by type of lending andtype of customer. The Bank believes that its extensive branch network facilitates its customer-orientedapproach to service this diversified group of customers.
Since its inception, prudent risk management has been one of the highest priorities of the Bank’s operations.As of March 31, 2009, the Bank’s capital adequacy ratio, as reported to the Korean Financial SupervisoryService, was 14.46%, which was highest among Korean commercial banks.
The Bank is the largest subsidiary of Shinhan Financial Group, which is the first privately establishedfinancial holding company in Korea. Shinhan Financial Group is one of the three largest financial servicesproviders in Korea as measured by total assets as of March 31, 2009 and, through its subsidiaries, providesa wide range of financial products and services, including banking, credit card services, brokerage,insurance and asset management services, including the largest credit card operation in Korea. The Bankbelieves that its business has benefited from the cross-selling and other synergy opportunities with othermember companies of Shinhan Financial Group. For more information on the financial holding companystructure, see “Shinhan Financial Group”.
Former Shinhan Bank was established in 1982 as the first privately funded commercial bank in Korea.Chohung Bank was established in 1897 and was the oldest financial institution in Korea. Former ShinhanBank and Chohung Bank were merged on April 3, 2006 and the new bank was named “Shinhan Bank”. TheBank’s headquarters is located at 120, 2-Ka, Taepyung-ro, Chung-Ku, Seoul, Korea. As of March 31, 2009,the Bank had nine consolidated subsidiaries, located in Seoul, Hong Kong, New York, Los Angeles,Toronto, Frankfurt, Phnom Penh, Beijing and Almaty.
Strategy
Prior to the onset of the current turmoil in the financial services industry and macro-economy in Korea aswell as globally, the Bank’s primary strategic focus has been on enhancing its market position in the Koreanbanking industry, achieving economy of scale in each major business segment, and integrating the businessunits of former Shinhan Bank and Chohung Bank.
1
The Bank believes that the level of uncertainty and volatility presented by the ongoing market andeconomic conditions presents a unique set of challenges and opportunities that requires it to realign itsstrategic priorities in order to ensure that it positions itself to best weather the current market crisis as wellas to capture the opportunities that emerge from it. Accordingly, the Bank plans to take a more “back tobasics” approach in protecting and strengthening the fundamentals of, and synergy among, its core businesslines, which will serve as the platform for pursuing sustainable growth group-wide and further solidifyingits competitive leadership, notwithstanding the difficult prospects in the global and domestic market andeconomic conditions.
More specifically, the Bank’s “back to basics” approach in light of the current crisis will focus on thefollowing fundamentals of its core businesses:
Further strengthen risk management. The Bank plans to make its risk management system morecomprehensive and pre-emptive in detecting and assessing any known and potential risks throughearly alerts and multiple contingency management plans. The Bank will also seek to improve itsoverall asset quality and minimize any reputational risk by reassessing the risk profile of its corebusinesses and realigning their respective asset portfolios by reducing exposure to high-risk assets.
Strengthen the profit structure. In order to improve the Bank’s profitability, it plans, among others,to adopt greater differentiation in risk-profiling its products to price them more accurately,aggressively restructure low-profit and overlapping product lines and loss-leaders, conservativelydiversify its revenue streams by taking advantage of market openings allowed by regulatory changes,deepen its banking customer relationships by capturing a greater market share of auto payroll depositaccounts and further expand cross-selling opportunities across the group-wide business units.
Capture maximum synergy. The Bank plans to continue to assist in building out, in conjunction withShinhan Financial Group’s group-wide efforts, informational networks and shared databases in orderto maximize opportunities for target marketing, up-selling and cross-selling as well as deepeningcustomer loyalty and relationships at the group level.
The Bank plans to use its strong business fundamentals as described above to become a world-class bankthat ranks among the leaders of the banking industry in Asia and globally. The Bank aims to achieve suchobjective by implementing the following strategies and focusing on the following objectives and initiatives:
Pursue new customer-oriented marketing to enhance customer loyalty. To further develop andenhance the loyalty of the Bank’s customers across all business segments, the Bank will (i) developcomprehensive banking services for each customer segment, (ii) formulate customized marketing andbusiness strategies for each customer segment, (iii) strengthen its direct marketing efforts, (iv) explorenew businesses to meet changes in customers’ needs, (v) seek to develop innovative products andservices, such as ubiquitous banking and foreign financial product investment services, and (vi) offerdiversified investment products to customers. In particular, the Bank is focusing on the developmentof its mass-market customer basis. In addition, the Bank plans to combine its commercial bankingchannels with its investment banking products to create a unique commercial investment bankingmodel in Korea and simultaneously seek investment banking opportunities in the overseas markets.
Establish an optimal earnings structure for corporate sustainability. The Bank aims to strengthen itsfoundation of income sources, with particular efforts to increase its non-interest income. Furthermore,the Bank aims to secure a sound management structure to improve risk management, achieve anoptimal balance of funding and funds operations and strengthen its infrastructure and systems tomaximize earnings from cross-selling products and services of its affiliates.
Establish a sound foundation to compete globally. To enable the Bank to compete in the globalfinancial markets, it aims to (i) improve its brand value, (ii) continue to create customer-orientedoperating systems and processes, (iii) establish a system to create, accumulate, utilize and shareintellectual property among the Bank and its affiliates, (iv) create a flexible organizational culture that
2
embraces changes in market conditions and customers’ demands and (v) establish a platform to enablethe Bank to strengthen its strategic co-operation with foreign financial institutions and create a globalnetwork to exchange information and ideas.
Creating synergies within the holding company structure of Shinhan Financial Group. Since theestablishment of a financial holding company, Shinhan Financial Group, in 2001, the Bank hasfocused on achieving synergy through cross-selling of products and services of the other subsidiariesof Shinhan Financial Group. The Bank and its affiliates, Goodmorning Shinhan Securities andShinhan Life Insurance, together serve as the primary distribution channel for Shinhan FinancialGroup while the other non-bank members of the Shinhan Financial Group are focusing on developingcompetitive products and services. Examples of the principal products for cross-selling in the retailsegment include bancassurance, credit cards, beneficiary certificates and “Financial NetworkAccounts”, which are integrated accounts for banking, brokerage and insurance services. In particular,the Bank intends to capitalize on the synergistic benefits of the acquisition by Shinhan FinancialGroup of LG Card and its substantial customer base. See “Shinhan Financial Group”.
Establishing and Consolidating the One Portal Network. In order to provide total financial solutionsto the customers of the Bank and other members of the Shinhan Financial Group on a real-time basis,the Bank, together with other members of the Shinhan Financial Group, is continuing to develop aone-portal network for the Shinhan Financial Group. The one-portal network refers to the ability of acorporate or retail customer to have access to a total financial solution through any single point ofcontact with any member of Shinhan Financial Group.
3
Summary Financial Data
The following tables set forth summary non-consolidated income statement and balance sheet data withrespect to the Bank as of and for the years ended December 31, 2006, 2007 and 2008, which have beenderived from the Bank’s audited non-consolidated financial statements as of such dates and for suchperiods, and as of March 31, 2009 and for the three months ended March 31, 2008 and 2009, which havebeen derived from the Bank’s unaudited non-consolidated interim financial statements as of such date andfor such periods.
The non-consolidated financial statements exclude the accounts of all of the Bank’s subsidiaries (exceptthat the value of the Bank’s equity investments in their respective consolidated subsidiaries is included) andtheir respective trust account management business. The non-consolidated financial statements have beenprepared in accordance with Korean GAAP and, where applicable, the Korean Bank Accounting Guidelines,which differ in certain material respects from U.S. GAAP, and have not been intended to present thefinancial position, results of operations, cash flows and changes in equity in accordance with generallyaccepted accounting policies and practices in countries and jurisdictions other than Korea. For a discussionof certain differences between Korean GAAP and U.S. GAAP, see “Summary of Certain Differencesbetween Korean GAAP and U.S. GAAP” in this offering circular.
Certain financial information contained in “Business” and “Description of Assets and Liabilities of theBank” was not derived directly from the Bank’s unaudited non-consolidated interim financial statements asof March 31, 2009 and for the three months ended March 31, 2008 and 2009 or from the Bank’s auditednon-consolidated financial statements as of and for the years ended December 31, 2006, 2007 and 2008 butwas derived from certain accounting records, which were unaudited but were subject to the Bank’s internalcontrol over financial reporting.
On August 19, 2003, Shinhan Financial Group acquired 80.04% of Chohung Bank’s common shares.Subsequently, Shinhan Financial Group acquired additional common shares of Chohung Bank, and in June2004, acquired all remaining common shares of Chohung Bank. As of April 3, 2006, Shinhan FinancialGroup merged former Shinhan Bank into Chohung Bank, with the latter being the surviving legal entity, andsplit-merged the credit card business of Chohung Bank into Shinhan Card, a subsidiary of ShinhanFinancial Group. On the same date, the surviving entity from the merger of former Shinhan Bank andChohung Bank changed its name to Shinhan Bank. Accordingly, unless otherwise stated, the financial andstatistical information of the Bank for the year ended December 31, 2006 contained in this offering circulardoes not include information for former Shinhan Bank prior to the merger on April 3, 2006.
4
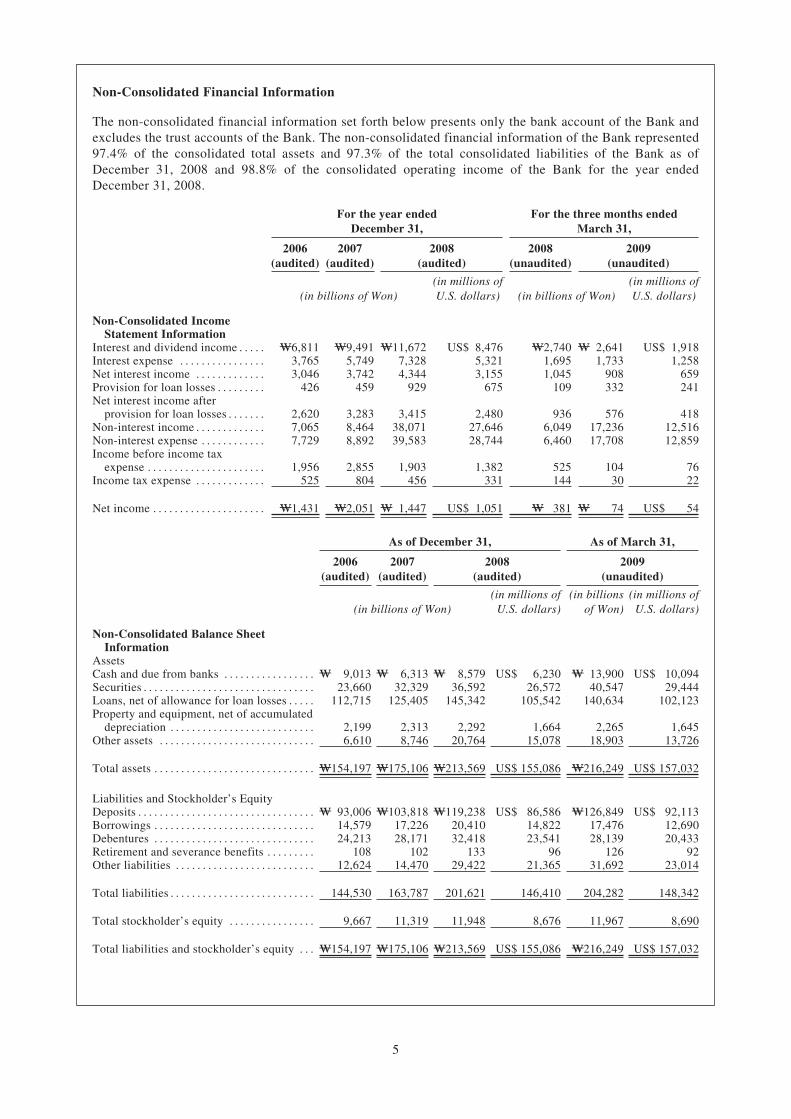
Non-Consolidated Financial Information
The non-consolidated financial information set forth below presents only the bank account of the Bank andexcludes the trust accounts of the Bank. The non-consolidated financial information of the Bank represented97.4% of the consolidated total assets and 97.3% of the total consolidated liabilities of the Bank as ofDecember 31, 2008 and 98.8% of the consolidated operating income of the Bank for the year endedDecember 31, 2008.
For the year endedDecember 31,
For the three months endedMarch 31,
2006(audited)
2007(audited)
2008(audited)
2008(unaudited)
2009(unaudited)
(in billions of Won)(in millions ofU.S. dollars) (in billions of Won)
(in millions ofU.S. dollars)
Non-Consolidated IncomeStatement Information
Interest and dividend income . . . . . W6,811 W9,491 W11,672 US$ 8,476 W2,740 W 2,641 US$ 1,918Interest expense . . . . . . . . . . . . . . . . 3,765 5,749 7,328 5,321 1,695 1,733 1,258Net interest income . . . . . . . . . . . . . 3,046 3,742 4,344 3,155 1,045 908 659Provision for loan losses . . . . . . . . . 426 459 929 675 109 332 241Net interest income after
provision for loan losses . . . . . . . 2,620 3,283 3,415 2,480 936 576 418Non-interest income . . . . . . . . . . . . . 7,065 8,464 38,071 27,646 6,049 17,236 12,516Non-interest expense . . . . . . . . . . . . 7,729 8,892 39,583 28,744 6,460 17,708 12,859Income before income tax
expense . . . . . . . . . . . . . . . . . . . . . . 1,956 2,855 1,903 1,382 525 104 76Income tax expense . . . . . . . . . . . . . 525 804 456 331 144 30 22
Net income . . . . . . . . . . . . . . . . . . . . . W1,431 W2,051 W 1,447 US$ 1,051 W 381 W 74 US$ 54
As of December 31, As of March 31,
2006(audited)
2007(audited)
2008(audited)
2009(unaudited)
(in billions of Won)(in millions of
U.S. dollars)(in billions
of Won)(in millions of
U.S. dollars)
Non-Consolidated Balance SheetInformation
AssetsCash and due from banks . . . . . . . . . . . . . . . . . W 9,013 W 6,313 W 8,579 US$ 6,230 W 13,900 US$ 10,094Securities . . . . . . . . . . . . . . . . . . . . . . . . . . . . . . . . 23,660 32,329 36,592 26,572 40,547 29,444Loans, net of allowance for loan losses . . . . . 112,715 125,405 145,342 105,542 140,634 102,123Property and equipment, net of accumulated
depreciation . . . . . . . . . . . . . . . . . . . . . . . . . . . 2,199 2,313 2,292 1,664 2,265 1,645Other assets . . . . . . . . . . . . . . . . . . . . . . . . . . . . . 6,610 8,746 20,764 15,078 18,903 13,726
Total assets . . . . . . . . . . . . . . . . . . . . . . . . . . . . . . W154,197 W175,106 W213,569 US$ 155,086 W216,249 US$ 157,032
Liabilities and Stockholder’s EquityDeposits . . . . . . . . . . . . . . . . . . . . . . . . . . . . . . . . . W 93,006 W103,818 W119,238 US$ 86,586 W126,849 US$ 92,113Borrowings . . . . . . . . . . . . . . . . . . . . . . . . . . . . . . 14,579 17,226 20,410 14,822 17,476 12,690Debentures . . . . . . . . . . . . . . . . . . . . . . . . . . . . . . 24,213 28,171 32,418 23,541 28,139 20,433Retirement and severance benefits . . . . . . . . . 108 102 133 96 126 92Other liabilities . . . . . . . . . . . . . . . . . . . . . . . . . . 12,624 14,470 29,422 21,365 31,692 23,014
Total liabilities . . . . . . . . . . . . . . . . . . . . . . . . . . . 144,530 163,787 201,621 146,410 204,282 148,342
Total stockholder’s equity . . . . . . . . . . . . . . . . 9,667 11,319 11,948 8,676 11,967 8,690
Total liabilities and stockholder’s equity . . . W154,197 W175,106 W213,569 US$ 155,086 W216,249 US$ 157,032
5
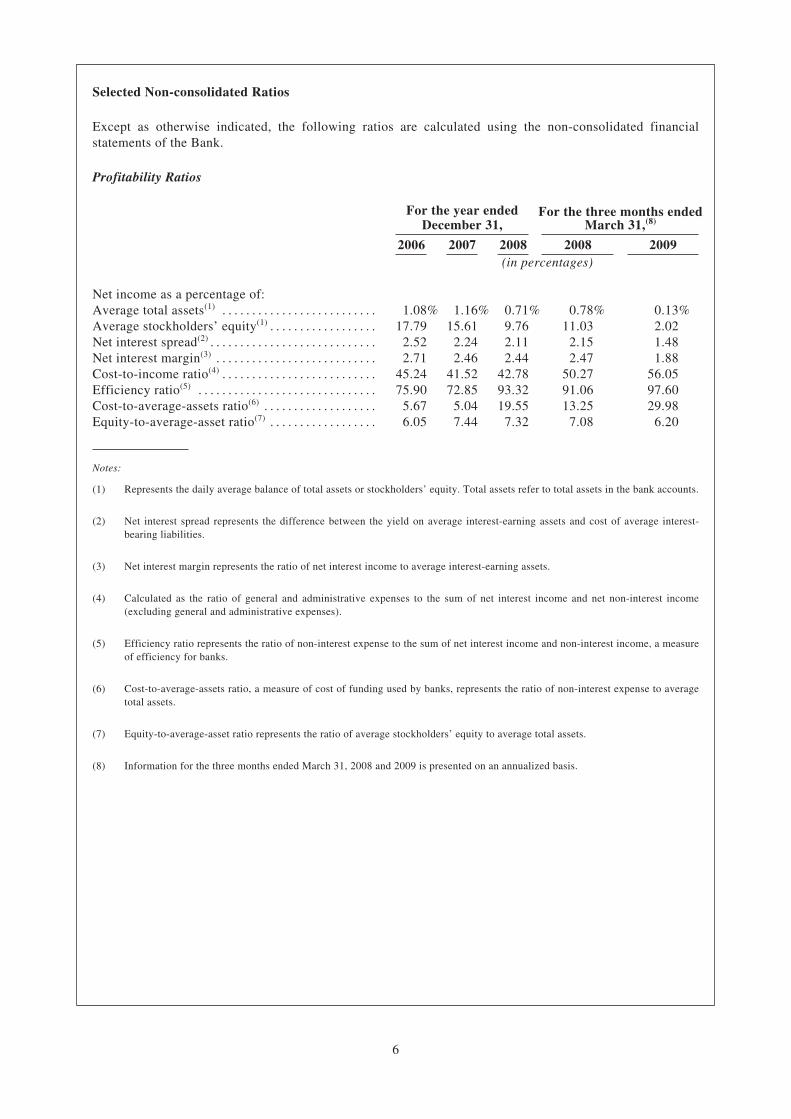
Selected Non-consolidated Ratios
Except as otherwise indicated, the following ratios are calculated using the non-consolidated financialstatements of the Bank.
Profitability Ratios
For the year endedDecember 31,
For the three months endedMarch 31,(8)
2006 2007 2008 2008 2009(in percentages)
Net income as a percentage of:Average total assets(1) . . . . . . . . . . . . . . . . . . . . . . . . . . 1.08% 1.16% 0.71% 0.78% 0.13%Average stockholders’ equity(1) . . . . . . . . . . . . . . . . . . 17.79 15.61 9.76 11.03 2.02Net interest spread(2) . . . . . . . . . . . . . . . . . . . . . . . . . . . . 2.52 2.24 2.11 2.15 1.48Net interest margin(3) . . . . . . . . . . . . . . . . . . . . . . . . . . . 2.71 2.46 2.44 2.47 1.88Cost-to-income ratio(4) . . . . . . . . . . . . . . . . . . . . . . . . . . 45.24 41.52 42.78 50.27 56.05Efficiency ratio(5) . . . . . . . . . . . . . . . . . . . . . . . . . . . . . . 75.90 72.85 93.32 91.06 97.60Cost-to-average-assets ratio(6) . . . . . . . . . . . . . . . . . . . 5.67 5.04 19.55 13.25 29.98Equity-to-average-asset ratio(7) . . . . . . . . . . . . . . . . . . 6.05 7.44 7.32 7.08 6.20
Notes:
(1) Represents the daily average balance of total assets or stockholders’ equity. Total assets refer to total assets in the bank accounts.
(2) Net interest spread represents the difference between the yield on average interest-earning assets and cost of average interest-bearing liabilities.
(3) Net interest margin represents the ratio of net interest income to average interest-earning assets.
(4) Calculated as the ratio of general and administrative expenses to the sum of net interest income and net non-interest income(excluding general and administrative expenses).
(5) Efficiency ratio represents the ratio of non-interest expense to the sum of net interest income and non-interest income, a measureof efficiency for banks.
(6) Cost-to-average-assets ratio, a measure of cost of funding used by banks, represents the ratio of non-interest expense to averagetotal assets.
(7) Equity-to-average-asset ratio represents the ratio of average stockholders’ equity to average total assets.
(8) Information for the three months ended March 31, 2008 and 2009 is presented on an annualized basis.
6
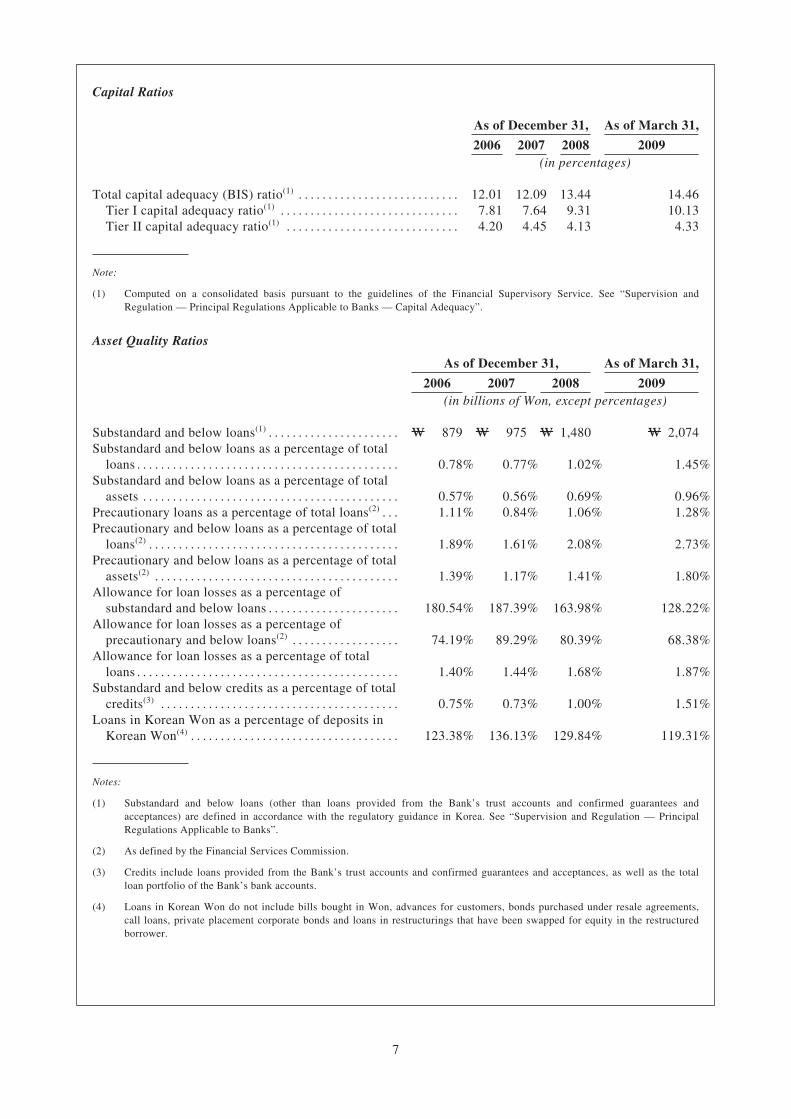
Capital Ratios
As of December 31, As of March 31,
2006 2007 2008 2009(in percentages)
Total capital adequacy (BIS) ratio(1) . . . . . . . . . . . . . . . . . . . . . . . . . . . 12.01 12.09 13.44 14.46Tier I capital adequacy ratio(1) . . . . . . . . . . . . . . . . . . . . . . . . . . . . . . 7.81 7.64 9.31 10.13Tier II capital adequacy ratio(1) . . . . . . . . . . . . . . . . . . . . . . . . . . . . . 4.20 4.45 4.13 4.33
Note:
(1) Computed on a consolidated basis pursuant to the guidelines of the Financial Supervisory Service. See “Supervision andRegulation — Principal Regulations Applicable to Banks — Capital Adequacy”.
Asset Quality Ratios
As of December 31, As of March 31,
2006 2007 2008 2009(in billions of Won, except percentages)
Substandard and below loans(1) . . . . . . . . . . . . . . . . . . . . . . W 879 W 975 W 1,480 W 2,074Substandard and below loans as a percentage of total
loans . . . . . . . . . . . . . . . . . . . . . . . . . . . . . . . . . . . . . . . . . . . . 0.78% 0.77% 1.02% 1.45%Substandard and below loans as a percentage of total
assets . . . . . . . . . . . . . . . . . . . . . . . . . . . . . . . . . . . . . . . . . . . 0.57% 0.56% 0.69% 0.96%Precautionary loans as a percentage of total loans(2) . . . 1.11% 0.84% 1.06% 1.28%Precautionary and below loans as a percentage of total
loans(2) . . . . . . . . . . . . . . . . . . . . . . . . . . . . . . . . . . . . . . . . . . 1.89% 1.61% 2.08% 2.73%Precautionary and below loans as a percentage of total
assets(2) . . . . . . . . . . . . . . . . . . . . . . . . . . . . . . . . . . . . . . . . . 1.39% 1.17% 1.41% 1.80%Allowance for loan losses as a percentage of
substandard and below loans . . . . . . . . . . . . . . . . . . . . . . 180.54% 187.39% 163.98% 128.22%Allowance for loan losses as a percentage of
precautionary and below loans(2) . . . . . . . . . . . . . . . . . . 74.19% 89.29% 80.39% 68.38%Allowance for loan losses as a percentage of total
loans . . . . . . . . . . . . . . . . . . . . . . . . . . . . . . . . . . . . . . . . . . . . 1.40% 1.44% 1.68% 1.87%Substandard and below credits as a percentage of total
credits(3) . . . . . . . . . . . . . . . . . . . . . . . . . . . . . . . . . . . . . . . . 0.75% 0.73% 1.00% 1.51%Loans in Korean Won as a percentage of deposits in
Korean Won(4) . . . . . . . . . . . . . . . . . . . . . . . . . . . . . . . . . . . 123.38% 136.13% 129.84% 119.31%
Notes:
(1) Substandard and below loans (other than loans provided from the Bank’s trust accounts and confirmed guarantees andacceptances) are defined in accordance with the regulatory guidance in Korea. See “Supervision and Regulation — PrincipalRegulations Applicable to Banks”.
(2) As defined by the Financial Services Commission.
(3) Credits include loans provided from the Bank’s trust accounts and confirmed guarantees and acceptances, as well as the totalloan portfolio of the Bank’s bank accounts.
(4) Loans in Korean Won do not include bills bought in Won, advances for customers, bonds purchased under resale agreements,call loans, private placement corporate bonds and loans in restructurings that have been swapped for equity in the restructuredborrower.
7
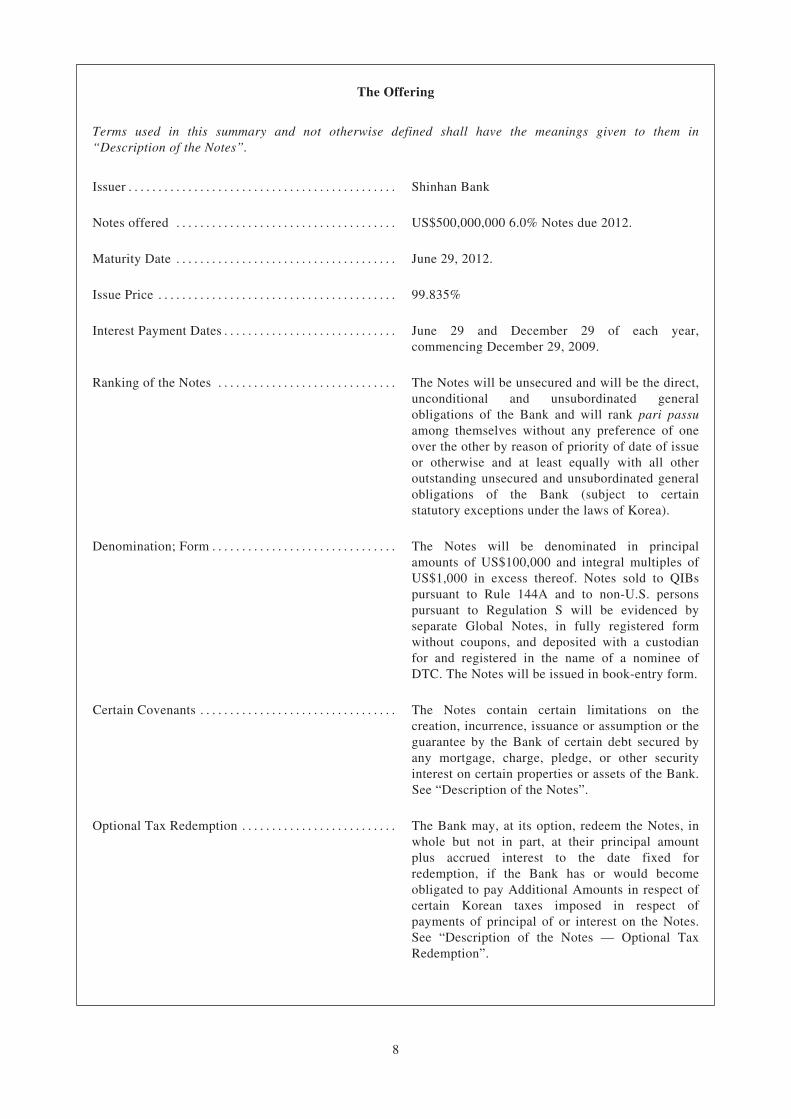
The Offering
Terms used in this summary and not otherwise defined shall have the meanings given to them in“Description of the Notes”.
Issuer . . . . . . . . . . . . . . . . . . . . . . . . . . . . . . . . . . . . . . . . . . . . . Shinhan Bank
Notes offered . . . . . . . . . . . . . . . . . . . . . . . . . . . . . . . . . . . . . US$500,000,000 6.0% Notes due 2012.
Maturity Date . . . . . . . . . . . . . . . . . . . . . . . . . . . . . . . . . . . . . June 29, 2012.
Issue Price . . . . . . . . . . . . . . . . . . . . . . . . . . . . . . . . . . . . . . . . 99.835%
Interest Payment Dates . . . . . . . . . . . . . . . . . . . . . . . . . . . . . June 29 and December 29 of each year,commencing December 29, 2009.
Ranking of the Notes . . . . . . . . . . . . . . . . . . . . . . . . . . . . . . The Notes will be unsecured and will be the direct,unconditional and unsubordinated generalobligations of the Bank and will rank pari passuamong themselves without any preference of oneover the other by reason of priority of date of issueor otherwise and at least equally with all otheroutstanding unsecured and unsubordinated generalobligations of the Bank (subject to certainstatutory exceptions under the laws of Korea).
Denomination; Form . . . . . . . . . . . . . . . . . . . . . . . . . . . . . . . The Notes will be denominated in principalamounts of US$100,000 and integral multiples ofUS$1,000 in excess thereof. Notes sold to QIBspursuant to Rule 144A and to non-U.S. personspursuant to Regulation S will be evidenced byseparate Global Notes, in fully registered formwithout coupons, and deposited with a custodianfor and registered in the name of a nominee ofDTC. The Notes will be issued in book-entry form.
Certain Covenants . . . . . . . . . . . . . . . . . . . . . . . . . . . . . . . . . The Notes contain certain limitations on thecreation, incurrence, issuance or assumption or theguarantee by the Bank of certain debt secured byany mortgage, charge, pledge, or other securityinterest on certain properties or assets of the Bank.See “Description of the Notes”.
Optional Tax Redemption . . . . . . . . . . . . . . . . . . . . . . . . . . The Bank may, at its option, redeem the Notes, inwhole but not in part, at their principal amountplus accrued interest to the date fixed forredemption, if the Bank has or would becomeobligated to pay Additional Amounts in respect ofcertain Korean taxes imposed in respect ofpayments of principal of or interest on the Notes.See “Description of the Notes — Optional TaxRedemption”.
8
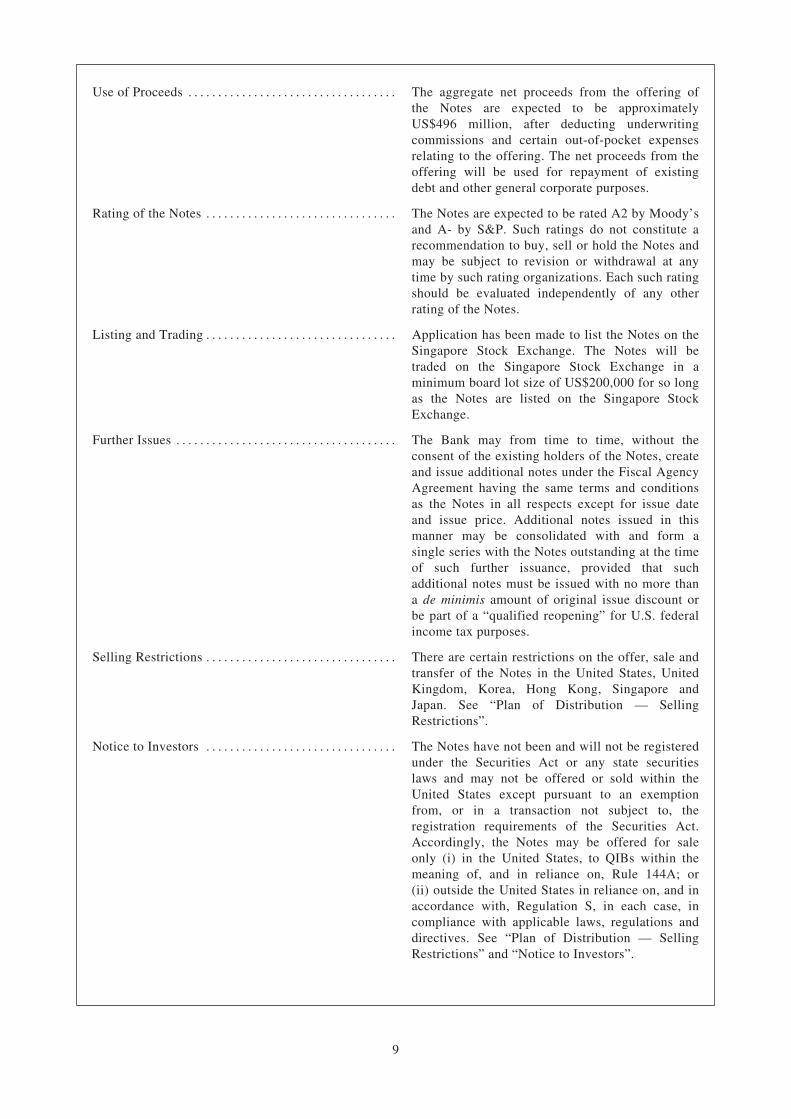
Use of Proceeds . . . . . . . . . . . . . . . . . . . . . . . . . . . . . . . . . . . The aggregate net proceeds from the offering ofthe Notes are expected to be approximatelyUS$496 million, after deducting underwritingcommissions and certain out-of-pocket expensesrelating to the offering. The net proceeds from theoffering will be used for repayment of existingdebt and other general corporate purposes.
Rating of the Notes . . . . . . . . . . . . . . . . . . . . . . . . . . . . . . . . The Notes are expected to be rated A2 by Moody’sand A- by S&P. Such ratings do not constitute arecommendation to buy, sell or hold the Notes andmay be subject to revision or withdrawal at anytime by such rating organizations. Each such ratingshould be evaluated independently of any otherrating of the Notes.
Listing and Trading . . . . . . . . . . . . . . . . . . . . . . . . . . . . . . . . Application has been made to list the Notes on theSingapore Stock Exchange. The Notes will betraded on the Singapore Stock Exchange in aminimum board lot size of US$200,000 for so longas the Notes are listed on the Singapore StockExchange.
Further Issues . . . . . . . . . . . . . . . . . . . . . . . . . . . . . . . . . . . . . The Bank may from time to time, without theconsent of the existing holders of the Notes, createand issue additional notes under the Fiscal AgencyAgreement having the same terms and conditionsas the Notes in all respects except for issue dateand issue price. Additional notes issued in thismanner may be consolidated with and form asingle series with the Notes outstanding at the timeof such further issuance, provided that suchadditional notes must be issued with no more thana de minimis amount of original issue discount orbe part of a “qualified reopening” for U.S. federalincome tax purposes.
Selling Restrictions . . . . . . . . . . . . . . . . . . . . . . . . . . . . . . . . There are certain restrictions on the offer, sale andtransfer of the Notes in the United States, UnitedKingdom, Korea, Hong Kong, Singapore andJapan. See “Plan of Distribution — SellingRestrictions”.
Notice to Investors . . . . . . . . . . . . . . . . . . . . . . . . . . . . . . . . The Notes have not been and will not be registeredunder the Securities Act or any state securitieslaws and may not be offered or sold within theUnited States except pursuant to an exemptionfrom, or in a transaction not subject to, theregistration requirements of the Securities Act.Accordingly, the Notes may be offered for saleonly (i) in the United States, to QIBs within themeaning of, and in reliance on, Rule 144A; or(ii) outside the United States in reliance on, and inaccordance with, Regulation S, in each case, incompliance with applicable laws, regulations anddirectives. See “Plan of Distribution — SellingRestrictions” and “Notice to Investors”.
9
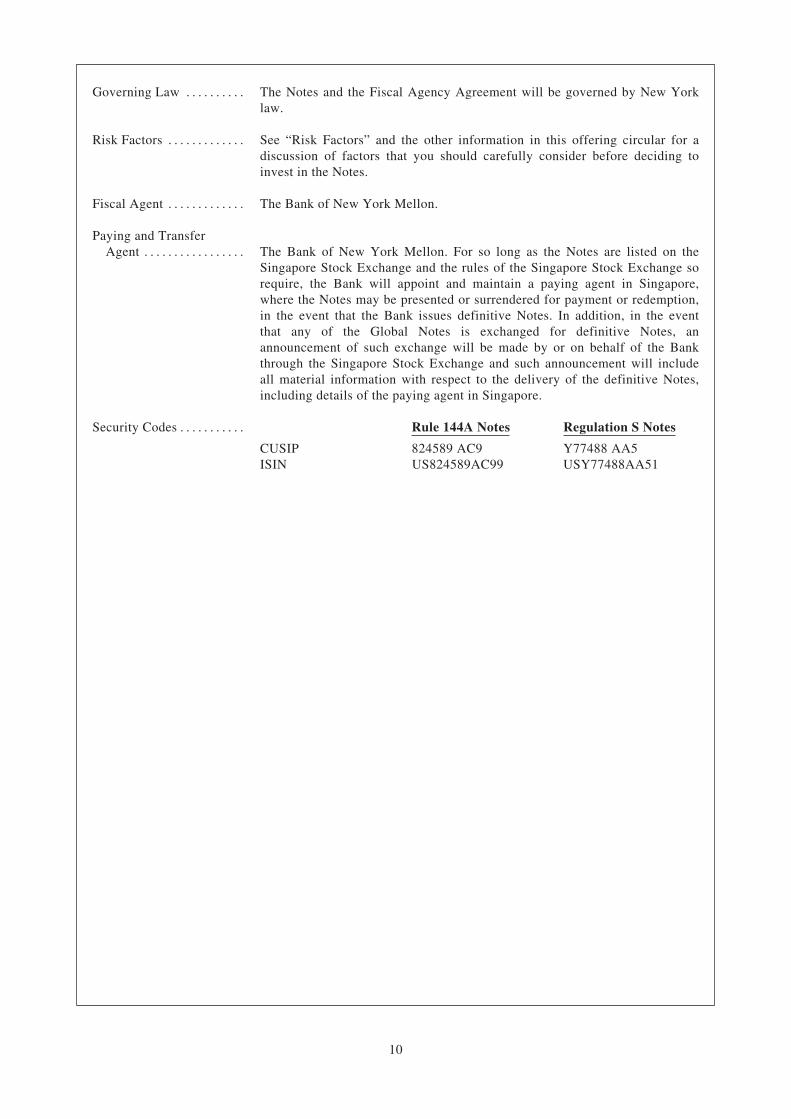
Governing Law . . . . . . . . . . The Notes and the Fiscal Agency Agreement will be governed by New Yorklaw.
Risk Factors . . . . . . . . . . . . . See “Risk Factors” and the other information in this offering circular for adiscussion of factors that you should carefully consider before deciding toinvest in the Notes.
Fiscal Agent . . . . . . . . . . . . . The Bank of New York Mellon.
Paying and TransferAgent . . . . . . . . . . . . . . . . . The Bank of New York Mellon. For so long as the Notes are listed on the
Singapore Stock Exchange and the rules of the Singapore Stock Exchange sorequire, the Bank will appoint and maintain a paying agent in Singapore,where the Notes may be presented or surrendered for payment or redemption,in the event that the Bank issues definitive Notes. In addition, in the eventthat any of the Global Notes is exchanged for definitive Notes, anannouncement of such exchange will be made by or on behalf of the Bankthrough the Singapore Stock Exchange and such announcement will includeall material information with respect to the delivery of the definitive Notes,including details of the paying agent in Singapore.
Security Codes . . . . . . . . . . . Rule 144A Notes Regulation S Notes
CUSIPISIN
824589 AC9US824589AC99
Y77488 AA5USY77488AA51
10
RISK FACTORS
In addition to other information contained in this offering circular, you should consider carefully the risksdescribed below. These risks are not the only ones that the Bank faces. Additional risks not currently knownto the Bank or those which the Bank currently believes are immaterial may also impair its businessoperations. The Bank’s business, financial condition or results of operations could be materially adverselyaffected by any of these risks.
Risks Relating to the Current Economic and Market Crisis
The recent difficulties in the global financial markets and their contagion effect on the overall economycould adversely affect the Bank’s asset quality and results of operations.
Since July 2007, significant adverse developments in the U.S. sub-prime mortgage sector have createdsignificant disruption and volatility in financial markets globally. The ensuing contraction of liquidity andcredit and deteriorations in asset values have had contagion effects on the overall economy. Starting in thesecond half of 2008, the world’s largest economies, including the United States, Europe and Japan, arewidely considered to be in the midst of significant economic recessions, and export-driven emergingeconomies such as China and Korea have also suffered substantial weakness in their economies. Forexample, the Korean economy experienced a contraction in real gross domestic product by 3.4% in thefourth quarter of 2008 compared to the fourth quarter of 2007. The weakening economies in Korea andglobally may create further shocks to the global financial markets, which in turn could cause a furtherdownward spiral in global economic and financial conditions.
In Korea, where most of the Bank’s assets are located and where it generates most of its income, there aresigns that, due to the recent significant difficulties in global economic and financial conditions, key macro-and microeconomic indicators such as exports, personal expenditures and consumption, unemploymentrates, demand for business products and services, debt service burden of households and businesses, thegeneral availability of credit and the asset value of real estate and securities may further deteriorate. Any ora combination of the foregoing factors may result in an increase in non-performing loans and worsen theasset quality of the Bank’s loans.
The Bank’s substandard or below credits, as classified according to the Financial Services Commissionguidelines, increased to W2,294 billion as of March 31, 2009 and W1,531 billion as of December 31, 2008,from W981 billion as of December 31, 2007, while the ratio of the Bank’s substandard or below credits tototal credits increased to 1.51% and 1.00% from 0.73% as of the same dates. The Bank’s delinquent loansas reported to the Financial Services Commission, which represent loans whose principals are past due forone day or more, increased to W1,608 billion as of March 31, 2009 and W1,172 billion as of December 31,2008, from W790 billion as of December 31, 2007, while its delinquency ratio increased to 1.12% and0.79% from 0.62% as of the same dates, respectively. Such increases were largely due to the deterioratingasset quality of the Bank’s loans to small- and medium-sized enterprises, which amounted to W62,144billion as of March 31, 2009 and W61,813 billion as of December 31, 2008, compared to W53,512 billionas of December 31, 2007. The delinquency ratio for such loans increased to 1.98% and 1.33% from 0.85%as of the same dates. The asset quality of the Bank’s loans, particularly the loans to small- and medium-sized enterprises, may further deteriorate, especially if the current economic and financial conditions inglobal and Korean markets continue to worsen, which would have a material adverse effect on its business,financial condition and results of operation.
The disruptions and volatility in the global and Korean financial markets and economies may also adverselyaffect the Bank’s business and results of operation in other ways. Specifically, the availability of credit maybecome limited, causing some of its counterparties to default. Moreover, negative developments in theglobal credit markets may cause significant fluctuations in stock markets globally and foreign currencyexchange rates, which in turn may affect the Bank results of operation. If credit market conditions continueto deteriorate, the Bank’s capital funding structure may need to be adjusted, its funding costs may increase,its credit rating may be further downgraded, or its loan and other credit losses may increase, all of whichcould have a material adverse effect on its business, financial condition and results of operation.
11
Systemic risk resulting from failures in the financial services industry could adversely affect the Bank.
Within the financial services industry, the default of any institution could lead to defaults by otherinstitutions. Concerns about, or a default by, one institution could lead to significant liquidity problems,losses or defaults by other institutions because the commercial soundness of many financial institutions maybe closely related as a result of their credit, trading, clearing or other relationships. This risk is sometimesreferred to as “systemic risk” and may adversely affect financial intermediaries, such as clearing agencies,clearinghouses, banks, securities firms and exchanges with which the Bank interacts on a daily basis, whichcould have an adverse effect on the Bank’s ability to raise new funding, and in turn, its business, financialcondition and results of operation. Furthermore, the Bank could be perceived to be facing the same issues asother financial institutions that hold assets with limited market liquidity or with significantly depressedvalues due to significantly negative views about the financial services sector in general as a result of recenteconomic and market developments, including the recent failures of major global financial institutions.Such perceptions of the Bank, even if false, could adversely affect its business, financial condition andresults of operation.
Risks Relating to the Bank’s Business
Competition in the Korean financial services industry is intense, and may further intensify as a result ofrecent deregulation.
Competition in the Korean financial services industry is, and is likely to remain, intense. The Bankcompetes principally with other major Korean commercial banks and major global banks operating inKorea, as well as government-run banks, specialized banks and regional banks. Some of the Bank’scompetitors, particularly the major global financial institutions, have greater experience and resources thanit does. As the Korean economy further develops, more competitors may enter the industry. In addition,potential consolidation among the Bank’s rival institutions may make the competitive landscape moreadverse to the Bank.
The Korean financial industry continues to be deregulated, which has lowered the barriers to entry. InFebruary 2009, the Financial Investment Services and Capital Markets Act became effective, which, byremoving regulatory barriers between securities brokerage, asset management, derivative financial servicesand trust services, has enabled financial investment companies (which have replaced the pre-existingsecurities companies and asset management companies) to engage in a broader sphere of financial activitiesthan the securities companies were previously allowed to, as well as offer a wider range of depositaryservices. Accordingly, the new law enables the creation of large financial institutions that can offer bothcommercial and investment banking services modeled after the major global financial institutions based inthe United States and Europe.
If the Bank is unable to compete effectively in this more competitive and deregulated business environment,its profit margin and market share may erode and its further growth opportunities may become limited,which could adversely affect its business, results of operation and financial condition.
The Bank is required to maintain its capital ratios above a minimum required level, and the failure to doso could result in the suspension of some or all of its operations.
The Bank, like other commercial banks in Korea, is required to maintain a minimum Tier I capital adequacyratio of 4.0% and a BIS ratio of 8.0%, each on a consolidated basis. These ratios measure the respectiveregulatory capital as a percentage of risk-weighted assets on a consolidated basis and are determined basedon guidelines of the Financial Services Commission. As of December 31, 2008, the Tier I capital adequacyratio and the BIS ratio of the Bank on a consolidated basis were 9.3% and 13.4%, respectively, and as ofMarch 31, 2009, the Tier I capital adequacy ratio and the BIS ratio of the Bank on a consolidated basis were10.13% and 14.46%, respectively.
The Bank may not be able to continue to satisfy its capital adequacy requirements for a number of reasons,including an increase in risky assets and provisioning expenses; substitution costs related to the disposal ofproblem loans; declines in the value of its securities portfolio; adverse changes in foreign currency
12
exchange rates; changes in the capital ratio requirements, the guidelines regarding the computation ofcapital ratios, or the framework set by the Basel Committee on Banking Supervision upon which theguidelines of the Financial Services Commission are based; or other adverse developments affecting theBank’s asset quality or equity capital as discussed in this section or due to other reasons.
If the Bank’s capital adequacy ratios fall below the required levels, the Financial Services Commission mayimpose penalties ranging from a warning to suspension or revocation of its business licenses. In order tomaintain the capital adequacy ratios above the required levels, the Bank may be required to raise additionalcapital through equity financing or capital injections from Shinhan Financial Group, but there is noassurance that it will be able to do so on commercially favorable terms or at all, or that Shinhan FinancialGroup may provide a capital injection in a sufficient amount or at all.
Liquidity, funding management and credit ratings are critical to the Bank’s ongoing performance.
Liquidity is essential to the Bank’s business as a financial intermediary, and the Bank may seek additionalfunding in the near future to satisfy liquidity needs, meet regulatory requirements, enhance its capital levelsor fund the growth of its operations as opportunities arise. A substantial part of the liquidity and fundingrequirements for the Bank is met using short-term customer deposits. While the volume of the Bank’scustomer deposits has generally been stable, there have been times when customer deposits declinedsubstantially due to the popularity of other, higher-yielding investment opportunities, namely stocks andmutual funds. During those times, the Bank was required to obtain alternative funding at higher costs. Inaddition, following the deregulation of depositary and settlement services as a result of the FinancialInvestment Services and Capital Markets Act, the Bank may experience a decrease in customer deposits dueto intensified competition for such deposits. The Bank also raises funds in the capital markets and borrowsfrom other financial institutions, the cost of which depends on the market rates and the general availabilityof credit, the terms of which may limit its ability to make acquisitions or subject itself to other restrictivecovenants. In addition, during times of sudden and significant devaluations of Korean Won against the U.S.dollar as was the case recently amid the global liquidity crisis, Korean commercial banks, including theBank, had difficulties from time to time in refinancing or obtaining optimal amounts of foreign currency-denominated funding on terms commercially acceptable to the Bank. While the Bank currently is not facingliquidity difficulties in any material respect, if the Bank is unable to obtain the funding that it needs onterms commercially acceptable to it for an extended period of time for reasons of Won devaluation orotherwise, it may not be able to ensure its financial viability, meet regulatory requirements, implement itsstrategies or compete effectively.
Credit ratings affect the cost and other terms upon which the Bank is able to obtain funding. Domestic andinternational rating agencies regularly evaluate the Bank, and their ratings of the Bank’s long-term debt arebased on a number of factors, including its financial strength as well as conditions affecting the financialservices industry generally and in Korea. In light of the ongoing difficulties in the financial servicesindustry and the financial markets, there can be no assurance that the rating agencies will maintain theBank’s current ratings or outlooks. For example, in February 2009, Moody’s Investors Service, Inc.(“Moody’s”) downgraded credit ratings on eight banks in Korea, including the Bank, as a result of whichthe Bank’s foreign currency-denominated long-term unsecured senior debt credit rating was downgradedfrom A1 to A2, which is the corresponding credit rating currently assigned to the Government. Other ratingagencies may decide to follow suit or place the Bank in a lower credit rating category. Additionaldowngrades in the credit ratings and outlooks of the Bank will likely increase the cost of its funding, limitits access to capital markets and borrowings, or require it to post additional collateral in financialtransactions, any of which could adversely affect its liquidity, net interest margins and profitability, and inturn, its business, financial condition and results of operation.
Changes in interest rates, foreign exchange rates, bond and equity prices, and other market factors haveaffected and will continue to affect the Bank’s business.
The most significant market risks that the Bank faces are interest rate, foreign exchange and bond andequity price risks. Changes in interest rate levels, yield curves and spreads may affect the interest ratemargin realized between lending and borrowing costs. Changes in currency rates, particularly in the KoreanWon-U.S. dollar exchange rates, affect the value of the Bank’s assets and liabilities denominated in foreign
13
currencies, the reported earnings of the Bank’s non-Korean subsidiaries and income from foreign exchangedealings. The performance of financial markets may affect bond and equity prices and, therefore, causechanges in the value of the Bank’s investment and trading portfolios. While the Bank has implemented riskmanagement methods to mitigate and control these and other market risks to which it is exposed, it isdifficult to predict with accuracy changes in economic or market conditions and to anticipate the effects thatsuch changes could have on the Bank’s business, financial condition and results of operation.
The Bank may incur losses associated with its counterparty exposures.
The Bank faces the risk that counterparties will be unable to honor contractual obligations. These partiesmay default on their obligations to the Bank due to bankruptcy, lack of liquidity, operational failure or otherreasons. This risk may arise, for example, from entering into swaps or other derivative contracts underwhich counterparties have obligations to make payments to the Bank or in executing currency or othertrades that fail to settle at the required time due to non-delivery by the counterparty or systems failure byclearing agents, exchanges, clearinghouses or other financial intermediaries. Counterparty risk hasincreased especially in light of the recent credit crisis and global economic downturn.
The Bank has significant exposure to small- and medium-sized enterprises, and financial difficultiesexperienced by such enterprises may result in a deterioration of its asset quality.
One of the Bank’s core banking businesses has historically been and continues to be lending to small- andmedium-sized enterprises (as defined in “Business — Business Overview — The Bank’s PrincipalActivities — Corporate Banking Services — Small- and Medium-sized Enterprises Banking”). The Bank’sloans to such enterprises increased from W44,330 billion as of December 31, 2006, to W53,512 billion as ofDecember 31, 2007, W61,813 billion as of December 31, 2008 and W62,144 billion as of March 31, 2009,representing 38.8%, 42.0%, 41.8% and 43.4%, respectively, of its total loan portfolio as of such dates.
Compared to loans to large corporations, which tend to be better capitalized and able to weather businessdownturns with greater ease, or loans to individuals and households, which tend to be secured with homesand with respect to which the borrowers are therefore less willing to default, loans to small- and medium-sized enterprises have historically had a relatively higher delinquency ratio. Prior to the onset of the globalfinancial crisis, loans to such enterprises were the targets of aggressive lending by Korean banks, includingthe Bank, as part of their campaigns to increase their respective market shares. As of December 31, 2006,2007 and 2008 and March 31, 2009, the Bank’s delinquent loans to small- and medium-sized enterpriseswere W318 billion, W453 billion, W820 billion and W1,231 billion, respectively, representing delinquencyratios (net of charge-offs and loan sales) of 0.72%, 0.85%, 1.33% and 1.98%, respectively. If the currentbusiness downturn further deepens in terms of length and severity, the delinquency ratio for the Bank’sloans to small- and medium-sized enterprises is likely to rise significantly at least in the near future.
Of particular concern is the significant exposure that the Bank has to small- and medium-sized enterprisesin the real estate and leasing industry and the construction industry. As of March 31, 2009, the Bank’s loansto the real estate and leasing industry and the construction industry was W12,444 billion and W4,349billion, representing 8.68% and 3.04%, respectively, of its total loan portfolio as of such dates with adelinquency ratio (net of charge-offs and loan sales) of 1.50% and 3.88%, respectively. In comparison, as ofDecember 31, 2008, the Bank’s loans to the real estate and leasing industry and the construction industrywas W13,619 billion and W4,266 billion, representing 9.21% and 2.89%, respectively, of its total loanportfolio as of such dates with a delinquency ratio (net of charge-offs and loan sales) of 1.08% and 2.51%,respectively. The small- and medium-sized enterprises in the real estate development and constructionindustries are concentrated in the housing market, which has been particularly affected by declining assetprices as a result of the global credit crisis as well as sustained efforts by the Government to stemspeculation in the housing market. The Bank also has significant exposure to construction companies thathave built residential units in provinces outside the metropolitan Seoul area, which have experienced arelatively low rate of pre-sales, the proceeds from which the construction companies primarily rely on as asource for their liquidity and cash flow. In addition, the Bank also has significant exposure to theshipbuilding industry, which has also been disproportionately hurt by the recent economic downturnfollowing a particularly robust period, largely due to the rapid slowdown in world trade, which hassubstantially diminished shipbuilding orders.
14
The delinquency ratio for small- and medium-sized enterprises in the construction and shipbuildingindustries is also likely to increase significantly if a restructuring program for troubled companies in theseindustries is implemented as currently planned by the government. Specifically, in December 2008, theGovernment announced that it would promote swift restructuring of troubled companies in certain industriesthat have been disproportionately affected by the ongoing economic difficulties, such as construction andshipbuilding industries. These restructurings will be supervised primarily by the major commercial banksthat are creditor financial institutions of such companies, with the Government having an oversight role. InFebruary 2009, 12 construction companies and four shipbuilding companies became subject to workoutfollowing review by their creditor financial institutions and the Government, and the Bank was one of thecreditor financial institutions for 11 construction companies and four shipbuilding companies. The Bank hasestablished an allowance for the loans and off-balance sheet credit instruments for such companiesamounting to W129 billion and W28 billion, respectively, as of December 31, 2008 and W204 billion andW123 billion, respectively, as of March 31, 2009. However, there is no assurance that the Bank’sallowances for such companies will be sufficient to cover all future losses arising from its exposure to suchcompanies.
The Bank is taking active steps to curtail delinquency among its small- and medium-sized enterprisecustomers, including by way of strengthening loan application review processes and closely monitoringborrowers in troubled sectors. Despite such efforts, there is no assurance that the delinquency ratio for theBank’s loans to small- and medium-sized enterprises will not rise in the future. The current adverseeconomic developments, which may deepen in terms of length and severity, are likely to cause deteriorationin the liquidity and cash flow of these enterprises and result in higher delinquency and impairment of loans.Furthermore, adverse structural changes or macroeconomic trends in the Korean economy may further hurtthe ability of such enterprises to generate revenues or service debt. A significant rise in the delinquencyratios among these borrowers would have a material adverse effect on the Bank’s business, financialcondition and results of operation.
A decline in the value of the collateral securing the Bank’s loans or the Bank’s inability to fully realizethe collateral value may adversely affect the Bank’s credit portfolio.
Most of the Bank’s home and mortgage loans are secured by borrowers’ homes, other real estate, othersecurities and guarantees (which are principally provided by the Government and other financialinstitutions), and a substantial portion of the Bank’s corporate loans are also secured, including by realestate. The secured portion of the Bank’s loans amounted to W71,955 billion, or 60.1% of its total loans, asof December 31, 2008, and W72,484 billion, or 60.4% of its total loans, as of March 31, 2009. The Bankcannot assure that the collateral value may not materially decline in the future. The Bank’s general policyfor home and mortgage loans is to lend up to 50% to 70% of the appraised value of collateral (except in“highly speculated” areas designated by the government where the Bank is required to limit the Banklending to 40% of the appraised value of collateral) and to periodically re-appraise the collateral value.However, in light of the current downturn in the real estate market in Korea, the value of the collateral mayfall below the outstanding principal balance of the underlying loans. Declines in real estate prices reducethe value of the collateral securing the Bank’s mortgage and home equity loans, and such reduction in thevalue of collateral may result in the Bank’s inability to cover the uncollectible portion of its secured loans.A decline in the value of the real estate or other collateral securing the Bank’s loans, or its inability toobtain additional collateral in the event of such declines, may result in the deterioration of its asset qualityand require the Bank to take additional loan loss provisions. In Korea, foreclosure on collateral generallyrequires a written petition to a Korean court. Foreclosure procedures in Korea typically take from sevenmonths to one year from initiation to collection depending on the nature of the collateral, and foreclosureapplications may be subject to delays and administrative requirements, which may result in a decrease in therecovery value of such collateral. There can be no assurance that the Bank will be able to realize the fullvalue of collateral as a result of, among others, delays in foreclosure proceedings, defects in the perfectionof collateral and general declines in collateral value. The Bank’s failure to recover the expected value ofcollateral could expose it to significant losses.
Payment guarantees received in connection with the Bank’s real estate financing may not providesufficient coverage.
The Bank, alone or together with other financial institutions, provides financing to real estate developmentprojects, which are concentrated in the construction of residential and, to a lesser extent, commercial
15
complexes. Developers in Korea commonly use project financings to acquire land and related projectdevelopment costs. It is the market practice for general contractors to guarantee the loan raised by a specialpurpose financing vehicle established by the developers in order to procure the construction orders as thedevelopers tend to be small and highly leveraged. While the general contractors tend to be large and well-established construction companies, given the severe downturn in the real estate market and theconstruction industry in general, there is no guarantee that even such companies will have sufficientliquidity to back up their payment guarantees if the real estate development projects do not generatesufficient cash flow from pre-sales of the residential or commercial units. This is particularly the case fordevelopment projects outside the Seoul metropolitan area, where pre-sales have been disproportionatelylow. If defaults arise under the Bank loans to real estate development projects and payment guarantees arenot paid in sufficient amounts to cover the amount of the Bank financings, this may have a material adverseeffect on the Bank’s business, financial condition and results of operation.
A significant portion of the Bank’s credit exposure is concentrated in a relatively small number of largecorporate borrowers, and future financial difficulties experienced by them may have an adverse impacton the Bank.
Of the Bank’s 10 largest corporate exposures as of March 31, 2009, four were companies that are or weremembers of the main debtor groups identified by the Governor of the Financial Supervisory Service, whichare largely comprised of chaebols. As of such date, the total amount of the Bank’s exposures to the maindebtor groups was W20,805 billion, or 10.52%, of the Bank’s total exposure. As of that date, the Bank’ssingle largest corporate credit exposure was to the Hyundai Heavy Industry group, to which it hadoutstanding credit exposure of W4,868 billion, or 2.46% of the Bank’s total exposures. See “Description ofAssets and Liabilities — Loan Portfolio — Exposure to Main Debtor Groups”. If the credit quality of theBank’s exposures to the main debtor groups declines, the Bank may be required to record additional loanloss provisions in respect of loans and impairment losses in respect of securities, which would adverselyaffect its financial condition, results of operations and capital adequacy. The Bank cannot assure you thatthe allowances which it has established against these exposures will be sufficient to cover all future lossesarising from such exposures, especially in light of the current economic downturn. Specifically, starting inApril 2009, the major creditor financial institutions to large corporations with outstanding unsecured debt ofW50 billion conducted credit review on 433 such corporations under the supervision of the Government aspart of a campaign to promote swift restructuring in the Korean corporate sector, and on June 11, 2009, theFinancial Supervisory Service reportedly announced that, after the credit review, 22 and 11 of suchcorporations will become subject to workouts and liquidation, respectively. In addition, the creditorfinancial institutions also entered into agreements with nine main debtor groups, largely comprised ofchaebols, under which such groups will undertake plans to improve their financial conditions, includingthrough sale of subsidiaries. Detailed information regarding the exposure to the foregoing corporations andmain debtor groups is not publicly available. The Bank is one of the creditor financial institutions and hasexposure to a limited number of such corporations and main debtor groups. With respect to those companiesthat are in or in the future may enter into workout, restructuring or liquidation processes, the Bank may notbe able to make full recoveries against such companies. Bankruptcies or financial difficulties of largecorporations, including chaebol groups, may have the adverse ripple effect of triggering delinquencies andimpairment of the Bank’s loans to small- and medium-sized enterprises that supply parts or labor to suchcorporations. If the Bank experiences future losses from its exposures to large corporations, includingchaebol groups, it may have a material adverse impact on the Bank’s business, financial condition andresults of operation. See “Description of Assets and Liabilities — Loan Portfolio — Exposure to MainDebtor Groups”.
Any deterioration in the asset quality of the Bank’s guarantees and acceptances will likely have amaterial adverse effect on its financial condition and results of operations.
In the normal course of the Bank’s banking activities, it makes various commitments and incurs certaincontingent liabilities in the form of guarantees and acceptances. Certain guarantees issued or modified afterDecember 31, 2002, that are not derivative contracts have been recorded on the Bank’s non-consolidatedbalance sheet at their fair value at inception. Other guarantees are recorded as off-balance sheet items in thefootnotes to the Bank’s financial statements, and those guarantees on which it has confirmed to makepayments become acceptances, which are recorded on the balance sheet. As of December 31, 2008 andMarch 31, 2009, the Bank had aggregate guarantees and acceptances of W16,244 billion and W16,664billion, respectively, for which it provided allowances for losses of W114 billion and W212 billion,respectively.
16
Such guarantees and acceptances include refund guarantees provided by the Bank to shipbuildingcompanies, which involve guaranteeing payment of the initial cash payment (typically 25% of the contractamount for ship orders) received by shipbuilders in the event that such shipbuilders are unable to deliver theships in time or otherwise default under the shipbuilding contracts. Recently, small- and medium-sizedshipbuilding companies have faced increasing financial difficulties due to the global economic downturnand the slowdown in shipbuilding orders, which increases the risk that they may default on theirshipbuilding contracts and the Bank may have to make payments under the refund guarantees. The refundguarantees provided to small- and medium-sized shipbuilding companies by the Bank amounted toapproximately W1 trillion and W1.6 trillion as of December 31, 2008 and March 31, 2009, respectively. Ifthe Bank experiences significant asset quality deterioration with respect to its guarantees and acceptances,there is no assurance that its allowances will be sufficient to cover actual losses resulting in respect of theseliabilities, or that the losses that it incurs on guarantees and acceptances will not be larger than theoutstanding principal amount of the relevant loans.
The Bank may incur significant losses from its investments and, to a lesser extent, trading activities dueto market fluctuations.
The Bank enters into and maintains large investment positions in the fixed income markets, primarilythrough its treasury and investment business, as described in “Business — Business Overview — TheBank’s Principal Activities — Treasury and Securities Investment”. The Bank also maintains smallertrading positions, including securities and derivative financial instruments, as part of its banking operations.Taking these positions entails making assessments about financial market conditions and trends. Therevenues and profits that the Bank derives from many of these positions and related transactions aredependent on market prices, which are beyond the Bank’s control. When the Bank owns assets such as debtsecurities, a decline in market prices, as a result of fluctuating market interest rates, can expose it to losses.If market prices move in a way that the Bank has not anticipated, it may experience losses. Also, whenmarkets are volatile and subject to rapid changes in the price directions, the actual market prices may becontrary to the Bank’s assessments and lead to lower than anticipated revenues or profits, or even result inlosses, with respect to the related transactions and positions.
The Bank may incur losses from commission- and fee-based business.
The Bank provides trust account management services for its customers. Downturns in stock markets arelikely to lead to a decline in the volume of transactions that the Bank executes for its customers and,therefore, to a decline in its non-interest revenues. In addition, because the fees that the Bank charges formanaging its clients’ portfolios are in many cases based on the size of the assets under management, amarket downturn which has the effect of reducing the value of its clients’ portfolios or increasing theamount of withdrawals would reduce the revenues that the Bank receives from its trust accountmanagement. Even in the absence of a market downturn, below-market performance by the Bank’s trustaccount services may result in increased withdrawals and reduced inflows, which would reduce the revenuethat it receives from these businesses. In addition, protracted market movements resulting in declines ofasset prices can reduce liquidity for assets held by the Bank and lead to material losses if it cannot close outor otherwise dispose of deteriorating positions in a timely way or at commercially reasonable prices.
Damage to the Bank’s reputation could harm the Bank’s business.
The Bank is one of the largest and most influential commercial banks in Korea by virtue of its financialtrack records, market share and the size of its operations and customer base. The Bank’s reputation iscritical in maintaining its relationships with clients, investors, regulators and the general public. The Bank’sreputation can be damaged in numerous ways, including, among others, employee misconduct (includingembezzlement), litigation, compliance failures, failure to properly address potential conflicts of interest, theactivities of customers and counterparties over which the Bank has limited or no control, prolonged orexacting scrutiny from regulatory authorities and customers regarding its trade practices, or uncertaintyabout its financial soundness and reliability. If the Bank is unable to prevent or properly address theseconcerns, it could lose its existing or prospective customers and investors, which could adversely affect itsbusiness, financial condition and results of operation.
17
The Bank’s risk management policies and procedures may not be fully effective at all times.
In the course of the Bank’s operations, it must manage a number of risks, such as credit risks, market risksand operational risks. Although the Bank devotes significant resources to developing and improving its riskmanagement policies and procedures and expects to continue to do so in the future, its risk managementtechniques may not be fully effective at all times in mitigating risk exposures in all market environments oragainst all types of risk, including risks that are unidentified or unanticipated. For example, in January2009, the Bank reported to the Financial Supervisory Service that an employee at a regional branch of theBank had embezzled approximately W22 billion of the Bank’s funds. The Bank expects to recoverapproximately W5.7 billion of the embezzled funds. To date, the Bank is waiting for the FinancialSupervisory Service to issue a request for remedial measures. Management of credit, market and operationalrisk requires, among others, policies and procedures to record properly and verify a large number oftransactions and events, and the Bank cannot assure you that these policies and procedures will prove to befully effective at all times against all the risks that the Bank faces.
Legal claims and regulatory risks arise in the conduct of the Bank’s business.
In the ordinary course of the Bank’s business, it is subject to regulatory oversight and liability risk. TheBank is also involved in a variety of other claims, disputes, legal proceedings and governmentinvestigations in jurisdictions where it is active, including Korea. These types of proceedings expose theBank to substantial monetary damages and legal defense costs, injunctive relief, criminal and civil penaltiesand the potential for regulatory restrictions on its businesses. The outcome of these matters cannot bepredicted and they could adversely affect the Bank’s future business.
Recently, the Bank has become party to individual and collective lawsuits in connection with the sale offoreign currency derivatives products known as “KIKO”, which stands for “knock-in knock-out”, to certainof its customers comprised mostly of small- and medium-sized enterprises. The KIKOs, which are intendedto be hedging instruments, operate so that if the value of Korean Won increases to a certain level, then theBank is required to pay the purchasers a certain amount, and if the value of Korean Won falls below acertain level, then the purchasers of KIKOs are required to pay the Bank a certain amount. As the KoreanWon significantly depreciated against the U.S. dollar in the second half of 2008, purchasers of KIKOs wererequired under the relevant contracts to make large payments to the Bank, and some of such purchasershave filed lawsuits to nullify their obligations. The aggregate amount of such claims as of March 31, 2009was W11.8 billion, and this amount may become larger as the lawsuits progress. The amount of damages forwhich the Bank may be liable if it loses these lawsuits may increase if the Korean Won further depreciatesagainst the U.S. dollar. While the Bank has won a limited number of preliminary injunction cases at thelower court level, other cases are pending and additional cases may be filed against the Bank. Othercommercial banks facing similar claims have lost some of their cases. If the Bank loses, the court maynullify the contracts under which KIKO products were sold and order the Bank to return payments receivedfrom the customers. While the final outcome of such litigation is uncertain and the Bank plans to rigorouslydefend its position, the lawsuits, especially if the courts rule against the Bank, may have a material adverseeffect on its business, financial condition and results of operation.
In addition, due to the global economic slowdown and a deteriorating Korean stock market since the secondhalf of 2008, investment funds whose performance is tied to domestic and foreign stock markets haveexperienced a sharp fall in their rates of return. Consequently, investors in these funds have increasinglybrought lawsuits against commercial banks in Korea that have sold such investment fund products based onthe allegation that such banks used defective sales practices in selling such funds, such as failing to complywith disclosure requirements or unfairly inducing them to invest in the funds. There have been cases inwhich the courts required the banks to compensate their customers for inadequate disclosure and unfairinducement. The Bank cannot assure you that, despite due training, all of its employees in charge of suchsales have not breached disclosure requirements, engaged in unfair inducement or committed similar acts.As of March 31, 2009, there were 12 cases filed against the Bank, which claims amounted to W6.3 billionin the aggregate. The amount claimed may increase in the course of litigation and there may be otherlawsuits that may be brought against the Bank based on similar allegations. While it is difficult to predictthe outcome of each lawsuit against the Bank, as it will ultimately depend on the specific facts andcircumstances underlying such lawsuit, if the courts rule against the Bank, the lawsuits may have a materialadverse effect on its business, financial condition and results of operation.
18
Labor unrest may adversely affect the Bank’s operations.
Following the merger of Chohung Bank and former Shinhan Bank on April 3, 2006, the labor union of theChohung Bank and the labor union of former Shinhan Bank were integrated in January 2008. As ofMarch 31, 2009, 8,074 employees were members of the integrated union, and, to date, the Bank has notexperienced any significant difficulties in its relationships with the integrated union in connection with themerger.
Any significant labor unrest in the Korean financial industry or other sectors of the Korean economy couldadversely affect the Bank’s operations, as well as the operations of many of the Bank’s customers and theirability to repay their loans, and could affect the financial conditions of Korean companies in general, anddepress the prices of securities on the Korea Exchange, the value of unlisted securities and the value of theWon relative to other currencies. Such developments would likely have an adverse effect on the Bank’sbusiness, financial condition, results of operations and capital adequacy.
The Act Concerning Protection of Fixed Term or Part Time Employees may have an adverse effect on theBank’s operations.
The Act Concerning Protection of Fixed Term or Part Time Employees (the “Non-regular Employee Act”)became effective on July 1, 2007. Under the Non-regular Employee Act, fixed-term employees hired underfixed-term employment contracts must not be discriminated against by employers, compared to regularemployees performing the same or similar duties as those of the fixed-term employees in wages and otherlabor conditions, without justifiable grounds. The Non-regular Employee Act also provides that, if a fixed-term employee remains employed under a fixed-term employment contract for a period exceeding twoyears, the fixed-term employee will be deemed to be a regular employee and the employer will not be ableto terminate the employment of such fixed-term employee without justifiable grounds, even after theexpiration of the fixed-term employment contract, provided that this provision shall apply only to fixed-term employees to be hired under fixed-term employment contracts to be newly entered into or renewed orextended after the effective date of the Non-regular Employee Act. As of March 31, 2009, the Bank had15,996 employees, of which 4,964 were fixed-term employees. To the extent that the Bank must treat any ofthe temporary employees as permanent employees with respect to wages and other benefits, the Bank’sresults of operations could be negatively affected.
The Bank may incur significant costs in preparing for and complying with the new IFRS accountingstandards, and may not be able to fully comply with such standards within the prescribed timeline.
In March 2007, the Government announced that all companies listed on the Korea Exchange will berequired to comply with International Financial Reporting Standards (“IFRS”) by 2011. IFRS is thefinancial reporting standard adopted in more than 110 countries and has requirements that are substantiallydifferent from those under Korean GAAP or U.S. GAAP. A task force team has been established by theBank to assist preparation for IFRS compliance by Shinhan Financial Group. Such preparation, as well asactual compliance with IFRS, may result in significant costs for the Bank and may have a material adverseeffect on its results of operations. In addition, the Bank may not be able to comply with the IFRSrequirements within the prescribed timeline, and such non-compliance may result in regulatory sanctions aswell as harm to its reputation.
The Bank may experience disruptions, delays and other difficulties relating to its information technologysystems.
The Bank relies on its information technology systems for its daily operations including billing, effectingonline and offline financial transactions and record keeping. The Bank also upgrades from time to time itsgroup-wide customer data sharing and other customer relations management systems. The Bank mayexperience disruptions, delays or other difficulties relating to its information technology systems, and maynot integrate or upgrade its systems as currently planned. Any of these developments may have an adverseeffect on its business and adversely impact its customers’ confidence in it.
19
Risks Relating to Law, Regulation and Government Policy
The Bank is a heavily regulated entity and operates in a legal and regulatory environment that is subjectto change, and violations could result in penalties and other regulatory actions.
As a financial services provider, the Bank is subject to a number of regulations designed to maintain thesafety and soundness of Korea’s financial system, ensure the Bank’s compliance with economic and otherobligations and limit its risk exposure. These regulations may limit the Bank’s activities, and changes inthese regulations may increase its costs of doing business. Regulatory agencies frequently reviewregulations relating to the Bank’s business. The Bank expects the regulatory environment in which itoperates to continue to change. Changes to regulations applicable to the Bank and the Bank’s business orchanges in their implementation or interpretation could affect it in unpredictable ways and could adverselyaffect its business, results of operations and financial conditions.
In addition, a breach of regulations could expose the Bank to potential liabilities and sanctions. Forexample, if the Financial Services Commission deems the Bank’s financial condition to be unsound, or ifthe Bank fails to meet the applicable requisite capital ratio or the capital adequacy ratio set forth underKorean law, the Financial Services Commission may order, among others, capital increases or reductions,stock cancellations or consolidations, transfers of business, sales of assets, closures of branch offices,mergers with other financial institutions, or suspensions of a part or all of the Bank’s business operations. Ifany of such measures is imposed on the Bank by the Financial Services Commission as a result of unsoundfinancial condition or failure to comply with minimum capital adequacy requirements or for other reasons,such measures may have a material adverse effect on its business, financial condition and results ofoperation.
For further details on the principal laws and regulations applicable to the Bank, see “Supervision andRegulation”.
Increased government intervention in the economy and tighter regulation of the financial servicesindustry in Korea as a result of the ongoing global economic downturn could increase the Bank’s costsand result in lower profits.
In response to the ongoing turbulence in the financial markets and the impact on the overall economy, manygovernments worldwide, including the Government, have intervened on a massive scale, including by wayof fiscal stimulus, lowered interest rates and direct investment in troubled financial institutions andcorporations. The anticipated severity of the current economic crisis may lead the Government to take otherinterventionist measures, as a result of which the Bank may be requested to participate in providingassistance to support distressed companies that are not its subsidiaries. In addition, the Bank mayvoluntarily enter into arrangements with the government under which it accepts greater governmentintervention in its affairs in exchange for government assistance. For example, in November 2008, the Bankentered into a memorandum of understanding with the Government, under which the Bank may becomesubject to increased government monitoring of its operations and may be required to make certainadjustments to its operations if it receives government guarantees for a certain amount of its foreigncurrency-denominated borrowings. In April 2009, the term during which the Bank is entitled to governmentguarantees for its foreign currency-denominated debt was extended until December 2009. While the Bankdoes not currently anticipate that it will need such government guarantees, increased governmentinvolvement in its operations could adversely affect its business, financial condition and results ofoperation. In addition, in February 2009, in order to provide additional liquidity and capital support forcommercial banks in Korea, the Government announced a plan to establish a bank capital improvementfund in the amount of W20 trillion. The fund will be funded with loans from government-owned banks aswell as from outside investors. The commercial banks may draw down from the fund up to a limit specifiedfor each bank, in exchange for subordinated debt, preferred shares and/or hybrid securities to be issued tothe fund, which may have the effect of improving the drawing bank’s liquidity and capital adequacy. TheBank’s drawdown limit is expected to be W2 trillion, and on February 26, 2009, the Bank’s board ofdirectors decided to apply for the credit line with the fund. If the Bank draws down from the fund, it maybecome subject to increased government monitoring and certain conditions on the use of proceeds from the
20
drawdown, including increased lending to small- and medium-sized enterprises, which generally are facingincreasing difficulties due to the economic downturn. This may have a material adverse effect on the Bank’sbusiness, results of operation and financial condition.
The Government may encourage targeted lending to and investment in certain sectors in furtherance ofpolicy initiatives, and the Bank may take this factor into account.
The Government has encouraged and may in the future encourage lending to or investment in the securitiesof certain types of borrowers and other financial institutions in furtherance of government initiatives. TheGovernment, through its regulatory bodies such as the Financial Services Commission, has in the pastannounced lending policies to encourage Korean banks and financial institutions to lend to or invest inparticular industries or customer segments, and, in certain cases, has provided lower cost funding throughloans made by the Bank of Korea for further lending to specific customer segments. Recently, theGovernment’s emphasis has been to provide assistance to the small- and medium-sized enterprises, whichhave been disproportionately affected by the recent developments in the Korean and global economy. Whileall of the Bank’s loans or securities investments are reviewed in accordance with its credit review policiesor internal investment guidelines and regulations, the Bank, on a voluntary basis, may factor the existenceof such policies and encouragements into consideration in making loans or securities investments. Inaddition, while the ultimate decision whether to make loans or securities investments remains with the Bankand is made based on its credit approval procedures and its risk management system independently ofgovernment policies, the Government may in the future request financial institutions in Korea, including theBank, to make investments in or provide other forms of financial support to particular sectors of the Koreaneconomy as a matter of policy, which financial institutions, including the Bank, may decide to accept. Forexample, the Government has recently undertaken various initiatives to support small- and medium-sizedenterprises through the ongoing economic downturn. As part of such initiatives, the Bank, like othercommercial banks in Korea, has entered into a memorandum of understanding in April 2009 with theGovernment under which the Bank will make efforts, among others, to provide greater liquidity into thegeneral economy by extending a greater volume of loans to small- and medium-sized enterprises. The Bankmay incur costs or losses as a result of providing such financial support.
The level and scope of government oversight of the Bank’s lending business, particularly regarding homeequity and mortgage loans, may change depending on the economic or political climate.
Curtailing excessive speculation in the real estate market has historically been a key policy initiative for theGovernment, and it has in the past adopted several regulatory measures, including in relation to retailbanking, to effect such policy. Some of the measures undertaken in the past include requiring financialinstitutions to impose stricter debt-to-income ratio and loan-to-value ratio requirements for mortgage loansfor real property located in areas deemed to have engaged in high speculation, raising property taxes on realestate transactions for owners of multiple residential units, adopting a ceiling on the sale price of newlyconstructed housing units and recommending that commercial banks refrain from making further mortgageand home equity lending, among others.
In light of the deepening slump in the housing market, the Government has recently announced or startedimplementing various policies to support the economy, such as deregulating the real estate sector andlowering tax rates. However, if the housing market shows signs of recovery, the Government may from timeto time take measures to regulate such market in order to preempt undue speculation, including by way ofimposing restrictions on retail lending, including mortgage and home equity lending. Any such measuresmay be premature, result in unintended consequences or contribute to substantial future declines in realestate prices in Korea, which will reduce the value of the collateral securing the Bank’s mortgage and homeequity loans. See “— Risks Relating to the Bank’s Business — A decline in the value of the collateralsecuring the Bank’s loans and the Bank’s inability to fully realize the collateral value may adversely affectthe Bank’s credit portfolio”. Such measures may also have the effect of limiting the growth and profitabilityof the Bank’s retail banking business, especially in the area of mortgage and home equity lending.
21
The Bank is generally subject to Korean accounting and disclosure standards, which differ from thoseapplicable to banks in other countries.
Banks in Korea, including the Bank, are subject to Korean accounting standards and disclosurerequirements, which differ in significant respects from those applicable to banks in certain other countries,including the United States. In addition, the Bank’s financial statements are prepared in accordance withKorean GAAP, which differ in certain respects from U.S. GAAP and generally accepted accountingprinciples of other countries as applied to banks. The audited financial statements of the Bank set forth inthis offering circular were audited in accordance with auditing standards generally accepted in Korea, whichmay differ from procedures and practices generally utilized in the United States and other jurisdictions,which procedures and practices could produce different results. See “Summary of Certain Differencesbetween Korean GAAP and U.S. GAAP”.
You may not be able to enforce a judgment of a foreign court against the Bank.
The Bank is a corporation with limited liability organized under the laws of Korea. Substantially all of theBank’s directors and officers and other persons named in this offering circular reside in Korea, and all or asignificant portion of the assets of the Bank directors and officers and other persons named in this offeringcircular and substantially all of its assets are located in Korea. As a result, it may not be possible forinvestors to effect service of process within the United States, or to enforce against them or the Bank in theUnited States judgments obtained in United States courts based on the civil liability provisions of thefederal securities laws of the United States. There is doubt as to the enforceability in Korea, either inoriginal actions or in actions for enforcement of judgments of United States courts, of civil liabilitiespredicated on the United States federal securities laws.
Risks Relating to Korea
Unfavorable financial and economic conditions in Korea and globally may have a material adverseimpact on the Bank’s asset quality, liquidity and financial performance.
The Bank is incorporated in Korea, where most of its assets are located and most of its income is generated.As a result, the Bank is subject to political, economic, legal and regulatory risks specific to Korea, and itsbusiness, results of operation and financial condition are substantially dependent on developments relatingto the Korean economy. As Korea’s economy is highly dependent on the health and direction of the globaleconomy, and investors’ reactions to developments in one country can have adverse effects on the securitiesprices of companies in other countries, the Bank is also subject to global economic conditions. Factors thatdetermine economic and business cycles of the Korean or global economy are for the most part beyond theBank’s control and inherently uncertain. In addition to discussions of recent developments regarding theglobal economic and market uncertainties and the risks relating to the Bank as provided elsewhere in thissection, factors that could hurt Korea’s economy in the future include, among others:
Š the length and severity of the current global and economic downturn;
Š volatility in foreign currency reserve levels, commodity prices (including oil prices), exchange rates(particularly against the U.S. dollar), interest rates and stock markets;
Š increased reliance on exports to service foreign currency debts, which could cause friction withKorea’s trading partners;
Š adverse developments in the economies of countries to which Korea exports goods and services (suchas the United States, China and Japan), or in emerging market economies in Asia or elsewhere thatcould result in a loss of confidence in the Korean economy;
Š the continued emergence of China, to the extent that its benefits (such as increased exports to China)are outweighed by its costs (such as competition in export markets or for foreign investment andrelocation of the manufacturing base from Korea to China);
22
Š social and labor unrest or declining consumer confidence or spending resulting from layoffs,increasing unemployment and lower levels of income;
Š uncertainty and volatility in real estate prices arising, in part, from the Government’s policy-driventax and other regulatory measures;
Š a decrease in tax revenues and a substantial increase in the Government’s expenditures forunemployment compensation and other social programs that together could lead to an increasedgovernment budget deficit;
Š political uncertainty or increasing strife among or within political parties in Korea, including as aresult of the increasing polarization of the positions of the ruling conservative party and theprogressive opposition; and
Š a deterioration in economic or diplomatic relations between Korea and its trading partners or allies,including such deterioration resulting from trade disputes or disagreements in foreign policy.
Any future deterioration of the Korean economy could have an adverse effect on the Bank’s business,financial condition and results of operation.
Tensions with North Korea could have an adverse effect on the Bank.
Relations between Korea and North Korea have been tense throughout Korea’s modern history. The level oftension between the two Koreas has fluctuated and may increase abruptly as a result of current and futureevents. In recent years, there have been heightened security concerns stemming from North Korea’s nuclearweapons and long-range missile programs and uncertainty regarding North Korea’s actions and possibleresponses from the international community. In April 2009, after launching a long-range rocket over thePacific Ocean, which led to protests from the international community, North Korea announced that itwould permanently withdraw from the six-party talks that began in 2003 to discuss Pyongyang’s path todenuclearization. On May 25, 2009, North Korea conducted its second nuclear testing by launching severalshort-range missiles. In response to such actions, the Republic decided to join the Proliferation SecurityInitiative, an international campaign aimed at stopping the trafficking of weapons of mass destruction, overPyongyang’s harsh rebuke and threat of war. After the United Nations Security Council passed on June 12,2009, a resolution to condemn North Korea’s second nuclear test and impose tougher sanctions such as amandatory ban on arms exports, North Korea announced that it would produce nuclear weapons and take“resolute military actions” against the international community.
There recently has been increased uncertainty about the future of North Korea’s political leadership and itsimplications for the economic and political stability of the region. In June 2009, American and SouthKorean officials announced that Kim Jong-il, the North Korean ruler who reportedly suffered a stroke inAugust 2008, designated his third son, who is reportedly in his twenties, to become his successor. Thesuccession plan, however, remains uncertain. In addition, North Korea’s economy faces severe challenges.
There can be no assurance that the level of tension and instability in the Korean peninsula will not escalatein the future, or that the political regime in North Korea may not suddenly collapse. The Bank currently isnot engaged in any business activities in North Korea. However, any further increase in tension oruncertainty relating to the military or economic stability in the Korean peninsula, including a breakdown ofdiplomatic negotiations over the North Korean nuclear program, the occurrence of military hostilities orheightened concerns about the stability of North Korea’s political leadership, could have a material adverseeffect on the Bank’s business, financial condition and results of operation.
Risks Relating to the Notes
The Notes are unsecured obligations.
Because the Notes are unsecured obligations, their repayment may be compromised if:
Š the Bank enters into bankruptcy, liquidation, rehabilitation or other winding-up proceedings;
23
Š there is a default in payment under the Bank’s future secured indebtedness or other unsecuredindebtedness; or
Š there is an acceleration of any of the Bank’s indebtedness.
If any of these events occurs, the Bank’s assets may not be sufficient to pay amounts due on any of theNotes.
The Notes are not protected by restrictive covenants.
The Notes and the Fiscal Agency Agreement do not contain various restrictive financial, operating or othercovenants or restrictions, including those on change of control, the payment of dividends, the incurrence ofindebtedness or the issuance or repurchase of securities by the Bank, except as provided in the FiscalAgency Agreement. See “Description of the Notes”.
The Notes are subject to transfer restrictions.
The Notes will not be registered under the Securities Act or any state securities laws and may not be offeredor sold within the United States, except to QIBs in reliance on the exemption provided by Rule 144A, tocertain persons in offshore transactions in reliance on Regulation S, or pursuant to another exemption from,or in another transaction not subject to, the registration requirements of the Securities Act and in accordancewith applicable state securities laws. In addition, subject to the conditions set forth herein and the FiscalAgency Agreement, Notes may be transferred only if the principal amount of Notes transferred is at leastUS$100,000. For a further discussion of the transfer restrictions applicable to the Notes, see “Notice toInvestors”.
The Notes may have limited liquidity.
The Notes constitute a new issue of securities for which there is no existing market. Application has beenmade to list the Notes on the Singapore Stock Exchange. The offer and sale of the Notes is not conditionedon obtaining a listing of the Notes on the Singapore Stock Exchange or any other exchange. Although theInitial Purchasers have advised the Bank that they currently intend to make a market in the Notes, they arenot obligated to do so, and any market-making activity with respect to the Notes, if commenced, may bediscontinued at any time without notice in their sole discretion. For a further discussion of the InitialPurchasers’ planned market-making activities, see “Plan of Distribution”.
No assurance can be given as to the liquidity of, or the development and continuation of an active tradingmarket for, the Notes. If an active trading market for the Notes does not develop or is not maintained, themarket price and liquidity of the Notes may be adversely affected. If such a market were to develop, theNotes could trade at prices that may be higher or lower than the price at which the Notes are issueddepending on many factors, including:
Š prevailing interest rates;
Š the Bank’s results of operations and financial condition;
Š political and economic developments in and affecting Korea;
Š the market conditions for similar securities; and
Š the financial condition and stability of the Korean financial sector.
24

USE OF PROCEEDS
The aggregate net proceeds from the offering of the Notes are expected to be approximatelyUS$496 million, after deducting underwriting commissions and certain out-of-pocket expenses relating tothe offering. The net proceeds from the offering will be used for repayment of existing debt and othergeneral corporate purposes.
25
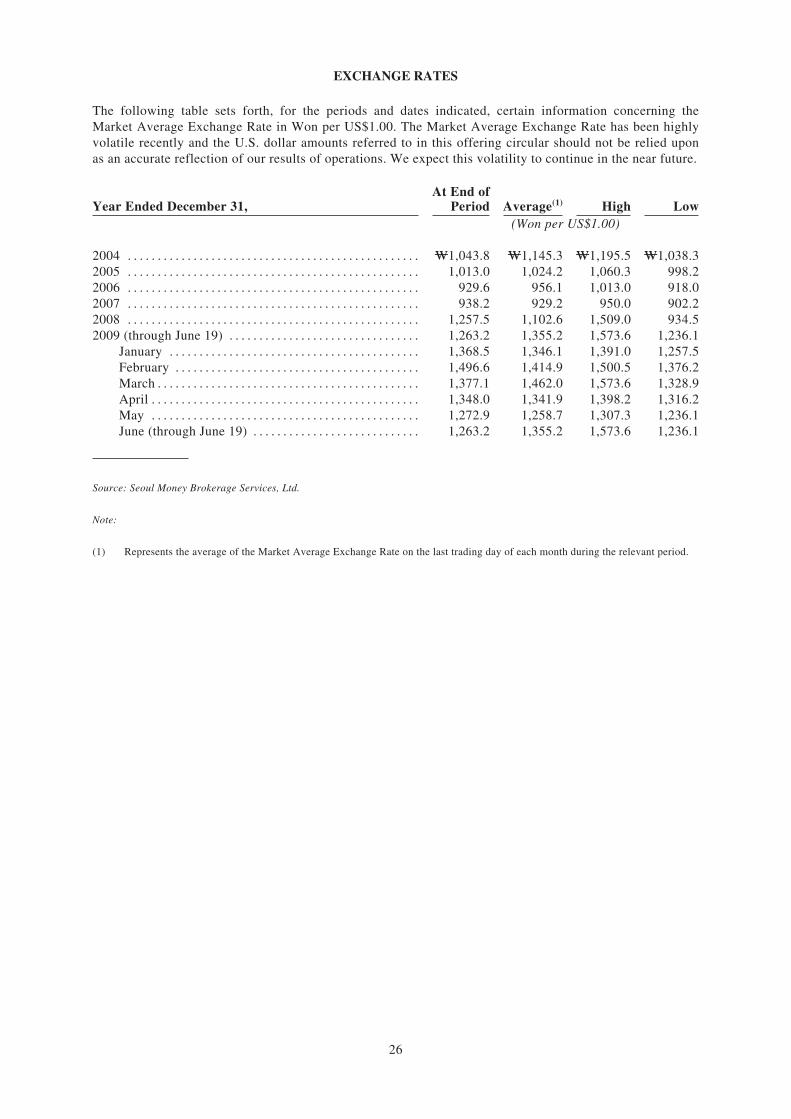
EXCHANGE RATES
The following table sets forth, for the periods and dates indicated, certain information concerning theMarket Average Exchange Rate in Won per US$1.00. The Market Average Exchange Rate has been highlyvolatile recently and the U.S. dollar amounts referred to in this offering circular should not be relied uponas an accurate reflection of our results of operations. We expect this volatility to continue in the near future.
Year Ended December 31,At End of
Period Average(1) High Low(Won per US$1.00)
2004 . . . . . . . . . . . . . . . . . . . . . . . . . . . . . . . . . . . . . . . . . . . . . . . . . W1,043.8 W1,145.3 W1,195.5 W1,038.32005 . . . . . . . . . . . . . . . . . . . . . . . . . . . . . . . . . . . . . . . . . . . . . . . . . 1,013.0 1,024.2 1,060.3 998.22006 . . . . . . . . . . . . . . . . . . . . . . . . . . . . . . . . . . . . . . . . . . . . . . . . . 929.6 956.1 1,013.0 918.02007 . . . . . . . . . . . . . . . . . . . . . . . . . . . . . . . . . . . . . . . . . . . . . . . . . 938.2 929.2 950.0 902.22008 . . . . . . . . . . . . . . . . . . . . . . . . . . . . . . . . . . . . . . . . . . . . . . . . . 1,257.5 1,102.6 1,509.0 934.52009 (through June 19) . . . . . . . . . . . . . . . . . . . . . . . . . . . . . . . . 1,263.2 1,355.2 1,573.6 1,236.1
January . . . . . . . . . . . . . . . . . . . . . . . . . . . . . . . . . . . . . . . . . . 1,368.5 1,346.1 1,391.0 1,257.5February . . . . . . . . . . . . . . . . . . . . . . . . . . . . . . . . . . . . . . . . . 1,496.6 1,414.9 1,500.5 1,376.2March . . . . . . . . . . . . . . . . . . . . . . . . . . . . . . . . . . . . . . . . . . . . 1,377.1 1,462.0 1,573.6 1,328.9April . . . . . . . . . . . . . . . . . . . . . . . . . . . . . . . . . . . . . . . . . . . . . 1,348.0 1,341.9 1,398.2 1,316.2May . . . . . . . . . . . . . . . . . . . . . . . . . . . . . . . . . . . . . . . . . . . . . 1,272.9 1,258.7 1,307.3 1,236.1June (through June 19) . . . . . . . . . . . . . . . . . . . . . . . . . . . . 1,263.2 1,355.2 1,573.6 1,236.1
Source: Seoul Money Brokerage Services, Ltd.
Note:
(1) Represents the average of the Market Average Exchange Rate on the last trading day of each month during the relevant period.
26
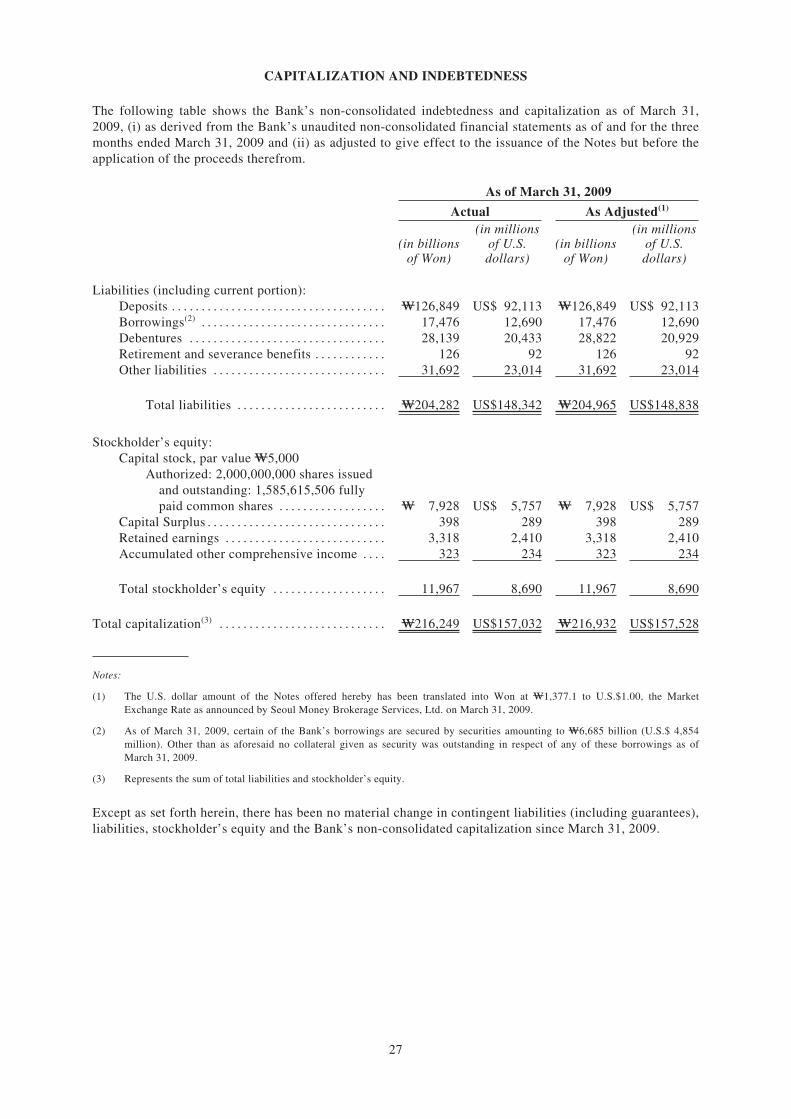
CAPITALIZATION AND INDEBTEDNESS
The following table shows the Bank’s non-consolidated indebtedness and capitalization as of March 31,2009, (i) as derived from the Bank’s unaudited non-consolidated financial statements as of and for the threemonths ended March 31, 2009 and (ii) as adjusted to give effect to the issuance of the Notes but before theapplication of the proceeds therefrom.
As of March 31, 2009
Actual As Adjusted(1)
(in billionsof Won)
(in millionsof U.S.dollars)
(in billionsof Won)
(in millionsof U.S.dollars)
Liabilities (including current portion):Deposits . . . . . . . . . . . . . . . . . . . . . . . . . . . . . . . . . . . . W126,849 US$ 92,113 W126,849 US$ 92,113Borrowings(2) . . . . . . . . . . . . . . . . . . . . . . . . . . . . . . . 17,476 12,690 17,476 12,690Debentures . . . . . . . . . . . . . . . . . . . . . . . . . . . . . . . . . 28,139 20,433 28,822 20,929Retirement and severance benefits . . . . . . . . . . . . 126 92 126 92Other liabilities . . . . . . . . . . . . . . . . . . . . . . . . . . . . . 31,692 23,014 31,692 23,014
Total liabilities . . . . . . . . . . . . . . . . . . . . . . . . . W204,282 US$148,342 W204,965 US$148,838
Stockholder’s equity:Capital stock, par value W5,000
Authorized: 2,000,000,000 shares issuedand outstanding: 1,585,615,506 fullypaid common shares . . . . . . . . . . . . . . . . . . W 7,928 US$ 5,757 W 7,928 US$ 5,757
Capital Surplus . . . . . . . . . . . . . . . . . . . . . . . . . . . . . . 398 289 398 289Retained earnings . . . . . . . . . . . . . . . . . . . . . . . . . . . 3,318 2,410 3,318 2,410Accumulated other comprehensive income . . . . 323 234 323 234
Total stockholder’s equity . . . . . . . . . . . . . . . . . . . 11,967 8,690 11,967 8,690
Total capitalization(3) . . . . . . . . . . . . . . . . . . . . . . . . . . . . W216,249 US$157,032 W216,932 US$157,528
Notes:
(1) The U.S. dollar amount of the Notes offered hereby has been translated into Won at W1,377.1 to U.S.$1.00, the MarketExchange Rate as announced by Seoul Money Brokerage Services, Ltd. on March 31, 2009.
(2) As of March 31, 2009, certain of the Bank’s borrowings are secured by securities amounting to W6,685 billion (U.S.$ 4,854million). Other than as aforesaid no collateral given as security was outstanding in respect of any of these borrowings as ofMarch 31, 2009.
(3) Represents the sum of total liabilities and stockholder’s equity.
Except as set forth herein, there has been no material change in contingent liabilities (including guarantees),liabilities, stockholder’s equity and the Bank’s non-consolidated capitalization since March 31, 2009.
27
SELECTED FINANCIAL INFORMATION
The following tables set forth selected non-consolidated income statement and balance sheet data withrespect to the Bank as of and for the years ended December 31, 2006, 2007 and 2008, which have beenderived from the Bank’s audited non-consolidated financial statements as of such dates and for suchperiods, and as of March 31, 2009 and for the three months ended March 31, 2008 and 2009, which havebeen derived from the Bank’s unaudited non-consolidated interim financial statements as of such date andfor such periods.
The non-consolidated financial statements exclude the accounts of all of the Bank’s subsidiaries (exceptthat the value of the Bank’s equity investments in their respective consolidated subsidiaries is included) andtheir respective trust account management business. The non-consolidated financial statements have beenprepared in accordance with Korean GAAP and, where applicable, the Korean Bank Accounting Guidelines,which differ in certain material respects from U.S. GAAP, and have not been intended to present thefinancial position, results of operations, cash flows and changes in equity in accordance with generallyaccepted accounting policies and practices in countries and jurisdictions other than Korea. For a discussionof certain differences between Korean GAAP and U.S. GAAP, see “Summary of Certain Differencesbetween Korean GAAP and U.S. GAAP” in this offering circular.
Certain financial information contained in “Business” and “Description of Assets and Liabilities of theBank” was not derived directly from the Bank’s unaudited non-consolidated interim financial statements asof March 31, 2009 and for the three months ended March 31, 2008 and 2009 or from the Bank’s auditednon-consolidated financial statements as of and for the years ended December 31, 2006, 2007 and 2008 butwas derived from certain accounting records that are subject to the internal control over financial reportingof the Bank.
On August 19, 2003, Shinhan Financial Group acquired 80.04% of Chohung Bank’s common shares.Subsequently, Shinhan Financial Group acquired additional common shares of Chohung Bank, and as ofJune 2004, acquired all remaining common shares of Chohung Bank. As of April 3, 2006, Shinhan FinancialGroup merged former Shinhan Bank into Chohung Bank, with the latter being the surviving legal entity, andsplit-merged the credit card business of Chohung Bank into Shinhan Card, a subsidiary of ShinhanFinancial Group. On the same date, the surviving entity from the merger of former Shinhan Bank andChohung Bank changed its name to Shinhan Bank. Accordingly, unless otherwise stated, the financial andstatistical information of the Bank for the year ended December 31, 2006 contained in this offering circulardoes not include information for former Shinhan Bank prior to the merger on April 3, 2006.
28
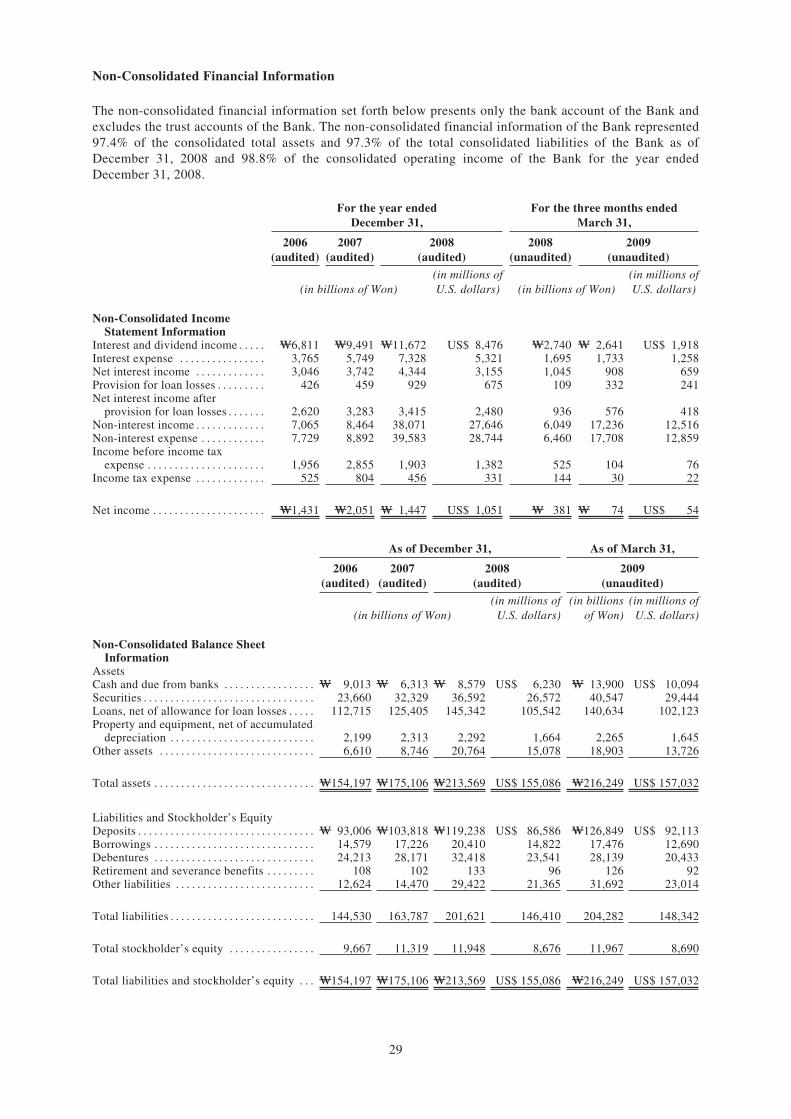
Non-Consolidated Financial Information
The non-consolidated financial information set forth below presents only the bank account of the Bank andexcludes the trust accounts of the Bank. The non-consolidated financial information of the Bank represented97.4% of the consolidated total assets and 97.3% of the total consolidated liabilities of the Bank as ofDecember 31, 2008 and 98.8% of the consolidated operating income of the Bank for the year endedDecember 31, 2008.
For the year endedDecember 31,
For the three months endedMarch 31,
2006(audited)
2007(audited)
2008(audited)
2008(unaudited)
2009(unaudited)
(in billions of Won)(in millions ofU.S. dollars) (in billions of Won)
(in millions ofU.S. dollars)
Non-Consolidated IncomeStatement Information
Interest and dividend income . . . . . W6,811 W9,491 W11,672 US$ 8,476 W2,740 W 2,641 US$ 1,918Interest expense . . . . . . . . . . . . . . . . 3,765 5,749 7,328 5,321 1,695 1,733 1,258Net interest income . . . . . . . . . . . . . 3,046 3,742 4,344 3,155 1,045 908 659Provision for loan losses . . . . . . . . . 426 459 929 675 109 332 241Net interest income after
provision for loan losses . . . . . . . 2,620 3,283 3,415 2,480 936 576 418Non-interest income . . . . . . . . . . . . . 7,065 8,464 38,071 27,646 6,049 17,236 12,516Non-interest expense . . . . . . . . . . . . 7,729 8,892 39,583 28,744 6,460 17,708 12,859Income before income tax
expense . . . . . . . . . . . . . . . . . . . . . . 1,956 2,855 1,903 1,382 525 104 76Income tax expense . . . . . . . . . . . . . 525 804 456 331 144 30 22
Net income . . . . . . . . . . . . . . . . . . . . . W1,431 W2,051 W 1,447 US$ 1,051 W 381 W 74 US$ 54
As of December 31, As of March 31,
2006(audited)
2007(audited)
2008(audited)
2009(unaudited)
(in billions of Won)(in millions of
U.S. dollars)(in billions
of Won)(in millions of
U.S. dollars)
Non-Consolidated Balance SheetInformation
AssetsCash and due from banks . . . . . . . . . . . . . . . . . W 9,013 W 6,313 W 8,579 US$ 6,230 W 13,900 US$ 10,094Securities . . . . . . . . . . . . . . . . . . . . . . . . . . . . . . . . 23,660 32,329 36,592 26,572 40,547 29,444Loans, net of allowance for loan losses . . . . . 112,715 125,405 145,342 105,542 140,634 102,123Property and equipment, net of accumulated
depreciation . . . . . . . . . . . . . . . . . . . . . . . . . . . 2,199 2,313 2,292 1,664 2,265 1,645Other assets . . . . . . . . . . . . . . . . . . . . . . . . . . . . . 6,610 8,746 20,764 15,078 18,903 13,726
Total assets . . . . . . . . . . . . . . . . . . . . . . . . . . . . . . W154,197 W175,106 W213,569 US$ 155,086 W216,249 US$ 157,032
Liabilities and Stockholder’s EquityDeposits . . . . . . . . . . . . . . . . . . . . . . . . . . . . . . . . . W 93,006 W103,818 W119,238 US$ 86,586 W126,849 US$ 92,113Borrowings . . . . . . . . . . . . . . . . . . . . . . . . . . . . . . 14,579 17,226 20,410 14,822 17,476 12,690Debentures . . . . . . . . . . . . . . . . . . . . . . . . . . . . . . 24,213 28,171 32,418 23,541 28,139 20,433Retirement and severance benefits . . . . . . . . . 108 102 133 96 126 92Other liabilities . . . . . . . . . . . . . . . . . . . . . . . . . . 12,624 14,470 29,422 21,365 31,692 23,014
Total liabilities . . . . . . . . . . . . . . . . . . . . . . . . . . . 144,530 163,787 201,621 146,410 204,282 148,342
Total stockholder’s equity . . . . . . . . . . . . . . . . 9,667 11,319 11,948 8,676 11,967 8,690
Total liabilities and stockholder’s equity . . . W154,197 W175,106 W213,569 US$ 155,086 W216,249 US$ 157,032
29
UNAUDITED NON-CONSOLIDATED PRO FORMA INCOME STATEMENT
On August 19, 2003, Shinhan Financial Group acquired 80.04% of Chohung Bank’s common shares.Subsequently, Shinhan Financial Group acquired additional common shares of Chohung Bank, and in June2004 acquired all remaining common shares of Chohung Bank. Effective April 3, 2006, former ShinhanBank merged into Chohung Bank, with the latter being the surviving legal entity, and split-merged thecredit card business of Chohung Bank into Shinhan Card, a subsidiary of Shinhan Financial Group. On thesame date, the surviving entity from the merger of former Shinhan Bank and Chohung Bank changed itsname to Shinhan Bank. Accordingly, unless otherwise stated, the financial and statistical information of theBank for the year ended December 31, 2006 contained in this offering circular does not include informationfor former Shinhan Bank prior to the merger on April 3, 2006.
The following unaudited and unreviewed non-consolidated pro forma statement of income for the yearended December 31, 2006 has been derived from the audited non-consolidated statement of income of theBank for such year and the unaudited non-consolidated statement of income of former Shinhan Bank for thethree months ended March 31, 2006. The basis of preparation of and the assumptions applied in calculatingthe adjustments to the unaudited and unreviewed non-consolidated pro forma financial information aredescribed below in the notes thereto.
Investors are cautioned that the unaudited and unreviewed non-consolidated pro forma statement of incomefor the year ended December 31, 2006 represents a summation (subject to certain adjustments as notedbelow) of the audited non-consolidated statement of income of the Bank for such year and the unaudited butreviewed non-consolidated statement of income of former Shinhan Bank for the three months endedMarch 31, 2006. The unaudited and unreviewed non-consolidated pro forma statement of income has beenprepared to illustrate what non-consolidated results of the operation of the Bank might have been if themerger described above had occurred on January 1, 2006. However, the unaudited and unreviewednon-consolidated pro forma financial information is for illustrative purposes only and not necessarilyindicative of the non-consolidated results of operation that would have been attained if the transactions hadactually occurred on that date, or of any future operating results. In addition, the audited non-consolidatedstatement of income of the Bank for the year ended December 31, 2006 includes the credit card operationsof Chohung Bank (which operations were split off on April 3, 2006 concurrently with the merger of formerShinhan Bank into Chohung Bank). Accordingly, exclusion of the operating results of the credit cardoperations of Chohung Bank for the three months ended March 31, 2006 from the Bank’s auditednon-consolidated statement of income for the year ended December 31, 2006 could affect the analysis of theoperating results of the Bank that would have been attained if the merger of former Shinhan Bank intoChohung Bank had actually occurred on January 1, 2006. The summation of the aforementioned statementsof income should not be relied upon for the purpose of making any decision to invest in the Notes.
30
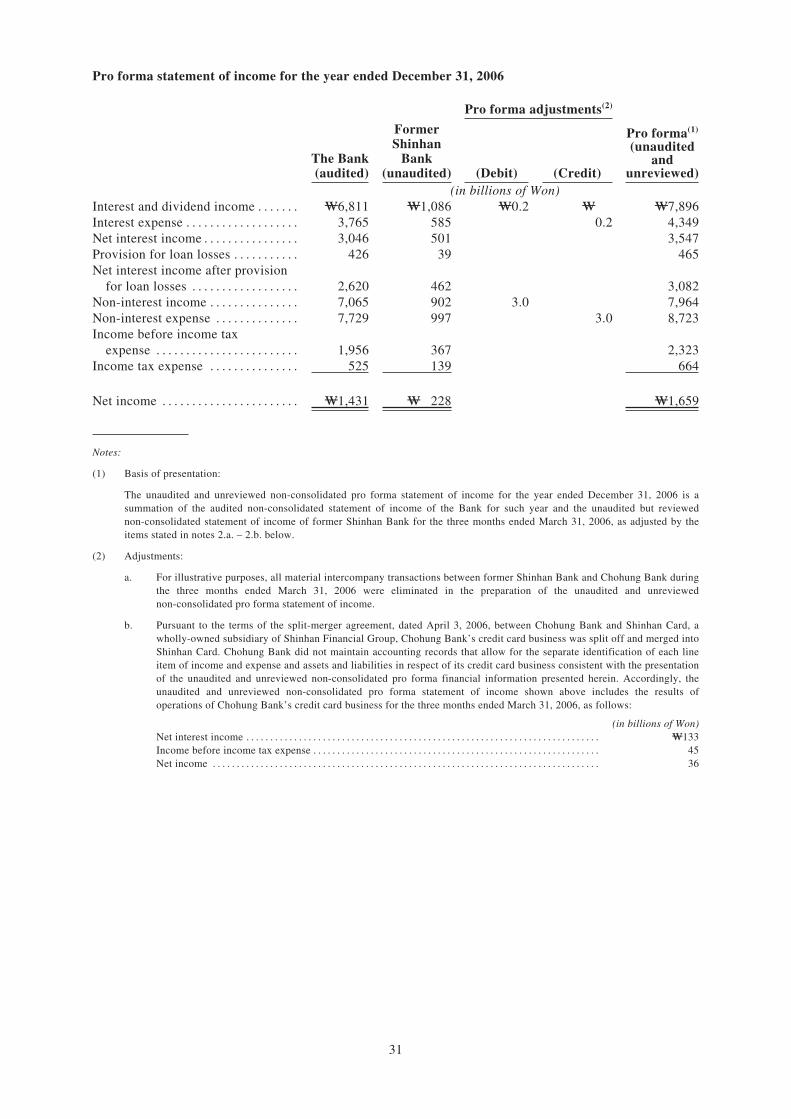
Pro forma statement of income for the year ended December 31, 2006
Pro forma adjustments(2)
The Bank(audited)
FormerShinhan
Bank(unaudited) (Debit) (Credit)
Pro forma(1)
(unauditedand
unreviewed)(in billions of Won)
Interest and dividend income . . . . . . . W6,811 W1,086 W0.2 W W7,896Interest expense . . . . . . . . . . . . . . . . . . . 3,765 585 0.2 4,349Net interest income . . . . . . . . . . . . . . . . 3,046 501 3,547Provision for loan losses . . . . . . . . . . . 426 39 465Net interest income after provision
for loan losses . . . . . . . . . . . . . . . . . . 2,620 462 3,082Non-interest income . . . . . . . . . . . . . . . 7,065 902 3.0 7,964Non-interest expense . . . . . . . . . . . . . . 7,729 997 3.0 8,723Income before income tax
expense . . . . . . . . . . . . . . . . . . . . . . . . 1,956 367 2,323Income tax expense . . . . . . . . . . . . . . . 525 139 664
Net income . . . . . . . . . . . . . . . . . . . . . . . W1,431 W 228 W1,659
Notes:
(1) Basis of presentation:
The unaudited and unreviewed non-consolidated pro forma statement of income for the year ended December 31, 2006 is asummation of the audited non-consolidated statement of income of the Bank for such year and the unaudited but reviewednon-consolidated statement of income of former Shinhan Bank for the three months ended March 31, 2006, as adjusted by theitems stated in notes 2.a. – 2.b. below.
(2) Adjustments:
a. For illustrative purposes, all material intercompany transactions between former Shinhan Bank and Chohung Bank duringthe three months ended March 31, 2006 were eliminated in the preparation of the unaudited and unreviewednon-consolidated pro forma statement of income.
b. Pursuant to the terms of the split-merger agreement, dated April 3, 2006, between Chohung Bank and Shinhan Card, awholly-owned subsidiary of Shinhan Financial Group, Chohung Bank’s credit card business was split off and merged intoShinhan Card. Chohung Bank did not maintain accounting records that allow for the separate identification of each lineitem of income and expense and assets and liabilities in respect of its credit card business consistent with the presentationof the unaudited and unreviewed non-consolidated pro forma financial information presented herein. Accordingly, theunaudited and unreviewed non-consolidated pro forma statement of income shown above includes the results ofoperations of Chohung Bank’s credit card business for the three months ended March 31, 2006, as follows:
(in billions of Won)Net interest income . . . . . . . . . . . . . . . . . . . . . . . . . . . . . . . . . . . . . . . . . . . . . . . . . . . . . . . . . . . . . . . . . . . . . . . . . . W133Income before income tax expense . . . . . . . . . . . . . . . . . . . . . . . . . . . . . . . . . . . . . . . . . . . . . . . . . . . . . . . . . . . . 45Net income . . . . . . . . . . . . . . . . . . . . . . . . . . . . . . . . . . . . . . . . . . . . . . . . . . . . . . . . . . . . . . . . . . . . . . . . . . . . . . . . . 36
31
MANAGEMENT’S DISCUSSION ANDANALYSIS OF FINANCIAL CONDITION AND RESULTS OF OPERATION
The following discussion and analysis should be read in conjunction with, and is qualified in its entirety byreference to, the Bank’s non-consolidated financial statements and the notes thereto included elsewhere inthis offering circular. This financial information has been prepared in accordance with Korean GAAP,which differs in certain respects from U.S. GAAP. See “Summary of Certain Differences Between KoreanGAAP and U.S. GAAP”. The discussion contains forward-looking statements and reflects the Bank’scurrent view with respect to future events and financial performance. Actual results may differ materiallyfrom those anticipated in these forward-looking statements as a result of certain factors such as those setforth under “Risk Factors” and elsewhere in this offering circular.
Overview
Since July 2007, adverse developments in the U.S. sub-prime mortgage sector have created significantdisruption and volatility in the financial markets globally. The ensuing contraction of liquidity and creditand deteriorations in asset values have had contagion effects on the overall economy. Starting in the secondhalf of 2008, the world’s largest economies, including the United States, Europe and Japan, are widelyconsidered to be in the midst of economic recessions, and export-driven emerging economies such as Chinaand Korea have also suffered a substantially slower rate of growth. The weakening economy may createfurther shocks to the global financial markets, which in turn could cause a further downward spiral in globaleconomic and financial conditions.
In Korea, where most of the Bank’s assets are located and where it generates most of its income, there aresigns that due to the recent difficulties in the global economic and financial conditions, key macro- andmicroeconomic indicators such as exports, personal expenditures and consumption, demand for businessproducts and services, debt service burden of households and businesses, the general availability of creditand the asset value of real estate and securities may further deteriorate. Any or a combination of theforegoing factors may result in an increase in non-performing loans and otherwise worsen the asset qualityof the Bank’s loans, which would lead to increases in provisions for loan losses. For instance, an increase inbankruptcies, or a worsening cash flow situation, among the Bank’s corporate customers, particularly thesmall- and medium-sized enterprises, which represent a substantial number of the Bank’s customers, maylead to an increase in defaults under the Bank’s loans. In addition, as a significant portion of the Bank’sloan portfolio is secured by homes and other real estate, a downturn in the real estate market may cause aportion of its loans to exceed the value of the underlying collateral; and any decline in the value of thecollateral securing its loans, and the inability to obtain additional collateral or inability to realize the valueof the collateral may require the Bank to increase credit loss allowances.
The disruptions and volatility in the global and Korean financial markets and economy may adversely affectthe Bank’s business and results of operation in other ways. Specifically, the availability of credit maybecome limited, causing some of the Bank’s counterparties to default. Moreover, the negative developmentsin the global credit markets may cause significant fluctuations in stock markets globally and foreigncurrency exchange rates, which in turn may affect the Bank’s results of operation. If credit marketconditions continue to deteriorate, the Bank’s capital funding structure may need to be adjusted, its fundingcosts may increase, its credit rating may be downgraded, or its credit-related losses may increase, all ofwhich could have a material adverse effect on the Bank’s results of operation, financial condition, cashflows and capital adequacy.
In particular, in recent years, commercial banks in Korea, including the Bank, have significantly expandedlending in the areas of home and mortgage loans to individuals and loans to small- and medium-enterprises.The global economic and financial crisis has significantly increased the credit risk of such loans, whichhave represented the Bank’s core lending activities, as well as the market risks of its new product offeringssuch as structured derivative products. The global crisis has also increased the funding costs of foreign-denominated as well as Won-denominated borrowings, and has significantly affected liquidity in general,notwithstanding the active liquidity support provided by the Bank of Korea. The Bank’s deposit productsincreased in volume in the second half of 2008 due to the downturn in the Korean stock market, but areduction in market interest rates may negatively impact the popularity of its deposit products compared to
32
other investment alternatives. The Bank’s results of operation is expected to, at least in the short term,depend primarily on the strength of risk management, improvement of funding and the net interest marginand cost reduction, rather than the pricing and volume competition among the commercial banks as was thecase in the recent past.
Overall, the Bank faces an increasingly difficult environment due to the ongoing difficulties in the globaland Korean economy and financial markets, and it will continue to focus on risk management, synergycreation and cost cutting to withstand the related challenges.
Outlook
In light of the deepening economic downturn in Korea and globally, the Bank anticipates that the assetquality of its loans may significantly deteriorate in 2009 compared to 2008, accompanied by increases indelinquencies, non-performing loans and substandard or below credit relative to its total loans and creditand provision for loan losses. The Bank anticipates that its total loans and credits will not increasesignificantly and may even decrease in terms of volume in 2009 compared to 2008, if the economic slumpseverely worsens. In addition, the Bank anticipates that its net interest margin may significantly decrease in2009 compared to 2008 largely due to a narrowing in the net interest spread as the base certificate ofdeposit rates, upon which a substantial portion of its lending is based, remains relatively low due togovernment policy reasons related to stimulating the economy while the interest rates applicable to itsborrowings remain relatively high due to the continued liquidity difficulties in the global financial markets.Accordingly, the Bank anticipates that the level of its net income may be significantly lower in 2009compared to 2008.
The Bank’s anticipated financial condition and results of operation described above are forward-lookingstatements based upon the assumptions and beliefs of its management regarding economic conditions inKorea and globally, demand for its products and services, its market environment, its credit costs andreserves and other factors, and are subject to the qualifications described under “Forward-LookingStatements”. The Bank’s actual results of operations could vary significantly from the foregoingexpectations and could be influenced by a number of factors, including those described in “— OperatingResults” and “Risk Factors”. As a result, the Bank cannot and does not make any representations withrespect to the accuracy of the foregoing expectations.
Interest Rates
Interest rate movements, in terms of magnitude and timing as well as the divergence of such movementswith respect to the Bank’s assets and liabilities, have a significant impact on its net interest margins and itsprofitability, particularly with respect to its financial products that are sensitive to such movements. Forexample, if the interest rates applicable to the Bank’s loans (which are recorded as its assets) decrease orincrease at a slower pace or by a thinner margin compared to the interest rates applicable to its deposits(which are recorded as its liabilities), its net interest margin will shrink and its profitability will benegatively affected. In addition, the relative size and composition of its variable rate loans and deposits (ascompared to its fixed rate loans and deposits) may also impact its net interest margin. Furthermore, thedifference in the average term of the Bank’s loans compared to its deposits may also impact the Bank’s netinterest margin. For example, since the Bank’s deposits tend to have a longer term, on average, than that ofits loans, the Bank’s deposits are less sensitive to movements in the base interest rates on which the Bank’sdeposits and loans tend to be pegged, and, therefore, an increase in the base interest rates tend to increasethe net margin of the Bank while a decrease in the base interest rates tend to have the opposite effect. Whilethe Bank continually manages its assets and liabilities to minimize its exposure to interest rate volatilities,such efforts by the Bank may not mitigate the impact of interest rate volatility in a timely or effectivemanner.
33
The following table shows certain benchmark Won-denominated borrowing interest rates as of the datesindicated.
CorporateBond
Rates(1)
TreasuryBond
Rates(2)
Certificateof Deposit
Rates(3)
December 31, 2004 . . . . . . . . . . . . . . . . . . . . . . . . . . . . . . . . . . . . . . . . . . . . . . 3.72 3.28 3.43June 30, 2005 . . . . . . . . . . . . . . . . . . . . . . . . . . . . . . . . . . . . . . . . . . . . . . . . . . . 4.41 4.02 3.54December 31, 2005 . . . . . . . . . . . . . . . . . . . . . . . . . . . . . . . . . . . . . . . . . . . . . . 5.52 5.08 4.09June 30, 2006 . . . . . . . . . . . . . . . . . . . . . . . . . . . . . . . . . . . . . . . . . . . . . . . . . . . 5.20 4.92 4.59December 31, 2006 . . . . . . . . . . . . . . . . . . . . . . . . . . . . . . . . . . . . . . . . . . . . . . 5.29 4.92 4.86June 30, 2007 . . . . . . . . . . . . . . . . . . . . . . . . . . . . . . . . . . . . . . . . . . . . . . . . . . . 5.66 5.26 5.00December 31, 2007 . . . . . . . . . . . . . . . . . . . . . . . . . . . . . . . . . . . . . . . . . . . . . . 6.77 5.74 5.82June 30, 2008 . . . . . . . . . . . . . . . . . . . . . . . . . . . . . . . . . . . . . . . . . . . . . . . . . . . 6.88 5.90 5.37December 31, 2008 . . . . . . . . . . . . . . . . . . . . . . . . . . . . . . . . . . . . . . . . . . . . . . 7.72 3.41 3.93March 31, 2009 . . . . . . . . . . . . . . . . . . . . . . . . . . . . . . . . . . . . . . . . . . . . . . . . . . 6.13 3.94 2.43
Source: Korea Securities Dealers Association
Notes:
(1) Measured by the yield on three-year AA-rated corporate bonds.
(2) Measured by the yield on three-year treasury bonds.
(3) Measured by the yield on certificates of deposit (with a maturity of 91 days).
Critical Accounting Policies
The Bank’s non-consolidated financial statements are prepared in accordance with Korean GAAP, andwhere applicable, Korean Bank Accounting Guidelines, which reflect prevailing accounting practices withinthe Korean banking industry. The preparation of the Bank’s financial statements requires management tomake judgments, involving significant estimates and assumptions, in the application of certain accountingpolicies about the effects of matters that are inherently uncertain. These estimates and assumptions, whichmay materially affect the reported amounts of certain assets, liabilities, revenues and expenses, are based oninformation available to the Bank as of the date of the financial statements, and changes in this informationover time could materially impact amounts reported in the financial statements as a result of the use ofdifferent estimates and assumptions. Certain accounting policies, by their nature, have a greater reliance onthe use of estimates and assumptions, and could produce results materially different from those originallyreported.
Based on the sensitivity of financial statement amounts to the methods, estimates and assumptionsunderlying reported amounts, the Bank has identified the following significant accounting policies thatinvolve critical accounting estimates. These policies require subjective or complex judgments, and as suchcould be subject to revision as new information becomes available. The Bank’s significant accountingpolicies are described in more detail in Note 2 in the notes to its non-consolidated financial statementsincluded in this offering circular.
Allowance for Credit Losses
The allowance for credit losses includes allowance for loan losses and allowance for off-balance sheetcredit instruments. The allowance for loan losses is reported as a reduction of loans, and the allowance foroff-balance sheet credit instruments is reported in other liabilities. The allowance for credit lossesrepresents the amount available for estimated probable credit losses existing in the Bank’s lending portfolio.In estimating the allowance for corporate and household loan losses, the Bank records the greater amountresulting from the methods described below for each loan classification.
34
(i) Expected Loss Method
The Bank estimates the allowance for corporate and household loan losses by applying the expected lossmethod, which analyzes factors of estimated loss based on probability of default (“PD”) and loss givendefault (“LGD”). This provisioning method considers both financial and non-financial factors of borrowersto assess PD and LGD. PD is determined by considering the type of borrowers, the nature of loans anddelinquent days and LGD is determined by considering the type of loan and collateral. The period ofhistorical data used to calculate PD and LGD is updated annually; PD and LGD are calculated based onhistorical data for the past seven years and 70 months for corporate loans, and five years and 60 months forretail loans, respectively, as of December 31, 2008 and as of March 31, 2009. The allowance for loan lossesis calculated by multiplying the outstanding loan balance by the PD and LGD.
(ii) Financial Supervisory Service Guidelines
The Bank applies the Financial Supervisory Service Guidelines for corporate and household loans inaccordance with the Regulation for the Supervision of Banks revised on February 2, 2009. The prescribedminimum levels of provision per the Financial Supervisory Service Guidelines are as follows:
Š for corporate loans, 0.85% for normal (0.9% for construction, real estate and rental services, retail andwholesale, lodging and restaurant; industries susceptible to market), 7% for precautionary, 20% forsubstandard, 50% for doubtful and 100% for estimated loss, respectively; and
Š for household loans, 1% for normal, 10% for precautionary, 20% for substandard, 55% for doubtfuland 100% for estimated loss, respectively.
In addition, the Bank considers the borrower’s ability to repay and the recovery value of collateral inestimating expected loss on high-risk or large volume loan balances. In estimating the allowance for unusedcorporate and household credit commitments, to the extent that the Bank’s internal analysis and theFinancial Supervisory Service guidelines yield different amounts of allowance, the Bank records the greateramount with respect to each loan classification.
Allowance for Off-balance Sheet Credit Instruments
The allowance for off-balance sheet credit instruments represents the amounts available for estimatedprobable credit loss existing in the Bank’s unfunded credit facilities such as commitments to extend credit,guarantees, acceptances, standby and commercial letters of credit and other financial instruments. As statedabove, the Bank performs periodic systematic reviews of its credit portfolio including off-balance sheetcredit instruments to identify inherent losses and assess the overall probability of collection.
(i) Expected Loss Method
The Bank estimates the allowance for unused loan commitments using the same method applied forallowance for loan losses.
(ii) Financial Supervisory Service Guidelines
The Bank estimates the allowance for unused loan commitments based on each classification in accordancewith the Regulations for the Supervision of Banks established by the Financial Supervisory Service, asamended on February 2, 2009 as follows:
Š for unused corporate loan commitments, a minimum of 0.85% for normal (0.9% for construction, realestate and rental services, retail and wholesale, lodging and restaurant; industries susceptible tomarket), 7% for precautionary, 20% for substandard, 50% for doubtful and 100% for estimated loss,respectively; and
Š for unused household loan commitments, a minimum of 1% for normal, 10% for precautionary, 20%for substandard, 55% for doubtful and 100% for estimated loss, respectively.
35
The Bank estimates allowance for losses on outstanding guarantees and acceptances, contingent guaranteesand acceptances and endorsed bills in accordance with the same loan classification criteria applied inestimating allowance for loan losses. Such allowance of losses is recorded as other liabilities, and thechanges in such allowance over the relevant period are recorded as non-interest expenses or non-interestincome.
Valuation of Securities and Financial Instruments
The Bank classifies securities on its balance sheet as trading, available-for-sale, or held-to-maturity, basedon their marketability, the intent of its acquisition and its ability to hold those securities.
Specifically, the Bank classifies securities as trading securities when those securities are bought and heldprincipally for sale in the near term to generate profits from short-term price differences and are tradedfrequently. Debt securities that have a fixed or determinable payment amount and a fixed maturity areclassified as held-to-maturity, only if the Bank has both the positive intent and ability to hold suchsecurities to maturity. All other securities are classified as available-for-sale.
Trading securities. If the fair value of trading securities differs from the book value, they are recorded attheir fair value on the Bank’s balance sheet and unrealized holding gains and losses are included in itscurrent earnings.
Available-for-sale securities. The Bank records available-for-sale securities at their fair value on itsbalance sheet. Unrealized holding gains and losses for available-for-sale securities are accounted for asseparate components of stockholders’ equity until realized; that is, at the time when such securities aredisposed of or written down to recognize impairment loss, the lump-sum cumulative amount of suchcomponents of stockholders’ equity related to those securities is reflected in current earnings. As anexception, however, available-for-sale equity securities that are not traded in an active trading market areaccounted for at their acquisition costs, only if their fair values cannot be reliably estimated. When therecoverable values of available-for-sale equity securities are less than their acquisition cost (for debtsecurities, their amortized acquisition cost), and there is any objective evidence that their fair values areimpaired, book values are adjusted to the recoverable amounts and the amount of the acquisition cost (fordebt securities, the amortized acquisition cost) in excess of the recoverable value less the amount ofimpairment loss already recognized in prior periods is reflected in current loss as impairment loss foravailable-for-sale securities. Subsequent recovery is recorded in current operations up to the amount of thepreviously recognized impairment loss as reversal of loss on impairment on available-for-sale securities andany excess is included in accumulated other comprehensive income as gain on valuation ofavailable-for-sale securities. However, if the increases in the fair value of the impaired securities are notregarded as the recovery of the impairment, the increases in the fair value are recorded on gain or loss onvaluation of available-for sale securities in accumulated other comprehensive income. For non-marketableequity securities, which were impaired based on the net asset fair value, the recovery is recorded up to theamount of acquisition cost.
Held-to-maturity securities. The Bank records held-to-maturity securities at amortized acquisition cost.The difference between their acquisition cost and face value (commonly referred to as a “discount” or“premium” on debt securities) is (1) amortized into interest income over the remaining term of the securitiesusing the effective interest method and (2) added to or subtracted from the acquisition cost. When therecoverable amount is less than the amortized acquisition cost of a debt security, and there is any objectiveevidence of impairment loss, the book value of the security is adjusted to the recoverable amount. Thedifference between the recoverable amount and book value is accounted for in current loss as impairmentloss for held-to-maturity securities.
Subsequent recovery is recorded in current operations up to the amount of the previously recognizedimpairment loss as reversal of loss on impairment of held-to-maturity securities.
The Bank believes that the accounting estimates related to the fair value and recoverable value of its varioussecurities are a “critical accounting policy” because: (1) they may be highly susceptible to change fromperiod to period based on factors beyond the Bank’s control; and (2) any significant difference between the
36
estimated fair or recoverable value of these securities on any particular date and either their estimated fairor recoverable value on a different date or the actual proceeds that the Bank receives upon sale of thesesecurities could result in valuation losses or losses on disposal, which may have a material impact on theBank’s net income. The Bank’s assumptions about the fair or recoverable value of securities that it holdsrequire significant judgment because actual valuations have fluctuated in the past and are expected tocontinue to do so, based on a variety of factors.
Investments in Associates
Associates are all entities over which the Bank has the ability to significantly influence the financial andoperating policies and procedures, generally accompanying an equity interest of over 15% of the votingrights. Investments in associates are accounted for using the equity method of accounting and are initiallyrecognized at cost.
The parent company’s investments in associates include goodwill identified on acquisition (net of anyaccumulated impairment loss). Goodwill is calculated as the excess of the acquisition cost of an investmentin an associate over the parent company’s share of the fair value of the identifiable net assets acquired.
Negative goodwill is the excess of fair value of the net identifiable assets acquired over the purchase price.The balance of negative goodwill is allocated to reduce proportionately the values assigned to depreciablenon-monetary assets. If the allocation reduces the non-monetary assets to zero, any remainder is recognizedas an extraordinary gain in the period of acquisition. However, negative goodwill related to future lossesand expenses that have been specifically identified in the purchase agreement is recognized as income in theperiod that these are actually incurred.
Goodwill is amortized using the straight-line method over its estimated useful life of five years.Amortization of (negative) goodwill is recorded together with equity income (losses).
The parent company’s share of its post-acquisition profits or losses in investments in associates isrecognized in the consolidated income statement, and its share of post-acquisition movements in equity isrecognized in equity. The cumulative post-acquisition movements are adjusted against the carrying amountof each investment. Changes in the carrying amount of an investment resulting from dividends by anassociate are recognized when the associate declares the dividend. When the parent company’s share oflosses in an associate equals or exceeds its interest in the associate, including preferred stock, otherlong-term loans and receivables issued by the associate or guaranteed obligations of the associate, theparent company does not recognize further losses, unless it has incurred obligations or made payments onbehalf of the associate.
Unrealized gains on transactions between the parent company and its associates are eliminated to the extentof the parent company’s interest in each associate.
When events or circumstances indicate that the carrying value of goodwill may not be recoverable, theparent company reviews goodwill for impairment and records any impairment loss immediately in theconsolidated statement of income.
Contingent Liabilities
The Bank is subject to contingent liabilities, including judicial, tax, regulatory and arbitration proceedings,commitments provided to its customers and other claims arising from the conduct of its business activities.The Bank establishes allowances against these contingencies in its financial statements based on itsassessment of the probability of occurrence and its estimate of the obligation. The Bank involves internaland external advisors, such as attorneys, consultants and other professionals, in assessing probability and inestimating any amounts involved. Throughout the life of a contingency, the Bank or its advisors may learnof additional information that can affect its assessments about the probability of repayment or about theestimates of amounts involved. Changes in these assessments can lead to changes in allowances recorded onthe Bank’s financial statements. In addition, the actual costs of resolving these claims may be substantiallyhigher or lower than the amounts provided in the Bank’s financial statements for those claims.
37
Recognition of Deferred Tax Assets
Income tax expense is the amount currently payable for the period added to or deducted from the change indeferred income tax. However, the Bank recognizes deferred income tax assets only if it reasonably expectsto realize the future tax benefits from accumulated temporary differences and tax loss carry-forwards. Informing a conclusion about whether a tax asset is recoverable in the foreseeable future, the Bank uses itsjudgment in assessing the potential events and circumstances affecting future recoverability while at thesame time considering past experience. If the Bank’s interpretations or judgments differ from those of taxauthorities with respect to the utilization of tax losses carried forward, the income tax provision may vary infuture periods. The Bank accounts for the difference between the amount currently payable for the periodand income tax expense as deferred income tax assets or liabilities and is offset against income tax assets orliabilities in future periods.
The Bank believes that the estimates related to its establishment of deferred tax assets are a “criticalaccounting policy” because: (1) they may be highly susceptible to change from period to period based on itsassumptions regarding its future profitability; and (2) any significant difference between the Bank’sestimates of future profits on any particular date and such estimates of future profits on a different datecould result in income tax benefits, which may have a material impact on its net income from period toperiod. The Bank’s assumptions about future profitability require significant judgment and are inherentlysubjective.
38
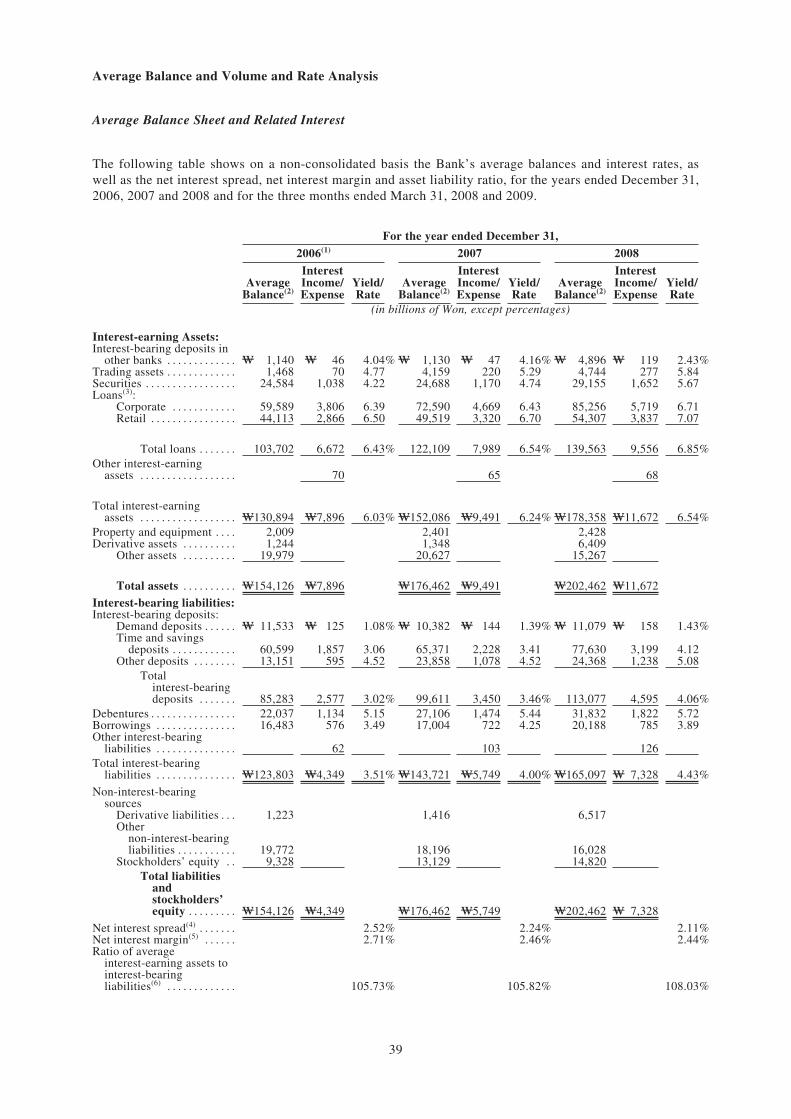
Average Balance and Volume and Rate Analysis
Average Balance Sheet and Related Interest
The following table shows on a non-consolidated basis the Bank’s average balances and interest rates, aswell as the net interest spread, net interest margin and asset liability ratio, for the years ended December 31,2006, 2007 and 2008 and for the three months ended March 31, 2008 and 2009.
For the year ended December 31,
2006(1) 2007 2008
AverageBalance(2)
InterestIncome/Expense
Yield/Rate
AverageBalance(2)
InterestIncome/Expense
Yield/Rate
AverageBalance(2)
InterestIncome/Expense
Yield/Rate
(in billions of Won, except percentages)
Interest-earning Assets:Interest-bearing deposits in
other banks . . . . . . . . . . . . . W 1,140 W 46 4.04% W 1,130 W 47 4.16% W 4,896 W 119 2.43%Trading assets . . . . . . . . . . . . . 1,468 70 4.77 4,159 220 5.29 4,744 277 5.84Securities . . . . . . . . . . . . . . . . . 24,584 1,038 4.22 24,688 1,170 4.74 29,155 1,652 5.67Loans(3):
Corporate . . . . . . . . . . . . 59,589 3,806 6.39 72,590 4,669 6.43 85,256 5,719 6.71Retail . . . . . . . . . . . . . . . . 44,113 2,866 6.50 49,519 3,320 6.70 54,307 3,837 7.07
Total loans . . . . . . . 103,702 6,672 6.43% 122,109 7,989 6.54% 139,563 9,556 6.85%Other interest-earning
assets . . . . . . . . . . . . . . . . . . 70 65 68
Total interest-earningassets . . . . . . . . . . . . . . . . . . W130,894 W7,896 6.03% W152,086 W9,491 6.24% W178,358 W11,672 6.54%
Property and equipment . . . . 2,009 2,401 2,428Derivative assets . . . . . . . . . . 1,244 1,348 6,409
Other assets . . . . . . . . . . 19,979 20,627 15,267
Total assets . . . . . . . . . . W154,126 W7,896 W176,462 W9,491 W202,462 W11,672
Interest-bearing liabilities:Interest-bearing deposits:
Demand deposits . . . . . . W 11,533 W 125 1.08% W 10,382 W 144 1.39% W 11,079 W 158 1.43%Time and savings
deposits . . . . . . . . . . . . 60,599 1,857 3.06 65,371 2,228 3.41 77,630 3,199 4.12Other deposits . . . . . . . . 13,151 595 4.52 23,858 1,078 4.52 24,368 1,238 5.08
Totalinterest-bearingdeposits . . . . . . . 85,283 2,577 3.02% 99,611 3,450 3.46% 113,077 4,595 4.06%
Debentures . . . . . . . . . . . . . . . . 22,037 1,134 5.15 27,106 1,474 5.44 31,832 1,822 5.72Borrowings . . . . . . . . . . . . . . . 16,483 576 3.49 17,004 722 4.25 20,188 785 3.89Other interest-bearing
liabilities . . . . . . . . . . . . . . . 62 103 126Total interest-bearing
liabilities . . . . . . . . . . . . . . . W123,803 W4,349 3.51% W143,721 W5,749 4.00% W165,097 W 7,328 4.43%
Non-interest-bearingsources
Derivative liabilities . . . 1,223 1,416 6,517Other
non-interest-bearingliabilities . . . . . . . . . . . 19,772 18,196 16,028
Stockholders’ equity . . 9,328 13,129 14,820Total liabilities
andstockholders’equity . . . . . . . . . W154,126 W4,349 W176,462 W5,749 W202,462 W 7,328
Net interest spread(4) . . . . . . . 2.52% 2.24% 2.11%Net interest margin(5) . . . . . . 2.71% 2.46% 2.44%Ratio of average
interest-earning assets tointerest-bearingliabilities(6) . . . . . . . . . . . . . 105.73% 105.82% 108.03%
39
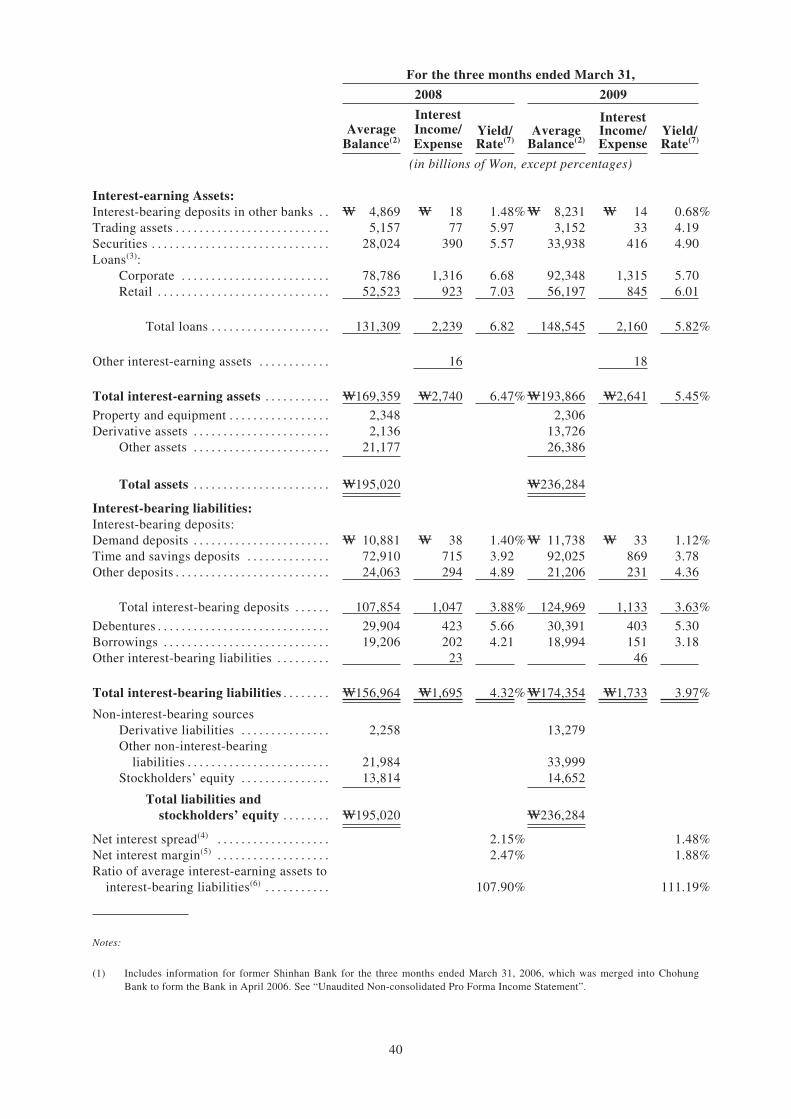
For the three months ended March 31,
2008 2009
AverageBalance(2)
InterestIncome/Expense
Yield/Rate(7)
AverageBalance(2)
InterestIncome/Expense
Yield/Rate(7)
(in billions of Won, except percentages)
Interest-earning Assets:Interest-bearing deposits in other banks . . W 4,869 W 18 1.48% W 8,231 W 14 0.68%Trading assets . . . . . . . . . . . . . . . . . . . . . . . . . . 5,157 77 5.97 3,152 33 4.19Securities . . . . . . . . . . . . . . . . . . . . . . . . . . . . . . 28,024 390 5.57 33,938 416 4.90Loans(3):
Corporate . . . . . . . . . . . . . . . . . . . . . . . . . 78,786 1,316 6.68 92,348 1,315 5.70Retail . . . . . . . . . . . . . . . . . . . . . . . . . . . . . 52,523 923 7.03 56,197 845 6.01
Total loans . . . . . . . . . . . . . . . . . . . . 131,309 2,239 6.82 148,545 2,160 5.82%
Other interest-earning assets . . . . . . . . . . . . 16 18
Total interest-earning assets . . . . . . . . . . . W169,359 W2,740 6.47% W193,866 W2,641 5.45%
Property and equipment . . . . . . . . . . . . . . . . . 2,348 2,306Derivative assets . . . . . . . . . . . . . . . . . . . . . . . 2,136 13,726
Other assets . . . . . . . . . . . . . . . . . . . . . . . 21,177 26,386
Total assets . . . . . . . . . . . . . . . . . . . . . . . W195,020 W236,284
Interest-bearing liabilities:Interest-bearing deposits:Demand deposits . . . . . . . . . . . . . . . . . . . . . . . W 10,881 W 38 1.40% W 11,738 W 33 1.12%Time and savings deposits . . . . . . . . . . . . . . 72,910 715 3.92 92,025 869 3.78Other deposits . . . . . . . . . . . . . . . . . . . . . . . . . . 24,063 294 4.89 21,206 231 4.36
Total interest-bearing deposits . . . . . . 107,854 1,047 3.88% 124,969 1,133 3.63%
Debentures . . . . . . . . . . . . . . . . . . . . . . . . . . . . . 29,904 423 5.66 30,391 403 5.30Borrowings . . . . . . . . . . . . . . . . . . . . . . . . . . . . 19,206 202 4.21 18,994 151 3.18Other interest-bearing liabilities . . . . . . . . . 23 46
Total interest-bearing liabilities . . . . . . . . W156,964 W1,695 4.32% W174,354 W1,733 3.97%
Non-interest-bearing sourcesDerivative liabilities . . . . . . . . . . . . . . . 2,258 13,279Other non-interest-bearing
liabilities . . . . . . . . . . . . . . . . . . . . . . . . 21,984 33,999Stockholders’ equity . . . . . . . . . . . . . . . 13,814 14,652
Total liabilities andstockholders’ equity . . . . . . . . W195,020 W236,284
Net interest spread(4) . . . . . . . . . . . . . . . . . . . 2.15% 1.48%Net interest margin(5) . . . . . . . . . . . . . . . . . . . 2.47% 1.88%Ratio of average interest-earning assets to
interest-bearing liabilities(6) . . . . . . . . . . . 107.90% 111.19%
Notes:
(1) Includes information for former Shinhan Bank for the three months ended March 31, 2006, which was merged into ChohungBank to form the Bank in April 2006. See “Unaudited Non-consolidated Pro Forma Income Statement”.
40
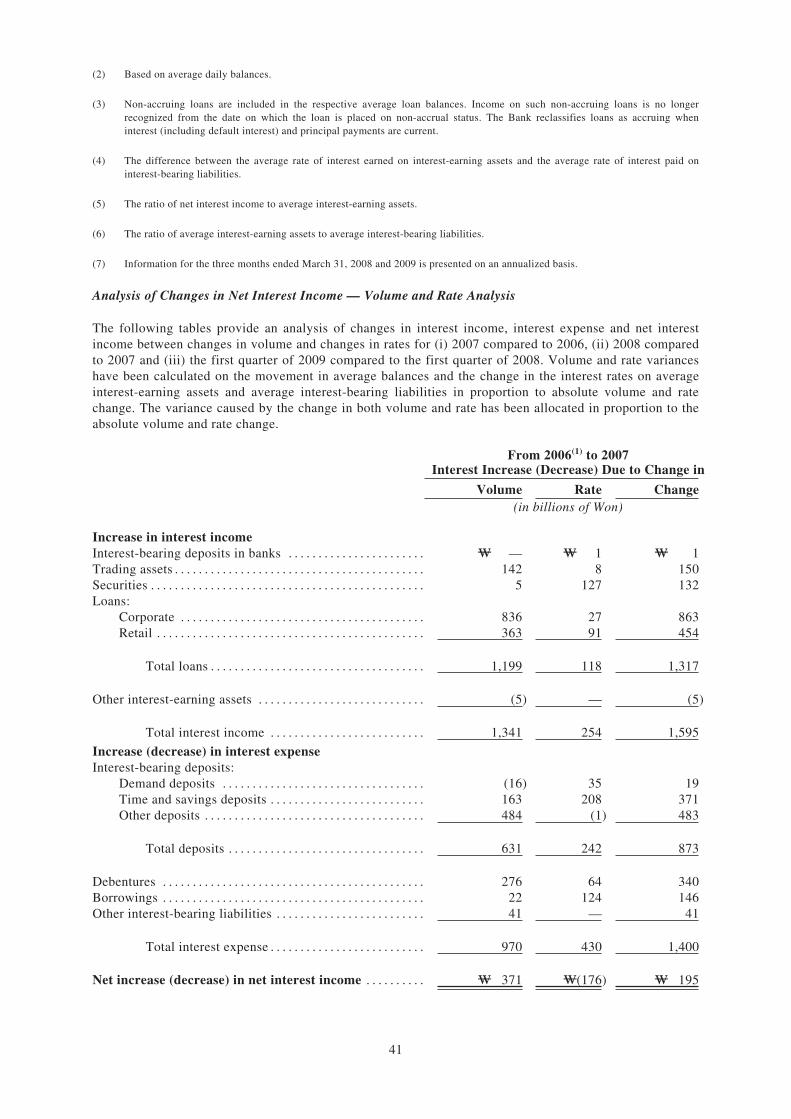
(2) Based on average daily balances.
(3) Non-accruing loans are included in the respective average loan balances. Income on such non-accruing loans is no longerrecognized from the date on which the loan is placed on non-accrual status. The Bank reclassifies loans as accruing wheninterest (including default interest) and principal payments are current.
(4) The difference between the average rate of interest earned on interest-earning assets and the average rate of interest paid oninterest-bearing liabilities.
(5) The ratio of net interest income to average interest-earning assets.
(6) The ratio of average interest-earning assets to average interest-bearing liabilities.
(7) Information for the three months ended March 31, 2008 and 2009 is presented on an annualized basis.
Analysis of Changes in Net Interest Income — Volume and Rate Analysis
The following tables provide an analysis of changes in interest income, interest expense and net interestincome between changes in volume and changes in rates for (i) 2007 compared to 2006, (ii) 2008 comparedto 2007 and (iii) the first quarter of 2009 compared to the first quarter of 2008. Volume and rate varianceshave been calculated on the movement in average balances and the change in the interest rates on averageinterest-earning assets and average interest-bearing liabilities in proportion to absolute volume and ratechange. The variance caused by the change in both volume and rate has been allocated in proportion to theabsolute volume and rate change.
From 2006(1) to 2007Interest Increase (Decrease) Due to Change in
Volume Rate Change(in billions of Won)
Increase in interest incomeInterest-bearing deposits in banks . . . . . . . . . . . . . . . . . . . . . . . W — W 1 W 1Trading assets . . . . . . . . . . . . . . . . . . . . . . . . . . . . . . . . . . . . . . . . . . 142 8 150Securities . . . . . . . . . . . . . . . . . . . . . . . . . . . . . . . . . . . . . . . . . . . . . . 5 127 132Loans:
Corporate . . . . . . . . . . . . . . . . . . . . . . . . . . . . . . . . . . . . . . . . . 836 27 863Retail . . . . . . . . . . . . . . . . . . . . . . . . . . . . . . . . . . . . . . . . . . . . . 363 91 454
Total loans . . . . . . . . . . . . . . . . . . . . . . . . . . . . . . . . . . . . 1,199 118 1,317
Other interest-earning assets . . . . . . . . . . . . . . . . . . . . . . . . . . . . (5) — (5)
Total interest income . . . . . . . . . . . . . . . . . . . . . . . . . . 1,341 254 1,595
Increase (decrease) in interest expenseInterest-bearing deposits:
Demand deposits . . . . . . . . . . . . . . . . . . . . . . . . . . . . . . . . . . (16) 35 19Time and savings deposits . . . . . . . . . . . . . . . . . . . . . . . . . . 163 208 371Other deposits . . . . . . . . . . . . . . . . . . . . . . . . . . . . . . . . . . . . . 484 (1) 483
Total deposits . . . . . . . . . . . . . . . . . . . . . . . . . . . . . . . . . 631 242 873
Debentures . . . . . . . . . . . . . . . . . . . . . . . . . . . . . . . . . . . . . . . . . . . . 276 64 340Borrowings . . . . . . . . . . . . . . . . . . . . . . . . . . . . . . . . . . . . . . . . . . . . 22 124 146Other interest-bearing liabilities . . . . . . . . . . . . . . . . . . . . . . . . . 41 — 41
Total interest expense . . . . . . . . . . . . . . . . . . . . . . . . . . 970 430 1,400
Net increase (decrease) in net interest income . . . . . . . . . . W 371 W(176) W 195
41
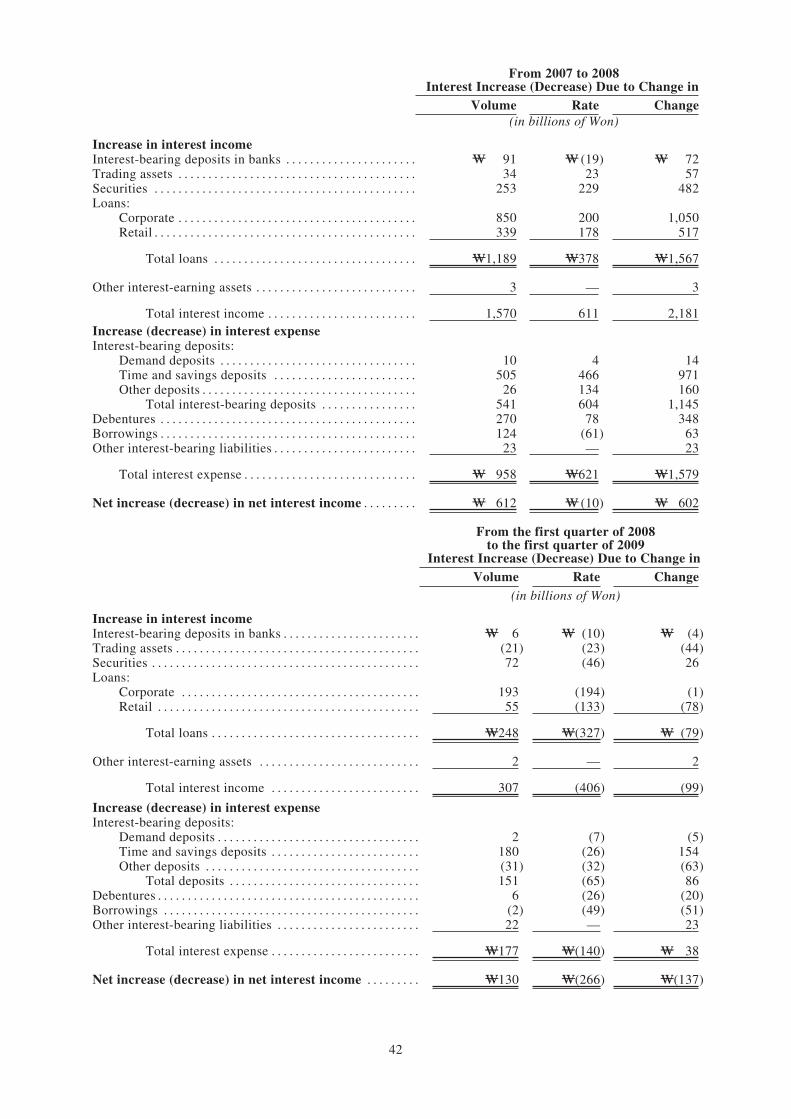
From 2007 to 2008Interest Increase (Decrease) Due to Change in
Volume Rate Change(in billions of Won)
Increase in interest incomeInterest-bearing deposits in banks . . . . . . . . . . . . . . . . . . . . . . W 91 W (19) W 72Trading assets . . . . . . . . . . . . . . . . . . . . . . . . . . . . . . . . . . . . . . . . 34 23 57Securities . . . . . . . . . . . . . . . . . . . . . . . . . . . . . . . . . . . . . . . . . . . . 253 229 482Loans:
Corporate . . . . . . . . . . . . . . . . . . . . . . . . . . . . . . . . . . . . . . . . 850 200 1,050Retail . . . . . . . . . . . . . . . . . . . . . . . . . . . . . . . . . . . . . . . . . . . . 339 178 517
Total loans . . . . . . . . . . . . . . . . . . . . . . . . . . . . . . . . . . W1,189 W378 W1,567
Other interest-earning assets . . . . . . . . . . . . . . . . . . . . . . . . . . . 3 — 3
Total interest income . . . . . . . . . . . . . . . . . . . . . . . . . 1,570 611 2,181Increase (decrease) in interest expenseInterest-bearing deposits:
Demand deposits . . . . . . . . . . . . . . . . . . . . . . . . . . . . . . . . . 10 4 14Time and savings deposits . . . . . . . . . . . . . . . . . . . . . . . . 505 466 971Other deposits . . . . . . . . . . . . . . . . . . . . . . . . . . . . . . . . . . . . 26 134 160
Total interest-bearing deposits . . . . . . . . . . . . . . . . 541 604 1,145Debentures . . . . . . . . . . . . . . . . . . . . . . . . . . . . . . . . . . . . . . . . . . . 270 78 348Borrowings . . . . . . . . . . . . . . . . . . . . . . . . . . . . . . . . . . . . . . . . . . . 124 (61) 63Other interest-bearing liabilities . . . . . . . . . . . . . . . . . . . . . . . . 23 — 23
Total interest expense . . . . . . . . . . . . . . . . . . . . . . . . . . . . . W 958 W621 W1,579
Net increase (decrease) in net interest income . . . . . . . . . W 612 W (10) W 602
From the first quarter of 2008to the first quarter of 2009
Interest Increase (Decrease) Due to Change inVolume Rate Change
(in billions of Won)
Increase in interest incomeInterest-bearing deposits in banks . . . . . . . . . . . . . . . . . . . . . . . W 6 W (10) W (4)Trading assets . . . . . . . . . . . . . . . . . . . . . . . . . . . . . . . . . . . . . . . . . (21) (23) (44)Securities . . . . . . . . . . . . . . . . . . . . . . . . . . . . . . . . . . . . . . . . . . . . . 72 (46) 26Loans:
Corporate . . . . . . . . . . . . . . . . . . . . . . . . . . . . . . . . . . . . . . . . 193 (194) (1)Retail . . . . . . . . . . . . . . . . . . . . . . . . . . . . . . . . . . . . . . . . . . . . 55 (133) (78)
Total loans . . . . . . . . . . . . . . . . . . . . . . . . . . . . . . . . . . . W248 W(327) W (79)
Other interest-earning assets . . . . . . . . . . . . . . . . . . . . . . . . . . . 2 — 2
Total interest income . . . . . . . . . . . . . . . . . . . . . . . . . 307 (406) (99)
Increase (decrease) in interest expenseInterest-bearing deposits:
Demand deposits . . . . . . . . . . . . . . . . . . . . . . . . . . . . . . . . . . 2 (7) (5)Time and savings deposits . . . . . . . . . . . . . . . . . . . . . . . . . 180 (26) 154Other deposits . . . . . . . . . . . . . . . . . . . . . . . . . . . . . . . . . . . . (31) (32) (63)
Total deposits . . . . . . . . . . . . . . . . . . . . . . . . . . . . . . . . 151 (65) 86Debentures . . . . . . . . . . . . . . . . . . . . . . . . . . . . . . . . . . . . . . . . . . . . 6 (26) (20)Borrowings . . . . . . . . . . . . . . . . . . . . . . . . . . . . . . . . . . . . . . . . . . . (2) (49) (51)Other interest-bearing liabilities . . . . . . . . . . . . . . . . . . . . . . . . 22 — 23
Total interest expense . . . . . . . . . . . . . . . . . . . . . . . . . W177 W(140) W 38
Net increase (decrease) in net interest income . . . . . . . . . W130 W(266) W(137)
42
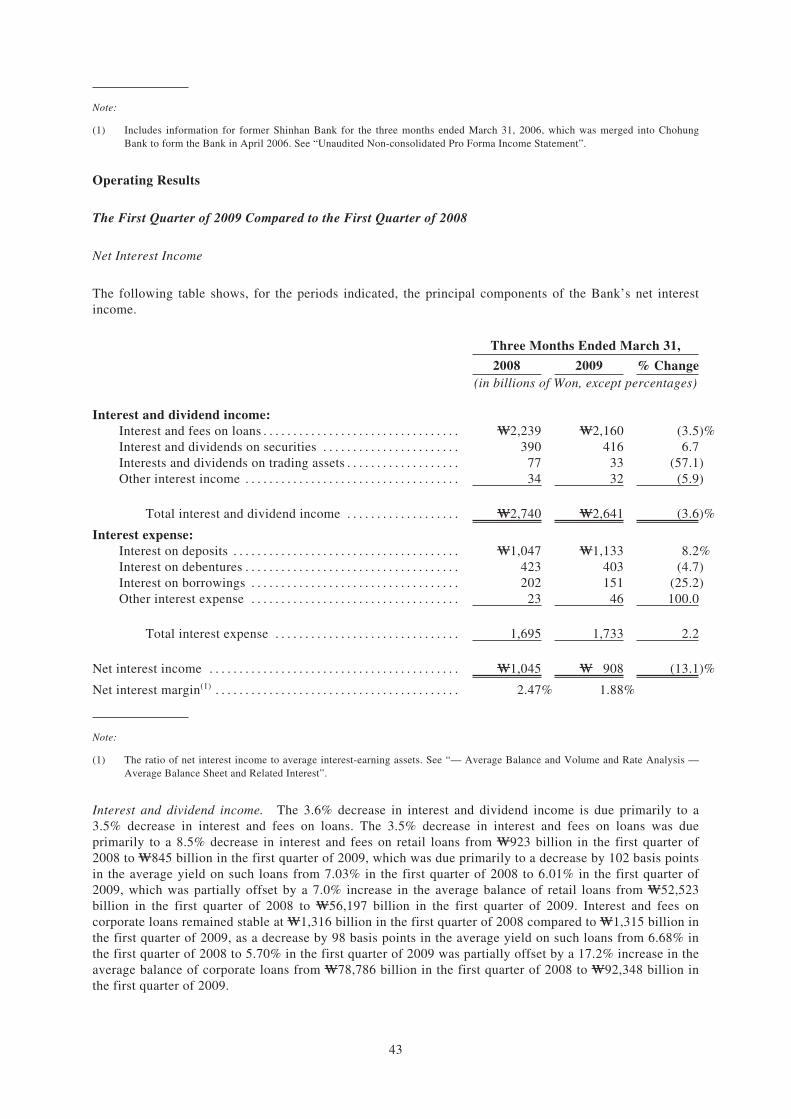
Note:
(1) Includes information for former Shinhan Bank for the three months ended March 31, 2006, which was merged into ChohungBank to form the Bank in April 2006. See “Unaudited Non-consolidated Pro Forma Income Statement”.
Operating Results
The First Quarter of 2009 Compared to the First Quarter of 2008
Net Interest Income
The following table shows, for the periods indicated, the principal components of the Bank’s net interestincome.
Three Months Ended March 31,
2008 2009 % Change(in billions of Won, except percentages)
Interest and dividend income:Interest and fees on loans . . . . . . . . . . . . . . . . . . . . . . . . . . . . . . . . . W2,239 W2,160 (3.5)%Interest and dividends on securities . . . . . . . . . . . . . . . . . . . . . . . 390 416 6.7Interests and dividends on trading assets . . . . . . . . . . . . . . . . . . . 77 33 (57.1)Other interest income . . . . . . . . . . . . . . . . . . . . . . . . . . . . . . . . . . . . 34 32 (5.9)
Total interest and dividend income . . . . . . . . . . . . . . . . . . . W2,740 W2,641 (3.6)%
Interest expense:Interest on deposits . . . . . . . . . . . . . . . . . . . . . . . . . . . . . . . . . . . . . . W1,047 W1,133 8.2%Interest on debentures . . . . . . . . . . . . . . . . . . . . . . . . . . . . . . . . . . . . 423 403 (4.7)Interest on borrowings . . . . . . . . . . . . . . . . . . . . . . . . . . . . . . . . . . . 202 151 (25.2)Other interest expense . . . . . . . . . . . . . . . . . . . . . . . . . . . . . . . . . . . 23 46 100.0
Total interest expense . . . . . . . . . . . . . . . . . . . . . . . . . . . . . . . 1,695 1,733 2.2
Net interest income . . . . . . . . . . . . . . . . . . . . . . . . . . . . . . . . . . . . . . . . . . W1,045 W 908 (13.1)%
Net interest margin(1) . . . . . . . . . . . . . . . . . . . . . . . . . . . . . . . . . . . . . . . . . 2.47% 1.88%
Note:
(1) The ratio of net interest income to average interest-earning assets. See “— Average Balance and Volume and Rate Analysis —Average Balance Sheet and Related Interest”.
Interest and dividend income. The 3.6% decrease in interest and dividend income is due primarily to a3.5% decrease in interest and fees on loans. The 3.5% decrease in interest and fees on loans was dueprimarily to a 8.5% decrease in interest and fees on retail loans from W923 billion in the first quarter of2008 to W845 billion in the first quarter of 2009, which was due primarily to a decrease by 102 basis pointsin the average yield on such loans from 7.03% in the first quarter of 2008 to 6.01% in the first quarter of2009, which was partially offset by a 7.0% increase in the average balance of retail loans from W52,523billion in the first quarter of 2008 to W56,197 billion in the first quarter of 2009. Interest and fees oncorporate loans remained stable at W1,316 billion in the first quarter of 2008 compared to W1,315 billion inthe first quarter of 2009, as a decrease by 98 basis points in the average yield on such loans from 6.68% inthe first quarter of 2008 to 5.70% in the first quarter of 2009 was partially offset by a 17.2% increase in theaverage balance of corporate loans from W78,786 billion in the first quarter of 2008 to W92,348 billion inthe first quarter of 2009.
43
The decrease in lending rates for both corporate and retail loans was principally due to a decrease in thebase rate set by the Bank of Korea in an effort to increase the supply of liquidity in the Korean financialmarkets in light of the global credit crisis.
Overall, the average volume of the Bank’s loans increased by 13.1% from W131,309 billion in the firstquarter of 2008 to W148,545 billion in the first quarter of 2009. The increase in the average volume ofcorporate loans was primarily due to an increase in lending to small- and medium-sized enterprises in thefirst quarter of 2009 pursuant to the Government initiative to support such enterprises in light of thedifficult economic environment in Korea. The increase in the average volume of retail loans was primarilydue to a steady increase in certain mortgage and home equity lending that was made pursuant to presetlending schedules in the first quarter of 2009.
Interest expense. Interest expense increased by 2.2% from W1,695 billion in the first quarter of 2008 toW1,733 billion in the first quarter of 2009, due primarily to a 8.2% increase in interest on deposits fromW1,047 billion in the first quarter of 2008 to W1,133 billion in the first quarter of 2009, which waspartially offset by a 25.2% decrease in interest on borrowings from W202 billion in the first quarter of 2008to W151 billion in the first quarter of 2009.
The increase in interest expense on deposits in the first quarter of 2009 was primarily the result of a 15.9%increase in the average volume of interest-bearing deposits from W107,854 billion in the first quarter of2008 to W124,969 billion in the first quarter of 2009, which was partially offset by a decrease of 25 basispoints in the cost of interest-bearing deposits from 3.88% in the first quarter of 2008 to 3.63% in the firstquarter of 2009.
The increase in the average volume of interest-bearing deposits was due primarily to a 7.9% increase in theaverage volume of demand deposits from W10,881 billion in the first quarter of 2008 to W11,738 billion inthe first quarter of 2009 and a 26.2% increase in the average volume of the Bank’s time and savingsdeposits from W72,910 billion in the first quarter of 2008 to W92,025 billion in the first quarter of 2009,which was partially offset by an 11.9% decrease in the average volume of other deposits from W24,063billion in the first quarter of 2008 to W21,206 billion in the first quarter of 2009.
The principal reason for the decrease in interest rates payable on the Bank’s interest-bearing deposits wasthe decrease in market interest rates payable on interest-bearing deposits in general as a result of a decreasein the base rate set by the Bank of Korea in an effort to increase the supply of liquidity in the Koreanfinancial markets in light of the global credit crisis. The average interest rate paid on time and savingsdeposits, which accounted for 73.6% of its average interest-bearing deposits in the first quarter of 2009,decreased by 14 basis points from 3.92% in the first quarter of 2008 to 3.78% in the first quarter of 2009. Incontrast, the average interest rate paid on the Bank’s demand deposits, which accounted for 9.4% of itsaverage interest-bearing deposits in the first quarter of 2009, decreased by 28 basis points from 1.40% inthe first quarter of 2008 to 1.12% in the first quarter of 2009, and the average interest rate paid on theBank’s other deposits, which consist primarily of certificates of deposit and accounted for 17.0% of theBank’s average interest-bearing deposits in the first quarter of 2009 decreased by 62 basis points from4.98% in the first quarter of 2008 to 4.36% in the first quarter of 2009.
The 4.7% decrease in interest expense on debentures was primarily due to a decrease in the average rate fordebentures by 36 basis points, from 5.66% in the first quarter of 2008 to 5.30% in the first quarter of 2009,which was partially offset by an increase in the average volume of debentures by 1.6% from W29,904billion in the first quarter of 2008 to W30,391 billion in the first quarter of 2009.
The 25.2% decrease in interest expense on borrowings was primarily due to a decrease by 103 basis pointsin the average interest rates paid on the Bank’s borrowings from 4.21% in the first quarter of 2008 to 3.18%in the first quarter of 2009, and a 1.1% decrease in the average volume of the Bank’s borrowings fromW19,206 billion in the first quarter of 2008 to W18,994 billion in the first quarter of 2009.
Net interest margin. Net interest margin represents the ratio of net interest income to average interest-earning assets. The Bank’s overall net interest margin decreased by 59 basis points from 2.47% in the firstquarter of 2008 to 1.88% in the first quarter of 2009, primarily due to a decrease in net interest spread by
44
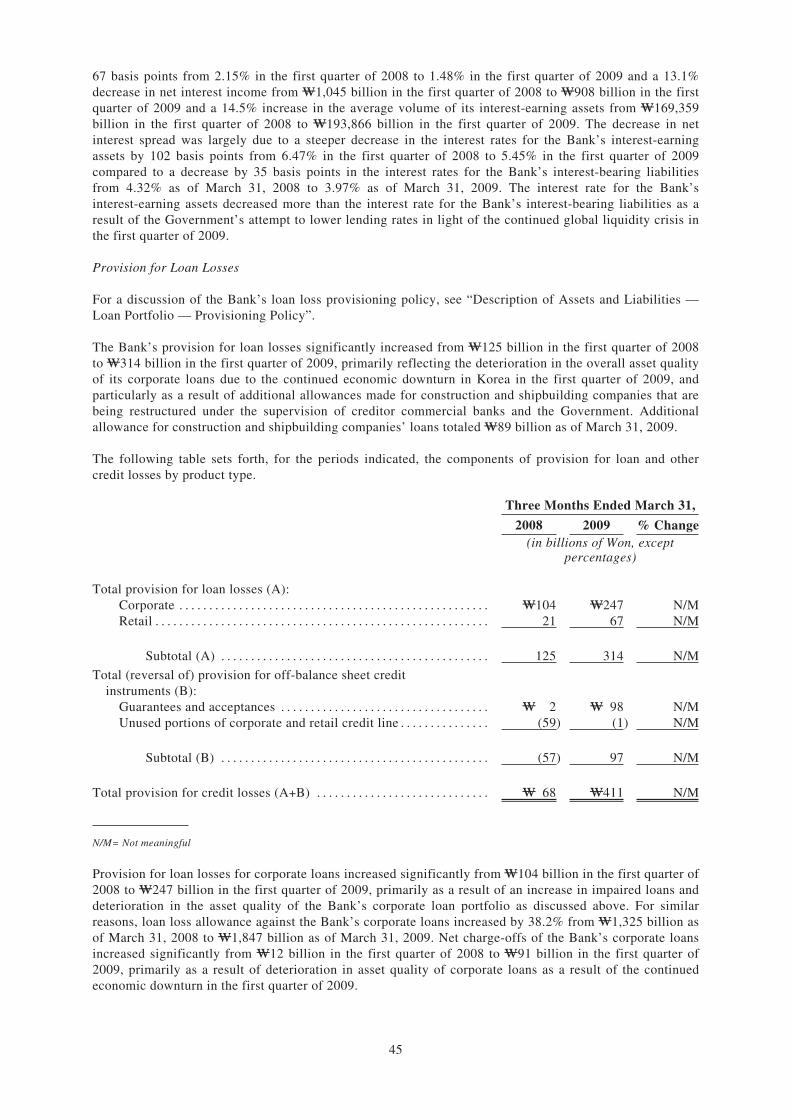
67 basis points from 2.15% in the first quarter of 2008 to 1.48% in the first quarter of 2009 and a 13.1%decrease in net interest income from W1,045 billion in the first quarter of 2008 to W908 billion in the firstquarter of 2009 and a 14.5% increase in the average volume of its interest-earning assets from W169,359billion in the first quarter of 2008 to W193,866 billion in the first quarter of 2009. The decrease in netinterest spread was largely due to a steeper decrease in the interest rates for the Bank’s interest-earningassets by 102 basis points from 6.47% in the first quarter of 2008 to 5.45% in the first quarter of 2009compared to a decrease by 35 basis points in the interest rates for the Bank’s interest-bearing liabilitiesfrom 4.32% as of March 31, 2008 to 3.97% as of March 31, 2009. The interest rate for the Bank’sinterest-earning assets decreased more than the interest rate for the Bank’s interest-bearing liabilities as aresult of the Government’s attempt to lower lending rates in light of the continued global liquidity crisis inthe first quarter of 2009.
Provision for Loan Losses
For a discussion of the Bank’s loan loss provisioning policy, see “Description of Assets and Liabilities —Loan Portfolio — Provisioning Policy”.
The Bank’s provision for loan losses significantly increased from W125 billion in the first quarter of 2008to W314 billion in the first quarter of 2009, primarily reflecting the deterioration in the overall asset qualityof its corporate loans due to the continued economic downturn in Korea in the first quarter of 2009, andparticularly as a result of additional allowances made for construction and shipbuilding companies that arebeing restructured under the supervision of creditor commercial banks and the Government. Additionalallowance for construction and shipbuilding companies’ loans totaled W89 billion as of March 31, 2009.
The following table sets forth, for the periods indicated, the components of provision for loan and othercredit losses by product type.
Three Months Ended March 31,
2008 2009 % Change(in billions of Won, except
percentages)
Total provision for loan losses (A):Corporate . . . . . . . . . . . . . . . . . . . . . . . . . . . . . . . . . . . . . . . . . . . . . . . . . . . . W104 W247 N/MRetail . . . . . . . . . . . . . . . . . . . . . . . . . . . . . . . . . . . . . . . . . . . . . . . . . . . . . . . . 21 67 N/M
Subtotal (A) . . . . . . . . . . . . . . . . . . . . . . . . . . . . . . . . . . . . . . . . . . . . . 125 314 N/M
Total (reversal of) provision for off-balance sheet creditinstruments (B):
Guarantees and acceptances . . . . . . . . . . . . . . . . . . . . . . . . . . . . . . . . . . . W 2 W 98 N/MUnused portions of corporate and retail credit line . . . . . . . . . . . . . . . (59) (1) N/M
Subtotal (B) . . . . . . . . . . . . . . . . . . . . . . . . . . . . . . . . . . . . . . . . . . . . . (57) 97 N/M
Total provision for credit losses (A+B) . . . . . . . . . . . . . . . . . . . . . . . . . . . . . W 68 W411 N/M
N/M= Not meaningful
Provision for loan losses for corporate loans increased significantly from W104 billion in the first quarter of2008 to W247 billion in the first quarter of 2009, primarily as a result of an increase in impaired loans anddeterioration in the asset quality of the Bank’s corporate loan portfolio as discussed above. For similarreasons, loan loss allowance against the Bank’s corporate loans increased by 38.2% from W1,325 billion asof March 31, 2008 to W1,847 billion as of March 31, 2009. Net charge-offs of the Bank’s corporate loansincreased significantly from W12 billion in the first quarter of 2008 to W91 billion in the first quarter of2009, primarily as a result of deterioration in asset quality of corporate loans as a result of the continuedeconomic downturn in the first quarter of 2009.
45
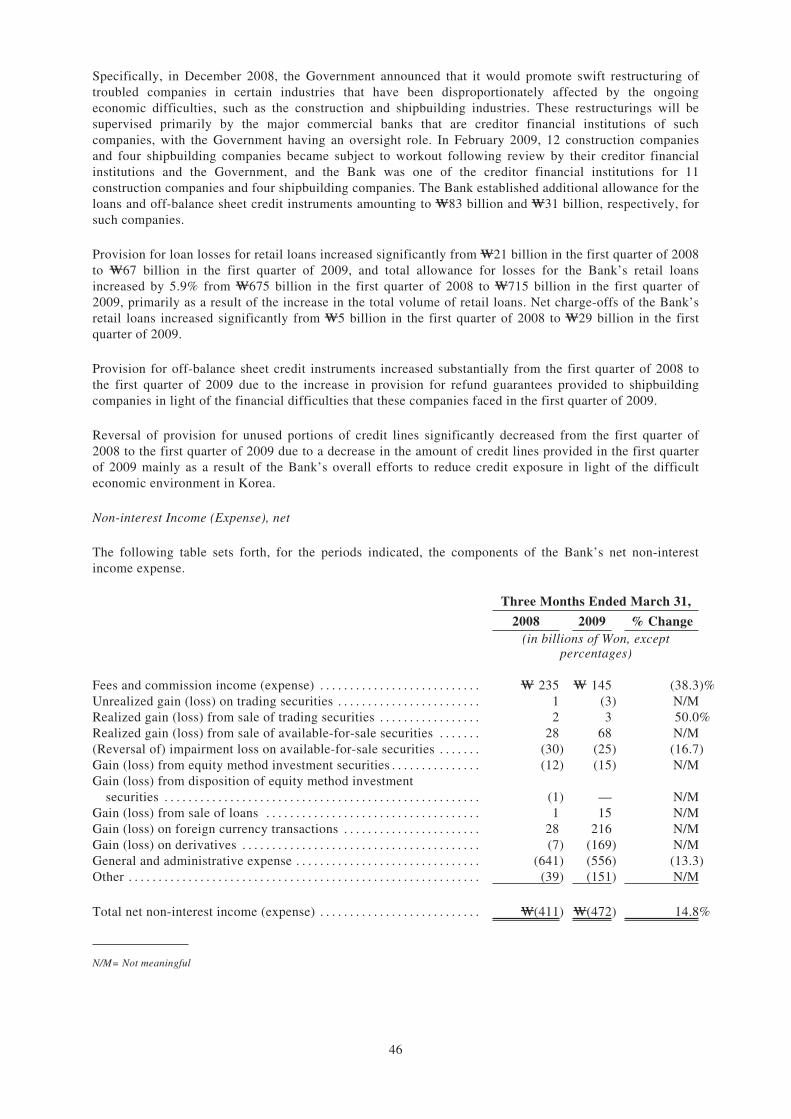
Specifically, in December 2008, the Government announced that it would promote swift restructuring oftroubled companies in certain industries that have been disproportionately affected by the ongoingeconomic difficulties, such as the construction and shipbuilding industries. These restructurings will besupervised primarily by the major commercial banks that are creditor financial institutions of suchcompanies, with the Government having an oversight role. In February 2009, 12 construction companiesand four shipbuilding companies became subject to workout following review by their creditor financialinstitutions and the Government, and the Bank was one of the creditor financial institutions for 11construction companies and four shipbuilding companies. The Bank established additional allowance for theloans and off-balance sheet credit instruments amounting to W83 billion and W31 billion, respectively, forsuch companies.
Provision for loan losses for retail loans increased significantly from W21 billion in the first quarter of 2008to W67 billion in the first quarter of 2009, and total allowance for losses for the Bank’s retail loansincreased by 5.9% from W675 billion in the first quarter of 2008 to W715 billion in the first quarter of2009, primarily as a result of the increase in the total volume of retail loans. Net charge-offs of the Bank’sretail loans increased significantly from W5 billion in the first quarter of 2008 to W29 billion in the firstquarter of 2009.
Provision for off-balance sheet credit instruments increased substantially from the first quarter of 2008 tothe first quarter of 2009 due to the increase in provision for refund guarantees provided to shipbuildingcompanies in light of the financial difficulties that these companies faced in the first quarter of 2009.
Reversal of provision for unused portions of credit lines significantly decreased from the first quarter of2008 to the first quarter of 2009 due to a decrease in the amount of credit lines provided in the first quarterof 2009 mainly as a result of the Bank’s overall efforts to reduce credit exposure in light of the difficulteconomic environment in Korea.
Non-interest Income (Expense), net
The following table sets forth, for the periods indicated, the components of the Bank’s net non-interestincome expense.
Three Months Ended March 31,
2008 2009 % Change(in billions of Won, except
percentages)
Fees and commission income (expense) . . . . . . . . . . . . . . . . . . . . . . . . . . . W 235 W 145 (38.3)%Unrealized gain (loss) on trading securities . . . . . . . . . . . . . . . . . . . . . . . . 1 (3) N/MRealized gain (loss) from sale of trading securities . . . . . . . . . . . . . . . . . 2 3 50.0%Realized gain (loss) from sale of available-for-sale securities . . . . . . . 28 68 N/M(Reversal of) impairment loss on available-for-sale securities . . . . . . . (30) (25) (16.7)Gain (loss) from equity method investment securities . . . . . . . . . . . . . . . (12) (15) N/MGain (loss) from disposition of equity method investment
securities . . . . . . . . . . . . . . . . . . . . . . . . . . . . . . . . . . . . . . . . . . . . . . . . . . . . . (1) — N/MGain (loss) from sale of loans . . . . . . . . . . . . . . . . . . . . . . . . . . . . . . . . . . . . 1 15 N/MGain (loss) on foreign currency transactions . . . . . . . . . . . . . . . . . . . . . . . 28 216 N/MGain (loss) on derivatives . . . . . . . . . . . . . . . . . . . . . . . . . . . . . . . . . . . . . . . . (7) (169) N/MGeneral and administrative expense . . . . . . . . . . . . . . . . . . . . . . . . . . . . . . . (641) (556) (13.3)Other . . . . . . . . . . . . . . . . . . . . . . . . . . . . . . . . . . . . . . . . . . . . . . . . . . . . . . . . . . . (39) (151) N/M
Total net non-interest income (expense) . . . . . . . . . . . . . . . . . . . . . . . . . . . W(411) W(472) 14.8%
N/M= Not meaningful
46
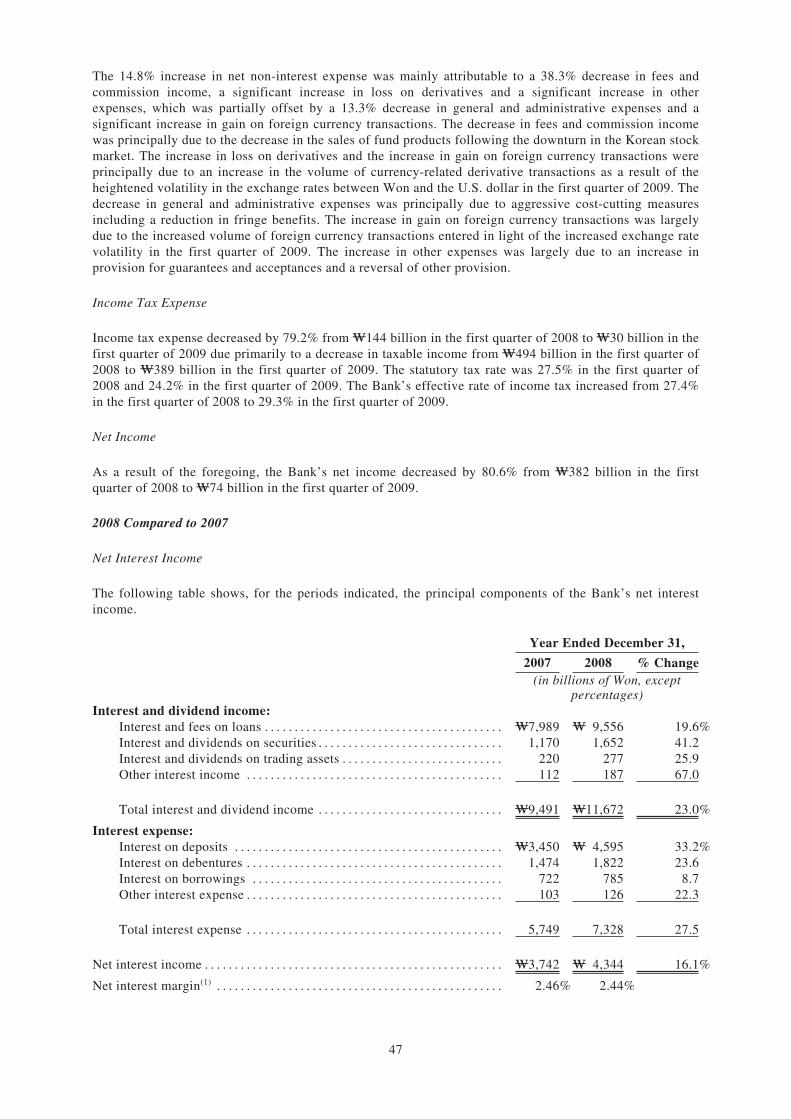
The 14.8% increase in net non-interest expense was mainly attributable to a 38.3% decrease in fees andcommission income, a significant increase in loss on derivatives and a significant increase in otherexpenses, which was partially offset by a 13.3% decrease in general and administrative expenses and asignificant increase in gain on foreign currency transactions. The decrease in fees and commission incomewas principally due to the decrease in the sales of fund products following the downturn in the Korean stockmarket. The increase in loss on derivatives and the increase in gain on foreign currency transactions wereprincipally due to an increase in the volume of currency-related derivative transactions as a result of theheightened volatility in the exchange rates between Won and the U.S. dollar in the first quarter of 2009. Thedecrease in general and administrative expenses was principally due to aggressive cost-cutting measuresincluding a reduction in fringe benefits. The increase in gain on foreign currency transactions was largelydue to the increased volume of foreign currency transactions entered in light of the increased exchange ratevolatility in the first quarter of 2009. The increase in other expenses was largely due to an increase inprovision for guarantees and acceptances and a reversal of other provision.
Income Tax Expense
Income tax expense decreased by 79.2% from W144 billion in the first quarter of 2008 to W30 billion in thefirst quarter of 2009 due primarily to a decrease in taxable income from W494 billion in the first quarter of2008 to W389 billion in the first quarter of 2009. The statutory tax rate was 27.5% in the first quarter of2008 and 24.2% in the first quarter of 2009. The Bank’s effective rate of income tax increased from 27.4%in the first quarter of 2008 to 29.3% in the first quarter of 2009.
Net Income
As a result of the foregoing, the Bank’s net income decreased by 80.6% from W382 billion in the firstquarter of 2008 to W74 billion in the first quarter of 2009.
2008 Compared to 2007
Net Interest Income
The following table shows, for the periods indicated, the principal components of the Bank’s net interestincome.
Year Ended December 31,
2007 2008 % Change(in billions of Won, except
percentages)Interest and dividend income:
Interest and fees on loans . . . . . . . . . . . . . . . . . . . . . . . . . . . . . . . . . . . . . . . . W7,989 W 9,556 19.6%Interest and dividends on securities . . . . . . . . . . . . . . . . . . . . . . . . . . . . . . . 1,170 1,652 41.2Interest and dividends on trading assets . . . . . . . . . . . . . . . . . . . . . . . . . . . 220 277 25.9Other interest income . . . . . . . . . . . . . . . . . . . . . . . . . . . . . . . . . . . . . . . . . . . 112 187 67.0
Total interest and dividend income . . . . . . . . . . . . . . . . . . . . . . . . . . . . . . . W9,491 W11,672 23.0%
Interest expense:Interest on deposits . . . . . . . . . . . . . . . . . . . . . . . . . . . . . . . . . . . . . . . . . . . . . W3,450 W 4,595 33.2%Interest on debentures . . . . . . . . . . . . . . . . . . . . . . . . . . . . . . . . . . . . . . . . . . . 1,474 1,822 23.6Interest on borrowings . . . . . . . . . . . . . . . . . . . . . . . . . . . . . . . . . . . . . . . . . . 722 785 8.7Other interest expense . . . . . . . . . . . . . . . . . . . . . . . . . . . . . . . . . . . . . . . . . . . 103 126 22.3
Total interest expense . . . . . . . . . . . . . . . . . . . . . . . . . . . . . . . . . . . . . . . . . . . 5,749 7,328 27.5
Net interest income . . . . . . . . . . . . . . . . . . . . . . . . . . . . . . . . . . . . . . . . . . . . . . . . . . W3,742 W 4,344 16.1%
Net interest margin(1) . . . . . . . . . . . . . . . . . . . . . . . . . . . . . . . . . . . . . . . . . . . . . . . . 2.46% 2.44%
47
Note:
(1) The ratio of net interest income to average interest-earning assets. See “— Average Balance and Volume and Rate Analysis—Average Balance Sheet and Related Interest”.
Interest and dividend income. The 23.0% increase in interest and dividend income is due primarily to a19.6% increase in interest and fees on loans.
The 19.6% increase in interest and fees on loans was due primarily to the following;
Š a 22.5% increase in interest and fees on corporate loans from W4,669 billion in 2007 to W5,719billion in 2008, which was due primarily to a 17.4% increase in the average balance of corporate loansfrom W72,590 billion in 2007 to W85,256 billion in 2008 and an increase by 28 basis points in theaverage yield on such loans from 6.43% in 2007 to 6.71% in 2008; and
Š a 15.6% increase in interest and fees on retail loans from W3,320 billion in 2007 to W3,837 billion in2008, which was due primarily to a 9.7% increase in the average balance of retail loans from W49,519billion in 2007 to W54,307 billion in 2008 and an increase by 37 basis points in the average yield onsuch loans from 6.70% in 2007 to 7.07% in 2008.
The increase in the average volume of corporate loans was primarily due to the continued increase inlending to small- and medium-sized enterprises in the first half of 2008 and increased lending to largecorporations compared to small- and medium-sized enterprises in the second half of 2008, which resultedfrom the Bank’s efforts to improve the asset quality of the Bank’s corporate loans in light of the downturnin the Korean economy in the second half of 2008. The increase in the average volume of retail loans wasprimarily due to the steady increase in mortgage and home lending, and to a lesser extent, increased lendingto professionals and other high income-earning individuals as part of a targeted marketing campaign in2008.
Overall, the average volume of the Bank’s loans increased by 14.3% from W122,109 billion in 2007 toW139,563 billion in 2008.
The increases in the yields of corporate loans and retail loans were largely due to the general increase inmarket interest rates in Korea in the second half of 2008 as a result of the global liquidity crisis.
The 41.2% increase in interest and dividends on securities was due primarily to an 18.1% increase in theaverage balance of securities from W24,688 billion in 2007 to W29,155 billion in 2008 and an increase by93 basis points in the average yield on securities from 4.74% in 2007 to 5.67% in 2008. The averagebalance of securities increased as a result of an increased purchase of securities in proportion to the increasein total assets. The increase in the average yield of securities was largely due to the general increase inmarket interest rates in Korea in the second half of 2008.
Interest expense. Interest expense increased by 27.5% from W5,749 billion in 2007 to W7,328 billion in2008, due primarily to a 33.2% increase in interest on deposits from W3,450 billion in 2007 to W4,595billion in 2008 and a 23.6% increase in interest on debentures from W1,474 billion in 2007 to W1,822billion in 2008.
The increase in interest expense on deposits in 2008 was primarily the result of an increase by 60 basispoints in the cost of interest-bearing deposits from 3.46% in 2007 to 4.06% in 2008 and a 13.5% increase inthe average volume of interest-bearing deposits from W99,611 billion in 2007 to W113,077 billion in 2008.
The principal reason for the increase in interest rates payable on the Bank’s interest-bearing deposits wasthe increase in interest rates payable on time and savings deposits. The average interest rate paid on theBank’s time and savings deposits, which accounted for 68.7% of its average interest-bearing deposits in
48
2008, increased by 71 basis points from 3.41% in 2007 to 4.12% in 2008. The average interest rate paid onother deposits, which accounted for 21.5% of the Bank’s average interest-bearing deposits in 2008,increased by 56 basis points from 4.52% in 2007 to 5.08% in 2008. The average interest rate paid ondemand deposits, which accounted for 9.8% of the Bank’s average interest-bearing deposits in 2008,increased by 4 basis points from 1.39% in 2007 to 1.43% in 2008.
The increase in the average volume of interest-bearing deposits was due primarily to an 18.8% increase inthe average volume of time and savings deposits from W65,371 billion in 2007 to W77,630 billion in 2008,and to a lesser extent, a 2.1% increase in the average volume of other deposits from W23,858 billion in2007 to W24,368 billion in 2008 and a 6.7% increase in the average volume of demand deposits fromW10,382 billion in 2007 to W11,079 billion in 2008. The increase in the average volume of time andsavings deposits and other deposits was largely due to the aggressive marketing of other deposits based onhigher interest rates in the second half of 2008 as part of the Bank’s funding strategy to meet increaseddemand for corporate loans in light of the global liquidity crisis in the second half of 2008.
The 23.6% increase in interest expense on debentures was primarily due to a 17.4% increase in the averagevolume of debentures from W27,106 billion in 2007 to W31,832 billion in 2008 and an increase by 28 basispoints in the average rate for debentures from 5.44% in 2007 to 5.72% in 2008. The 8.7% increase ininterest expense on borrowings was primarily due to a 18.7% increase in the average volume of borrowingsfrom W17,004 billion in 2007 to W20,188 billion in 2008, which was partially offset by a decrease by 36basis points in the average interest rates paid on the Bank’s borrowings from 4.25% in 2007 to 3.89% in2008.
Net interest margin. The Bank’s overall net interest margin decreased by 2 basis points from 2.46% in2007 to 2.44% in 2008, primarily due to a 17.3% increase in the average volume of its interest-earningassets from W152,086 billion in 2007 to W178,358 billion in 2008 and a decrease in net interest spread by13 basis points from 2.24% in 2007 to 2.11% in 2008, which was partially offset by a 16.1% increase in netinterest income from W3,742 billion in 2007 to W4,344 billion in 2008. The decrease in net interest spreadwas largely due to a relatively steeper increase in the Bank’s borrowing rates compared to the Bank’slending rates in 2008 as a result of the relatively longer average duration for the Bank’s interest-bearingliabilities compared to that for its interest-bearing assets.
Provision for Loan Losses
For a discussion of the Bank’s loan loss provisioning policy, see “Description of Assets and Liabilities —Loan Portfolio — Provisioning Policy”.
The Bank’s provision for loan losses significantly increased to W753 billion in 2008 from W422 billion in2007, primarily reflecting the deterioration in the overall asset quality of its corporate loans due to theeconomic downturn in Korea in 2008, and particularly as a result of additional allowances made forconstruction and shipbuilding companies that are being restructured under the supervision of creditorcommercial banks and the Government. Additional allowance for construction and shipbuilding companiesloans totaled W71 billion.
49
The following table sets forth, for the periods indicated, the components of provision for loan and othercredit losses by product type.
As of December 31,
2007 2008 % Change(in billions of Won, except percentages)
Total provision for loan losses:Corporate . . . . . . . . . . . . . . . . . . . . . . . . . . . . . . . . . . . . . . . . . . . . . . . . . . W308 W663 115.3%Retail . . . . . . . . . . . . . . . . . . . . . . . . . . . . . . . . . . . . . . . . . . . . . . . . . . . . . . 114 90 (21.1)
Subtotal (A) . . . . . . . . . . . . . . . . . . . . . . . . . . . . . . . . . . . . . . . . . . . . . . . . 422 753 78.4
Total (reversal of) provision for off-balance sheet creditinstruments:
Guarantees and acceptances . . . . . . . . . . . . . . . . . . . . . . . . . . . . . . . . . W 8 W 54 551.4Unused portions of corporate and retail credit line . . . . . . . . . . . . 128 (92) N/M
Subtotal (B) . . . . . . . . . . . . . . . . . . . . . . . . . . . . . . . . . . . . . . . . . . . . . . . . 136 (38) N/M
Total provision for credit losses (A+B) . . . . . . . . . . . . . . . . . . . . . . . . . . . W558 W715 27.9%
N/M= Not meaningful
Provision for loan losses for corporate loans increased by 115.3% from W308 billion in 2007 to W663billion in 2008, primarily as a result of an increase in impaired loans and deterioration in the asset quality ofthe Bank’s corporate loan portfolio as discussed above. For similar reasons, loan loss allowance against theBank’s corporate loans increased by 38.1% from W1,217 billion as of December 31, 2007 to W1,679 billionas of December 31, 2008. Net charge-offs of the Bank’s corporate loans increased significantly from W25billion in 2007 to W241 billion in 2008, the non-performing loan ratio for the Bank’s corporate loansincreased from 0.58% in 2007 to 0.63% in 2008, and the delinquency ratio for the Bank’s corporate loansalso increased from 0.78% in 2007 to 1.06% in 2008, primarily as a result of deterioration in asset quality ofcorporate loans as a result of the economic downturn in the second half of 2008. The non-performing loanratio measures the ratio of loans that are past due more than 90 days to the total loans. The non-performingloans are generally “substandard or below” under asset classifications under Financial Supervisory ServiceGuidelines, but are not necessarily the same. See “Description of Assets and Liabilities — Loan Portfolio— Provisioning Policy — Loan and Credit Classifications”.
Specifically, in December 2008, the Government announced that it would promote swift restructuring oftroubled companies in certain industries that have been disproportionately affected by the ongoingeconomic difficulties, such as construction and shipbuilding industries. These restructurings will besupervised primarily by the major commercial banks that are creditor financial institutions of suchcompanies, with the Government having an oversight role.
Provision for loan losses for retail loans decreased by 21.1% from W114 billion in 2007 to W90 billion in2008, and total allowance for losses for the Bank’s retail loans increased by 4.7% from W659 billion in2007 to W690 billion in 2008, primarily as a result of the increase in the total volume of retail loans. Netcharge-offs of the Bank’s retail loans decreased by 57.1% from W84 billion in 2007 to W36 billion in 2008,the non-performing loan ratio for the Bank’s retail loans decreased from 0.21% in 2007 to 0.17% in 2008,and the delinquency ratio for the Bank’s retail loans also decreased from 0.39% in 2007 to 0.35% in 2008,primarily as a result of improved asset quality in the home and mortgage loans, which comprise thesubstantial majority of the Bank retail loans, due to stricter lending policies involving more stringentloan-to-value and debt-to-income ratios applied in making such loans.
Provision for off-balance sheet credit instruments decreased substantially from 2007 to 2008 due to thedecrease in the amount of credit lines provided in 2008 mainly as a result of the Bank’s overall efforts toreduce credit exposure in light of the difficult economic environment in Korea.
50
Non-interest Income (Expense), net
The following table sets forth, for the periods indicated, the components of the Bank’s net non-interestincome and expense.
As of December 31,
2007 2008 % Change(in billions of Won, except percentages)
Fees and commission income . . . . . . . . . . . . . . . . . . . . . . . . . . . . . . . . . . W 889 W 776 (12.7)%Unrealized gain (loss) on trading securities . . . . . . . . . . . . . . . . . . . . . (8) 9 N/MRealized gain (loss) from sale of trading securities . . . . . . . . . . . . . . 5 (9) N/MRealized gain from sale of available-for-sale securities . . . . . . . . . . 1,035 117 (88.7)(Reversal of) impairment loss on available-for-sale securities . . . . 122 (114) N/MGain (loss) from equity method investment securities . . . . . . . . . . . . 94 56 (40.4)Gain (loss) from disposition of equity method investment
securities . . . . . . . . . . . . . . . . . . . . . . . . . . . . . . . . . . . . . . . . . . . . . . . . . . (136) 96 N/MGain from sale of loans . . . . . . . . . . . . . . . . . . . . . . . . . . . . . . . . . . . . . . . 38 4 (89.4)Gain on foreign currency transactions . . . . . . . . . . . . . . . . . . . . . . . . . . 163 482 N/MGain (loss) on derivatives . . . . . . . . . . . . . . . . . . . . . . . . . . . . . . . . . . . . . 122 (386) N/MGeneral and administrative expense . . . . . . . . . . . . . . . . . . . . . . . . . . . . (2,353) (2,117) (10.0)Other . . . . . . . . . . . . . . . . . . . . . . . . . . . . . . . . . . . . . . . . . . . . . . . . . . . . . . . . (399) (426) 6.8
Total net non-interest income (expenses) . . . . . . . . . . . . . . . . . . . . . . . W (428) W(1,512) N/M
N/M = Not meaningful
The significant increase in net non-interest expense was mainly attributable to a significant decrease inrealized gain from sale of available-for-sale securities and loss on derivatives in 2008 compared to gain onderivatives in 2007, which was partially offset by gain on foreign currency transactions. The decrease inrealized gain from sale of available-for-sale securities was principally due to the sale of the Bank’s interestin LG Card to Shinhan Financial Group in March 2007. The change from gain on derivatives to loss onderivatives was mainly due to a significant increase in the trading volume of foreign currency-relatedderivatives related to significant fluctuations in exchange rates between the Won and the U.S. dollar in2008.
Income Tax Expense
Income tax expense decreased by 43.3% from W804 billion in 2007 to W456 billion in 2008 due primarilyto a decrease in taxable income from W2,653 billion in 2007 to W2,123 billion in 2008. The statutory taxrate was 27.5% in both 2007 and 2008. The Bank’s effective rate of income tax decreased to 24.0% in 2008from 28.2% in 2007, due to the reduction in the future tax rate to be applied to deferred tax assets.
Net Income
As a result of the foregoing, the Bank’s net income decreased by 29.4% from W2,051 billion in 2007 toW1,447 billion in 2008.
51
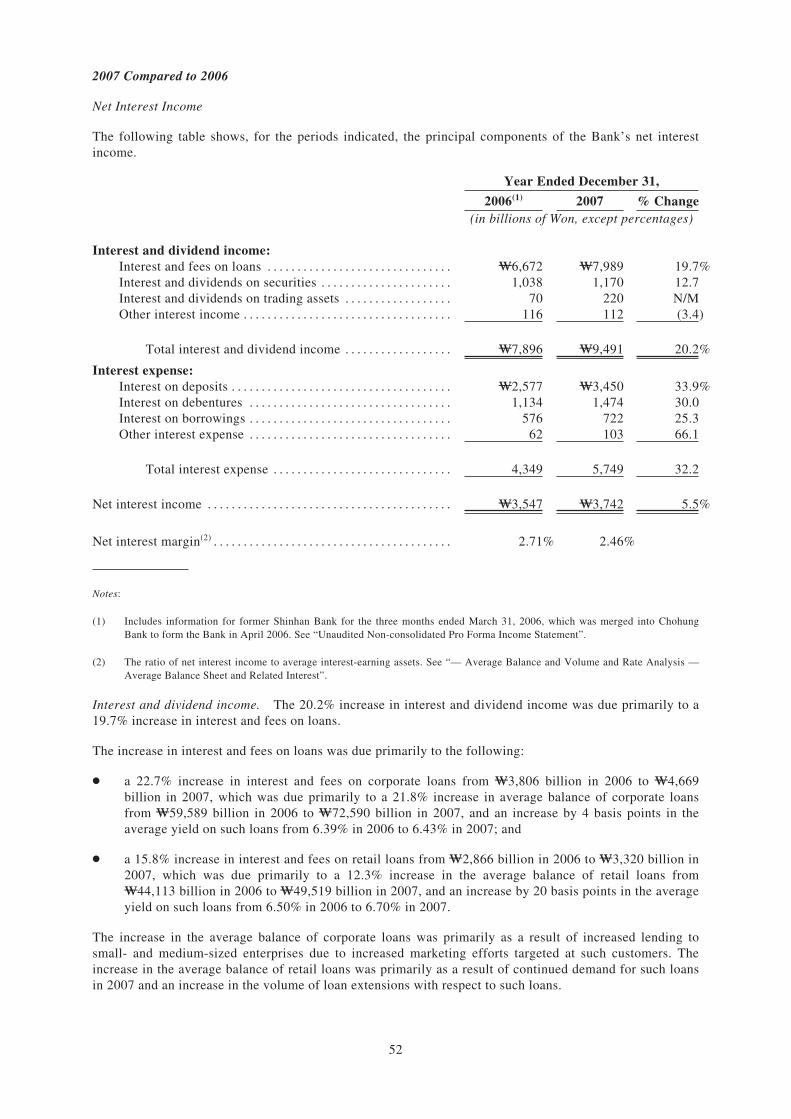
2007 Compared to 2006
Net Interest Income
The following table shows, for the periods indicated, the principal components of the Bank’s net interestincome.
Year Ended December 31,
2006(1) 2007 % Change(in billions of Won, except percentages)
Interest and dividend income:Interest and fees on loans . . . . . . . . . . . . . . . . . . . . . . . . . . . . . . . W6,672 W7,989 19.7%Interest and dividends on securities . . . . . . . . . . . . . . . . . . . . . . 1,038 1,170 12.7Interest and dividends on trading assets . . . . . . . . . . . . . . . . . . 70 220 N/MOther interest income . . . . . . . . . . . . . . . . . . . . . . . . . . . . . . . . . . . 116 112 (3.4)
Total interest and dividend income . . . . . . . . . . . . . . . . . . W7,896 W9,491 20.2%
Interest expense:Interest on deposits . . . . . . . . . . . . . . . . . . . . . . . . . . . . . . . . . . . . . W2,577 W3,450 33.9%Interest on debentures . . . . . . . . . . . . . . . . . . . . . . . . . . . . . . . . . . 1,134 1,474 30.0Interest on borrowings . . . . . . . . . . . . . . . . . . . . . . . . . . . . . . . . . . 576 722 25.3Other interest expense . . . . . . . . . . . . . . . . . . . . . . . . . . . . . . . . . . 62 103 66.1
Total interest expense . . . . . . . . . . . . . . . . . . . . . . . . . . . . . . 4,349 5,749 32.2
Net interest income . . . . . . . . . . . . . . . . . . . . . . . . . . . . . . . . . . . . . . . . . W3,547 W3,742 5.5%
Net interest margin(2) . . . . . . . . . . . . . . . . . . . . . . . . . . . . . . . . . . . . . . . . 2.71% 2.46%
Notes:
(1) Includes information for former Shinhan Bank for the three months ended March 31, 2006, which was merged into ChohungBank to form the Bank in April 2006. See “Unaudited Non-consolidated Pro Forma Income Statement”.
(2) The ratio of net interest income to average interest-earning assets. See “— Average Balance and Volume and Rate Analysis —Average Balance Sheet and Related Interest”.
Interest and dividend income. The 20.2% increase in interest and dividend income was due primarily to a19.7% increase in interest and fees on loans.
The increase in interest and fees on loans was due primarily to the following:
Š a 22.7% increase in interest and fees on corporate loans from W3,806 billion in 2006 to W4,669billion in 2007, which was due primarily to a 21.8% increase in average balance of corporate loansfrom W59,589 billion in 2006 to W72,590 billion in 2007, and an increase by 4 basis points in theaverage yield on such loans from 6.39% in 2006 to 6.43% in 2007; and
Š a 15.8% increase in interest and fees on retail loans from W2,866 billion in 2006 to W3,320 billion in2007, which was due primarily to a 12.3% increase in the average balance of retail loans fromW44,113 billion in 2006 to W49,519 billion in 2007, and an increase by 20 basis points in the averageyield on such loans from 6.50% in 2006 to 6.70% in 2007.
The increase in the average balance of corporate loans was primarily as a result of increased lending tosmall- and medium-sized enterprises due to increased marketing efforts targeted at such customers. Theincrease in the average balance of retail loans was primarily as a result of continued demand for such loansin 2007 and an increase in the volume of loan extensions with respect to such loans.
52
Overall, the average balance of the Bank’s loans increased by 17.8% from W103,702 billion in 2006 toW122,109 billion in 2007.
The increase in the average yields for corporate loans and retail loans was primarily due to the general risein market interest rates in Korea from 2006 to 2007.
Interest expense. Interest expense increased by 32.2% from W4,349 billion in 2006 to W5,749 billion in2007, due primarily to a 33.9% increase in interest on deposits from W2,577 billion in 2006 to W3,450billion in 2007 and a 30.0% increase in interest on debentures from W1,134 billion in 2006 to W1,474billion in 2007.
The increase in interest expense on deposits in 2007 was primarily the result of a 16.8% increase in theaverage volume of interest-bearing deposits from W85,283 billion in 2006 to W99,611 billion in 2007 andan increase by 44 basis points in the cost of interest-bearing deposits from 3.02% in 2006 to 3.46% in 2007.
The 30.0% increase in interest expense on debentures was primarily due to a 23.0% increase in the averagevolume of debentures from W23,037 billion in 2006 to W27,106 billion in 2007, which mainly resultedfrom the increased issuance of foreign long-term debt by the Bank to take advantage of lower funding costsin the low exchange rate environment in 2007, and an increase by 29 basis points in the average interest ratepaid on the Bank’s debentures from 5.15% in 2006 to 5.44% in 2007, primarily as a result of the generalincrease in the average market interest rate in 2007.
The 25.3% increase in interest expense on borrowings was primarily due to a 3.2% increase in the averagevolume of borrowings from W16,483 billion in 2006 to W17,004 billion in 2007, which mainly resultedfrom an increase by 76 basis points in the average interest rate paid on the Bank’s borrowings from 3.49%in 2006 to 4.25% in 2007, primarily as a result of the general increase in the average market interest rate in2007 and the increased issuance of foreign long-term debt by the Bank to take advantage of lower fundingcosts based on Won appreciation in 2007.
Net interest margin. The Bank’s overall net interest margin decreased by 25 basis points from 2.71% in2006 to 2.46% in 2007, primarily due to a 16.2% increase in the average volume of the Bank’s interestearning assets from W130,894 billion in 2006 to W152,086 billion in 2007, which was partially offset by a5.5% increase in net interest income from W3,547 billion in 2006 to W3,742 billion in 2007.
Provision For Loan Losses
For a discussion of the Bank’s loan loss provisioning policy, see “Description of Assets and Liabilities —Loan Portfolio — Provisioning Policy”.
The Bank’s provision for loan losses increased by 9.6% to W422 billion in 2007 from W385 billion in2006, primarily as a result of the increase in provision for loan losses of corporate loans, which waspartially offset by an improvement in the overall asset quality of the Bank’s loan resulting from the relativepaucity of problem loans in the retail sector compared to prior years and the implementation of stricter loanreview process.
53
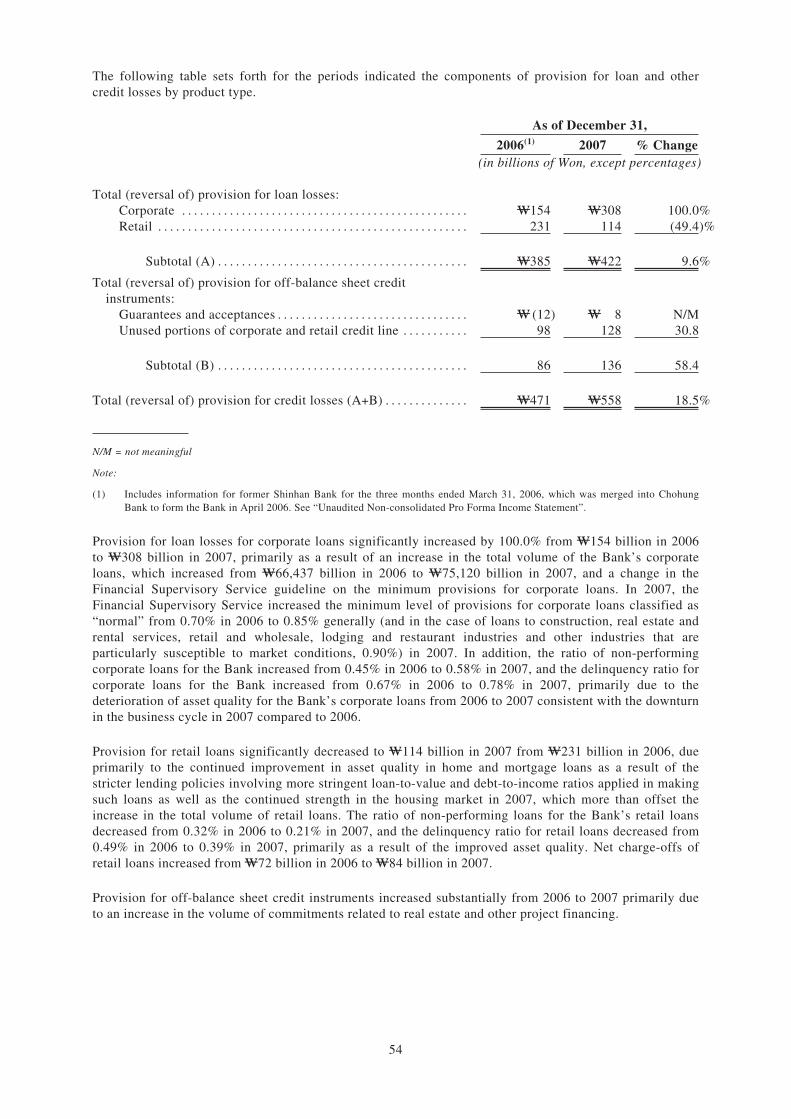
The following table sets forth for the periods indicated the components of provision for loan and othercredit losses by product type.
As of December 31,
2006(1) 2007 % Change(in billions of Won, except percentages)
Total (reversal of) provision for loan losses:Corporate . . . . . . . . . . . . . . . . . . . . . . . . . . . . . . . . . . . . . . . . . . . . . . . . W154 W308 100.0%Retail . . . . . . . . . . . . . . . . . . . . . . . . . . . . . . . . . . . . . . . . . . . . . . . . . . . . 231 114 (49.4)%
Subtotal (A) . . . . . . . . . . . . . . . . . . . . . . . . . . . . . . . . . . . . . . . . . . W385 W422 9.6%
Total (reversal of) provision for off-balance sheet creditinstruments:
Guarantees and acceptances . . . . . . . . . . . . . . . . . . . . . . . . . . . . . . . . W (12) W 8 N/MUnused portions of corporate and retail credit line . . . . . . . . . . . 98 128 30.8
Subtotal (B) . . . . . . . . . . . . . . . . . . . . . . . . . . . . . . . . . . . . . . . . . . 86 136 58.4
Total (reversal of) provision for credit losses (A+B) . . . . . . . . . . . . . . W471 W558 18.5%
N/M = not meaningful
Note:
(1) Includes information for former Shinhan Bank for the three months ended March 31, 2006, which was merged into ChohungBank to form the Bank in April 2006. See “Unaudited Non-consolidated Pro Forma Income Statement”.
Provision for loan losses for corporate loans significantly increased by 100.0% from W154 billion in 2006to W308 billion in 2007, primarily as a result of an increase in the total volume of the Bank’s corporateloans, which increased from W66,437 billion in 2006 to W75,120 billion in 2007, and a change in theFinancial Supervisory Service guideline on the minimum provisions for corporate loans. In 2007, theFinancial Supervisory Service increased the minimum level of provisions for corporate loans classified as“normal” from 0.70% in 2006 to 0.85% generally (and in the case of loans to construction, real estate andrental services, retail and wholesale, lodging and restaurant industries and other industries that areparticularly susceptible to market conditions, 0.90%) in 2007. In addition, the ratio of non-performingcorporate loans for the Bank increased from 0.45% in 2006 to 0.58% in 2007, and the delinquency ratio forcorporate loans for the Bank increased from 0.67% in 2006 to 0.78% in 2007, primarily due to thedeterioration of asset quality for the Bank’s corporate loans from 2006 to 2007 consistent with the downturnin the business cycle in 2007 compared to 2006.
Provision for retail loans significantly decreased to W114 billion in 2007 from W231 billion in 2006, dueprimarily to the continued improvement in asset quality in home and mortgage loans as a result of thestricter lending policies involving more stringent loan-to-value and debt-to-income ratios applied in makingsuch loans as well as the continued strength in the housing market in 2007, which more than offset theincrease in the total volume of retail loans. The ratio of non-performing loans for the Bank’s retail loansdecreased from 0.32% in 2006 to 0.21% in 2007, and the delinquency ratio for retail loans decreased from0.49% in 2006 to 0.39% in 2007, primarily as a result of the improved asset quality. Net charge-offs ofretail loans increased from W72 billion in 2006 to W84 billion in 2007.
Provision for off-balance sheet credit instruments increased substantially from 2006 to 2007 primarily dueto an increase in the volume of commitments related to real estate and other project financing.
54
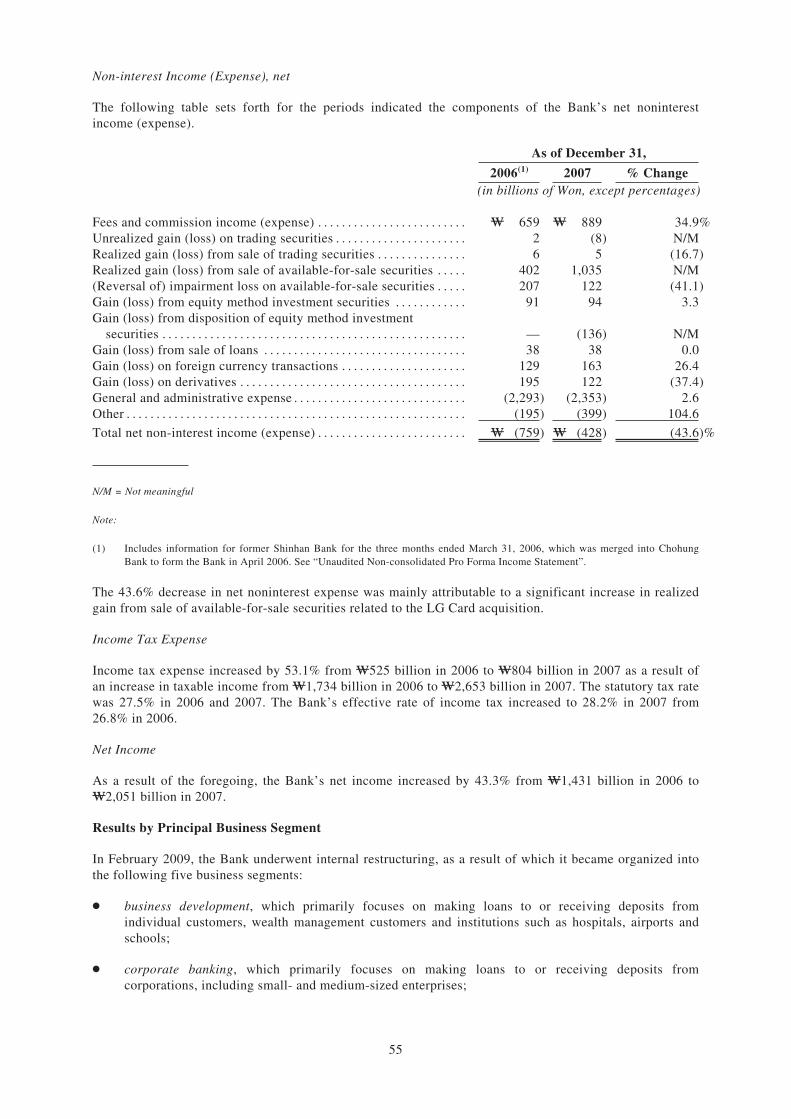
Non-interest Income (Expense), net
The following table sets forth for the periods indicated the components of the Bank’s net noninterestincome (expense).
As of December 31,
2006(1) 2007 % Change(in billions of Won, except percentages)
Fees and commission income (expense) . . . . . . . . . . . . . . . . . . . . . . . . . W 659 W 889 34.9%Unrealized gain (loss) on trading securities . . . . . . . . . . . . . . . . . . . . . . 2 (8) N/MRealized gain (loss) from sale of trading securities . . . . . . . . . . . . . . . 6 5 (16.7)Realized gain (loss) from sale of available-for-sale securities . . . . . 402 1,035 N/M(Reversal of) impairment loss on available-for-sale securities . . . . . 207 122 (41.1)Gain (loss) from equity method investment securities . . . . . . . . . . . . 91 94 3.3Gain (loss) from disposition of equity method investment
securities . . . . . . . . . . . . . . . . . . . . . . . . . . . . . . . . . . . . . . . . . . . . . . . . . . . — (136) N/MGain (loss) from sale of loans . . . . . . . . . . . . . . . . . . . . . . . . . . . . . . . . . . 38 38 0.0Gain (loss) on foreign currency transactions . . . . . . . . . . . . . . . . . . . . . 129 163 26.4Gain (loss) on derivatives . . . . . . . . . . . . . . . . . . . . . . . . . . . . . . . . . . . . . . 195 122 (37.4)General and administrative expense . . . . . . . . . . . . . . . . . . . . . . . . . . . . . (2,293) (2,353) 2.6Other . . . . . . . . . . . . . . . . . . . . . . . . . . . . . . . . . . . . . . . . . . . . . . . . . . . . . . . . . (195) (399) 104.6
Total net non-interest income (expense) . . . . . . . . . . . . . . . . . . . . . . . . . W (759) W (428) (43.6)%
N/M = Not meaningful
Note:
(1) Includes information for former Shinhan Bank for the three months ended March 31, 2006, which was merged into ChohungBank to form the Bank in April 2006. See “Unaudited Non-consolidated Pro Forma Income Statement”.
The 43.6% decrease in net noninterest expense was mainly attributable to a significant increase in realizedgain from sale of available-for-sale securities related to the LG Card acquisition.
Income Tax Expense
Income tax expense increased by 53.1% from W525 billion in 2006 to W804 billion in 2007 as a result ofan increase in taxable income from W1,734 billion in 2006 to W2,653 billion in 2007. The statutory tax ratewas 27.5% in 2006 and 2007. The Bank’s effective rate of income tax increased to 28.2% in 2007 from26.8% in 2006.
Net Income
As a result of the foregoing, the Bank’s net income increased by 43.3% from W1,431 billion in 2006 toW2,051 billion in 2007.
Results by Principal Business Segment
In February 2009, the Bank underwent internal restructuring, as a result of which it became organized intothe following five business segments:
Š business development, which primarily focuses on making loans to or receiving deposits fromindividual customers, wealth management customers and institutions such as hospitals, airports andschools;
Š corporate banking, which primarily focuses on making loans to or receiving deposits fromcorporations, including small- and medium-sized enterprises;
55
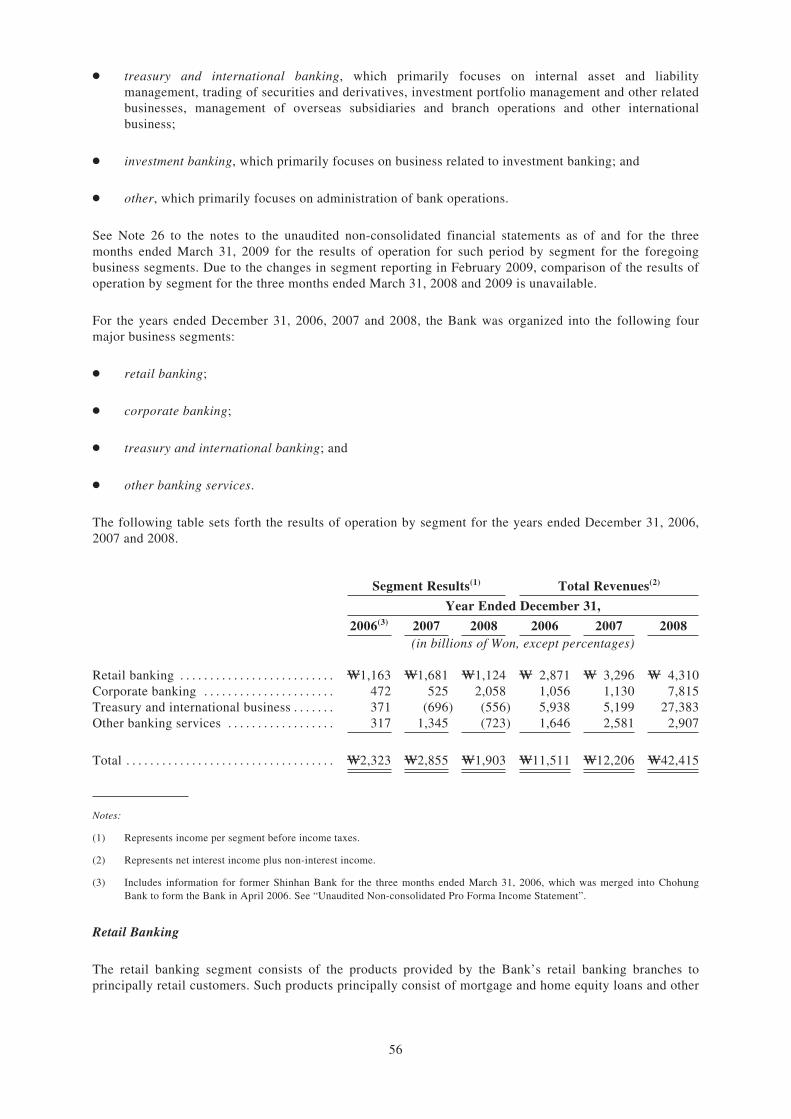
Š treasury and international banking, which primarily focuses on internal asset and liabilitymanagement, trading of securities and derivatives, investment portfolio management and other relatedbusinesses, management of overseas subsidiaries and branch operations and other internationalbusiness;
Š investment banking, which primarily focuses on business related to investment banking; and
Š other, which primarily focuses on administration of bank operations.
See Note 26 to the notes to the unaudited non-consolidated financial statements as of and for the threemonths ended March 31, 2009 for the results of operation for such period by segment for the foregoingbusiness segments. Due to the changes in segment reporting in February 2009, comparison of the results ofoperation by segment for the three months ended March 31, 2008 and 2009 is unavailable.
For the years ended December 31, 2006, 2007 and 2008, the Bank was organized into the following fourmajor business segments:
Š retail banking;
Š corporate banking;
Š treasury and international banking; and
Š other banking services.
The following table sets forth the results of operation by segment for the years ended December 31, 2006,2007 and 2008.
Segment Results(1) Total Revenues(2)
Year Ended December 31,
2006(3) 2007 2008 2006 2007 2008(in billions of Won, except percentages)
Retail banking . . . . . . . . . . . . . . . . . . . . . . . . . . W1,163 W1,681 W1,124 W 2,871 W 3,296 W 4,310Corporate banking . . . . . . . . . . . . . . . . . . . . . . 472 525 2,058 1,056 1,130 7,815Treasury and international business . . . . . . . 371 (696) (556) 5,938 5,199 27,383Other banking services . . . . . . . . . . . . . . . . . . 317 1,345 (723) 1,646 2,581 2,907
Total . . . . . . . . . . . . . . . . . . . . . . . . . . . . . . . . . . . W2,323 W2,855 W1,903 W11,511 W12,206 W42,415
Notes:
(1) Represents income per segment before income taxes.
(2) Represents net interest income plus non-interest income.
(3) Includes information for former Shinhan Bank for the three months ended March 31, 2006, which was merged into ChohungBank to form the Bank in April 2006. See “Unaudited Non-consolidated Pro Forma Income Statement”.
Retail Banking
The retail banking segment consists of the products provided by the Bank’s retail banking branches toprincipally retail customers. Such products principally consist of mortgage and home equity loans and other
56
consumer loans, deposits and other savings products, as well as corporate loans provided to smallbusinesses. The table below provides the income statement data for the retail banking segment for theperiods indicated.
Year Ended December 31, % Change
2006(1) 2007 2008 2006/2007 2007/2008(in billions of Won, except percentages)
Income statement dataNet interest income . . . . . . . . . . . . . . . . . . . . . . . . . . . . . . W2,274 W2,328 W2,311 2.4% (0.7)%Noninterest income . . . . . . . . . . . . . . . . . . . . . . . . . . . . . . 597 968 1,999 62.1 106.5
Total revenues . . . . . . . . . . . . . . . . . . . . . . . . . . . . . . . . . . 2,871 3,296 4,310 14.8 30.8Provision (reversal) for loan losses . . . . . . . . . . . . . . . 291 222 362 (23.7) 63.1Noninterest expense including depreciation and
amortization . . . . . . . . . . . . . . . . . . . . . . . . . . . . . . . . . . 1,417 1,393 2,824 (1.7) 102.7
Segment results(2) . . . . . . . . . . . . . . . . . . . . . . . . . . . . . . . W1,163 W1,681 W1,124 44.5% (33.1)%
Notes:
(1) Includes information for former Shinhan Bank for the months ended March 31, 2006, which was merged into Chohung Bank toform the Bank in April 2006. See “Unaudited Non-consolidated Pro Forma Income Statement”.
(2) Net income per segment before income taxes.
Comparison of 2008 to 2007
The overall segment results for retail banking decreased by 33.1% from W1,681 billion in 2007 toW1,124 billion in 2008.
Net interest income decreased by 0.7% due primarily to a decrease in net interest margin, while the averagevolume of lending to individuals and households remained relatively stable. The decrease in net interestmargin in 2008 was due primarily to the relatively higher rise in the borrowing rates as a result of the globalliquidity crisis in the second half of 2008 compared to the lending rates which are pegged to a base ratedetermined by the Government, which declined in the second half of 2008 as part of the government effortto increase liquidity in the market.
Non-interest income increased by 106.5% due primarily to an increase in fees from an increased volume ofderivatives transactions related to interest rate hedging undertaken for funding for retail loans, which morethan offset an decrease in fees and commissions from the sales of investment fund products arising from thedownturn in the Korean stock market in the second half of 2008.
Provision for loan losses increased by 63.1% due primarily to the increase in corporate loans provided bythe Bank’s retail banking branches to small businesses, the asset quality of which deteriorated.
Non-interest expense including depreciation and amortization increased by 102.7% due primarily to thereturn of deposits held in accounts which have been dormant for more than five years pursuant to newregulatory requirements and mandatory contributions made to the court deposit management commission, aswell as an increase in expenses related to the increased volume of derivatives transactions.
Comparison of 2007 to 2006
The overall segment results for retail banking increased by 44.5% from W1,163 billion in 2006 toW1,681 billion in 2007.
Net interest income increased by 2.4% due primarily to the increase in the Bank’s interest rate in line withthe general rise of market interests in Korea and the increase in the average volume of lending toindividuals and households as a result of greater consumer demand for retail loans.
57
Non-interest income increased by 62.1% due primarily to the increase in the fees and commissions from thesales of investment fund products, which gained popularity among consumers in 2007 due to the bullishstock market in Korea.
Provision for loan losses on retail loans decreased by 23.7% due primarily to the non-recurrence ofadditional provisioning the Bank was required to undertake in 2006 to meet the new minimum requiredprovisioning levels established by the Financial Services Commission for retail loans, as well as the overallimprovement in the asset quality of the Bank’s retail loan portfolio, which more than offset the effect fromthe increase in the total volume of retail lending.
Noninterest expense including depreciation and amortization decreased by 1.7% due primarily to thenon-occurrence of fees related to credit card services performed by Chohung Bank in 2006 prior to thesplit-off of Chohung Bank’s credit card division in April 2006.
Corporate Banking
The corporate banking segment consists of the products provided by the Bank’s corporate banking branchesprincipally to corporate customers, most of which are small- and medium-sized enterprises, chaebols andpublic enterprises. Activities within the segment include providing loans, overdrafts and other creditfacilities and procuring deposits. The table below provides the income statement data for the corporatebanking segment for the periods indicated.
Year Ended December 31, % Change
2006(1) 2007 2008 2006/2007 2007/2008(in billions of Won, except percentages)
Income statement dataNet interest income . . . . . . . . . . . . . . . . . . . . . . . . . . . . . . W 833 W 864 W2,476 3.7% 186.6%Non-interest income . . . . . . . . . . . . . . . . . . . . . . . . . . . . . 223 266 5,339 19.3 N/M
Total revenues . . . . . . . . . . . . . . . . . . . . . . . . . . . . . . . . . . 1,056 1,130 7,815 7.0 N/MProvision (reversal) for loan losses . . . . . . . . . . . . . . . 142 137 326 (3.5) 138.0Non-interest expense including depreciation and
amortization . . . . . . . . . . . . . . . . . . . . . . . . . . . . . . . . . . 442 468 5,431 5.9 N/M
Segment results(2) . . . . . . . . . . . . . . . . . . . . . . . . . . . . . . . W 472 W 525 W2,058 11.2% N/M
N/M = not meaningful
Notes:
(1) Includes information for former Shinhan Bank for the three months ended March 31, 2006, which was merged into ChohungBank to form the Bank in April 2006. See “Unaudited Non-consolidated Pro Forma Income Statement”.
(2) Net income per segment before income taxes.
Comparison of 2008 to 2007
The overall segment results for corporate banking improved significantly from W525 billion in 2007 toW2,058 billion in 2008.
Net interest income increased significantly due primarily to an increase in the volume of corporate lendingdue principally to increased reliance by large corporations on loans from banks for funding in light of thetightened liquidity in the credit markets in the second half of 2008 and the Bank’s marketing campaigns toattract high-quality corporate borrowers.
58
Noninterest income increased significantly, due primarily to an increase in the sales volume of foreigncurrency-related derivatives as a result of an increase in volatility in exchange rates and an enlargedexposure to naked currency positions among the Bank’s customers.
Provision for loan losses on corporate loans increased significantly, mainly as a result of additionalallowance made for troubled construction and shipbuilding companies and the deterioration in asset qualityfor corporate loans.
Non-interest expense including depreciation and amortization increased significantly, due primarily to anincrease in the sales volume of foreign currency-related derivatives.
Comparison of 2007 to 2006
The overall segment results for corporate banking increased by 11.2% from W472 billion in 2006 toW525 billion in 2007.
Net interest income increased by 3.7% due primarily to the increase in the average volume of lending tocorporate customers, particularly small- and medium-sized enterprises, following aggressive marketing tothis segment, which more than offset the increase in funding costs related to the increasing flight ofcustomer funds from depositary bank accounts to investment fund products.
Non-interest income increased by 19.3% due primarily to valuation loss of currency forwards as a result ofWon appreciation compared to other currencies.
Provision for loan losses on corporate loans decreased by 3.5% due primarily to a decrease in charge-offsand an increase in recoveries of charged-off loans.
Noninterest expense including depreciation and amortization increased by 5.9% due primarily to theincrease in the number of employees related to new hiring, the increased depreciation and amortizationexpenses related to the integration of the information technology systems of former Shinhan Bank andChohung Bank in 2006 and valuation gains of currency forwards as a result of Won appreciation comparedto other currencies.
Treasury and International Banking
The treasury and international business segment consists primarily of the Bank’s business of trading of, andinvestment in, debt securities and, to a lesser extent, in equity securities for its own accounts, handling itstreasury activities such as correspondence banking, and entering into derivatives transactions. The tablebelow provides the income statement data for the treasury and international banking segment for the periodsindicated.
Year Ended December 31, % Change
2006(1) 2007 2008 2006/2007 2007/2008(in billions of Won, except percentages)
Income statement dataNet interest income (expense) . . . . . . . . . . . . . . . . . . . W (172) W (265) W (578) 54.1% 118.1%Non-interest income . . . . . . . . . . . . . . . . . . . . . . . . . . . . 6,110 5,464 27,961 (10.6) N/M
Total revenues . . . . . . . . . . . . . . . . . . . . . . . . . . . . . . . . . 5,938 5,199 27,383 (12.4) N/MProvision (reversal) for loan losses . . . . . . . . . . . . . . (13) 38 (4) N/M (110.5)Non-interest expense including depreciation and
amortization . . . . . . . . . . . . . . . . . . . . . . . . . . . . . . . . . 5,580 5,857 27,943 5.0% N/M
Segment results(2) . . . . . . . . . . . . . . . . . . . . . . . . . . . . . . W 371 W (696) W (556) N/M (20.1)%
N/M = not meaningful
Notes:
(1) Includes information for former Shinhan Bank for the three months ended March 31, 2006, which was merged into ChohungBank to form the Bank in April 2006. See “Unaudited Non-consolidated Pro Forma Income Statement”.
(2) Net income per segment before income taxes.
59
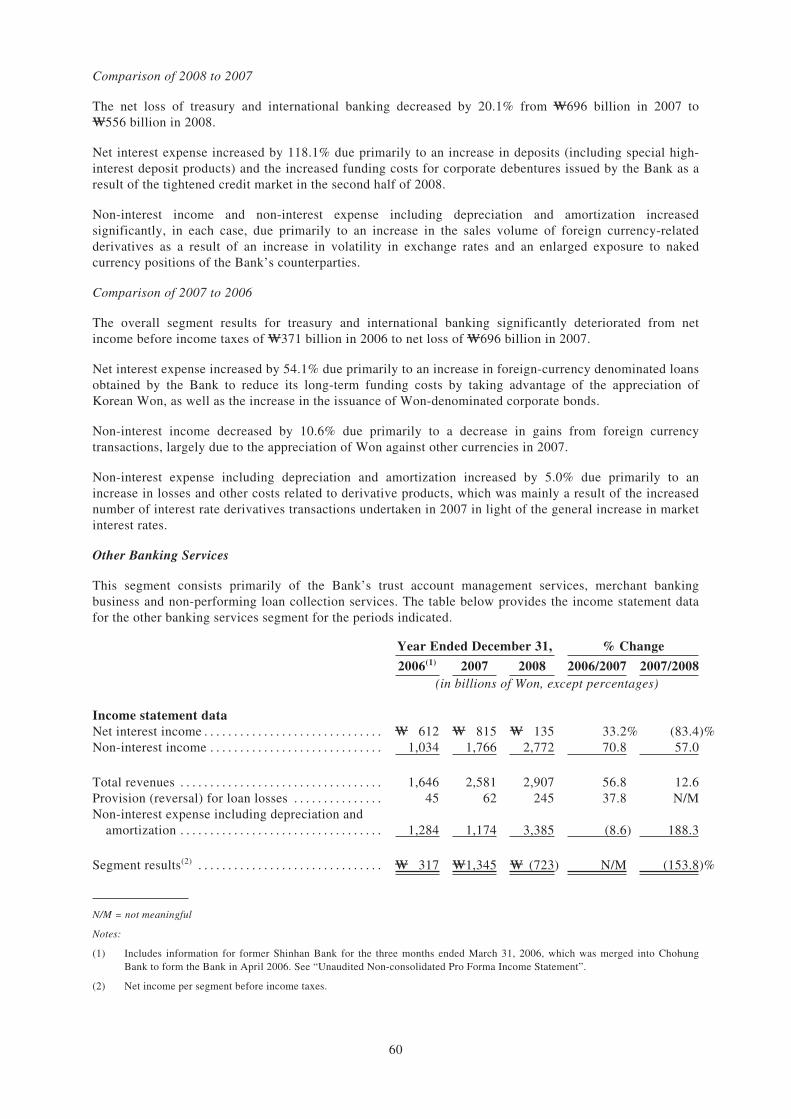
Comparison of 2008 to 2007
The net loss of treasury and international banking decreased by 20.1% from W696 billion in 2007 toW556 billion in 2008.
Net interest expense increased by 118.1% due primarily to an increase in deposits (including special high-interest deposit products) and the increased funding costs for corporate debentures issued by the Bank as aresult of the tightened credit market in the second half of 2008.
Non-interest income and non-interest expense including depreciation and amortization increasedsignificantly, in each case, due primarily to an increase in the sales volume of foreign currency-relatedderivatives as a result of an increase in volatility in exchange rates and an enlarged exposure to nakedcurrency positions of the Bank’s counterparties.
Comparison of 2007 to 2006
The overall segment results for treasury and international banking significantly deteriorated from netincome before income taxes of W371 billion in 2006 to net loss of W696 billion in 2007.
Net interest expense increased by 54.1% due primarily to an increase in foreign-currency denominated loansobtained by the Bank to reduce its long-term funding costs by taking advantage of the appreciation ofKorean Won, as well as the increase in the issuance of Won-denominated corporate bonds.
Non-interest income decreased by 10.6% due primarily to a decrease in gains from foreign currencytransactions, largely due to the appreciation of Won against other currencies in 2007.
Non-interest expense including depreciation and amortization increased by 5.0% due primarily to anincrease in losses and other costs related to derivative products, which was mainly a result of the increasednumber of interest rate derivatives transactions undertaken in 2007 in light of the general increase in marketinterest rates.
Other Banking Services
This segment consists primarily of the Bank’s trust account management services, merchant bankingbusiness and non-performing loan collection services. The table below provides the income statement datafor the other banking services segment for the periods indicated.
Year Ended December 31, % Change
2006(1) 2007 2008 2006/2007 2007/2008(in billions of Won, except percentages)
Income statement dataNet interest income . . . . . . . . . . . . . . . . . . . . . . . . . . . . . . W 612 W 815 W 135 33.2% (83.4)%Non-interest income . . . . . . . . . . . . . . . . . . . . . . . . . . . . . 1,034 1,766 2,772 70.8 57.0
Total revenues . . . . . . . . . . . . . . . . . . . . . . . . . . . . . . . . . . 1,646 2,581 2,907 56.8 12.6Provision (reversal) for loan losses . . . . . . . . . . . . . . . 45 62 245 37.8 N/MNon-interest expense including depreciation and
amortization . . . . . . . . . . . . . . . . . . . . . . . . . . . . . . . . . . 1,284 1,174 3,385 (8.6) 188.3
Segment results(2) . . . . . . . . . . . . . . . . . . . . . . . . . . . . . . . W 317 W1,345 W (723) N/M (153.8)%
N/M = not meaningful
Notes:
(1) Includes information for former Shinhan Bank for the three months ended March 31, 2006, which was merged into ChohungBank to form the Bank in April 2006. See “Unaudited Non-consolidated Pro Forma Income Statement”.
(2) Net income per segment before income taxes.
60
For segment reporting purposes, each segment result reflects provision for loan losses that are allocatedbased on the ending balances of loans for each segment in order to show a meaningful comparison ofperformance within such segment and compared to other segments. In other banking segment, provision(reversal) for loan losses amounted to W45 billion, W62 billion and W245 billion in 2006, 2007 and 2008,respectively.
The Bank frequently issues subordinated debt securities, which carry interest rates that are higher thanmarket interest rates. As subordinated debt securities have the overall effect of improving the Bank’s capitaladequacy and benefit the Bank in its entirety, the management believes it is inappropriate to allocate thehigher costs associated with issuing subordinated debt to a particular business segment. Accordingly, theBank allocates and reflects the difference between the higher costs associated with subordinated debt andmarket interest rates in this segment as interest expenses.
Comparison of 2008 to 2007
The overall segment results for other banking deteriorated significantly from net income of W1,345 billionin 2007 to net loss of W723 billion in 2008.
The Bank recorded net interest expense in 2008 compared to net interest income in 2007 due primarily to anaggressive marketing campaign to sell high interest-bearing deposit products to its corporate customers,which more than offset the increase in interest income from increased lending to large corporate borrowers.
Non-interest income increased by 57.0% due primarily to an increase in gains from foreign currencyderivative transactions, which largely resulted from the increased volume of such transactions due to thewide fluctuations in the exchange rates between Korean Won and the U.S. dollar.
Non-interest expense including depreciation and amortization increased significantly due primarily to anincrease in losses from foreign currency derivative transactions, which largely resulted from the increasedvolume of such transactions due to the wide fluctuations in the exchange rates between Korean Won and theU.S. dollar.
Comparison of 2007 to 2006
The overall segment results for other banking increased significantly from W317 billion in 2006 toW1,345 billion in 2007.
Net interest income increased by 33.2% due primarily to an increase in interest earned on commercialpapers and debentures, which was partially offset by an increase in interests payable on certificates ofdeposit and other time deposits.
Non-interest income increased by 70.8% due primarily to an increase in gains from the disposition ofavailable-for-sale securities as a result of the change in the accounting method into an equity accountingmethod for the 7.15% equity interest previously held by the Bank prior to the acquisition of the controllingequity interest in LG Card in March 2007.
Non-interest expense including depreciation and amortization decreased by 8.6% due primarily to theabsence in 2007 in impairment in available-for-sale securities recorded in 2006.
61
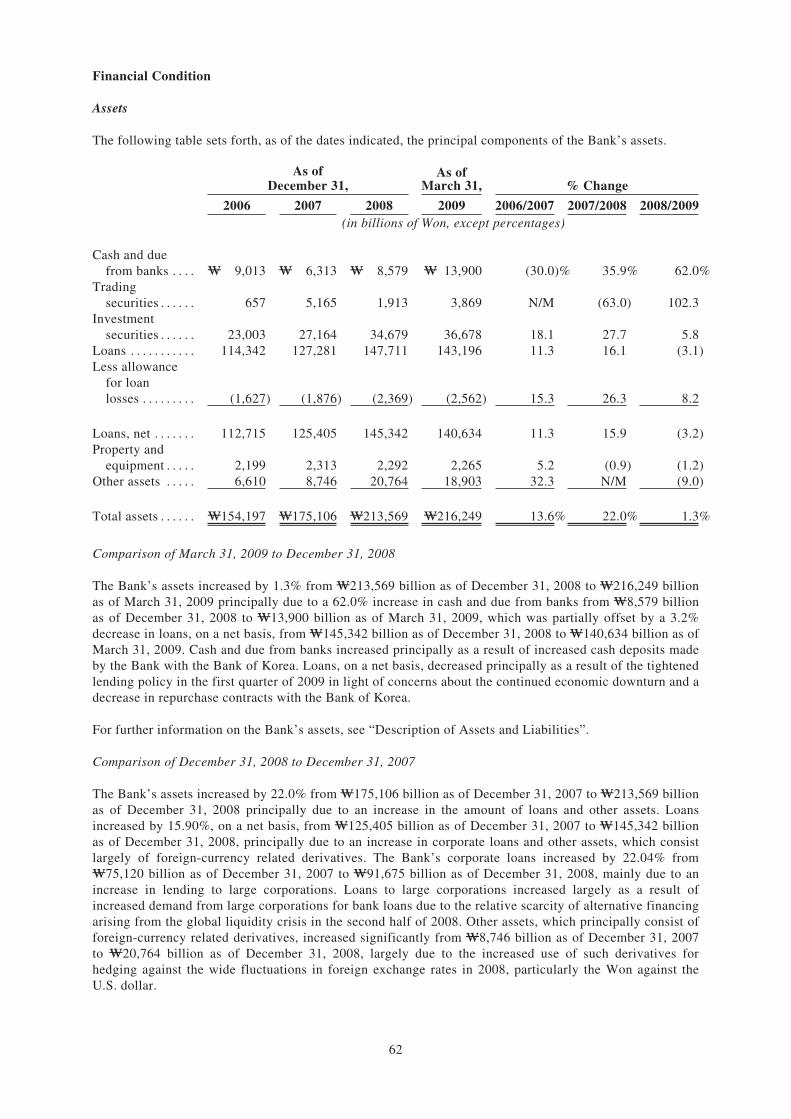
Financial Condition
Assets
The following table sets forth, as of the dates indicated, the principal components of the Bank’s assets.
As ofDecember 31,
As ofMarch 31, % Change
2006 2007 2008 2009 2006/2007 2007/2008 2008/2009(in billions of Won, except percentages)
Cash and duefrom banks . . . . W 9,013 W 6,313 W 8,579 W 13,900 (30.0)% 35.9% 62.0%
Tradingsecurities . . . . . . 657 5,165 1,913 3,869 N/M (63.0) 102.3
Investmentsecurities . . . . . . 23,003 27,164 34,679 36,678 18.1 27.7 5.8
Loans . . . . . . . . . . . 114,342 127,281 147,711 143,196 11.3 16.1 (3.1)Less allowance
for loanlosses . . . . . . . . . (1,627) (1,876) (2,369) (2,562) 15.3 26.3 8.2
Loans, net . . . . . . . 112,715 125,405 145,342 140,634 11.3 15.9 (3.2)Property and
equipment . . . . . 2,199 2,313 2,292 2,265 5.2 (0.9) (1.2)Other assets . . . . . 6,610 8,746 20,764 18,903 32.3 N/M (9.0)
Total assets . . . . . . W154,197 W175,106 W213,569 W216,249 13.6% 22.0% 1.3%
Comparison of March 31, 2009 to December 31, 2008
The Bank’s assets increased by 1.3% from W213,569 billion as of December 31, 2008 to W216,249 billionas of March 31, 2009 principally due to a 62.0% increase in cash and due from banks from W8,579 billionas of December 31, 2008 to W13,900 billion as of March 31, 2009, which was partially offset by a 3.2%decrease in loans, on a net basis, from W145,342 billion as of December 31, 2008 to W140,634 billion as ofMarch 31, 2009. Cash and due from banks increased principally as a result of increased cash deposits madeby the Bank with the Bank of Korea. Loans, on a net basis, decreased principally as a result of the tightenedlending policy in the first quarter of 2009 in light of concerns about the continued economic downturn and adecrease in repurchase contracts with the Bank of Korea.
For further information on the Bank’s assets, see “Description of Assets and Liabilities”.
Comparison of December 31, 2008 to December 31, 2007
The Bank’s assets increased by 22.0% from W175,106 billion as of December 31, 2007 to W213,569 billionas of December 31, 2008 principally due to an increase in the amount of loans and other assets. Loansincreased by 15.90%, on a net basis, from W125,405 billion as of December 31, 2007 to W145,342 billionas of December 31, 2008, principally due to an increase in corporate loans and other assets, which consistlargely of foreign-currency related derivatives. The Bank’s corporate loans increased by 22.04% fromW75,120 billion as of December 31, 2007 to W91,675 billion as of December 31, 2008, mainly due to anincrease in lending to large corporations. Loans to large corporations increased largely as a result ofincreased demand from large corporations for bank loans due to the relative scarcity of alternative financingarising from the global liquidity crisis in the second half of 2008. Other assets, which principally consist offoreign-currency related derivatives, increased significantly from W8,746 billion as of December 31, 2007to W20,764 billion as of December 31, 2008, largely due to the increased use of such derivatives forhedging against the wide fluctuations in foreign exchange rates in 2008, particularly the Won against theU.S. dollar.
62
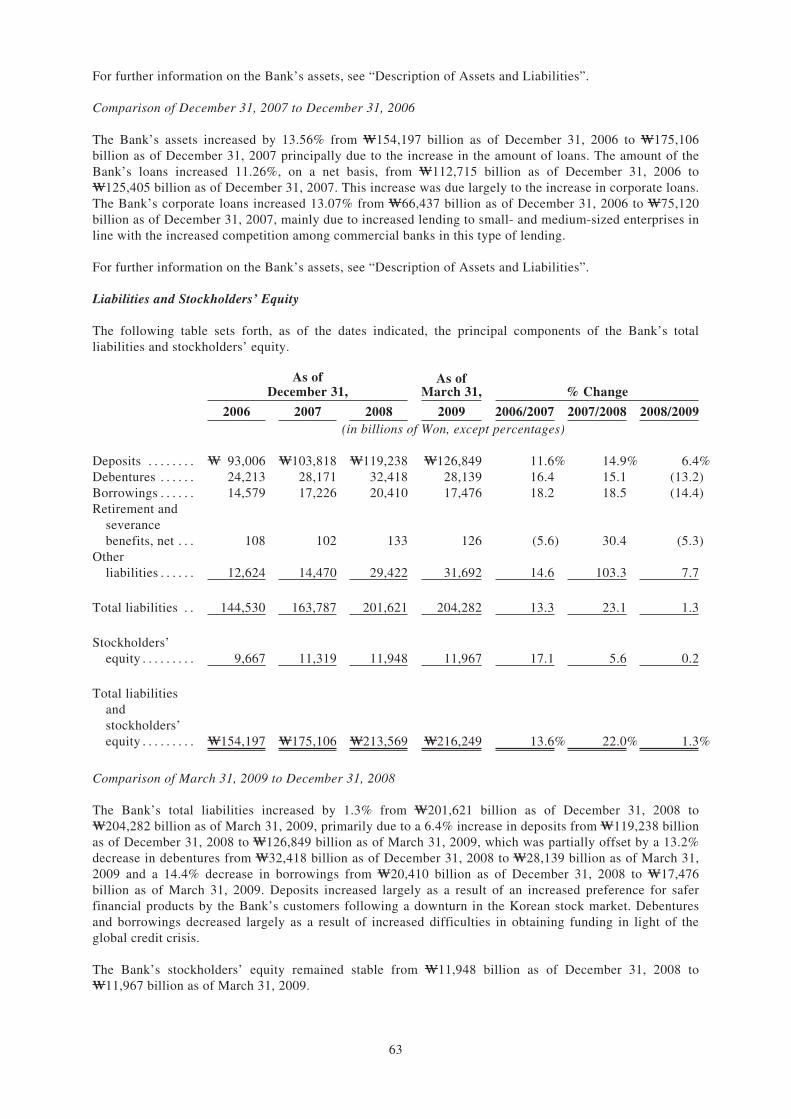
For further information on the Bank’s assets, see “Description of Assets and Liabilities”.
Comparison of December 31, 2007 to December 31, 2006
The Bank’s assets increased by 13.56% from W154,197 billion as of December 31, 2006 to W175,106billion as of December 31, 2007 principally due to the increase in the amount of loans. The amount of theBank’s loans increased 11.26%, on a net basis, from W112,715 billion as of December 31, 2006 toW125,405 billion as of December 31, 2007. This increase was due largely to the increase in corporate loans.The Bank’s corporate loans increased 13.07% from W66,437 billion as of December 31, 2006 to W75,120billion as of December 31, 2007, mainly due to increased lending to small- and medium-sized enterprises inline with the increased competition among commercial banks in this type of lending.
For further information on the Bank’s assets, see “Description of Assets and Liabilities”.
Liabilities and Stockholders’ Equity
The following table sets forth, as of the dates indicated, the principal components of the Bank’s totalliabilities and stockholders’ equity.
As ofDecember 31,
As ofMarch 31, % Change
2006 2007 2008 2009 2006/2007 2007/2008 2008/2009(in billions of Won, except percentages)
Deposits . . . . . . . . W 93,006 W103,818 W119,238 W126,849 11.6% 14.9% 6.4%Debentures . . . . . . 24,213 28,171 32,418 28,139 16.4 15.1 (13.2)Borrowings . . . . . . 14,579 17,226 20,410 17,476 18.2 18.5 (14.4)Retirement and
severancebenefits, net . . . 108 102 133 126 (5.6) 30.4 (5.3)
Otherliabilities . . . . . . 12,624 14,470 29,422 31,692 14.6 103.3 7.7
Total liabilities . . 144,530 163,787 201,621 204,282 13.3 23.1 1.3
Stockholders’equity . . . . . . . . . 9,667 11,319 11,948 11,967 17.1 5.6 0.2
Total liabilitiesandstockholders’equity . . . . . . . . . W154,197 W175,106 W213,569 W216,249 13.6% 22.0% 1.3%
Comparison of March 31, 2009 to December 31, 2008
The Bank’s total liabilities increased by 1.3% from W201,621 billion as of December 31, 2008 toW204,282 billion as of March 31, 2009, primarily due to a 6.4% increase in deposits from W119,238 billionas of December 31, 2008 to W126,849 billion as of March 31, 2009, which was partially offset by a 13.2%decrease in debentures from W32,418 billion as of December 31, 2008 to W28,139 billion as of March 31,2009 and a 14.4% decrease in borrowings from W20,410 billion as of December 31, 2008 to W17,476billion as of March 31, 2009. Deposits increased largely as a result of an increased preference for saferfinancial products by the Bank’s customers following a downturn in the Korean stock market. Debenturesand borrowings decreased largely as a result of increased difficulties in obtaining funding in light of theglobal credit crisis.
The Bank’s stockholders’ equity remained stable from W11,948 billion as of December 31, 2008 toW11,967 billion as of March 31, 2009.
63
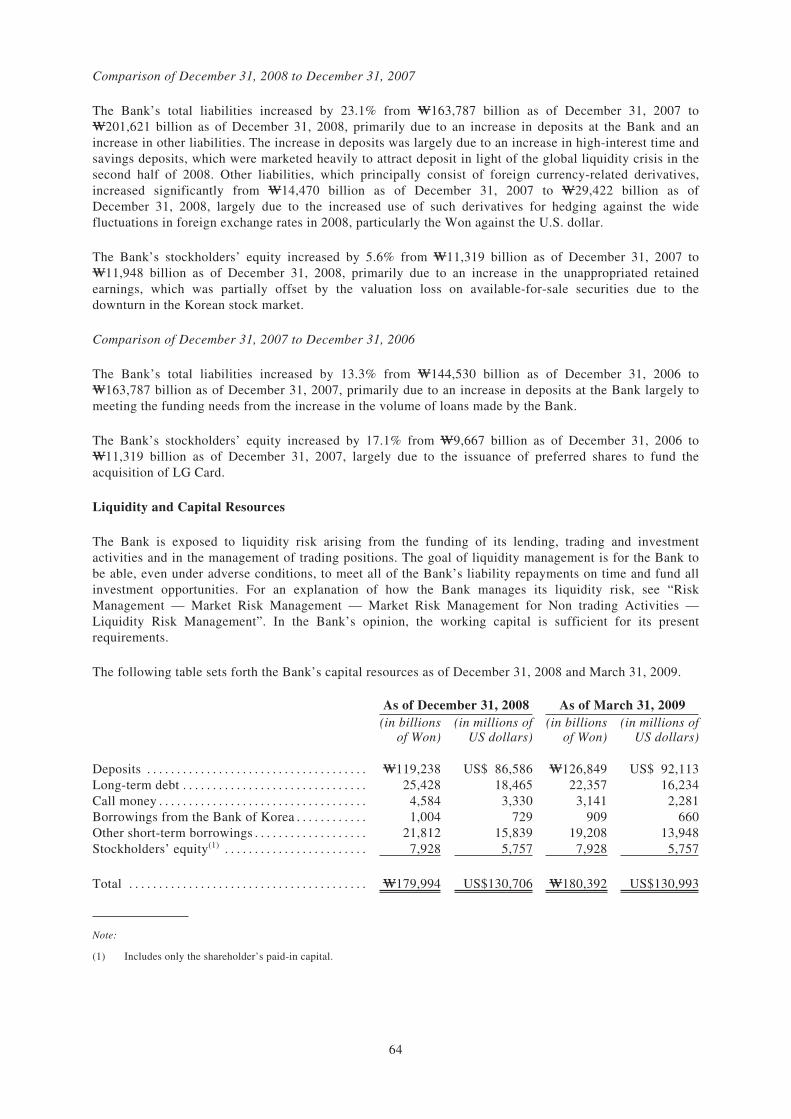
Comparison of December 31, 2008 to December 31, 2007
The Bank’s total liabilities increased by 23.1% from W163,787 billion as of December 31, 2007 toW201,621 billion as of December 31, 2008, primarily due to an increase in deposits at the Bank and anincrease in other liabilities. The increase in deposits was largely due to an increase in high-interest time andsavings deposits, which were marketed heavily to attract deposit in light of the global liquidity crisis in thesecond half of 2008. Other liabilities, which principally consist of foreign currency-related derivatives,increased significantly from W14,470 billion as of December 31, 2007 to W29,422 billion as ofDecember 31, 2008, largely due to the increased use of such derivatives for hedging against the widefluctuations in foreign exchange rates in 2008, particularly the Won against the U.S. dollar.
The Bank’s stockholders’ equity increased by 5.6% from W11,319 billion as of December 31, 2007 toW11,948 billion as of December 31, 2008, primarily due to an increase in the unappropriated retainedearnings, which was partially offset by the valuation loss on available-for-sale securities due to thedownturn in the Korean stock market.
Comparison of December 31, 2007 to December 31, 2006
The Bank’s total liabilities increased by 13.3% from W144,530 billion as of December 31, 2006 toW163,787 billion as of December 31, 2007, primarily due to an increase in deposits at the Bank largely tomeeting the funding needs from the increase in the volume of loans made by the Bank.
The Bank’s stockholders’ equity increased by 17.1% from W9,667 billion as of December 31, 2006 toW11,319 billion as of December 31, 2007, largely due to the issuance of preferred shares to fund theacquisition of LG Card.
Liquidity and Capital Resources
The Bank is exposed to liquidity risk arising from the funding of its lending, trading and investmentactivities and in the management of trading positions. The goal of liquidity management is for the Bank tobe able, even under adverse conditions, to meet all of the Bank’s liability repayments on time and fund allinvestment opportunities. For an explanation of how the Bank manages its liquidity risk, see “RiskManagement — Market Risk Management — Market Risk Management for Non trading Activities —Liquidity Risk Management”. In the Bank’s opinion, the working capital is sufficient for its presentrequirements.
The following table sets forth the Bank’s capital resources as of December 31, 2008 and March 31, 2009.
As of December 31, 2008 As of March 31, 2009(in billions
of Won)(in millions of
US dollars)(in billions
of Won)(in millions of
US dollars)
Deposits . . . . . . . . . . . . . . . . . . . . . . . . . . . . . . . . . . . . . W119,238 US$ 86,586 W126,849 US$ 92,113Long-term debt . . . . . . . . . . . . . . . . . . . . . . . . . . . . . . . 25,428 18,465 22,357 16,234Call money . . . . . . . . . . . . . . . . . . . . . . . . . . . . . . . . . . . 4,584 3,330 3,141 2,281Borrowings from the Bank of Korea . . . . . . . . . . . . 1,004 729 909 660Other short-term borrowings . . . . . . . . . . . . . . . . . . . 21,812 15,839 19,208 13,948Stockholders’ equity(1) . . . . . . . . . . . . . . . . . . . . . . . . 7,928 5,757 7,928 5,757
Total . . . . . . . . . . . . . . . . . . . . . . . . . . . . . . . . . . . . . . . . W179,994 US$130,706 W180,392 US$130,993
Note:
(1) Includes only the shareholder’s paid-in capital.
64
Due to the Bank’s history as a traditional commercial bank, its primary source of funding has historicallybeen and continues to be customer deposits. Deposits amounted to W103,818 billion, W119,238 billion andW126,849 billion as of December 31, 2007 and 2008 and March 31, 2009, respectively, which representedapproximately 66.2%, 66.3% and 70.3%, respectively, of the Bank’s total funding as of such dates.
The Bank meets most of its funding requirements through short-term funding sources, which consistprimarily of customer deposits. As of December 31, 2008, approximately 66.7% of the Bank’s total depositshad current maturities of one year or less. In the past, largely due to the lack of alternative investmentopportunities for individuals and households in Korea, especially in light of the low interest rateenvironment and volatile stock market conditions, a substantial portion of such customer deposits wererolled over upon maturity and accordingly provided a stable source of funding for the Bank. However, attimes of a bullish stock market as in 2007 and the first half of 2008, a significant portion of customerdeposits maintained at banks shifted to money market funds and other brokerage accounts maintained atsecurities companies, which resulted in temporary difficulty in finding sufficient funding for Korean banksin general, including the Bank, in the first half of 2008. While customers have, in large part, reverted tobank deposits when the Korean stock market turned bearish, the Bank cannot assure you that there will notbe significant outflows in bank deposits in the future resulting from upturns in the stock market or theavailability of other attractive investment alternatives. In addition, during times of sudden and significantdevaluations of Korean Won against the U.S. dollar as was the case recently amid the global liquidity crisis,Korean commercial banks, including the Bank, had difficulties in refinancing or obtaining optimal amountsof foreign currency-denominated funding on terms commercially acceptable to the Bank. While the Bankcurrently is not facing liquidity difficulties in any material respect, if the Bank is unable to obtain thefunding it needs on terms commercially acceptable to it for an extended period of time for reasons of Wondevaluation or otherwise, the Bank may not be able to ensure its financial viability, meet regulatoryrequirements, implement its strategies or compete effectively.
The Bank may use secondary and other funding sources, such as debt and equity securities issuances andrepurchase transactions, to complement, or, if necessary, replace funding through customer deposits. Inaddition, the Bank receives from time to time capital contributions from Shinhan Financial Group. Forexample, in December 2008, the Bank received a capital contribution of W800 billion from ShinhanFinancial Group to improve the Bank’s capital adequacy in light of the concerns regarding the growingglobal credit crisis.
The Bank depends on long-term debt as a significant source of funding, principally in the form of corporatedebt securities. Since 1999, the Bank has actively issued and continues to issue long-term debt securitieswith maturities of over one year in the Korean fixed-income market. The Bank has maintained one of thehighest credit ratings of AAA in the domestic fixed-income market since 1999. In addition, the Bank mayalso issue long-term debt securities denominated in foreign currency in the overseas market. As ofDecember 31, 2007 and 2008 and March 31, 2009, the Bank’s long-term debt amounted to W20,973 billion,W25,428 billion and W22,357 billion, respectively.
Given the Bank’s relatively high debt rating in the fixed-income market in Korea, the Bank believes that itwill be able to obtain replacement funding through the issuance of long-term debt securities. The Bank’sinterest rates on long-term debt securities are in general 20 to 40 basis points higher than the interest ratesoffered on its deposits. However, since long-term debt securities are not subject to premiums paid fordeposit insurance and the Bank of Korea reserves, the Bank estimates that its funding costs on long-termdebt securities are on a par with its funding costs on deposits.
Credit ratings affect the cost and other terms upon which the Bank is able to obtain funding. Domestic andinternational rating agencies regularly evaluate the Bank and their ratings of the Bank’s long-term debt arebased on a number of factors, including the Bank’s financial strength as well as conditions affecting thefinancial services industry generally. In light of the ongoing difficulties in the financial services industryand the financial markets, there can be no assurance that the rating agencies will maintain the currentratings or outlooks for the Bank. For example, in February 2009, Moody’s have put 10 commercial banks inKorea, including the Bank, on a negative outlook, as a result of which the Bank’s credit rating for foreigncurrency-denominated long-term unsecured senior debt was downgraded to A2 from A1. There is noassurance that other rating agencies will not follow suit or place in an even more negative credit rating
65
category. The Bank’s failure to maintain current credit ratings and outlooks could increase the cost of itsfunding, limit its access to capital markets and borrowings, and require the Bank to post additionalcollateral in financial transactions, any of which could adversely affect its liquidity, net interest margins andprofitability.
As of June 15, 2009, the credit ratings by S&P, Moody’s and Fitch assigned to the Bank were as follows:
As of June 15, 2009
S&P Moody’s Fitch
A- A2 A
Secondary funding sources also include call money, borrowings from the Bank of Korea and other short-term borrowings which amounted to W24,424 billion, W27,400 billion and W23,258 billion, as ofDecember 31, 2007 and 2008 and March 31, 2009, each representing 15.6%, 15.2% and 12.9%,respectively, of the Bank’s total funding as of such dates.
In addition, pursuant to the Bank’s liquidity risk management policies designed to ensure compliance withrequired capital adequacy and liquidity ratios, Shinhan Financial Group has set limits to the amount ofliquidity support by it to its subsidiaries to 70% of its total stockholders’ equity and the amount of liquiditysupport to a single subsidiary to 35% of its total stockholders’ equity.
Contractual Obligations, Commitments and Guarantees
In the ordinary course of the Bank’s business, it has certain contractual cash obligations and commitmentswhich extend for several years. As the Bank is able to obtain liquidity and funding through various sourcesas described in “— Liquidity and Capital Resources” above, the Bank does not believe that thesecontractual cash obligations and commitments will have a material effect on its liquidity or capitalresources.
Contractual Cash Obligations
The following table sets forth the Bank’s contractual cash obligations as of March 31, 2009.
As of March 31, 2009Payments Due by Period(3)
Less than3 months
3-6months
7-12months 1-3 years
Morethan 3years Total
(in billions of Won)
Borrowings(1) . . . . . . . . . . . . . . . . . . . . . W10,305 W 2,911 W 1,403 W 1,420 W 1,437 W 17,476Debentures(2) . . . . . . . . . . . . . . . . . . . . . . 2,534 2,011 4,094 7,012 12,511 28,162Deposits . . . . . . . . . . . . . . . . . . . . . . . . . . 29,472 9,335 45,543 8,544 33,955 126,849
Total . . . . . . . . . . . . . . . . . . . . . . . . . . . . . W42,311 W14,257 W51,040 W16,976 W47,903 W172,487
Notes:
(1) Borrowings exclude Won-denominated or foreign currency denominated debentures.
(2) W23 billion of bond discounts and premiums on redemption of debentures is excluded.
(3) As of March 31, 2009, accrued severance indemnities amounted to W305 billion.
66
Commitments and Guarantees
In the normal course of the Bank’s banking activities, it makes various commitments and guarantees to meetthe financing needs of its customers. Commitments and guarantees are usually in the form of, among others,commitments to extend credit, commercial letters of credit, standby letter of credit and performanceguarantees. The contractual amount of these financial instruments represents the maximum possible lossamount if the counter party draws down the commitment or the Bank should fulfill its obligation under theguarantee and the counter party fails to perform under the contract. See “Description of Assets andLiabilities — Commitments and Guarantees”.
The following table sets forth, on a consolidated basis, the Bank’s commitments and guarantees as ofDecember 31, 2008 and March 31, 2009. These commitments, apart from certain guarantees andacceptances, are not included within the Bank’s unaudited non-consolidated balance sheet.
As of December 31, 2008Commitment Expiration by Period
Less than1 Year 1-5 Years
Morethan 5Years Total
(in billions of Won)
Commitments to extend credit(1):Corporate . . . . . . . . . . . . . . . . . . . . . . . . . . . . . . . . . . . . . . . . . . . . W42,558 W 3,951 W3,044 W49,553Retail . . . . . . . . . . . . . . . . . . . . . . . . . . . . . . . . . . . . . . . . . . . . . . . 8,003 292 1 8,296Liquidity facilities to SPEs(2) . . . . . . . . . . . . . . . . . . . . . . . . . . 677 2,688 1,007 4,372
Commercial letters of credit(3) . . . . . . . . . . . . . . . . . . . . . . . . . . . . . 2,990 3 — 2,993Financial standby letters of credit(4) . . . . . . . . . . . . . . . . . . . . . . . . 311 95 — 406Other financial guarantees(5) . . . . . . . . . . . . . . . . . . . . . . . . . . . . . . . 740 31 23 794Performance letters of credit and guarantees(6) . . . . . . . . . . . . . . 7,831 3,653 66 11,550Acceptances(7) . . . . . . . . . . . . . . . . . . . . . . . . . . . . . . . . . . . . . . . . . . . . 472 — — 472Credit derivatives(8) . . . . . . . . . . . . . . . . . . . . . . . . . . . . . . . . . . . . . . . 29 — — 29
Total . . . . . . . . . . . . . . . . . . . . . . . . . . . . . . . . . . . . . . . . . . . . . . . . W63,611 W10,713 W4,141 W78,465
As of March 31, 2009Commitment Expiration by Period
Less than1 Year 1-5 Years
Morethan 5Years Total
(in billions of Won)
Commitments to extend credit(1):Corporate . . . . . . . . . . . . . . . . . . . . . . . . . . . . . . . . . . . . . . . . . . . . W46,833 W 6,192 W4,063 W57,088Retail . . . . . . . . . . . . . . . . . . . . . . . . . . . . . . . . . . . . . . . . . . . . . . . 8,336 290 1 8,627Liquidity facilities to SPEs(2) . . . . . . . . . . . . . . . . . . . . . . . . . . 813 2,995 884 4,692
Commercial letters of credit(3) . . . . . . . . . . . . . . . . . . . . . . . . . . . . . 2,771 14 — 2,785Financial standby letters of credit(4) . . . . . . . . . . . . . . . . . . . . . . . . 332 94 — 426Other financial guarantees(5) . . . . . . . . . . . . . . . . . . . . . . . . . . . . . . . 863 32 23 918Performance letters of credit and guarantees(6) . . . . . . . . . . . . . . 8,836 3,070 52 11,958Acceptances(7) . . . . . . . . . . . . . . . . . . . . . . . . . . . . . . . . . . . . . . . . . . . . 548 — — 548Credit derivatives(8) . . . . . . . . . . . . . . . . . . . . . . . . . . . . . . . . . . . . . . . 29 — — 29
Total . . . . . . . . . . . . . . . . . . . . . . . . . . . . . . . . . . . . . . . . . . . . . . . . W67,239 W12,687 W7,145 W87,071
Notes:
(1) Commitments to extend credit represent unfunded portions of authorizations to extend credit in the form of loans. Thecommitments expire on fixed dates and a customer is required to comply with predetermined conditions to draw funds under thecommitments.
67
(2) Liquidity facilities to SPEs represent irrevocable commitments to provide contingent credit lines including commercial paperpurchase agreements to special purpose entities for which the Bank serves as the administrator.
(3) Commercial letters of credit are undertakings on behalf of customers authorizing third parties to draw drafts on the Bank up to astipulated amount under specific terms and conditions. These are generally short-term and collateralized by the underlyingshipments of goods to which they relate. Commitments to extend credit, including credit lines, are in general subject toprovisions that allow the Bank to withdraw such commitments in the event there are material adverse changes affecting anobligor.
(4) Financial standby letters of credit are irrevocable obligations to pay third-party beneficiaries when the Bank’s customers fail torepay loans or debt instruments, which are generally in foreign currencies. A substantial portion of these standby letters of creditare secured by underlying assets, including trade-related documents.
(5) Other financial guarantees are used in various transactions to enhance the credit standing of the Bank’s customers. They provideirrevocable assurance, subject to satisfaction of certain conditions, that the Bank will make payment in the event that itscustomers fail to fulfill their obligations to third parties. These financial obligations include a return of security deposits and thepayment of service fees.
(6) Performance letters of credit and guarantees are issued to guarantee customers’ tender bids on construction or similar projects orto guarantee completion of such projects in accordance with contractual terms. They are also issued to support a customer’sobligation to supply products, commodities, maintenance or other services to third parties.
(7) Acceptances represent guarantees by the Bank to pay a bill of exchange drawn on a customer. The Bank expects mostacceptances to be presented, but reimbursement by the customer is normally immediate.
(8) The Bank discloses written notional amounts of certain derivatives contracts that do not meet the characteristics of derivativesunder the Interpretation of Korea Accounting Standard No. 53-70 as part of guarantee exposure.
Off-Balance Sheet Arrangements
The Bank has several types of off-balance sheet arrangements, including guarantees for loans, debentures,trade financing arrangements, guarantees for other financings, credit lines, letters of credit and creditcommitments. Details of the Bank’s off-balance sheet arrangements are provided in Note 16 in the notes tothe Bank’s non-consolidated financial statements included in this offering circular.
68
THE KOREAN BANKING INDUSTRY
Unless otherwise expressly stated, the information and statistics set out in this section are derived frompublicly available information, including materials published by the Financial Services Commission. Nofurther verification has been made by the Bank or any of its affiliates or advisers.
The banking sector in Korea is composed of five specialized banks, seven nationwide commercial banks,six regional commercial banks and 39 branches of foreign banks as of March 31, 2009.
The specialized banks are organized under, or chartered by, special laws and are designed to meet the needsof specific sectors of the Korean economy in accordance with Government policy, that cannot be met bycommercial banks due to limited resources or lack of profitability. The Korea Development Bank, forexample, offers long-term facility investment funds to major industries in Korea, while The Export-ImportBank of Korea offers export loans and trade finance. Industrial Bank of Korea focuses on the small- andmedium-sized enterprises sector while National Agricultural Cooperative Federation and NationalFederation of Fisheries Cooperatives support their respective industries. All of these specialized banks alsoprovide traditional deposit products, except for The Export-Import Bank of Korea.
The commercial banks are designed to serve the general public and corporate sectors. The seven nationwidebanks consist of the Bank, Kookmin Bank, Woori Bank, Hana Bank, Korea Exchange Bank, Citibank andStandard Chartered First Bank Korea. Amongst these, the Bank, Kookmin Bank, Woori Bank and HanaBank are major banking flagships of their respective financial holding companies, established based on theCommercial Act of Korea and the Financial Holding Company Act to facilitate cross-selling opportunitiesbetween traditional banking and nonbanking operations and promoting improved resources allocation andcapital efficiency.
Providing similar services as nationwide banks, the regional banks were limited in principle to operatingwithin the provinces where they are based. Such limitation, however, was abolished on November 27, 1998.Except for the customers of their branches in Seoul, the regional banks’ main business clients are small andmedium-sized companies in their regions. The regional banks are Pusan Bank, Daegu Bank, Kwangju Bank,Jeonbuk Bank, Kyongnam Bank and Jeju Bank. Kwangju Bank, Jeonbuk Bank, and Kyongnam Bank aresubsidiaries of Woori Financial Group while Jeju Bank is a subsidiary of Shinhan Financial Group.
As in most countries, commercial banks in Korea may engage in a wide range of business. Their coreactivities include the taking of deposits, the extension of loans and discounts, remittances and collections,and foreign exchange. They also handle such business as guarantees and acceptances and own-accountsecurities investment. Specific authorization is required for each area of nonbank business in which theyengage such as the trust and credit card businesses. In addition, they are also expanding their businessesinto noninterest but fee-based businesses such as bancassurance and fund sales.
69
BUSINESS
Introduction
Former Shinhan Bank was established in 1982 as the first privately funded commercial bank in Korea.Chohung Bank was established in 1897 and was the oldest financial institution in Korea. Former ShinhanBank and Chohung Bank were merged on April 3, 2006 and the new bank was named “Shinhan Bank”. TheBank provides a wide range of banking products and services to small- and medium-sized enterprises, largecorporations and individuals in Korea through its nationwide network of branches. As of March 31, 2009,the Bank had 944 domestic branches and 10 overseas branches. The Bank’s extensive branch network andits retail customer base provide it with a stable and relatively low cost funding source. Won-currencydeposits of the Bank amounted to W36,056 billion as of December 31, 2008, and W40,308 billion as ofMarch 31, 2009. The Bank has eight consolidated subsidiaries, located in Seoul, Hong Kong, New York,California, Frankfurt, Phnom Penh, Beijing and Almaty.
As of March 31, 2009, the total assets, net loans (after deducting allowance for loan losses) and deposits ofthe Bank, which do not include the assets and liabilities of trust accounts, were W216,249 billion,W140,634 billion and W126,849 billion, respectively. As of December 31, 2008, the total assets, net loans(after deducting allowance for loan losses) and deposits of the bank accounts of the Bank were W213,569billion, W145,342 billion and W119,238 billion, respectively. As of December 31, 2007, the total assets, netloans (after deducting allowance for loan losses) and deposits of the bank accounts of the Bank wereW175,106 billion, W125,405 billion and W103,818 billion, respectively. For 2007, 2008 and the firstquarter of 2009, the Bank’s net income was W2,051 billion, W1,447 billion and W74 billion, respectively.
The Bank is one of the largest lenders in Korea to small- and medium-sized enterprises. As of December 31,2008 and March 31, 2009, loans to small- and medium-sized enterprises totaled W61,813 billion andW62,144 billion, respectively, representing, 41.8%, and 43.4% of the loans of the Bank, respectively.
As of December 31, 2008 and March 31, 2009, the Bank’s capital adequacy ratio, determined in accordancewith the Financial Service Commission requirements which have been formulated using the FoundationInternal Ratings Based (“FIRB”) method, was 13.44% and 14.46%, respectively. See “Supervision andRegulation — Principal Regulations Applicable to Banks — Capital Adequacy”.
The Bank’s registration number with the Companies Registry in Korea is 110111-0012809. The Bank hasits headquarters at 120, 2-Ka, Taepyung-ro, Chung-Ku, Seoul, Korea.
Merger
On August 19, 2003, Shinhan Financial Group acquired 543,570,144 shares of Chohung Bank’s commonstock from KDIC, which shares represented 80.04 % of Chohung Bank’s outstanding shares. In December2003, Shinhan Financial Group’s ownership increased to 81.15% following its additional capital injectionof W200 billion into Chohung Bank. In June 2004, Shinhan Financial Group acquired the common shares ofChohung Bank that it previously did not own, which were 135,548,285 shares, or 18.85% of total commonshares of former Chohung Bank outstanding, through a cash tender offer followed by a small-scale shareswap under Korean law. Shinhan Financial Group delisted the common shares of Chohung Bank from theKorea Exchange on July 2, 2004.
On April 3, 2006, former Shinhan Bank was merged into Chohung Bank with Chohung Bank being thesurviving legal entity. In connection with the merger, Chohung Bank issued 828,505,540 shares of commonstock of Chohung Bank in consideration for the assets and liabilities of former Shinhan Bank. Immediatelyfollowing the merger, Chohung Bank changed its name to “Shinhan Bank”.
On April 3, 2006, Chohung Bank’s credit card business was spun-off and merged into Shinhan Card. Inconnection with the split-merger, 41,207,856 shares of common stock of Shinhan Card were issued toShinhan Financial Group in exchange for 42,008,463 shares of common stock of Chohung Bank, and
70
Shinhan Card assumed assets amounting to W1,967 billion, together with certain liabilities and accumulatedother comprehensive income amounting to W1,797 billion, relating to the credit card business of ChohungBank. As a result of the split-merger, 42,008,463 shares of common stock of Chohung Bank were retired,resulting in a reduction in its stockholder’s equity of approximately W210 billion.
Following the merger of the two banks on April 3, 2006, the labor union of the Chohung Bank and the laborunion of former Shinhan Bank were integrated in January 2008. As of March 31, 2009, 8,074 employeeswere members of the integrated union. To date, the Bank has not experienced any significant difficulties inits relationships with the integrated union in connection with the merger.
Financial Holding Company Structure
In September 2001, former Shinhan Bank formed a financial holding company, Shinhan Financial Grouppursuant to the Financial Holding Company Act of Korea. Former Shinhan Bank’s shares were exchangedfor those of Shinhan Financial Group. As part of this share exchange, former Shinhan Bank also transferredits holding in Shinhan Capital Co., Ltd. to Shinhan Financial Group. Under the new structure, as of July 1,2002, former Shinhan Bank was the wholly owned subsidiary of Shinhan Financial Group. For moreinformation on the financial holding company structure, see “Shinhan Financial Group”.
Competitive Strengths
Strategy
Prior to the onset of the current turmoil in the financial services industry and macro-economy in Korea aswell as globally, the Bank’s primary strategic focus has been on enhancing its market position in the Koreanfinancial industry, achieving an economy of scale in each major business segment, and seamlesslyintegrating the business units of the former Shinhan Bank and Chohung Bank.
The Bank believes that the level of uncertainty and volatility presented by the ongoing market andeconomic conditions presents a unique set of challenges and opportunities that requires it to realign itsstrategic priorities in order to ensure that it positions itself to best weather the current market crisis as wellas to capture the opportunities that emerge from it. Accordingly, the Bank plans to take a more “back tobasics” approach in protecting and strengthening the fundamentals of, and synergy among, its core businesslines, which will serve as the platform for pursing sustainable growth group-wide and further solidifying itscompetitive leadership, notwithstanding the difficult prospects in the global and domestic market andeconomic conditions.
More specifically, the Bank’s “back to basics” approach in light of the current crisis will focus on thefollowing fundamentals of its core businesses:
Further strengthen risk management. The Bank plans to make its risk management system morecomprehensive and preemptive in detecting and assessing any known and potential risks through earlyalerts and multiple contingency management plans. The Bank will also seek to improve its overallasset quality and minimize any reputational risk by reassessing the risk profile of its core businessesand realigning their respective asset portfolios by unburdening a substantial portion of the high-riskassets.
Strengthen the profit structure. In order to improve the Bank’s profitability, it plans, among others,to adopt greater differentiation in risk-profiling its products to price them more accurately,aggressively restructure low-profit and overlapping product lines and loss-leaders, conservativelydiversify its revenue streams by taking advantage of market openings allowed by regulatory changes,deepen its banking customer relationships by capturing a greater market share of auto payroll depositaccounts and further expand cross-selling opportunities across the group-wide business units.
Capture maximum synergy. The Bank plans to continue to assist in building out, in conjunction withShinhan Financial Group’s groupwide efforts, informational networks and shared databases in order tomaximize opportunities for target marketing, up-selling and cross-selling as well as deepeningcustomer loyalty and relationship at the group level.
71
The Bank plans to use its strong business fundamentals as described above to become a world-class bankthat ranks among the leaders of the banking industry in Asia and globally. The Bank aims to achieve suchobjective by implementing the following strategies and focusing on the following objectives and initiatives:
Pursue new customer-oriented marketing to enhance customer loyalty. To further develop and enhance theloyalty of the Bank’s customers across all business segments, it will (i) develop comprehensive bankingservices for each customer segment, (ii) formulate customized marketing and business strategies for eachcustomer segment, (iii) strengthen its direct marketing efforts, (iv) explore new businesses to meet changesin customers’ needs, (v) seek to develop innovative products and services, such as ubiquitous banking andforeign financial product investment services and (vi) offer diversified investment products to customers. Inparticular, the Bank is focusing on the development of its mass-market customer basis. In addition, theBank plans to combine its commercial banking channels with its investment banking products to create aunique commercial investment banking model in Korea and simultaneously seek investment bankingopportunities in the overseas markets.
Establish an optimal earnings structure for corporate sustainability. The Bank aims to strengthen itsfoundation of income sources, with particular efforts to increase its noninterest income. Furthermore, theBank aims to secure a sound management structure to improve risk management, achieve an optimalbalance of funding and funds operations and strengthen its infrastructure and systems to maximize earningsfrom cross-selling products and services of its affiliates.
Establish a sound foundation to compete globally. To enable the Bank to compete in the global financialmarkets, it aims to (i) improve its brand value, (ii) continue to create customer-oriented operating systemsand processes, (iii) establish a system to create, accumulate, utilize and share intellectual property amongthe Bank and its affiliates, (iv) create a flexible organizational culture that embraces changes in marketconditions and customers’ demands and (v) establish a platform to enable the Bank to strengthen itsstrategic cooperation with foreign financial institutions and create a global network to exchange informationand ideas.
Creating synergies within the holding company structure of Shinhan Financial Group. Since theestablishment of a financial holding company, Shinhan Financial Group, in 2001, the Bank has focused onachieving synergy through cross-selling of products and services of the other subsidiaries of ShinhanFinancial Group. The Bank and its affiliates, Goodmorning Shinhan Securities and Shinhan Life Insurance,together serve as the primary distribution channels for the Shinhan Financial Group while the othernon bank members of the Shinhan Financial Group are focusing on developing competitive products andservices. Examples of the principal products for cross-selling in the retail segment include bancassurance,credit cards, beneficiary certificates and “Financial Network Accounts”, which are integrated accounts forbanking, brokerage and insurance services. In particular, the Bank intends to capitalize on the synergisticbenefits of the acquisition by Shinhan Financial Group of LG Card and its substantial customer base. See“Shinhan Financial Group”.
Establishing and Consolidating the One Portal Network. In order to provide total financial solutions to thecustomers of the Bank and other members of the Shinhan Financial Group on a real-time basis, the Bank,along with other members of the Shinhan Financial Group, are continuing to develop a one portal networkfor the Shinhan Financial Group. The one portal network refers to the ability of a corporate or retailcustomer to have access to a total financial solution through any single point of contact with any member ofthe Shinhan Financial Group.
72
Business Overview
The Bank’s Principal Activities
The Bank’s principal group activities consist of deposit-taking activities from its retail and corporatecustomers, which provide the Bank with funding necessary to offer a variety of banking services.
The comprehensive banking services that the Bank has traditionally provided are as follows:
Š retail banking services;
Š corporate banking services, primarily consisting of:
Š small- and medium-sized enterprises banking; and
Š large corporate banking;
Š treasury and securities investment; and
Š trust account management services.
In February 2008, the Bank underwent internal restructuring, as a result of which it became organized intofive business segments, consisting of business development, corporate banking, treasury and internationalbanking, investment banking and other services. For more details, see “Management’s Discussion andAnalysis of Financial Condition and Results of Operations — Results by Principal Business Segment.”
The Bank’s principal activities are not subject to any material seasonal trends. While the Bank has a numberof overseas branches and subsidiaries, substantially all of its revenues are generated in Korea.
Deposit-Taking Activities
The Bank offers many deposit products that target different customer segments with features tailored toeach segment’s financial and other profiles. The deposit products offered by the Bank include principallythe following:
Š Demand deposits. These deposit products do not accrue interest or accrue interest at a lower ratethan time or savings deposits and allow the customer to deposit and withdraw funds at any time. Theseinterest-bearing, demand deposits accrue interest at a fixed or variable rate depending on the periodand the amount of deposit. Demand deposits constituted approximately 37.9%, 32.2% and 33.7% ofthe Bank’s total deposits as of December 31, 2007 and 2008 and March 31, 2009, respectively, andpaid interest at the average rate of 1.39%, 1.43% and 1.12% in 2007, 2008 and the first quarter of2009, respectively.
Š Time and savings deposits. Timing and savings deposits consist of time deposit products and savingsdeposit products. Time deposit products generally require the customer to maintain a deposit for afixed term during which the deposit accrues interest at a fixed rate or variable rate based on certainfinancial indexes, including the Korea Composite Stock Price Index (“KOSPI”). If the deposit iswithdrawn prior to the end of the fixed term, the customer will be paid a lower interest rate than thatoriginally offered. The term typically ranges from one month to five years. Savings deposit productsallow the customer to deposit and withdraw funds at any time and accrue interest at an adjustableinterest rate, which is lower than time or installment deposits. Currently, interest on savings depositsranges from zero to 3.04%. Time and savings deposits constituted approximately 41.3%, 50.8% and51.9% of the Bank’s total deposits as of December 31, 2007 and 2008 and March 31, 2009,respectively, and paid interest at the average rate of 3.41%, 4.12% and 3.78% in 2007, 2008 and thefirst quarter of 2009, respectively.
73
Š Other deposits. Other deposits principally include certificate of deposits. Certificate of depositproducts typically have maturities from 30 days to 5 years. Interest rates on certificates of deposits aredetermined based on the length of the deposit and the prevailing market interest rates. Certificates ofdeposits are sold on a discount to their face value, reflecting the interest payable on the certificates ofdeposit. Other deposits constituted approximately 20.9%, 17.0% and 14.3% of the Bank’s totaldeposits as of December 31, 2007 and 2008 and March 31, 2009, respectively, and paid interest at theaverage rate of 4.52%, 5.08% and 4.36% in 2007, 2008 and the first quarter of 2009, respectively.
The Bank also offers deposits which provide the customer with preferential rights to housing subscriptionsunder the Housing Construction Promotion Law, and eligibility for mortgage loans. These products include:
Housing subscription time deposits, which are special purpose time deposits providing the customer with apreferential right to subscribe for new private apartment units under the Housing Construction PromotionLaw. This law sets forth various measures supporting the purchase of houses and the supply of such housesby construction companies. If a potential home-buyer subscribes for these deposit products and holds themfor a certain period of time as set forth in the Housing Construction Promotion Law, such deposit customersobtain the right to subscribe for new private apartment units on a priority basis. Such preferential rights areneither transferable nor marketable in the open market. These products accrue interest at a fixed rate for oneyear and at an adjustable rate after one year, which are consistent with other time deposits. Deposit amountsper account range from W2 million to W15 million depending on the size and location of the dwelling unit.These deposit products target high and middle income households.
Housing subscription installment savings deposits, which are monthly installment savings programsproviding the customer with a preferential subscription right for new private apartment units under theHousing Construction Promotion Law. Such preferential rights are neither transferable nor marketable inthe open market. These deposits require monthly installments of W50,000 to W500,000, have maturitiesbetween three and five years and accrue interest at fixed rates depending on the terms, which are consistentwith other installment savings deposits. These deposit products target low and middle income households.For information on the Bank’s deposits in Korean Won based on the principal types of deposit products theBank offers, see “Description of Assets and Liabilities — Funding — Deposits”.
The Bank offers varying interest rates on its deposit products depending on the rate of return on its interestearning assets, average funding costs and interest rates offered by other major commercial banks.
The Monetary Policy Committee of the Bank of Korea imposes a reserve requirement on Won currencydeposits of commercial banks which ranges from 0% to 7%, based generally on the term to maturity and thetype of deposit instrument. See “Supervision and Regulation — Principal Regulations Applicable to Banks— Liquidity”.
The Depositor Protection Act provides for a deposit insurance system where the Korea Deposit InsuranceCorporation guarantees to depositors the repayment of their eligible bank deposits. The deposit insurancesystem insures up to a total of W50 million per depositor per bank. See “Supervision and Regulation —Principal Regulations Applicable to Banks — Deposit Insurance System”.
Retail Banking Services
Overview
Retail banking services include mortgage and retail lending as well as demand, savings and fixed deposit-taking, checking account services, electronic banking and ATM services, bill paying services, payroll andcheck-cashing services, currency exchange and wire fund transfer.
Retail banking has been and will continue to remain one of its core businesses. The Bank’s strategy in retailbanking is to provide prompt and comprehensive services to retail customers through increased automationand improved customer service, as well as a streamlined branch network focused on sales. The retailsegment places an emphasis on targeting high net worth individuals. The retail loans of the Bank amountedto W56,131 billion and W56,034 billion as of December 31, 2008 and March 31, 2009, respectively.
74
Retail Lending Activities
The Bank offers various retail loan products, consisting principally of household loans, which targetdifferent segments of the population with features tailored to each segment’s financial profile and othercharacteristics, including each customer’s profession, age, loan purpose, collateral requirements and theduration of the customer’s relationship with the Bank. Household loans consist principally of the following:
Š Mortgage and home equity loans, mostly consisting of mortgage loans which are loans to financehome purchases and are generally secured by the value of the home being purchased; and
Š Other retail loans, which are loans made to customers for any purpose (other than mortgage and homeequity loans), the terms of which vary based primarily upon the characteristics of the borrower andwhich are either unsecured or secured or guaranteed by deposits or a third party.
As of December 31, 2008, the Bank’s mortgage and home-equity loans and other retail loans accounted for63.1% and 36.9%, respectively of the Bank’s total Won-denominated retail loans.
For secured loans, including mortgage and home equity loans, the Bank’s policy is to lend up to 40% to60% of the appraisal value of the collateral, by taking into account the value of any lien or other securityinterest that is prior to its security interest (other than petty claims). As of December 31, 2008, theloan-to-value ratio of mortgage and home equity loans of the Bank was approximately 45.58%. As ofDecember 31, 2008, substantially all of its mortgage and home equity loans were secured by residentialproperty.
Due to the rapid increase in mortgage and home equity loans in Korea, in 2005 and 2006, the FinancialServices Commission implemented stringent regulations and guidelines that are designed to suppress theincrease of loans secured by housing. These regulations include restrictions on banks’ maximumloan-to-value ratios, guidelines with respect to appraisal of collateral, internal control and credit approvalpolicy requirements with regard to housing loans, as well as provisions designed to discourage commercialbanks or other financial institutions from instituting incentive-based marketing and promotion of housingloans. In addition to the existing regulations and guidelines, from the second half of 2005 to the first quarterof 2007, the Financial Services Commission implemented additional guidelines to reduce mortgage andhome equity loans and stabilize the real estate market, including (i) permitting the term of the loan securedby the borrower’s apartment to be extended only once (ii) reducing the maximum loan-to-value ratio forloans secured by the borrower’s apartment in highly speculated areas, (iii) not allowing mortgage or homeequity loans to minors and (iv) lowering the minimum loan-to-value ratio to 40% in respect of loans bybanks and insurance companies for the purpose of assisting the purchase of apartments located in highlyspeculated areas with a purchase price of less than W600 million. Following the onset of the newadministration of President Lee Myong Bak whose campaign platform included promises of market-orientedderegulation and, in response to the ongoing recession in the housing market, the Government has rolledback some of the restrictive regulatory initiatives, including raising the loan-to-value ratio to 60% except inthree designated highly speculative areas. The Government is reportedly considering other measures inorder to bolster the housing market. Despite such recent measures, the Bank believes the outlook for theKorean housing market remains uncertain in light of the ongoing uncertainties surrounding the Koreaneconomy and its financial markets.
The following table sets forth the portfolio of the Bank’s retail loans.
As of December 31, As of March 31,
2006 2007 2008 2009(in billions of Won, except percentages)
Retail loans(1) . . . . . . . . . . . . . . . . . . . . . . . . . . . . . . . . . . . . . . W47,943 W52,258 W56,131 W56,034
Percentage of retail loans to total gross loans . . . . . . . . . 41.9% 41.0% 38.0% 39.1%
Note:
(1) Before allowance for loan losses.
75
Pricing
The interest rates on retail loans made by the Bank are either periodic floating rates (which are based on abase rate determined for three-month, six-month or twelve-month periods derived using an internal transferprice system, which reflects its cost of funding in the market, further adjusted to account for expensesrelated to lending and profit margin) or fixed rates that reflect its cost of funding, as well as its expensesrelated to lending and profit margin. Fixed-rate loans are currently limited to maturities of three years andare offered only on a limited basis. For unsecured loans, both types of rates also incorporate a margin basedon, among other things, the borrower’s credit score as determined during the Bank’s loan approval process.For secured loans, credit limit is based on the type of collateral, priority with respect to the collateral andloan to value. The Bank can adjust the price to reflect the borrower’s current and/or expected futurecontribution to its profitability. The applicable interest rate is determined at the time a loan is extended. If aloan is terminated prior to its maturity, the borrower is obligated to pay the Bank an early termination fee ofapproximately 0.5% to 2.0% of the loan amount in addition to the accrued interest, depending on the timing,the nature of the credit and the amount.
As of December 31, 2008, the Bank’s three-month, six-month and twelve-month base rates wereapproximately 3.93%, 4.67% and 4.96%, respectively. As of March 31, 2009, the Bank’s three-month,six-month and twelve-month base rates were approximately 2.43%, 2.74% and 3.36%, respectively. As ofDecember 31, 2008 and March 31, 2009, the Bank’s fixed rates for home equity loans with a maturity ofone year, two years and three years were 8.80%, 9.10% and 9.40%, respectively, and the Bank’s fixed ratesfor other retail loans with a maturity of one year were from 10.00% to 14.50%, depending on the creditscores of its customers.
As of December 31, 2008, approximately 82.0% of the Bank’s total retail loans were priced based on afloating rate and approximately 18.0% were priced based on a fixed rate. As of March 31, 2009,approximately 75.8% of the Bank’s total retail loans were priced based on a floating rate and approximately24.2% were priced based on a fixed rate.
Private Banking
Historically, the Bank has focused on customers with high net worth. The Bank’s retail banking servicesprovide a private banking service to its high net worth customers who seek personal advice in complexfinancial matters. The Bank’s aim is to help enhance the private wealth and increase the financialsophistication of its clients by offering them portfolio/fund management services, tax consulting servicesand real estate management service.
As of March 31, 2009, the Bank operated 16 private banking centers nationwide, including ten in Seoul, twoin the suburbs of Seoul and four in other cities located in other regions in Korea. As of March 31, 2009, theBank had approximately 3,700 private banking customers, who typically are required to have W500 millionin deposit or W1 billion in assets under management with the Bank to qualify for its private bankingservices.
Corporate Banking Services
Overview
The Bank provides corporate banking services to small- and medium-sized enterprises, including enterprisesknown as “small office, home office” (“SOHO”), which are small enterprises operated by individuals orhouseholds, and, to a lesser extent, to large corporations, including corporations that are affiliated withchaebols. The Bank also lends to government-controlled companies.
76
The following table sets forth the balances and percentage of the Bank’s total lending attributable to eachcategory of its corporate lending business as of the dates indicated.
As of December 31, As of March 31,
2006 2007 2008 2009(in billions of Won, except percentages)
Small- and medium-sizedenterprises loans(1) . . . . . . . . W44,330 66.7% W53,512 71.2% W61,813 67.4% W62,144 71.2%
Large corporate loans(2) . . . . . . 22,107 33.3 21,608 28.8 29,862 32.6 25,118 28.8Total corporate loans . . . . . . . . W66,437 100.0% W75,120 100.0% W91,675 100.0% W87,262 100.0%
Notes:
(1) Represents the principal amount of loans extended to corporations meeting the definition of small- and medium-sized enterprisesunder the Basic Act on Small- and Medium-sized Enterprises and its Presidential Decree.
(2) Includes loans to government-controlled companies.
Small- and Medium-sized Enterprises Banking
Under the Basic Act on Small- and Medium-sized Enterprises and its Presidential Decree, small- andmedium-sized enterprises are defined as companies which (i) do not have employees, sales, paid-in capitalor assets exceeding the number or the amount, as the case may be, specified in accordance with their typesof businesses in the Presidential Decree and (ii) do not belong to a conglomerate as defined in theMonopoly Regulations and Fair Trade Act. In order to qualify as a small- and medium-sized enterprise,none of its shareholders holding 30% or more of its total issued and outstanding voting shares can have(i) full-time employees of 1,000 or more and (ii) assets of W500 billion or more as of the end of theimmediately preceding fiscal year. As of December 31, 2008 and March 31, 2009, the Bank provided loansin the amount W61,813 billion and W62,144 billion to the small- and medium-sized enterprises, whichnumbered approximately 200,000 as of both December 31, 2008 and March 31, 2009.
The Bank’s small- and medium-sized enterprises banking business has traditionally been and will remainone of its core businesses. As a result of the adoption of restrictive regulatory measures in 2005 to 2007designed to curb speculation in the housing market, lending to the small- and medium-sized enterprises wasan area of intense competition among the commercial banks in Korea as opportunities to expand home andmortgage loans diminished. However, since the onset of the global financial crisis and economic downturnsin Korea starting in the second half of 2008, the Bank has sharply reduced new lending to the small- andmedium-sized enterprises and is currently focusing on maintaining the asset quality of existing loans tothese enterprises.
The Bank, which has traditionally focused on small- and medium-sized enterprises lending, is well-positioned to succeed in the small- and medium-sized enterprises market, in light of its marketingcapabilities (which has provided the Bank with significant brand loyalty) and its conservative credit ratingsystem for credit approval. To maintain or increase its market share of small- and medium-sized enterpriseslending, the Bank has:
Š positioned itself based on accumulated expertise. The Bank believes that it has a good understandingof the credit risks embedded in this market segment and to develop loan and other productsspecifically tailored to the needs of this market segment;
Š operated a relationship management system to provide targeted and tailored customer service tosmall-and medium-sized enterprises. The Bank currently has 144 corporate banking branches withrelationship management teams. These relationship management teams market products and reviewand approve smaller loans that pose less credit risks; and
Š continued to focus on cross-selling loan products with other products. For example, when the Banklends to small- and medium-sized enterprises, it also explores opportunities to cross-sell retail loans ordeposit products to the employees of those companies or to provide financial advisory services.
77
Large Corporate Banking
Large corporate customers consist primarily of member companies of chaebols and financial institutions.Large corporate loans of the Bank amounted to W29,862 billion and W25,118 billion as of December 31,2008 and March 31, 2009, respectively.
The Bank aims to be a one-stop financial solution provider and a partner in corporate expansion and growthto its corporate clients. To this end and in order to take advantage of the recent deregulation in the Koreanfinancial industry as a result of the adoption of the Financial Investment Services and Capital Markets Act,the Bank provides investment banking services, including real estate financing, overseas real estate projectfinancing, large development project financing, infrastructure financing, structured financing, equityinvestments/venture investments, mergers and acquisitions consulting, securitization and derivativesservices, including securities and derivative products and foreign exchange trading. The Bank, through itssubsidiary, Shinhan Asia Limited, opened its investment banking center in Hong Kong in October 2006 toarrange financing for and offer consulting services to Korean companies expanding their business overseas.
Due to the liquidity shortage as a result of the ongoing turbulence in the global financial markets, the Bankbelieves that opportunities for large corporate banking, particularly loans involving large sums of principal,will generally be limited at least in the near future. In light of this outlook, the Bank aims to focus onminimizing its credit risks in the area of large corporate banking, developing a diversified set of financialsolutions to its corporate customers and bolstering human capital and other platforms to take advantage offuture business opportunities in corporate banking.
Electronic Corporate Banking
The Bank offers to corporate customers a Web-based total cash management service through “ShinhanBizbank”. Shinhan Bizbank supports all types of banking transactions from basic transaction historyinquiries and fund transfers to opening letters of credit, trade finance, payment management, collectionmanagement, sales settlement service, acquisition settlement service, B2B settlement service, sweeping andpooling.
Corporate Lending Activities
The Bank’s principal loan products for corporate customers are working capital loans and facilities loans.Working capital loans, which include discounted notes and trade financing, are generally loans used forgeneral working capital purposes. Facilities loans are provided to finance the purchase of equipment andconstruction of manufacturing plants. As of December 31, 2008, working capital loans and facilities loansamounted to W47,820 billion and W13,490 billion, respectively, representing 78.0% and 22.0% of theBank’s total Won-denominated corporate loans. As of March 31, 2009, working capital loans and facilitiesloans amounted to W48,213 billion and W13,713 billion, respectively, representing 77.9% and 22.1% of theBank’s total Won-denominated corporate loans. Working capital loans generally have a maturity of oneyear, but may be extended on an annual basis for an aggregate term of three years in the case of unsecuredloans and five years in the case of secured loans. Facilities loans, which are generally secured, have amaximum maturity of ten years. Loans to corporations may be unsecured or secured by real estate, depositsor guaranty certificates.
When evaluating the extension of loans to corporate customers, the Bank reviews the corporate customer’screditworthiness, credit score, value of any collateral or third-party guarantee. The value of any collateral isdefined using a formula that takes into account the appraised value of the property, any prior liens or otherclaims against the property and an adjustment factor based on a number of considerations including, withrespect to property, the average value of any nearby property sold in a court-supervised auction during theprevious year. The Bank revalues any collateral when a secured loan is renewed or if a trigger event occurswith respect to the loan in question.
78
Pricing
The Bank establishes the price for its corporate loan products based principally on their respective cost offunding and the expected loss rate based on the borrower’s credit risk. As of December 31, 2008, 0.37% ofthe Bank’s corporate loans with outstanding maturities of one year or more had interest rates that were notfixed but were variable by reference to its market rate.
The Bank generally determines the pricing for its corporate loans as follows:
Interest rate = (The Bank’s periodic market floating rate or reference rate) plus transaction cost plusa credit spread plus risk premium plus or minus a discretionary adjustment rate.
Depending on the situation and the Bank’s agreement with the borrower, the Bank may use either itsperiodic market floating rate or the reference rate as the base rate in calculating its pricing. As ofDecember 31, 2008, the Bank’s periodic market floating rates (which are based on a base rate determinedfor three-month, six-month, one-year, two-year, three-year or five-year periods derived using the Bank’smarket rate system) were 3.93% for three months, 4.73% for six months, 5.06% for one year, 5.513% fortwo years, 5.70% for three years and 6.11% for five years. As of the same date, the Bank’s reference ratewas 8.75%. The reference rate refers to the base lending rate used by the Bank. The reference rate isdetermined annually by the Bank’s Asset & Liability Management Committee based on, among others, theBank’s funding costs, cost efficiency ratio and discretionary margins.
Transaction cost is added to reflect the standardized transaction cost assigned to each loan product and othermiscellaneous costs, including contributions to the Credit Guarantee Fund and education taxes.
The credit spread is added to the periodic floating rate to reflect the expected loss from a borrower’s creditrating and the value of any collateral or payment guarantee. In addition, the Bank adds a risk premium thatis measured by the unexpected loss that exceeds the expected loss from the credit rating assigned to aparticular borrower.
A discretionary adjustment rate is added or subtracted to reflect the borrower’s current and/or futurecontribution to the Bank’ profitability. In the event of additional credit provided by way of a guarantee ofanother, the adjustment rate is subtracted to reflect such change in the credit spread. In addition, dependingon the price and other terms set by competing banks for similar borrowers, the Bank may reduce the interestrate to compete more effectively with other banks.
Treasury and Securities Investment
The Bank engages in treasury and securities investment business, which involves, among other things, thefollowing activities:
Š treasury;
Š securities investment and trading;
Š derivatives trading; and
Š international business.
Treasury
The Bank’s treasury division provides funds to all of the Bank’s business operations and ensures theliquidity of its operation. To secure long-term stable funds, the Bank uses fixed and floating rate notes,debentures, structured financing and other advanced funding sources. As for overseas funding, the Bankclosely monitors the feasibility of raising funds in currencies other than the U.S. dollar, such as JapaneseYen and the Euro. In addition, the Bank makes call loans and borrows call money in the short-term moneymarket. Call loans are short-term lending among banks and financial institutions in either Korean Won orforeign currencies, in amounts exceeding W100 million, with maturities of typically one day.
79
Securities Investment and Trading
The Bank invests in and trades securities for its own accounts in order to maintain adequate sources ofliquidity and to generate interest, dividend income and capital gains. The Bank’s trading and investmentportfolios consist primarily of Korean treasury securities and debt securities issued by Governmentagencies, local governments or certain government-invested enterprises and debt securities issued byfinancial institutions. Equity securities held by the Bank consist of equities listed on the KRX KOSPIMarket and KRX KOSDAQ Market of the Korea Exchange. For a detailed description of the Bank’ssecurities investment portfolio, see “Description of Assets and Liabilities — Investment Portfolio”.
Derivatives Trading
The Bank provides and trades a range of derivatives products. The derivatives products offered by the Bankinclude:
Š interest rate swaps, options, and futures relating to Korean Won interest rate risks and LIBOR risks,respectively;
Š cross-currency swaps, largely for Korean Won against U.S. dollars, Japanese Yen and Euros;
Š equity and equity-linked options;
Š foreign currency forwards, swaps and options;
Š commodity forwards, swaps and options;
Š credit derivatives; and
Š KOSPI 200 indexed equity options.
The Bank’s trading volume in terms of notional amount was W329,643 billion, W395,015 billion andW100,538 billion, in 2007, 2008 and the first quarter of 2009, respectively. Such derivative operationsgenerally focus on addressing the needs of corporate clients to hedge their risk exposure, and back-to-backderivatives entered into to hedge the Bank’s risk exposure that results from such client contracts.
The Bank also enters into derivative trading contracts to hedge the interest rate and foreign currency riskexposures that arise from the Bank’s own assets and liabilities. In addition, on a limited basis, the Bankengages in proprietary trading of derivatives within its regulated open position limits. See “Description ofAssets and Liabilities — Derivatives”.
International Business
The Bank also engages in treasury and investment activities in international capital markets, principallyincluding foreign currency-denominated securities trading, foreign exchange trading and services, trade-related financial services, international factoring services and foreign retail banking operations through theBank’s overseas branches and subsidiaries. The Bank aims to become a leading bank in Asia and expand itsinternational business by focusing on further bolstering its overseas network, localizing its overseasoperations and diversifying its product offerings, particularly in terms of asset management, in order tomeet the varied financial needs of its current and potential customers overseas.
Trust Account Management Services
Overview
The Bank’s trust account management services involve management of trust accounts, primarily in the formof money trusts. Trust account customers are typically individuals seeking higher rates of return than thoseoffered by bank account deposits. Because deposit reserve requirements do not apply to deposits held intrust accounts as opposed to deposits held in bank accounts, and regulations governing trust accounts tend
80
to be less strict, the Bank is generally able to offer higher rates of return on trust account products than onbank account deposits. However, due to the ongoing low interest environment, in recent years the Bank hasnot been able to offer highly attractive rates of return on its trust account products.
Trust account products generally require higher minimum deposit amounts than comparable bank accountdeposit products do. Compared to comparable bank account products, deposits in trust accounts are investedprimarily in securities and, to a lesser extent, in loans, as the relative shortage of funding sources requirethat trust accounts be invested in a higher percentage of liquid assets.
Under the Banking Act of 1950, as amended, assets accepted in trust accounts are required to be segregatedfrom other assets of the trustee bank and are not available to satisfy the claims of the depositors or othercreditors of such bank. Accordingly, trust accounts are accounted for and reported separately from bankaccounts. See “Supervision and Regulation”. Trust accounts are regulated by the Trust Act and the FinancialInvestment Services and Capital Markets Act, and most national commercial banks offer similar trustaccount products. The Bank earns income from trust account management services, which is recorded as nettrust management fees. See “Management’s Discussion and Analysis of Financial Condition and Results ofOperations — Operating Results — 2008 Compared to 2007 — Non-interest Income (Expense), net”.
As of December 31, 2007 and 2008 and March 31, 2009, the Bank had total trust assets of W34,259 billion,W37,123 billion and W32,623 billion, respectively, comprised principally of real property investments ofW8,403 billion, W9,942 billion and W10,023 billion, respectively; securities investments of W11,903billion, W10,628 billion and W8,985 billion, respectively; and loans in the principal amount of W677billion, W744 billion and W693 billion, respectively. Securities investments consisted of corporate bonds,government-related bonds and other securities, primarily commercial paper. As of December 31, 2007 and2008 and March 31, 2009, equity securities constituted 3.4%, 3.0% and 3.3%, respectively, of the Bank’stotal trust assets. Loans made by trust accounts are similar in type to those made by the Bank’s bankaccounts, except that they are made only in Korean Won. As of December 31, 2007 and 2008 and March 31,2009, approximately 60.4%, 64.4% and 62.9%, respectively, of the amount of loans from the trust accountswere collateralized or guaranteed. In making investments from funds received for each trust account, eachtrust product maintains investment guidelines applicable to each such product which set forth, among otherthings, company, industry and security type limitations.
Money trusts managed by the Bank’s trust account business were W13,574 billion, W12,822 billion andW10,458 billion as of December 31, 2007 and 2008 and March 31, 2009, respectively.
Trust Products
The Bank offers primarily two types of money trust accounts through its retail branch network: guaranteedfixed rate trusts and variable rate trusts.
Š variable rate trust accounts. Variable rate trust accounts are not entitled to a guaranteed return onthe deposits, except in the limited cases of principal guaranteed variable rate trust accounts, for whichthe payment of the principal amount is guaranteed. As of December 31, 2007 and 2008 and March 31,2009, the Bank’s variable rate trust accounts amounted to W10,019 billion, W9,311 billion andW6,990 billion, respectively, and its principal guaranteed variable rate trust accounts amounted toW3,546 billion, W3,510 billion and W3,467 billion, respectively. The Bank charges a lump sum or afixed percentage of the assets held in such trusts as a management fee, and, depending on the trustproducts, is also entitled to an additional fee in cases of early termination of trusts by the customer.Korean banks are currently allowed to guarantee the principal of the following types of variable ratetrust account products: (i) existing individual pension trusts, (ii) new individual pension trusts,(iii) existing retirement pension trusts, (iv) new retirement pension trusts, (v) pension trusts and(vi) employee retirement benefit trusts.
Š guaranteed fixed rate trust accounts. Guaranteed fixed rate trust accounts are entitled to aguaranteed return of the principal as well as a fixed rate of return. Upon termination of these trusts,the Bank is entitled to investment returns from the management of these trusts, net of the guaranteed
81
returns paid to customers and any related expenses. In the past, Korean commercial banks, includingthe Bank, offered two types of guaranteed fixed rate trust products: general unspecified money trustsand development money trusts. However, since January 1999, the banks have been prohibited fromoffering new guaranteed fixed rate trust products, and the guaranteed fixed rate trust productscurrently serviced by the banks are carryovers from the past and have been dwindling in volume as theproducts mature. As of December 31, 2007 and 2008 and March 31, 2009, the guaranteed fixed ratetrust products maintained by the Bank amounted to W9.7 billion, W1.0 billion and W1.0 billion,respectively. If income from a guaranteed fixed rate trust account is insufficient to pay the guaranteedamount, such deficiency must be satisfied from (i) first, special reserves maintained in such trustaccounts, (ii) secondly, trust fees and (iii) lastly, funds transferred from the bank accounts of theBank.
Distribution Network
The Bank offers a wide range of financial services to retail and corporate customers through a variety ofdistribution networks and channels. The following table presents the geographical distribution of the Bank’sdistribution network based on the branch offices and other distribution channels, as of March 31, 2009.
Distribution Channels in Korea
Shinhan Bank
Retail Corporate Total
Seoul metropolitan . . . . . . . . . . . . . . . . . . . . . . . . . . . . . . . . . . . . . . . . . . . . . . . . . . . . . . . 394 25 419Kyunggi Province . . . . . . . . . . . . . . . . . . . . . . . . . . . . . . . . . . . . . . . . . . . . . . . . . . . . . . . . 193 5 198Six major cities: . . . . . . . . . . . . . . . . . . . . . . . . . . . . . . . . . . . . . . . . . . . . . . . . . . . . . . . . . 171 7 178
Incheon . . . . . . . . . . . . . . . . . . . . . . . . . . . . . . . . . . . . . . . . . . . . . . . . . . . . . . . . . . . . . 57 2 59Busan . . . . . . . . . . . . . . . . . . . . . . . . . . . . . . . . . . . . . . . . . . . . . . . . . . . . . . . . . . . . . . . 41 1 42Kwangju . . . . . . . . . . . . . . . . . . . . . . . . . . . . . . . . . . . . . . . . . . . . . . . . . . . . . . . . . . . . 13 1 14Taegu . . . . . . . . . . . . . . . . . . . . . . . . . . . . . . . . . . . . . . . . . . . . . . . . . . . . . . . . . . . . . . . 26 1 27Ulsan . . . . . . . . . . . . . . . . . . . . . . . . . . . . . . . . . . . . . . . . . . . . . . . . . . . . . . . . . . . . . . . 12 1 13Taejon . . . . . . . . . . . . . . . . . . . . . . . . . . . . . . . . . . . . . . . . . . . . . . . . . . . . . . . . . . . . . . 22 1 23
Sub-total . . . . . . . . . . . . . . . . . . . . . . . . . . . . . . . . . . . . . . . . . . . . . . . . . . . . . . . . . . . . 758 37 795Others . . . . . . . . . . . . . . . . . . . . . . . . . . . . . . . . . . . . . . . . . . . . . . . . . . . . . . . . . . . . . . . . . . . 148 1 149
Total . . . . . . . . . . . . . . . . . . . . . . . . . . . . . . . . . . . . . . . . . . . . . . . . . . . . . . . . . . . . . . . 906 38 944
Banking Service Channels
The Bank’s services are primarily dispensed through an extensive branch network, complemented by self-service terminals and electronic banking.
As of March 31, 2009, the Bank had 944 branches in Korea, including 906 retail banking branches(including banking offices) and 38 corporate banking branches. The Bank’s branch network is designed tofocus on providing one-stop banking services tailored to one of three customer categories: retail customers,small- and medium-sized enterprise customers and large corporate customers.
Retail Banking Channels
In Korea, many retail transactions are conducted in cash or with credit cards, and conventional checkingaccounts are generally not offered or used as widely as in other countries. As a result, an extensive retailbranch network plays an important role for Korean banks as customers generally handle most transactionsthrough bank branches. Recently, one of the key initiatives at the Bank has been to target high net worthindividuals through private banking. The Bank’s private banking services are provided principally throughprivate banking relationship managers who, within target customer groups, assist clients in developingindividual investment strategies. The Bank believes that its relationship managers help foster lastingrelationships with the Bank’s clients. Private banking customers also have access to the Bank’s retail branchnetwork and other general banking products the Bank offers through its retail banking operations.
82
Corporate Banking Channels
In order to service corporate customers and attract high-quality corporate borrowers, in particular within thesmall-and medium-sized enterprises sector, the Bank has developed a corporate relationship managementsystem within its domestic branch network and strengthened its marketing capability. The Bank’s corporaterelationship managers help foster enduring relationships with the Bank’s corporate customers, particularlythe small- and medium-sized enterprises.
Self-Service Terminals
In order to complement the Bank’s banking branch network, it maintains an extensive network of automatedbanking machines, which are located in branches and in unmanned outlets. These automated bankingmachines consist of ATMs, cash dispensers and passbook printers. As of March 31, 2009, the Bank had1,022 cash dispensers and 6,125 ATMs. The Bank has actively promoted the use of these distributionoutlets in order to provide convenient service to customers, as well as to maximize the marketing and salesfunctions at the branch level, reduce employee costs and improve profitability. The Bank believes that theuse of its automated banking machines has increased in recent years. In 2008, automated banking machinetransactions accounted for approximately 28.7% and 50.3% of total deposit and withdrawal transactions ofthe Bank in terms of the number of transactions and fee revenue generated, respectively.
Electronic Banking
The Bank’s internet banking services are more comprehensive than those available at the counter, includingsuch services as 24-hour account balance posting, real-time account transfer, overseas remittance and loanrequests. The Bank also provides the Mobile Banking service, which enables customers to make speedy,convenient and secure banking transactions using mobile phones. As the purpose of e-banking is primarilycost-saving rather than profit generation, the substantial majority of the Bank’s electronic bankingtransactions do not generate fee income.
Overseas Branch Network
The table below sets forth the Bank’s overseas banking subsidiaries and branches as of March 31, 2009.
Business Unit LocationYear Established
or Acquired
SubsidiariesShinhan Asia Ltd. Hong Kong SAR, China 1982Shinhan Bank Europe GmbH Germany 1994Shinhan Bank America New York, U.S.A. 2003Shinhan Vina Bank Vietnam 2000Shinhan Bank (China) Limited Beijing, China 2008Shinhan Khmer Bank Limited Cambodia 2007Shinhan Bank Kazakhstan Limited Kazakhstan 2008Shinhan Bank Canada Toronto, Canada 2008
BranchesTokyo Japan 1988Osaka Japan 1986Fukuoka Japan 1997New York U.S.A. 1989Singapore Singapore 1990London United Kingdom 1991Ho Chi Minh City Vietnam 1995Mumbai India 1996Hong Kong China 2006New Delhi India 2006
Representative OfficeShinhan Mexico Representative Office Mexico City, Mexico 2008
83
The principal activities of these overseas branches and subsidiaries are trade financing and local currencyfunding for Korean companies and Korean nationals in the overseas markets, and providing foreignexchange services in conjunction with the Bank’s headquarters. On a limited basis, these overseas branchesand subsidiaries also engage in investment and trading of securities of foreign issuers.
Subsidiaries
As of March 31, 2009, the Bank had eight consolidated subsidiaries, details of which are provided in thetable below.
Subsidiary LocationEquity
ownership Business
(Percentage)
Shinhan Asia Limited Hong Kong 100.0 Investment banking services, arrangingfinancing and consulting services for Koreancompanies, and engaging in investment bankingbusiness in China and Southeast Asiancountries.
Shinhan Bank America New York andCalifornia
100.0 General banking services, mostly for Koreancustomers living in the United States.
Shinhan Bank EuropeGmbh
Frankfurt 100.0 Overseas lending, mostly to Koreancorporations and/or their affiliates.
Shinhan Khmer Bank Phnom Penh 80.1 General banking services, local investmentbanking and related services and arrangingfinancing and consulting services for Koreancompanies.
Shinhan Bank (China)Limited
Beijing 100.0 Financial services to both local and Koreancommunities and companies.
Shinhan Aitas Co., Ltd. Seoul 89.6 Management of trust assets and related funds.Also provides consulting services andmanagement of indirect investment securities.
Shinhan Bank Kazakhstan Almaty 100.0 Established in February 2008 but has notlaunched its operations to date.
Shinhan Bank Canada Toronto 100.0 General banking services, mostly for Koreancustomers living in Canada.
Competition
The Bank competes principally with other national commercial banks in Korea, but also faces competitionfrom a number of additional entities, including branches and subsidiaries of foreign banks operating inKorea, regional banks, government-owned development banks and Korea’s specialized banks, such asKorea Development Bank and the National Association of Agriculture and Fisheries, as well as variousother types of financial service institutions, including savings institutions (such as mutual savings andfinance companies and credit unions and credit cooperatives), investment institutions (such as securitiesbrokerage firms, merchant banking corporations and asset management companies) and life insurancecompanies. As of March 31, 2009, Korea had seven major domestic commercial banks in Korea (includingCitibank and Standard Chartered First Bank, both of which acquired domestic commercial banks), sixregional banks and branches and subsidiaries of 39 foreign banks. The Bank believes that foreign financialinstitutions, many of which have greater experiences and resources than the Bank does, will continue toenter the Korean market and compete with the Bank in providing financial products and services either bythemselves or in partnership with existing Korean financial institutions. Furthermore, the Korean bankingindustry may undergo further consolidation either voluntarily or as part of government-led initiatives. Someof the financial institutions resulting from these developments may, by virtue of their increased size,expanded business scope and more efficient operations, provide greater competition for the Bank.
Over the past several years, competition has been particularly fierce in the Bank’s core banking business ofsmall- and medium-sized enterprise lending, as most Korean banks have focused their business in this areaafter reducing their exposure to large corporations, which has contributed to, and may further intensify,
84
lower profitability and asset quality problems in small- and medium-enterprise loans. In addition, the newlyenacted Financial Investment Services and Capital Markets Act took effect in February 2009, with the aimof promoting integration and rationalization of the Korean capital markets and financial investmentproducts industry, and this will likely further intensify competition among financial institutions in Korea,including banks. See “Risk Factors — Risks Relating to the Bank’s Business — Competition in the Koreanfinancial services industry is intense, and may further intensify as a result of recent deregulation”,“Supervision and Regulation — Financial Investment Services and Capital Markets Act”.
There can be no assurance that the Bank will be able to compete successfully with other domestic andforeign financial institutions, and increased competition and market saturation from any or all of theforegoing developments may result in a loss of market share and declining margins for the Bank, whichwould have a material adverse effect on the Bank’s financial condition and results of operation. See “RiskFactors — Risks Relating to the Bank’s Business — Competition in the Korean financial services industryis intense, and may further intensify as a result of recent deregulation”.
Information Technology
The Bank dedicates substantial resources to maintaining a sophisticated information technology system tosupport its operations management and provide high quality customer service. In order to maximize synergyamong the Bank’s subsidiaries, the Bank is currently continuing to build and implement a single groupwideenterprise information technology system known as “enterprise data warehouse”. In addition, the Bank iscurrently continuing to upgrade the information technology systems for each of its subsidiaries to enhancethe quality of its customer service specific to such subsidiary.
The Bank’s current information technology initiatives also include installing a financial reporting systemmeeting the IFRS standards starting fiscal year 2011 and building a group-wide security managementsystem to further ensure secure financial transactions for its customers.
The Bank’s information technology system is currently backed up on a real-time basis. The Bank hasestablished a completely duplicative back-up IT system in different locations in Korea to provide a back-upsystem in the event of any system failure. The Bank’s information technology system is currently able tofully resume operation within an hour even in the case of a complete disruption of the informationtechnology system at the headquarters of Shinhan Financial Group.
Properties
The Bank’s registered office and corporate headquarters are located at 120, 2-Ga, Taepyung-Ro, Jung-Gu,Seoul 100-102, Korea. Information regarding certain of the Bank’s properties in Korea is presented in thefollowing table.
Type of Facility LocationArea
(in square meters)
BuildingSite
(if Different)
Registered office and corporateheadquarters
120, 2-Ga, Taepyung-Ro, Jung-Gu, Seoul100-102, Korea
42,710 5,418
Shinhan Centennial Building 117, Samgak-Dong, Jung-Gu, Seoul, Korea 19,697 1,389
Shinhan Bank Gwanggyo Branch 14, 1-Ga, Namdaemun-Ro, Jung-Gu, Seoul,Korea
16,727 6,783
Shinhan Myongdong Branch 53-1, 1-Ga, Myong-Dong, Jung-Gu, Seoul,Korea
8,936 1,014
Shinhan Youngdungpo Branch 57, 4-Ga, Youngdungpo-Dong, Youngdungpo-Gu, Seoul, Korea
6,171 1,983
Shinhan Back Office Support Center 781, Janghang-Dong, Ilsan-Gu, Goyang-Si,Kyunggi Province, Korea
24,496 5,856
Shinhan Bank Back Office and Call Center 731, Yoksam-Dong, Kangnam-Gu, Seoul,Korea
23,374 7,964
Shinhan Bank Back Office and StorageCenter
1704-Ga, Yongam-Dong, Sangdang-Gu,Cheongju-Si, Chungcheongbuk-Do, Korea
5,756 6,398
85
The Bank’s principal establishment is the former Shinhan Bank headquarters building located in Seoul,Korea which has a total floor area of approximately 42,710 square meters. The Bank owns, directly orindirectly, a majority interest in its headquarters building. In addition, the Bank owns or leases various sitesand buildings for its branches. The Bank houses its central mainframe computer system at its informationtechnology centre in the Seoul metropolitan area. The Bank also owns the Chohung Bank headquartersbuilding located in Seoul, Korea which has a total floor area of approximately 40,777 square meters.
As of March 31, 2009, the Bank had a countrywide network of 944 branches. Approximately 27.1% of thesefacilities were housed in buildings owned by the Bank, while the remaining branches are leased properties.
The net book value of all properties owned by the Bank as of March 31, 2009 was W1,920 billion. TheBank does not own any material properties outside of Korea.
Legal Proceedings and Other Matters
Legal Proceedings
As of March 31, 2009, the Bank was the defendant in pending lawsuits in the aggregate claim amount ofW175 billion, for which it recorded a provision of W33 billion. The Bank’s management believes that theselawsuits will not have a material adverse effect on its financial condition or results of operation.
Tax Assessment
Beginning in 2002, commercial banks in Korea, including the Bank, offered their customers products thatcombined certain deposit and swap elements. Under the terms of these products, the customer madedeposits in Korean Won, which were immediately converted into Japanese Yen and were repaid in KoreanWon at maturity after conversion from Japanese Yen. While these products carried a low interest rate, themajority of the benefit to the customers was from the foreign exchange gains. These products weremarketed to customers under the notion that the exchange gains from these products would be exempt fromincome tax or tax withholding. However, in 2005, the Korean National Tax Service announced that suchexchange gains would be subject to tax and tax withholding, and that the banks selling these productsshould have made a withholding and that the customers of these products should have reported income onsuch gains, and further that the banks and customers should pay substantial fines for having failed to do so.Following the announcement, the Bank ceased to offer these products.
In November 2006, the Korean National Tax Service imposed on the Bank additional taxes in the amount ofW13 billion with respect to the Bank’s tax liabilities and additional taxes in the amount of W21 billion withrespect to its customers’ tax liabilities, in each case, in respect of the products described above. While theBank has paid the additional taxes in order to avoid any further interest and penalty on unpaid taxes, it iscurrently challenging such tax imposition in court. In February 2009, the lower court ruled against theBank, and the Bank is currently considering its legal options. For the purpose of fostering customergoodwill, the Bank has voluntarily and preemptively indemnified its customers for their increased taxliability to the extent they resulted from the investment in these deposit products, including any additionaltax liability that its customers may have to the Korean National Tax Service. In 2006, based on theassumption that the Bank may be subject to maximum additional tax-related liability, including the liabilityfrom the indemnity to its customers, the Bank recorded a total charge to the Bank’s income of W52 billionin the year ended December 31, 2006, consisting of additional tax expenses of W13 billion and provisionfor other losses of W39 billion. In addition, the Bank also recorded W11 billion as deferred tax assets on itsbalance sheet as of December 31, 2006. In 2008, the Korean National Tax Service returned W4 billion ofthe additional tax payment made by the Bank. Mainly as a result of the foregoing, the Bank had W32 billionof provision for other losses and W7 billion of related deferred tax assets as of December 31, 2008 relatedto the Japanese Yen swap deposit products.
86
DESCRIPTION OF ASSETS AND LIABILITIES
The following discussion describes the assets and liabilities of the bank accounts of the Bank on anon-consolidated basis. Unless otherwise indicated, the assets and liabilities of the trust accounts of theBank are discussed under the heading “Trust Accounts”.
Loan Portfolio
The Bank extends loans from both its bank and trust accounts. Guarantees are not categorized as loansunless and until the Bank has made a payment on behalf of a customer in relation to the guarantee.
As of December 31, As of March 31,
2006 2007 2008 2009(in billions of Won)
Corporate . . . . . . . . . . . . . . . . . . . . . . . . . . . . . . . . . . . . . . W 66,437 W 75,120 W 91,675 W 87,262Retail . . . . . . . . . . . . . . . . . . . . . . . . . . . . . . . . . . . . . . . . . . 47,943 52,258 56,131 56,034
Total(1) . . . . . . . . . . . . . . . . . . . . . . . . . . . . . . . . . . . . W114,380 W127,378 W147,806 W143,296
Note:
(1) As of December 31, 2006, 2007 and 2008 and March 31, 2009, approximately 89.0%, 88.5%, 88.5% and 89.3% of the Bank’stotal gross loans, respectively, were Won-denominated.
87
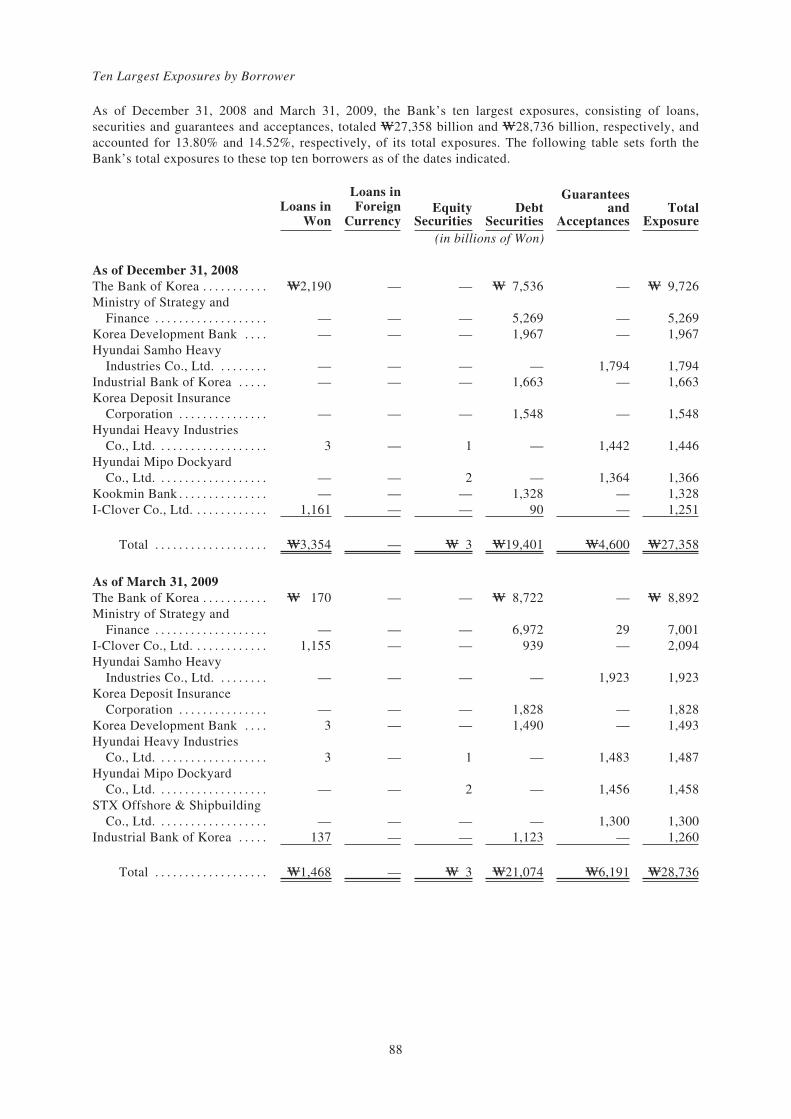
Ten Largest Exposures by Borrower
As of December 31, 2008 and March 31, 2009, the Bank’s ten largest exposures, consisting of loans,securities and guarantees and acceptances, totaled W27,358 billion and W28,736 billion, respectively, andaccounted for 13.80% and 14.52%, respectively, of its total exposures. The following table sets forth theBank’s total exposures to these top ten borrowers as of the dates indicated.
Loans inWon
Loans inForeign
CurrencyEquity
SecuritiesDebt
Securities
Guaranteesand
AcceptancesTotal
Exposure(in billions of Won)
As of December 31, 2008The Bank of Korea . . . . . . . . . . . W2,190 — — W 7,536 — W 9,726Ministry of Strategy and
Finance . . . . . . . . . . . . . . . . . . . — — — 5,269 — 5,269Korea Development Bank . . . . — — — 1,967 — 1,967Hyundai Samho Heavy
Industries Co., Ltd. . . . . . . . . — — — — 1,794 1,794Industrial Bank of Korea . . . . . — — — 1,663 — 1,663Korea Deposit Insurance
Corporation . . . . . . . . . . . . . . . — — — 1,548 — 1,548Hyundai Heavy Industries
Co., Ltd. . . . . . . . . . . . . . . . . . . 3 — 1 — 1,442 1,446Hyundai Mipo Dockyard
Co., Ltd. . . . . . . . . . . . . . . . . . . — — 2 — 1,364 1,366Kookmin Bank . . . . . . . . . . . . . . . — — — 1,328 — 1,328I-Clover Co., Ltd. . . . . . . . . . . . . 1,161 — — 90 — 1,251
Total . . . . . . . . . . . . . . . . . . . W3,354 — W 3 W19,401 W4,600 W27,358
As of March 31, 2009The Bank of Korea . . . . . . . . . . . W 170 — — W 8,722 — W 8,892Ministry of Strategy and
Finance . . . . . . . . . . . . . . . . . . . — — — 6,972 29 7,001I-Clover Co., Ltd. . . . . . . . . . . . . 1,155 — — 939 — 2,094Hyundai Samho Heavy
Industries Co., Ltd. . . . . . . . . — — — — 1,923 1,923Korea Deposit Insurance
Corporation . . . . . . . . . . . . . . . — — — 1,828 — 1,828Korea Development Bank . . . . 3 — — 1,490 — 1,493Hyundai Heavy Industries
Co., Ltd. . . . . . . . . . . . . . . . . . . 3 — 1 — 1,483 1,487Hyundai Mipo Dockyard
Co., Ltd. . . . . . . . . . . . . . . . . . . — — 2 — 1,456 1,458STX Offshore & Shipbuilding
Co., Ltd. . . . . . . . . . . . . . . . . . . — — — — 1,300 1,300Industrial Bank of Korea . . . . . 137 — — 1,123 — 1,260
Total . . . . . . . . . . . . . . . . . . . W1,468 — W 3 W21,074 W6,191 W28,736
88
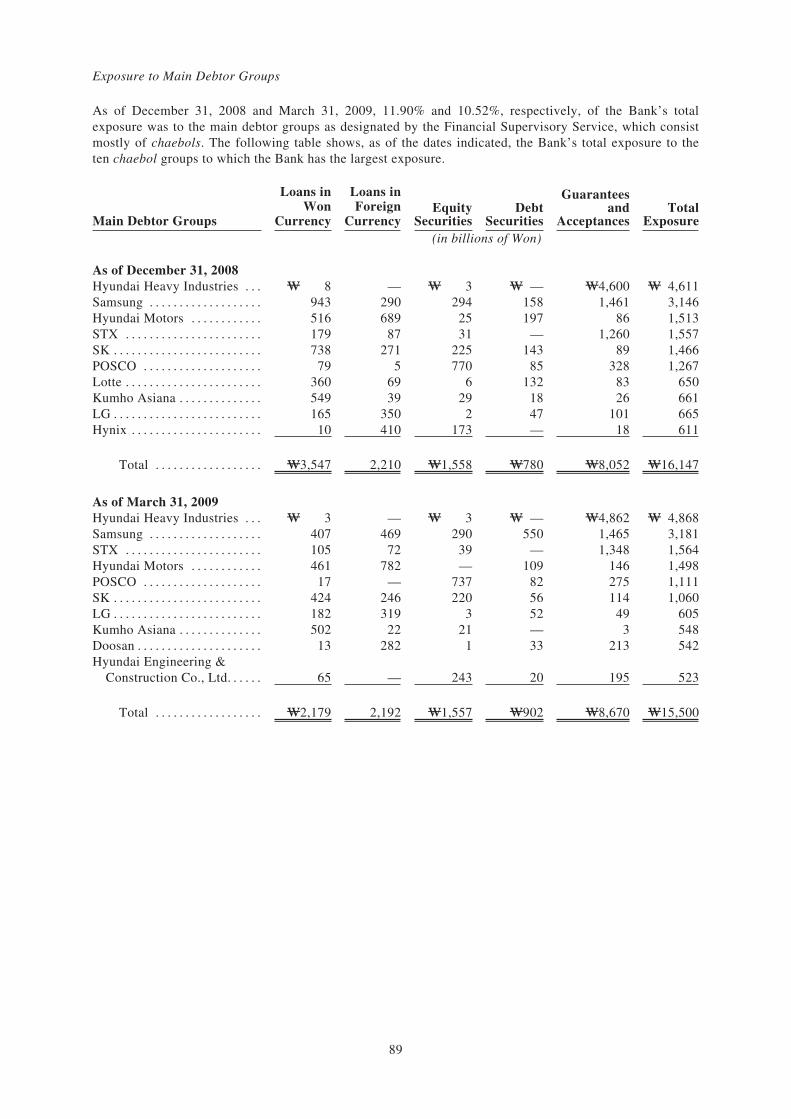
Exposure to Main Debtor Groups
As of December 31, 2008 and March 31, 2009, 11.90% and 10.52%, respectively, of the Bank’s totalexposure was to the main debtor groups as designated by the Financial Supervisory Service, which consistmostly of chaebols. The following table shows, as of the dates indicated, the Bank’s total exposure to theten chaebol groups to which the Bank has the largest exposure.
Main Debtor Groups
Loans inWon
Currency
Loans inForeign
CurrencyEquity
SecuritiesDebt
Securities
Guaranteesand
AcceptancesTotal
Exposure(in billions of Won)
As of December 31, 2008Hyundai Heavy Industries . . . W 8 — W 3 W — W4,600 W 4,611Samsung . . . . . . . . . . . . . . . . . . . 943 290 294 158 1,461 3,146Hyundai Motors . . . . . . . . . . . . 516 689 25 197 86 1,513STX . . . . . . . . . . . . . . . . . . . . . . . 179 87 31 — 1,260 1,557SK . . . . . . . . . . . . . . . . . . . . . . . . . 738 271 225 143 89 1,466POSCO . . . . . . . . . . . . . . . . . . . . 79 5 770 85 328 1,267Lotte . . . . . . . . . . . . . . . . . . . . . . . 360 69 6 132 83 650Kumho Asiana . . . . . . . . . . . . . . 549 39 29 18 26 661LG . . . . . . . . . . . . . . . . . . . . . . . . . 165 350 2 47 101 665Hynix . . . . . . . . . . . . . . . . . . . . . . 10 410 173 — 18 611
Total . . . . . . . . . . . . . . . . . . W3,547 2,210 W1,558 W780 W8,052 W16,147
As of March 31, 2009Hyundai Heavy Industries . . . W 3 — W 3 W — W4,862 W 4,868Samsung . . . . . . . . . . . . . . . . . . . 407 469 290 550 1,465 3,181STX . . . . . . . . . . . . . . . . . . . . . . . 105 72 39 — 1,348 1,564Hyundai Motors . . . . . . . . . . . . 461 782 — 109 146 1,498POSCO . . . . . . . . . . . . . . . . . . . . 17 — 737 82 275 1,111SK . . . . . . . . . . . . . . . . . . . . . . . . . 424 246 220 56 114 1,060LG . . . . . . . . . . . . . . . . . . . . . . . . . 182 319 3 52 49 605Kumho Asiana . . . . . . . . . . . . . . 502 22 21 — 3 548Doosan . . . . . . . . . . . . . . . . . . . . . 13 282 1 33 213 542Hyundai Engineering &
Construction Co., Ltd. . . . . . 65 — 243 20 195 523
Total . . . . . . . . . . . . . . . . . . W2,179 2,192 W1,557 W902 W8,670 W15,500
89
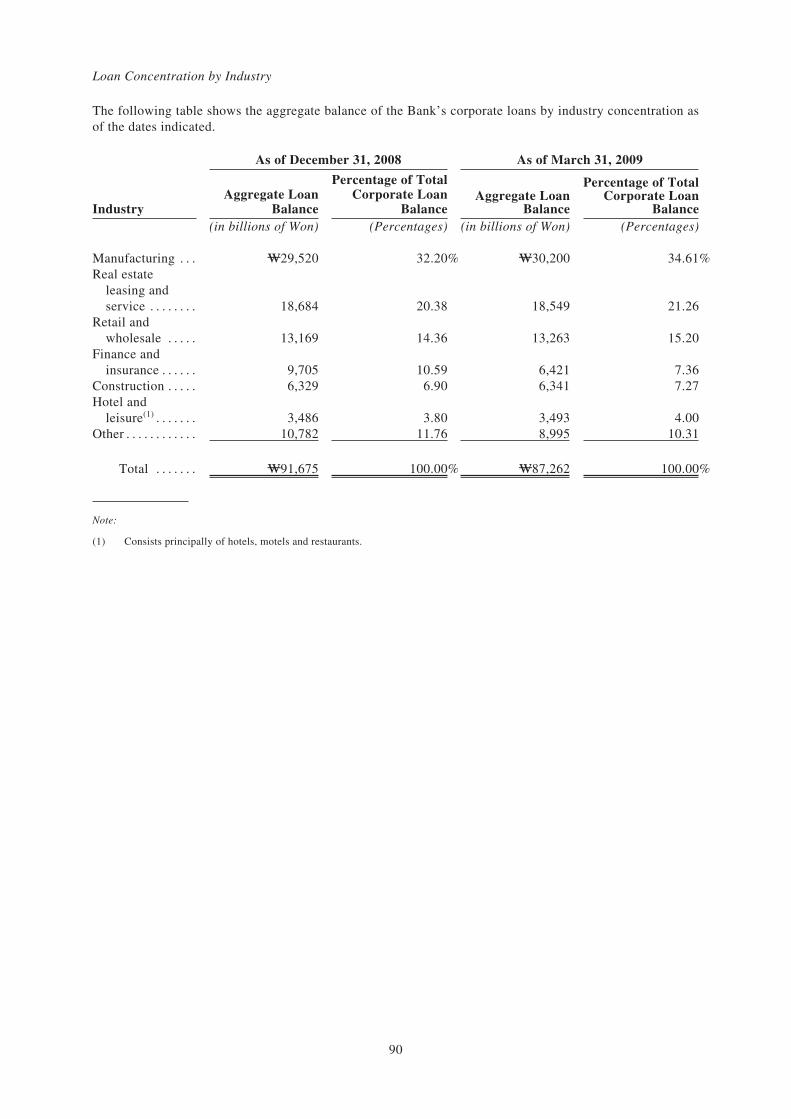
Loan Concentration by Industry
The following table shows the aggregate balance of the Bank’s corporate loans by industry concentration asof the dates indicated.
As of December 31, 2008 As of March 31, 2009
IndustryAggregate Loan
Balance
Percentage of TotalCorporate Loan
BalanceAggregate Loan
Balance
Percentage of TotalCorporate Loan
Balance(in billions of Won) (Percentages) (in billions of Won) (Percentages)
Manufacturing . . . W29,520 32.20% W30,200 34.61%Real estate
leasing andservice . . . . . . . . 18,684 20.38 18,549 21.26
Retail andwholesale . . . . . 13,169 14.36 13,263 15.20
Finance andinsurance . . . . . . 9,705 10.59 6,421 7.36
Construction . . . . . 6,329 6.90 6,341 7.27Hotel and
leisure(1) . . . . . . . 3,486 3.80 3,493 4.00Other . . . . . . . . . . . . 10,782 11.76 8,995 10.31
Total . . . . . . . W91,675 100.00% W87,262 100.00%
Note:
(1) Consists principally of hotels, motels and restaurants.
90
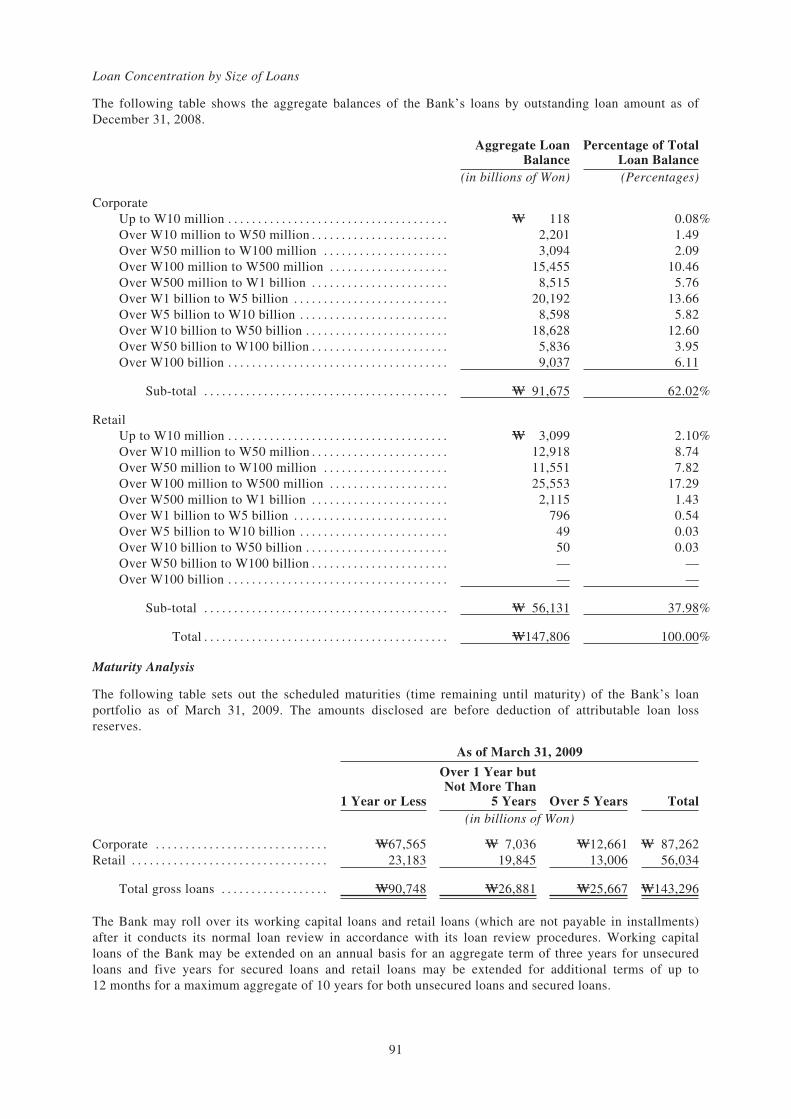
Loan Concentration by Size of Loans
The following table shows the aggregate balances of the Bank’s loans by outstanding loan amount as ofDecember 31, 2008.
Aggregate LoanBalance
Percentage of TotalLoan Balance
(in billions of Won) (Percentages)
CorporateUp to W10 million . . . . . . . . . . . . . . . . . . . . . . . . . . . . . . . . . . . . . W 118 0.08%Over W10 million to W50 million . . . . . . . . . . . . . . . . . . . . . . . 2,201 1.49Over W50 million to W100 million . . . . . . . . . . . . . . . . . . . . . 3,094 2.09Over W100 million to W500 million . . . . . . . . . . . . . . . . . . . . 15,455 10.46Over W500 million to W1 billion . . . . . . . . . . . . . . . . . . . . . . . 8,515 5.76Over W1 billion to W5 billion . . . . . . . . . . . . . . . . . . . . . . . . . . 20,192 13.66Over W5 billion to W10 billion . . . . . . . . . . . . . . . . . . . . . . . . . 8,598 5.82Over W10 billion to W50 billion . . . . . . . . . . . . . . . . . . . . . . . . 18,628 12.60Over W50 billion to W100 billion . . . . . . . . . . . . . . . . . . . . . . . 5,836 3.95Over W100 billion . . . . . . . . . . . . . . . . . . . . . . . . . . . . . . . . . . . . . 9,037 6.11
Sub-total . . . . . . . . . . . . . . . . . . . . . . . . . . . . . . . . . . . . . . . . . W 91,675 62.02%
RetailUp to W10 million . . . . . . . . . . . . . . . . . . . . . . . . . . . . . . . . . . . . . W 3,099 2.10%Over W10 million to W50 million . . . . . . . . . . . . . . . . . . . . . . . 12,918 8.74Over W50 million to W100 million . . . . . . . . . . . . . . . . . . . . . 11,551 7.82Over W100 million to W500 million . . . . . . . . . . . . . . . . . . . . 25,553 17.29Over W500 million to W1 billion . . . . . . . . . . . . . . . . . . . . . . . 2,115 1.43Over W1 billion to W5 billion . . . . . . . . . . . . . . . . . . . . . . . . . . 796 0.54Over W5 billion to W10 billion . . . . . . . . . . . . . . . . . . . . . . . . . 49 0.03Over W10 billion to W50 billion . . . . . . . . . . . . . . . . . . . . . . . . 50 0.03Over W50 billion to W100 billion . . . . . . . . . . . . . . . . . . . . . . . — —Over W100 billion . . . . . . . . . . . . . . . . . . . . . . . . . . . . . . . . . . . . . — —
Sub-total . . . . . . . . . . . . . . . . . . . . . . . . . . . . . . . . . . . . . . . . . W 56,131 37.98%
Total . . . . . . . . . . . . . . . . . . . . . . . . . . . . . . . . . . . . . . . . . W147,806 100.00%
Maturity Analysis
The following table sets out the scheduled maturities (time remaining until maturity) of the Bank’s loanportfolio as of March 31, 2009. The amounts disclosed are before deduction of attributable loan lossreserves.
As of March 31, 2009
1 Year or Less
Over 1 Year butNot More Than
5 Years Over 5 Years Total(in billions of Won)
Corporate . . . . . . . . . . . . . . . . . . . . . . . . . . . . . W67,565 W 7,036 W12,661 W 87,262Retail . . . . . . . . . . . . . . . . . . . . . . . . . . . . . . . . . 23,183 19,845 13,006 56,034
Total gross loans . . . . . . . . . . . . . . . . . . W90,748 W26,881 W25,667 W143,296
The Bank may roll over its working capital loans and retail loans (which are not payable in installments)after it conducts its normal loan review in accordance with its loan review procedures. Working capitalloans of the Bank may be extended on an annual basis for an aggregate term of three years for unsecuredloans and five years for secured loans and retail loans may be extended for additional terms of up to12 months for a maximum aggregate of 10 years for both unsecured loans and secured loans.
91
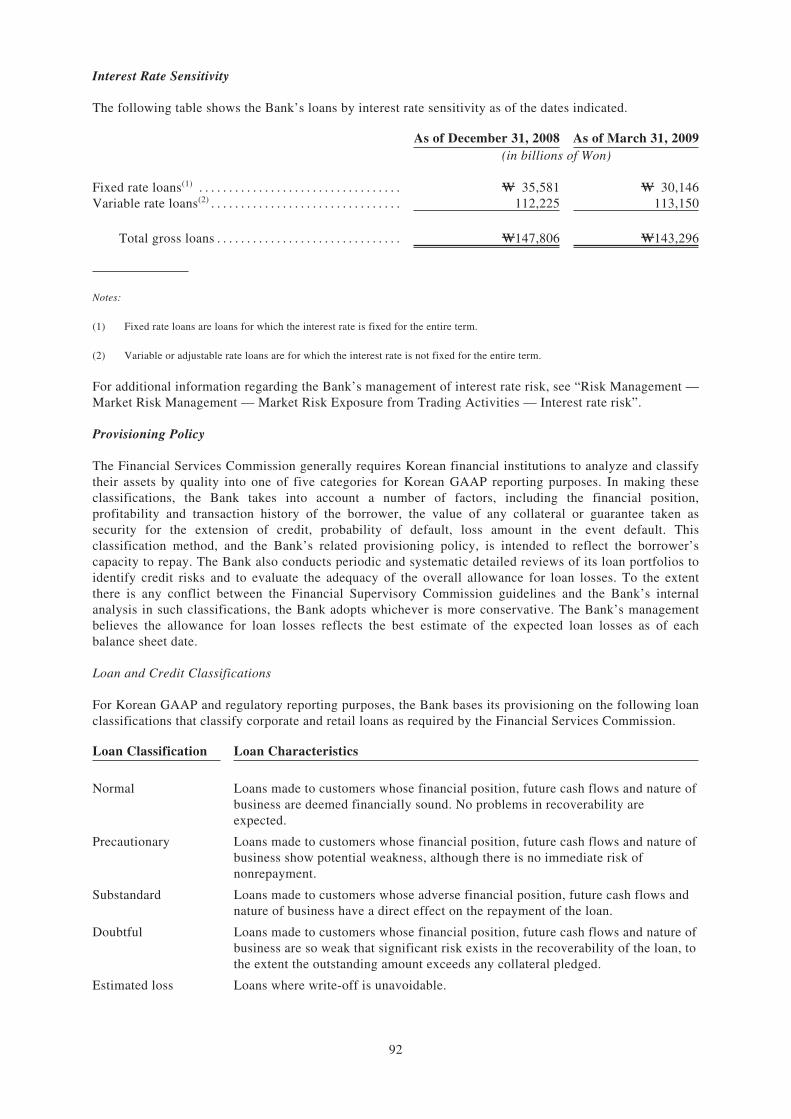
Interest Rate Sensitivity
The following table shows the Bank’s loans by interest rate sensitivity as of the dates indicated.
As of December 31, 2008 As of March 31, 2009(in billions of Won)
Fixed rate loans(1) . . . . . . . . . . . . . . . . . . . . . . . . . . . . . . . . . . W 35,581 W 30,146Variable rate loans(2) . . . . . . . . . . . . . . . . . . . . . . . . . . . . . . . . 112,225 113,150
Total gross loans . . . . . . . . . . . . . . . . . . . . . . . . . . . . . . . W147,806 W143,296
Notes:
(1) Fixed rate loans are loans for which the interest rate is fixed for the entire term.
(2) Variable or adjustable rate loans are for which the interest rate is not fixed for the entire term.
For additional information regarding the Bank’s management of interest rate risk, see “Risk Management —Market Risk Management — Market Risk Exposure from Trading Activities — Interest rate risk”.
Provisioning Policy
The Financial Services Commission generally requires Korean financial institutions to analyze and classifytheir assets by quality into one of five categories for Korean GAAP reporting purposes. In making theseclassifications, the Bank takes into account a number of factors, including the financial position,profitability and transaction history of the borrower, the value of any collateral or guarantee taken assecurity for the extension of credit, probability of default, loss amount in the event default. Thisclassification method, and the Bank’s related provisioning policy, is intended to reflect the borrower’scapacity to repay. The Bank also conducts periodic and systematic detailed reviews of its loan portfolios toidentify credit risks and to evaluate the adequacy of the overall allowance for loan losses. To the extentthere is any conflict between the Financial Supervisory Commission guidelines and the Bank’s internalanalysis in such classifications, the Bank adopts whichever is more conservative. The Bank’s managementbelieves the allowance for loan losses reflects the best estimate of the expected loan losses as of eachbalance sheet date.
Loan and Credit Classifications
For Korean GAAP and regulatory reporting purposes, the Bank bases its provisioning on the following loanclassifications that classify corporate and retail loans as required by the Financial Services Commission.
Loan Classification Loan Characteristics
Normal Loans made to customers whose financial position, future cash flows and nature ofbusiness are deemed financially sound. No problems in recoverability areexpected.
Precautionary Loans made to customers whose financial position, future cash flows and nature ofbusiness show potential weakness, although there is no immediate risk ofnonrepayment.
Substandard Loans made to customers whose adverse financial position, future cash flows andnature of business have a direct effect on the repayment of the loan.
Doubtful Loans made to customers whose financial position, future cash flows and nature ofbusiness are so weak that significant risk exists in the recoverability of the loan, tothe extent the outstanding amount exceeds any collateral pledged.
Estimated loss Loans where write-off is unavoidable.
92
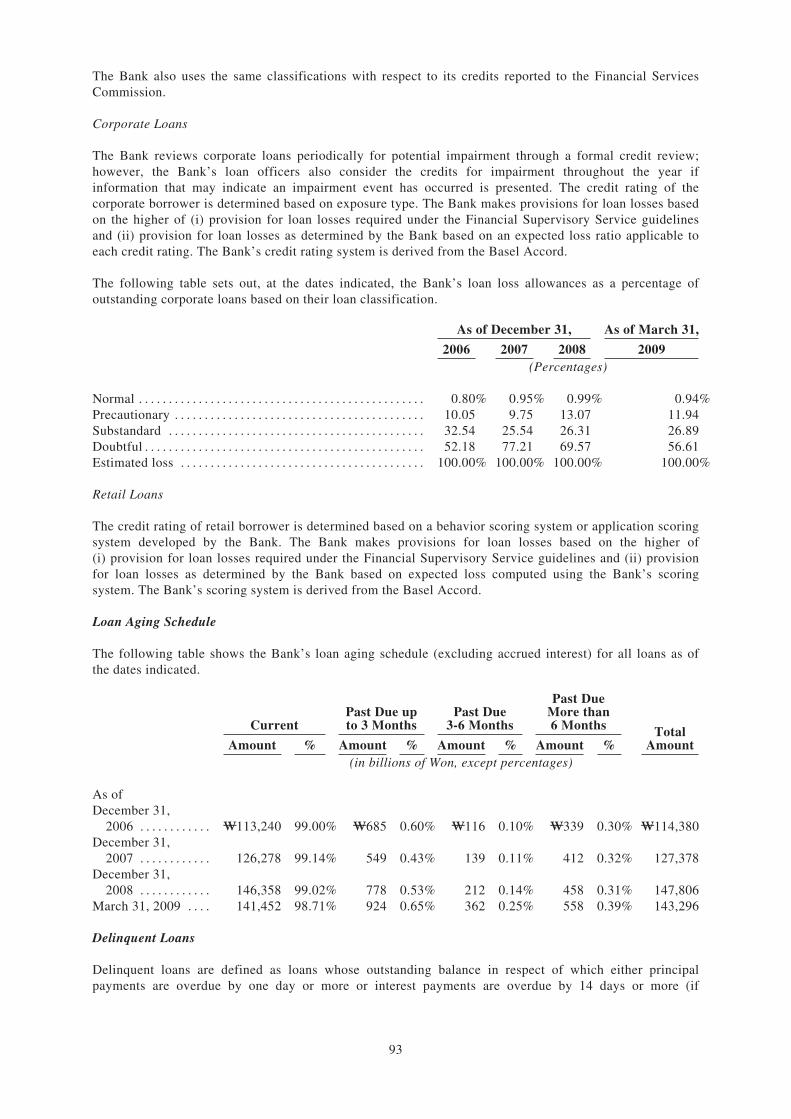
The Bank also uses the same classifications with respect to its credits reported to the Financial ServicesCommission.
Corporate Loans
The Bank reviews corporate loans periodically for potential impairment through a formal credit review;however, the Bank’s loan officers also consider the credits for impairment throughout the year ifinformation that may indicate an impairment event has occurred is presented. The credit rating of thecorporate borrower is determined based on exposure type. The Bank makes provisions for loan losses basedon the higher of (i) provision for loan losses required under the Financial Supervisory Service guidelinesand (ii) provision for loan losses as determined by the Bank based on an expected loss ratio applicable toeach credit rating. The Bank’s credit rating system is derived from the Basel Accord.
The following table sets out, at the dates indicated, the Bank’s loan loss allowances as a percentage ofoutstanding corporate loans based on their loan classification.
As of December 31, As of March 31,
2006 2007 2008 2009(Percentages)
Normal . . . . . . . . . . . . . . . . . . . . . . . . . . . . . . . . . . . . . . . . . . . . . . . . 0.80% 0.95% 0.99% 0.94%Precautionary . . . . . . . . . . . . . . . . . . . . . . . . . . . . . . . . . . . . . . . . . . 10.05 9.75 13.07 11.94Substandard . . . . . . . . . . . . . . . . . . . . . . . . . . . . . . . . . . . . . . . . . . . 32.54 25.54 26.31 26.89Doubtful . . . . . . . . . . . . . . . . . . . . . . . . . . . . . . . . . . . . . . . . . . . . . . . 52.18 77.21 69.57 56.61Estimated loss . . . . . . . . . . . . . . . . . . . . . . . . . . . . . . . . . . . . . . . . . 100.00% 100.00% 100.00% 100.00%
Retail Loans
The credit rating of retail borrower is determined based on a behavior scoring system or application scoringsystem developed by the Bank. The Bank makes provisions for loan losses based on the higher of(i) provision for loan losses required under the Financial Supervisory Service guidelines and (ii) provisionfor loan losses as determined by the Bank based on expected loss computed using the Bank’s scoringsystem. The Bank’s scoring system is derived from the Basel Accord.
Loan Aging Schedule
The following table shows the Bank’s loan aging schedule (excluding accrued interest) for all loans as ofthe dates indicated.
CurrentPast Due upto 3 Months
Past Due3-6 Months
Past DueMore than6 Months Total
AmountAmount % Amount % Amount % Amount %(in billions of Won, except percentages)
As ofDecember 31,
2006 . . . . . . . . . . . . W113,240 99.00% W685 0.60% W116 0.10% W339 0.30% W114,380December 31,
2007 . . . . . . . . . . . . 126,278 99.14% 549 0.43% 139 0.11% 412 0.32% 127,378December 31,
2008 . . . . . . . . . . . . 146,358 99.02% 778 0.53% 212 0.14% 458 0.31% 147,806March 31, 2009 . . . . 141,452 98.71% 924 0.65% 362 0.25% 558 0.39% 143,296
Delinquent Loans
Delinquent loans are defined as loans whose outstanding balance in respect of which either principalpayments are overdue by one day or more or interest payments are overdue by 14 days or more (if
93
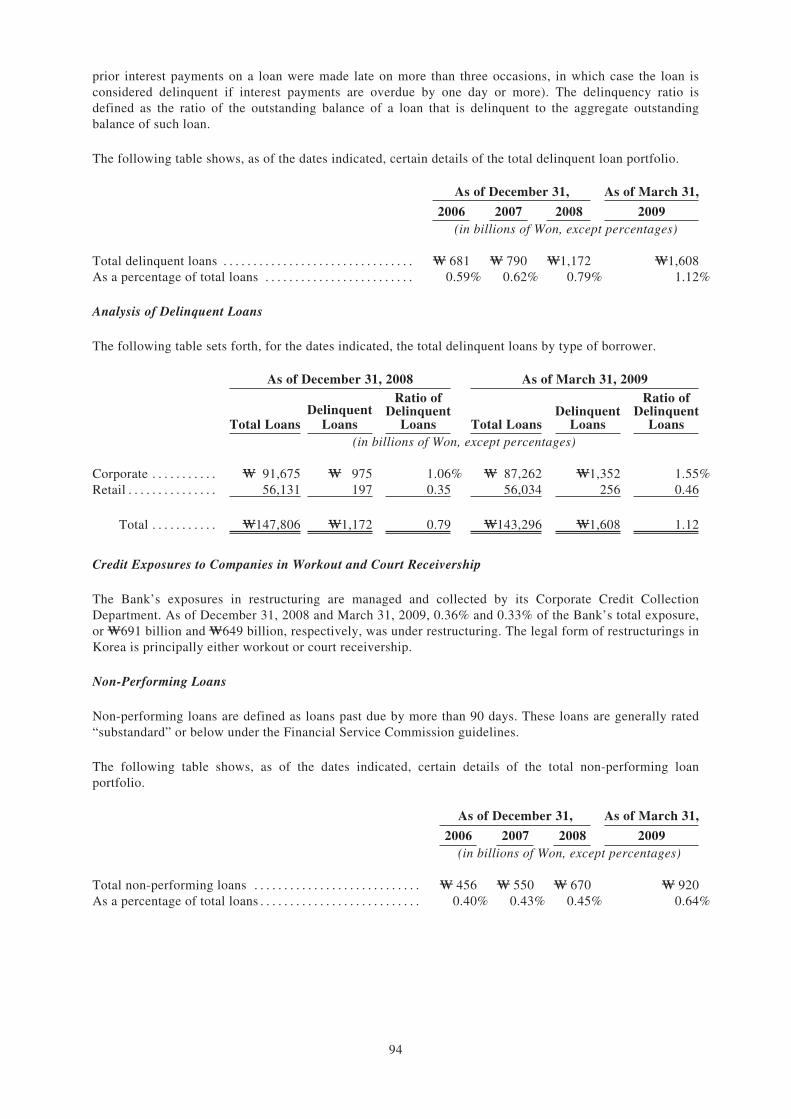
prior interest payments on a loan were made late on more than three occasions, in which case the loan isconsidered delinquent if interest payments are overdue by one day or more). The delinquency ratio isdefined as the ratio of the outstanding balance of a loan that is delinquent to the aggregate outstandingbalance of such loan.
The following table shows, as of the dates indicated, certain details of the total delinquent loan portfolio.
As of December 31, As of March 31,
2006 2007 2008 2009(in billions of Won, except percentages)
Total delinquent loans . . . . . . . . . . . . . . . . . . . . . . . . . . . . . . . . W 681 W 790 W1,172 W1,608As a percentage of total loans . . . . . . . . . . . . . . . . . . . . . . . . . 0.59% 0.62% 0.79% 1.12%
Analysis of Delinquent Loans
The following table sets forth, for the dates indicated, the total delinquent loans by type of borrower.
As of December 31, 2008 As of March 31, 2009
Total LoansDelinquent
Loans
Ratio ofDelinquent
Loans Total LoansDelinquent
Loans
Ratio ofDelinquent
Loans(in billions of Won, except percentages)
Corporate . . . . . . . . . . . W 91,675 W 975 1.06% W 87,262 W1,352 1.55%Retail . . . . . . . . . . . . . . . 56,131 197 0.35 56,034 256 0.46
Total . . . . . . . . . . . W147,806 W1,172 0.79 W143,296 W1,608 1.12
Credit Exposures to Companies in Workout and Court Receivership
The Bank’s exposures in restructuring are managed and collected by its Corporate Credit CollectionDepartment. As of December 31, 2008 and March 31, 2009, 0.36% and 0.33% of the Bank’s total exposure,or W691 billion and W649 billion, respectively, was under restructuring. The legal form of restructurings inKorea is principally either workout or court receivership.
Non-Performing Loans
Non-performing loans are defined as loans past due by more than 90 days. These loans are generally rated“substandard” or below under the Financial Service Commission guidelines.
The following table shows, as of the dates indicated, certain details of the total non-performing loanportfolio.
As of December 31, As of March 31,
2006 2007 2008 2009(in billions of Won, except percentages)
Total non-performing loans . . . . . . . . . . . . . . . . . . . . . . . . . . . . W 456 W 550 W 670 W 920As a percentage of total loans . . . . . . . . . . . . . . . . . . . . . . . . . . . 0.40% 0.43% 0.45% 0.64%
94
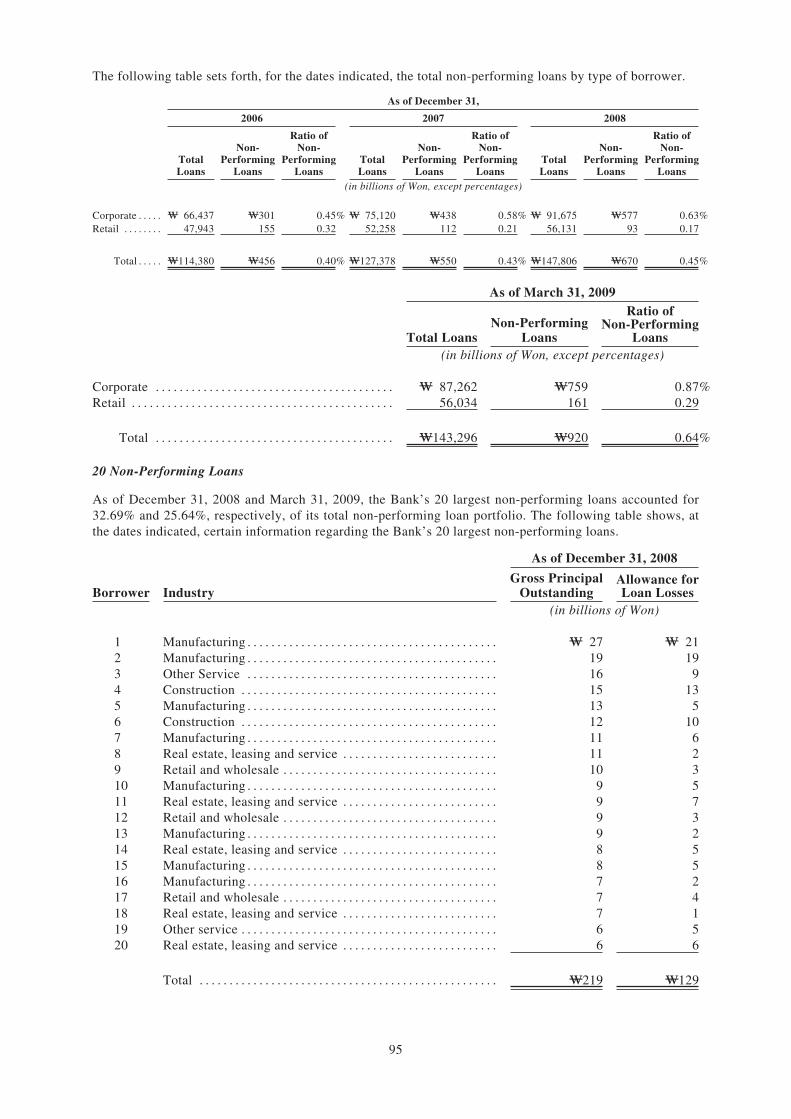
The following table sets forth, for the dates indicated, the total non-performing loans by type of borrower.
As of December 31,
2006 2007 2008
TotalLoans
Non-Performing
Loans
Ratio ofNon-
PerformingLoans
TotalLoans
Non-Performing
Loans
Ratio ofNon-
PerformingLoans
TotalLoans
Non-Performing
Loans
Ratio ofNon-
PerformingLoans
(in billions of Won, except percentages)
Corporate . . . . . W 66,437 W301 0.45% W 75,120 W438 0.58% W 91,675 W577 0.63%Retail . . . . . . . . 47,943 155 0.32 52,258 112 0.21 56,131 93 0.17
Total . . . . . W114,380 W456 0.40% W127,378 W550 0.43% W147,806 W670 0.45%
As of March 31, 2009
Total LoansNon-Performing
Loans
Ratio ofNon-Performing
Loans(in billions of Won, except percentages)
Corporate . . . . . . . . . . . . . . . . . . . . . . . . . . . . . . . . . . . . . . . . W 87,262 W759 0.87%Retail . . . . . . . . . . . . . . . . . . . . . . . . . . . . . . . . . . . . . . . . . . . . 56,034 161 0.29
Total . . . . . . . . . . . . . . . . . . . . . . . . . . . . . . . . . . . . . . . . W143,296 W920 0.64%
20 Non-Performing Loans
As of December 31, 2008 and March 31, 2009, the Bank’s 20 largest non-performing loans accounted for32.69% and 25.64%, respectively, of its total non-performing loan portfolio. The following table shows, atthe dates indicated, certain information regarding the Bank’s 20 largest non-performing loans.
As of December 31, 2008
Borrower IndustryGross Principal
OutstandingAllowance forLoan Losses
(in billions of Won)
1 Manufacturing . . . . . . . . . . . . . . . . . . . . . . . . . . . . . . . . . . . . . . . . . . W 27 W 212 Manufacturing . . . . . . . . . . . . . . . . . . . . . . . . . . . . . . . . . . . . . . . . . . 19 193 Other Service . . . . . . . . . . . . . . . . . . . . . . . . . . . . . . . . . . . . . . . . . . 16 94 Construction . . . . . . . . . . . . . . . . . . . . . . . . . . . . . . . . . . . . . . . . . . . 15 135 Manufacturing . . . . . . . . . . . . . . . . . . . . . . . . . . . . . . . . . . . . . . . . . . 13 56 Construction . . . . . . . . . . . . . . . . . . . . . . . . . . . . . . . . . . . . . . . . . . . 12 107 Manufacturing . . . . . . . . . . . . . . . . . . . . . . . . . . . . . . . . . . . . . . . . . . 11 68 Real estate, leasing and service . . . . . . . . . . . . . . . . . . . . . . . . . . 11 29 Retail and wholesale . . . . . . . . . . . . . . . . . . . . . . . . . . . . . . . . . . . . 10 310 Manufacturing . . . . . . . . . . . . . . . . . . . . . . . . . . . . . . . . . . . . . . . . . . 9 511 Real estate, leasing and service . . . . . . . . . . . . . . . . . . . . . . . . . . 9 712 Retail and wholesale . . . . . . . . . . . . . . . . . . . . . . . . . . . . . . . . . . . . 9 313 Manufacturing . . . . . . . . . . . . . . . . . . . . . . . . . . . . . . . . . . . . . . . . . . 9 214 Real estate, leasing and service . . . . . . . . . . . . . . . . . . . . . . . . . . 8 515 Manufacturing . . . . . . . . . . . . . . . . . . . . . . . . . . . . . . . . . . . . . . . . . . 8 516 Manufacturing . . . . . . . . . . . . . . . . . . . . . . . . . . . . . . . . . . . . . . . . . . 7 217 Retail and wholesale . . . . . . . . . . . . . . . . . . . . . . . . . . . . . . . . . . . . 7 418 Real estate, leasing and service . . . . . . . . . . . . . . . . . . . . . . . . . . 7 119 Other service . . . . . . . . . . . . . . . . . . . . . . . . . . . . . . . . . . . . . . . . . . . 6 520 Real estate, leasing and service . . . . . . . . . . . . . . . . . . . . . . . . . . 6 6
Total . . . . . . . . . . . . . . . . . . . . . . . . . . . . . . . . . . . . . . . . . . . . . . . . . . W219 W129
95
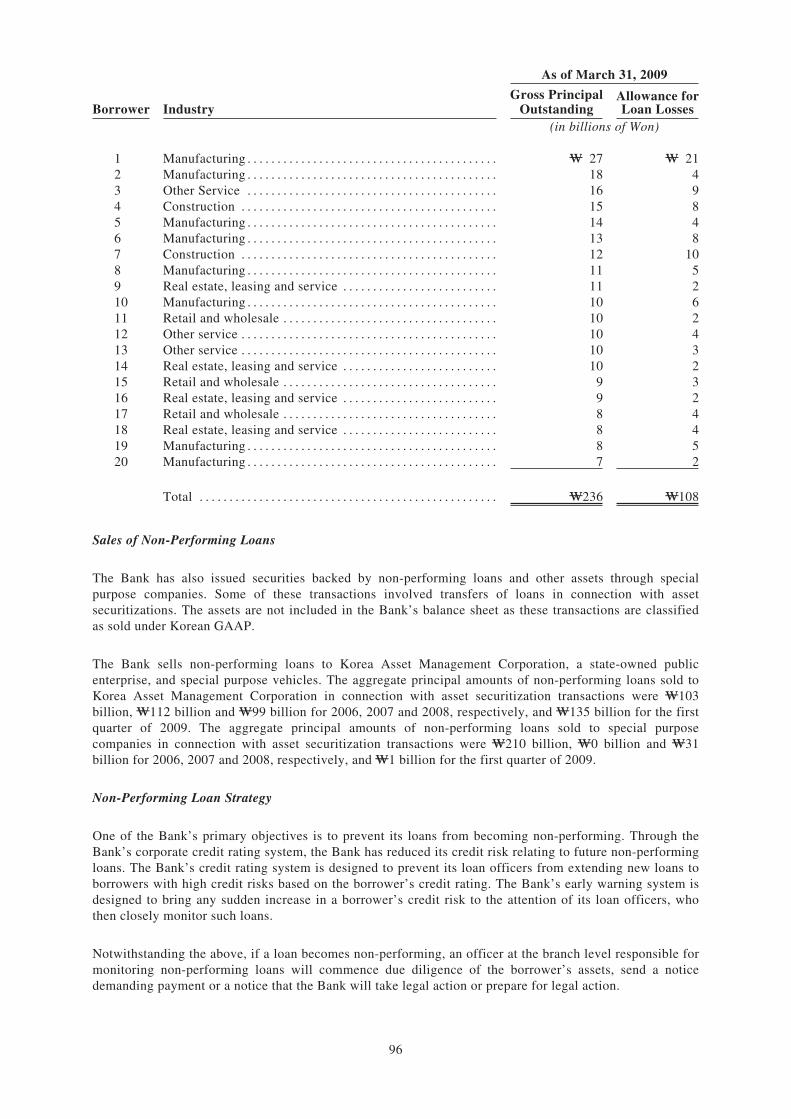
As of March 31, 2009
Borrower IndustryGross Principal
OutstandingAllowance forLoan Losses
(in billions of Won)
1 Manufacturing . . . . . . . . . . . . . . . . . . . . . . . . . . . . . . . . . . . . . . . . . . W 27 W 212 Manufacturing . . . . . . . . . . . . . . . . . . . . . . . . . . . . . . . . . . . . . . . . . . 18 43 Other Service . . . . . . . . . . . . . . . . . . . . . . . . . . . . . . . . . . . . . . . . . . 16 94 Construction . . . . . . . . . . . . . . . . . . . . . . . . . . . . . . . . . . . . . . . . . . . 15 85 Manufacturing . . . . . . . . . . . . . . . . . . . . . . . . . . . . . . . . . . . . . . . . . . 14 46 Manufacturing . . . . . . . . . . . . . . . . . . . . . . . . . . . . . . . . . . . . . . . . . . 13 87 Construction . . . . . . . . . . . . . . . . . . . . . . . . . . . . . . . . . . . . . . . . . . . 12 108 Manufacturing . . . . . . . . . . . . . . . . . . . . . . . . . . . . . . . . . . . . . . . . . . 11 59 Real estate, leasing and service . . . . . . . . . . . . . . . . . . . . . . . . . . 11 210 Manufacturing . . . . . . . . . . . . . . . . . . . . . . . . . . . . . . . . . . . . . . . . . . 10 611 Retail and wholesale . . . . . . . . . . . . . . . . . . . . . . . . . . . . . . . . . . . . 10 212 Other service . . . . . . . . . . . . . . . . . . . . . . . . . . . . . . . . . . . . . . . . . . . 10 413 Other service . . . . . . . . . . . . . . . . . . . . . . . . . . . . . . . . . . . . . . . . . . . 10 314 Real estate, leasing and service . . . . . . . . . . . . . . . . . . . . . . . . . . 10 215 Retail and wholesale . . . . . . . . . . . . . . . . . . . . . . . . . . . . . . . . . . . . 9 316 Real estate, leasing and service . . . . . . . . . . . . . . . . . . . . . . . . . . 9 217 Retail and wholesale . . . . . . . . . . . . . . . . . . . . . . . . . . . . . . . . . . . . 8 418 Real estate, leasing and service . . . . . . . . . . . . . . . . . . . . . . . . . . 8 419 Manufacturing . . . . . . . . . . . . . . . . . . . . . . . . . . . . . . . . . . . . . . . . . . 8 520 Manufacturing . . . . . . . . . . . . . . . . . . . . . . . . . . . . . . . . . . . . . . . . . . 7 2
Total . . . . . . . . . . . . . . . . . . . . . . . . . . . . . . . . . . . . . . . . . . . . . . . . . . W236 W108
Sales of Non-Performing Loans
The Bank has also issued securities backed by non-performing loans and other assets through specialpurpose companies. Some of these transactions involved transfers of loans in connection with assetsecuritizations. The assets are not included in the Bank’s balance sheet as these transactions are classifiedas sold under Korean GAAP.
The Bank sells non-performing loans to Korea Asset Management Corporation, a state-owned publicenterprise, and special purpose vehicles. The aggregate principal amounts of non-performing loans sold toKorea Asset Management Corporation in connection with asset securitization transactions were W103billion, W112 billion and W99 billion for 2006, 2007 and 2008, respectively, and W135 billion for the firstquarter of 2009. The aggregate principal amounts of non-performing loans sold to special purposecompanies in connection with asset securitization transactions were W210 billion, W0 billion and W31billion for 2006, 2007 and 2008, respectively, and W1 billion for the first quarter of 2009.
Non-Performing Loan Strategy
One of the Bank’s primary objectives is to prevent its loans from becoming non-performing. Through theBank’s corporate credit rating system, the Bank has reduced its credit risk relating to future non-performingloans. The Bank’s credit rating system is designed to prevent its loan officers from extending new loans toborrowers with high credit risks based on the borrower’s credit rating. The Bank’s early warning system isdesigned to bring any sudden increase in a borrower’s credit risk to the attention of its loan officers, whothen closely monitor such loans.
Notwithstanding the above, if a loan becomes non-performing, an officer at the branch level responsible formonitoring non-performing loans will commence due diligence of the borrower’s assets, send a noticedemanding payment or a notice that the Bank will take legal action or prepare for legal action.
96
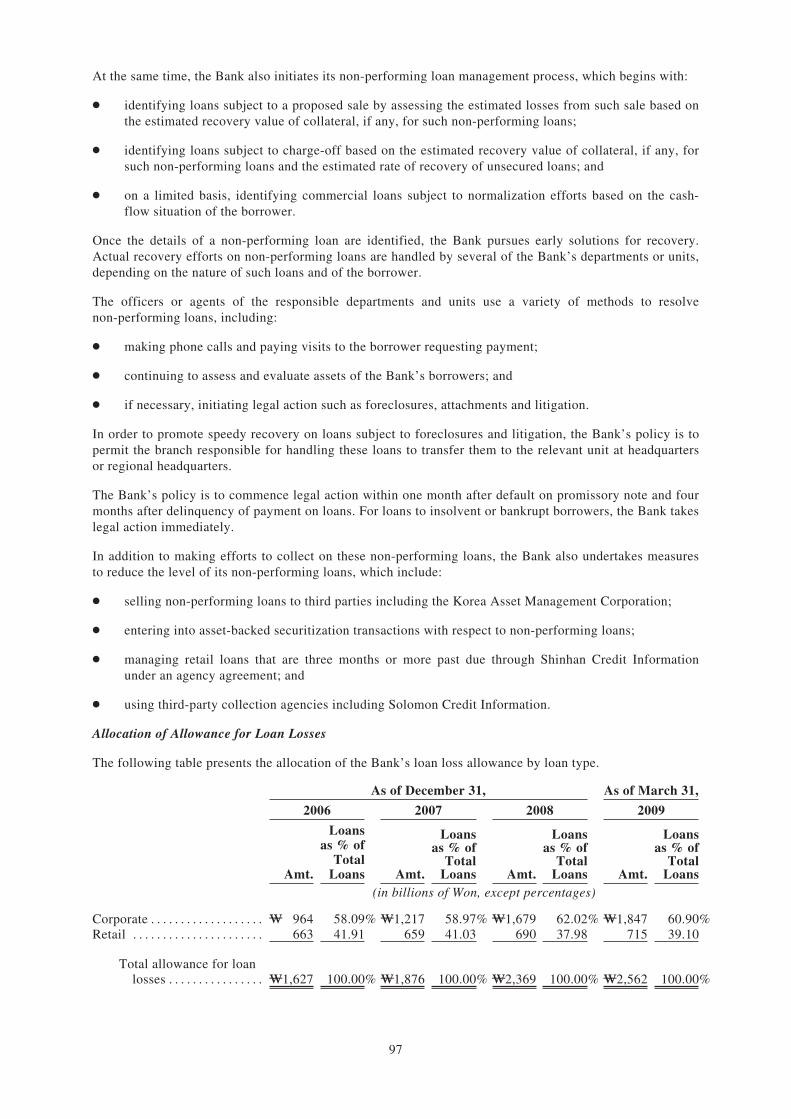
At the same time, the Bank also initiates its non-performing loan management process, which begins with:
Š identifying loans subject to a proposed sale by assessing the estimated losses from such sale based onthe estimated recovery value of collateral, if any, for such non-performing loans;
Š identifying loans subject to charge-off based on the estimated recovery value of collateral, if any, forsuch non-performing loans and the estimated rate of recovery of unsecured loans; and
Š on a limited basis, identifying commercial loans subject to normalization efforts based on the cash-flow situation of the borrower.
Once the details of a non-performing loan are identified, the Bank pursues early solutions for recovery.Actual recovery efforts on non-performing loans are handled by several of the Bank’s departments or units,depending on the nature of such loans and of the borrower.
The officers or agents of the responsible departments and units use a variety of methods to resolvenon-performing loans, including:
Š making phone calls and paying visits to the borrower requesting payment;
Š continuing to assess and evaluate assets of the Bank’s borrowers; and
Š if necessary, initiating legal action such as foreclosures, attachments and litigation.
In order to promote speedy recovery on loans subject to foreclosures and litigation, the Bank’s policy is topermit the branch responsible for handling these loans to transfer them to the relevant unit at headquartersor regional headquarters.
The Bank’s policy is to commence legal action within one month after default on promissory note and fourmonths after delinquency of payment on loans. For loans to insolvent or bankrupt borrowers, the Bank takeslegal action immediately.
In addition to making efforts to collect on these non-performing loans, the Bank also undertakes measuresto reduce the level of its non-performing loans, which include:
Š selling non-performing loans to third parties including the Korea Asset Management Corporation;
Š entering into asset-backed securitization transactions with respect to non-performing loans;
Š managing retail loans that are three months or more past due through Shinhan Credit Informationunder an agency agreement; and
Š using third-party collection agencies including Solomon Credit Information.
Allocation of Allowance for Loan Losses
The following table presents the allocation of the Bank’s loan loss allowance by loan type.
As of December 31, As of March 31,
2006 2007 2008 2009
Amt.
Loansas % of
TotalLoans Amt.
Loansas % of
TotalLoans Amt.
Loansas % of
TotalLoans Amt.
Loansas % of
TotalLoans
(in billions of Won, except percentages)
Corporate . . . . . . . . . . . . . . . . . . . W 964 58.09% W1,217 58.97% W1,679 62.02% W1,847 60.90%Retail . . . . . . . . . . . . . . . . . . . . . . 663 41.91 659 41.03 690 37.98 715 39.10
Total allowance for loanlosses . . . . . . . . . . . . . . . . W1,627 100.00% W1,876 100.00% W2,369 100.00% W2,562 100.00%
97
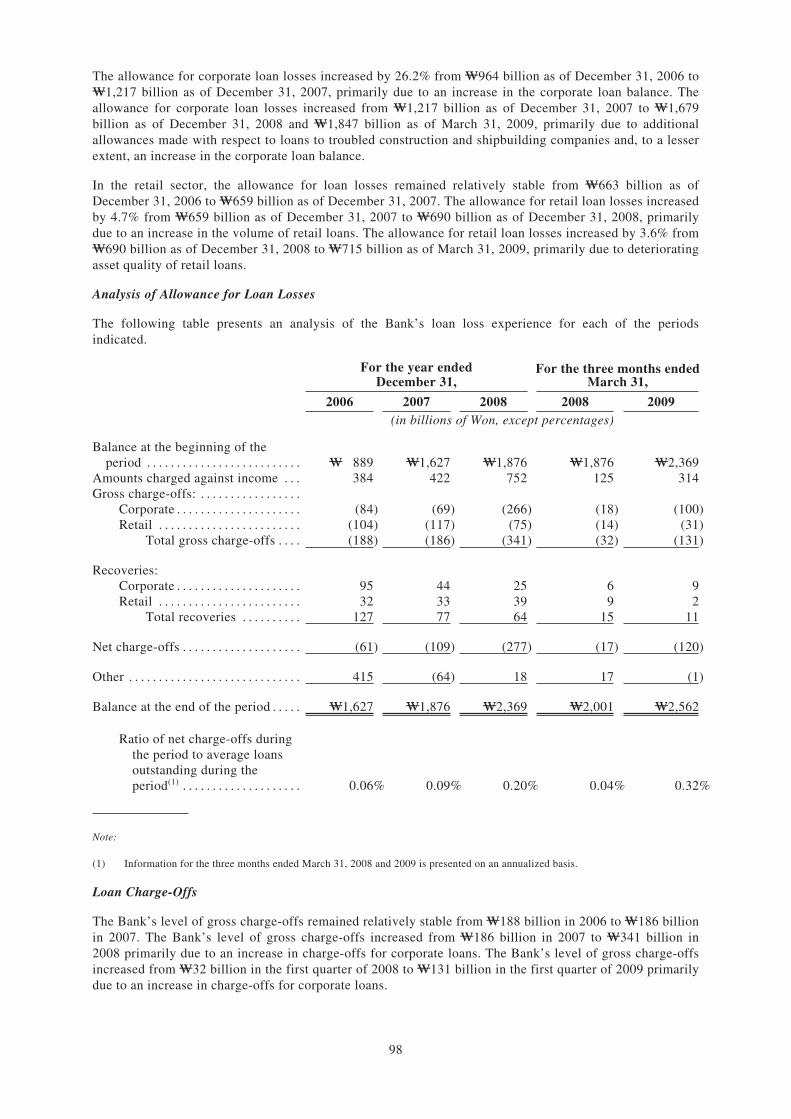
The allowance for corporate loan losses increased by 26.2% from W964 billion as of December 31, 2006 toW1,217 billion as of December 31, 2007, primarily due to an increase in the corporate loan balance. Theallowance for corporate loan losses increased from W1,217 billion as of December 31, 2007 to W1,679billion as of December 31, 2008 and W1,847 billion as of March 31, 2009, primarily due to additionalallowances made with respect to loans to troubled construction and shipbuilding companies and, to a lesserextent, an increase in the corporate loan balance.
In the retail sector, the allowance for loan losses remained relatively stable from W663 billion as ofDecember 31, 2006 to W659 billion as of December 31, 2007. The allowance for retail loan losses increasedby 4.7% from W659 billion as of December 31, 2007 to W690 billion as of December 31, 2008, primarilydue to an increase in the volume of retail loans. The allowance for retail loan losses increased by 3.6% fromW690 billion as of December 31, 2008 to W715 billion as of March 31, 2009, primarily due to deterioratingasset quality of retail loans.
Analysis of Allowance for Loan Losses
The following table presents an analysis of the Bank’s loan loss experience for each of the periodsindicated.
For the year endedDecember 31,
For the three months endedMarch 31,
2006 2007 2008 2008 2009(in billions of Won, except percentages)
Balance at the beginning of theperiod . . . . . . . . . . . . . . . . . . . . . . . . . . W 889 W1,627 W1,876 W1,876 W2,369
Amounts charged against income . . . 384 422 752 125 314Gross charge-offs: . . . . . . . . . . . . . . . . .
Corporate . . . . . . . . . . . . . . . . . . . . . (84) (69) (266) (18) (100)Retail . . . . . . . . . . . . . . . . . . . . . . . . (104) (117) (75) (14) (31)
Total gross charge-offs . . . . (188) (186) (341) (32) (131)
Recoveries:Corporate . . . . . . . . . . . . . . . . . . . . . 95 44 25 6 9Retail . . . . . . . . . . . . . . . . . . . . . . . . 32 33 39 9 2
Total recoveries . . . . . . . . . . 127 77 64 15 11
Net charge-offs . . . . . . . . . . . . . . . . . . . . (61) (109) (277) (17) (120)
Other . . . . . . . . . . . . . . . . . . . . . . . . . . . . . 415 (64) 18 17 (1)
Balance at the end of the period . . . . . W1,627 W1,876 W2,369 W2,001 W2,562
Ratio of net charge-offs duringthe period to average loansoutstanding during theperiod(1) . . . . . . . . . . . . . . . . . . . . 0.06% 0.09% 0.20% 0.04% 0.32%
Note:
(1) Information for the three months ended March 31, 2008 and 2009 is presented on an annualized basis.
Loan Charge-Offs
The Bank’s level of gross charge-offs remained relatively stable from W188 billion in 2006 to W186 billionin 2007. The Bank’s level of gross charge-offs increased from W186 billion in 2007 to W341 billion in2008 primarily due to an increase in charge-offs for corporate loans. The Bank’s level of gross charge-offsincreased from W32 billion in the first quarter of 2008 to W131 billion in the first quarter of 2009 primarilydue to an increase in charge-offs for corporate loans.
98
Basic Principles
The Bank attempts to minimize loans to be charged off, by practicing a sound credit approval process basedon credit risk analysis prior to extending loans and a systematic management of outstanding loans.
Loans To Be Charged-Off
Loans are charged-off if they are deemed to be uncollectible by falling under any of the followingcategories:
Š loans for which collection is not foreseeable due to insolvency, bankruptcy, dissolution or the shuttingdown of the business of the debtor;
Š loans for which collection is not foreseeable due to the death or disappearance of the debtor;
Š loans for which expenses of collection exceed the collectable amount;
Š loans on which collection is not possible through legal or any other means; or
Š the portion of loans classified as “estimated loss”, net of any recovery from collateral, which isdeemed to be uncollectible.
Procedure for Charge-off Approval
An application for the Bank’s loans to be charged-off is submitted by a branch to the Corporate CreditCollection Department in the case of corporate loans and foreign branches, and to the Consumer CreditCollection Department in the case of individual loans. An application for charge-off is generally submittedimmediately after the relevant loan becomes 180 days past due. The General Manager in charge of reviewevaluates the application. The General Manager of the Audit Department conducts a review of compliancewith the Bank’s internal procedures for charge-offs. The General Manager in charge of review gets approvalfrom the President of the Bank.
Treatment of Loans Charged-Off
Once loans are charged-off, they are derecognized from the Bank’s balance sheet. The Bank still continuesits collection efforts in respect of these loans through third-party collection agencies including Korea AssetManagement Corporation and Shinhan Credit Information.
Treatment of Collateral
When the Bank determines that a loan collateralized by real estate cannot be recovered through normalcollection channels, the Bank will petition a court to foreclose and sell the collateral through a court-supervised auction within one month after default and insolvency and within four months after delinquency.However, this treatment does not apply to companies under restructuring, workout or other courtproceedings subjecting them to restrictions on such auction procedures. In the Bank’s experience, the filingof this petition with the court generally encourages the debtor to repay the overdue loan. If a debtorultimately fails to repay and the court grants its approval for foreclosure, the Bank will sell the collateraland recover the full principal amount and accrued interest up to the sales price, net of expenses incurredfrom the auction. Foreclosure proceedings under laws and regulations in Korea typically take from sevenmonths to one year from initiation to collection depending on the nature of the collateral.
99
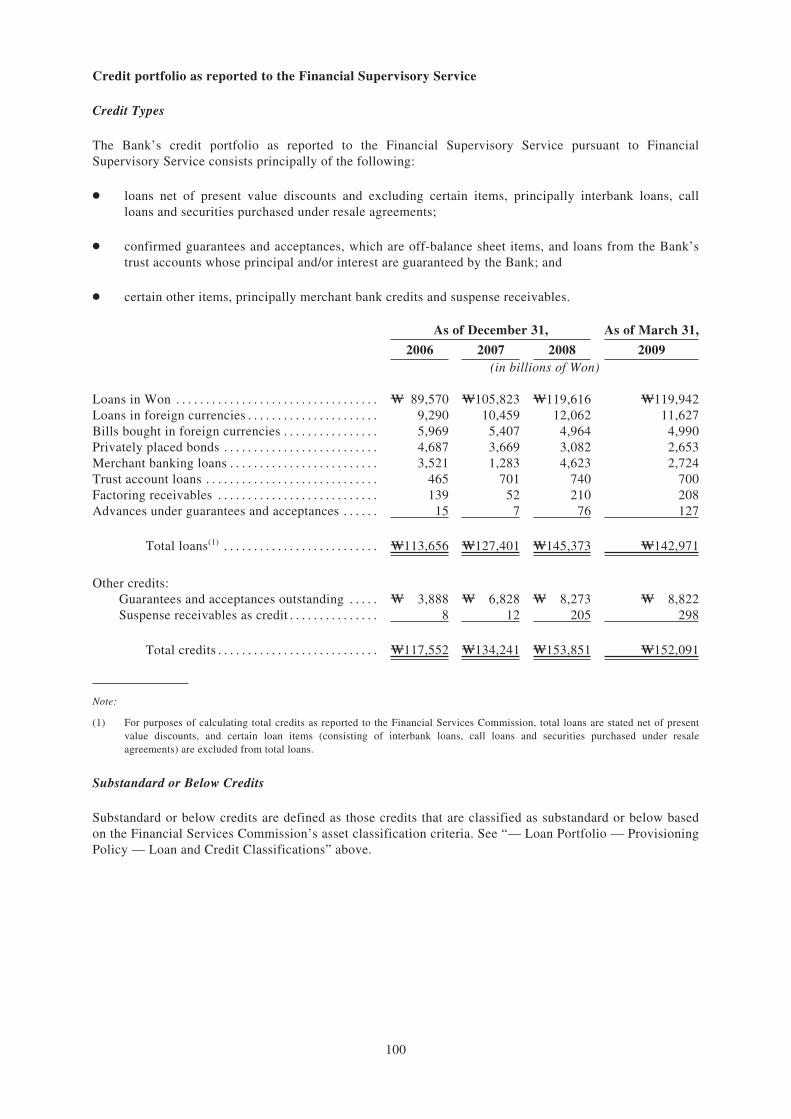
Credit portfolio as reported to the Financial Supervisory Service
Credit Types
The Bank’s credit portfolio as reported to the Financial Supervisory Service pursuant to FinancialSupervisory Service consists principally of the following:
Š loans net of present value discounts and excluding certain items, principally interbank loans, callloans and securities purchased under resale agreements;
Š confirmed guarantees and acceptances, which are off-balance sheet items, and loans from the Bank’strust accounts whose principal and/or interest are guaranteed by the Bank; and
Š certain other items, principally merchant bank credits and suspense receivables.
As of December 31, As of March 31,
2006 2007 2008 2009(in billions of Won)
Loans in Won . . . . . . . . . . . . . . . . . . . . . . . . . . . . . . . . . . W 89,570 W105,823 W119,616 W119,942Loans in foreign currencies . . . . . . . . . . . . . . . . . . . . . . 9,290 10,459 12,062 11,627Bills bought in foreign currencies . . . . . . . . . . . . . . . . 5,969 5,407 4,964 4,990Privately placed bonds . . . . . . . . . . . . . . . . . . . . . . . . . . 4,687 3,669 3,082 2,653Merchant banking loans . . . . . . . . . . . . . . . . . . . . . . . . . 3,521 1,283 4,623 2,724Trust account loans . . . . . . . . . . . . . . . . . . . . . . . . . . . . . 465 701 740 700Factoring receivables . . . . . . . . . . . . . . . . . . . . . . . . . . . 139 52 210 208Advances under guarantees and acceptances . . . . . . 15 7 76 127
Total loans(1) . . . . . . . . . . . . . . . . . . . . . . . . . . W113,656 W127,401 W145,373 W142,971
Other credits:Guarantees and acceptances outstanding . . . . . W 3,888 W 6,828 W 8,273 W 8,822Suspense receivables as credit . . . . . . . . . . . . . . . 8 12 205 298
Total credits . . . . . . . . . . . . . . . . . . . . . . . . . . . W117,552 W134,241 W153,851 W152,091
Note:
(1) For purposes of calculating total credits as reported to the Financial Services Commission, total loans are stated net of presentvalue discounts, and certain loan items (consisting of interbank loans, call loans and securities purchased under resaleagreements) are excluded from total loans.
Substandard or Below Credits
Substandard or below credits are defined as those credits that are classified as substandard or below basedon the Financial Services Commission’s asset classification criteria. See “— Loan Portfolio — ProvisioningPolicy — Loan and Credit Classifications” above.
100
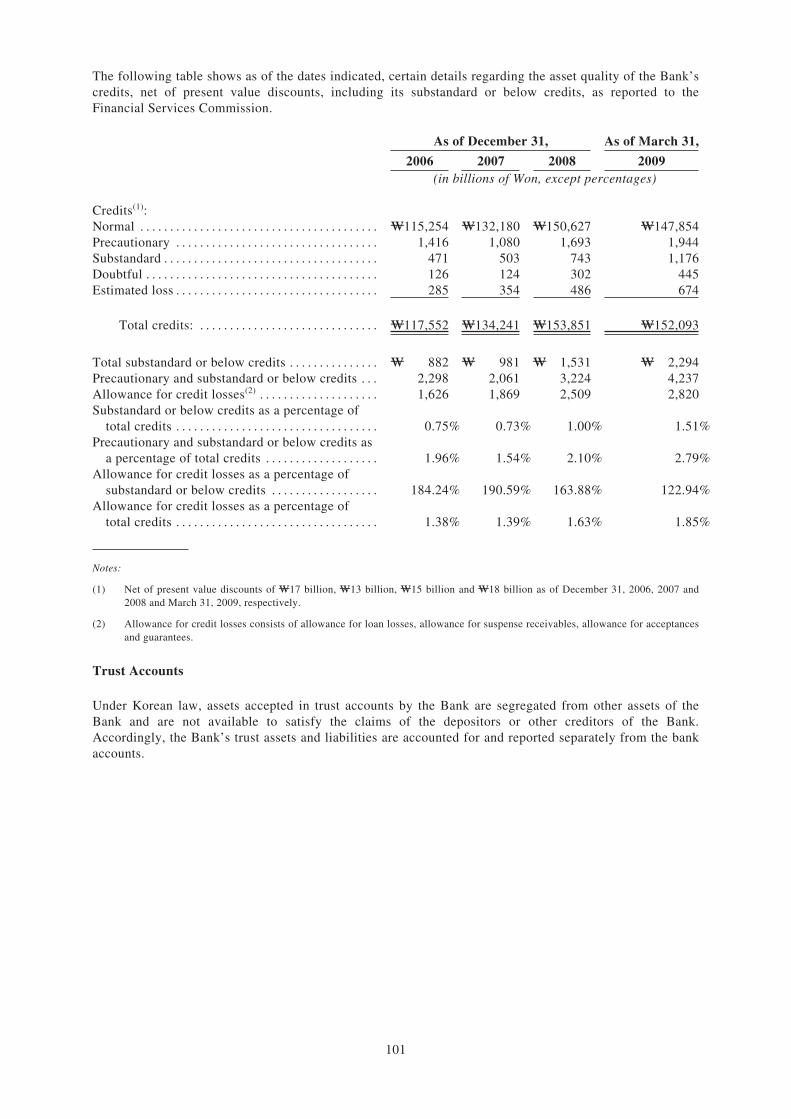
The following table shows as of the dates indicated, certain details regarding the asset quality of the Bank’scredits, net of present value discounts, including its substandard or below credits, as reported to theFinancial Services Commission.
As of December 31, As of March 31,
2006 2007 2008 2009(in billions of Won, except percentages)
Credits(1):Normal . . . . . . . . . . . . . . . . . . . . . . . . . . . . . . . . . . . . . . . . W115,254 W132,180 W150,627 W147,854Precautionary . . . . . . . . . . . . . . . . . . . . . . . . . . . . . . . . . . 1,416 1,080 1,693 1,944Substandard . . . . . . . . . . . . . . . . . . . . . . . . . . . . . . . . . . . . 471 503 743 1,176Doubtful . . . . . . . . . . . . . . . . . . . . . . . . . . . . . . . . . . . . . . . 126 124 302 445Estimated loss . . . . . . . . . . . . . . . . . . . . . . . . . . . . . . . . . . 285 354 486 674
Total credits: . . . . . . . . . . . . . . . . . . . . . . . . . . . . . . W117,552 W134,241 W153,851 W152,093
Total substandard or below credits . . . . . . . . . . . . . . . W 882 W 981 W 1,531 W 2,294Precautionary and substandard or below credits . . . 2,298 2,061 3,224 4,237Allowance for credit losses(2) . . . . . . . . . . . . . . . . . . . . 1,626 1,869 2,509 2,820Substandard or below credits as a percentage of
total credits . . . . . . . . . . . . . . . . . . . . . . . . . . . . . . . . . . 0.75% 0.73% 1.00% 1.51%Precautionary and substandard or below credits as
a percentage of total credits . . . . . . . . . . . . . . . . . . . 1.96% 1.54% 2.10% 2.79%Allowance for credit losses as a percentage of
substandard or below credits . . . . . . . . . . . . . . . . . . 184.24% 190.59% 163.88% 122.94%Allowance for credit losses as a percentage of
total credits . . . . . . . . . . . . . . . . . . . . . . . . . . . . . . . . . . 1.38% 1.39% 1.63% 1.85%
Notes:
(1) Net of present value discounts of W17 billion, W13 billion, W15 billion and W18 billion as of December 31, 2006, 2007 and2008 and March 31, 2009, respectively.
(2) Allowance for credit losses consists of allowance for loan losses, allowance for suspense receivables, allowance for acceptancesand guarantees.
Trust Accounts
Under Korean law, assets accepted in trust accounts by the Bank are segregated from other assets of theBank and are not available to satisfy the claims of the depositors or other creditors of the Bank.Accordingly, the Bank’s trust assets and liabilities are accounted for and reported separately from the bankaccounts.
101
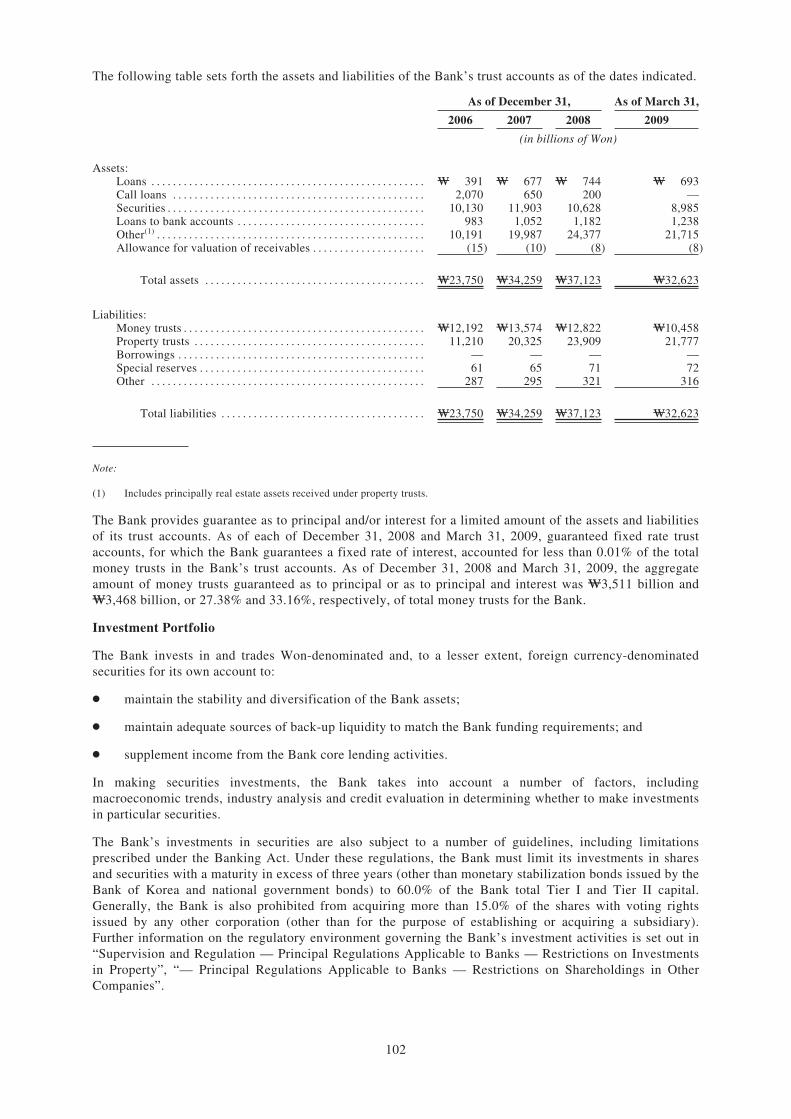
The following table sets forth the assets and liabilities of the Bank’s trust accounts as of the dates indicated.
As of December 31, As of March 31,
2006 2007 2008 2009
(in billions of Won)
Assets:Loans . . . . . . . . . . . . . . . . . . . . . . . . . . . . . . . . . . . . . . . . . . . . . . . . . . . W 391 W 677 W 744 W 693Call loans . . . . . . . . . . . . . . . . . . . . . . . . . . . . . . . . . . . . . . . . . . . . . . . 2,070 650 200 —Securities . . . . . . . . . . . . . . . . . . . . . . . . . . . . . . . . . . . . . . . . . . . . . . . . 10,130 11,903 10,628 8,985Loans to bank accounts . . . . . . . . . . . . . . . . . . . . . . . . . . . . . . . . . . . 983 1,052 1,182 1,238Other(1) . . . . . . . . . . . . . . . . . . . . . . . . . . . . . . . . . . . . . . . . . . . . . . . . . . 10,191 19,987 24,377 21,715Allowance for valuation of receivables . . . . . . . . . . . . . . . . . . . . . (15) (10) (8) (8)
Total assets . . . . . . . . . . . . . . . . . . . . . . . . . . . . . . . . . . . . . . . . . W23,750 W34,259 W37,123 W32,623
Liabilities:Money trusts . . . . . . . . . . . . . . . . . . . . . . . . . . . . . . . . . . . . . . . . . . . . . W12,192 W13,574 W12,822 W10,458Property trusts . . . . . . . . . . . . . . . . . . . . . . . . . . . . . . . . . . . . . . . . . . . 11,210 20,325 23,909 21,777Borrowings . . . . . . . . . . . . . . . . . . . . . . . . . . . . . . . . . . . . . . . . . . . . . . — — — —Special reserves . . . . . . . . . . . . . . . . . . . . . . . . . . . . . . . . . . . . . . . . . . 61 65 71 72Other . . . . . . . . . . . . . . . . . . . . . . . . . . . . . . . . . . . . . . . . . . . . . . . . . . . 287 295 321 316
Total liabilities . . . . . . . . . . . . . . . . . . . . . . . . . . . . . . . . . . . . . . W23,750 W34,259 W37,123 W32,623
Note:
(1) Includes principally real estate assets received under property trusts.
The Bank provides guarantee as to principal and/or interest for a limited amount of the assets and liabilitiesof its trust accounts. As of each of December 31, 2008 and March 31, 2009, guaranteed fixed rate trustaccounts, for which the Bank guarantees a fixed rate of interest, accounted for less than 0.01% of the totalmoney trusts in the Bank’s trust accounts. As of December 31, 2008 and March 31, 2009, the aggregateamount of money trusts guaranteed as to principal or as to principal and interest was W3,511 billion andW3,468 billion, or 27.38% and 33.16%, respectively, of total money trusts for the Bank.
Investment Portfolio
The Bank invests in and trades Won-denominated and, to a lesser extent, foreign currency-denominatedsecurities for its own account to:
Š maintain the stability and diversification of the Bank assets;
Š maintain adequate sources of back-up liquidity to match the Bank funding requirements; and
Š supplement income from the Bank core lending activities.
In making securities investments, the Bank takes into account a number of factors, includingmacroeconomic trends, industry analysis and credit evaluation in determining whether to make investmentsin particular securities.
The Bank’s investments in securities are also subject to a number of guidelines, including limitationsprescribed under the Banking Act. Under these regulations, the Bank must limit its investments in sharesand securities with a maturity in excess of three years (other than monetary stabilization bonds issued by theBank of Korea and national government bonds) to 60.0% of the Bank total Tier I and Tier II capital.Generally, the Bank is also prohibited from acquiring more than 15.0% of the shares with voting rightsissued by any other corporation (other than for the purpose of establishing or acquiring a subsidiary).Further information on the regulatory environment governing the Bank’s investment activities is set out in“Supervision and Regulation — Principal Regulations Applicable to Banks — Restrictions on Investmentsin Property”, “— Principal Regulations Applicable to Banks — Restrictions on Shareholdings in OtherCompanies”.
102
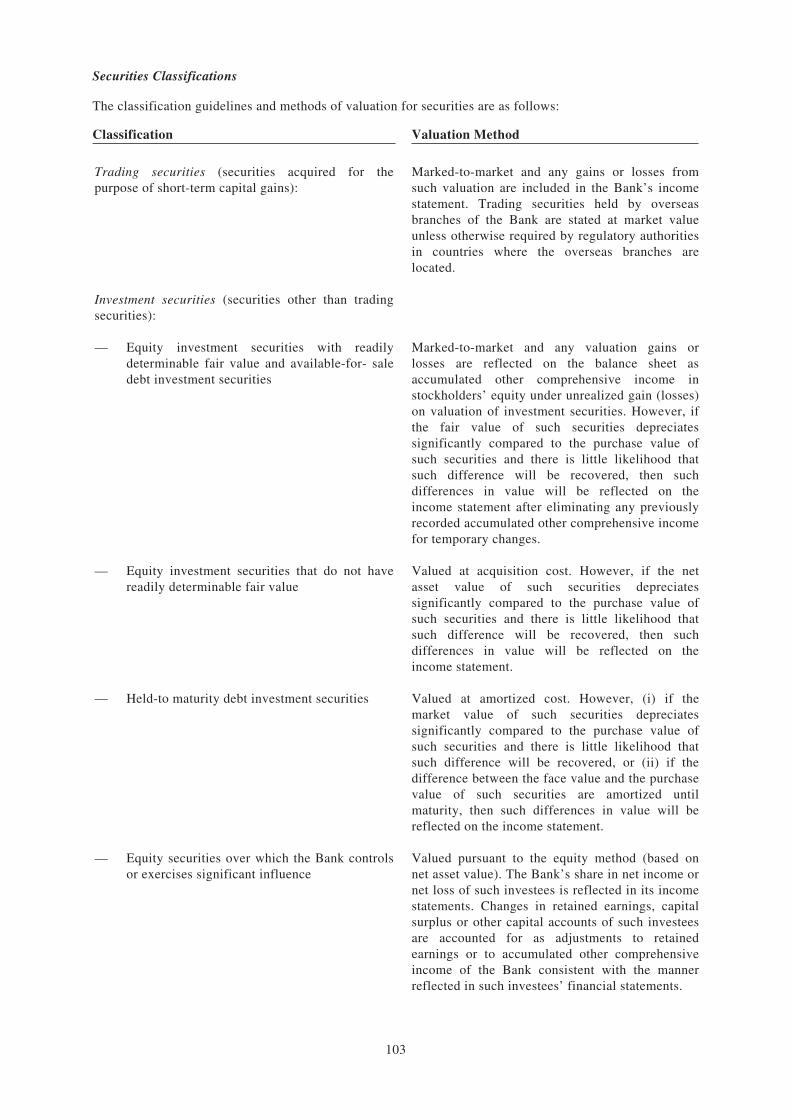
Securities Classifications
The classification guidelines and methods of valuation for securities are as follows:
Classification Valuation Method
Trading securities (securities acquired for thepurpose of short-term capital gains):
Marked-to-market and any gains or losses fromsuch valuation are included in the Bank’s incomestatement. Trading securities held by overseasbranches of the Bank are stated at market valueunless otherwise required by regulatory authoritiesin countries where the overseas branches arelocated.
Investment securities (securities other than tradingsecurities):
— Equity investment securities with readilydeterminable fair value and available-for- saledebt investment securities
Marked-to-market and any valuation gains orlosses are reflected on the balance sheet asaccumulated other comprehensive income instockholders’ equity under unrealized gain (losses)on valuation of investment securities. However, ifthe fair value of such securities depreciatessignificantly compared to the purchase value ofsuch securities and there is little likelihood thatsuch difference will be recovered, then suchdifferences in value will be reflected on theincome statement after eliminating any previouslyrecorded accumulated other comprehensive incomefor temporary changes.
— Equity investment securities that do not havereadily determinable fair value
Valued at acquisition cost. However, if the netasset value of such securities depreciatessignificantly compared to the purchase value ofsuch securities and there is little likelihood thatsuch difference will be recovered, then suchdifferences in value will be reflected on theincome statement.
— Held-to maturity debt investment securities Valued at amortized cost. However, (i) if themarket value of such securities depreciatessignificantly compared to the purchase value ofsuch securities and there is little likelihood thatsuch difference will be recovered, or (ii) if thedifference between the face value and the purchasevalue of such securities are amortized untilmaturity, then such differences in value will bereflected on the income statement.
— Equity securities over which the Bank controlsor exercises significant influence
Valued pursuant to the equity method (based onnet asset value). The Bank’s share in net income ornet loss of such investees is reflected in its incomestatements. Changes in retained earnings, capitalsurplus or other capital accounts of such investeesare accounted for as adjustments to retainedearnings or to accumulated other comprehensiveincome of the Bank consistent with the mannerreflected in such investees’ financial statements.
103
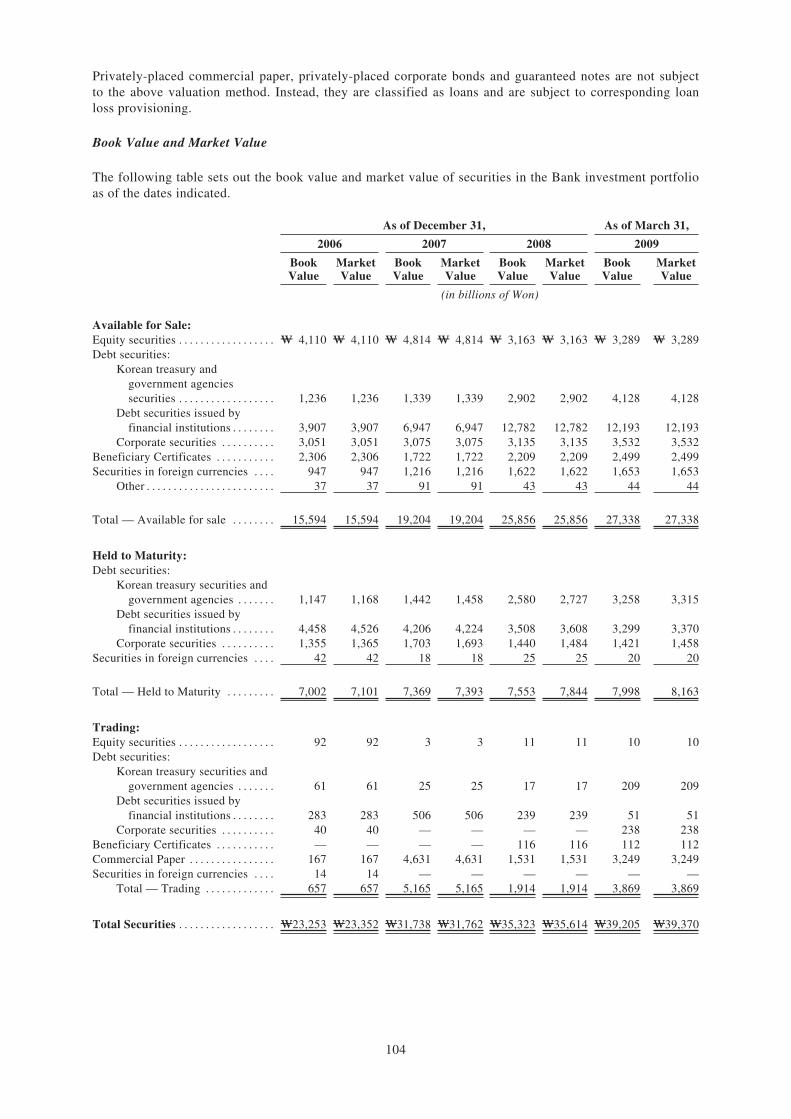
Privately-placed commercial paper, privately-placed corporate bonds and guaranteed notes are not subjectto the above valuation method. Instead, they are classified as loans and are subject to corresponding loanloss provisioning.
Book Value and Market Value
The following table sets out the book value and market value of securities in the Bank investment portfolioas of the dates indicated.
As of December 31, As of March 31,
2006 2007 2008 2009
BookValue
MarketValue
BookValue
MarketValue
BookValue
MarketValue
BookValue
MarketValue
(in billions of Won)
Available for Sale:Equity securities . . . . . . . . . . . . . . . . . . W 4,110 W 4,110 W 4,814 W 4,814 W 3,163 W 3,163 W 3,289 W 3,289Debt securities:
Korean treasury andgovernment agenciessecurities . . . . . . . . . . . . . . . . . . 1,236 1,236 1,339 1,339 2,902 2,902 4,128 4,128
Debt securities issued byfinancial institutions . . . . . . . . 3,907 3,907 6,947 6,947 12,782 12,782 12,193 12,193
Corporate securities . . . . . . . . . . 3,051 3,051 3,075 3,075 3,135 3,135 3,532 3,532Beneficiary Certificates . . . . . . . . . . . 2,306 2,306 1,722 1,722 2,209 2,209 2,499 2,499Securities in foreign currencies . . . . 947 947 1,216 1,216 1,622 1,622 1,653 1,653
Other . . . . . . . . . . . . . . . . . . . . . . . . 37 37 91 91 43 43 44 44
Total — Available for sale . . . . . . . . 15,594 15,594 19,204 19,204 25,856 25,856 27,338 27,338
Held to Maturity:Debt securities:
Korean treasury securities andgovernment agencies . . . . . . . 1,147 1,168 1,442 1,458 2,580 2,727 3,258 3,315
Debt securities issued byfinancial institutions . . . . . . . . 4,458 4,526 4,206 4,224 3,508 3,608 3,299 3,370
Corporate securities . . . . . . . . . . 1,355 1,365 1,703 1,693 1,440 1,484 1,421 1,458Securities in foreign currencies . . . . 42 42 18 18 25 25 20 20
Total — Held to Maturity . . . . . . . . . 7,002 7,101 7,369 7,393 7,553 7,844 7,998 8,163
Trading:Equity securities . . . . . . . . . . . . . . . . . . 92 92 3 3 11 11 10 10Debt securities:
Korean treasury securities andgovernment agencies . . . . . . . 61 61 25 25 17 17 209 209
Debt securities issued byfinancial institutions . . . . . . . . 283 283 506 506 239 239 51 51
Corporate securities . . . . . . . . . . 40 40 — — — — 238 238Beneficiary Certificates . . . . . . . . . . . — — — — 116 116 112 112Commercial Paper . . . . . . . . . . . . . . . . 167 167 4,631 4,631 1,531 1,531 3,249 3,249Securities in foreign currencies . . . . 14 14 — — — — — —
Total — Trading . . . . . . . . . . . . . 657 657 5,165 5,165 1,914 1,914 3,869 3,869
Total Securities . . . . . . . . . . . . . . . . . . W23,253 W23,352 W31,738 W31,762 W35,323 W35,614 W39,205 W39,370
104
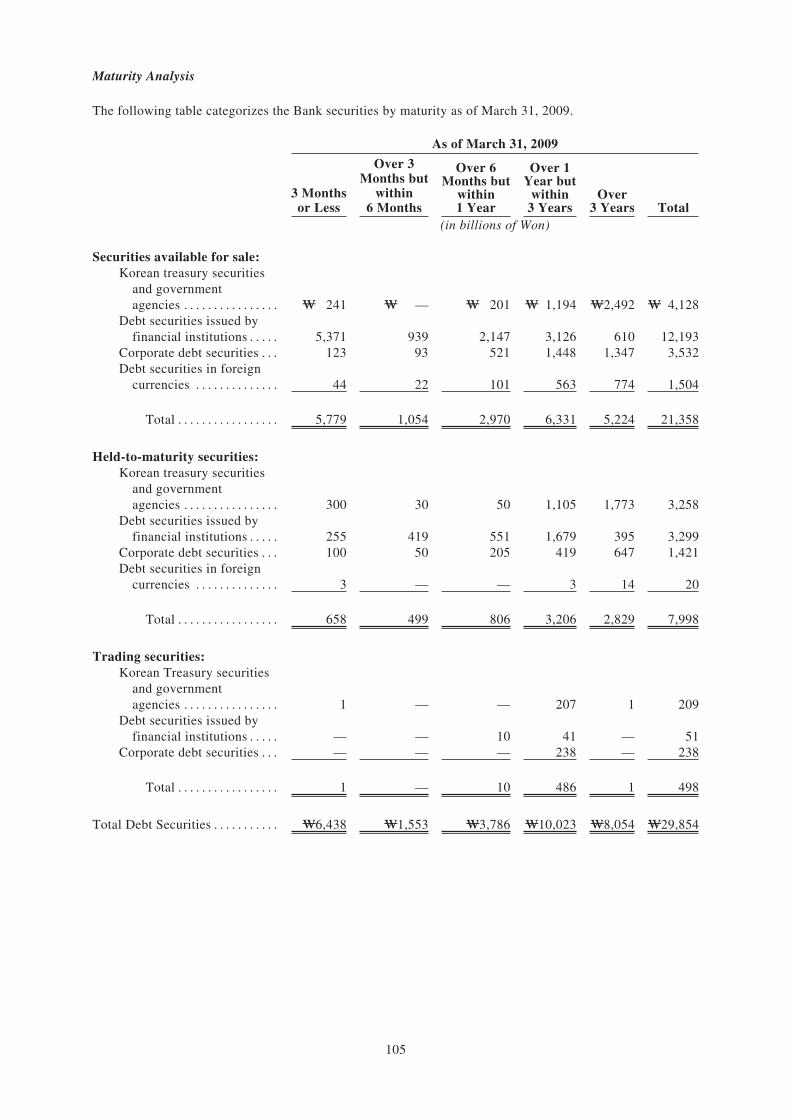
Maturity Analysis
The following table categorizes the Bank securities by maturity as of March 31, 2009.
As of March 31, 2009
3 Monthsor Less
Over 3Months but
within6 Months
Over 6Months but
within1 Year
Over 1Year but
within3 Years
Over3 Years Total
(in billions of Won)
Securities available for sale:Korean treasury securities
and governmentagencies . . . . . . . . . . . . . . . . W 241 W — W 201 W 1,194 W2,492 W 4,128
Debt securities issued byfinancial institutions . . . . . 5,371 939 2,147 3,126 610 12,193
Corporate debt securities . . . 123 93 521 1,448 1,347 3,532Debt securities in foreign
currencies . . . . . . . . . . . . . . 44 22 101 563 774 1,504
Total . . . . . . . . . . . . . . . . . 5,779 1,054 2,970 6,331 5,224 21,358
Held-to-maturity securities:Korean treasury securities
and governmentagencies . . . . . . . . . . . . . . . . 300 30 50 1,105 1,773 3,258
Debt securities issued byfinancial institutions . . . . . 255 419 551 1,679 395 3,299
Corporate debt securities . . . 100 50 205 419 647 1,421Debt securities in foreign
currencies . . . . . . . . . . . . . . 3 — — 3 14 20
Total . . . . . . . . . . . . . . . . . 658 499 806 3,206 2,829 7,998
Trading securities:Korean Treasury securities
and governmentagencies . . . . . . . . . . . . . . . . 1 — — 207 1 209
Debt securities issued byfinancial institutions . . . . . — — 10 41 — 51
Corporate debt securities . . . — — — 238 — 238
Total . . . . . . . . . . . . . . . . . 1 — 10 486 1 498
Total Debt Securities . . . . . . . . . . . W6,438 W1,553 W3,786 W10,023 W8,054 W29,854
105
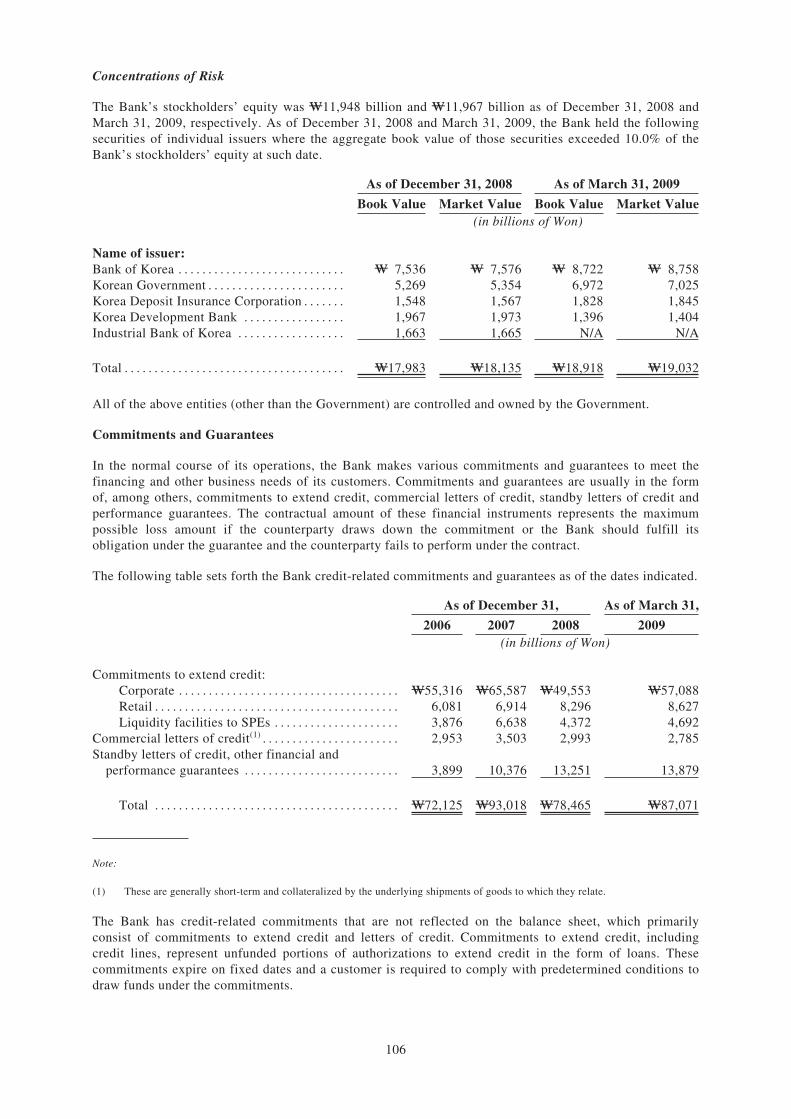
Concentrations of Risk
The Bank’s stockholders’ equity was W11,948 billion and W11,967 billion as of December 31, 2008 andMarch 31, 2009, respectively. As of December 31, 2008 and March 31, 2009, the Bank held the followingsecurities of individual issuers where the aggregate book value of those securities exceeded 10.0% of theBank’s stockholders’ equity at such date.
As of December 31, 2008 As of March 31, 2009
Book Value Market Value Book Value Market Value(in billions of Won)
Name of issuer:Bank of Korea . . . . . . . . . . . . . . . . . . . . . . . . . . . . W 7,536 W 7,576 W 8,722 W 8,758Korean Government . . . . . . . . . . . . . . . . . . . . . . . 5,269 5,354 6,972 7,025Korea Deposit Insurance Corporation . . . . . . . 1,548 1,567 1,828 1,845Korea Development Bank . . . . . . . . . . . . . . . . . 1,967 1,973 1,396 1,404Industrial Bank of Korea . . . . . . . . . . . . . . . . . . 1,663 1,665 N/A N/A
Total . . . . . . . . . . . . . . . . . . . . . . . . . . . . . . . . . . . . . W17,983 W18,135 W18,918 W19,032
All of the above entities (other than the Government) are controlled and owned by the Government.
Commitments and Guarantees
In the normal course of its operations, the Bank makes various commitments and guarantees to meet thefinancing and other business needs of its customers. Commitments and guarantees are usually in the formof, among others, commitments to extend credit, commercial letters of credit, standby letters of credit andperformance guarantees. The contractual amount of these financial instruments represents the maximumpossible loss amount if the counterparty draws down the commitment or the Bank should fulfill itsobligation under the guarantee and the counterparty fails to perform under the contract.
The following table sets forth the Bank credit-related commitments and guarantees as of the dates indicated.
As of December 31, As of March 31,
2006 2007 2008 2009(in billions of Won)
Commitments to extend credit:Corporate . . . . . . . . . . . . . . . . . . . . . . . . . . . . . . . . . . . . . W55,316 W65,587 W49,553 W57,088Retail . . . . . . . . . . . . . . . . . . . . . . . . . . . . . . . . . . . . . . . . . 6,081 6,914 8,296 8,627Liquidity facilities to SPEs . . . . . . . . . . . . . . . . . . . . . 3,876 6,638 4,372 4,692
Commercial letters of credit(1) . . . . . . . . . . . . . . . . . . . . . . . 2,953 3,503 2,993 2,785Standby letters of credit, other financial and
performance guarantees . . . . . . . . . . . . . . . . . . . . . . . . . . 3,899 10,376 13,251 13,879
Total . . . . . . . . . . . . . . . . . . . . . . . . . . . . . . . . . . . . . . . . . W72,125 W93,018 W78,465 W87,071
Note:
(1) These are generally short-term and collateralized by the underlying shipments of goods to which they relate.
The Bank has credit-related commitments that are not reflected on the balance sheet, which primarilyconsist of commitments to extend credit and letters of credit. Commitments to extend credit, includingcredit lines, represent unfunded portions of authorizations to extend credit in the form of loans. Thesecommitments expire on fixed dates and a customer is required to comply with predetermined conditions todraw funds under the commitments.
106
Commercial letters of credit are undertakings on behalf of customers authorizing third parties to draw draftson the Bank up to a stipulated amount under specific terms and conditions. They are generally short-termand collateralized by the underlying shipments of goods which they relate to and therefore have less risk.
Standby letters of credit are irrevocable obligations to pay third party beneficiaries when the Bankcustomers fail to repay loans or debt instruments, which are generally in foreign currencies. A substantialportion of these standby letters of credit are secured by underlying assets, including trade-relateddocuments.
Other financial and performance guarantees are irrevocable assurance that the Bank makes payments tobeneficiaries in the event that its customers fail to fulfill their obligations or to perform under certaincontracts. Liquidity facilities to special purpose entities (“SPEs”) represent irrevocable commitments toprovide contingent liquidity credit lines to SPEs established by the Bank’s customers in the event that atriggering event such as shortage of cash occurs.
The commitments and guarantees do not necessarily represent the Bank’s exposure since they often expireunused.
Derivatives
As discussed under “Business — Business Overview — The Bank’s Principal Activities — Treasury andSecurities Investment” above, the Bank engages in derivatives trading activities primarily on behalf of itscustomers so that they may hedge their risks and also enter into back-to-back derivatives with otherfinancial institutions to cover exposures arising from such transactions. In addition, the Bank enters intoderivatives transactions to hedge against risk exposures arising from its own assets and liabilities.
107
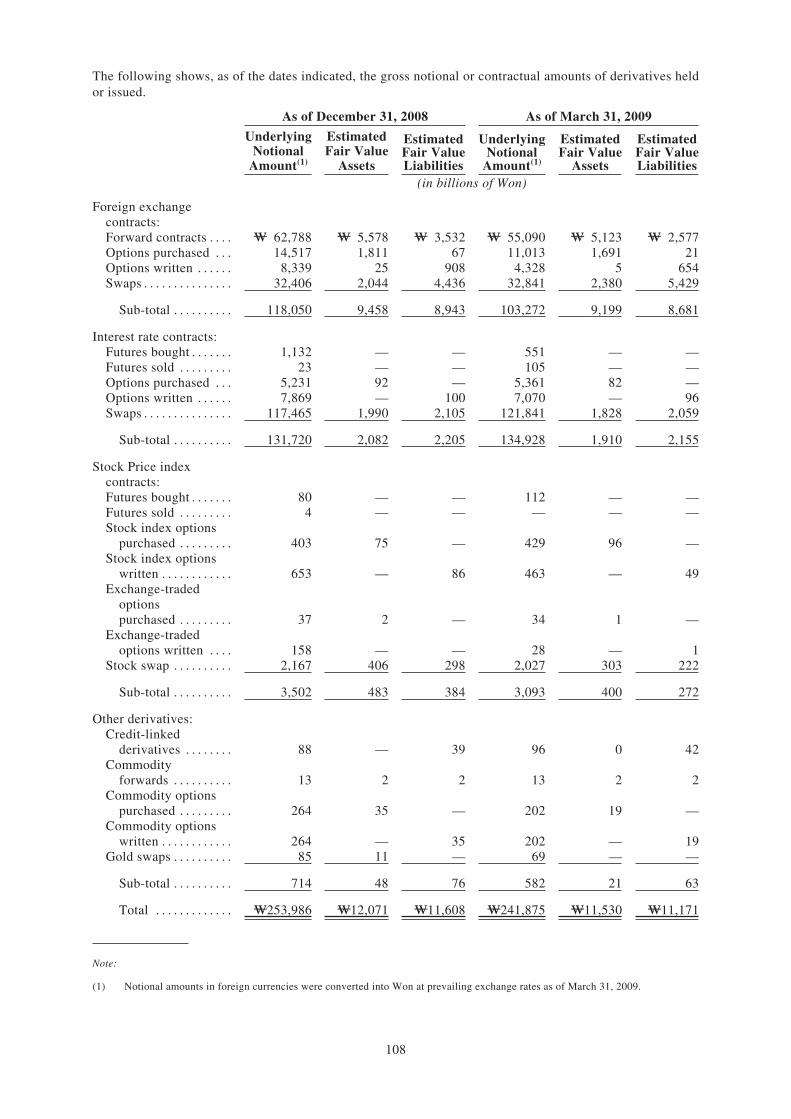
The following shows, as of the dates indicated, the gross notional or contractual amounts of derivatives heldor issued.
As of December 31, 2008 As of March 31, 2009
UnderlyingNotional
Amount(1)
EstimatedFair Value
Assets
EstimatedFair ValueLiabilities
UnderlyingNotional
Amount(1)
EstimatedFair Value
Assets
EstimatedFair ValueLiabilities
(in billions of Won)
Foreign exchangecontracts:Forward contracts . . . . W 62,788 W 5,578 W 3,532 W 55,090 W 5,123 W 2,577Options purchased . . . 14,517 1,811 67 11,013 1,691 21Options written . . . . . . 8,339 25 908 4,328 5 654Swaps . . . . . . . . . . . . . . . 32,406 2,044 4,436 32,841 2,380 5,429
Sub-total . . . . . . . . . . 118,050 9,458 8,943 103,272 9,199 8,681
Interest rate contracts:Futures bought . . . . . . . 1,132 — — 551 — —Futures sold . . . . . . . . . 23 — — 105 — —Options purchased . . . 5,231 92 — 5,361 82 —Options written . . . . . . 7,869 — 100 7,070 — 96Swaps . . . . . . . . . . . . . . . 117,465 1,990 2,105 121,841 1,828 2,059
Sub-total . . . . . . . . . . 131,720 2,082 2,205 134,928 1,910 2,155
Stock Price indexcontracts:Futures bought . . . . . . . 80 — — 112 — —Futures sold . . . . . . . . . 4 — — — — —Stock index options
purchased . . . . . . . . . 403 75 — 429 96 —Stock index options
written . . . . . . . . . . . . 653 — 86 463 — 49Exchange-traded
optionspurchased . . . . . . . . . 37 2 — 34 1 —
Exchange-tradedoptions written . . . . 158 — — 28 — 1
Stock swap . . . . . . . . . . 2,167 406 298 2,027 303 222
Sub-total . . . . . . . . . . 3,502 483 384 3,093 400 272
Other derivatives:Credit-linked
derivatives . . . . . . . . 88 — 39 96 0 42Commodity
forwards . . . . . . . . . . 13 2 2 13 2 2Commodity options
purchased . . . . . . . . . 264 35 — 202 19 —Commodity options
written . . . . . . . . . . . . 264 — 35 202 — 19Gold swaps . . . . . . . . . . 85 11 — 69 — —
Sub-total . . . . . . . . . . 714 48 76 582 21 63
Total . . . . . . . . . . . . . W253,986 W12,071 W11,608 W241,875 W11,530 W11,171
Note:
(1) Notional amounts in foreign currencies were converted into Won at prevailing exchange rates as of March 31, 2009.
108
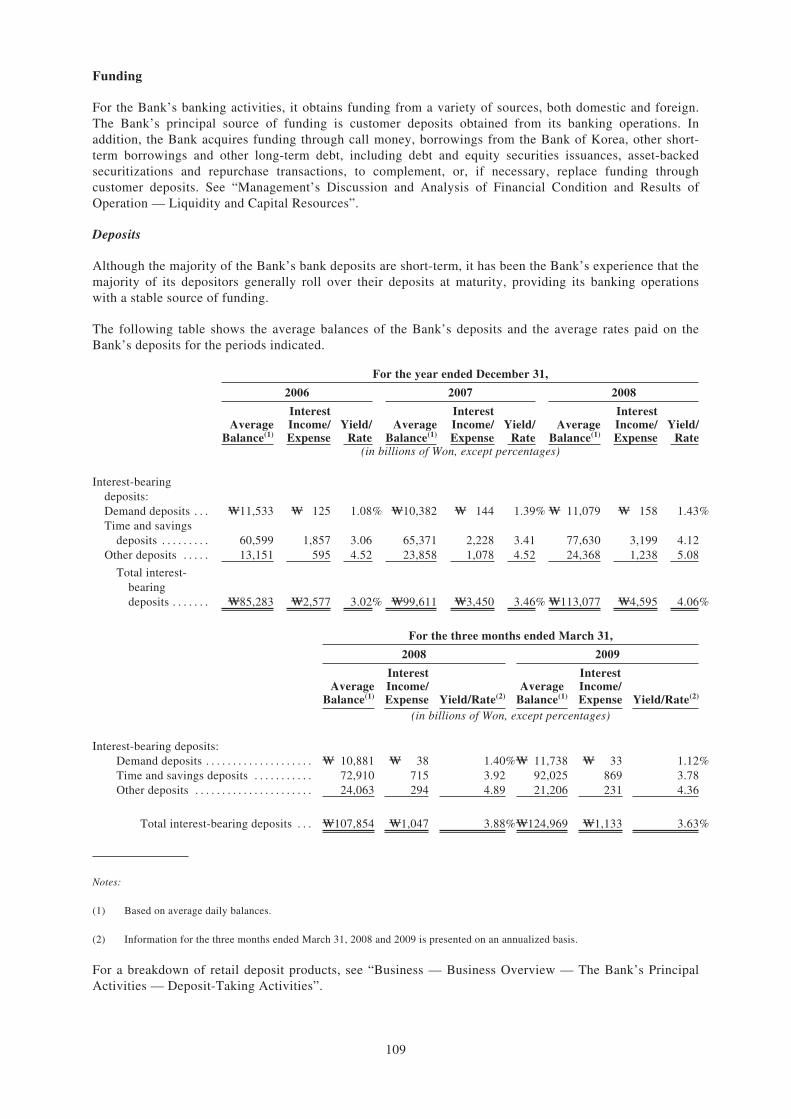
Funding
For the Bank’s banking activities, it obtains funding from a variety of sources, both domestic and foreign.The Bank’s principal source of funding is customer deposits obtained from its banking operations. Inaddition, the Bank acquires funding through call money, borrowings from the Bank of Korea, other short-term borrowings and other long-term debt, including debt and equity securities issuances, asset-backedsecuritizations and repurchase transactions, to complement, or, if necessary, replace funding throughcustomer deposits. See “Management’s Discussion and Analysis of Financial Condition and Results ofOperation — Liquidity and Capital Resources”.
Deposits
Although the majority of the Bank’s bank deposits are short-term, it has been the Bank’s experience that themajority of its depositors generally roll over their deposits at maturity, providing its banking operationswith a stable source of funding.
The following table shows the average balances of the Bank’s deposits and the average rates paid on theBank’s deposits for the periods indicated.
For the year ended December 31,
2006 2007 2008
AverageBalance(1)
InterestIncome/Expense
Yield/Rate
AverageBalance(1)
InterestIncome/Expense
Yield/Rate
AverageBalance(1)
InterestIncome/Expense
Yield/Rate
(in billions of Won, except percentages)
Interest-bearingdeposits:Demand deposits . . . W11,533 W 125 1.08% W10,382 W 144 1.39% W 11,079 W 158 1.43%Time and savings
deposits . . . . . . . . . 60,599 1,857 3.06 65,371 2,228 3.41 77,630 3,199 4.12Other deposits . . . . . 13,151 595 4.52 23,858 1,078 4.52 24,368 1,238 5.08
Total interest-bearingdeposits . . . . . . . W85,283 W2,577 3.02% W99,611 W3,450 3.46% W113,077 W4,595 4.06%
For the three months ended March 31,
2008 2009
AverageBalance(1)
InterestIncome/Expense Yield/Rate(2)
AverageBalance(1)
InterestIncome/Expense Yield/Rate(2)
(in billions of Won, except percentages)
Interest-bearing deposits:Demand deposits . . . . . . . . . . . . . . . . . . . . W 10,881 W 38 1.40%W 11,738 W 33 1.12%Time and savings deposits . . . . . . . . . . . 72,910 715 3.92 92,025 869 3.78Other deposits . . . . . . . . . . . . . . . . . . . . . . 24,063 294 4.89 21,206 231 4.36
Total interest-bearing deposits . . . W107,854 W1,047 3.88%W124,969 W1,133 3.63%
Notes:
(1) Based on average daily balances.
(2) Information for the three months ended March 31, 2008 and 2009 is presented on an annualized basis.
For a breakdown of retail deposit products, see “Business — Business Overview — The Bank’s PrincipalActivities — Deposit-Taking Activities”.
109
RISK MANAGEMENT
Overview
The Bank has a comprehensive system of risk management in order to manage the risks of the Bank withinacceptable limits and ensure the soundness of its assets. The Bank strives to stabilize its long-termprofitability through effective risk management.
The Board of Directors (“Board”) sets basic guidelines with respect to the Bank’s risk management andcontrols, such as total risk limits for the Bank. Under the supervision of the Board, the Risk ManagementCommittee determines asset allocation and risk limits for each business group, and assists the managementin formulating basic management guidelines for all banking operations.
In accordance with these basic policies and guidelines, the Asset & Liability Management Committee(“ALM Committee”) and the Credit Policy Committee, both consisting of senior executives and groupheads, oversee credit, market and operational risks. The Risk Management Department, which isindependent from all business units, identifies, evaluates and controls all risks of the Bank and supports theRisk Management Committee.
Credit Risk Management
Credit risk, which is the risk of loss from default by an obligor or counter-party, is the greatest risk theBank faces. The Bank’s credit risk management is guided by the following principles:
Š achieve profit level corresponding to the level of risks involved;
Š improve asset quality and achieve optimal industrial and rating loan portfolio;
Š focus on small- and medium-sized enterprises and markets;
Š establish appropriate limits for investment securities;
Š avoid excessive loan concentration in a particular borrower or sector;
Š focus on borrower’s ability to repay the debt; and
Š financially support the Bank’s select customers’ growth.
Major policies for the Bank’s credit risk management are determined by the Credit Policy Committee, theexecutive decision-making body for management of credit risk. The Credit Policy Committee is led by theDeputy President and head of the Risk Management Group. The Credit Policy Committee further consists ofchief officers from other subsidiaries of Shinhan Financial Group. Apart from the Credit Policy Committee,the Bank has a Credit Review Committee in place to perform credit review evaluation, thereby separatingcredit policy decision-making and loan approvals. Both committees make decisions by 2/3 or more votes ofthe attending members, which must constitute at least two-thirds of the committee members to satisfy thequorum.
The Bank performs credit risk management procedures pursuant to internal guidelines and regulations andcontinually monitors and improves these guidelines and regulations. Its credit risk management proceduresinclude:
Š credit evaluation and approval;
Š credit review and monitoring; and
Š credit risk assessment and control.
110
Credit Evaluation and Approval
All loan applicants and guarantors are subject to credit review evaluation before approval of any loans.Credit evaluation of loan applicants is carried out on a separate level by a Credit Officer and Senior CreditOfficer and (senior) credit officer committees consisting of loan evaluation specialists from different areas.Loan evaluation is carried out by a group rather than on an individual level through objective and deliberateprocess. The Bank uses a credit scoring system for retail loans and a credit-risk rating system forcommercial loans.
Retail loans
Loan applications for retail loans are reviewed in accordance with the Bank’s credit scoring system and theobjective statistics methodology regarding secured and unsecured loans maintained and operated by theBank’s Retail Banking Division. The credit scoring system is an automated credit approval system used toevaluate loan applications and determine the appropriate pricing for the loan.
The Bank’s credit scoring system takes into account factors such as a borrower’s personal information,transaction history with the Bank and other financial institutions and other relevant credit information. Theapplicant is given a score which is used to decide whether to approve loans as well as determine loanamounts. The score determines whether the applicant is approved for credit, conditionally approved, subjectto further assessment, or denied. If the applicant becomes subject to further assessment, the appropriatediscretionary body, either at the branch level or at the headquarters level, makes a reassessment, whichconsiders qualitative factors as well as quantitative factors, such as credit history, occupation and pastrelationship with the Bank.
For mortgage loans and loans secured by real estate, the Bank evaluates the value of the real estate offeredas collateral for a loan using a database the Bank has developed, which contains information about realestate values throughout Korea. In addition, the Bank uses information from a third party provider ofinformation about the real estate market in Korea, which gives the Bank up-to-date market valueinformation for Korean real estate values. Staff from the processing centers appraises the real estate. Inaddition, for loans of W5 billion or more, the Bank hires certified appraisers to review the appraisal valueof real estate collateral that have an appraisal value exceeding W10 billion, as initially determined by theprocessing centers. The Bank reevaluates internally, on a summary basis, the appraisal value of collateral atleast every year.
For loans secured by securities, deposits or other assets other than real estate, the Bank requires borrowersto observe specified collateral ratios in respect of secured obligations.
Corporate loans
The Bank rates all of its corporate borrowers using a rating system. The Bank uses internally developedcredit evaluation models to rate potential borrowers. The credit risk-rating systems take into account avariety of evaluation criteria in order to standardize credit decisions, by focusing on the quality ofborrowers rather than the volume of loans. The systems include both quantitative factors based on theborrower’s financial and other data, and qualitative factors based on the judgment of the Bank’s creditofficers. Financial evaluation factors the Bank considers include financial variables and ratios based on itscustomer’s financial statements, such as return on assets and cash flow to total debt ratios. Non-financialevaluation factors include, among others, the industry in which the borrower operates, its competitiveposition in its industry, its operating and funding capabilities, the quality of its management and controllingstockholders (based in part on interviews with its officers and employees), technological capabilities andlabor relations.
The Bank consults reports prepared by external credit rating services, such as Korea Information Service,National Information & Credit Evaluation Inc. and Korea Management Consulting & Credit RatingCorporation. The Bank uses these services to provide it with support for the accuracy of the credit review itconducts.
The Bank monitors and improves the effectiveness of the credit risk-rating systems using a database that itupdates continually with actual default records.
111
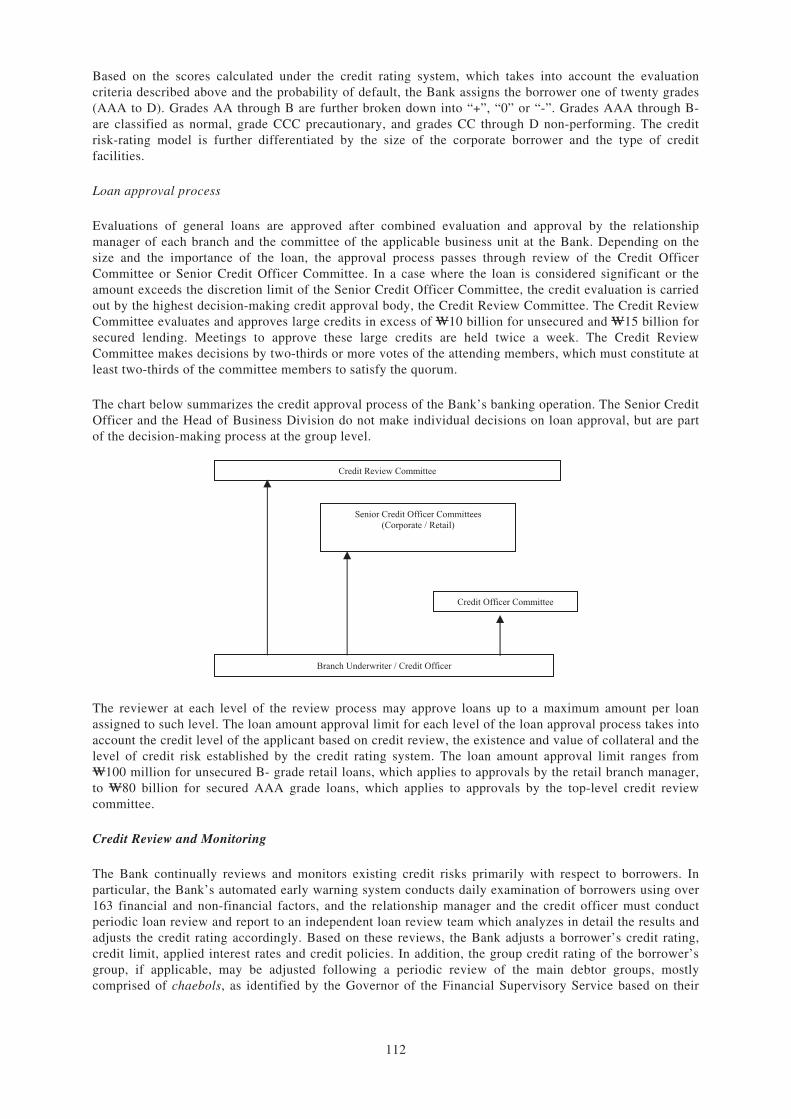
Based on the scores calculated under the credit rating system, which takes into account the evaluationcriteria described above and the probability of default, the Bank assigns the borrower one of twenty grades(AAA to D). Grades AA through B are further broken down into “+”, “0” or “-”. Grades AAA through B-are classified as normal, grade CCC precautionary, and grades CC through D non-performing. The creditrisk-rating model is further differentiated by the size of the corporate borrower and the type of creditfacilities.
Loan approval process
Evaluations of general loans are approved after combined evaluation and approval by the relationshipmanager of each branch and the committee of the applicable business unit at the Bank. Depending on thesize and the importance of the loan, the approval process passes through review of the Credit OfficerCommittee or Senior Credit Officer Committee. In a case where the loan is considered significant or theamount exceeds the discretion limit of the Senior Credit Officer Committee, the credit evaluation is carriedout by the highest decision-making credit approval body, the Credit Review Committee. The Credit ReviewCommittee evaluates and approves large credits in excess of W10 billion for unsecured and W15 billion forsecured lending. Meetings to approve these large credits are held twice a week. The Credit ReviewCommittee makes decisions by two-thirds or more votes of the attending members, which must constitute atleast two-thirds of the committee members to satisfy the quorum.
The chart below summarizes the credit approval process of the Bank’s banking operation. The Senior CreditOfficer and the Head of Business Division do not make individual decisions on loan approval, but are partof the decision-making process at the group level.
Credit Review Committee
Senior Credit Officer Committees (Corporate / Retail)
Credit Officer Committee
Branch Underwriter / Credit Officer
The reviewer at each level of the review process may approve loans up to a maximum amount per loanassigned to such level. The loan amount approval limit for each level of the loan approval process takes intoaccount the credit level of the applicant based on credit review, the existence and value of collateral and thelevel of credit risk established by the credit rating system. The loan amount approval limit ranges fromW100 million for unsecured B- grade retail loans, which applies to approvals by the retail branch manager,to W80 billion for secured AAA grade loans, which applies to approvals by the top-level credit reviewcommittee.
Credit Review and Monitoring
The Bank continually reviews and monitors existing credit risks primarily with respect to borrowers. Inparticular, the Bank’s automated early warning system conducts daily examination of borrowers using over163 financial and non-financial factors, and the relationship manager and the credit officer must conductperiodic loan review and report to an independent loan review team which analyzes in detail the results andadjusts the credit rating accordingly. Based on these reviews, the Bank adjusts a borrower’s credit rating,credit limit, applied interest rates and credit policies. In addition, the group credit rating of the borrower’sgroup, if applicable, may be adjusted following a periodic review of the main debtor groups, mostlycomprised of chaebols, as identified by the Governor of the Financial Supervisory Service based on their
112
outstanding credit exposures, of which 43 and 45 were identified as such as of December 31, 2008 andMarch 31, 2009, respectively. The Bank also continually reviews other factors, such as industry conditionsin which borrowers operate and their domestic and overseas asset base and operations, to ensure that ratingsare appropriate. The Credit Review Department provides credit review reports, independent ofunderwriting, to the Chief Risk Officer on a monthly basis.
The early warning system conducts an automatic daily check on borrowers with whom the Bank has morethan W2 billion of exposure. The relationship manager and the Credit Officer in the Credit ReviewDepartment monitor those borrowers, and then the Credit Review Department further reviews the results ofthe monitoring. In addition, the Bank carries out a planned review of each borrower in accordance withchanging credit risk factors based on changing economic environment. The results of such planned revieware continually reported to the Chief Risk Officer of the Bank.
Depending on the nature of the items detected by the early warning system, a borrower may be classified asa “deteriorating credit” and undergo evaluation for a possible downgrade in its customer rating, or may beinitially classified as a “borrower showing early warning signs” or re-attain “normal borrower” status. Forborrowers classified as “showing early warning signs”, the relevant relationship manager gathersinformation and conducts a review of the borrower to determine whether it should be classified as adeteriorating credit or whether to impose management improvement warnings or implement joint creditors’management. If the borrower becomes non-performing, the Bank’s collection department directly managessuch borrower’s account in order to maximize recovery rate, and conducts auctions, court proceedings, saleof assets or corporate restructuring as needed.
Credit Risk Assessment and Control
To assess credit risk in a systematic manner, the Bank has developed and upgraded systems designed toquantify credit risks based on selection and monitoring of various statistics, including delinquency rate,non-performing loan ratio, expected loan loss and weighted average risk rating.
The Bank controls loan concentration by monitoring and managing loans at two levels: portfolio level andindividual loan account level. In order to prevent concentration of loans, the Bank has established a creditlimit per country, industry, affiliates, corporation and financial institution, and has encouraged extension ofcredit to customers with good credit and reduction of credit to customers with less than good credit. Inaddition, the Bank utilizes the results of credit portfolio analysis in allocating asset quality based onforward looking criteria, increasing discretion and adjusting loan to value ratio.
The Bank measures credit risk using internally accumulated data. The Bank measures expected andunexpected losses with respect to total assets monthly, which the Bank refers to when setting risk limits for,and allocating capital to, its business groups. Expected loss is calculated based on the probability of default,the loss given default, the exposure at default and the past bankruptcy rate and recovery rate, and the Bankprovides allowance for loan losses under Korean GAAP accordingly. The Bank selects the higher of the twoprovisioning levels, as determined by the Financial Supervisory Service requirement or the Bank’s internalcalculation. Unexpected loss is predicted based on value at risk (“VaR”), which is used to determinecompliance with the credit risk limits set for the entire Bank as well as for each department thereof.Beginning on January 1, 2008, the Bank uses the “Monte Carlo” simulation method to compute the VaR,compared to the “historical” simulation method used previously, as the “Monte Carlo” method provides amore systematic method for reflecting concentration risks and correlation effects.
Market Risk Management
Market risk is the risk of loss generated by fluctuations in market prices such as interest rates, foreignexchange rates and equity prices. The principal market risks to which the Bank is exposed are interest raterisk and, to a lesser extent, equity price risk, foreign exchange risk and commodity risk. These risks stemfrom the Bank’s trading and non-trading activities relating to financial instruments such as loans, deposits,securities and financial derivatives. The Bank divides market risk into risks arising from trading activitiesand risks arising from non-trading activities.
113
For the Bank’s market risk management, the Bank’s Risk Management Committee establishes overallmarket risk management principles for both the trading and nontrading activities of the Bank. Based onthese principles, the Bank’s Asset & Liability Management Committee, or the ALM Committee, assessesand controls market risks arising from trading and non-trading activities. The ALM Committee, whichconsists of eight executive vice presidents and the head of the Treasury Department, is the executivedecision-making body for the Bank’s risk management and asset and liability management operations. Atleast on a monthly basis, the ALM Committee reviews and approves reports, which include the position andVaR with respect to the Bank’s trading activities and the position, VaR, duration gap and market valueanalysis and net interest income simulation with respect to its non-trading activities. The Bank measuresmarket risk with respect to all assets and liabilities in bank accounts and trust accounts in accordance withthe regulations promulgated by the Financial Services Commission.
Market Risk Exposure from Trading Activities
The Bank’s trading activities principally consist of:
Š trading activities to realize short-term trading profits in debt and stock markets and foreign exchangemarkets based on the Bank’s short-term forecast of changes in market situation and customer demand,on its own account as well as for the trust accounts of the Bank’s customers; and
Š trading activities primarily to realize profits from arbitrage transactions in derivatives such as swap,forward, futures and option transactions, and, to a lesser extent, to sell derivative products to theBank’s customers and to cover market risk incurred from those trading activities.
As a result of these trading activities, the Bank is exposed principally to interest rate risk, foreign exchangerisk and equity risk.
Interest rate risk
The Bank’s exposure to interest rate risk arises primarily from Won-denominated debt securities, directlyheld or indirectly held through beneficiary certificates, and, to a lesser extent, from interest rate derivatives.The Bank’s exposure to interest rate risk arising from foreign currency-denominated trading debt securitiesis minimal since its net position in those securities is not significant. As the Bank’s trading accounts aremarked-to-market daily, it manages the interest rate risk related to its trading accounts using VaR, a marketvalue-based tool.
Foreign exchange risk
Foreign exchange risk arises because of the Bank’s assets and liabilities, including derivatives such asforeign exchange forwards and futures and currency swaps, which are denominated in currencies other thanthe Won. The Bank manages foreign exchange risk on an overall position basis, including its overseasbranches, by covering all of its foreign exchange spot and forward positions in both trading and non-tradingaccounts.
The Bank’s net foreign currency open position, which is the difference between its foreign currency assetsand liabilities as offset against forward foreign exchange positions, is the Bank’s foreign exchange risk. TheALM Committee oversees the Bank’s foreign exchange exposure for both trading and non-trading activitiesby establishing limits for the net foreign currency open position, loss limits and VaR limits. Themanagement of the Bank’s foreign exchange position is centralized at the FX & Derivatives Department.Dealers in the FX & Derivatives Department manage the Bank’s overall position within the set limitsthrough spot trading, forward contracts, currency options, futures and swaps and foreign exchange swaps.The Bank sets the limit for net open position by currency and the limits for currencies other than the U.S.dollar and Japanese Yen are restrictive to minimize other foreign exchange trading.
114
The following table shows the Bank’s net foreign currency open positions as of December 31, 2006, 2007and 2008 and March 31, 2009. Positive amounts represent long exposures and negative amounts representshort exposures.
As of December 31, As of March 31,
Currency 2006 2007 2008 2009(In millions of US$)
U.S. dollar . . . . . . . . . . . . . . . . . . . . . . . . . . . . . . . . . . . . . . . US$301.1 US$ 20.4 US$(41.6) US$ (2.6)Japanese Yen . . . . . . . . . . . . . . . . . . . . . . . . . . . . . . . . . . . . (27.2) (21.0) (43.7) (0.1)Euro . . . . . . . . . . . . . . . . . . . . . . . . . . . . . . . . . . . . . . . . . . . . . 25.5 18.9 (10.8) (0.4)Others . . . . . . . . . . . . . . . . . . . . . . . . . . . . . . . . . . . . . . . . . . . 70.3 66.1 59.3 47.5
Total . . . . . . . . . . . . . . . . . . . . . . . . . . . . . . . . . . . . . . . . . . . . US$369.7 US$ 84.4 US$(36.8) US$(44.4)
Equity risk
Equity risk for the Bank’s trading activities results from the trading of equity portfolio of Korean companiesand Korea Stock Price Index futures and options. The trading equity portfolio consists of stocks listed onthe KRX KOSPI Market Division or the KRX KOSDAQ Market Division of the Korea Exchange andnearest-month or second nearest-month futures contracts under strict limits on diversification as well aslimits on positions. This has been an area of particular focus due to the level of volatility in the stockmarket. In addition, the Bank pays close attention to loss limits. Although the Bank holds a substantiallysmaller amount of equity securities than debt securities in its trading accounts, the VaR of trading accountequity risk is generally higher than that of trading account interest rate risk due to high volatility in thevalue of equity securities. As of December 31, 2006, 2007 and 2008 and March 31, 2009, the Bank heldW109.4 billion, W33.6 billion, W13.4 billion and W13.1 billion, respectively, of equity securities in itstrading accounts (including the trust accounts).
Management of Market Risk from Trading Activities
The following tables present an overview of market risk, measured by VaR, from trading activities of theBank for the year ended and as of December 31, 2008 and for the three months ended and as of March 31,2009. For market risk management purposes, the Bank includes its trading portfolio in bank accounts andassets in trust accounts for which it guarantees principal or fixed return in accordance with the FinancialServices Commission regulations.
Trading Portfolio VaR(1) for the year ended December 31, 2008
Average Minimum MaximumAs of
December 31, 2008
(in billions of Won)
Interest rate . . . . . . . . . . . . . . . . . . . . . . . . . W 43.3 W28.6 W 58.7 W 30.1Foreign exchange(2) . . . . . . . . . . . . . . . . . . 12.2 0.6 55.7 53.2Equities . . . . . . . . . . . . . . . . . . . . . . . . . . . . . 15.8 6.1 27.5 15.9Option volatility(3) . . . . . . . . . . . . . . . . . . . 9.5 1.2 72.7 1.8Less: portfolio diversification(4) . . . . . . . (26.1) 1.7 (91.1) (54.2)
Total VaR(5) . . . . . . . . . . . . . . . . . . . . . . . . . W 54.7 W38.2 W123.5 W 46.8
115
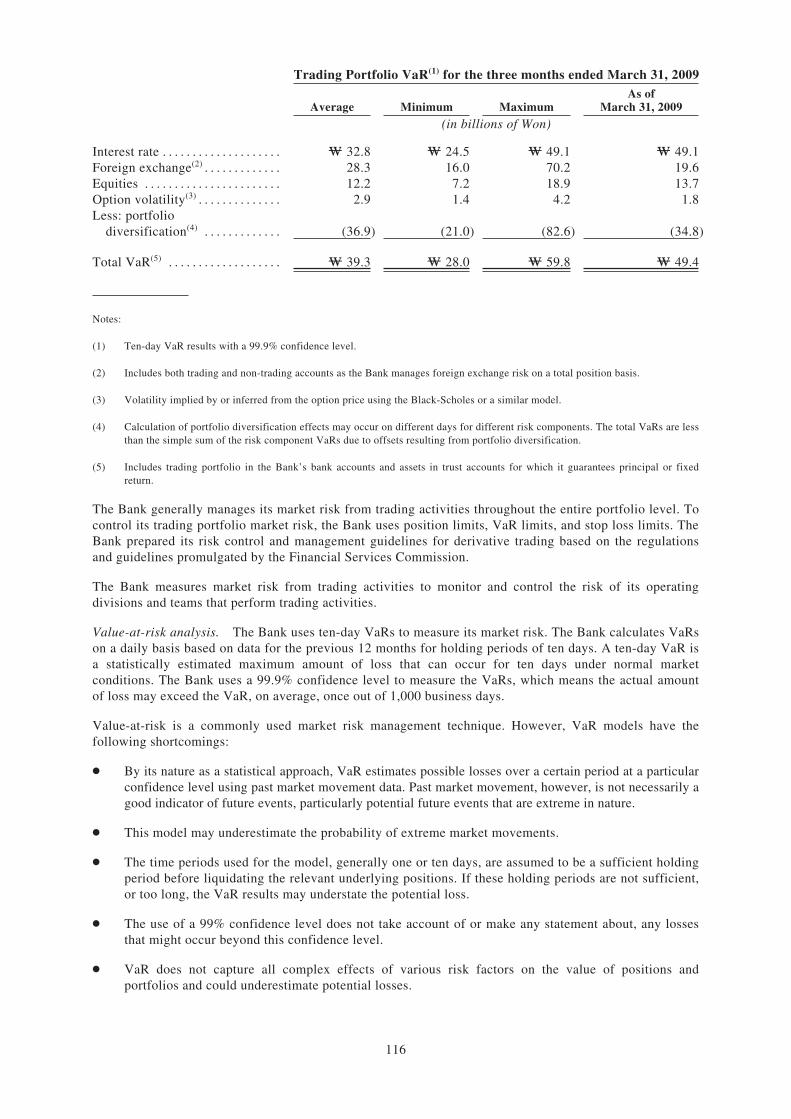
Trading Portfolio VaR(1) for the three months ended March 31, 2009
Average Minimum MaximumAs of
March 31, 2009
(in billions of Won)
Interest rate . . . . . . . . . . . . . . . . . . . . W 32.8 W 24.5 W 49.1 W 49.1Foreign exchange(2) . . . . . . . . . . . . . 28.3 16.0 70.2 19.6Equities . . . . . . . . . . . . . . . . . . . . . . . 12.2 7.2 18.9 13.7Option volatility(3) . . . . . . . . . . . . . . 2.9 1.4 4.2 1.8Less: portfolio
diversification(4) . . . . . . . . . . . . . (36.9) (21.0) (82.6) (34.8)
Total VaR(5) . . . . . . . . . . . . . . . . . . . W 39.3 W 28.0 W 59.8 W 49.4
Notes:
(1) Ten-day VaR results with a 99.9% confidence level.
(2) Includes both trading and non-trading accounts as the Bank manages foreign exchange risk on a total position basis.
(3) Volatility implied by or inferred from the option price using the Black-Scholes or a similar model.
(4) Calculation of portfolio diversification effects may occur on different days for different risk components. The total VaRs are lessthan the simple sum of the risk component VaRs due to offsets resulting from portfolio diversification.
(5) Includes trading portfolio in the Bank’s bank accounts and assets in trust accounts for which it guarantees principal or fixedreturn.
The Bank generally manages its market risk from trading activities throughout the entire portfolio level. Tocontrol its trading portfolio market risk, the Bank uses position limits, VaR limits, and stop loss limits. TheBank prepared its risk control and management guidelines for derivative trading based on the regulationsand guidelines promulgated by the Financial Services Commission.
The Bank measures market risk from trading activities to monitor and control the risk of its operatingdivisions and teams that perform trading activities.
Value-at-risk analysis. The Bank uses ten-day VaRs to measure its market risk. The Bank calculates VaRson a daily basis based on data for the previous 12 months for holding periods of ten days. A ten-day VaR isa statistically estimated maximum amount of loss that can occur for ten days under normal marketconditions. The Bank uses a 99.9% confidence level to measure the VaRs, which means the actual amountof loss may exceed the VaR, on average, once out of 1,000 business days.
Value-at-risk is a commonly used market risk management technique. However, VaR models have thefollowing shortcomings:
Š By its nature as a statistical approach, VaR estimates possible losses over a certain period at a particularconfidence level using past market movement data. Past market movement, however, is not necessarily agood indicator of future events, particularly potential future events that are extreme in nature.
Š This model may underestimate the probability of extreme market movements.
Š The time periods used for the model, generally one or ten days, are assumed to be a sufficient holdingperiod before liquidating the relevant underlying positions. If these holding periods are not sufficient,or too long, the VaR results may understate the potential loss.
Š The use of a 99% confidence level does not take account of or make any statement about, any lossesthat might occur beyond this confidence level.
Š VaR does not capture all complex effects of various risk factors on the value of positions andportfolios and could underestimate potential losses.
116
Currently, the Bank conducts back-testing of VaR results against actual outcomes on a daily basis.
The Bank operates an integrated market risk management system which manages The Bank’sWon-denominated and foreign-denominated accounts. This system uses historical simulation to measureboth linear risks arising from such products as equity and debt securities and nonlinear risks arising fromother products including options. The Bank believes that this system enables it to generate elaborate andconsistent VaR numbers and perform sensitivity analysis and back testing to check the validity of themodels on a daily basis.
Stress test. In addition to VaR, the Bank performs stress tests to measure market risk. As VaR assumesnormal market situations, the Bank assesses its market risk exposure to unlikely abnormal marketfluctuations through stress tests. Stress test is an important way to supplement VaR since VaR does notcover potential loss if the market moves in a manner which is outside the Bank’s normal expectations.Stress test projects the anticipated change in value of holding positions under certain scenarios assumingthat no action is taken during a stress event to change the risk profile of a portfolio.
The Bank uses seven relatively simple but fundamental scenarios for stress tests taking into account fourmarket risk components such as foreign exchange rates, stock prices and Won-denominated and foreigncurrency-denominated interest rates. For the worst case scenario, the Bank assumed instantaneous andsimultaneous movements in the four market risk components — depreciation of Won by 20%, decrease inKorea Exchange Composite Index by 30%, and increases in Won-denominated and U.S. dollar-denominatedinterest rates by 200 basis point and 200 basis points, respectively. In the case of this worst-case scenario,the change in market value of the Bank’s trading portfolio was a decline of W315.9 billion and W129.7billion as of December 31, 2008 and March 31, 2009, respectively. The Bank performs stress test at leastmonthly and reports the results to the ALM Committee and the Risk Management Committee.
The Bank sets limits on stress testing for its overall operations. If the impact of market turmoil or otherabnormalities is large, their respective chief risk officer may request a portfolio restructuring or otherproper action.
Hedging and Derivative Market Risk
The principal objective of the Bank’s groupwide hedging strategy is to manage its market risk withinestablished limits. The Bank uses derivative instruments to hedge its market risk as well as to make profitsby trading derivative products within pre-approved risk limits. The Bank’s derivative trading includesinterest rate and cross-currency swaps, foreign currency forwards and futures, stock index and interest ratefutures, and stock index and currency options.
While the Bank uses derivatives for hedging purposes, derivative transactions themselves incur market riskas the Bank takes trading positions and trades them for the purpose of making profits. These activitiesconsist primarily of the following:
Š arbitrage transactions to make profits from short-term discrepancies between the spot and derivativemarkets or within the derivative markets;
Š sales of tailor-made derivative products that meet various needs of the Bank’s corporate customers,and related transactions to reduce its exposure resulting from those sales;
Š taking positions in limited cases when the Bank expects short-swing profits based on its marketforecasts; and
Š trading to hedge the Bank’s interest rate and foreign currency risk exposure as described above.
Market risk from derivatives is not significant since derivative trading activities of the Bank are primarilydriven by arbitrage and customer deals with very limited open trading positions.
117
Market Risk Management for Non-trading Activities
Interest Rate Risk
Principal market risk from non-trading activities of the Bank is interest rate risk. Interest rate risk is the riskof loss resulting from interest rate fluctuations that adversely affect the financial condition and results ofoperations of the Bank. The Bank’s interest rate risk arises primarily due to differences between the timingof rate changes for interest-earning assets and interest-bearing liabilities.
Interest rate risk affects the Bank’s earnings and the economic value of the Bank’s net assets:
Š Earnings: interest rate fluctuations have an effect on the Bank’s net interest income by affecting itsinterest-sensitive operating income and expenses.
Š Economic value of net assets: interest rate fluctuations influence the Bank’s net worth by affectingthe present value of cash flows from the assets, liabilities and other transactions of the Bank.
Accordingly, the Bank measures and manages interest rate risk for non-trading activities by taking intoaccount effects of interest rate changes on both its income and net asset value. The Bank measures andmanages interest rate risk on a daily/monthly basis with respect to all interest-earning assets and interest-bearing liabilities in the Bank’s bank accounts (including derivatives denominated in Won which areinterest rate swaps for the purpose of hedging) and in the trust accounts, except that it measures VaRs on amonthly basis. Most of the Bank’s interest-earning assets and interest-bearing liabilities are denominated inWon.
Interest Rate Risk Management
The principal objectives of the Bank’s interest rate risk management are to generate stable net interestincome and to protect the Bank’s net asset value against interest rate fluctuations. To this end, the ALMCommittee sets out the Bank’s interest rate risk limits at least annually and the Risk ManagementDepartment monitors the Bank’s compliance with these limits and reports the monitoring results to theALM Committee on a monthly basis. The Bank uses interest rate swaps to control its interest rate exposurelimits.
On a daily/monthly basis, the Bank uses various analytical methodologies to measure and manage itsinterest rate risk for nontrading activities, including the following:
Š Interest Rate Gap Analysis. Interest rate gap analysis measures the difference in the amounts ofinterest-earning assets and interest-bearing liabilities at each maturity and repricing date for a specifictime frame.
Š Duration Gap Analysis. Duration gap analysis measures durations of the Bank’s interest-earningassets and interest-bearing liabilities, which are weighted average maturities of these assets andliabilities calculated based on discounted cash flows from these assets and liabilities using yieldcurves.
Š Market Value Analysis. Market value analysis measures changes in the market value of the Bank’sinterest-earning assets and interest-bearing liabilities based on the assumption of parallel shifts ininterest rates.
Š Net Interest Income Simulation Analysis. Net interest income simulation analysis uses deterministicanalysis methodology to measure changes in the Bank’s annual net interest income (interest incomeless interest expenses) under the current maturity structure, using different scenarios for interest rates(assuming parallel shifts) and funding requirements.
118
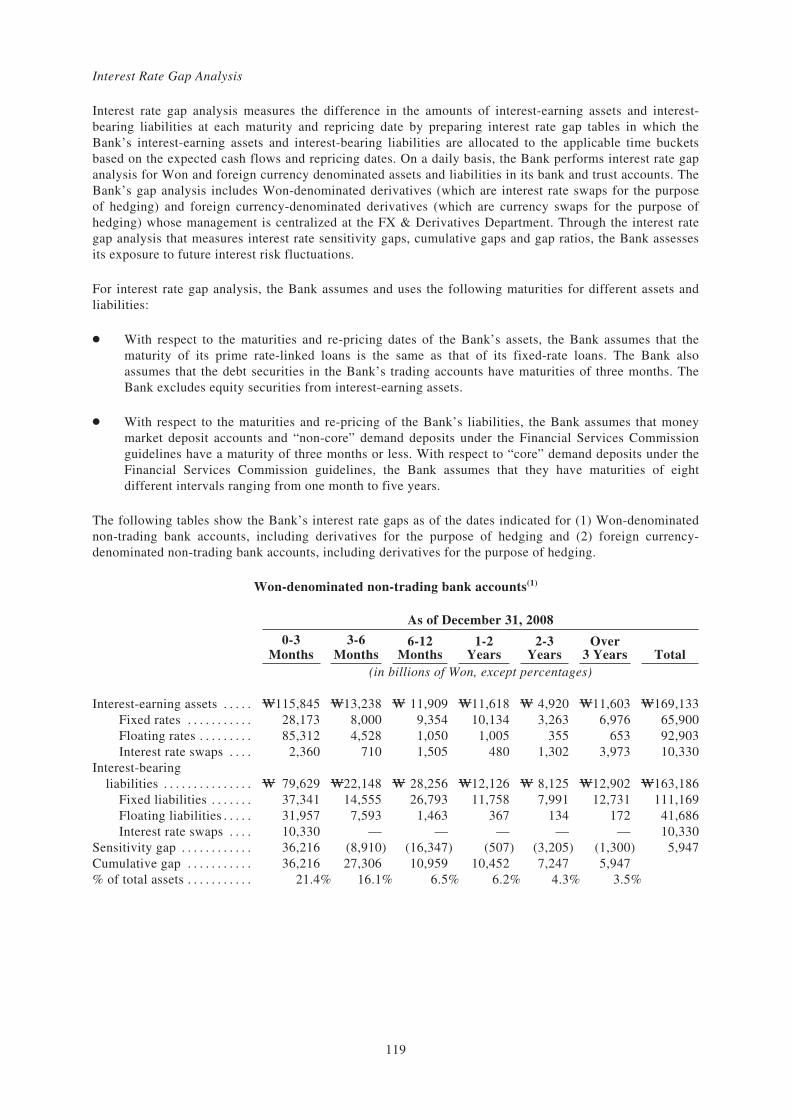
Interest Rate Gap Analysis
Interest rate gap analysis measures the difference in the amounts of interest-earning assets and interest-bearing liabilities at each maturity and repricing date by preparing interest rate gap tables in which theBank’s interest-earning assets and interest-bearing liabilities are allocated to the applicable time bucketsbased on the expected cash flows and repricing dates. On a daily basis, the Bank performs interest rate gapanalysis for Won and foreign currency denominated assets and liabilities in its bank and trust accounts. TheBank’s gap analysis includes Won-denominated derivatives (which are interest rate swaps for the purposeof hedging) and foreign currency-denominated derivatives (which are currency swaps for the purpose ofhedging) whose management is centralized at the FX & Derivatives Department. Through the interest rategap analysis that measures interest rate sensitivity gaps, cumulative gaps and gap ratios, the Bank assessesits exposure to future interest risk fluctuations.
For interest rate gap analysis, the Bank assumes and uses the following maturities for different assets andliabilities:
Š With respect to the maturities and re-pricing dates of the Bank’s assets, the Bank assumes that thematurity of its prime rate-linked loans is the same as that of its fixed-rate loans. The Bank alsoassumes that the debt securities in the Bank’s trading accounts have maturities of three months. TheBank excludes equity securities from interest-earning assets.
Š With respect to the maturities and re-pricing of the Bank’s liabilities, the Bank assumes that moneymarket deposit accounts and “non-core” demand deposits under the Financial Services Commissionguidelines have a maturity of three months or less. With respect to “core” demand deposits under theFinancial Services Commission guidelines, the Bank assumes that they have maturities of eightdifferent intervals ranging from one month to five years.
The following tables show the Bank’s interest rate gaps as of the dates indicated for (1) Won-denominatednon-trading bank accounts, including derivatives for the purpose of hedging and (2) foreign currency-denominated non-trading bank accounts, including derivatives for the purpose of hedging.
Won-denominated non-trading bank accounts(1)
As of December 31, 2008
0-3Months
3-6Months
6-12Months
1-2Years
2-3Years
Over3 Years Total
(in billions of Won, except percentages)
Interest-earning assets . . . . . W115,845 W13,238 W 11,909 W11,618 W 4,920 W11,603 W169,133Fixed rates . . . . . . . . . . . 28,173 8,000 9,354 10,134 3,263 6,976 65,900Floating rates . . . . . . . . . 85,312 4,528 1,050 1,005 355 653 92,903Interest rate swaps . . . . 2,360 710 1,505 480 1,302 3,973 10,330
Interest-bearingliabilities . . . . . . . . . . . . . . . W 79,629 W22,148 W 28,256 W12,126 W 8,125 W12,902 W163,186
Fixed liabilities . . . . . . . 37,341 14,555 26,793 11,758 7,991 12,731 111,169Floating liabilities . . . . . 31,957 7,593 1,463 367 134 172 41,686Interest rate swaps . . . . 10,330 — — — — — 10,330
Sensitivity gap . . . . . . . . . . . . 36,216 (8,910) (16,347) (507) (3,205) (1,300) 5,947Cumulative gap . . . . . . . . . . . 36,216 27,306 10,959 10,452 7,247 5,947% of total assets . . . . . . . . . . . 21.4% 16.1% 6.5% 6.2% 4.3% 3.5%
119
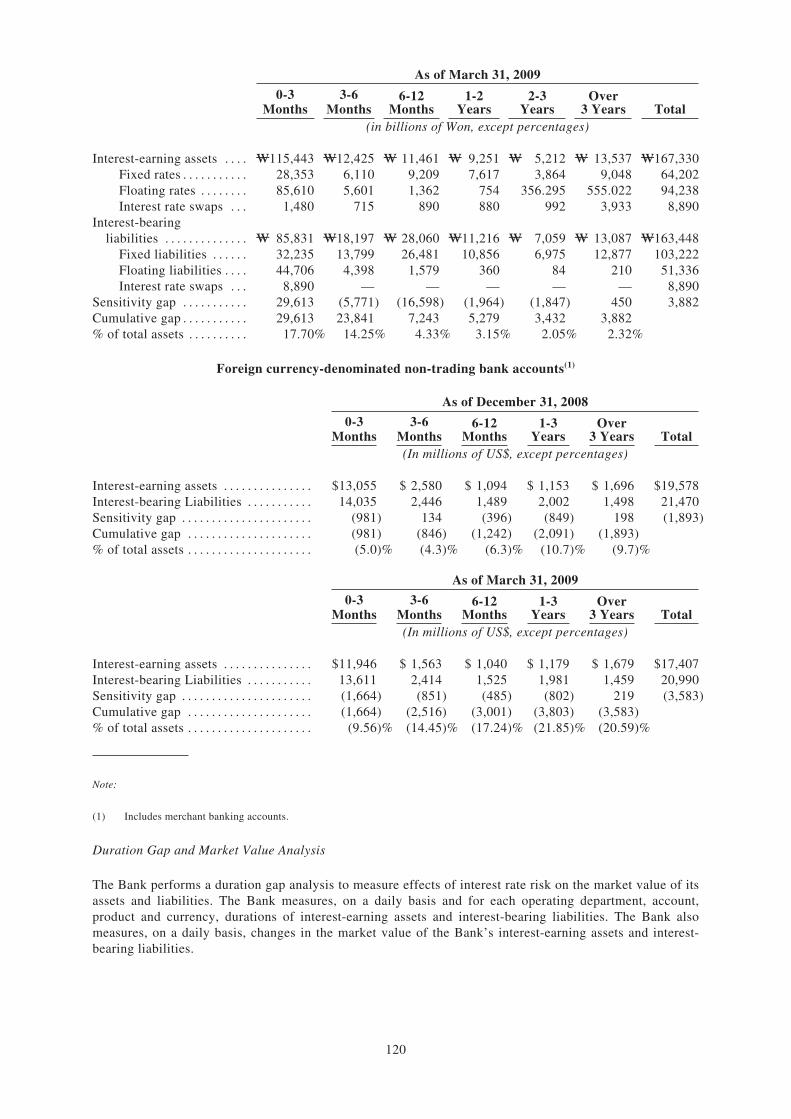
As of March 31, 2009
0-3Months
3-6Months
6-12Months
1-2Years
2-3Years
Over3 Years Total
(in billions of Won, except percentages)
Interest-earning assets . . . . W115,443 W12,425 W 11,461 W 9,251 W 5,212 W 13,537 W167,330Fixed rates . . . . . . . . . . . 28,353 6,110 9,209 7,617 3,864 9,048 64,202Floating rates . . . . . . . . 85,610 5,601 1,362 754 356.295 555.022 94,238Interest rate swaps . . . 1,480 715 890 880 992 3,933 8,890
Interest-bearingliabilities . . . . . . . . . . . . . . W 85,831 W18,197 W 28,060 W11,216 W 7,059 W 13,087 W163,448
Fixed liabilities . . . . . . 32,235 13,799 26,481 10,856 6,975 12,877 103,222Floating liabilities . . . . 44,706 4,398 1,579 360 84 210 51,336Interest rate swaps . . . 8,890 — — — — — 8,890
Sensitivity gap . . . . . . . . . . . 29,613 (5,771) (16,598) (1,964) (1,847) 450 3,882Cumulative gap . . . . . . . . . . . 29,613 23,841 7,243 5,279 3,432 3,882% of total assets . . . . . . . . . . 17.70% 14.25% 4.33% 3.15% 2.05% 2.32%
Foreign currency-denominated non-trading bank accounts(1)
As of December 31, 2008
0-3Months
3-6Months
6-12Months
1-3Years
Over3 Years Total
(In millions of US$, except percentages)
Interest-earning assets . . . . . . . . . . . . . . . $13,055 $ 2,580 $ 1,094 $ 1,153 $ 1,696 $19,578Interest-bearing Liabilities . . . . . . . . . . . 14,035 2,446 1,489 2,002 1,498 21,470Sensitivity gap . . . . . . . . . . . . . . . . . . . . . . (981) 134 (396) (849) 198 (1,893)Cumulative gap . . . . . . . . . . . . . . . . . . . . . (981) (846) (1,242) (2,091) (1,893)% of total assets . . . . . . . . . . . . . . . . . . . . . (5.0)% (4.3)% (6.3)% (10.7)% (9.7)%
As of March 31, 2009
0-3Months
3-6Months
6-12Months
1-3Years
Over3 Years Total
(In millions of US$, except percentages)
Interest-earning assets . . . . . . . . . . . . . . . $11,946 $ 1,563 $ 1,040 $ 1,179 $ 1,679 $17,407Interest-bearing Liabilities . . . . . . . . . . . 13,611 2,414 1,525 1,981 1,459 20,990Sensitivity gap . . . . . . . . . . . . . . . . . . . . . . (1,664) (851) (485) (802) 219 (3,583)Cumulative gap . . . . . . . . . . . . . . . . . . . . . (1,664) (2,516) (3,001) (3,803) (3,583)% of total assets . . . . . . . . . . . . . . . . . . . . . (9.56)% (14.45)% (17.24)% (21.85)% (20.59)%
Note:
(1) Includes merchant banking accounts.
Duration Gap and Market Value Analysis
The Bank performs a duration gap analysis to measure effects of interest rate risk on the market value of itsassets and liabilities. The Bank measures, on a daily basis and for each operating department, account,product and currency, durations of interest-earning assets and interest-bearing liabilities. The Bank alsomeasures, on a daily basis, changes in the market value of the Bank’s interest-earning assets and interest-bearing liabilities.
120
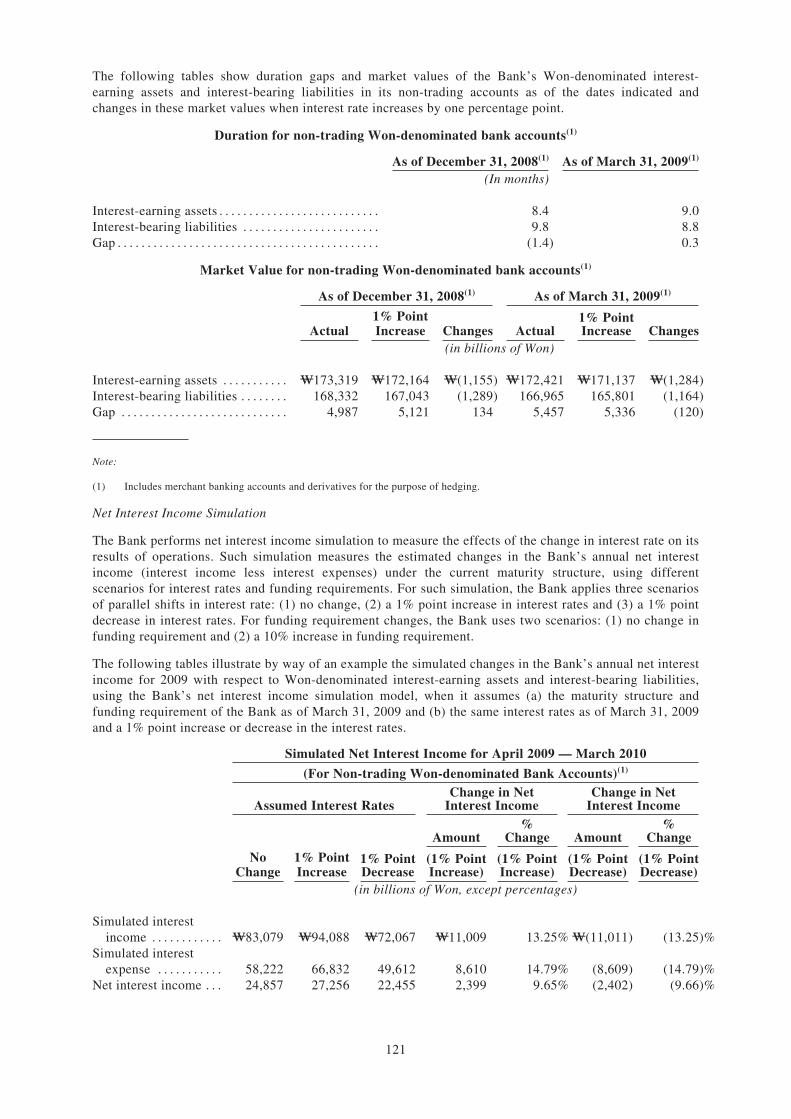
The following tables show duration gaps and market values of the Bank’s Won-denominated interest-earning assets and interest-bearing liabilities in its non-trading accounts as of the dates indicated andchanges in these market values when interest rate increases by one percentage point.
Duration for non-trading Won-denominated bank accounts(1)
As of December 31, 2008(1) As of March 31, 2009(1)
(In months)
Interest-earning assets . . . . . . . . . . . . . . . . . . . . . . . . . . . 8.4 9.0Interest-bearing liabilities . . . . . . . . . . . . . . . . . . . . . . . 9.8 8.8Gap . . . . . . . . . . . . . . . . . . . . . . . . . . . . . . . . . . . . . . . . . . . . (1.4) 0.3
Market Value for non-trading Won-denominated bank accounts(1)
As of December 31, 2008(1) As of March 31, 2009(1)
Actual1% PointIncrease Changes Actual
1% PointIncrease Changes
(in billions of Won)
Interest-earning assets . . . . . . . . . . . W173,319 W172,164 W(1,155) W172,421 W171,137 W(1,284)Interest-bearing liabilities . . . . . . . . 168,332 167,043 (1,289) 166,965 165,801 (1,164)Gap . . . . . . . . . . . . . . . . . . . . . . . . . . . . 4,987 5,121 134 5,457 5,336 (120)
Note:
(1) Includes merchant banking accounts and derivatives for the purpose of hedging.
Net Interest Income Simulation
The Bank performs net interest income simulation to measure the effects of the change in interest rate on itsresults of operations. Such simulation measures the estimated changes in the Bank’s annual net interestincome (interest income less interest expenses) under the current maturity structure, using differentscenarios for interest rates and funding requirements. For such simulation, the Bank applies three scenariosof parallel shifts in interest rate: (1) no change, (2) a 1% point increase in interest rates and (3) a 1% pointdecrease in interest rates. For funding requirement changes, the Bank uses two scenarios: (1) no change infunding requirement and (2) a 10% increase in funding requirement.
The following tables illustrate by way of an example the simulated changes in the Bank’s annual net interestincome for 2009 with respect to Won-denominated interest-earning assets and interest-bearing liabilities,using the Bank’s net interest income simulation model, when it assumes (a) the maturity structure andfunding requirement of the Bank as of March 31, 2009 and (b) the same interest rates as of March 31, 2009and a 1% point increase or decrease in the interest rates.
Simulated Net Interest Income for April 2009 — March 2010
(For Non-trading Won-denominated Bank Accounts)(1)
Assumed Interest RatesChange in Net
Interest IncomeChange in Net
Interest Income
Amount%
Change Amount%
Change
NoChange
1% PointIncrease
1% PointDecrease
(1% PointIncrease)
(1% PointIncrease)
(1% PointDecrease)
(1% PointDecrease)
(in billions of Won, except percentages)
Simulated interestincome . . . . . . . . . . . . W83,079 W94,088 W72,067 W11,009 13.25% W(11,011) (13.25)%
Simulated interestexpense . . . . . . . . . . . 58,222 66,832 49,612 8,610 14.79% (8,609) (14.79)%
Net interest income . . . 24,857 27,256 22,455 2,399 9.65% (2,402) (9.66)%
121
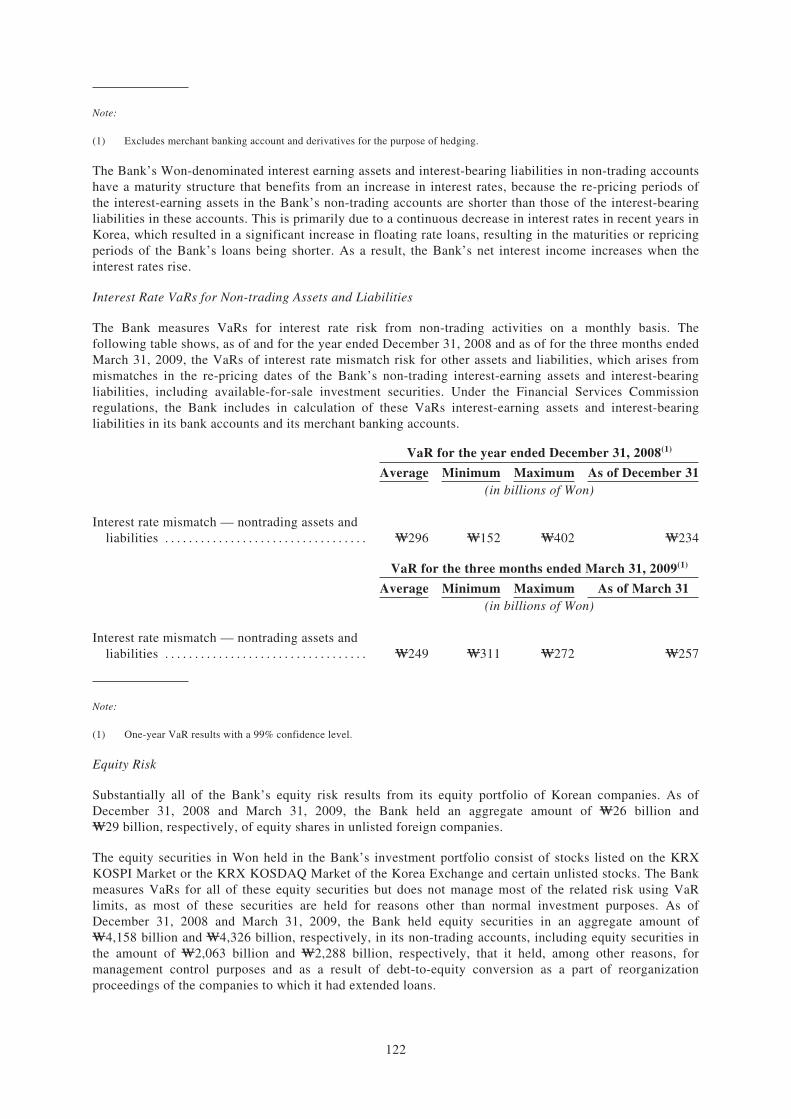
Note:
(1) Excludes merchant banking account and derivatives for the purpose of hedging.
The Bank’s Won-denominated interest earning assets and interest-bearing liabilities in non-trading accountshave a maturity structure that benefits from an increase in interest rates, because the re-pricing periods ofthe interest-earning assets in the Bank’s non-trading accounts are shorter than those of the interest-bearingliabilities in these accounts. This is primarily due to a continuous decrease in interest rates in recent years inKorea, which resulted in a significant increase in floating rate loans, resulting in the maturities or repricingperiods of the Bank’s loans being shorter. As a result, the Bank’s net interest income increases when theinterest rates rise.
Interest Rate VaRs for Non-trading Assets and Liabilities
The Bank measures VaRs for interest rate risk from non-trading activities on a monthly basis. Thefollowing table shows, as of and for the year ended December 31, 2008 and as of for the three months endedMarch 31, 2009, the VaRs of interest rate mismatch risk for other assets and liabilities, which arises frommismatches in the re-pricing dates of the Bank’s non-trading interest-earning assets and interest-bearingliabilities, including available-for-sale investment securities. Under the Financial Services Commissionregulations, the Bank includes in calculation of these VaRs interest-earning assets and interest-bearingliabilities in its bank accounts and its merchant banking accounts.
VaR for the year ended December 31, 2008(1)
Average Minimum Maximum As of December 31(in billions of Won)
Interest rate mismatch — nontrading assets andliabilities . . . . . . . . . . . . . . . . . . . . . . . . . . . . . . . . . . W296 W152 W402 W234
VaR for the three months ended March 31, 2009(1)
Average Minimum Maximum As of March 31(in billions of Won)
Interest rate mismatch — nontrading assets andliabilities . . . . . . . . . . . . . . . . . . . . . . . . . . . . . . . . . . W249 W311 W272 W257
Note:
(1) One-year VaR results with a 99% confidence level.
Equity Risk
Substantially all of the Bank’s equity risk results from its equity portfolio of Korean companies. As ofDecember 31, 2008 and March 31, 2009, the Bank held an aggregate amount of W26 billion andW29 billion, respectively, of equity shares in unlisted foreign companies.
The equity securities in Won held in the Bank’s investment portfolio consist of stocks listed on the KRXKOSPI Market or the KRX KOSDAQ Market of the Korea Exchange and certain unlisted stocks. The Bankmeasures VaRs for all of these equity securities but does not manage most of the related risk using VaRlimits, as most of these securities are held for reasons other than normal investment purposes. As ofDecember 31, 2008 and March 31, 2009, the Bank held equity securities in an aggregate amount ofW4,158 billion and W4,326 billion, respectively, in its non-trading accounts, including equity securities inthe amount of W2,063 billion and W2,288 billion, respectively, that it held, among other reasons, formanagement control purposes and as a result of debt-to-equity conversion as a part of reorganizationproceedings of the companies to which it had extended loans.
122
As of December 31, 2008 and March 31, 2009, the Bank held Won-denominated convertible bonds in theamount of W2 billion and W2 billion, respectively, and foreign currency exchangeable bonds in the amountof W22 billion and W25 billion, respectively, in its non-trading accounts. The Bank does not measureequity risk with respect to convertible and exchangeable bonds and the interest rate risk of these bonds aremeasured together with the other debt securities. As such, the Bank measures interest rate risk VaRs but notequity risk VaRs for these equity-linked securities.
The following table shows the VaRs of the Bank’s equity risk for listed equity as of the dates indicated.
As of December 31, 2008 As of March 31, 2009(in billions of Won)
Listed equities(1) . . . . . . . . . . . . . . . . . . . . . . . . . . . . . . . . . . . W880 W966
Note:
(1) Ten-day VaR results with a 99.9% confidence level.
Liquidity Risk Management
Liquidity risk is the risk of insolvency, default or loss due to disparity between inflow and outflow of funds,including having to obtain funds at a high price or to dispose of securities at an unfavorable price due tolack of available funds or losing attractive investment opportunities.
The Bank applies the following basic principles for liquidity risk management:
Š maintain an appropriate level of liquidity risk through liquidity risk management based on liquiditygap or debt-to-equity ratio at each maturity date;
Š assess and monitor net cash flows by currency and by maturity and continuously evaluate availablesources of funds and possibility of disposal of any liquid assets;
Š diversify sources and uses of funds by product and by maturity to prevent excessive concentration incertain periods or products; and
Š prepare contingency plans to cope with liquidity crisis.
The Bank manages its liquidity risk within the limits set on Won and foreign currency accounts inaccordance with the regulations of the Financial Services Commission. The Financial Services Commissionrequires Korean banks to maintain a Won liquidity ratio of at least 100.0% and a foreign currency liquidityratio of at least 85.0%. The Financial Services Commission defines foreign currency liquidity ratio asforeign currency-denominated liquid assets (including marketable securities) due within three monthsdivided by foreign currency-denominated liabilities due within three months. As for the Won liquidity ratio,prior to October 2008 the Financial Services Commission defined it as Won-denominated liquid assets(including marketable securities) due within three months divided by Won-denominated liabilities duewithin three months, but since October 2008 defines it as Won-denominated liquid assets (includingmarketable securities) due within one month divided by Won-denominated liabilities due within one month.
The Treasury Department is in charge of liquidity risk management with respect to the Bank’s Won andforeign currency funds. The Treasury Department submits the Bank’s monthly funding and assetmanagement plans to the ALM Committee for its approval, based on the analysis of various factors,including macroeconomic indices, interest rate and foreign exchange movements and maturity structures ofthe Bank’s assets and liabilities. The Risk Management Department measures the Bank’s liquidity ratio andliquidity gap ratio on a daily basis and reports whether they are in compliance with the limits to the ALMCommittee on a monthly basis.
123
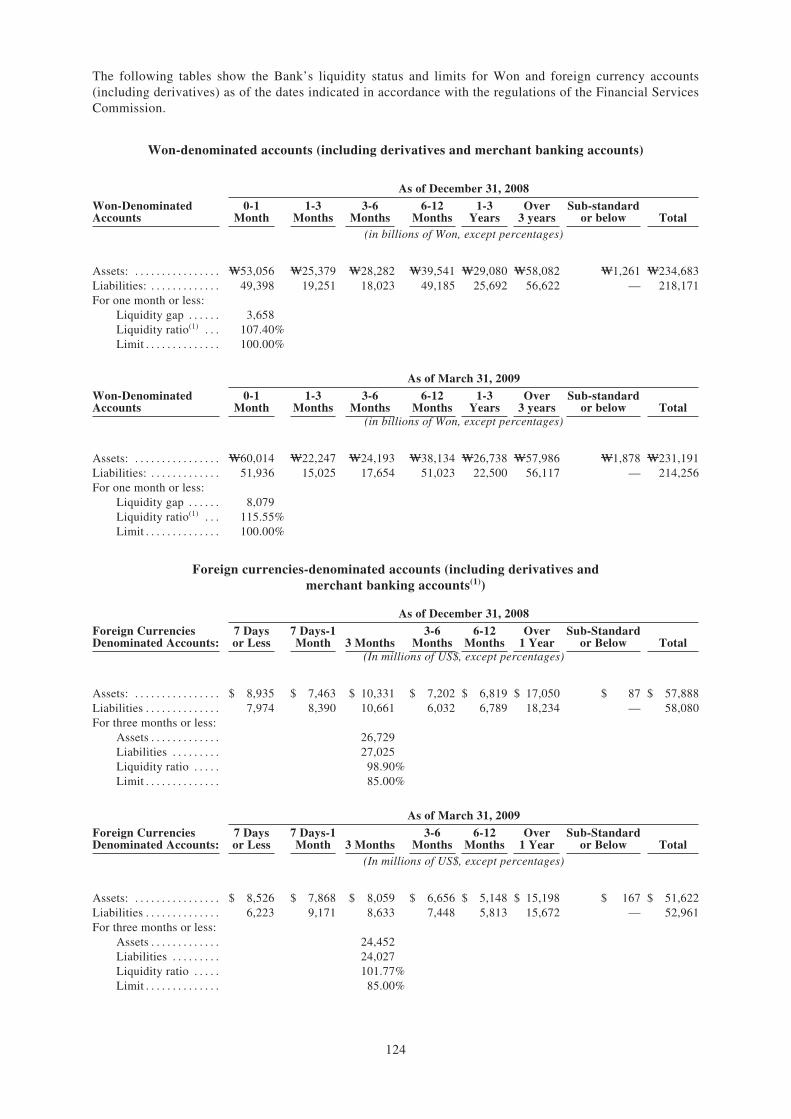
The following tables show the Bank’s liquidity status and limits for Won and foreign currency accounts(including derivatives) as of the dates indicated in accordance with the regulations of the Financial ServicesCommission.
Won-denominated accounts (including derivatives and merchant banking accounts)
As of December 31, 2008
Won-DenominatedAccounts
0-1Month
1-3Months
3-6Months
6-12Months
1-3Years
Over3 years
Sub-standardor below Total
(in billions of Won, except percentages)
Assets: . . . . . . . . . . . . . . . . W53,056 W25,379 W28,282 W39,541 W29,080 W58,082 W1,261 W234,683Liabilities: . . . . . . . . . . . . . 49,398 19,251 18,023 49,185 25,692 56,622 — 218,171For one month or less:
Liquidity gap . . . . . . 3,658Liquidity ratio(1) . . . 107.40%Limit . . . . . . . . . . . . . . 100.00%
As of March 31, 2009
Won-DenominatedAccounts
0-1Month
1-3Months
3-6Months
6-12Months
1-3Years
Over3 years
Sub-standardor below Total
(in billions of Won, except percentages)
Assets: . . . . . . . . . . . . . . . . W60,014 W22,247 W24,193 W38,134 W26,738 W57,986 W1,878 W231,191Liabilities: . . . . . . . . . . . . . 51,936 15,025 17,654 51,023 22,500 56,117 — 214,256For one month or less:
Liquidity gap . . . . . . 8,079Liquidity ratio(1) . . . 115.55%Limit . . . . . . . . . . . . . . 100.00%
Foreign currencies-denominated accounts (including derivatives andmerchant banking accounts(1))
As of December 31, 2008
Foreign CurrenciesDenominated Accounts:
7 Daysor Less
7 Days-1Month 3 Months
3-6Months
6-12Months
Over1 Year
Sub-Standardor Below Total
(In millions of US$, except percentages)
Assets: . . . . . . . . . . . . . . . . $ 8,935 $ 7,463 $ 10,331 $ 7,202 $ 6,819 $ 17,050 $ 87 $ 57,888Liabilities . . . . . . . . . . . . . . 7,974 8,390 10,661 6,032 6,789 18,234 — 58,080For three months or less:
Assets . . . . . . . . . . . . . 26,729Liabilities . . . . . . . . . 27,025Liquidity ratio . . . . . 98.90%Limit . . . . . . . . . . . . . . 85.00%
As of March 31, 2009
Foreign CurrenciesDenominated Accounts:
7 Daysor Less
7 Days-1Month 3 Months
3-6Months
6-12Months
Over1 Year
Sub-Standardor Below Total
(In millions of US$, except percentages)
Assets: . . . . . . . . . . . . . . . . $ 8,526 $ 7,868 $ 8,059 $ 6,656 $ 5,148 $ 15,198 $ 167 $ 51,622Liabilities . . . . . . . . . . . . . . 6,223 9,171 8,633 7,448 5,813 15,672 — 52,961For three months or less:
Assets . . . . . . . . . . . . . 24,452Liabilities . . . . . . . . . 24,027Liquidity ratio . . . . . 101.77%Limit . . . . . . . . . . . . . . 85.00%
124
Note:
(1) In October 2008, the criteria for Won currency liquidity ratio were changed from three months of residual maturity to one monthof residual maturity.
The Bank maintains diverse sources of liquidity to facilitate flexibility in meeting its funding requirements.The Bank funds its operations principally by accepting deposits from retail and corporate depositors,accessing the call loan market (a short-term market for loans with maturities of less than one month),issuing debentures and borrowing from the Bank of Korea. The Bank uses the funds primarily to extendloans or purchase securities. Generally, deposits are of shorter average maturity than loans or investments.
In addition to liquidity risk management under the normal market situations, the Bank has contingencyplans to effectively cope with possible liquidity crisis. Liquidity crisis arises when the Bank would not beable to effectively manage the situations with its normal liquidity management measures due to, amongother reasons, inability to access the Bank’s normal sources of funds or epidemic withdrawals of deposits asa result of various external or internal factors, including a collapse in the financial markets or abruptdeterioration of the Bank’s credit. The Bank has contingency plans corresponding to different stages ofliquidity crisis: “cautionary stage”, “near-crisis stage” and “crisis stage”, based on the following liquidityindices:
Š indices that reflect the market movements such as interest rates and stock prices;
Š indices that reflect financial market psychology such as the size of money market funds; and
Š indices that reflect the Bank’s internal financial condition.
Operational Risk Management
Operational risk is difficult to quantify and subject to different definitions. The Basel Committee definesoperational risk as the risk of loss resulting from inadequate or failed internal processes, people and systemsor from other external events. Similarly, the Bank defines operational risk as the risks related to its overallmanagement other than credit risk, market risk, interest rate risk and liquidity risk. These include risksarising from system failure, human error or non-adherence to policy and procedures, from fraud orinadequate internal controls and procedures, and from environmental changes, resulting in financial andnon-financial loss, including reputational loss. The Bank monitors and assesses operational risks related toits business operations, including administrative risk, information technology risk, managerial risk, legalrisk and reputation risk, with a view to minimizing such losses.
To monitor and manage operational risks, the Bank maintains, a system of comprehensive policies and hasin place a control framework designed to provide a stable and well-managed operational environmentthroughout the organization. Currently, the primary responsibility for ensuring compliance with the Bank’sbanking operational risk procedures remains with each of the business units and operational teams. Inaddition, the Audit Department, the Risk Management Department and the Compliance Department of theBank also play important roles in reviewing and maintaining the integrity of the Bank’s internal controlenvironment.
The operational risk management system of the Bank is managed by the operational risk team under theRisk Management Department. The current system principally consists of risk control self-assessment, riskquantification using key risk indicators, loss data collection, scenario management and operational riskcapital measurement. The Bank operates several educational and awareness programs with a view tofamiliarizing all of its employees to this new system. In addition, the Bank has a designated operational riskmanager at each of its departments and branch offices, serving the role of a coordinator between theoperational risk team at the headquarters and the employees in the field and seeking to provide centralizedfeedback to further improve the operational risk management system.
125
As of December 31, 2008 and March 31, 2009, the Bank has conducted risk control self-assessments on itsdepartments as well as domestic and overseas branch offices, from which it collects systematized data on allof its branch offices, and uses the findings from such self-assessments to improve the procedures andprocesses for the relevant departments or branch offices. In addition, the Bank has accumulated risk-relateddata since 2003, improved the procedures for monitoring operational losses and is developing risksimulation models. In addition, the Bank selects and monitors, at the department level, approximately 200key risk indicators.
The audit committee of the Bank, which consists of three board members, including two outside directors,is an independent inspection authority that supervises the Bank’s internal controls and compliance withestablished ethical and legal principles. The audit committee performs internal audits of, among othermatters, the Bank’s overall management and accounting, and supervises its Audit Department, which assiststhe Bank’s audit committee. The Bank’s audit committee also reviews and evaluates the Bank’s accountingpolicies and their changes, financial and accounting matters and fairness of financial reporting.
The Bank’s Audit Committee and the Audit Department supervise and perform the following audits:
Š general audits, including full-scale audits performed annually for the overall operations, sectionalaudits of selected operations performed when necessary, and periodic and irregular spot audits;
Š special audits, performed when the Audit Committee or a standing director who is an audit committeemember deems it necessary or pursuant to requests by the chief executive officer or supervisoryauthorities such as the Financial Supervisory Service;
Š day-to-day audits, performed by the standing director who is an audit committee member for materialtransactions or operations that are subject to approval by the heads of the Bank’s operationaldepartments or senior executives;
Š real-time monitoring audits, performed by the computerized audit system to identify any irregulartransactions and take any necessary actions; and
Š self-audits as a self-check by each operational department to ensure its compliance with the Bank’sbusiness regulations and policies, which include daily audits, monthly audits and special audits.
In addition to these audits and compliance activities, the Bank’s Audit Department designates operationalrisk management examiners to monitor the appropriateness of operational risk management frameworks andthe functions and activities of the board of directors, relevant departments and business units, and conductsperiodic checks on the operational risk and reports such findings. The Bank’s Audit Department alsoreviews in advance proposed banking products or other business or service plans with a view to minimizingoperational risk.
General audits, special audits, day-to-day audits and real-time monitoring audits are performed by theBank’s examiners, and self-audits are performed by the self-auditors of the relevant operationaldepartments.
In addition to internal audits and inspections, the Financial Supervisory Service conducts general annualaudits of the Bank’s operations. The Financial Supervisory Service also performs special audits as the needarises on particular aspects of the Bank’s operations such as risk management, credit monitoring andliquidity. In the ordinary course of these audits, the Financial Supervisory Service routinely issues warningnotices where it determines that a regulated financial institution or such institution’s employees have failedto comply with the applicable laws or rules, regulations and guidelines of the Financial Supervisory Service.The Bank has in the past received, and expects in the future to receive, such notices and it has taken andwill continue to take appropriate actions in response to such notices. For example, in January 2009, theBank reported to the Financial Supervisory Service that an employee at a regional branch of the Bank hadembezzled approximately W22 billion of the Bank’s funds. The Bank expects to recover approximatelyW5.7 billion of the embezzled fund. To date, the Bank is waiting for the Financial Supervisory Service toissue a request for remedial measures.
126
The Bank considers legal risk as a part of operational risk. The uncertainty of the enforceability ofobligations of the Bank’s customers and counterparties, including foreclosure on collateral, creates legalrisk. Changes in laws and regulations could also adversely affect the Bank. Legal risk is higher in new areasof business where the law is often untested in the courts although legal risk can also increase in the Bank’straditional business to the extent that the legal and regulatory landscape in Korea is changing and many newlaws and regulations governing the banking industry remain untested. The Bank seeks to minimize legalrisk by using stringent legal documentation, employing procedures designed to ensure that transactions areproperly authorized and consulting legal advisers. The Compliance Department operates the Bank’scompliance inspection system. This system is designed to ensure that all of the Bank’s employees complywith the law. The compliance inspection system’s main function is to monitor the degree of improvement incompliance with the law, maintain internal controls (including ensuring that each department hasestablished proper internal policies and that it complies with those policies) and educate employees aboutobservance of the law. The Compliance Department also supervises the management, execution andperformance of the self-audits.
Upgrades and Integration of Risk Management
In December 2007, the Bank obtained approval from the Financial Supervisory Service to use an internalmarket risk evaluation model, and in April 2008, the Bank became the first commercial bank in Korea toobtain approval from the Financial Supervisory Service to use the foundation internal rating-based(“F-IRB”) method with respect to the Basel II credit risks related to loan portfolios of large companies,small- and medium-sized enterprises and retail outlets. In December 2008, the Bank applied for approvalfrom the Financial Supervisory Service to use the advanced internal rating-based (“A-IRB”) method withrespect to operational risks and is currently undergoing the review process.
The approval to use the internal market risk evaluation model enables the Bank to gain a pricing advantagecompared to other banks, as such model makes it easier for the Bank to manage its capital and meet the BISequity ratio through a differentiated risk assessment based on the borrower’s credit rating.
Since 2003, in anticipation of the Basel II requirements, the Bank has taken measures to improve its riskmanagement system, including the design and operation of its credit evaluation model, quantitativemodeling of risk factors and testing the adequacy of such factors, and management and monitoring of creditrisks, to a level consistent with international practice. Consistent with this approach, since 2005, the Bankhas been reflecting the cost of credit based on expected loss in the computation of its pre-tax profits andalso adopted the Risk Adjusted Return on Capital (“RAROC”) system to evaluate risk adjustments, and in2008, the Bank expects to give further weight to the use of the RAROC evaluation system in determiningthe lending rates and the risk-adjusted profitability of such loans.
The Bank aims to apply the Basel II standards and principles more systematically in its systems governingthe lending process, price determination, portfolio and risk management, allocation of capital, performanceevaluations and incentive determinations. In particular, the Bank aims to further develop portfoliomanagement techniques to optimize the investment of its own capital in light of the differentiateddetermination of regulatory capital based on the level of risk under Basel II.
127
MANAGEMENT AND EMPLOYEES
Management
Board of Directors
Management of the Bank is the responsibility of the Board of Directors of the Bank (the “Board”), which isresponsible for policy and strategic matters, has the ultimate responsibility for the administration of theaffairs of the Bank and oversees the day-to-day operations through several governing bodies. The addressfor each of the Directors of the Board is: c/o Shinhan Bank, 120, 2-Ka, Taepyung-ro, Chung-Ku, Seoul,Korea.
The Board is comprised of two Standing Directors (one of whom is an Executive Director) and sevenNon-Standing (Outside) Directors.
The Standing (Executive) Director is elected for a renewable term of up to three years as determined at thegeneral meeting of the Bank’s shareholders. Non-Standing (Outside) Directors are elected for a renewableterm of two-years. The Standing Director who is a member of the audit committee (as described below) iselected for a renewable term of three years. The Board meets at least once every quarter and additionalextraordinary meetings can be convened at the request of the chairman of the Board.
In addition, the Board has established four committees to carry out duties for the purpose of supporting theadministration of various Board responsibilities: an audit committee, a risk management committee, anaudit committee member nomination committee and an outside director nomination committee.
The purpose of the audit committee is to (i) establish internal audit plans, carry out such plans, evaluate theresults, take appropriate follow-up measures and propose appropriate reforms, (ii) evaluate and proposeappropriate reforms regarding the comprehensive system of internal controls, (iii) approve theappointment(s) of external auditor(s), and (iv) perform various other functions similar to the foregoing.
The purpose of the risk management committee is to (i) review risk, evaluation and limit policies of theBank, (ii) review asset liability management and credit and market risk measures, and (iii) regulate assetquality, risk exposure and problem assets.
The purpose of the audit committee nomination committee is to nominate, and recommend to the Board forappointment candidates for members of the audit committee.
The purpose of the outside director nomination committee is to nominate, and recommend at the relevantgeneral shareholders meeting for appointment candidates for outside directors.
Standing (Executive) Director
As of the date of this offering circular, the Bank had one Standing (Executive) Director, who is a full-timeemployee of the Bank and holds executive positions as listed below.
Name Age Position CEO Since Date Term Ends
Baek Soon Lee 57 President and Chief Executive Officer March 17, 2009 March 16, 2012
Baek Soon Lee has been the Bank’s president, chief executive officer and executive director sinceMarch 17, 2009. Mr. Lee previously served as Shinhan Financial Group’s Deputy President. Mr. Leegraduated from Deok Su commercial high school.
The above Executive Director does not hold external positions outside of the Bank.
128
Standing Director (Audit Committee Member)
Name Age PositionStatutoryAuditor Since Date Term Ends
Woo-Jong Won 56 Standing Director March 21, 2008 March 20, 2011
Woo-Jong Won has been a Standing Director and a member of the Audit Committee since March 21, 2008.Mr. Won previously worked as the Director of the Non-Bank Service Department in the FinancialSupervisory Service. Mr. Won received his B.A. in economics from Sogang University.
Non-Standing (Outside) Directors
As of the date of this offering circular, the Bank had seven Non-Standing (Outside) Directors, as listedbelow.
Name Age Position Director Since Date Term Ends
Sang Hoon Shin 61 Director, President and CEO of ShinhanFinancial Group
March 17, 2009 March 16, 2010
Chul Soon Park 52 Director, Professor of Seoul NationalUniversity
March 17, 2009 March 16, 2011
Kyung-Suh Park 51 Director, Professor of Korea University April 1, 2006 March 17, 2010Sung Ho Wee 52 Director, Vice President of Shinhan
Financial GroupMarch 17, 2009 March 16, 2010
Sang Rok Seo 69 Director, Ex-Dean of University ofIncheon
April 1, 2006 March 17, 2010
Jae Ha Park 52 Director, Deputy Director of KoreaInstitute of Finance
March 19, 2007 March 16, 2011
Hirakawa Yuki 49 Director, CEO of Pyung ChunIndustries Corporation
March 17, 2009 March 16, 2010
Sang Hoon Shin has been a Non-Standing Director since March 17, 2009. Mr. Shin has worked at ShinhanBank since 1982 and previously served as Shinhan Financial Group’s Senior Executive Vice President andPresident and Chief Executive Officer of Shinhan Bank. Mr. Shin received a B.A. in businessadministration from Sungkyunkwan University and a M.B.A. from Yonsei University.
Chul Soon Park has been a Non-Standing Director since March 17, 2009. Mr. Park worked as the Vice Deanof College of Economics at Seoul National University and is currently a professor in the College ofBusiness Administration at Seoul National University. Mr. Park received his B.A. in economics from SeoulNational University and his Ph. D. in business administration from Columbia University.
Kyung-Suh Park has been a Non-Standing Director since April 1, 2006. Mr. Park is currently a professor ofbusiness administration at Korea University. Mr. Park received his B.A. in business administration fromKorea University and received his Ph.D in business administration from Northwestern University.
Sung Ho Wee has been a Non-Standing Director since March 17, 2009. Mr. Wee previously worked as thegeneral manager of Shinhan Bank Gua Cheon branch and private banking department, and is currently aDeputy President of Shinhan Financial Group. Mr. Wee received his B.A. in economics from KoreaUniversity.
Sang-Rok Seo has been a Non-Standing Director since April 1, 2006. Mr. Seo previously worked as theDean of Incheon University and is currently a joint professor at Kyungbook University. Mr. Seo receivedhis B.A. in economics from Seoul National University and his Ph.D in economics from the University ofIllinois.
129
Jae Ha Park has been a Non-Standing Director since March 19, 2007. Mr. Park is currently the deputydirector of Korea Institute of Finance. Mr. Park received his B.A. in economics from Seoul NationalUniversity and his Ph.D from Pennsylvania State University.
Hirakawa Yuki has been a Non-Standing Director since March 17, 2009. Mr. Yuki is currently ChiefExecutive Officer of Pyung Chun Industries Corporation. Mr. Yuki received his B.A. in Spanish from theNational Osaka University.
Substantially all of the Non-Standing (Outside) Directors hold positions with companies or organizationsother than the Bank (the principal such positions are specified above).
Management
As of the date of this offering circular, the management of the Bank consists of 11 Non-Director ExecutiveOfficers.
Non-Director ExecutiveOfficers Age Position
ExecutiveOfficer Since Date Term Ends
Jeum Joo Gweon 54 Deputy President — RetailBusiness DevelopmentGroup
December 19, 2006 December 18, 2010
Joo Won Park 55 Deputy President — RiskManagement Group
December 21, 2007 December 20, 2009
Chan Park 52 Deputy President —Management Support Group
August 29, 2007 August 28, 2009
Jung Won Lee 53 Deputy President — CreditAnalysis & AssessmentGroup
August 29, 2007 August 28, 2009
Hyung Jin Kim 51 Deputy President —Management PlanningGroup
December 21, 2007 December 20, 2009
Young Hoon Lee 53 Deputy President —Corporate Banking Group
December 21, 2007 December 20, 2009
Sung Rack Lee 51 Deputy President —Institutional Banking Group
August 29, 2008 August 28, 2010
Dong Dae Lee 52 Executive Vice President —Investment Banking Group
February 12, 2009 February 11, 2011
Se Il Oh 52 Executive Vice President —IT Group
February 12, 2009 February 11, 2011
Yong Byung Cho 52 Executive Vice President —Treasury & Global BankingGroup
February 12, 2009 February 11, 2011
Jong Bok Moon 52 Executive Vice President —Wealth Management Group
February 12, 2009 February 11, 2011
Jeum Joo Gwon has been our Deputy President and Non-Director Executive Officer since December 19,2006. Mr. Gwon previously served as the Deputy General Manager of the Financial Planning Department inShinhan Financial Group. Mr. Gwon received his B.A. in business administration from Hongik University.
Joo Won Park has been our Deputy President and Non-Director Executive Officer since December 21,2007. Mr. Park previously served as the General Manager of the Human Resources Department at ChohungBank. Mr. Park received his B.A. in agricultural education at Seoul National University.
Chan Park has been our Deputy President and Non-Director Executive Officer since August 29, 2007.Mr. Park previously served as the General Manager of Chohung Bank’s New Bank Promotion Departmentand Vice President of Shinhan Bank’s Value Innovation Department. Mr. Park received his B.A. inagricultural economics from Jun Book University.
130
Jung Won Lee has been our Deputy President and Non-Director Executive Officer since August 29, 2007.Mr. Lee previously served as General Manager of Shinhan Bank’s Credit Planning Department and CreditAnalysis & Assessment Department. Mr. Lee received his B.A. in trade from Sung Kyun Kwan University.
Hyung Jin Kim has been our Deputy President and Non-Director Executive Officer since December 21,2007. Mr. Kim previously served as Branch Manager of Shinhan Bank’s East Seocho Branch, GeneralManager of Human Resources Department, and Head of the Value Innovation Department. Mr. Kimreceived his B.A. in economics from Yeungnam University.
Young Hoon Lee has been our Deputy President and Non-Director Executive Officer since December 21,2007. Mr. Lee previously served as Branch Manager of Shinhan Bank’s Ansan Corporate Finance Branchand General Manager of Corporate Banking Department. Mr. Lee received his B.A. in economics fromJeonam University.
Sung Rack Lee has been our Deputy President and Non-Director Executive Officer since August 29, 2008.Mr. Lee previously served as Branch Manager of Shinhan Bank’s Garak Branch and Incheon InternationalAirport Branch, and General Manager of the General Affairs Department and the Human ResourcesDepartment. Mr. Lee received his B.A. in economics from Konkook University.
Dong Dae Lee has been our Executive Vice President and Non-Director Executive Officer sinceFebruary 12, 2009. Mr. Lee previously served as Branch Manager of Shinhan Bank’s Samsung CentralConglomerate Finance Branch and Head of the Conglomerate Sales Department. Mr. Lee received his B.A.in trade from Myungji University.
Se Il Oh has been our Executive Vice President and Non-Director Executive Officer since February 12,2009. Mr. Oh previously served as General Manager of Shinhan Bank’s Information System Departmentand Comprehensive Financial Support Department and Head of Corporate Sales Department. Mr. Ohreceived his B.A. in economics from Yeonsei University.
Yong Byung Cho has been our Executive Vice President and Non-Director Executive Officer sinceFebruary 12, 2009. Mr. Cho previously served as Branch Manager of Shinhan Bank’s Sejongro Branch andNew York office, and General Manager of Human Resources and Financial Planning Department. Mr. Choreceived his B.A. in law from Korea University.
Jong Bok Moon has been our Executive Vice President and Non-Director Executive Officer sinceFebruary 12, 2009. Mr. Moon previously served as Branch Manager of Chohung Bank’s Daegu CorporateFinance Branch and Shinhan Bank’s Euljiro Corporate Finance Branch.
Audit Committee
The Bank has an Audit Committee under the Board. The rights and responsibilities of the Audit Committeeinclude the following: (i) conduct the audit of accounting and business of the Bank, (ii) investigate theagenda and documents to be submitted at general shareholders meetings and state at general shareholdersmeetings its opinion on whether there exists any violation of laws, regulations or articles of incorporation orremarkable illegality, (iii) demand the convening of extraordinary shareholders meetings, (iv) requestreports on business of subsidiaries and if necessary, investigate business or status of properties ofsubsidiaries, (v) approve the appointment of external auditors and (vi) handle other matters delegated by theBoard.
131
As of the date of this offering circular, the audit committee of the Bank consists of the following members.
Name Age PositionAudit CommitteeMember Since Date Term Ends
Sang-Rok Seo 69 Head of the auditcommittee; non-standing(outside) director
April 1, 2006 March 17, 2010
Jae-Ha Park 52 Member of the auditcommittee; non-standing(outside) director
March 19, 2007 March 16, 2011
Woo-Jong Won 56 Standing member of theaudit committee
March 21, 2008 March 20, 2001
Sang-Rok Seo has been the Head of the Audit Committee and a non-standing outside director since April 1,2006. Mr. Seo previously worked as director and statutory auditor of Samsung Life Insurance Co., Ltd. andreceived his Ph.D from University of Illinois.
Jae-Ha Park has been a member of the Audit Committee and a non-standing outside director sinceMarch 19, 2007. Mr. Park has previously as advisor of the Ministry of Finance and Economy and receivedhis Ph.D from Pennsylvania State University.
Woo-Jong Won has been the standing member of the Audit Committee since March 21, 2008. Mr. Wonpreviously worked as professor at the Human Resources Development Office in the Financial SupervisoryService. Mr. Won received his B.A. in economics from Sogang University.
Risk Management Committee
The Risk Management Committee currently consists of three outside directors, namely Chul Soon Park,Kyung-Suh Park and Sung Ho Wee. The committee oversees and makes determinations on all issuesrelating to the Bank’s comprehensive risk management function. In order to ensure the Bank’s stablefinancial condition and to maximize its profits, the committee monitors the Bank’s overall risk exposureand reviews the Bank’s compliance with risk policies and risk limits. In addition, the committee reviewsrisk and control strategies and policies, evaluates whether each risk is at an adequate level, establishes orabolishes risk management divisions, reviews risk-based capital allocations, and reviews the plans andevaluation of internal control. The committee holds regular meetings every quarter.
Audit Committee Nomination Committee
Members of this committee will be appointed by the Bank’s Board if and only to the extent necessary torecommend and nominate candidates for the Bank’s audit committee member positions and related matters.This committee recommends candidates for the members of the Audit Committee and is required to act onthe basis of a two-thirds vote of the members present.
Outside Director Recommendation Committee
Members of this committee will be appointed by the Bank’s Board if and only to the extent necessary torecommend and nominate candidates for the Bank’s outside director positions and related matters. Thecommittee meetings are called by the chairman of this committee, who must be an outside director.
Remuneration
The aggregate remuneration and benefits in kind granted by the Bank to its directors and executive officersas of December 31, 2008 was approximately W3,013 million.
Employees
As of March 31, 2009, the Bank had 13,079 employees, including 2,013 contract-based employees, whowere employed on a fixed term basis. The Bank believes that it has a good relationship with its employees.
132
As of March 31, 2009, 8,150 employees were members of the Bank’s labor union. Following the merger ofChohung Bank and former Shinhan Bank, the employees of the two banks maintained separate unions untilOctober 1, 2008, when the two unions merged together. The Bank has not experienced a work stoppage of aserious nature since the acquisition of Chohung Bank in 2003. Every year the union and managementnegotiate and enter into a new collective bargaining agreement that has a one-year term.
Share Ownership
All of the Bank’s share capital is owned by Shinhan Financial Group.
Stock Options
Shinhan Financial Group has granted stock options to certain of the directors and officers of the Bank. Foroptions granted prior to March 21, 2006, Shinhan Financial Group is required to pay in cash the differencebetween the exercise and the market price at the date of exercise. For options issued on or after March 21,2006, Shinhan Financial Group may either issue common stock or pay in cash the difference between theexercise and the market price at the date of exercise.
The following table is the breakdown of outstanding stock options exercisable into shares of ShinhanFinancial Group’s common stock that it has granted to the Bank’s directors and officers, describing thegrant dates, positions held by such directors and officers, exercise period, price and the number of optionsas of March 31, 2009.
Exercise Period
Grant Date From To
ExercisePrice
(In Won)
Number ofGrantedOptions
Number ofoptions
Outstanding
The BankBaek Soon Lee . . . . . . . . . . . . 5/22/2002 5/23/2004 5/22/2008 18,910 1,500 —
(President & CEO) 5/15/2003 5/16/2005 5/15/2009 11,800 2,200 2,2003/25/2004 3/25/2006 3/25/2009 21,595 20,000 —3/30/2005 3/30/2008 3/29/2012 28,006 19,889 19,8893/21/2006 3/21/2009 3/20/2013 38,829 22,683 22,6833/20/2007 3/20/2010 3/19/2014 54,560 11,000 11,0003/19/2008 3/19/2011 3/18/2015 49,053 11,000 9,900
Jeom Ju Gweon . . . . . . . . . . . 5/22/2002 5/23/2004 5/22/2008 18,910 1,500 —(Deputy President) 5/15/2003 5/16/2005 5/15/2009 11,800 1,700 —
3/25/2004 3/25/2006 3/25/2009 21,595 1,800 —3/30/2005 3/30/2008 3/29/2012 28,006 2,500 2,5003/21/2006 3/21/2009 3/20/2013 38,829 6,616 6,6163/20/2007 3/20/2010 3/19/2014 54,560 7,500 7,5003/19/2008 3/19/2011 3/18/2015 49,053 11,000 9,900
Joo Won Park . . . . . . . . . . . . 3/30/2005 3/30/2008 3/29/2012 28,006 2,000 2,000(Deputy President) 3/21/2006 3/21/2009 3/20/2013 38,829 2,100 2,100
3/20/2007 3/20/2010 3/19/2014 54,560 7,000 7,0003/19/2008 3/19/2011 3/18/2015 49,053 10,000 9,000
Chan Park . . . . . . . . . . . . . . . 3/30/2005 3/30/2008 3/29/2012 28,006 1,800 1,800(Deputy President) 3/21/2006 3/21/2009 3/20/2013 38,829 6,616 6,616
3/20/2007 3/20/2010 3/19/2014 54,560 7,000 7,0003/19/2008 3/19/2011 3/18/2015 49,053 8,250 7,425
Jung Won Lee . . . . . . . . . . . . 5/22/2002 5/23/2004 5/22/2008 18,910 2,500 —(Deputy President) 5/15/2003 5/16/2005 5/15/2009 11,800 1,700 1,700
3/25/2004 3/25/2006 3/25/2009 21,595 2,000 —3/30/2005 3/30/2008 3/29/2012 28,006 2,500 2,5003/21/2006 3/21/2009 3/20/2013 38,829 2,500 2,5003/20/2007 3/20/2010 3/19/2014 54,560 3,000 3,0003/19/2008 3/19/2011 3/18/2015 49,053 8,250 7,425
133
Exercise Period
Grant Date From To
ExercisePrice
(In Won)
Number ofGrantedOptions
Number ofoptions
Outstanding
Hyung Jin Kim . . . . . . . . . . . . . . . . . 5/15/2003 5/16/2005 5/15/2009 11,800 1,200 —(Deputy President) 3/25/2004 3/25/2006 3/25/2009 21,595 2,000 —
3/30/2005 3/30/2008 3/29/2012 28,006 1,800 1,8003/21/2006 3/21/2009 3/20/2013 38,829 2,500 2,5003/20/2007 3/20/2010 3/19/2014 54,560 3,000 3,0003/19/2008 3/19/2011 3/18/2015 49,053 7,500 6,750
Young Hoon Lee . . . . . . . . . . . . . . . 5/22/2002 5/23/2004 5/22/2008 18,910 1,500 —(Deputy President) 5/15/2003 5/16/2005 5/15/2009 11,800 1,200 —
3/25/2004 3/25/2006 3/25/2009 21,595 2,000 —3/30/2005 3/30/2008 3/29/2012 28,006 2,500 2,5003/21/2006 3/21/2009 3/20/2013 38,829 6,616 6,6163/20/2007 3/20/2010 3/19/2014 54,560 3,000 3,0003/19/2008 3/19/2011 3/18/2015 49,053 7,500 6,750
Sung Rack Lee . . . . . . . . . . . . . . . . . 5/22/2002 5/23/2004 5/22/2008 18,910 1,000 —(Deputy President) 5/15/2003 5/16/2005 5/15/2009 11,800 1,200 1,200
3/25/2004 3/25/2006 3/25/2009 21,595 2,000 —3/30/2005 3/30/2008 3/29/2012 28,006 2,500 2,5003/21/2006 3/21/2009 3/20/2013 38,829 2,500 2,5003/20/2007 3/20/2010 3/19/2014 54,560 3,000 3,000
Dong Dae Lee . . . . . . . . . . . . . . . . . 5/22/2002 5/23/2004 5/22/2008 18,910 1,500 —(Executive Vice President) 5/15/2003 5/16/2005 5/15/2009 11,800 1,700 —
3/25/2004 3/25/2006 3/25/2009 21,595 2,500 —3/30/2005 3/30/2008 3/29/2012 28,006 2,500 2,5003/21/2006 3/21/2009 3/20/2013 38,829 2,500 2,5003/20/2007 3/20/2010 3/19/2014 54,560 3,000 3,0003/19/2008 3/19/2011 3/18/2015 49,053 3,500 3,500
Se Il Oh . . . . . . . . . . . . . . . . . . . . . . . 5/22/2002 5/23/2004 5/22/2008 18,910 1,500 —(Executive Vice President) 5/15/2003 5/16/2005 5/15/2009 11,800 2,200 —
3/25/2004 3/25/2006 3/25/2009 21,595 1,800 —3/30/2005 3/30/2008 3/29/2012 28,006 1,800 1,8003/21/2006 3/21/2009 3/20/2013 38,829 2,100 2,1003/19/2008 3/19/2011 3/18/2015 49,053 3,500 3,500
Yong Byung Cho . . . . . . . . . . . . . . . 5/22/2002 5/23/2004 5/22/2008 18,910 2,500 —(Executive Vice President) 5/15/2003 5/16/2005 5/15/2009 11,800 1,700 —
3/25/2004 3/25/2006 3/25/2009 21,595 1,800 —3/30/2005 3/30/2008 3/29/2012 28,006 1,800 1,8003/21/2006 3/21/2009 3/20/2013 38,829 2,500 2,5003/20/2007 3/20/2010 3/19/2014 54,560 3,000 3,000
Jong Bok Moon . . . . . . . . . . . . . . . . 3/30/2005 3/30/2008 3/29/2012 28,006 1,500 1,500(Executive Vice President) 3/21/2006 3/21/2009 3/20/2013 38,829 1,800 1,800
3/20/2007 3/20/2010 3/19/2014 54,560 3,000 3,000
Total . . . . . . . . . . . . . . . . . . . . . 292,320 226,870
134
CERTAIN RELATIONSHIPS AND RELATED PARTY TRANSACTIONS
As of March 31, 2009, there were no loans outstanding made by the Bank to the members of the Bank’sboard of directors or the Bank’s executive officers. There are no guarantees provided by the Bank and itsconsolidated subsidiaries for the benefit of any of the Bank’s directors or executive officers. None of thedirectors or executive officers has or has had any interest in any transactions effected by the Bank which areor were unusual in their nature or conditional or significant to the business of the Bank and which wereeffected during the current or immediately preceding year or were effected during an earlier year andremain in any respect outstanding or unperformed.
Following the merger of Chohung Bank and former Shinhan Bank in April 2006, the Bank granted to itsemployees 1,708,050 out of 2,420,955 treasury shares of Shinhan Financial Group’s common stock held bythe Bank in accordance with the Financial Holding Company Act of Korea, which requires that the treasuryshares must be disposed of within six months of acquisition. The remaining 712,905 ungranted treasuryshares of Shinhan Financial Group’s common stock held by the Bank were sold in the market in June 2006.
Directors, executive officers and certain employees of the Bank, as is the case with certain othersubsidiaries of Shinhan Financial Group, receive from time to time shares of Shinhan Financial Group’scommon stock and/or stock options exercisable into such shares, as part of their compensation. See“Management and Employees — Share Ownership” and “Management and Employees — Stock Options”.
As a subsidiary of Shinhan Financial Group, the Bank engages from time to time in ordinary course ofbusiness activities with other subsidiaries of Shinhan Financial Group, including cross-selling activities.See Note 23 of the notes to the Bank’s unaudited non-consolidated financial statements included in thisoffering circular.
135
SHINHAN FINANCIAL GROUP
Introduction
Incorporated on September 1, 2001, Shinhan Financial Group is the first private financial holding companyto be established in Korea. Since inception, Shinhan Financial Group has developed and introduced a widerange of financial products and services in Korea and aimed to deliver comprehensive financial solutions toclients through a convenient one-portal network. According to reports by the Financial Supervisory Service,Shinhan Financial Group is one of the three largest financial services providers in Korea as measured bytotal assets as of December 31, 2008 and operates the third largest banking business (as measured by totalassets as of December 31, 2008) and the largest credit card business (as measured by the total creditpurchase volume as of December 31, 2008) in Korea.
Shinhan Financial Group has experienced substantial growth through several mergers and acquisitions.Most notably, Shinhan Financial Group’s acquisition of Chohung Bank in 2003 has enabled ShinhanFinancial Group to have one of the three largest banking operations in Korea and enhanced its bankingclient base by adding Chohung Bank’s large corporate clients to its traditional client base of small- andmedium-sized enterprises. In addition, Shinhan Financial Group’s acquisition in March 2007 of LG Card,the then and now largest credit card company in Korea, has significantly expanded its non-banking businesscapacity and helped it to achieve a balanced business portfolio.
Shinhan Financial Group currently has 11 direct subsidiaries and 17 indirect subsidiaries (not including anyspecial purpose entities) offering a wide range of financial products and services, including commercialbanking, corporate banking, private banking, credit card, asset management, brokerage and insuranceservices. Shinhan Financial Group believes that such breadth of services will help it to meet the diversifiedneeds of the Bank’s present and potential clients. Shinhan Financial Group currently serves approximately14.8 million active customers, which Shinhan Financial Group believes is the largest customer base inKorea for financial institutions, through approximately 17,200 employees at more than 1,430 networkbranches group-wide. While substantially all of Shinhan Financial Group’s revenues have been historicallyderived from Korea, it aims to serve the needs of its clients through a global network of its 42 offices in theUnited States, Canada, the United Kingdom, Japan, the People’s Republic of China, Germany, India, HongKong, Vietnam, Cambodia, Kazakhstan and Singapore.
History and Organization
On September 1, 2001, Shinhan Financial Group was formed as a financial holding company under theFinancial Holding Companies Act, as a result of acquiring all of the issued shares of the following fourentities from their former shareholders in exchange for shares of Shinhan Financial Group’s common stock:(i) the Bank, a nationwide commercial bank listed on the Korea Stock Exchange, (ii) Shinhan SecuritiesCo., Ltd., a securities brokerage company listed on the Korea Stock Exchange, (iii) Shinhan Capital Co.,Ltd., a leasing company listed on the Korea Exchange Korean Securities Dealers Automated Quotations(“KRX KOSDAQ”), and (iv) Shinhan Investment Trust Management Co., Ltd., a privately held investmenttrust management company. On September 10, 2001, the common stock of Shinhan Financial Group’sholding company was listed on what is currently the KRX KOSPI Market.
136
Since its inception, Shinhan Financial Group has expanded its operations, in large part, through strategicacquisitions or formation of joint ventures. Shinhan Financial Group’s key acquisitions and joint ventureformations are described as below:
Date of Acquisition Entity Principal Activities Method of Establishment
April 2002 Jeju Bank Regional banking Acquisition from KoreaDeposit InsuranceCorporation
July 2002 Goodmorning ShinhanSecurities Co., Ltd.
Securities and investment Acquisition from theSsangYong Group
August 2002 Shinhan BNP ParibasInvestment TrustManagement Co., Ltd.(1)
Investment advisory 50:50 joint venture withBNP Paribas
August 2003 Chohung Bank(2) Commercial banking Acquisition fromcreditors
December 2005 Shinhan Life Insurance Life insurance services Acquisition fromshareholders
March 2007 LG Card(3) Credit card services Acquisition fromcreditors
Notes:
(1) In August 2002, Shinhan Financial Group signed a joint venture agreement with BNP Paribas Asset Management, the assetmanagement arm of BNP Paribas, in respect of Shinhan Investment Trust Management. In October 2002, Shinhan FinancialGroup sold to BNP Paribas Asset Management 3,999,999 shares of Shinhan Investment Trust Management, representing 50%less one share, which was subsequently renamed Shinhan BNP Paribas Investment Trust Management Co., Ltd. (“Shinhan BNPParibas Investment Trust Management”). In January 2009, SH Asset Management Co., Ltd. (“SH Asset Management”) andShinhan BNP Paribas Investment Trust Management merged to form Shinhan BNP Paribas Asset Management Co., Ltd.(“Shinhan BNP Paribas Asset Management”).
(2) In August 2003, Shinhan Financial Group acquired 80.04% of common shares of Chohung Bank, a nationwide commercial bankin Korea. Shinhan Financial Group subsequently acquired the remaining interest in Chohung Bank through a series oftransactions and delisted Chohung Bank from the Korea Exchange in July 2004. Shinhan Financial Group merged Shinhan Bankand Chohung Bank in April 2006, with Chohung Bank becoming the legal surviving entity. The newly merged bank thenchanged its name to “Shinhan Bank”.
(3) In June 2002, the credit card division of the Bank was split off and established as Shinhan Financial Group’s wholly-ownedsubsidiary, Shinhan Card Co., Ltd. In April 2006, concurrently with the merger of Shinhan Bank and Chohung Bank, ShinhanFinancial Group also split off Chohung Bank’s credit card business and merged it into the former Shinhan Card. In March 2007,Shinhan Financial Group acquired from the creditor committee and other shareholders of LG Card the controlling equity interestin LG Card following a public tender offer. After Shinhan Financial Group’s further acquisition of shares in July 2007 followinga second public tender offer and a share swap with the Shinhan Financial Group’s shares in September 2007, LG Card becameShinhan Financial Group’s wholly-owned subsidiary. On October 1, 2007, LG Card assumed all of the assets and liabilities offormer Shinhan Card, and changed its name to Shinhan Card. On the same date, former Shinhan Card changed its name to SHCManagement Co., Ltd. and currently survives under that name with no significant assets and liabilities.
Below are some of the recent developments relating to Shinhan Financial Group’s organizational structure.
Š On June 2, 2008, Shinhan Card established Shinhan KTF Mobile Card Co., Ltd. as a joint venture withKTF, a mobile telephone company in Korea, to promote joint marketing between its credit cardoperations and KTF’s mobile telephone services. The joint venture’s capital stock as of December 31,2008 amounted to W2 billion, of which Shinhan Card owned 50%.
Š On May 29, 2008, the Bank acquired a 55.9% equity interest in AITAS Co., Ltd. for W36 billion. Thisentity provides administration services to mutual funds and other trust investment companies. Othercommercial banks and employees of AITAS own the remaining equity. The Bank currently owns89.58% equity interest in AITAS.
137
Š In January 2009, SH Asset Management and Shinhan BNP Paribas Investment Trust Managementmerged to form Shinhan BNP Paribas Asset Management.
Š In June 2009, Shinhan Financial Group sold 3,290,002 common shares, or approximately 35%, ofSH&C Life Insurance Co., Ltd., a 50:50 joint venture with BNP Paribas Assurance (formerly knownas Cardif S.A.), to BNP Paribas Assurance. Following this transaction, BNP Paribas Assurance ownsapproximately 85% equity interest in SH&C Life Insurance Co., Ltd. In consideration of ShinhanFinancial Group’s extensive business partnership with BNP Paribas and the Bank’s role in selling thebancassurance products, Shinhan Financial Group transferred 15% equity interest in SH&C LifeInsurance to the Bank. Following this transaction, SH&C is no longer Shinhan Financial Group’ssubsidiary.
All of Shinhan Financial Group’s subsidiaries are incorporated in Korea, except for the following:
Š Shinhan Asia Limited (incorporated in Hong Kong);
Š Shinhan Bank America (incorporated in the United States);
Š Shinhan Bank Canada (incorporated in the Canada);
Š Shinhan Bank (China) Limited (incorporated in the People’s Republic of China);
Š Shinhan Bank Europe GmbH (incorporated in Germany);
Š Shinhan Bank Kazakhstan Limited (incorporated in Kazakhstan);
Š Shinhan Khmer Bank Limited (incorporated in Cambodia);
Š Shinhan Vina Bank (incorporated in Vietnam);
Š Shinhan Finance Ltd., Hong Kong (incorporated in Hong Kong);
Š Goodmorning Shinhan Securities Europe Ltd. (incorporated in United Kingdom);
Š Goodmorning Shinhan Securities USA, Inc. (incorporated in the United States); and
Š Goodmorning Shinhan Securities Asia Limited (incorporated in Hong Kong).
138
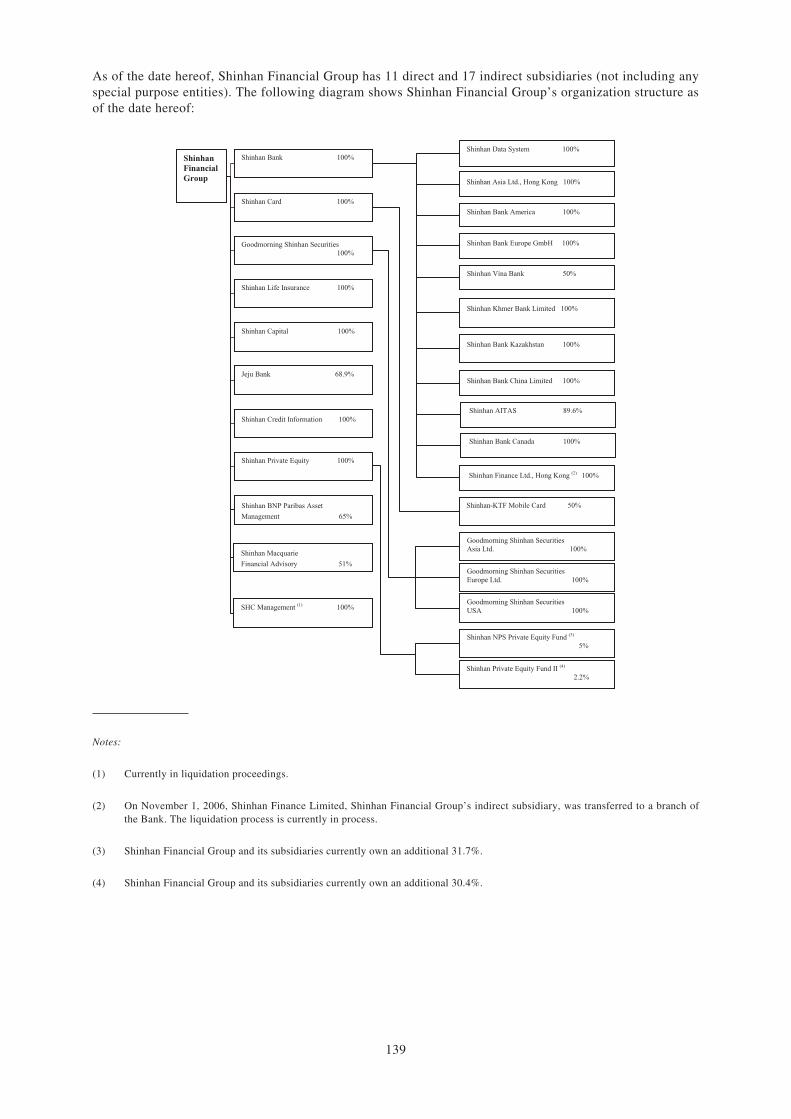
As of the date hereof, Shinhan Financial Group has 11 direct and 17 indirect subsidiaries (not including anyspecial purpose entities). The following diagram shows Shinhan Financial Group’s organization structure asof the date hereof:
Shinhan Data System 100% Shinhan Financial Group
Shinhan Bank 100%
Shinhan Asia Ltd., Hong Kong 100%
Shinhan Card 100%
SHC Management (1) 100%
Goodmorning Shinhan Securities 100%
Shinhan Life Insurance 100%
Shinhan Capital 100%
Jeju Bank 68.9%
Shinhan Credit Information 100%
Shinhan Private Equity 100%
Shinhan BNP Paribas Asset
Management 65%
Shinhan Macquarie
Financial Advisory 51%
Shinhan Bank America 100%
Shinhan Bank Europe GmbH 100%
Shinhan Vina Bank 50%
Shinhan Khmer Bank Limited 100%
Shinhan Bank Kazakhstan 100%
Shinhan Bank China Limited 100%
Goodmorning Shinhan Securities Europe Ltd. 100%
Goodmorning Shinhan Securities USA 100%
Shinhan NPS Private Equity Fund (3)
5%
Goodmorning Shinhan Securities Asia Ltd. 100%
Shinhan AITAS 89.6%
Shinhan-KTF Mobile Card 50%
Shinhan Finance Ltd., Hong Kong (2) 100%
Shinhan Private Equity Fund II (4)
2.2%
Shinhan Bank Canada 100%
Notes:
(1) Currently in liquidation proceedings.
(2) On November 1, 2006, Shinhan Finance Limited, Shinhan Financial Group’s indirect subsidiary, was transferred to a branch ofthe Bank. The liquidation process is currently in process.
(3) Shinhan Financial Group and its subsidiaries currently own an additional 31.7%.
(4) Shinhan Financial Group and its subsidiaries currently own an additional 30.4%.
139
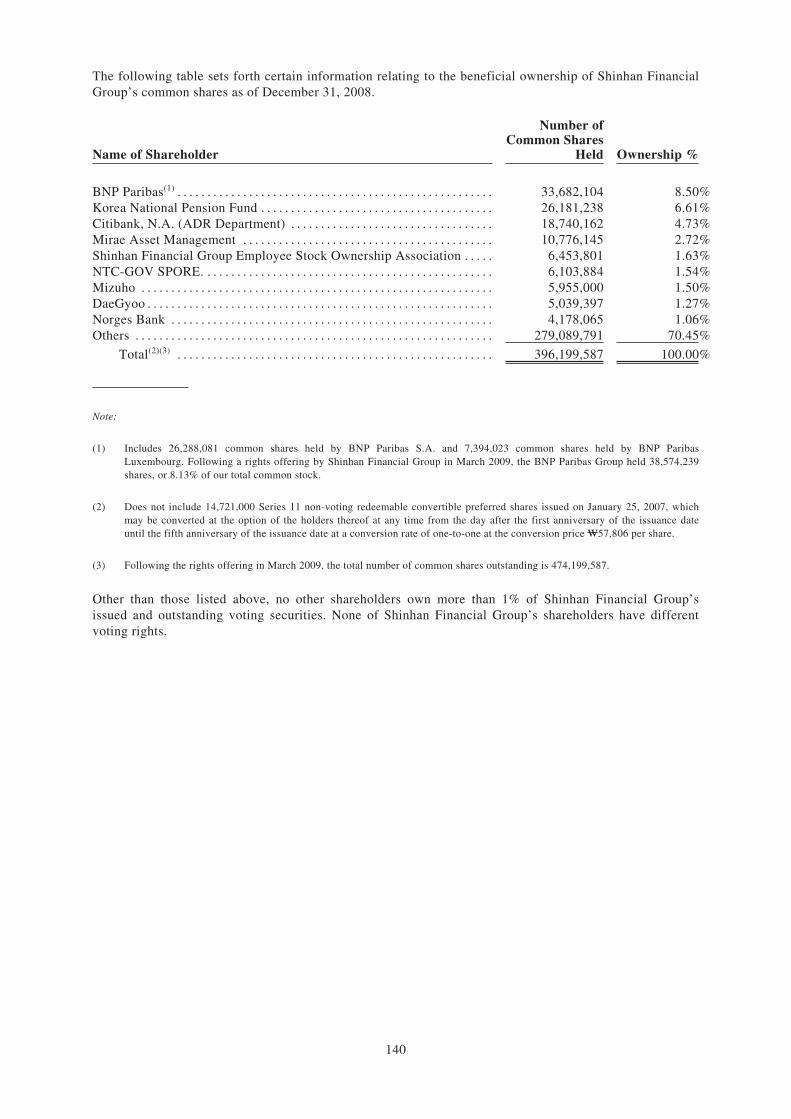
The following table sets forth certain information relating to the beneficial ownership of Shinhan FinancialGroup’s common shares as of December 31, 2008.
Name of Shareholder
Number ofCommon Shares
Held Ownership %
BNP Paribas(1) . . . . . . . . . . . . . . . . . . . . . . . . . . . . . . . . . . . . . . . . . . . . . . . . . . . . . 33,682,104 8.50%Korea National Pension Fund . . . . . . . . . . . . . . . . . . . . . . . . . . . . . . . . . . . . . . . 26,181,238 6.61%Citibank, N.A. (ADR Department) . . . . . . . . . . . . . . . . . . . . . . . . . . . . . . . . . . 18,740,162 4.73%Mirae Asset Management . . . . . . . . . . . . . . . . . . . . . . . . . . . . . . . . . . . . . . . . . . 10,776,145 2.72%Shinhan Financial Group Employee Stock Ownership Association . . . . . 6,453,801 1.63%NTC-GOV SPORE. . . . . . . . . . . . . . . . . . . . . . . . . . . . . . . . . . . . . . . . . . . . . . . . . 6,103,884 1.54%Mizuho . . . . . . . . . . . . . . . . . . . . . . . . . . . . . . . . . . . . . . . . . . . . . . . . . . . . . . . . . . . 5,955,000 1.50%DaeGyoo . . . . . . . . . . . . . . . . . . . . . . . . . . . . . . . . . . . . . . . . . . . . . . . . . . . . . . . . . . 5,039,397 1.27%Norges Bank . . . . . . . . . . . . . . . . . . . . . . . . . . . . . . . . . . . . . . . . . . . . . . . . . . . . . . 4,178,065 1.06%Others . . . . . . . . . . . . . . . . . . . . . . . . . . . . . . . . . . . . . . . . . . . . . . . . . . . . . . . . . . . . 279,089,791 70.45%
Total(2)(3) . . . . . . . . . . . . . . . . . . . . . . . . . . . . . . . . . . . . . . . . . . . . . . . . . . . . . 396,199,587 100.00%
Note:
(1) Includes 26,288,081 common shares held by BNP Paribas S.A. and 7,394,023 common shares held by BNP ParibasLuxembourg. Following a rights offering by Shinhan Financial Group in March 2009, the BNP Paribas Group held 38,574,239shares, or 8.13% of our total common stock.
(2) Does not include 14,721,000 Series 11 non-voting redeemable convertible preferred shares issued on January 25, 2007, whichmay be converted at the option of the holders thereof at any time from the day after the first anniversary of the issuance dateuntil the fifth anniversary of the issuance date at a conversion rate of one-to-one at the conversion price W57,806 per share.
(3) Following the rights offering in March 2009, the total number of common shares outstanding is 474,199,587.
Other than those listed above, no other shareholders own more than 1% of Shinhan Financial Group’sissued and outstanding voting securities. None of Shinhan Financial Group’s shareholders have differentvoting rights.
140
SUPERVISION AND REGULATION
Principal Regulations Applicable to Banks
General
The banking system in Korea is governed by the Banking Act of 1950, as amended (the “Banking Act”) andthe Bank of Korea Act of 1950, as amended (the “Bank of Korea Act”). In addition, Korean banks aresubject to the regulations and supervision of the Bank of Korea, the Bank of Korea’s Monetary PolicyCommittee, the Financial Services Commission and its executive body, the Financial Supervisory Service.
The Bank of Korea, established in June 1950 under the Bank of Korea Act, performs the customaryfunctions of a central bank. It seeks to contribute to the sound development of the national economy byprice stabilization through establishing and implementing efficient monetary and credit policies. The Bankof Korea acts under instructions of the Monetary Policy Committee, the supreme policy-making body of theBank of Korea.
Under the Bank of Korea Act, the Monetary Policy Committee’s primary responsibilities are to formulatemonetary and credit policies and to determine the operations, management and administration of the Bankof Korea. The Financial Services Commission, established on April 1, 1998, exerts direct control overcommercial banks pursuant to the Banking Act, including establishing guidelines on capital adequacy ofcommercial banks, and prepares regulations relating to supervision of banks. Furthermore, pursuant to theAmendment to the Government Organization Act and the Banking Act on May 24, 1999, the FinancialServices Commission, instead of the Ministry of Strategy and Finance, now regulates market entry into thebanking business.
The Financial Supervisory Service is subject to the instructions and directives of the Financial ServicesCommission and carries out supervision and examination of commercial banks. In particular, the FinancialSupervisory Service sets requirements both for prudent control of liquidity and for capital adequacy andestablishes reporting requirements within the authority delegated to it under the Financial ServicesCommission regulations, pursuant to which banks are required to submit annual reports on financialperformance and shareholdings, regular reports on management strategy and non-performing loans,including write-offs, and management of problem companies and plans for the settlement of bad loans.
Under the Banking Act, permission to commence a commercial banking business or a long-term financingbusiness must be obtained from the Financial Services Commission. Commercial banking business isdefined as the lending of funds acquired predominantly from the acceptance of deposits for a period notexceeding one year or subject to the limitation established by the Financial Services Commission, for aperiod between one year and three years. Long-term financing business is defined as the lending, for periodsin excess of one year, of funds acquired predominantly from paid-in capital, reserves or other retainedearnings, the acceptance of deposits with maturities of at least one year, or the issuance of bonds or othersecurities. A bank wishing to enter any business other than commercial banking and long-term financingbusinesses, such as the trust business, must obtain permission from the Financial Services Commission.Permission to merge with any other banking institution, to liquidate, to close a banking business or totransfer all or a part of a business must also be obtained from the Financial Services Commission.
If the Government deems a bank’s financial condition to be unsound or if a bank fails to meet the applicablecapital adequacy ratio set forth under Korean law, the government may order:
Š capital increases or reductions;
Š stock cancellations or consolidations;
Š transfers of a part or all of business;
Š sale of assets;
141
Š closures of branch offices;
Š mergers or becoming a subsidiary of a financial holding company under the Financial HoldingCompanies Act;
Š acquisitions of a bank by a third party;
Š suspensions of a part or all of business operations; or
Š assignments of contractual rights and obligations relating to financial transactions.
Capital Adequacy
The Banking Act requires nationwide banks to maintain a minimum paid-in capital of W100 billion andregional banks to maintain a minimum paid-in capital of W25 billion.
In addition to minimum capital requirements, all banks including foreign bank branches in Korea arerequired to maintain a prescribed solvency position. A bank must also set aside as its legal reserve anamount equal to at least 10% of its net profits after tax each time it pays dividends on net profits earneduntil such time when the reserve equals the amount of its total paid-in capital.
Under the Banking Act, the capital of a bank is divided into two categories: Tier I and Tier II capital. Tier Icapital (core capital) consists of stockholders’ equity, capital surplus, retained earnings, unissued stockdividends and hybrid Tier I capital instruments. Tier II capital (supplementary capital) consists ofrevaluation reserves, gain on valuation of investment in securities, allowance for bad debts set aside forloans classified as “normal” or “precautionary” (up to certain limits), perpetual subordinated (up to certainlimits) debt, cumulative preferred shares, redeemable preferred shares (with a right to redeem after the fifthanniversary of the date of issuance) and certain other subordinated debt. The regulation under the BankingAct currently allows 70% of the increased after-tax profit arising out of the revaluation of tangible assets tobe included in Tier II capital (supplementary capital).
All banks must meet standards regarding minimum ratios of Tier I and Tier II capital (less any capitaldeductions) to risk-weighted assets, determined in accordance with the Financial Services Commissionrequirements that have been formulated based on the Bank for International Settlement (“BIS”) Standards.These standards were adopted and became effective in 1996 and were amended effective January 1, 2008upon the implementation by Financial Services Commission of Basel II. Under these regulations, alldomestic banks and foreign bank branches were required to meet the minimum ratio of Tier I and Tier IIcapital (less any capital deductions) to risk-weighted assets of 8%.
The Financial Services Commission amended the Regulation on the Supervision of the Banking Business inNovember 2002 to include a more conservative risk-weighting system on certain newly extended mortgageand home equity loans, requiring Korean banks to apply the risk-weighted ratio of 50%, 60%, or 70% inrespect of home mortgage loans depending on the borrowers’ debt ratios and whether the home mortgageloans are overdue. On June 28, 2007, the Financial Supervisory Commission further amended theEnforcement Detailed Rules on the Supervision of the Banking Business, and, as a result, Korean bankshave been applying the following risk-weight ratios in respect of their home mortgage loans starting from1st January, 2008:
(1) for those banks adopting a standardized approach for calculating credit risk capital requirements,the risk-weight ratio of 35%; and
(2) for those banks adopting an internal ratings-based approach for calculating credit risk capitalrequirements, a risk-weight ratio calculated with reference to the probability of default, lossgiven default and exposure at default, each as defined in the Enforcement Detailed Rules on theSupervision of the Banking Business.
In Korea, Basel II, the new convention entered into by the Basel committee in June 2004 for the purpose ofimproving risk management and increasing capital adequacy of banks, was implemented in January 2008.
142
Pursuant to Basel II, operational risk, such as inadequate procedure, loss risk by employees, internal system,occurrence of unexpected event, as well as credit risk and market risk, should be taken into account incalculating the risk-weighted assets. However, as the current capital adequacy ratio of 8% for banks wouldbe maintained, it would become more onerous for banks to satisfy the minimum capital requirements. UnderBasel II, the capital requirements for credit risk can be calculated by the internal rating based (IRB)approach or the standardized approach.
Under the standardized approach, home mortgage loans fully secured by the residential property that is orwill be occupied by the borrower are risk-weighted at 35%.
Under the Regulation on the Supervision of the Banking Business, banks generally must maintainallowances for credit losses in respect of their outstanding loans and other credits (including confirmedguarantees and acceptances and trust account loans) in an aggregate amount covering not less than:
Š 0.85% of normal credits (or 0.9% in the case of normal credits comprising loans to certain industriesincluding construction, retail and wholesale sales, accommodations, restaurant, real estate and lease,1.0% in the case of normal credits comprising loans to individuals and households and 1.5% in thecase of normal credits comprising outstanding credit card receivables and card loans);
Š 7% of precautionary credits (or 10% in the case of precautionary credits comprising loans toindividuals and households, and 15% in the case of precautionary credits comprising outstandingcredit card receivables and card loans);
Š 20% of substandard credits;
Š 50% of doubtful credits (or 55% in the case of doubtful credits comprising loans to individuals andhouseholds, and 60% in the case of doubtful credits comprising outstanding credit card receivablesand card loans); and
Š 100% of estimated loss credits.
Furthermore, under an amendment in 2006 to the Regulation on the Supervision of the Banking Business,banks must maintain allowances for credit losses in respect of their confirmed guarantees (includingconfirmed acceptances) and outstanding non-used credit lines as of the settlement date in an aggregateamount calculated at the same rates applicable to normal, precautionary, substandard and doubtful creditscomprising their outstanding loans and other credits as set forth above.
Liquidity
All banks are required to match the maturities of their assets and liabilities in accordance with the BankingAct in order to ensure adequate liquidity. Banks may not invest in excess of an amount exceeding 60% oftheir Tier I and Tier II capital (less any capital deductions) in stocks and other securities with a remainingperiod to maturity of over three years. However, this restriction does not apply to government bonds or toMonetary Stabilization Bonds issued by the Bank of Korea.
The Financial Services Commission requires each Korean bank to maintain a Won liquidity ratio (definedas Won assets due within one month, including marketable securities, divided by Won liabilities due withinone month) of not less than 100% and to make monthly reports to the Financial Supervisory Service. TheFinancial Services Commission also requires each Korean bank to (1) maintain a foreign-currency liquidityratio due within three months (defined as foreign-currency liquid assets due within three months divided byforeign-currency liabilities due within three months) of not less than 85%, (2) maintain a ratio of foreign-currency liquid assets due within seven days (defined as foreign-currency liquid assets due within sevendays less foreign-currency liabilities due within seven days, divided by total foreign-currency assets) of notless than 0% and (3) maintain a ratio of foreign-currency liquid assets due within a month (defined asforeign-currency liquid assets due within a month less foreign currency liabilities due within a month,divided by total foreign-currency assets) of not less than negative 10%. The Financial Services Commissionalso requires each Korean bank to submit monthly reports with respect to maintenance of these ratios.
143
The Monetary Policy Committee is authorized to fix and alter minimum reserve requirements that banksmust maintain against their deposit liabilities. The current minimum reserve ratio is 7.0% of averagebalances for Won currency demand deposits outstanding, 0.0% of average balances for Won currencyemployee asset establishment savings deposits, employee long-term savings deposits, employee housepurchase savings deposits, long-term house purchase savings deposits, household long-term savingsdeposits and employee preferential savings deposits outstanding and 2.0% of average balances for Woncurrency time and savings deposits, mutual installments, housing installments and certificates of depositoutstanding. For foreign currency deposit liabilities, a 2.0% minimum reserve ratio is applied to savingsdeposits outstanding and a 7.0% minimum reserve ratio is applied to demand deposits, while a 1.0%minimum reserve ratio is applied for offshore accounts, immigrant accounts and resident accounts openedby foreign exchange banks.
Financial Exposure to Any Single Customer and Major Shareholders
Under the Banking Act, the sum of material credit exposures by a bank, that is, the total sum of its credits tosingle individuals, legal entities or business groups that exceed 10% of the sum of Tier I and Tier II capital(less any capital deductions), must not exceed five times the sum of Tier I and Tier II capital (less anycapital deductions), subject to certain exceptions. Beginning on January 1, 2000, subject to certainexceptions, no bank is permitted to extend credit (including loans, guarantees, purchases of securities (onlyin the nature of a credit) and such other transactions which directly or indirectly create credit risk) in excessof 20% of the sum of Tier I and Tier II capital (less any capital deductions) to a single individual or legalentity, and no bank may grant credit in excess of 25% of the sum of Tier I and Tier II capital (less anycapital deductions) to a single group of companies that belong to the same conglomerate as defined in theMonopoly Regulations and Fair Trade Act.
Pursuant to an amendment to the Banking Act, which became effective on July 28, 2002, the restrictions onextending credits to a major shareholder have been amended. The definition of a “major shareholder” is asfollows:
Š a shareholder holding (together with persons who have a special relationship with such shareholder asdefined in the Presidential Decree of the Banking Act) in excess of 10% (or in the case of regionalbanks, 15%) in the aggregate of the bank’s total issued and outstanding voting shares; or
Š a shareholder holding (together with persons who have a special relationship with such shareholder asdefined in the Presidential Decree of the Banking Act) more than 4% in the aggregate of the bank’s(excluding regional banks) total issued and outstanding voting shares, where such shareholder is thelargest shareholder or is able to actually control the major business affairs of the bank, for example,through appointment and dismissal of the chief executive officer or of the majority of the executives.
According to such amendment, banks are prohibited from extending credits in an amount greater than thelesser of (1) 25% of the sum of such bank’s Tier I and Tier II capital (less any capital deductions) or (2) therelevant major shareholder’s shareholding ratio multiplied by the sum of the bank’s Tier I and Tier IIcapital (less any capital deductions) to a major shareholder (together with persons who have specialrelationship with such major shareholder as defined in the Presidential Decree of the Banking Act). Also, nobank is allowed to grant credit to its major shareholders in the aggregate in excess of 25% of its Tier I andTier II capital (less any capital deductions). However, the foregoing restrictions do not apply to the KoreaDeposit Insurance Corporation if it becomes a major shareholder of a bank in the process of restructuring ofsuch bank.
Recently, there has been a rapid increase in the use of credit support agreements between banks and specialpurpose companies that have been established for asset-backed securitization. When managing the creditrisk of banks, among the methods for providing credit support by banks, a loan agreement, a purchaseagreement for asset-backed commercial papers, purchase of subordinate beneficiary certificates, andassumption of liability by providing warranty against default under asset-backed securitization are examplesof creating financial exposure to banks.
144
Interest Rates
Korean banks remain dependent on the acceptance of deposits as their primary source of funds. Currently,there are no legal controls on interest rates on bank loans in Korea except for the cap of 49% on the interestrate with respect to loans extended to individuals and certain small-sized enterprises under the Act onLending Business. Historically, interest rates on deposits and lending rates were regulated by the MonetaryBoard of the Bank of Korea. Under the government’s Financial Reform Plan issued in May 1993, controlson deposit interest rates in Korea have been gradually reduced. In February 2004, the Government removedrestrictions on all interest rates, except for the prohibition on interest payments on current account deposits.Deregulation of interest rates on deposits has increased competition for deposits based on interest ratesoffered and therefore may increase the Bank’s banking operation’s interest expense.
Lending to Small- and Medium-Sized Enterprises
In order to obtain funding from the Bank of Korea at concessionary rates for their small- and medium-sizedenterprise loans, banks are required to extend to small- and medium-sized enterprises a certain minimumpercentage of any monthly increase in their Won currency lending. Currently, this minimum percentage is45% in the case of national banks and 60% in the case of regional banks. If a bank does not comply with theforegoing, all or a portion of the Bank of Korea funds provided to such bank in support of loans to small-and medium-sized enterprises may have to be prepaid to the Bank of Korea or the credit limit from the Bankof Korea for such bank may be decreased.
Disclosure of Management Performance
For the purpose of enforcing mandatory disclosure of management performance so that the general public,especially depositors and stockholders, will be in a better position to monitor banks, the Financial ServicesCommission requires commercial banks to disclose certain matters as follows:
Š loans bearing no profit made to a single business group in an amount exceeding 10% of the sum of thebank’s Tier I and Tier II capital (less any capital deductions) as of the end of the previous month(where the loan exposure to such borrower is calculated as the sum of substandard credits, doubtfulcredits and estimated loss credits) except where the loan exposure to a single business group is notmore than W4 billion;
Š occurrence of any financial event involving embezzlement, malfeasance or misappropriation of fundsthe amount of which exceeds 1% of the sum of the bank’s Tier I and Tier II capital (less any capitaldeductions), unless the bank has lost or expects to lose not more than W1 billion as a result thereof, orthe Governor of the Financial Supervisory Service has made a public announcement regarding such anoccurrence;
Š any loss due to court judgments or similar decisions in civil proceedings in an amount exceeding 1%of the sum of the bank’s Tier I and Tier II capital (less any capital deductions) as of the end of theprevious month except where the loss is not more than W1 billion;
Š any event which can cause a material change in financial status, such as resolutions for a capitalincrease or reduction, issuance of convertible bonds, bonds with warrants, exchangeable bonds, ordepositary receipts or cancellation of shares with profit;
Š any event which can cause a material change in a bank’s management, such as knowledge of aproposal or confirmation of a litigation that can have a material effect on the management of the banksuch as litigation regarding the effectiveness of securities issuance or amendments of rightsthereunder, appointment or dismissal of an officer, or a change in bank’s largest shareholder, majorshareholder, affiliate company, or a resolution for change of business objective;
Š any event which can cause a material change in the bank’s property, such as a natural disaster whichcauses damages in an amount exceeding 5% (or 2.5% in the case of a “Large Listed Company”, whichrefers to a company that has total assets as of the end of the most recent fiscal year of W2 trillion ormore) or more of its total assets as of the end of the most recent fiscal year;
145
Š any event which can cause a material change in the bank’s investment, such as investment in othercompanies in an amount exceeding 5% (or 2.5% in the case of a Large Listed Company) or more ofthe bank’s Tier I and Tier II capital;
Š any event which can cause a material change in the bank’s profit or loss, such as special profit orspecial loss of 10% (or 5% in the case of a Large Listed Company) or more of the bank’s Tier I andTier II capital; and
Š any other events which can have material effects on the bank’s operation, including, among others,payment of cash dividends, acquisition or disposal of treasury shares, or distribution of stock options.
Restrictions on Lending
According to the Banking Act, commercial banks are prohibited from making any of the followingcategories of loans:
Š loans made for the purpose of speculation in commodities or securities;
Š loans made directly or indirectly on the pledge of a bank’s own shares, or on the pledge of shares inexcess of 20% of the issued and outstanding shares of any other corporation (subject to certainexceptions with respect to financing for infrastructure projects);
Š loans made directly or indirectly to enable a natural or legal person to buy the bank’s own shares;
Š loans made directly or indirectly to finance political campaigns and other related activities;
Š loans made to any of the bank’s officers or employees other than de minimis loans of up to (1) W20million in the case of a general loan, (2) W50 million in the case of a general loan plus a housing loan,or (3) W60 million in the aggregate for general loans, housing loans and loans to pay damages arisingfrom wrongful acts of employees in financial transactions;
Š credit (including loans) secured by a pledge of shares of a subsidiary corporation of the bank or toenable a natural or juridical person to buy shares of a subsidiary corporation of the bank; and
Š loans to any officers or employees of a subsidiary corporation of the bank other than general loans ofup to W20 million or general and housing loans of up to W50 million in the aggregate.
Regulations Relating to Retail Household Loans
The Financial Services Committee has in recent years implemented a number of changes to the mechanismsby which a bank evaluates and reports its retail household loan balances and has proposed implementingfurther changes. As a result of the rapid increase in retail household loans and related credit risks, theFinancial Services Committee and the Financial Supervisory Service increased the minimum provisioningrequirements for retail household loans. These requirements, set forth in the following table, becameeffective on December 31, 2006.
Asset Quality Classification Provisioning Ratio on Retail Household Loans
Before Current
Normal . . . . . . . . . . . . . . . . . . . . . . . . . . . . . . . . . . . . . . . . . . 0.75% or above 1.0% or abovePrecautionary . . . . . . . . . . . . . . . . . . . . . . . . . . . . . . . . . . . . 8.0% or above 10.0% or aboveSubstandard . . . . . . . . . . . . . . . . . . . . . . . . . . . . . . . . . . . . . . 20.0% or above 20.0% or aboveDoubtful . . . . . . . . . . . . . . . . . . . . . . . . . . . . . . . . . . . . . . . . . 55.0% or above 55.0% or aboveEstimated loss . . . . . . . . . . . . . . . . . . . . . . . . . . . . . . . . . . . 100.0% 100.0%
146
In addition, due to a rapid increase in the number of loans secured by homes and other forms of housing, theFinancial Services Committee and the Financial Supervisory Service have implemented regulationsdesigned to curtail extension of new or refinanced loans secured by housing, including the following:
Š as to loans secured by collateral of housing located nationwide, the loan-to-value ratio (the aggregateprincipal amount of loans secured by such collateral over the appraised value of the collateral) shouldnot exceed 60%;
Š as to loans secured by collateral of housing located in areas of excessive investment as designated bythe Government, (i) the loan-to-value ratio for loans with a maturity of not more than three yearsshould not exceed 50% and (ii) the loan-to-value ratio for loans with a maturity of more than threeyears should not exceed 60%;
Š as to loans secured by apartments located in areas of high speculation as designated by theGovernment, (i) the loan-to-value ratio for loans with a maturity of not more than ten years should notexceed 40%; and (ii) the loan-to-value ratio for loans with a maturity of more than ten years shouldnot exceed (a) 40%, if the price of such apartment is over W600 million, and (b) 60%, if the price ofsuch apartment is W600 million or lower;
Š as to loans secured by apartments with appraisal values of more than W600 million in areas of highspeculation as designated by the Government or certain metropolitan areas designated as areas ofexcessive investment by the Government, the borrower’s debt-to-income ratio (calculated as (i) theaggregate annual total payment amount of (x) the principal of and interest on loans secured by suchapartment(s) and (y) the interest on other debts of the borrower over (ii) the borrower’s annualincome) should not exceed 40%;
Š as to apartments located in areas of high speculation as designated by the Government, a borrower ispermitted to have only one new loan secured by such apartment;
Š where a borrower has two or more loans secured by apartments located in areas of high speculation asdesignated by the Government, the loan with the earliest maturity date must be repaid first and thenumber of loans must be eventually reduced to one; and
Š in the case of a borrower (i) whose spouse already has a loan secured by housing or (ii) who is singleand under 30 years old, the debt-to-income ratio of the borrower in respect of loans secured byapartment(s) located in areas of high speculation as designated by the Government should not exceed40%.
Restrictions on Investments in Property
A bank may possess real estate property only to the extent necessary for the conduct of its business,provided that the aggregate value of such real estate property must not exceed 60% of the sum of its Tier Iand Tier II capital (less any capital deductions). Any property acquired by a bank (1) through the exerciseof its rights as a secured party or (2) the acquisition of which is prohibited by the Banking Act must bedisposed of within one year, subject to certain exceptions.
Restrictions on Shareholdings in Other Companies
Under the Banking Act, a bank may not own more than 15% of outstanding shares with voting rights ofanother company, except where, among other reasons:
Š the company issuing such shares is engaged in a category of financial business set forth by theFinancial Services Commission (including private equity funds); or
Š the acquisition of shares by the bank is necessary for corporate restructuring of such company and isapproved by the Financial Services Commission.
147
In the above cases, a bank must satisfy either of the following requirements:
Š the total investment in companies in which the bank owns more than 15% of the outstanding shareswith voting rights does not exceed 15% of the sum of Tier I and Tier II capital (less any capitaldeductions); or
Š the acquisition satisfies the requirements determined by the Financial Services Commission.
The Banking Act provides that a bank using its bank accounts and its trust accounts is not permitted toacquire the shares issued by the Major Shareholder of such bank in excess of an amount equal to 1% of thesum of Tier I and Tier II capital (less any capital deductions).
Restrictions on Bank Ownership
Under an amendment to the Banking Act, which became effective on July 28, 2002, subject to certainexceptions, a single shareholder and persons who stand in a special relationship with such shareholder (asdescribed in the Presidential Decree to the Banking Act) may acquire beneficial ownership of up to 10% ofa national bank’s total issued and outstanding shares with voting rights and up to 15% of a regional bank’stotal issued and outstanding shares with voting rights. The government, the Korea Deposit InsuranceCorporation and financial holding companies qualifying under the Financial Holding Companies Act are notsubject to such ceilings. However, non-financial business group companies (i.e., (1) any same shareholdergroup with aggregate net assets of all non-financial companies belonging to such group of not less than 25%of the aggregate net assets of all corporations that are members of such group, (2) any group with aggregateassets of all non-financial companies belonging to such group of not less than W2 trillion or (3) any mutualfund in which a same shareholder group, as described in items (1) and (2) above, owns more than 4% of thetotal shares issued and outstanding) may not acquire beneficial ownership of shares of a national bank inexcess of 4% of such bank’s outstanding voting shares, provided that such non-financial business groupcompanies may acquire beneficial ownership of:
Š up to 10% of a national bank’s outstanding voting shares with the approval of the Financial ServicesCommission under the condition that such non-financial group companies will not exercise votingrights in respect of such shares in excess of the 4% limit; and
Š in the event that a foreigner, as defined in the Foreign Investment Promotion Act, owns in excess of4% of a national bank’s outstanding voting shares, up to 10% of such bank’s outstanding voting shareswithout the approval of the Financial Services Commission, and in excess of 10%, 25% or 33% ofsuch bank’s outstanding voting shares, with the approval of the Financial Services Commission, up tothe number of shares owned by such foreigner.
In addition, any person (whether a Korean national or a foreigner), with the exception of non-financialbusiness group companies described above, may also acquire in excess of 10% of a national bank’s totalvoting shares issued and outstanding, provided that an approval from the Financial Services Commission isobtained in instances where the total holding exceeds 10% (or 15% in the case of regional banks), 25% or33% of the bank’s total voting shares issued and outstanding, provided that in addition to the foregoingthreshold shareholding ratios, the Financial Services Commission may, at its discretion, designate a separateand additional threshold shareholding ratio.
Deposit Insurance System
The Depositor Protection Act provides, through a deposit insurance system, insurance for certain deposits ofbanks in Korea. Under the Depositor Protection Act, all banks governed by the Banking Act, including theBank, are required to pay to the Korea Deposit Insurance Corporation an insurance premium on a quarterlybasis at such rate as determined by the Presidential Decree to the Depositor Protection Act, which shall notexceed 0.5% of the bank’s insurable deposits in any given year. The current insurance premium is 0.02% ofinsurable deposits for each quarter. If the Korea Deposit Insurance Corporation pays the insured amount, itwill acquire the claims of the depositors within the payment amount. Under current rules, the Korea Deposit
148
Insurance Corporation insures only up to a total of W50 million for deposits and interest, regardless ofwhen the deposits were made and the size of the deposits. However, the maximum limit of W50 million isnot applicable to interest-free settlement accounts (for example, a checking account), for any insurableevent occurring during the period from January 1, 2001 to December 31, 2003.
Restrictions on Foreign Exchange Position
Under the Korean Foreign Exchange Transaction Regulations, a bank’s net overpurchased and oversoldpositions are each limited to 50% of the stockholders’ equity as of the end of the prior month.
Trust Business
A bank that intends to enter into the trust business must obtain the approval of the Financial ServicesCommission. Trust activities of banks are governed by the Trust Act and the Financial Investment Servicesand Capital Markets Act. Banks engaged in the banking business and trust business are subject to certainlegal and accounting procedures requirements, including the following:
Š under the Banking Act, assets accepted in trust by a bank in Korea must be segregated from its otherassets in the accounts of such bank; accordingly, banks engaged in the banking and trust businessesmust maintain two separate accounts, the “bank accounts” and the “trust accounts”, and two separatesets of records which provide details of their banking and trust businesses, respectively; and
Š assets comprising the trust accounts are not available to depositors or other general creditors of suchbank in the event the trustee is liquidated or is wound up.
On January 17, 2005, in accordance with the amendment to the Trust Business Act, a comprehensive trustsystem was introduced to allow banks engaged in trust businesses to accept in trust two or more propertiessuch as money, securities, or real estate with one trust deed. In addition, intellectual property rights can alsobe held as a trust asset.
The Indirect Investment Asset Management Business Act, which applied to unspecified money trust accountproducts under the Trust Business Act, securities investment trusts under the Securities Investment TrustBusiness Act, securities investment companies under the Securities Investment Company Act and variableinsurance products under the Insurance Business Act, took effect on January 5, 2004. In accordance with theIndirect Investment Asset Management Business Act, the Bank ceased offering unspecified money trustaccount products from the Bank and instead began to offer products developed by its investment trustmanagement business that fulfill the requirements as an asset management company.
Since February 4, 2009, a trust business conducted by a bank is also governed by the Financial InvestmentServices and Capital Markets Act, which replaced and superseded the Trust Business Act, and the IndirectInvestment Asset Management Business Act. Under the Financial Investment Services and Capital MarketsAct, a bank with a trust business license (such as the Bank) is permitted to offer both specified money trustaccount products and unspecified money trust account products. In the event that a bank qualifies andoperates as an asset management company, a trustee, a custodian or a general office administrator under theFinancial Investment Services and Capital Markets Act, it is required to establish relevant operation andmanagement systems to prevent potential conflicts of interest among the banking business, the assetmanagement business, the trustee or custodian business and general office administration. These measuresinclude:
Š prohibitions against officers, directors and employees of one particular business operation fromserving as an officer, director or employee in another business operation, except where an officer or adirector (1) is serving in two or more business operations with no significant conflict of interest inaccordance with the Presidential Decree on the Financial Investment Services and Capital Markets Actor (2) is serving in a trustee business or a custodian business and simultaneously serving in a generaloffice administrator business in accordance with the Financial Investment Services and CapitalMarkets Act;
149
Š prohibitions against the joint use or sharing of computer equipment or office equipment; and
Š prohibitions against the sharing of information by and among officers, directors or employees engagedin the different business operations.
A bank which qualifies and operates as an asset management company may engage in the sale ofbeneficiary certificates of investment trusts which are managed by such bank. However, such bank isprohibited from engaging in the following activities:
Š acting as trustee of an investment trust managed by such bank;
Š purchasing with such bank’s own funds beneficiary certificates of an investment trust managed bysuch bank;
Š using in its sales activities information relating to the trust property of an investment trust managed bysuch bank;
Š selling through a financial institution established under the Banking Act beneficiary certificates of aninvestment trust managed by such bank;
Š establishing a short-term financial indirect investment vehicle; and
Š establishing a mutual fund.
Laws and Regulations Governing Other Business Activities
To enter the foreign exchange business, a bank must register with the Minister of the Ministry of Strategyand Finance. The foreign exchange business is governed by the Foreign Exchange Transaction Law. Toenter the securities business, a bank must obtain the permission of the Financial Services Commission. Thesecurities dealing and brokerage business is governed by regulations under the Financial InvestmentServices and Capital Markets Act. Pursuant to the above-mentioned laws, banks are permitted to engage inthe foreign exchange business and the underwriting business for government and other public bonds.
Financial Investment Services and Capital Markets Act
General
On July 3, 2007, the National Assembly of Korea passed the Financial Investment Services and CapitalMarkets Act, a new law consolidating six laws regulating capital markets. The Financial InvestmentServices and Capital Markets Act became effective as of February 4, 2009.
Consolidation of Capital Markets-Related Laws
Prior to the effective date of the Financial Investment Services and Capital Markets Act, separate lawsregulated various types of financial institutions depending on the type of the financial institution (forexample, securities companies, futures companies, trust business companies and asset managementcompanies) and subject financial institutions to different licensing and ongoing regulatory requirements (forexample, under the Securities and Exchange Act, the Futures Business Act and the Indirect InvestmentAsset Management Business Act). By applying one uniform set of rules to the same financial businesshaving the same economic function, the Financial Investment Services and Capital Markets Act attempts toimprove and address issues caused by the previous regulatory system under which the same economicfunction relating to capital markets-related business were governed by multiple regulations. To this end, theFinancial Investment Services and Capital Markets Act categorizes capital markets-related business into sixdifferent functions, as follows:
Š dealing (trading and underwriting of “financial investment products” (as defined below));
150
Š brokerage (brokerage of financial investment products);
Š collective investment (establishment of collective investment schemes and the management thereof);
Š investment advice;
Š discretionary investment management; and
Š trusts (together with the five business set forth above, the “Financial Investment Businesses”).
Accordingly, all financial business relating to financial investment products are reclassified as one or moreof the Financial Investment Businesses described above, and financial institutions are subject to theregulations applicable to their relevant Financial Investment Business, irrespective of the type of thefinancial institution it is. For example, under the Financial Investment Services and Capital Markets Act,derivative businesses conducted by securities companies and future companies will be subject to the sameregulations under the Financial Investment Services and Capital Markets Act, at least in principle.
The banking business and insurance business are not subject to the Financial Investment Services andCapital Markets Act and will continue to be regulated under separate laws; provided, however, that they canstill be subject to the Financial Investment Services and Capital Markets Act if their activities involve anyfinancial investment businesses requiring a license based on the Financial Investment Services and CapitalMarkets Act.
Comprehensive Definition of Financial Investment Products
In an effort to encompass the various types of securities and derivative products available in the capitalmarkets, the Financial Investment Services and Capital Markets Act sets forth the comprehensive term“financial investment products”, defined to mean all financial products with a risk of loss in the investedamount (in contrast to “deposits”, which are financial products for which the invested amount is protectedor preserved). Financial investment products are classified into two major categories: (i) “securities”(relating to financial investment products where the risk of loss is limited to the invested amount) and(ii) “derivatives” (relating to financial investment products where the risk of loss may exceed the investedamount). As a result of the general and open-ended manner in which financial investment products aredefined, any future financial product could potentially fall under the definition of financial investmentproducts, which would enable Financial Investment Companies (as defined below) to handle a broaderrange of financial products. Under the Financial Investment Services and Capital Markets Act, securitiescompanies, asset management companies, future companies and other entities engaging in any FinancialInvestment Business are classified as “Financial Investment Companies”.
New License System and the Conversion of Existing Licenses
Financial Investment Companies will be able to choose what Financial Investment Business to engage in(through the “check the box” method set forth in the relevant license application), by specifying the desired(i) Financial Investment Business, (ii) financial investment product and (iii) target customers to whichfinancial investment products may be sold or dealt to (i.e., general investors or professional investors).Licenses will be issued under the specific business sub-categories described in the foregoing sentence. Forexample, it would be possible for a Financial Investment Company to obtain a license to engage in theFinancial Investment Business of (i) dealing, (ii) over the counter derivatives products or (iii) only withprofessional investors.
Financial institution currently engaging in business activities constituting a Financial Investment Businesshave had to take certain steps, such as renewal of their license or registration, in order to continue engagingin such business activities even after the Financial Investment Services and Capital Markets Act becameeffective. Financial institutions that are not licensed Financial Investment Companies are not be permittedto engage in any Financial Investment Business, subject to the following exceptions: (i) banks and insurancecompanies are permitted to engage in certain categories of Financial Investment Business for a period not
151
exceeding six months commencing on the effective date of the Financial Investment Services and CapitalMarkets Act; and (ii) other financial institutions that engaged in any Financial Investment Business prior tothe effective date of the Financial Investment Services and Capital Markets Act (whether in the form of aconcurrent business or an incidental business) are permitted to continue such Financial Investment Businessfor a period not exceeding six months commencing on the effective date of the Financial InvestmentServices and Capital Markets Act.
Expanded Business Scope of Financial Investment Companies
Under the previous regulatory regime in Korea, it was difficult for a financial institution to explore a newline of business or expand upon its existing line of business. For example, a financial institution licensed asa securities company generally could not engage in the asset management business. In contrast, under theFinancial Investment Services and Capital Markets Act, pursuant to the integration of its current businessinvolving financial investment products into a single Financial Investment Business, a licensed FinancialInvestment Company is permitted to engage in all types of Financial Investment Businesses, subject tosatisfying relevant regulations, for example, maintaining an adequate “Chinese Wall”, to the extentrequired. As to incidental businesses (i.e., a financial related business which is not a Financial InvestmentBusiness), the Financial Investment Services and Capital Markets Act generally allows a FinancialInvestment Company to freely engage in such incidental businesses by shifting away from the currentpositive-list system towards a more comprehensive system. In addition, a Financial Investment Company ispermitted (i) to outsource marketing activities by contracting “introducing brokers” that are individuals butnot employees of the Financial Investment Company, (ii) to engage in foreign exchange business related totheir Financial Investment Business and (iii) to participate in the settlement network, pursuant to anagreement among the settlement network participants.
Improvement in Investor Protection Mechanism
While the Financial Investment Services and Capital Markets Act widens the scope of financial businessesin which financial institutions are permitted to engage, a more rigorous investor-protection mechanism willbe imposed upon Financial Investment Companies dealing in financial investment products. The FinancialInvestment Services and Capital Markets Act distinguishes general investors from sophisticated investorsand provides new or enhanced protections to general investors. For instance, the Financial InvestmentServices and Capital Markets Act expressly provides for strict know-your-customer rules for generalinvestors and imposes an obligation that Financial Investment Companies should market financialinvestment products suitable to each general investor considering his/her investment objective, net worth,investment experience etc. Under the Financial Investment Services and Capital Markets Act, a FinancialInvestment Company can be held liable if a general investor proves (i) damage or losses relating to suchgeneral investor’s investment in financial investment products solicited by such Financial InvestmentCompany and (ii) absence of explanation, false explanation, or omission of material fact (without having toprove fault or causation). In cases where there are any conflicts of interest between the Financial InvestmentCompanies and investors, the Financial Investment Services and Capital Markets Act expressly requires(i) disclosure of any conflict of interest to investors and (ii) either mitigation of the conflicts of interest to acomfortable level or abstention from the relevant transaction.
Other Regulatory Changes Related to Securities and Investments
The Financial Investment Services and Capital Markets Act changed various securities regulationsincluding those relating to public disclosure, insider trading and proxy contests, which were previouslygoverned by the Securities and Exchange Act. For example, the 5% and 10% reporting obligations under theSecurities and Exchange Act are more stringent under the Financial Investment Services and CapitalMarkets Act. For example, the number of events requiring an investor to update its 5% report are increasedunder the Financial Investment Services and Capital Markets Act. Previously, only a change in theshareholding of 1% or more or in the purpose of shareholding (such as an intention to influencemanagement) could trigger the obligation to update the 5% report. The government has issued detailedregulations stipulating additional events requiring updates to 5% reports, such as the change in the type ofholding and change in any major aspect of the relevant contract. As for the 10% report filing obligation, theinitial filing is expected to be required to be made within five business days of the date of the event
152

triggering the 10% reporting obligation, compared to 10 calendar days under the previous law. The due datefor reporting a subsequent change after the initial 10% report filing is reduced from the 10th day of the firstmonth immediately following the month in which such change took place to five business days of the dateof such change. Under the previous law, there are limitation on the type of investment vehicles that could beused in a collective investment scheme (namely, to trusts and corporations), the type of funds that can beused for collective investment, and the types of assets and investment securities a fund can invest in.However, the Financial Investment Services and Capital Markets Act significantly liberalizes theserestrictions, permitting all legal entities, including limited liability companies or partnerships, to be used forthe purpose of collective investments, allowing the formation of fund complexes and permitting investmentfunds to invest in a wide variety of different assets and investment instruments.
153
DESCRIPTION OF THE NOTES
The Notes will be issued under a fiscal agency agreement (the “Fiscal Agency Agreement”) to be dated asof June 29, 2009 between the Bank and The Bank of New York Mellon, as fiscal agent (the “Fiscal Agent”).The following summaries of certain provisions of the Notes and the Fiscal Agency Agreement do notpurport to be complete and are subject to, and are qualified in their entirety by reference to, all theprovisions of the Notes and the Fiscal Agency Agreement, including the definitions contained therein ofcertain terms.
General
The Notes will be issued in an initial aggregate principal amount of US$500,000,000 and will mature onJune 29, 2012. The Notes will be the direct, unconditional, unsecured and unsubordinated generalobligations of the Bank. The Notes will rank pari passu among themselves, without any preference of oneover the other by reason of priority of date of issue or otherwise, and at least equally with all otheroutstanding unsecured and unsubordinated general obligations of the Bank.
The Notes will bear interest at the rate per annum shown on the front cover of this Offering Circular fromJune 29, 2009, payable semi-annually in arrears on June 29 and December 29 of each year, commencingDecember 29, 2009, to the holders of record on June 14 or December 14 immediately preceding suchinterest payment date (each, a “Record Date”). Interest will be calculated on the basis of a 360-day yearconsisting of twelve 30-day months and in the case of an incomplete month, the number of days elapsed onthe basis of a month of 30 days. The Notes will be issued in denominations of US$100,000 or integralmultiples of US$1,000 in excess thereof. The Notes do not provide for any sinking fund. Temporarydocuments of title will not be issued. During the tenure of the Notes, the Notes will be traded on theSingapore Stock Exchange in a minimum board lot size of US$200,000.
The term “Business Day” means any day other than a day on which commercial banks or foreign exchangemarkets are permitted or required to be closed in the City of New York or London or, in the caseCertificated Notes (as defined below) are to be presented, in the place in which Certificated Notes arepresented. If the date for payment of interest on or principal of the Notes is not a Business Day, thenpayment of interest or principal will be made on the next succeeding Business Day with the same force andeffect as if made on such date, and no interest shall accrue for the period after such date.
Payments on the Notes will be made in accordance with any laws, regulations or administrative practicesapplicable to the Bank and its agents in respect thereof, including the requirements under Korean tax law.
Further issues
The Notes will be issued in the initial aggregate principal amount set forth above. The Bank may, from timeto time, without the consent of the holders of the Notes, create and issue, pursuant to the Fiscal AgencyAgreement and in accordance with applicable laws and regulations, additional notes (“Additional Notes”)maturing on the same maturity date and having the same terms and conditions under the Fiscal AgencyAgreement as the previously outstanding Notes in all respects (or in all respects except for the issue dateand the amount and the date of the first payment of interest thereon) so that such Additional Notes shall beconsolidated and form a single series with the previously outstanding Notes, provided that Additional Notesmust (i) be issued with no more than a de minimis amount of original issue discount, or (ii) be part of a“qualified reopening” for U.S. federal income tax purposes.
Redemption at maturity
On June 29, 2012 (the “Maturity Date”), the Bank will redeem all outstanding Notes at a price equal to100% of the unpaid principal amount thereof. The Notes cannot be redeemed prior to Maturity Date exceptas provided below under “— Optional tax redemption.”
Optional tax redemption
The Notes may be redeemed at any time, at the option of the Bank, in whole, but not in part, upon not lessthan 30 nor more than 60 days’ prior notice, at a redemption price equal to 100% of the principal amount of
154
the Notes then outstanding plus accrued and unpaid interest on the principal amount being redeemed to (butexcluding) the redemption date, if (i) as a result of any change in, or amendment to, the laws or regulationsof Korea (or of any political subdivision or authority thereof or therein having the power to tax) or anychange in the application or official interpretation of such laws or regulations (including the cessation of taxexemptions presently applicable), which change or amendment becomes effective on or after the date of thisOffering Circular, the Bank is or would be obligated on the next succeeding due date for a payment withrespect to the Notes to pay additional amounts with respect to the Notes, and (ii) such obligation cannot beavoided by the Bank taking reasonable measures available to it. Additional amounts are payable by theBank under the circumstances described below under “— Additional amounts”.
Prior to any such redemption of the Notes, the Fiscal Agency Agreement requires that the Bank deliver tothe Fiscal Agent a certificate signed by an authorized officer of the Bank stating that the Bank is entitled toeffect such redemption and setting forth a statement of facts showing that the conditions precedent to theright of the Bank so to redeem have occurred, and an opinion of independent legal advisers of recognizedstanding to the effect that the Bank has or will become obliged to pay such additional amounts as a result ofsuch change or amendment.
No notice of redemption may be given earlier than 90 days prior to the earliest date on which the Bankwould be obligated to pay additional amounts if a payment in respect of the Notes were then due.
Purchases
The Bank may at any time purchase Notes at any price in the open market or otherwise. Notes, if sopurchased, may be held, reissued or resold or, at the option of the Bank, surrendered to the Fiscal Agent forcancellation.
Cancellations
All Notes which are redeemed will forthwith be cancelled. All Notes so cancelled and the Notes purchasedand surrendered for cancellation as described above shall be forwarded to the Fiscal Agent and cannot bereissued or resold.
Meetings of holders of the Notes; modifications
The Bank may at any time, and the Fiscal Agent will at any time after the Notes become immediately dueand payable due to a default upon a request in writing made by holders of the Notes holding not less than10% of the aggregate outstanding principal amount of the Notes, convene a meeting of holders of the Notes.Further provisions concerning meetings of the holders are set forth in the Fiscal Agency Agreement.
The Fiscal Agency Agreement permits the Bank and the Fiscal Agent, without the consent of the holders ofthe Notes, to execute supplemental agreements for certain enumerated purposes, and with the consent of theholders of not less than a majority in aggregate principal amount of the Notes then outstanding, evidencedas in the Fiscal Agency Agreement provided, to execute supplemental agreements adding any provisions toor changing in any manner or eliminating any of the provisions of the Fiscal Agency Agreement or of theNote or of any supplemental agreement or modifying in any manner the rights of the holders of the Notes;provided that no such supplemental agreement will (a) change the stated maturity of the principal of anyNote, or reduce the principal amount thereof, or reduce the rate or extend the time of payment of anyinstallment of interest thereon, or change the place or currency of payment of principal of, or interest on,any Note, or change the Bank’s obligation to pay additional amounts, or impair or affect the right of anyNoteholder to institute suit for the enforcement of any such payment on or after the due date therefor (or inthe case of redemption, on or after the redemption date) without the consent of the holder of each Note soaffected; or (b) reduce the aforesaid percentage of Notes, the consent of the holders of which is required forany such supplemental agreement, without the consent of the holders of all Notes then outstanding. At ameeting of the holders of the Notes called for obtaining the consent of the holders of the Notes, personsentitled to vote a majority in aggregate principal amount of the Notes at the time outstanding will constitutea quorum. In the absence of a quorum at any such meeting, the meeting may be adjourned for a period ofnot less than 10 days; in the absence of a quorum at any such adjourned meeting, such adjourned meetingmay be further adjourned for a period of not less than 10 days; at the reconvening of any meeting further
155
adjourned for lack of a quorum, the persons entitled to vote 25% in aggregate principal amount of the Notesat the time outstanding will constitute a quorum for the taking of any action set forth in the notice of theoriginal meeting. At a meeting or an adjourned meeting duly convened and at which a quorum is present asaforesaid, any resolution to modify or amend, or to waive compliance with, any of the covenants orconditions referred to above (other than certain situations set forth in the Fiscal Agency Agreement) will beeffectively passed if passed by the persons entitled to vote the lesser of (i) a majority in aggregate principalamount of Notes then outstanding or (ii) 75% in aggregate principal amount of the Notes represented andvoting at the meeting.
Any modifications, amendments or waivers so consented to or approved will be conclusive and binding onall holders of the Notes whether or not they have given such consent or were present at such meeting, andon all future holders of the Notes whether or not notation of such modifications, amendments or waivers ismade upon the Notes. Any instrument given by or on behalf of any holder of a Note in connection with anyconsent to any such modification, amendment or waiver will be irrevocable once given and will beconclusive and binding on all subsequent holders of such Note.
Limitation on liens
So long as any of the Notes remains outstanding, the Bank will not create or permit to subsist any mortgage,charge, pledge or other security interest upon or over the whole or any part of its property, assets orrevenues (whether present or future) to secure for the benefit of the holders of any International InvestmentSecurities (as defined below):
(i) payment of any sum due in respect of any such International Investment Securities;
(ii) payment under any guarantee in respect of any such International Investment Securities; or
(iii) payment under any indemnity or other like obligations in respect of any such InternationalInvestment Securities,
without, in any such case and at the same time, according to the holders of the Notes either the samesecurity as is available for the benefit of the holders of such International Investment Securities or suchother security or guarantee as shall be approved by the holders of a majority of the aggregate principalamount of the Notes then outstanding.
For purposes of the foregoing, “International Investment Securities” means notes, bonds, debentures,certificates of deposit or investment securities of any person which:
(i) by their terms either are payable, or confer a right to receive payment, in any currency other thanWon or are denominated in Won and more than one-half of the aggregate principal amount ofwhich is initially distributed outside Korea by or with the authorization of the Bank; and
(ii) are for the time being, or are intended to be, quoted, listed, ordinarily dealt in or traded on anystock exchange or over-the-counter or other securities market outside Korea.
For the avoidance of doubt, notwithstanding the foregoing, in the event that there is a change in law orregulation in Korea permitting or providing for the issue of covered bonds, any arrangement relating to thesegregation of any part of the Bank’s property, assets or revenues for the purpose thereof shall be permitted,provided that, such arrangement is entered into in compliance with such law or regulation and that suchproperty, assets or revenues qualify as collateral for issues of covered bonds under such law or regulation.
Events of default
The occurrence and continuance of one or more of the following events will constitute events of default(each an “Event of Default”) under the Notes:
(a) Non-payment: default in the payment of principal of the Notes when the same becomes due andpayable, whether at maturity, upon acceleration, redemption or otherwise; or default in the paymentof any installment of interest upon any of the Notes as and when the same shall become due andpayable, and continuance of such default in the payment of interest for a period of 14 days; or
156
(b) Breach of other obligations: the Bank defaults in the performance or observance of any of itsother obligations under or in respect of the Notes or the Fiscal Agency Agreement and suchdefault remains unremedied for 30 days after the Fiscal Agent or any Noteholder has givenwritten notice thereof to the Bank; or
(c) Cross-acceleration: any Indebtedness (as defined below) by the Bank in aggregate exceedingUS$10,000,000 (or its equivalent in one or more other currencies) of the Bank either(1) becoming due and payable prior to the due date for payment thereof by reason ofacceleration following a default by the Bank or (2) not being repaid by the Bank at, andremaining unpaid after, maturity (as extended by the period of grace, if any) applicable thereto,or any guarantee given by the Bank in respect of Indebtedness of any other person not beinghonored and remaining dishonored after becoming due and called; provided that, in the case of(1) above, if any such default under any such Indebtedness shall be cured or waived, then thedefault under the Notes shall be deemed to have been cured and waived; or
(d) Enforcement proceedings: a distress, attachment, execution, seizure before judgment or otherlegal process is levied, enforced or sued out upon or against the whole or a material part of theassets or revenues of the Bank and is not discharged or stayed within 60 days; or
(e) Security enforced: a secured party takes possession, or a receiver, manager or other similarofficer is appointed, of the whole or a material part of the undertaking, assets and revenues ofthe Bank; or
(f) Insolvency, etc.: (1) the Bank becomes insolvent or is unable to pay its debts as they fall due,(2) an administrator or liquidator of the Bank or the whole or any part of the undertaking, assetsand revenues of the Bank is appointed (or application for any such appointment is made (ordocuments filed with a court for such appointment) and is not withdrawn within 60 daysthereafter), (3) the Bank takes any action for a readjustment or deferment of any of itsobligations or makes a general assignment or an arrangement or composition with or for thebenefit of its creditors or declares a moratorium in respect of any of its Indebtedness or anySurety given by it, (4) the Bank ceases or threatens to cease to carry on all or any substantialpart of its business or (5) the Bank ceases to be a foreign exchange bank with a general bankinglicense in Korea; or
(g) Winding up, etc.: an order is made or an effective resolution is passed for the winding up,liquidation or dissolution of the Bank; or
(h) Analogous event: any event occurs which under the laws of Korea has an analogous effect toany of the events referred to in paragraphs (d) through (g) above; or
(i) Unlawfulness: it is or becomes unlawful for the Bank to perform or comply with any one ormore of its obligations under or in respect of any of the Notes or the Fiscal Agency Agreement;or
(j) Government intervention: (1) all or any substantial part of the undertaking, assets and revenuesof the Bank is condemned, seized or otherwise appropriated by any person acting or purportingto act under the authority of any national, regional or local government of Korea or (2) the Bankis prevented by any such person from exercising normal control over all or any substantial partof its undertaking, assets and revenues.
For the purposes of the foregoing:
(i) “Indebtedness” means all obligations created, incurred or assumed by a Person for the paymentor repayment of moneys relating to or in connection with (a) any indebtedness of the Person inrespect of moneys borrowed by it; (b) any indebtedness of the Person under acceptance ordocumentary credit facilities; (c) any indebtedness of the Person under bills, bonds, debentures,
157
notes or similar instruments on which the Person is liable; (d) any obligations of the Personunder leases which in accordance with accounting principles generally accepted in Korea arerequired to be capitalized for financial reporting purposes; (e) any indebtedness of the Person(whether actual or contingent) for moneys owing under any instrument entered into by thePerson in respect of the acquisition cost of assets payment of which is deferred for a period inexcess of six months after acquisition thereof, and (f) indebtedness of the Person (actual orcontingent) under guarantees, security, indemnities or other commitments designed to assure anycreditors in respect of the payment of any indebtedness of any other person;
(ii) “Person” means any individual, company, corporation, firm, partnership, joint venture,association, organization, state, agency of a state or other entity, whether or not having aseparate legal personality; and
(iii) “Surety” means any obligation of any Person to pay an Indebtedness of another Person(s)including, without limitation, (1) any obligation to purchase such Indebtedness, (2) anyobligation to lend or give money, to purchase or subscribe shares or other securities or topurchase assets or services in order to provide funds for the payment of such Indebtedness,(3) any indemnity against the consequences of a default in the payment of such Indebtedness and(4) any other agreement to be responsible for such Indebtedness.
In each and every such case described in (a) through (j) above, unless the principal of all of the Notes shallalready have become due and payable, the holders of not less than 25% in aggregate principal amount of theNotes then outstanding, by written notice as provided in the Fiscal Agency Agreement, may declare theentire principal of all the Notes, and the interest accrued thereon, to be due and payable immediately,provided however, that if any of the events specified in (d) through (h) shall have occurred, the aggregateprincipal amount of the Notes then outstanding shall automatically become due and payable without regardto the giving of any such notice. If, at any time after the principal of the Notes shall have been so declareddue and payable, and before any judgment or decree for the payment of the moneys due shall have beenobtained or entered, the Bank shall pay or deposit with the Fiscal Agent a sum sufficient to pay all maturedinstallments of interest upon all the Notes and the principal of any and all Notes that shall have become dueotherwise than by acceleration (with interest upon such principal and, to the extent that the payment of suchinterest is enforceable under applicable law, on overdue installments of interest) and reasonablecompensation and expenses of the Fiscal Agent, and if any and all Events of Default under the Notes, otherthan the non-payment of the principal of Notes that shall have become due by acceleration, shall have beencured, waived or otherwise remedied, then and in every such case the holders of a majority in aggregateprincipal amount of the Notes then outstanding may, by written notice, waive all defaults and rescind andannul such declaration and its consequences.
Consolidation, merger and sale of assets
The Bank will not consolidate with, merge or amalgamate into, or transfer all or substantially all of itsassets to any corporation or convey or transfer all or substantially all of its assets to any person, except asprovided in the Notes or the Fiscal Agency Agreement. The Bank may, without the consent of the holders ofany of the Notes, consolidate with, or merge into, or sell, transfer, lease or convey all or substantially all ofits assets to any corporation organized under the laws of Korea, provided that:
Š any successor corporation expressly assumes the Bank’s obligations under the Notes and the FiscalAgency Agreement;
Š after giving effect to the transaction, no Event of Default and no event which, after notice or lapse oftime or both, would become an Event of Default, shall have occurred and be continuing;
Š the Bank has delivered to the Fiscal Agent an officer’s certificate and an opinion of counsel, eachstating that such consolidation, merger, sale, transfer, lease or conveyance and, if a supplementalagreement is required in connection with such transaction, such supplemental agreement comply withthis provision and that all conditions precedent provided for in the Fiscal Agency Agreement relatingto such transaction have been complied with; and
158
Š certain other conditions in the Fiscal Agency Agreement are satisfied.
Although there is a limited body of case law interpreting the phrase “substantially all,” there is no preciseestablished definition of the phrase under applicable law. Accordingly, in certain circumstances there maybe a degree of uncertainty as to whether a particular transaction would involve “substantially all” of theproperty or assets of a person.
Discharge and defeasance
Discharge of Notes
The Fiscal Agency Agreement provides that the Bank will be discharged from any and all obligations inrespect of the Notes (except for certain obligations to register the transfer of or exchange Notes, replacestolen, lost or mutilated Notes, make payments of principal and interest and maintain paying agencies) if:
Š the Bank has paid or caused to be paid in full the principal of and interest on all Notes outstandingthereunder;
Š the Bank shall have delivered to the Fiscal Agent for cancellation all Notes outstanding theretoforeauthenticated; or
Š all Notes not theretofore delivered to the Fiscal Agent for cancellation (i) have become due andpayable; (ii) will become due and payable in accordance with their terms within one year or (iii) are tobe, or have been, called for redemption as described under “— Optional tax redemption” within oneyear under arrangements satisfactory to the Fiscal Agent for the giving of notice of redemption, and,in any such case, the Bank shall have irrevocably deposited with the Fiscal Agent, in trust for thebenefit of the holders of such Notes, (a) cash in U.S. dollars in an amount, or (b) U.S. GovernmentObligations (as defined below) which through the payment of interest thereon and principal thereof inaccordance with their terms will provide not later than the due date of any payment, cash in U.S.dollars in an amount, or (c) any combination of (a) and (b), sufficient to pay all the principal of, andinterest on, the Notes on the dates such payments are due in accordance with the terms of the Notes.
“U.S. Government Obligations” means securities which are (i) direct obligations of the United Statesgovernment or (ii) obligations of a Person controlled or supervised by and acting as an agency orinstrumentality of the United States government, the payment of which is unconditionally guaranteed by theUnited States government, which, in either case, are full faith and credit obligations of the United Statesgovernment payable in U.S. dollars and are not callable or redeemable at the option of the issuer thereof andshall also include a depositary receipt issued by a bank or trust company as custodian with respect to anysuch U.S. Government Obligation or a specific payment of interest on or principal of any such U.S.Government Obligation held by such custodian for the account of the holder of a depositary receipt;provided that (except as required by law) such custodian is not authorized to make any deduction from theamount payable to the holder of such depositary receipt from any amount received by the custodian inrespect of the U.S. Government Obligation or the specific payment of interest on or principal of the U.S.Government Obligation evidenced by such depositary receipt.
Covenant defeasance
The Fiscal Agency Agreement also provides that the Bank need not comply with certain covenants(“covenant defeasance”) of the Notes (including those described under “— Limitation on liens”), if:
Š the Bank irrevocably deposits with the Fiscal Agent, in trust for the benefit of the holders of suchNotes, (a) cash in U.S. dollars in an amount, or (b) U.S. Government Obligations which through thepayment of interest thereon and principal thereof in accordance with their terms will provide not laterthan the due date of any payment cash in U.S. dollars in an amount, or (c) any combination of (a) and(b), sufficient to pay all the principal of, and interest on, the Notes on the dates such payments are duein accordance with the terms of the Notes;
159
Š certain Events of Default or certain events which with notice or lapse of time or both would becomeEvents of Default shall not have occurred and be continuing on the date of such deposit;
Š the Bank delivers to the Fiscal Agent an opinion of tax counsel of recognized standing with respect toU.S. federal income tax matters to the effect that the beneficial owners of the Notes will not recognizeincome, gain or loss for U.S. federal income tax purposes as a result of the exercise of such covenantdefeasance and will be subject to U.S. federal income tax on the same amounts, in the same mannerand at the same times as would be the case if such covenant defeasance had not occurred;
Š the Bank delivers to the Fiscal Agent an opinion of tax counsel of recognized standing in Korea to theeffect that such deposit and related covenant defeasance will not cause the holders of Notes, otherthan holders who are or who are deemed to be residents of Korea or use or hold or are deemed to useor hold their Notes in carrying on a business in Korea, to recognize income, gain or loss for Koreanincome tax purposes, and to the effect that payments out of the trust fund will be free and exemptfrom any and all withholding and other income taxes of whatever nature of Korea or any province orpolitical subdivision thereof or therein having power to tax, except in the case of Notes beneficiallyowned (x) by a Person who is or is deemed to be a resident of Korea or (y) by a Person who uses orholds or is deemed to use or hold such Notes in carrying on a business in Korea; and
Š the Bank delivers to the Fiscal Agent an Officers’ Certificate and an opinion of legal counsel ofrecognized standing, each stating that all conditions precedent provided for relating to such covenantdefeasance have been complied with.
Additional amounts
All payments of principal and interest in respect of the Notes by the Bank shall be made withoutwithholding or deduction for, or on account of, any present or future taxes or duties of whatever natureimposed or levied by or on behalf of Korea, or any political subdivision of, or any authority thereof ortherein having power to tax (“Taxes”), unless such withholding or deduction is required by law. In suchevent, the Bank will pay such additional amounts (“Additional Amounts”) as shall be necessary in orderthat the net amounts received by the holders of the Notes after such withholding or deduction shall equal therespective amounts of principal or interest which would otherwise have been receivable in respect of suchNote in the absence of such withholding or deduction, except that no such Additional Amounts shall bepayable in respect of the Notes:
(i) to or on behalf of a holder of the Notes who is liable for such Taxes in respect of such Note byreason of such holder of the Notes (or fiduciary, settlor, beneficiary, member or shareholder of,or possessor of power over the relevant holder, if the relevant holder is an estate, nominee, trustor corporation) being or having been connected with Korea (or any political subdivision thereof)otherwise than merely by holding such Note; or
(ii) to or on behalf of a holder of the Notes who presents a Note (where presentation is required)more than 30 days after the Relevant Date (as defined below), except to the extent that theholder of the Notes thereof would have been entitled to such Additional Amounts on presentingthe same for payment on such thirtieth day; or
(iii) where such withholding or deduction is imposed on a payment to or for the benefit of anindividual and is required to be made pursuant to European Union Directive 2003/48/EC or anylaw implementing or complying with, or introduced in order to conform to, such Directive; or
(iv) to or on behalf of a holder of the Notes who would have been able to avoid such withholding ordeduction by presenting (where presentation is required) the Note elsewhere to the Fiscal Agentor a paying agent in a Member State of the European Union; or
(v) to or on behalf of a holder of the Notes who is able to avoid such withholding or deduction bymaking a declaration of non-residence or other similar claim for exemption and does not makesuch declaration or claim; or
(vi) any combination of (i) through (v) above.
160
As used herein, the “Relevant Date” means the date on which any payment in respect of a Note firstbecomes due, except that, if the full amount of the moneys payable has not been duly received by the FiscalAgent on or prior to such due date, it means the date on which, the full amount of such moneys having beenso received, notice to that effect is duly given to the holders of the Notes in accordance with the FiscalAgency Agreement.
The obligation of the Bank to pay such Additional Amounts shall not apply to (a) any estate, inheritance,gift, sales, transfer, personal property or any similar tax, assessment or other governmental charge or(b) any tax, assessment or other governmental charge which is payable otherwise than by deduction orwithholding from payments of principal of or interest on the Notes; provided that, except as otherwise setforth in the Notes and in the Fiscal Agency Agreement, the Bank shall pay all stamp and other duties, ifany, which may be imposed by Korea or any respective political subdivision thereof or any taxing authorityof or in the foregoing, with respect to the Fiscal Agency Agreement or as a consequence of the initialissuance of the Notes.
Furthermore, no Additional Amounts shall be payable with respect to any payment of the principal of, orany interest on, any Note to any holder who is a fiduciary; partnership; limited liability company or anyperson other than the sole beneficial owner of such payment to the extent such payment would be requiredby the laws of Korea (or any political subdivision or taxing authority thereof or therein) to be included inthe income for tax purposes of a beneficiary or settlor with respect to such fiduciary, a member of suchpartnership or limited liability company, or a beneficial owner who would not have been entitled to suchAdditional Amounts had such beneficiary, settlor, member or beneficial owner been the holder of suchNote.
References to payments of principal or interest in respect of the Notes shall be deemed to include anyadditional amounts which may be payable as set forth in the Fiscal Agency Agreement.
Indemnification of Judgment Currency
To the fullest extent permitted by applicable law, the Bank will indemnify each holder of the Notes againstany loss incurred by such holder as a result of any judgment or order being given or made for any amountdue under any Note and such judgment or order being expressed and paid in a currency (the “JudgmentCurrency”) which is other than U.S. dollars and as a result of any variation as between (i) the rate ofexchange at which the U.S. dollar is converted into the Judgment Currency for the purposes of suchjudgment or order and (ii) the spot rate of exchange in The City of New York at which the holder on thedate of payment of such judgment is able to purchase U.S. dollars with the amount of the JudgmentCurrency actually received by such holder. This indemnification will constitute a separate and independentobligation of the Bank and will continue in full force and effect notwithstanding any such judgment or orderas aforesaid. The term spot rate of exchange includes any premiums and costs of exchange payable inconnection with the purchase of, or conversion into, U.S. dollars.
Fiscal Agent
The Fiscal Agent may resign at any time or may be removed by the Bank. If the Fiscal Agent resigns, isremoved or becomes incapable of acting as Fiscal Agent or if a vacancy occurs in the office of the FiscalAgent for any cause, the Bank shall appoint a successor Fiscal Agent in accordance with the provisions ofthe Fiscal Agency Agreement.
The address of the relevant corporate trust office of the Fiscal Agent is 101 Barclay Street, New York,NY 10286, U.S.A.
Book-entry; Delivery and Form
Summary of provisions relating to Notes in Global form
The certificates representing the Notes will be issued in fully registered form without interest coupons.Notes sold in offshore transactions in reliance on Regulation S under the Securities Act will initially be
161
represented by one or more permanent global Notes in definitive, fully registered form without interestcoupons (each a “Regulation S Global Note”) and will be deposited with the Fiscal Agent as custodian for,and registered in the name of, a nominee of DTC for the accounts of its participants, including Euroclearand Clearstream. Prior to the 40th day after the later of the commencement of the offering of the Notes andthe date of the Fiscal Agency Agreement, any resale or other transfer of such interests to U.S. persons shallnot be permitted unless such resale or transfer is made pursuant to Rule 144A or Regulation S and inaccordance with the certification requirements described below.
Notes sold in reliance on Rule 144A will be represented by one or more permanent global Notes indefinitive, fully registered form without interest coupons (each, a “Rule 144A Global Note” and, togetherwith the Regulation S Global Note, the “Global Notes”) and will be deposited with the Fiscal Agent ascustodian for, and registered in the name of a nominee of, DTC. Beneficial interests in a Rule 144A GlobalNote may be transferred to a person who takes delivery in the form of an interest in a Regulation S GlobalNote only upon receipt by the Fiscal Agent of written certifications (in the form(s) provided in the FiscalAgency Agreement) and pursuant to the transfer restrictions related to a Rule 144A Global Note asdescribed in this Offering Circular.
Each Global Note (and any Notes issued in exchange therefor) will be subject to certain restrictions ontransfer set forth therein described under “Notice to Investors”. Except in the limited circumstancesdescribed below under “— Summary of provisions relating to Certificated Notes”, owners of beneficialinterests in the Global Notes will not be entitled to receive physical delivery of Certificated Notes (asdefined below).
Ownership of beneficial interests in a Global Note will be limited to persons who have accounts with DTC(“participants”) or persons who hold interests through participants. Ownership of beneficial interests in aGlobal Note will be shown on, and the transfer of that ownership will be effected only through, recordsmaintained by DTC or its nominee (with respect to interests of participants) and the records of participants(with respect to interests of persons other than participants). Qualified Institutional Buyers may hold theirinterests in a Rule 144A Global Note directly through DTC if they are participants in such system, orindirectly through organizations which are participants in such system.
Investors may hold their interests in a Regulation S Global Note directly through Euroclear or Clearstream,if they are participants in such systems, or indirectly through organizations that are participants in suchsystems. Euroclear and Clearstream will hold interests in the Regulations S Global Notes on behalf of theirparticipants through DTC.
So long as DTC, or its nominee, is the holder of the Global Note, DTC or such nominee, as the case may be,will be considered the sole owner or holder of the Notes represented by such Global Note for all purposesunder the Fiscal Agency Agreement and the Notes. No beneficial owner of an interest in a Global Note willbe able to transfer that interest except in accordance with DTC’s applicable procedures, in addition to theseprovided for under the Fiscal Agency Agreement and, if applicable, those of Euroclear and Clearstream.
Payments of the principal of, and interest on, a Global Note will be made to DTC or its nominee, as the case maybe, as the holder thereof. Neither the Bank nor the Fiscal Agent will have any responsibility or liability for anyaspect of the records relating to or payments made on account of beneficial ownership interests in a Global Noteor for maintaining, supervising or reviewing any records relating to such beneficial ownership interests.
The Bank expects that DTC or its nominee, upon receipt of any payment in respect of a Global Note, willcredit participants’ accounts with payments in amounts proportionate to their respective beneficial interestsin the principal amount of such Global Note as shown on the records of DTC or its nominee. The Bank alsoexpects that payments by participants to owners of beneficial interests in such Global Note held throughsuch participants will be governed by standing instructions and customary practices, as is now the case withsecurities held for the accounts of customers registered in the names of nominees for such customers. Suchpayments will be the responsibility of such participants.
Transfers between participants in DTC will be effected in the ordinary way in accordance with DTC rulesand will be settled in same-day funds. Transfers between participants in Euroclear and Clearstream will beeffected in the ordinary way in accordance with their respective rules and operating procedures.
162
The Bank expects that DTC will take any action permitted to be taken by a Noteholder (including thepresentation of Notes for exchange as described below) only at the direction of one or more participants towhose account the DTC interests in a Global Note is credited and only in respect of such portion of theaggregate principal amount of Notes as to which such participant or participants has or have given suchdirection. However, if there is an Event of Default under the Notes, DTC will exchange the applicableGlobal Note for Certificated Notes, which it will distribute to its participants and which may be legended asset forth under the heading “Notice to Investors”.
Summary of provisions relating to Certificated Notes
If (i) DTC notifies the Bank that it is unwilling or unable to continue as a depositary for the Global Notes,and a successor depositary is not appointed by the Bank within 90 days of such notice, (ii) either Euroclearor Clearstream or a successor clearing system is closed for business for a continuous period of 14 days(other than by reason of holidays, statutory or otherwise) or announces an intention permanently to ceasebusiness or does in fact do so, or (iii) an Event of Default has occurred and is continuing, the Bank (at itscost) will issue certificates representing the Notes (“Certificated Notes”) in registered form in exchange forthe affected Global Notes. Upon receipt of such notice from DTC, Euroclear, Clearstream or the FiscalAgent, as the case may be, the Bank will use its best efforts to make arrangements for the exchange ofinterests in the relevant Global Note for Certificated Notes and cause the requested Certificated Notes to beregistered in the names of beneficial holders and executed and delivered to the Paying and Transfer Agentsin sufficient quantities for delivery to holders.
A Certificated Note may be transferred in whole or in part (in a principal amount equal to the minimumauthorized denomination or any integral multiple thereof) by surrendering such Certificated Note to betransferred, together with an executed instrument or assignment of transfer, at the corporate trust office ofthe Fiscal Agent or at the office of the Paying and Transfer Agent and (so long as the Notes are listed on theSGX-ST and the rules of the SGX-ST so require) the Paying and Transfer Agent in Singapore. In the case ofa permitted transfer of only part of a Certificated Note, a new Certificated Note in respect of the balance nottransferred will be issued to the transferor. Each new Certificated Note to be issued upon the transfer of aCertificated Note will, upon the effective receipt of a duly completed form of transfer by a Paying andTransfer Agent at its respective specified office, be available for delivery three business days after issuanceat such specified office, or at the request of the holder requesting such transfer, will be mailed at the risk ofthe transferee entitled to the new Certificated Note to such address as may be specified in such dulycompleted form of transfer. The transfer of the Certificated Notes will be effected without charge by or onbehalf of the Bank or any Paying and Transfer Agent but against such indemnity as the Bank or the Payingand Transfer Agent may require in respect of any tax or other duty of whatever nature which may be leviedor imposed in connection with such transfer.
If any Certificated Note is lost, stolen, mutilated, defaced or destroyed it may be replaced at the specifiedoffice of the Fiscal Agent upon payment by the claimant of the expenses incurred in connection with suchreplacement and on such terms as to evidence and indemnity as the Bank may reasonably require. Mutilatedor defaced Certificated Notes must be surrendered before replacements will be issued.
Certificated Notes delivered in exchange for beneficial interests in any Global Note will be registered in thenames, and issued in denominations of $100,000 or integral multiples of $1,000 in excess thereof, requestedby or on behalf of the DTC or successor depositary (in accordance with its customary procedures). Holdersof an interest in the Global Notes may receive Certificated Notes, which may bear the legend referred tounder “Notice to Investors”, in accordance with DTC’s rules and procedures in addition to those providedfor under the Fiscal Agency Agreement. Subject to such transfer restrictions, the holder of a CertificatedNote bearing such a legend may transfer or exchange such Notes in whole or in part by surrendering them tothe Fiscal Agent. Prior to any proposed transfer of Notes in certificated form, the holder may be required toprovide certifications and other documentation to the Fiscal Agent as described above. In the case of atransfer of only part of a Note, the original principal amount of both the part transferred and the balance nottransferred must be in authorized denominations, and new Notes will be issued to the transferor andtransferee, respectively, by the Fiscal Agent. Upon the transfer, exchange or replacement of CertificatedNotes not bearing the legend described above, the Fiscal Agent will deliver Certificated Notes that do notbear such legend.
163
Upon the transfer, exchange or replacement of Certificated Notes bearing the legend described above, orupon a specific request for removal of the legend from such Certificated Note, the Fiscal Agent will deliveronly Certificated Notes bearing such legend or will refuse to remove such legend, as the case may be, unlessthere is delivered to the Bank such satisfactory evidence, which may include an opinion of legal counsel ofrecognized standing, as may be reasonably required by the Bank that neither the legend nor the restrictionson transfer set forth therein are required to ensure compliance with the provisions of the Securities Act.
Payment of principal and interest in respect of the Certificated Notes shall be payable at the office ofagency of the Bank in the City of New York which shall initially be the corporate trust office of the FiscalAgent, at 101 Barclay Street, New York, NY 10286, U.S.A, provided that at the option of the Bank,payment may be made by wire transfer, direct deposit or check mailed to the address of the holder entitledthereto as such address appears in the Note Register (as defined in the Fiscal Agency Agreement).
Except in the limited circumstances described above, owners of interests in the Global Notes will not beentitled to receive physical delivery of individual definitive certificates. The Notes are not issuable inbearer form.
Notices
Except as otherwise expressly provided herein or the Fiscal Agency Agreement, whenever the FiscalAgency Agreement or the Note requires that the Bank or the Fiscal Agent give notice to the holder of theNotes, the Bank or the Fiscal Agent will cause such notice to be mailed to the holders of Notes at theirrespective addresses as they appear in the Note Register.
For so long as all of the Notes are represented in registered form and held on behalf of a clearing systems,any notices or reports to holders of the Notes may alternatively be given by delivery thereof to the clearingsystems in accordance with the applicable rules and procedures of the clearing systems.
Governing Law, Jurisdiction and Other Matters
The Fiscal Agency Agreement and the Notes will be governed by, and construed in accordance with, thelaws of the State of New York. The Bank will agree that any legal action, suit, or proceeding arising out ofor based upon the Fiscal Agency Agreement or the Notes may be instituted in any New York State or U.S.Federal court located in the Borough of Manhattan, The City of New York. The Bank will appoint ShinhanBank, New York Branch as its authorized agent upon whom process may be served in connection with anysuch action and will irrevocably consent to the jurisdiction of any such court in respect of any suchproceeding. The Bank will also waive, to the extent permissible under applicable law, any objection whichthe Bank may now or hereafter have to the laying of venue of any such proceeding and any claim that suchproceeding brought in such court has been brought in an inconvenient forum. To the extent that the Bankhas or hereafter may acquire any immunity (sovereign or otherwise) from any legal action, suit orproceeding, from jurisdiction of any court or from set-off or any legal process (whether service or notice,attachment in aid or otherwise) against the Bank or any of its assets which may arise in connection with theNotes or the Fiscal Agency Agreement, the Bank hereby irrevocably waives and agrees, to fullest extentallowed under applicable law, not to plead or claim such immunity.
Paying and Transfer Agents
The Fiscal Agent will serve as the initial principal paying agent and transfer agent (together with anyadditional paying agent and transfer agent, the “Paying and Transfer Agents”). The Paying and TransferAgents may resign at any time or may be removed by the Bank. If the Paying and Transfer Agents areremoved or become incapable of acting as Paying and Transfer Agents or if a vacancy occurs in the officeof the Paying and Transfer Agents for any cause, a successor Paying and Transfer Agent as provided by theFiscal Agency Agreement; provided that we will maintain a Paying and Transfer Agent having a specifiedoffice in Singapore so long as the Notes are listed on the SGX-ST and the rules of the SGX-ST so require.
164
TAXATION
Korean Taxation
Republic of Korea
The information provided below does not purport to be a complete summary of Korean tax law and practicecurrently applicable. Prospective investors who are in any doubt as to their tax position should consult withtheir own professional advisors.
The taxation of non resident individuals and non Korean corporations (“Non-Residents”) depends onwhether they have a “permanent establishment” (as defined under Korean law and applicable tax treaty) inKorea to which the relevant Korean source income is attributable or with which such income is effectivelyconnected. Non-Residents without a permanent establishment in Korea are taxed in the manner describedbelow. Non-Residents with permanent establishments in Korea are taxed in accordance with different rules.
Tax on Interest
Interest on the Notes paid to Non-Residents, being foreign currency denominated bonds, is exempt fromincome tax and corporation tax (whether payable by withholding or otherwise) pursuant to the Special TaxTreatment Control Law (the “STTCL”), so far as the Notes are “foreign currency denominated bonds” underthe STTCL. The term “foreign currency denominated bonds” in this context is not defined under theSTTCL. In this regard, the Korean tax authority issued a ruling on September 1, 1990 to the effect that “anotes issuance facility, commercial paper issued in U.S. dollars or euros or a banker’s acceptance” are nottreated as the “foreign currency denominated bonds”.
If the tax exemption under the STTCL referred to above were to cease to be in effect, the rate of income taxor corporation tax applicable to interest on the Notes, for a Non-Resident without a permanentestablishment in Korea, would be 14% of income. In addition, a tax surcharge called a residents’ tax wouldbe imposed at the rate of 10% of the income tax or corporation tax (raising the total tax rate to 15.4%). Thetax is withheld by the payer or us.
The tax rates may be reduced by an applicable tax treaty, convention or agreement between Korea and thecountry of the recipient of the income. The relevant tax treaties are discussed below.
Tax on Capital Gains
Korean tax laws currently exclude from Korean taxation gains made by a Non-Resident without apermanent establishment in Korea from the sale of the Notes to other Non-Residents (other than to theirpermanent establishments in Korea). In addition, capital gains earned by Non-Residents with or withoutpermanent establishments in Korea from the transfer taking place outside Korea of the Notes are currentlyexempt from taxation by virtue of STTCL, provided that the issuance of the Notes is deemed to be anoverseas issuance under the STTCL.
If the exclusion or exemption from Korean taxation referred to above were to cease to be in effect, in theabsence of an applicable tax treaty reducing or eliminating tax on capital gains, the applicable rate of taxwould be the lower of 11% (including resident surtax) of the gross realization proceeds or (subject to theproduction of satisfactory evidence of the acquisition cost and certain direct transaction costs of the relevantNote) 22% (including resident surtax) of the realized gain (i.e., the excess of the gross realization proceedsover the acquisition cost and certain direct transaction costs) made. If such evidence shows that no gain (ora loss) was made on the sale, no Korean tax is payable. There is no provision under relevant Korean law toallow offsetting of gains and losses or otherwise aggregating transactions for the purpose of computing thenet gain attributable to sales of the Notes issued by Korean companies. The purchaser or any otherdesignated withholding agent of the Notes is obliged under Korean law to withhold the applicable amountof Korean tax and make payment thereof to the relevant Korean tax authority. Unless the seller can claimthe benefit of an exemption from tax under an applicable tax treaty or on the failure of the seller to producesatisfactory evidence of his acquisition cost and certain direct transaction costs in relation to the instrumentsbeing sold, the purchaser or such withholding agent must withhold an amount equal to 11% of the grossrealization proceeds. Any amounts withheld by the purchaser or such withholding agent must be paid to the
165
competent Korean tax office. The purchaser or withholding agent must pay any withholding tax no laterthan the tenth day of the month following the month in which the payment for the purchase of the relevantinstruments occurred. Failure to transmit the withheld tax to the Korean tax authorities in time subjects thepurchaser or such withholding agent to penalties under Korean tax laws. The Korean tax authorities mayattempt to collect such tax from a Non-Resident who is liable for payment of any Korean tax on gains, as apurchaser or withholding agent who is obliged to withhold such tax, through proceedings against paymentsdue to the Non-Resident from its Korean investments and the assets or revenues of any of theNon-Resident’s branch or representative offices in Korea.
Inheritance Tax and Gift Tax
Korean inheritance tax is imposed upon (a) all assets (wherever located) of the deceased if at the time of hisdeath he was domiciled in Korea and (b) all property located in Korea that passes on death (irrespective ofthe domicile of the deceased). Gift tax is imposed in similar circumstances to the above. The taxes areimposed if the value of the relevant property is above a certain limit and the rate varies from 10% to 50%.At present, Korea has not entered into any tax treaties regarding its inheritance or gift taxes.
Under Korean inheritance and gift tax laws, bonds issued by Korean corporations are deemed located inKorea irrespective of where they are physically located or by whom they are owned, and, consequently, theKorean inheritance and gift taxes will be imposed on transfers of the Notes by inheritance or gift.Prospective purchasers should consult their personal tax advisors regarding the consequences of theimposition of the Korean inheritance or gift tax.
Stamp Duty and Securities Transaction Tax
No stamp, issue or registration duties will be payable in Korea by the Holders in connection with the issueof the Notes except for a nominal amount of stamp duty on certain documents executed in Korea which willbe paid by us. No securities transaction tax will be imposed upon the transfer of the Notes.
Tax Treaties
At the date of this offering circular, Korea has tax treaties with, among others Australia, Austria, Belgium,Canada, Denmark, Finland, France, Germany, Ireland, Italy, Japan, Luxembourg, The Netherlands, NewZealand, Norway, Singapore, Sweden, Switzerland, the United Kingdom and the United States of America,under which the rate of withholding tax on interest is reduced, generally to between 5% and 16.5%(including residents’ tax), and the tax on capital gains is often eliminated. Under the tax treaty with theUnited States, in general Korean withholding tax on interest (excluding residents’ tax) may not exceed arate of 12% and the tax on capital gains is eliminated, provided that the Holders are beneficial owners of therelevant interest income and capital gain.
Each Holder should inquire whether he is entitled to the benefit of a tax treaty with respect to anytransaction involving the Notes. It is the responsibility of the party claiming the benefits of a tax treaty inrespect of interest payments to file with the payer or us a certificate as to his residence. In the absence ofsufficient proof, the payer or we must withhold taxes in accordance with the above discussion.
Further, in order for a Non-Resident to obtain the benefit of a tax exemption on certain Korean sourceincome (e.g., interest and capital gains) under an applicable tax treaty, Korean tax law requires suchNon-Resident (or its agents) to submit to the payer of such Korean source income an application for taxexemption under a tax treaty along with a certificate of tax residency of such Non-Resident issued by acompetent authority of the Non-Resident’s country of tax residence, subject to certain exceptions. The payerof such Korean source income, in turn, is required to submit such application to the relevant district taxoffice by the ninth day of the month following the date of the first payment of such income.
Withholding and Gross Up
As mentioned above, interest on the Notes is exempt from any withholding or deduction on account ofincome tax or corporation tax pursuant to STTCL. However, in the event that the payer or we are requiredby law to make any withholding or deduction for or on account of any Korean taxes (as more fully
166
described in “Description of the Notes — Additional Amounts”) we have agreed to pay (subject to thecustomary exceptions as set out in “Description of the Notes — Additional Amounts”) such AdditionalAmounts as may be necessary in order that the net amounts received by the Holder of any Note after suchwithholding or deduction shall equal the respective amounts which would have been received by suchHolder in the absence of such withholding or deduction.
United States Taxation
To ensure compliance with Internal Revenue Service Circular 230, you are hereby notified that anydiscussion of tax matters set forth in this offering circular was written in connection with thepromotion or marketing of the transactions or matters addressed herein and was not intended orwritten to be used, and cannot be used by any prospective investor, for the purpose of avoidingtax-related penalties under federal, state or local tax law. Each prospective investor should seekadvice based on its particular circumstances from an independent tax advisor.
The following is a summary of certain United States federal income tax consequences of the purchase,ownership and disposition of Notes as of the date hereof. Except where noted, this summary deals only withNotes that are held as capital assets by a U.S. holder (as defined below) who acquired our Notes uponoriginal issuance at their initial offering price.
A “U.S. holder” means a person that is for United States federal income tax purposes any of the following:
Š an individual citizen or resident of the United States;
Š a corporation (or any other entity treated as a corporation for United States federal income taxpurposes) created or organized in or under the laws of the United States, any state thereof or theDistrict of Columbia;
Š an estate the income of which is subject to United States federal income taxation regardless of itssource; or
Š a trust if it (1) is subject to the primary supervision of a court within the United States and one ormore United States persons have the authority to control all substantial decisions of the trust or (2) hasa valid election in effect under applicable United States Treasury regulations to be treated as a UnitedStates person.
With respect to U.S. holders, the discussion set forth below is applicable to U.S. holders (i) who areresidents of the United States for purposes of the current income tax treaty between the United States andKorea (the “Treaty”), (ii) whose Notes are not, for purposes of the Treaty, attributable to a permanentestablishment in Korea and (iii) who otherwise qualify for the full benefits of the Treaty.
This summary is based upon provisions of the Internal Revenue Code of 1986, as amended (the “Code”),and regulations, rulings and judicial decisions as of the date hereof. Those authorities may be changed,perhaps retroactively, so as to result in United States federal income tax consequences different from thosesummarized below. This summary does not address all aspects of United States federal income taxes anddoes not deal with foreign, state, or local or other tax considerations that may be relevant to U.S. holders inlight of their personal circumstances. In addition, it does not represent a detailed description of the UnitedStates federal income tax consequences applicable to you if you are subject to special treatment under theUnited States federal income tax laws. For example, this summary does not address all of the United Statesfederal income tax consequences applicable to:
Š holders who may be subject to special tax treatment, such as dealers in securities or currencies, tradersin securities that elect to use the mark-to-market method of accounting for their securities, financialinstitutions, regulated investment companies, real estate investment trusts, partnerships or other pass-through entities for United States federal income tax purposes, tax-exempt entities or insurancecompanies;
Š persons holding the Notes as part of a hedging, integrated, constructive sale or conversion transactionor a straddle;
167
Š holders of the Notes whose “functional currency” is not the United States dollar; or
Š alternative minimum tax consequences, if any.
If a partnership holds our Notes, the tax treatment of a partner will generally depend upon the status of thepartner and the activities of the partnership. If you are a partner of a partnership holding our Notes, youshould consult your tax advisors.
If you are considering the purchase of Notes, you should consult your own tax advisors concerning theparticular United States federal income tax consequences to you of the ownership of the Notes, as wellas the consequences to you arising under the laws of any other taxing jurisdiction.
Payments of Interest
If the principal amount of the Notes exceeds their “issue price” (the first price at which a substantial amountof the Notes is sold to the public) by an amount equal to or greater than 0.25% of the principal amount ofthe Notes multiplied by the number of complete years to maturity, the Notes will be treated as having beingissued with original issue discount (“OID”) in an amount equal to such difference. The Notes are notexpected to be, and the following discussion assumes that the Notes will not be, issued with OID for UnitedStates federal income tax purposes. Accordingly, interest on a Note will generally be taxable to you asordinary income at the time it is paid or accrued in accordance with your method of accounting for taxpurposes. If, however, the Notes are issued with OID, you generally must accrue the OID in gross incomeover the term of the Notes on a constant yield basis, regardless of your regular method of tax accounting. Asa result, you generally would recognize taxable income in respect of a Note in advance of the receipt ofcash attributable to such income.
Although interest payments are currently exempt from Korean taxation, if the Korean law providing for theexemption is repealed, then, in addition to interest payments on the Notes, you will be required to include inincome any Additional Amounts and any Korean tax withheld from interest payments notwithstanding thatyou in fact did not receive such withheld tax. You may be entitled to deduct or credit this tax, subject tocertain limitations (including that the election to deduct or credit foreign taxes applies to all of your foreigntaxes for a particular tax year). Interest income (including any Additional Amounts and any Korean taxeswithheld in respect thereof) on a Note generally will be considered foreign source income and, for purposesof the United States foreign tax credit, generally will be considered passive category income. As a U.S.holder that is entitled to the benefits of the Treaty, any United States foreign tax credit that you are entitledto generally will not exceed the rate of tax applicable under the Treaty. You will generally be denied aforeign tax credit for foreign taxes imposed with respect to the Notes where you do not meet a minimumholding period requirement during which you are not protected from risk of loss. The rules governing theforeign tax credit are complex. You are urged to consult your tax advisors regarding the availability of theforeign tax credit under your particular circumstances.
Sale, Exchange and Retirement of Notes
Your tax basis in a Note will, in general, be your cost for that Note. Upon the sale, exchange, retirement orother disposition of a Note, you will recognize gain or loss equal to the difference between the amount yourealize upon the sale, exchange, retirement or other disposition (less an amount equal to any accrued but unpaidinterest, which will be taxable as interest income to the extent not previously included in income) and theadjusted tax basis of the Note. Such gain or loss will be capital gain or loss and will generally be treated asUnited States source gain or loss. Consequently, you may not be able to claim a credit for any Korean taximposed upon a disposition of a Note unless such credit can be applied (subject to applicable limitation) againsttax due on other income treated as derived from foreign sources. Capital gains of individuals derived in respectof capital assets held for more than one year are eligible for reduced rates of taxation. The deductibility of capitallosses is subject to limitations.
Backup Withholding and Information Reporting
Information reporting requirements may apply to payments the Bank makes to you and the proceeds from asale of a Note paid to you, unless you are an exempt recipient such as a corporation. Additionally, if you
168
fail to provide your taxpayer identification number, or in the case of interest payments, fail either to reportin full dividend and interest income or to make certain certifications to establish an exemption from backupwithholding, you may be subject to backup withholding.
Any amounts withheld under the backup withholding rules will be allowed as a refund or a credit againstyour United States federal income tax liability provided the required information is furnished to the InternalRevenue Service.
EU Savings Directive
Under European Council Directive 2003/48/EC on the taxation of savings income, each Member State ofthe European Union is required to provide to the tax authorities of another Member State details ofpayments of interest or other similar income paid by a person within its jurisdiction to an individualbeneficial owner resident in that other Member State; however, for a transitional period, Austria, Belgiumand Luxembourg will instead apply a withholding system in relation to such payments, deducting tax atrates rising over time to 35%, unless during such period they elect otherwise.
A number of non-EU countries, and certain dependent or associated territories of certain Member States,have agreed to adopt similar measures (either provision of information or transitional withholding) inrelation to payments made by a person within its jurisdiction to an individual beneficial owner resident in aMember State. In addition, the Member States have entered into reciprocal provision of information ortransitional withholding arrangements with certain of those dependent or associated territories in relation topayments made by a person in a Member State to an individual beneficial owner resident in one of thoseterritories.
169
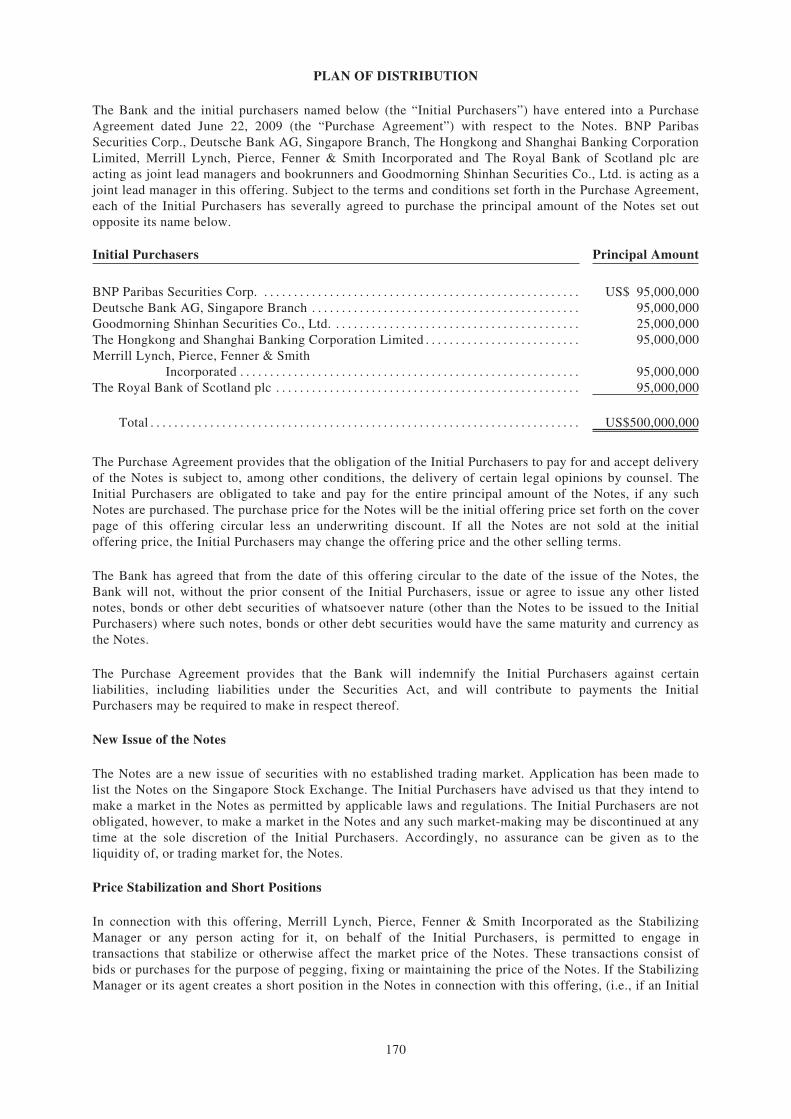
PLAN OF DISTRIBUTION
The Bank and the initial purchasers named below (the “Initial Purchasers”) have entered into a PurchaseAgreement dated June 22, 2009 (the “Purchase Agreement”) with respect to the Notes. BNP ParibasSecurities Corp., Deutsche Bank AG, Singapore Branch, The Hongkong and Shanghai Banking CorporationLimited, Merrill Lynch, Pierce, Fenner & Smith Incorporated and The Royal Bank of Scotland plc areacting as joint lead managers and bookrunners and Goodmorning Shinhan Securities Co., Ltd. is acting as ajoint lead manager in this offering. Subject to the terms and conditions set forth in the Purchase Agreement,each of the Initial Purchasers has severally agreed to purchase the principal amount of the Notes set outopposite its name below.
Initial Purchasers Principal Amount
BNP Paribas Securities Corp. . . . . . . . . . . . . . . . . . . . . . . . . . . . . . . . . . . . . . . . . . . . . . . . . . . . . . US$ 95,000,000Deutsche Bank AG, Singapore Branch . . . . . . . . . . . . . . . . . . . . . . . . . . . . . . . . . . . . . . . . . . . . . 95,000,000Goodmorning Shinhan Securities Co., Ltd. . . . . . . . . . . . . . . . . . . . . . . . . . . . . . . . . . . . . . . . . . 25,000,000The Hongkong and Shanghai Banking Corporation Limited . . . . . . . . . . . . . . . . . . . . . . . . . . 95,000,000Merrill Lynch, Pierce, Fenner & Smith
Incorporated . . . . . . . . . . . . . . . . . . . . . . . . . . . . . . . . . . . . . . . . . . . . . . . . . . . . . . . . . 95,000,000The Royal Bank of Scotland plc . . . . . . . . . . . . . . . . . . . . . . . . . . . . . . . . . . . . . . . . . . . . . . . . . . . 95,000,000
Total . . . . . . . . . . . . . . . . . . . . . . . . . . . . . . . . . . . . . . . . . . . . . . . . . . . . . . . . . . . . . . . . . . . . . . . . US$500,000,000
The Purchase Agreement provides that the obligation of the Initial Purchasers to pay for and accept deliveryof the Notes is subject to, among other conditions, the delivery of certain legal opinions by counsel. TheInitial Purchasers are obligated to take and pay for the entire principal amount of the Notes, if any suchNotes are purchased. The purchase price for the Notes will be the initial offering price set forth on the coverpage of this offering circular less an underwriting discount. If all the Notes are not sold at the initialoffering price, the Initial Purchasers may change the offering price and the other selling terms.
The Bank has agreed that from the date of this offering circular to the date of the issue of the Notes, theBank will not, without the prior consent of the Initial Purchasers, issue or agree to issue any other listednotes, bonds or other debt securities of whatsoever nature (other than the Notes to be issued to the InitialPurchasers) where such notes, bonds or other debt securities would have the same maturity and currency asthe Notes.
The Purchase Agreement provides that the Bank will indemnify the Initial Purchasers against certainliabilities, including liabilities under the Securities Act, and will contribute to payments the InitialPurchasers may be required to make in respect thereof.
New Issue of the Notes
The Notes are a new issue of securities with no established trading market. Application has been made tolist the Notes on the Singapore Stock Exchange. The Initial Purchasers have advised us that they intend tomake a market in the Notes as permitted by applicable laws and regulations. The Initial Purchasers are notobligated, however, to make a market in the Notes and any such market-making may be discontinued at anytime at the sole discretion of the Initial Purchasers. Accordingly, no assurance can be given as to theliquidity of, or trading market for, the Notes.
Price Stabilization and Short Positions
In connection with this offering, Merrill Lynch, Pierce, Fenner & Smith Incorporated as the StabilizingManager or any person acting for it, on behalf of the Initial Purchasers, is permitted to engage intransactions that stabilize or otherwise affect the market price of the Notes. These transactions consist ofbids or purchases for the purpose of pegging, fixing or maintaining the price of the Notes. If the StabilizingManager or its agent creates a short position in the Notes in connection with this offering, (i.e., if an Initial
170
Purchaser or its agent sells more Notes than are set forth on the cover page of this offering circular), theStabilizing Manager or its agent may reduce that short position by purchasing the Notes in the open market.In general, purchases of a Note for the purpose of stabilization or to reduce a short position could cause theprice of the Notes to be higher than it might be in the absence of such purchases. If the activities arecommenced, they may be discontinued by the Stabilizing Manager or its agent at any time. Thesetransactions may be effected in the over-the-counter market at any time. The Stabilizing Manager or itsagent also may impose a penalty bid. This occurs when a particular Initial Purchaser repays to theStabilizing Manager or its agent a portion of the underwriting discount received by it because theStabilizing Manager or its agent has repurchased the Notes sold by or for the account of such InitialPurchaser in stabilizing or short covering transactions. Neither the Bank nor the Stabilizing Manager makesany representation or prediction as to the direction or magnitude of any effect that the transactionsdescribed above may have on the price of the Notes. In addition, neither the Bank nor the StabilizingManager makes any representation that the Stabilizing Manager or its agent will engage in such transactionsor that such transactions, once commenced, will not be discontinued without notice.
Other Relationships
In the ordinary course of business, some of the Initial Purchasers and certain of their affiliates may engagefrom time to time in various financing and investment banking transactions with the Bank and its affiliates,for which they have received customary compensation. It is expected that the Initial Purchasers and theiraffiliates will continue to provide such services to, and enter into such transactions with the Bank and itsaffiliates in the future.
Delivery of the Notes
We expect that the Notes will be delivered against payment in same-day funds, on or about June 29, 2009,which we expect will be the fifth business day following the date of this offering circular. Under Rule15c6-1 promulgated under the Exchange Act, investors are generally required to settle trades in thesecondary market in three business days, unless investors and the other parties to any such trade expresslyagree otherwise. Accordingly, if investors wish to trade the Notes on the date of this offering circular or onthe next succeeding business day, because the Notes will initially settle in T+5, investors may be required tospecify an alternate settlement cycle at the time of investor’s trade to prevent a failed settlement.
Selling Restrictions
General
No action has been taken or will be taken in any jurisdiction by us or the Initial Purchaser that would permita public offering of the Notes, or the possession, circulation or distribution of this offering circular or anyother material relating to the Notes or this offering, in any jurisdiction where action for that purpose isrequired. Accordingly, the Notes may not be offered or sold, directly or indirectly, and neither this offeringcircular nor such other material may be distributed or published, in or from any country or jurisdictionexcept in compliance with any applicable rules and regulations of such country or jurisdiction.
United States
The Notes have not been and will not be registered under the Securities Act and may not be offered or soldwithin the United States except in transactions exempt from, or not subject to, the registration requirementsof the Securities Act and applicable state securities laws. In addition, an offer or sale of Notes within theUnited States by a dealer (whether or not participating in this offering) may violate the registrationrequirements of the Securities Act if such offer or sale is made otherwise than in accordance withRule 144A.
The Initial Purchasers, through their respective affiliates acting as selling agents, where applicable, proposeto offer the Notes to certain persons in offshore transactions in reliance on Regulation S and in accordancewith applicable law and propose to offer the Notes to qualified institutional buyers in the United States
171
pursuant to Rule 144A. Each of the Initial Purchasers has severally represented and agreed that, except aspermitted under the Purchase Agreement, it will not offer, sell or deliver the Notes within the United States.Any offer or sale of the Notes in the United States in reliance on Rule 144A will be made by broker-dealerswho are registered as such under the Exchange Act. Terms used in this paragraph have the meanings givento them by Regulation S. Transfer of the Notes will be restricted as described under “Notice to Investors”.
United Kingdom
Each of the Initial Purchasers has severally represented and agreed that:
(a) it has only communicated or caused to be communicated and will only communicate or cause tobe communicated an invitation or inducement to engage in investment activity (within themeaning of Section 21 of the Financial Services and Markets Act of 2000 (the “FSMA”))received by it in connection with the issue or sale of the Notes in circumstances in whichSection 21(1) of the FSMA does not apply to us; and
(b) it has complied and will comply with all applicable provisions of the FSMA with respect toanything done by it in relation to the Notes in, from or otherwise involving the United Kingdom.
Korea
The Notes may not be offered, sold or delivered, directly or indirectly, in Korea or to, or for the account orbenefit of, any Korean resident (as such term is defined in the Foreign Exchange Transaction Law andregulation of Korea and its enforcement decree) for a period of one year from the date of issuance of theNotes, except as otherwise permitted by applicable Korean laws and regulations. Each of the InitialPurchasers has severally represented and agreed that it will not, directly or indirectly, offer, sell or deliverany Notes in Korea or to, or for the account or benefit of, any resident of Korea, or to others for reofferingor resale, directly or indirectly, in Korea or to, or for the account or benefit of, any resident of Korea otherthan certain qualified professional investors as set forth in Article 11, Paragraph 1, Item 1, Sub-items Kaand Na of the presidential decree of the Financial Investment Services and Capital Markets Act for a periodof one year from the date of issuance of the Notes, except as otherwise permitted by applicable Korean lawsand regulations.
Hong Kong
Each of the Initial Purchasers has severally represented and agreed that: (i) it has not offered or sold andwill not offer or sell in Hong Kong, by means of any document, any Notes other than (a) to “professionalinvestors” as defined in the Securities and Futures Ordinance (Cap. 571) of Hong Kong and any rules madeunder that Ordinance; or (b) in other circumstances which do not result in the document being a“prospectus” as defined in the Companies Ordinance (Cap. 32) of Hong Kong or which do not constitute anoffer to the public within the meaning of that Ordinance; and (ii) it has not issued or had in its possessionfor the purposes of issue, and will not issue or have in its possession for the purposes of issue, whether inHong Kong or elsewhere, any advertisement, invitation or document relating to the Notes, which is directedat, or the contents of which are likely to be accessed or read by, the public of Hong Kong (except ifpermitted to do so under the securities laws of Hong Kong) other than with respect to the Notes which areor are intended to be disposed of only to persons outside Hong Kong or only to “professional investors” asdefined in the Securities and Futures Ordinance and any rules made under that Ordinance.
Singapore
Each of the Initial Purchasers has severally acknowledged that this offering circular has not been and willnot be registered as a prospectus with the Monetary Authority of Singapore under the Securities and FuturesAct, Chapter 289 of Singapore (the “SFA”). Accordingly, each of the Initial Purchasers has severallyrepresented and agreed that it has not offered or sold any Notes or caused the Notes to be made the subjectof an invitation for subscription or purchase, nor will it offer or sell the Notes or cause the Notes to be madethe subject of an invitation for subscription or purchase, and has not circulated or distributed, nor will it
172
circulate or distribute, this offering circular or any other document or material in connection with the offeror sale or invitation for subscription or purchase of the Notes, whether directly or indirectly, to persons inSingapore other than (i) to an institutional investor pursuant to Section 274 of the SFA, (ii) to a relevantperson, or any person pursuant to Section 275(1A) of the SFA, and in accordance with the conditionsspecified in Section 275 of the SFA or (iii) pursuant to, and in accordance with the conditions of, any otherapplicable provision of the SFA.
Each of the following relevant persons specified in Section 275 of the SFA which has subscribed orpurchased Notes, namely a person who is:
(a) a corporation (which is not an accredited investor) the sole business of which is to holdinvestments and the entire share capital of which is owned by one or more individuals, each ofwhom is an accredited investor; or
(b) a trust (where the trustee is not an accredited investor) whose sole purpose is to holdinvestments and each beneficiary is an individual who is an accredited investor,
should note that shares, debentures and units of shares and debentures of that corporation or thebeneficiaries’ rights and interest in that trust shall not be transferable for six months after that corporationor that trust has acquired the Notes under Section 275 of the SFA except:
(1) to an institutional investor under Section 274 of the SFA or to a relevant person, or to anyperson pursuant to Section 275(1A) of the SFA, and in accordance with the conditions specifiedin Section 275 of the SFA;
(2) where no consideration is or will be given for the transfer; or
(3) by operation of law.
Japan
The Notes have not been and will not be registered under the Financial Instruments and Exchange Act ofJapan (Law No. 25 of 1948, as amended) (the “FIEA”). Each of the Initial Purchasers has severallyrepresented and agreed that it has not offered or sold and will not offer or sell any Notes, directly orindirectly, in Japan or to, or for the benefit of, any resident of Japan (which term as used herein means anyperson resident in Japan, including any corporation or other entity organized under the laws of Japan) or toothers for re-offering or resale, directly or indirectly, in Japan or to, or for the benefit of, a resident ofJapan, except pursuant to an exemption from the registration requirements of, and otherwise in compliancewith, the FIEA and other applicable laws, regulations and ministerial guidelines of Japan.
173
NOTICE TO INVESTORS
Because of the following restrictions, investors are advised to consult legal counsel prior to making anyoffer, resale, pledge or other transfer of the Notes offered pursuant to this offering circular.
Korea
A registration statement for the offering and sale of the Notes has not been filed with the Financial ServicesCommission of Korea.
Each purchaser of the Notes hereunder will be deemed to have represented and agreed as follows:
(1) the Notes may not be offered, sold or delivered, directly or indirectly, in Korea or to, or for theaccount or benefit of, any resident of Korea (as such term is defined under the Foreign ExchangeTransaction Law and Regulation of Korea and its Enforcement Decree), for a period of one yearfrom the date of issuance of the Notes, except as otherwise permitted by applicable Korean lawsand regulations. Furthermore, a holder of the Notes shall be prohibited from offering, deliveringor selling any Notes, directly or indirectly, in Korea or to, or for the account or benefit of, anyresident of Korea other than certain qualified professional investors as set forth in Article 11,Paragraph 1, Item 1, Sub-items Ka and Na of the presidential decree of the Financial InvestmentServices and Capital Markets Act of Korea for a period of one year from the date of issuance ofthe Notes, except as otherwise permitted by applicable Korean laws and regulations.
(2) it understands that the Notes will, unless otherwise agreed by us, bear a legend substantially tothe following effect:
A REGISTRATION STATEMENT FOR THE OFFERING AND SALE OF THE NOTES HASNOT BEEN FILED WITH THE FINANCIAL SERVICES COMMISSION OF KOREA.ACCORDINGLY, THE NOTES MAY NOT BE OFFERED, SOLD OR DELIVERED,DIRECTLY OR INDIRECTLY, IN KOREA OR TO, OR FOR THE ACCOUNT OR BENEFITOF, ANY RESIDENT OF KOREA (AS SUCH TERM IS DEFINED UNDER THE FOREIGNEXCHANGE TRANSACTION LAW AND REGULATION OF KOREA AND ITSENFORCEMENT DECREE), FOR A PERIOD OF ONE YEAR FROM THE DATE OFISSUANCE OF THE NOTES, EXCEPT AS OTHERWISE PERMITTED BY APPLICABLEKOREAN LAWS AND REGULATIONS. FURTHERMORE, A HOLDER OF THE NOTESSHALL BE PROHIBITED FROM OFFERING, DELIVERING OR SELLING ANY NOTES,DIRECTLY OR INDIRECTLY, IN KOREA OR TO, OR FOR THE ACCOUNT OR BENEFITOF, ANY RESIDENT OF KOREA OTHER THAN CERTAIN QUALIFIED PROFESSIONALINVESTORS AS SET FORTH IN ARTICLE 11, PARAGRAPH 1, ITEM 1, SUB-ITEMS KAAND NA OF THE PRESIDENTIAL DECREE OF THE FINANCIAL INVESTMENTSERVICES AND CAPITAL MARKETS ACT FOR A PERIOD OF ONE YEAR FROM THEDATE OF ISSUANCE OF THE NOTES, EXCEPT AS OTHERWISE PERMITTED BYAPPLICABLE KOREAN LAWS AND REGULATIONS.
United States
The Notes have not been and will not be registered under the Securities Act or the securities laws of anystate of the United States or the securities laws of any other jurisdiction. The Notes may not be offered orsold within the United States, except in reliance on Rule 144A to QIBs. The Notes may also be offered andsold in offshore transactions in reliance on Regulation S.
Each purchaser of the Notes hereunder will be deemed to have represented and agreed as follows (termsused in this paragraph that are defined in Rule 144A or in Regulations S under the Securities Act are used inthis offering circular as defined in the Securities Act):
(1) it is purchasing the Notes for its own account or an account with respect to which it exercisessole investment discretion, and it and any such account (i) is a QIB, and is aware that the sale toit is being made in reliance on Rule 144A or (ii) is outside the United States;
174
(2) it acknowledges that the Notes have not been and will not be registered under the Securities Actor with any securities regulatory authority of any jurisdiction and may not be offered or soldwithin the United States except as set forth below;
(3) it understands and agrees that if in the future it decides to sell, pledge or otherwise transfer anyNotes or any beneficial interest in any Notes, such Notes may be offered, resold, pledged ortransferred only (A)(i) to us, (ii) to a person whom the seller reasonably believes is a QIB in atransaction meeting the requirements of Rule 144A, (iii) in an offshore transaction meeting therequirements of Rule 903 or 904 of Regulation S under the Securities Act, (iv) pursuant to anexemption from registration under the Securities Act provided by Rule 144 under the SecuritiesAct (if available) or (v) pursuant to another exemption from the Securities Act, provided that, asa condition to the registration of the transfer thereof, we or the Fiscal Agent may require thedelivery of any documents, including an opinion of counsel that it, in its sole discretion, maydeem necessary or appropriate to evidence compliance with such exemption, or (B) pursuant toan effective registration statement under the Securities Act, and, in each of such cases inaccordance with any applicable securities laws of any state of the United States;
(4) it agrees to, and each subsequent holder is required to, notify any purchaser of the Notes from itof the resale restrictions referred to in clause (3)(A) above, if then applicable;
(5) it understands and agrees that Notes initially offered in the United States to QIBs will berepresented by one or more Rule 144A Global Notes and that Notes initially offered outside theUnited States in reliance on Regulation S will be represented by one or more Regulation SGlobal Notes;
(6) it understands that the Rule 144A Global Notes will, unless otherwise agreed by us, bear alegend substantially to the following effect:
“THIS SECURITY HAS NOT BEEN REGISTERED UNDER THE U.S. SECURITIES ACT OF1933, AS AMENDED (THE “SECURITIES ACT”). THE HOLDER HEREOF, BYPURCHASING THIS SECURITY, AGREES FOR THE BENEFIT OF SHINHAN BANK (THE“BANK”) THAT THIS SECURITY MAY BE OFFERED, RESOLD, PLEDGED OROTHERWISE TRANSFERRED ONLY (A)(i) TO THE BANK, (ii) TO A PERSON WHOMTHE SELLER REASONABLY BELIEVES IS A QUALIFIED INSTITUTIONAL BUYER, ASDEFINED IN RULE 144A UNDER THE SECURITIES ACT, IN A TRANSACTIONMEETING THE REQUIREMENTS OF RULE 144A UNDER THE SECURITIES ACT, (iii) INAN OFFSHORE TRANSACTION MEETING THE REQUIREMENTS OF RULE 903 OR 904OF REGULATION S UNDER THE SECURITIES ACT, (iv) PURSUANT TO ANEXEMPTION FROM REGISTRATION UNDER THE SECURITIES ACT PROVIDED BYRULE 144 UNDER THE SECURITIES ACT (IF AVAILABLE) OR (v) PURSUANT TOANOTHER EXEMPTION FROM THE SECURITIES ACT, PROVIDED THAT, AS ACONDITION TO THE REGISTRATION OF THE TRANSFER THEREOF, THE BANK ORTHE FISCAL AGENT MAY REQUIRE THE DELIVERY OF ANY DOCUMENTS,INCLUDING AN OPINION OF COUNSEL THAT IT, IN ITS SOLE DISCRETION, MAYDEEM NECESSARY OR APPROPRIATE TO EVIDENCE COMPLIANCE WITH SUCHEXEMPTION, OR (B) PURSUANT TO AN EFFECTIVE REGISTRATION STATEMENTUNDER THE SECURITIES ACT, AND, IN EACH OF SUCH CASES IN ACCORDANCEWITH ANY APPLICABLE SECURITIES LAWS OF ANY STATE OF THE UNITEDSTATES. THE HOLDER AGREES TO, AND EACH SUBSEQUENT HOLDER IS REQUIREDTO, NOTIFY ANY PURCHASER OF THE NOTES FROM IT OF THE RESALERESTRICTIONS REFERRED TO IN (A) ABOVE, IF THEN APPLICABLE.”
(7) it understands that the Regulation S Global Notes will bear a legend to the following effectunless otherwise agreed to by us:
“THIS SECURITY (OR ITS PREDECESSOR) WAS ORIGINALLY ISSUED IN ATRANSACTION EXEMPT FROM REGISTRATION UNDER THE UNITED STATES
175
SECURITIES ACT OF 1933, AS AMENDED (THE “SECURITIES ACT”), AND MAY NOTBE TRANSFERRED IN THE UNITED STATES EXCEPT PURSUANT TO AN AVAILABLEEXEMPTION FROM THE REGISTRATION REQUIREMENTS OF THE SECURITIES ACTAND ALL APPLICABLE STATE SECURITIES LAWS. TERMS USED ABOVE HAVE THEMEANINGS GIVEN TO THEM IN REGULATIONS UNDER THE SECURITIES ACT.”
(8) it acknowledges that prior to any proposed transfer of any Certificated Notes in certificated formor of beneficial interests in the Global Notes (other than pursuant to an effective registrationstatement), the holder of the Notes or the holder of beneficial interests in the Global Notes, asthe case may be, may be required to provide certificates and other documentation relating to themanner of such transfer and submit such certifications and other documentation as provided inthe Fiscal Agency Agreement;
(9) either (i) no portion of the assets used by such purchaser or transferee to acquire or hold theNote or any beneficial interest therein constitutes assets of any employee benefit plan subject toTitle I of the U.S. Employee Retirement Income Security Act of 1974, as amended (“ERISA”),plan, individual retirement account or other arrangement subject to Section 4975 of the U.S.Internal Revenue Code of 1986, as amended (the “Code”) or provisions under any other federal,state, local, non-U.S. or other laws or regulations that are similar to such provisions of ERISA orthe Code (collectively, “Similar Laws”) or any entity whose underlying assets are considered toinclude “plan assets” of any such employee benefit plan, plan, account or arrangement or (ii) thepurchase and holding of the Notes or any beneficial interest therein by such purchaser will notconstitute a non exempt prohibited transaction under Section 406 of ERISA or Section 4975 ofthe Code or a similar violation of any applicable Similar Law; and
(10) it acknowledges that we, the Initial Purchasers, the Fiscal Agent and others will rely upon thetruth and accuracy of the foregoing acknowledgments, representations and agreements andagrees that if any of such acknowledgments, representations or warranties deemed to have beenmade by virtue of its purchase of the Notes are no longer accurate, it shall promptly notify us;and if it is acquiring any Notes as a fiduciary or agent for one or more accounts, it representsthat it has sole investment discretion with respect to each such account and that it has full powerto make the foregoing acknowledgments, representations and agreements on behalf of each suchaccount.
176
CERTAIN ERISA CONSIDERATIONS
The following is a summary of certain considerations associated with the purchase of the Notes byemployee benefit plans that are subject to Title I of the U.S. Employee Retirement Income Security Act of1974, as amended (“ERISA”), plans, individual retirement accounts and other arrangements that are subjectto Section 4975 of the U.S. Internal Revenue Code of 1986, as amended (the “Code”) or provisions underany other federal, state, local, non-U.S. or other laws or regulations that are similar to such provisions ofERISA or the Code (collectively, “Similar Laws”), and entities whose underlying assets are considered toinclude “plan assets” of any such plan, account or arrangement (each, a “Plan”).
General Fiduciary Matters
ERISA and the Code impose certain duties on persons who are fiduciaries of a Plan subject to Title I ofERISA or Section 4975 of the Code (an “ERISA Plan”) and prohibit certain transactions involving theassets of an ERISA Plan and its fiduciaries or other interested parties. Under ERISA and the Code, anyperson who exercises any discretionary authority or control over the administration of such an ERISA Planor the management or disposition of the assets of such an ERISA Plan, or who renders investment advicefor a fee or other compensation to such an ERISA Plan, is generally considered to be a fiduciary of theERISA Plan.
In considering an investment in the Notes of a portion of the assets of any Plan, a fiduciary shoulddetermine whether the investment is in accordance with the documents and instruments governing the Planand the applicable provisions of ERISA, the Code or any Similar Law relating to a fiduciary’s duties to thePlan including, without limitation, the prudence, diversification, delegation of control and prohibitedtransaction provisions of ERISA, the Code and any other applicable Similar Laws.
Prohibited Transaction Issues
Section 406 of ERISA and Section 4975 of the Code prohibit ERISA Plans from engaging in specifiedtransactions involving plan assets with persons or entities who are “parties in interest,” within the meaningof ERISA, or “disqualified persons,” within the meaning of Section 4975 of the Code, unless an exemptionis available. A party in interest or disqualified person who engaged in a non-exempt prohibited transactionmay be subject to excise taxes and other penalties and liabilities under ERISA and the Code. In addition, thefiduciary of the ERISA Plan that engaged in such a non-exempt prohibited transaction may be subject topenalties and liabilities under ERISA and the Code. The acquisition and/or holding of Notes by an ERISAPlan with respect to which the Issuer or the Initial Purchasers are considered a party in interest or adisqualified person may constitute or result in a direct or indirect prohibited transaction under Section 406of ERISA and/or Section 4975 of the Code, unless the investment is acquired and is held in accordance withan applicable statutory, class or individual prohibited transaction exemption. In this regard, the U.S.Department of Labor (the “DOL”) has issued prohibited transaction class exemptions, or “PTCEs,” that mayapply to the acquisition and holding of the Notes. These class exemptions include, without limitation, PTCE84-14 respecting transactions determined by independent qualified professional asset managers, PTCE 90-1respecting insurance company pooled separate accounts, PTCE 91-38 respecting bank collective investmentfunds, PTCE 95-60 respecting life insurance company general accounts and PTCE 96-23 respectingtransactions determined by in-house asset managers. In addition, Section 408(b)(17) of ERISA andSection 4975(d)(20) of the Code provide limited relief from the prohibited transaction provisions of ERISAand Section 4975 of the Code for certain transactions, provided that neither the issuer of the securities norany of its affiliates (directly or indirectly) have or exercise any discretionary authority or control or renderany investment advice with respect to the assets of any ERISA Plan involved in the transaction andprovided further that the ERISA Plan pays no more than adequate consideration in connection with thetransaction. There can be no assurance that all of the conditions of any such exemptions will be satisfied.
Because of the foregoing, the Notes should not be purchased or held by any person investing “plan assets”of any Plan, unless such purchase and holding will not constitute a non-exempt prohibited transaction underERISA and the Code or similar violation of any applicable Similar Laws.
177
Representation
Accordingly, by acceptance of a Note or any beneficial interest therein, each purchaser and subsequenttransferee of a Note or any beneficial interest therein will be deemed to have represented and warranted thateither (i) no portion of the assets used by such purchaser or transferee to acquire or hold the Note or anybeneficial interest therein constitutes assets of any Plan or (ii) the purchase and holding of the Notes or anybeneficial interest therein by such purchaser or transferee will not constitute a non-exempt prohibitedtransaction under Section 406 of ERISA or Section 4975 of the Code or a similar violation under anyapplicable Similar Laws.
The foregoing discussion is general in nature and is not intended to be all inclusive. Due to the complexityof these rules and the penalties that may be imposed upon persons involved in non-exempt prohibitedtransactions, it is particularly important that fiduciaries, or other persons considering purchasing the Noteson behalf of, or with the assets of, any Plan, consult with their counsel regarding the potential applicabilityof ERISA, Section 4975 of the Code and any Similar Laws to such investment and whether an exemptionwould be applicable to the purchase and holding of the Notes.
178
LEGAL MATTERS
Certain legal matters with respect to the issue and sale of the Notes will be passed upon for the Bank bySimpson Thacher & Bartlett LLP as to matters of United States federal and New York law and Yulchon asto matters of Korean law. Certain legal matters relating to the issue and sale of the Notes will be passedupon for the Initial Purchasers by Davis Polk & Wardwell as to matters of United States federal and NewYork state law and Kim & Change as to matters of Korean law. Yulchon may rely on the opinions ofSimpson Thacher & Bartlett LLP with respect to matters of United States federal and New York state law,and Simpson Thacher & Bartlett LLP may rely on the opinion of Yulchon with respect to matters of Koreanlaw.
INDEPENDENT ACCOUNTANTS
The non-consolidated financial statements of the Bank as of and for the year ended December 31, 2006,2007 and 2008 included in this offering circular have been audited by KPMG Samjong Accounting Corp.,independent accountants, as stated in their report appearing herein, which include explanatory paragraphsregarding the basis of non-consolidated financial statements presentation under Korean GAAP, theprocedures and practices utilized in the Republic of Korea to audit non-consolidated financial statementsand the translation into United States dollars for the convenience of the reader.
With respect to the non-consolidated interim financial statements as of March 31, 2009 and for the threemonths ended March 31, 2009 and 2008 included in this offering circular, the independent accountants havereported that they applied limited procedures in accordance with professional standards for a review of suchinformation. However, their separate report included herein, states that they did not audit and they do notexpress an opinion on those non-consolidated interim financial statements. Accordingly, the degree ofreliance on their report on such information should be restricted in light of the limited nature of the reviewprocedures applied. Their review report also includes explanatory paragraphs regarding the basis ofnon-consolidated financial statements presentation under Korean GAAP; the procedures and practicesutilized in the Republic of Korea to review non-consolidated financial statements and the translation intoUnited States dollars for the convenience of the reader.
KPMG Samjong Accounting Corp. is a member of the Korean Institute of Certified Public Accountants.
179
SUMMARY OF CERTAIN DIFFERENCES BETWEEN KOREAN GAAP AND U.S. GAAP
The non-consolidated financial statements of the Bank appearing elsewhere in this offering circular areprepared and presented in accordance with Korean GAAP.
Certain differences between Korean GAAP and U.S. GAAP, which would impact the Bank’s financialstatements included in this offering circular, are summarized below. Such differences involve methods forrecognizing and measuring the amounts shown in financial statements, as well as differing financialstatement presentation and disclosure requirements. Such summary should not be construed to beexhaustive. Accordingly, no assurance is provided that the following summary of differences betweenKorean GAAP and U.S. GAAP is complete. Had any such quantification or reconciliation been undertaken,other potential accounting and disclosure differences may have come to our management’s attention that arenot identified below. In addition, no attempt has been made to identify disclosure, presentation orclassification differences that would affect the manner in which transactions and events are presented in ourfinancial statements or notes thereto. Additionally, no attempt has been made to identify future differencesbetween Korean GAAP and U.S. GAAP as the result of prescribed changes in accounting standards.Regulatory bodies that promulgate Korean GAAP and U.S. GAAP have significant projects ongoing thatcould affect future comparisons such as this one. Finally, no attempt has been made to identify all futuredifferences between Korean GAAP and U.S. GAAP that may affect our financial statements as a result oftransactions or events that may occur in the future.
In making an investment decision, investors must rely upon their own examination of the Bank, the terms ofthis offering circular and the Bank’s financial statements included therein. Potential investors shouldconsult their own professional advisors for an understanding of the differences between Korean GAAP andU.S. GAAP, and how these differences might effect the financial information herein.
Financial Statements Presentation
Changes in Equity
Under Korean GAAP, shareholders’ equity consists of common stock, capital surplus, capital adjustment,accumulated other comprehensive income and retained earnings. Accumulated other comprehensive incomeconsists of unrealized holding gains and losses on available-for-sale securities, foreign currency translationreserve and cash flow hedge reserve, etc. Income tax (current and deferred) is recognized directly in equityif the related gain or loss is recognized directly in equity, in the current or a previous period.
Under U.S. GAAP, shareholders’ equity consists of common stock, additional-paid-in capital, retainedearnings and accumulated other comprehensive income. Accumulated other comprehensive income consistsof unrealized holding gains and losses on available-for-sale securities, foreign currency translation reserve,cash flow hedge reserve and deferred amounts from actuarial gains and losses, prior service cost andtransition amounts related to defined benefit postretirement benefit plans. Income tax (current and deferred)is recognized directly in accumulated other comprehensive income if the related gain or loss is recognizedas other comprehensive income for the period. However, subsequent changes in deferred tax related tochanges in tax rates, tax status, or from the assessment of the recoverability of a deferred tax asset arerecognized in profit or loss.
Business Combination
Under Korean GAAP, when the control over an entity is acquired through a series of transactions, suchacquisition is accounted for under the lump-sum method. Under U.S. GAAP, such acquisition is accountedfor under the step-acquisition method, and the minority interest in the entity prior to the acquisition ofcontrol is accounted retroactively under the equity method.
Under Korean GAAP, the value of consideration paid for acquisition of subsidiaries was measured based onthe Bank’s stock price on the consummation date of the merger, whereas under U.S. GAAP, the value ofconsideration was measured based on the Bank’s average closing stock price on the KRX KOSPI MarketDivision of the Korea Exchange two days before and after the date the merger was agreed to andannounced.
180
Under Korean GAAP, goodwill is amortized over its useful life during which future economic benefits areexpected to flow to the enterprise, not exceeding twenty years. Under U.S. GAAP, goodwill is notamortized, but rather it is tested for impairment at least annually. Under Korean GAAP, acquisition of theremaining interest in its consolidated subsidiary is accounted for under the book basis with no goodwillrecognized, rather, any excess amount paid results in a reduction of capital surplus. Furthermore,consolidation is required when the investor owns more than 30% of the investee’s voting shares and is alsothe largest shareholder. Under U.S. GAAP, acquisition of the remaining interest in its equity investee isaccounted for under the purchase method with the excess cost over the fair value of the net assets acquiredrecognized as goodwill. Generally, under U.S. GAAP, consolidation is required when the investor ownsmore than 50% of the investee’s voting shares, unless control does not rest with the majority owner.
Consolidation of Variable Interest Entities
Under Korean GAAP, there are no comprehensive standards or criteria for the consolidation of variableinterest entities including special purpose companies. Special purpose companies established under theKorea Asset Securitization Act for the purpose of holding certain financial assets and which are limited topassive activities are normally not consolidated if they do not otherwise meet the consolidation criteriaunder Korean GAAP. Financial statements of the trust accounts of a bank, on which the bank guarantees afixed rate of return and/or the repayment of principal, are accounted for as a controlled subsidiary.
Under U.S. GAAP, FASB Interpretation No. 46(R) Consolidation of Variable Interest Entities aninterpretation of ARB No. 51 clarifies application of the majority voting interest requirement in ARB 51 tocertain types of entities in which identification of the party with a controlling financial interest may beachieved through arrangements that do not involve voting interests. Variable interest entities, as defined,including non-qualifying special purpose companies, are subject to consolidation pursuant to FIN 46(R) ifthe equity investors as a group lack the characteristics of a controlling financial interest in the entity or donot have sufficient equity at risk to finance its activities without additional subordinated financial support.The principle behind the Interpretation is that if an investor absorbs a majority of expected losses and/orreceives a majority of expected residual returns in another entity, that investor should consolidate the entity.Financial statements of the trust accounts of a bank, on which the bank guarantees a fixed rate of return andthe repayment of principal, are consolidated.
Intangible Asset
Under Korean GAAP, an intangible asset, except for goodwill from business combination, shall berecognized only if (1) it is probable that future economic benefits that are attributable to the asset will flowinto the entity, (2) the cost of the asset can be measured reliably, and (3) it is an identifiable resourcecontrolled by the entity. The depreciable amount of an intangible asset shall be allocated on a systematicbasis over the best estimate of its useful life. The useful life of an intangible asset shall not exceed 20 yearsfrom the date when the asset is available for use, except in the case where, by contract or related laws, anentity has monopolistic and exclusive rights to control an intangible asset. Amortization shall commencewhen the asset is available for use.
Under Korean GAAP, if the recoverable amount of an intangible asset becomes less than its carryingamount as a result of obsolescence or sharp decline in market value of the asset or because of some othercauses of impairment, the carrying amount of the asset shall be reduced to its recoverable amount and thereduced amount shall be recognized as impairment loss. Recoveries after impairment loss recognition arepermitted. If an intangible asset is not in use and held for disposal, the intangible asset shall be carried at itscarrying amount as of the date when its use is suspended and tested for impairment at the end of each fiscalyear to recognize possible impairment loss.
Under U.S. GAAP, intangible assets except for goodwill are classified as two types: finite-lived intangibleassets and indefinite-lived intangible assets. If an identifiable intangible asset has an indefinite usefuleconomic life that is supported by clearly identifiable cash flows, then it is not subject to regular periodicamortization. Instead, the carrying amount of such intangible is to be tested for impairment at leastannually. An impairment loss would be recognized if the carrying amount exceeds the fair value. Finite-lived intangible assets are amortized over their estimated economic useful lives and are reviewed for
181
impairment whenever events or changes in circumstances indicate that the carrying amount of such assetsmay not be recoverable. Recoveries after impairment loss recognition are not permitted for all intangibleassets.
Allowance for Loan Losses
Under U.S. GAAP, the allowance for loan losses for specifically identified impaired loans is based on(i) the present value of expected future cash flows discounted at the loan’s effective interest rate or as apractical expedient, (ii) the loans observable market price or (iii) the fair value of the collateral if the loan iscollateral dependent.
For homogeneous pools of corporate and consumer loans, allowances are based on historical losses using arisk rating migration model adjusted for qualitative factors, while a delinquency roll-rate model adjusted forqualitative factors is used for homogeneous pools of credit cards.
Under Korean GAAP, the allowance for loan losses is recorded at the higher of (i) the amount determinedusing the expected loss method, which estimates the potential exposure at default (“EAD”), based on theprobability of default (“PD”), and loss given default (“LGD”), and (ii) the amount determined using theguidelines promulgated by the Financial Services Commission, which estimates the allowance bymultiplying a certain percentage as determined by the Financial Services Commission to loan balances ineach classification.
The following percentages represent guidelines required by the Financial Services Commission as ofDecember 31, 2008:
Corporate Loans Retail Loans
Normal(1) . . . . . . . . . . . . . . . . . . . . . . . . . . . . . . . . . . 0.85% or more 1.00% or morePrecautionary . . . . . . . . . . . . . . . . . . . . . . . . . . . . . . 7.00% or more 10.00% or moreSubstandard . . . . . . . . . . . . . . . . . . . . . . . . . . . . . . . . 20.00% or more 20.00% or moreDoubtful . . . . . . . . . . . . . . . . . . . . . . . . . . . . . . . . . . . 50.00% or more 55.00% or moreEstimated Loss . . . . . . . . . . . . . . . . . . . . . . . . . . . . . 100.00% 100.00%
Note:
(1) In the case of normal credits comprising loans to borrowers in the construction, wholesale and retail, accommodation andrestaurant or real estate and housing industries (as classified under the Korean Industry Classification Standard), the applicablefigure is 0.90% or more.
Loan Fees and Origination Costs
Under U.S. GAAP, loan origination fees net of direct loan origination costs are deferred and recognizedover the life of the loan as adjustment to yield (interest income) using the effective interest rate method.Direct loan origination costs include incremental direct costs of loan origination incurred in transactionswith independent third parties for that loan and certain costs directly related to specified activitiesperformed by the lender for that loan. Those activities are evaluating the prospective borrower’s financialcondition, evaluating and recording guarantees and collateral and negotiating loan terms, among others.Under Korean GAAP, loan origination costs related to wages and salaries are generally recognized asexpense when paid, further, other loan origination costs may be recognized as expense as incurred based onmateriality.
Accounting for Transfers of Financial Assets
Under Korean GAAP, the Bank records a transfer of financial assets as a sale when it surrenders controlover those financial assets to the extent that consideration other than beneficial interests in the transferred
182
asset is received in exchange. Otherwise, the transfer is accounted for as a collateralized borrowingtransaction. The Bank considers control surrendered when all conditions prescribed by the relevant Koreanaccounting standards are met. Those conditions focus on whether the transferred financial assets are isolatedbeyond the reach of the Bank and the Bank’s creditors, the constraints, if any, imposed on the transferee orbeneficial interest holders, and the Bank’s rights and obligations to reacquire transferred financial assets.However, transactions conducted in accordance with the Korean Asset Securitization Act are recorded assales which in principal focus mainly on the legal isolation criteria. Gains or losses on sales are determinedas the difference between the carrying amount of the assets sold and the net proceeds received.
Under U.S. GAAP, transfer of financial assets (on all or a portion of a financial asset) in which thetransferor surrenders control over financial assets is accounted for as a sale to the extent that considerationother than beneficial interests in the transferred assets is received in exchange. The transferor hassurrendered control, if and only if, all of the following conditions are met:
Š transferred assets have been isolated from the transferor presumptively beyond the reach of thetransferor and its creditors, even in bankruptcy or other receivership;
Š each transferee (or, if the transferee is a qualifying special-purpose entity, each holder of its beneficialinterests) has the right to pledge or exchange the assets (or beneficial interests) it received, and nocondition both constrains the transferee (or holder) from taking advantage of its right to pledge orexchange and provides more than a trivial benefit to the transferor; and
Š the transferor does not maintain effective control over the transferred assets through either (i) anagreement that both entitles and obligates the transferor to repurchase or redeem them before theirmaturity; or (ii) the ability to unilaterally cause the holder to return specific assets, other than througha cleanup call.
Impairment of Investment Securities
Under U.S. GAAP, declines in the fair value of held-to-maturity and available-for-sale securities belowtheir cost that are deemed to be other-than-temporary are recorded in earnings. Various quantitative andqualitative factors are assessed to determine whether impairment is other-than-temporary such as theduration and extent of the decline, the current operating and future expected performance, market values ofcomparable companies, changes in industry and market prospects, and the intent and ability of the holder tohold the security for a sufficient period of time for subsequent expected recovery in market value. UnderKorean GAAP, declines in the fair value that are deemed to be permanent are recorded in earnings. Thedetermination of whether a decline in the fair value of a security is permanent is generally based on whetherinvestees are in bankruptcy or liquidation.
Under Korean GAAP, the reversal of impairment loss for all investment securities, when it is objectivelyrelated to an event occurring after the recognition of impairment loss, is recognized as current income.However, the new carrying amount after the reversal of impairment loss cannot exceed the carrying value ofthe investment security that would have been measured at the date of reversal had no impairment loss beenrecognized. Under U.S. GAAP, other-than-temporary impairment losses with respect to investmentsecurities cannot be reversed.
Foreign Currency Translation in Available-for-Sale Securities
Under U.S. GAAP, effects of changes in foreign exchange rates of foreign available-for-sale securities arereflected as a component of other comprehensive income. Under Korean GAAP, effects of such changes inforeign exchange rates are reflected in earnings.
Hedge Accounting Treatment for Derivatives
Under U.S. GAAP, for a derivative to qualify for hedge accounting, it must be highly effective at reducingthe risk associated with the exposure being hedged. The hedging relationship must be designated and
183
formally documented at inception along with the particular risk management objective and strategy for thehedge, identification of the derivative used as the hedging instrument, the hedged item and the risk exposurebeing hedged, and the method of assessing hedge effectiveness. As the criteria for documenting thedesignation of hedging relationships and hedge effectiveness are more rigorous under U.S. GAAP, thederivatives accounted for as hedges under Korean GAAP may not qualify for hedge accounting underU.S. GAAP.
Share-based Compensation
Under Korean GAAP, for cash-settled, share-based payments granted prior to December 31, 2006, theliability is remeasured under the intrinsic value method at each subsequent reporting date, with any changesin fair value recognized in profit or loss for the period. But for cash-settled, share-based payments grantedafter December 31, 2006, the liability is remeasured using option-pricing models at each subsequentreporting date. For equity-settled, share-based payments, the cost of employee services received inexchange for an award of equity instruments is measured based on the grant-date fair value of the award andthat cost is recognized over the period during which an employee is required to provide service in exchangefor the award.
Under U.S. GAAP, for all awards granted, modified or repurchased as of the first annual reporting periodafter June 15, 2005 for public entities, the cost of employee services received in exchange for an award ofequity instruments is measured based on the grant-date fair value of the award (with limited exceptions)estimated using option-pricing models adjusted for the unique characteristics of those instruments inaccordance with SFAS 123(R). If an amount is classified as liability, the fair value of such award isremeasured subsequently at each reporting date through the settlement date with the changes in fair valueduring the requisite service period recognized as compensation cost over that period.
Accounting for Income Taxes
Under Korean GAAP, a deferred tax asset is recognized only when its realization is probable based onalmost certain future taxable income. An appropriate write-down of a previously recognized deferred taxasset is deducted directly from the deferred tax asset with a corresponding increase to income tax expense.
Under U.S. GAAP, deferred tax assets are not directly written down, but rather reduced by a valuationallowance if, in the opinion of management, it is more likely than not that some portion or all of thedeferred tax asset will not be realized. The valuation allowance is established through a charge to incometax expense.
In June 2006, the FASB issued FIN No. 48, Accounting for Uncertainty in Income Taxes — anInterpretation of FASB Statement No. 109. This Interpretation clarifies accounting for uncertainty inincome taxes recognized in an enterprise’s financial statements in accordance with FASB StatementNo. 109, Accounting for Income Taxes. This Interpretation prescribes a recognition threshold andmeasurement of a tax position taken or expected to be taken in a tax return, and provides guidance onderecognition, classification, interest and penalties, accounting in interim periods, disclosure and transition.This Interpretation is effective for fiscal years beginning after December 15, 2006.
Under Korean GAAP, additional tax assessments or tax refunds are recorded as expenses when taxassessment or tax refund actually occurs except when contingent liabilities are recorded for taxcontingencies. Under FIN No. 48, tax positions are required to be evaluated and tax benefits can berecognized only when the technical merits of uncertain tax positions meet the more-likely-than-notrecognition threshold and to be measured as the largest amount of tax benefit that is more than 50% likelyof being recognized.
184
INDEX TO FINANCIAL STATEMENTS
Audited Non-consolidated Financial Statements
Independent Auditors’ Report . . . . . . . . . . . . . . . . . . . . . . . . . . . . . . . . . . . . . . . . . . . . . . . . . . . . . . . . . . . . . . . F-2
Non-Consolidated Balance Sheets as of December 31, 2006, 2007 and 2008 . . . . . . . . . . . . . . . . . . . . F-3
Non-Consolidated Statements of Income for the years ended December 31, 2006, 2007 and2008 . . . . . . . . . . . . . . . . . . . . . . . . . . . . . . . . . . . . . . . . . . . . . . . . . . . . . . . . . . . . . . . . . . . . . . . . . . . . . . . . . . . . . . F-4
Non-Consolidated Statements of Appropriation of Retained Earnings . . . . . . . . . . . . . . . . . . . . . . . . . F-6
Non-Consolidated Statements of Changes in Equity for the years ended December 31, 2007and 2008 . . . . . . . . . . . . . . . . . . . . . . . . . . . . . . . . . . . . . . . . . . . . . . . . . . . . . . . . . . . . . . . . . . . . . . . . . . . . . . . . . . F-7
Non-Consolidated Statements of Cash Flows for the years ended December 31, 2006, 2007 and2008 . . . . . . . . . . . . . . . . . . . . . . . . . . . . . . . . . . . . . . . . . . . . . . . . . . . . . . . . . . . . . . . . . . . . . . . . . . . . . . . . . . . . . . F-9
Notes to Non-Consolidated Financial Statements . . . . . . . . . . . . . . . . . . . . . . . . . . . . . . . . . . . . . . . . . . . . . F-12
Unaudited Non-consolidated Interim Financial Statements
Independent Accountants’ Review Report . . . . . . . . . . . . . . . . . . . . . . . . . . . . . . . . . . . . . . . . . . . . . . . . . . . . F-92
Non-Consolidated Statements of Financial Position as of March 31, 2009 and December 31,2008 . . . . . . . . . . . . . . . . . . . . . . . . . . . . . . . . . . . . . . . . . . . . . . . . . . . . . . . . . . . . . . . . . . . . . . . . . . . . . . . . . . . . . . F-93
Non-Consolidated Statements of Income for the three-month periods ended March 31, 2009and 2008 . . . . . . . . . . . . . . . . . . . . . . . . . . . . . . . . . . . . . . . . . . . . . . . . . . . . . . . . . . . . . . . . . . . . . . . . . . . . . . . . . . F-94
Non-Consolidated Statements of Changes in Equity for the three-month periods endedMarch 31, 2009 and 2008 . . . . . . . . . . . . . . . . . . . . . . . . . . . . . . . . . . . . . . . . . . . . . . . . . . . . . . . . . . . . . . . . . . F-96
Non-Consolidated Statements of Cash Flows for the three-month periods ended March 31,2009 and 2008 . . . . . . . . . . . . . . . . . . . . . . . . . . . . . . . . . . . . . . . . . . . . . . . . . . . . . . . . . . . . . . . . . . . . . . . . . . . . . F-98
Notes to Non-Consolidated Financial Statements . . . . . . . . . . . . . . . . . . . . . . . . . . . . . . . . . . . . . . . . . . . . . F-101
F-1
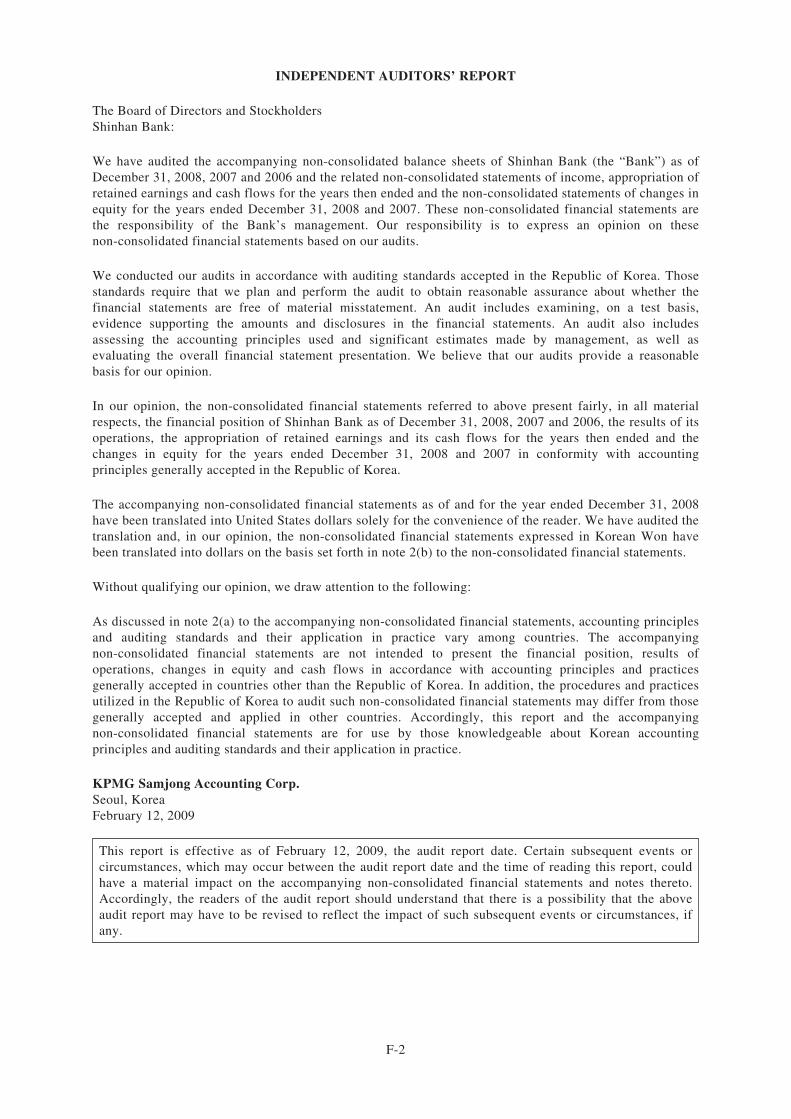
INDEPENDENT AUDITORS’ REPORT
The Board of Directors and StockholdersShinhan Bank:
We have audited the accompanying non-consolidated balance sheets of Shinhan Bank (the “Bank”) as ofDecember 31, 2008, 2007 and 2006 and the related non-consolidated statements of income, appropriation ofretained earnings and cash flows for the years then ended and the non-consolidated statements of changes inequity for the years ended December 31, 2008 and 2007. These non-consolidated financial statements arethe responsibility of the Bank’s management. Our responsibility is to express an opinion on thesenon-consolidated financial statements based on our audits.
We conducted our audits in accordance with auditing standards accepted in the Republic of Korea. Thosestandards require that we plan and perform the audit to obtain reasonable assurance about whether thefinancial statements are free of material misstatement. An audit includes examining, on a test basis,evidence supporting the amounts and disclosures in the financial statements. An audit also includesassessing the accounting principles used and significant estimates made by management, as well asevaluating the overall financial statement presentation. We believe that our audits provide a reasonablebasis for our opinion.
In our opinion, the non-consolidated financial statements referred to above present fairly, in all materialrespects, the financial position of Shinhan Bank as of December 31, 2008, 2007 and 2006, the results of itsoperations, the appropriation of retained earnings and its cash flows for the years then ended and thechanges in equity for the years ended December 31, 2008 and 2007 in conformity with accountingprinciples generally accepted in the Republic of Korea.
The accompanying non-consolidated financial statements as of and for the year ended December 31, 2008have been translated into United States dollars solely for the convenience of the reader. We have audited thetranslation and, in our opinion, the non-consolidated financial statements expressed in Korean Won havebeen translated into dollars on the basis set forth in note 2(b) to the non-consolidated financial statements.
Without qualifying our opinion, we draw attention to the following:
As discussed in note 2(a) to the accompanying non-consolidated financial statements, accounting principlesand auditing standards and their application in practice vary among countries. The accompanyingnon-consolidated financial statements are not intended to present the financial position, results ofoperations, changes in equity and cash flows in accordance with accounting principles and practicesgenerally accepted in countries other than the Republic of Korea. In addition, the procedures and practicesutilized in the Republic of Korea to audit such non-consolidated financial statements may differ from thosegenerally accepted and applied in other countries. Accordingly, this report and the accompanyingnon-consolidated financial statements are for use by those knowledgeable about Korean accountingprinciples and auditing standards and their application in practice.
KPMG Samjong Accounting Corp.Seoul, KoreaFebruary 12, 2009
This report is effective as of February 12, 2009, the audit report date. Certain subsequent events orcircumstances, which may occur between the audit report date and the time of reading this report, couldhave a material impact on the accompanying non-consolidated financial statements and notes thereto.Accordingly, the readers of the audit report should understand that there is a possibility that the aboveaudit report may have to be revised to reflect the impact of such subsequent events or circumstances, ifany.
F-2
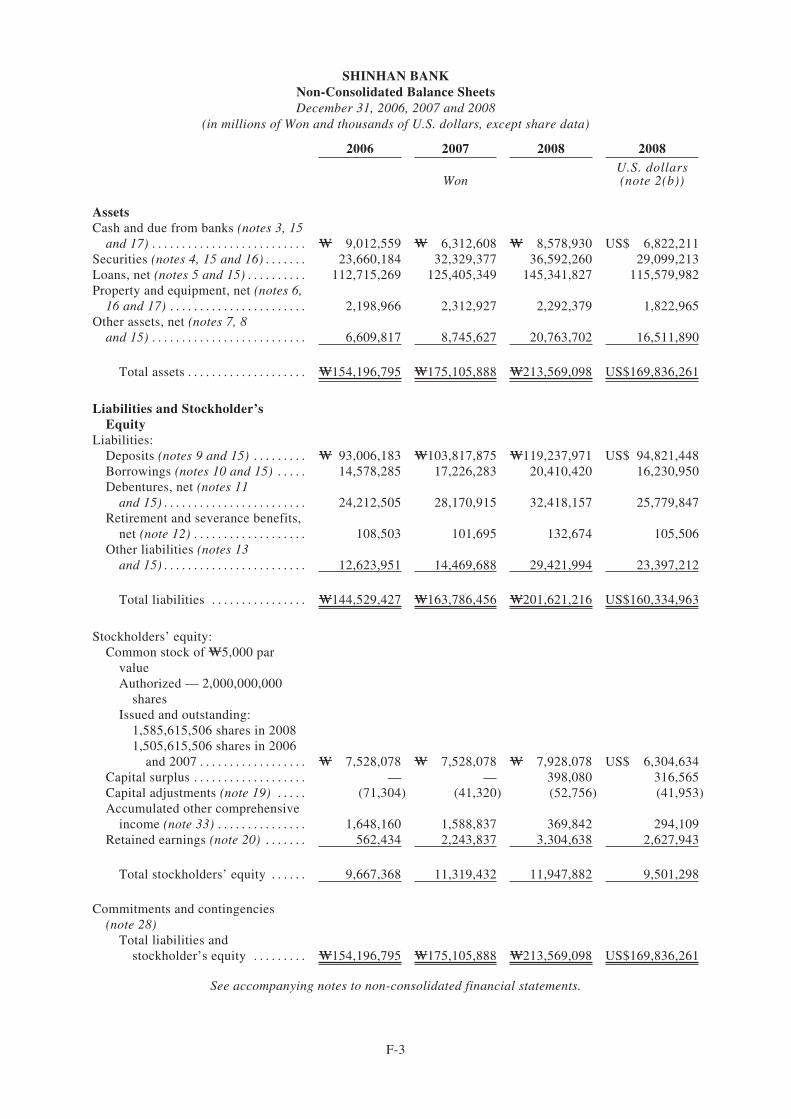
SHINHAN BANKNon-Consolidated Balance SheetsDecember 31, 2006, 2007 and 2008
(in millions of Won and thousands of U.S. dollars, except share data)
2006 2007 2008 2008
WonU.S. dollars(note 2(b))
AssetsCash and due from banks (notes 3, 15
and 17) . . . . . . . . . . . . . . . . . . . . . . . . . . W 9,012,559 W 6,312,608 W 8,578,930 US$ 6,822,211Securities (notes 4, 15 and 16) . . . . . . . 23,660,184 32,329,377 36,592,260 29,099,213Loans, net (notes 5 and 15) . . . . . . . . . . 112,715,269 125,405,349 145,341,827 115,579,982Property and equipment, net (notes 6,
16 and 17) . . . . . . . . . . . . . . . . . . . . . . . 2,198,966 2,312,927 2,292,379 1,822,965Other assets, net (notes 7, 8
and 15) . . . . . . . . . . . . . . . . . . . . . . . . . . 6,609,817 8,745,627 20,763,702 16,511,890
Total assets . . . . . . . . . . . . . . . . . . . . W154,196,795 W175,105,888 W213,569,098 US$169,836,261
Liabilities and Stockholder’sEquity
Liabilities:Deposits (notes 9 and 15) . . . . . . . . . W 93,006,183 W103,817,875 W119,237,971 US$ 94,821,448Borrowings (notes 10 and 15) . . . . . 14,578,285 17,226,283 20,410,420 16,230,950Debentures, net (notes 11
and 15) . . . . . . . . . . . . . . . . . . . . . . . . 24,212,505 28,170,915 32,418,157 25,779,847Retirement and severance benefits,
net (note 12) . . . . . . . . . . . . . . . . . . . 108,503 101,695 132,674 105,506Other liabilities (notes 13
and 15) . . . . . . . . . . . . . . . . . . . . . . . . 12,623,951 14,469,688 29,421,994 23,397,212
Total liabilities . . . . . . . . . . . . . . . . W144,529,427 W163,786,456 W201,621,216 US$160,334,963
Stockholders’ equity:Common stock of W5,000 par
valueAuthorized — 2,000,000,000
sharesIssued and outstanding:
1,585,615,506 shares in 20081,505,615,506 shares in 2006
and 2007 . . . . . . . . . . . . . . . . . . W 7,528,078 W 7,528,078 W 7,928,078 US$ 6,304,634Capital surplus . . . . . . . . . . . . . . . . . . . — — 398,080 316,565Capital adjustments (note 19) . . . . . (71,304) (41,320) (52,756) (41,953)Accumulated other comprehensive
income (note 33) . . . . . . . . . . . . . . . 1,648,160 1,588,837 369,842 294,109Retained earnings (note 20) . . . . . . . 562,434 2,243,837 3,304,638 2,627,943
Total stockholders’ equity . . . . . . 9,667,368 11,319,432 11,947,882 9,501,298
Commitments and contingencies(note 28)
Total liabilities andstockholder’s equity . . . . . . . . . W154,196,795 W175,105,888 W213,569,098 US$169,836,261
See accompanying notes to non-consolidated financial statements.
F-3
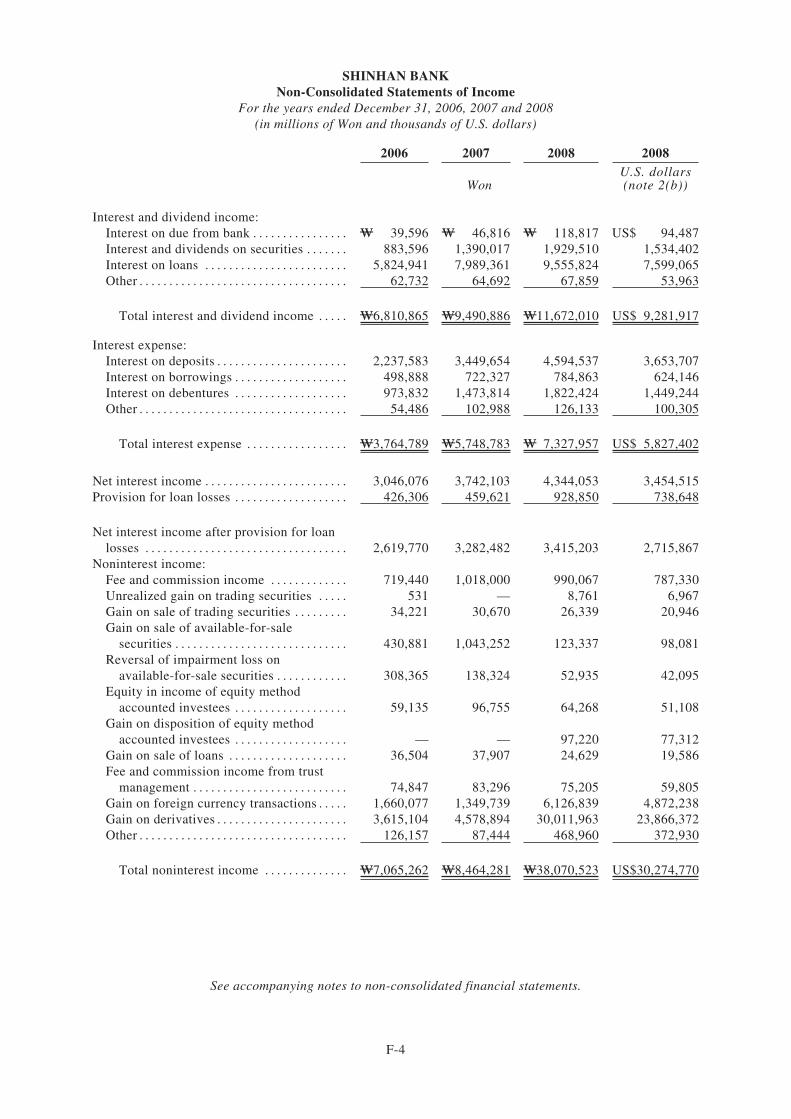
SHINHAN BANKNon-Consolidated Statements of Income
For the years ended December 31, 2006, 2007 and 2008(in millions of Won and thousands of U.S. dollars)
2006 2007 2008 2008
WonU.S. dollars(note 2(b))
Interest and dividend income:Interest on due from bank . . . . . . . . . . . . . . . . W 39,596 W 46,816 W 118,817 US$ 94,487Interest and dividends on securities . . . . . . . 883,596 1,390,017 1,929,510 1,534,402Interest on loans . . . . . . . . . . . . . . . . . . . . . . . . 5,824,941 7,989,361 9,555,824 7,599,065Other . . . . . . . . . . . . . . . . . . . . . . . . . . . . . . . . . . . 62,732 64,692 67,859 53,963
Total interest and dividend income . . . . . W6,810,865 W9,490,886 W11,672,010 US$ 9,281,917
Interest expense:Interest on deposits . . . . . . . . . . . . . . . . . . . . . . 2,237,583 3,449,654 4,594,537 3,653,707Interest on borrowings . . . . . . . . . . . . . . . . . . . 498,888 722,327 784,863 624,146Interest on debentures . . . . . . . . . . . . . . . . . . . 973,832 1,473,814 1,822,424 1,449,244Other . . . . . . . . . . . . . . . . . . . . . . . . . . . . . . . . . . . 54,486 102,988 126,133 100,305
Total interest expense . . . . . . . . . . . . . . . . . W3,764,789 W5,748,783 W 7,327,957 US$ 5,827,402
Net interest income . . . . . . . . . . . . . . . . . . . . . . . . 3,046,076 3,742,103 4,344,053 3,454,515Provision for loan losses . . . . . . . . . . . . . . . . . . . 426,306 459,621 928,850 738,648
Net interest income after provision for loanlosses . . . . . . . . . . . . . . . . . . . . . . . . . . . . . . . . . . 2,619,770 3,282,482 3,415,203 2,715,867
Noninterest income:Fee and commission income . . . . . . . . . . . . . 719,440 1,018,000 990,067 787,330Unrealized gain on trading securities . . . . . 531 — 8,761 6,967Gain on sale of trading securities . . . . . . . . . 34,221 30,670 26,339 20,946Gain on sale of available-for-sale
securities . . . . . . . . . . . . . . . . . . . . . . . . . . . . . 430,881 1,043,252 123,337 98,081Reversal of impairment loss on
available-for-sale securities . . . . . . . . . . . . 308,365 138,324 52,935 42,095Equity in income of equity method
accounted investees . . . . . . . . . . . . . . . . . . . 59,135 96,755 64,268 51,108Gain on disposition of equity method
accounted investees . . . . . . . . . . . . . . . . . . . — — 97,220 77,312Gain on sale of loans . . . . . . . . . . . . . . . . . . . . 36,504 37,907 24,629 19,586Fee and commission income from trust
management . . . . . . . . . . . . . . . . . . . . . . . . . . 74,847 83,296 75,205 59,805Gain on foreign currency transactions . . . . . 1,660,077 1,349,739 6,126,839 4,872,238Gain on derivatives . . . . . . . . . . . . . . . . . . . . . . 3,615,104 4,578,894 30,011,963 23,866,372Other . . . . . . . . . . . . . . . . . . . . . . . . . . . . . . . . . . . 126,157 87,444 468,960 372,930
Total noninterest income . . . . . . . . . . . . . . W7,065,262 W8,464,281 W38,070,523 US$30,274,770
See accompanying notes to non-consolidated financial statements.
F-4
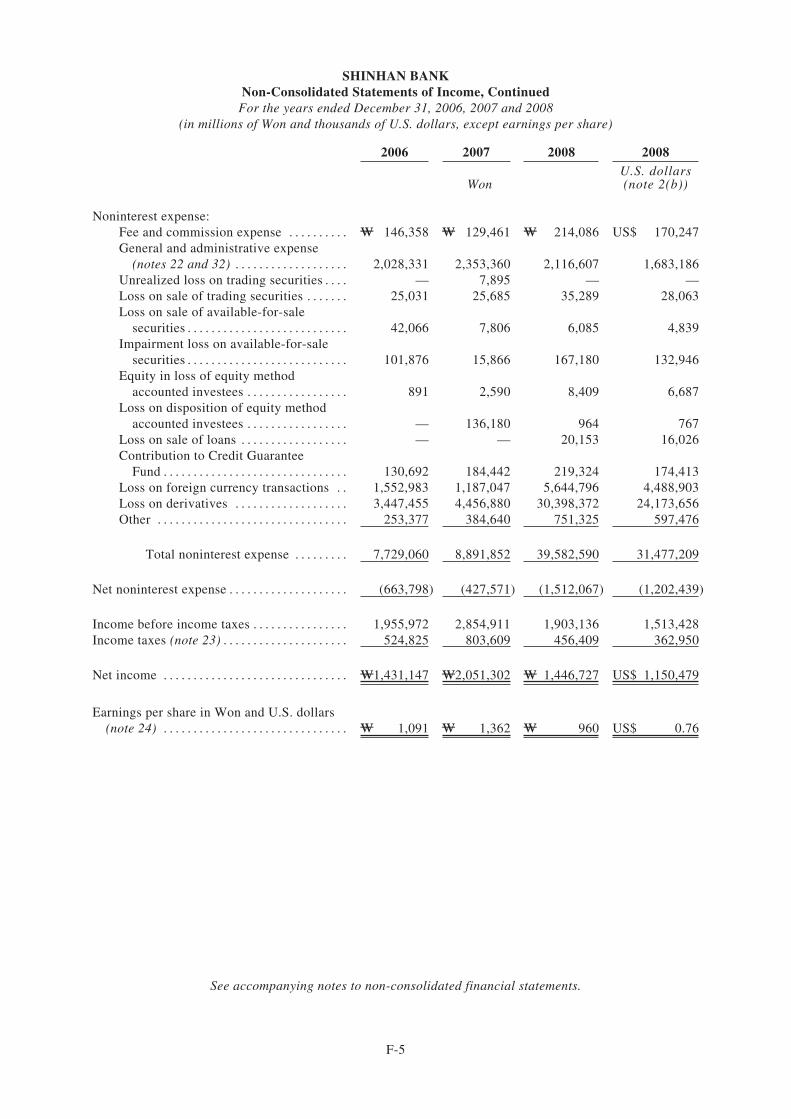
SHINHAN BANKNon-Consolidated Statements of Income, Continued
For the years ended December 31, 2006, 2007 and 2008(in millions of Won and thousands of U.S. dollars, except earnings per share)
2006 2007 2008 2008
WonU.S. dollars(note 2(b))
Noninterest expense:Fee and commission expense . . . . . . . . . . W 146,358 W 129,461 W 214,086 US$ 170,247General and administrative expense
(notes 22 and 32) . . . . . . . . . . . . . . . . . . . 2,028,331 2,353,360 2,116,607 1,683,186Unrealized loss on trading securities . . . . — 7,895 — —Loss on sale of trading securities . . . . . . . 25,031 25,685 35,289 28,063Loss on sale of available-for-sale
securities . . . . . . . . . . . . . . . . . . . . . . . . . . . 42,066 7,806 6,085 4,839Impairment loss on available-for-sale
securities . . . . . . . . . . . . . . . . . . . . . . . . . . . 101,876 15,866 167,180 132,946Equity in loss of equity method
accounted investees . . . . . . . . . . . . . . . . . 891 2,590 8,409 6,687Loss on disposition of equity method
accounted investees . . . . . . . . . . . . . . . . . — 136,180 964 767Loss on sale of loans . . . . . . . . . . . . . . . . . . — — 20,153 16,026Contribution to Credit Guarantee
Fund . . . . . . . . . . . . . . . . . . . . . . . . . . . . . . . 130,692 184,442 219,324 174,413Loss on foreign currency transactions . . 1,552,983 1,187,047 5,644,796 4,488,903Loss on derivatives . . . . . . . . . . . . . . . . . . . 3,447,455 4,456,880 30,398,372 24,173,656Other . . . . . . . . . . . . . . . . . . . . . . . . . . . . . . . . 253,377 384,640 751,325 597,476
Total noninterest expense . . . . . . . . . 7,729,060 8,891,852 39,582,590 31,477,209
Net noninterest expense . . . . . . . . . . . . . . . . . . . . (663,798) (427,571) (1,512,067) (1,202,439)
Income before income taxes . . . . . . . . . . . . . . . . 1,955,972 2,854,911 1,903,136 1,513,428Income taxes (note 23) . . . . . . . . . . . . . . . . . . . . . 524,825 803,609 456,409 362,950
Net income . . . . . . . . . . . . . . . . . . . . . . . . . . . . . . . W1,431,147 W2,051,302 W 1,446,727 US$ 1,150,479
Earnings per share in Won and U.S. dollars(note 24) . . . . . . . . . . . . . . . . . . . . . . . . . . . . . . . W 1,091 W 1,362 W 960 US$ 0.76
See accompanying notes to non-consolidated financial statements.
F-5
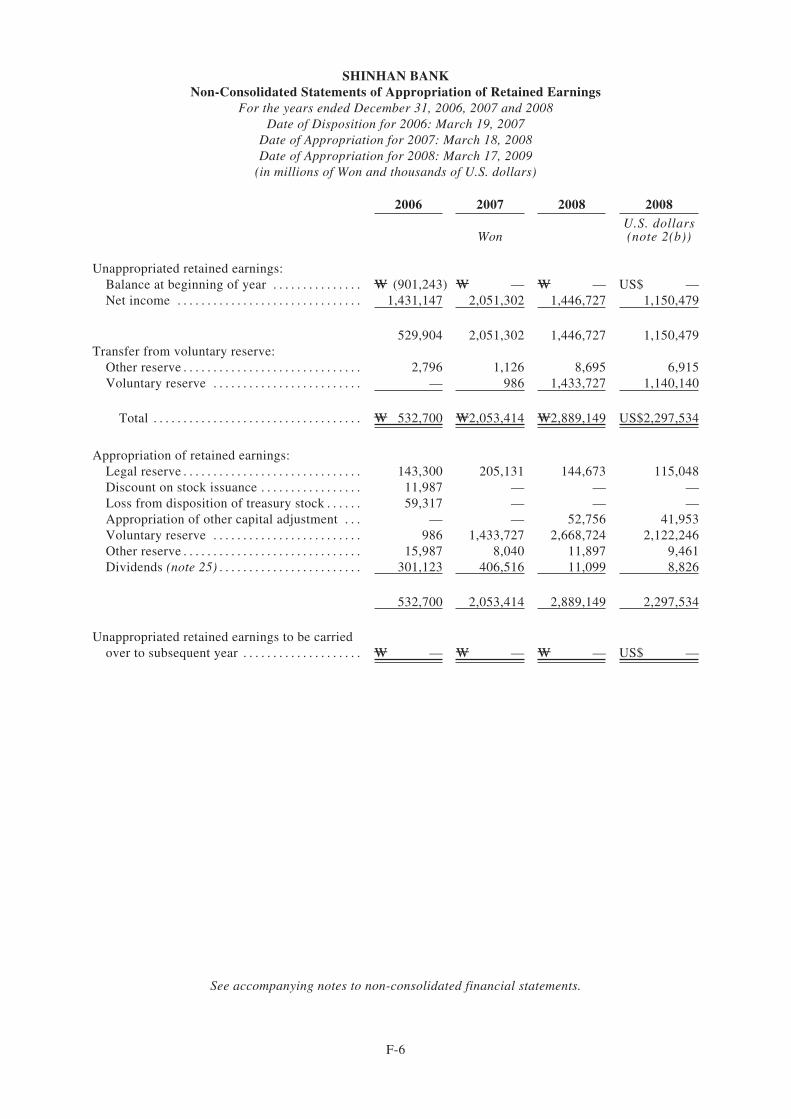
SHINHAN BANKNon-Consolidated Statements of Appropriation of Retained Earnings
For the years ended December 31, 2006, 2007 and 2008Date of Disposition for 2006: March 19, 2007
Date of Appropriation for 2007: March 18, 2008Date of Appropriation for 2008: March 17, 2009
(in millions of Won and thousands of U.S. dollars)
2006 2007 2008 2008
WonU.S. dollars(note 2(b))
Unappropriated retained earnings:Balance at beginning of year . . . . . . . . . . . . . . . W (901,243) W — W — US$ —Net income . . . . . . . . . . . . . . . . . . . . . . . . . . . . . . . 1,431,147 2,051,302 1,446,727 1,150,479
529,904 2,051,302 1,446,727 1,150,479Transfer from voluntary reserve:
Other reserve . . . . . . . . . . . . . . . . . . . . . . . . . . . . . . 2,796 1,126 8,695 6,915Voluntary reserve . . . . . . . . . . . . . . . . . . . . . . . . . — 986 1,433,727 1,140,140
Total . . . . . . . . . . . . . . . . . . . . . . . . . . . . . . . . . . . W 532,700 W2,053,414 W2,889,149 US$2,297,534
Appropriation of retained earnings:Legal reserve . . . . . . . . . . . . . . . . . . . . . . . . . . . . . . 143,300 205,131 144,673 115,048Discount on stock issuance . . . . . . . . . . . . . . . . . 11,987 — — —Loss from disposition of treasury stock . . . . . . 59,317 — — —Appropriation of other capital adjustment . . . — — 52,756 41,953Voluntary reserve . . . . . . . . . . . . . . . . . . . . . . . . . 986 1,433,727 2,668,724 2,122,246Other reserve . . . . . . . . . . . . . . . . . . . . . . . . . . . . . . 15,987 8,040 11,897 9,461Dividends (note 25) . . . . . . . . . . . . . . . . . . . . . . . . 301,123 406,516 11,099 8,826
532,700 2,053,414 2,889,149 2,297,534
Unappropriated retained earnings to be carriedover to subsequent year . . . . . . . . . . . . . . . . . . . . W — W — W — US$ —
See accompanying notes to non-consolidated financial statements.
F-6
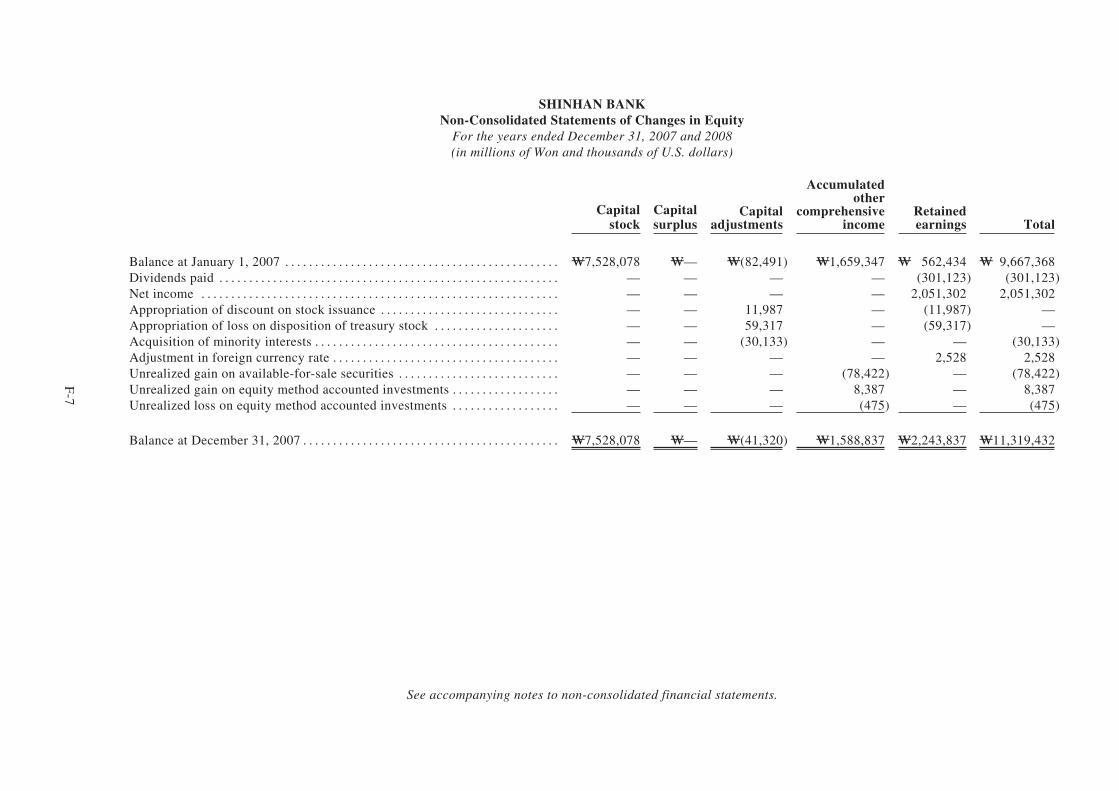
SHINHAN BANKNon-Consolidated Statements of Changes in Equity
For the years ended December 31, 2007 and 2008(in millions of Won and thousands of U.S. dollars)
Capitalstock
Capitalsurplus
Capitaladjustments
Accumulatedother
comprehensiveincome
Retainedearnings Total
Balance at January 1, 2007 . . . . . . . . . . . . . . . . . . . . . . . . . . . . . . . . . . . . . . . . . . . . . . W7,528,078 W— W(82,491) W1,659,347 W 562,434 W 9,667,368Dividends paid . . . . . . . . . . . . . . . . . . . . . . . . . . . . . . . . . . . . . . . . . . . . . . . . . . . . . . . . . — — — — (301,123) (301,123)Net income . . . . . . . . . . . . . . . . . . . . . . . . . . . . . . . . . . . . . . . . . . . . . . . . . . . . . . . . . . . . — — — — 2,051,302 2,051,302Appropriation of discount on stock issuance . . . . . . . . . . . . . . . . . . . . . . . . . . . . . . — — 11,987 — (11,987) —Appropriation of loss on disposition of treasury stock . . . . . . . . . . . . . . . . . . . . . — — 59,317 — (59,317) —Acquisition of minority interests . . . . . . . . . . . . . . . . . . . . . . . . . . . . . . . . . . . . . . . . . — — (30,133) — — (30,133)Adjustment in foreign currency rate . . . . . . . . . . . . . . . . . . . . . . . . . . . . . . . . . . . . . . — — — — 2,528 2,528Unrealized gain on available-for-sale securities . . . . . . . . . . . . . . . . . . . . . . . . . . . — — — (78,422) — (78,422)Unrealized gain on equity method accounted investments . . . . . . . . . . . . . . . . . . — — — 8,387 — 8,387Unrealized loss on equity method accounted investments . . . . . . . . . . . . . . . . . . — — — (475) — (475)
Balance at December 31, 2007 . . . . . . . . . . . . . . . . . . . . . . . . . . . . . . . . . . . . . . . . . . . W7,528,078 W— W(41,320) W1,588,837 W2,243,837 W11,319,432
See accompanying notes to non-consolidated financial statements.
F-7
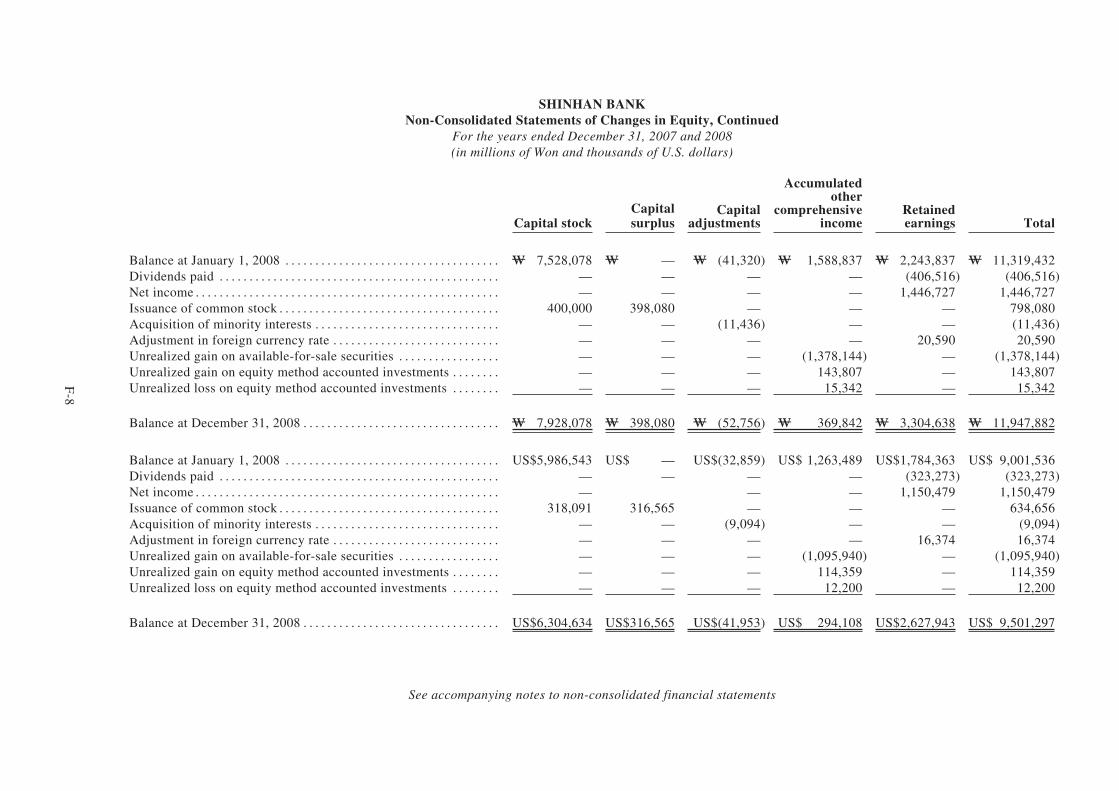
SHINHAN BANKNon-Consolidated Statements of Changes in Equity, Continued
For the years ended December 31, 2007 and 2008(in millions of Won and thousands of U.S. dollars)
Capital stockCapitalsurplus
Capitaladjustments
Accumulatedother
comprehensiveincome
Retainedearnings Total
Balance at January 1, 2008 . . . . . . . . . . . . . . . . . . . . . . . . . . . . . . . . . . . . W 7,528,078 W — W (41,320) W 1,588,837 W 2,243,837 W 11,319,432Dividends paid . . . . . . . . . . . . . . . . . . . . . . . . . . . . . . . . . . . . . . . . . . . . . . . — — — — (406,516) (406,516)Net income . . . . . . . . . . . . . . . . . . . . . . . . . . . . . . . . . . . . . . . . . . . . . . . . . . . — — — — 1,446,727 1,446,727Issuance of common stock . . . . . . . . . . . . . . . . . . . . . . . . . . . . . . . . . . . . . 400,000 398,080 — — — 798,080Acquisition of minority interests . . . . . . . . . . . . . . . . . . . . . . . . . . . . . . . — — (11,436) — — (11,436)Adjustment in foreign currency rate . . . . . . . . . . . . . . . . . . . . . . . . . . . . — — — — 20,590 20,590Unrealized gain on available-for-sale securities . . . . . . . . . . . . . . . . . — — — (1,378,144) — (1,378,144)Unrealized gain on equity method accounted investments . . . . . . . . — — — 143,807 — 143,807Unrealized loss on equity method accounted investments . . . . . . . . — — — 15,342 — 15,342
Balance at December 31, 2008 . . . . . . . . . . . . . . . . . . . . . . . . . . . . . . . . . W 7,928,078 W 398,080 W (52,756) W 369,842 W 3,304,638 W 11,947,882
Balance at January 1, 2008 . . . . . . . . . . . . . . . . . . . . . . . . . . . . . . . . . . . . US$5,986,543 US$ — US$(32,859) US$ 1,263,489 US$1,784,363 US$ 9,001,536Dividends paid . . . . . . . . . . . . . . . . . . . . . . . . . . . . . . . . . . . . . . . . . . . . . . . — — — — (323,273) (323,273)Net income . . . . . . . . . . . . . . . . . . . . . . . . . . . . . . . . . . . . . . . . . . . . . . . . . . . — — — 1,150,479 1,150,479Issuance of common stock . . . . . . . . . . . . . . . . . . . . . . . . . . . . . . . . . . . . . 318,091 316,565 — — — 634,656Acquisition of minority interests . . . . . . . . . . . . . . . . . . . . . . . . . . . . . . . — — (9,094) — — (9,094)Adjustment in foreign currency rate . . . . . . . . . . . . . . . . . . . . . . . . . . . . — — — — 16,374 16,374Unrealized gain on available-for-sale securities . . . . . . . . . . . . . . . . . — — — (1,095,940) — (1,095,940)Unrealized gain on equity method accounted investments . . . . . . . . — — — 114,359 — 114,359Unrealized loss on equity method accounted investments . . . . . . . . — — — 12,200 — 12,200
Balance at December 31, 2008 . . . . . . . . . . . . . . . . . . . . . . . . . . . . . . . . . US$6,304,634 US$316,565 US$(41,953) US$ 294,108 US$2,627,943 US$ 9,501,297
See accompanying notes to non-consolidated financial statements
F-8
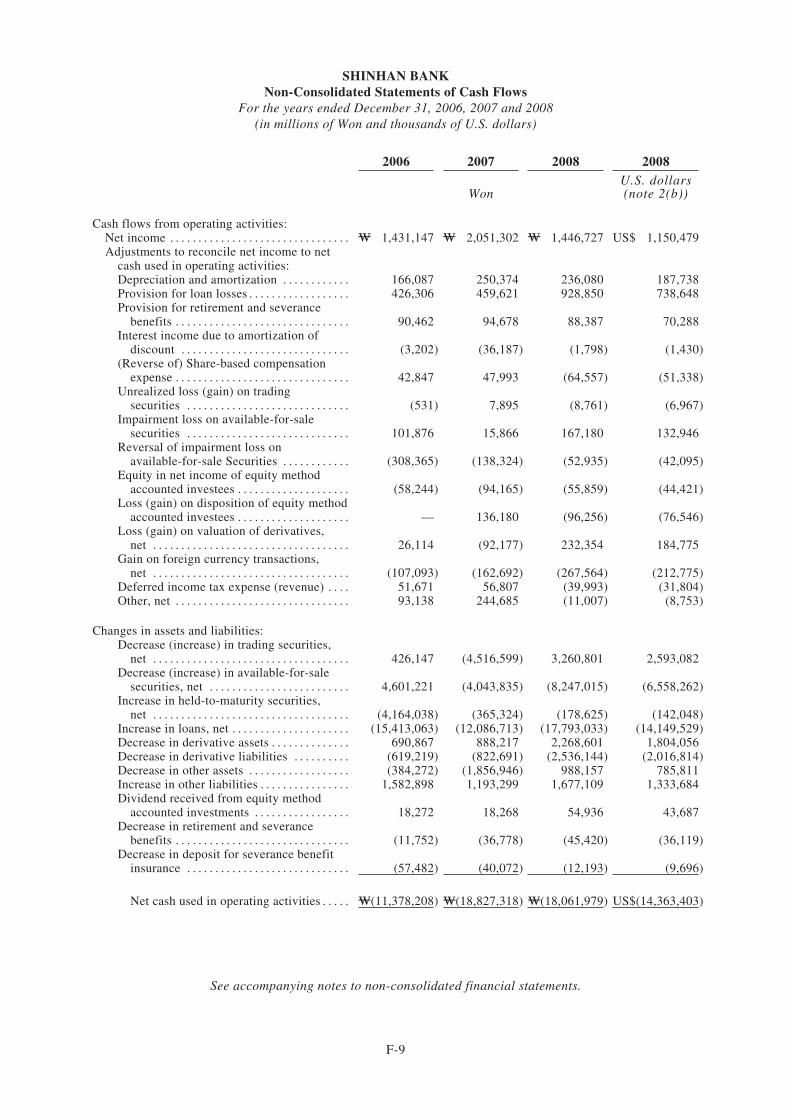
SHINHAN BANKNon-Consolidated Statements of Cash Flows
For the years ended December 31, 2006, 2007 and 2008(in millions of Won and thousands of U.S. dollars)
2006 2007 2008 2008
WonU.S. dollars(note 2(b))
Cash flows from operating activities:Net income . . . . . . . . . . . . . . . . . . . . . . . . . . . . . . . . W 1,431,147 W 2,051,302 W 1,446,727 US$ 1,150,479Adjustments to reconcile net income to net
cash used in operating activities:Depreciation and amortization . . . . . . . . . . . . 166,087 250,374 236,080 187,738Provision for loan losses . . . . . . . . . . . . . . . . . . 426,306 459,621 928,850 738,648Provision for retirement and severance
benefits . . . . . . . . . . . . . . . . . . . . . . . . . . . . . . . 90,462 94,678 88,387 70,288Interest income due to amortization of
discount . . . . . . . . . . . . . . . . . . . . . . . . . . . . . . (3,202) (36,187) (1,798) (1,430)(Reverse of) Share-based compensation
expense . . . . . . . . . . . . . . . . . . . . . . . . . . . . . . . 42,847 47,993 (64,557) (51,338)Unrealized loss (gain) on trading
securities . . . . . . . . . . . . . . . . . . . . . . . . . . . . . (531) 7,895 (8,761) (6,967)Impairment loss on available-for-sale
securities . . . . . . . . . . . . . . . . . . . . . . . . . . . . . 101,876 15,866 167,180 132,946Reversal of impairment loss on
available-for-sale Securities . . . . . . . . . . . . (308,365) (138,324) (52,935) (42,095)Equity in net income of equity method
accounted investees . . . . . . . . . . . . . . . . . . . . (58,244) (94,165) (55,859) (44,421)Loss (gain) on disposition of equity method
accounted investees . . . . . . . . . . . . . . . . . . . . — 136,180 (96,256) (76,546)Loss (gain) on valuation of derivatives,
net . . . . . . . . . . . . . . . . . . . . . . . . . . . . . . . . . . . 26,114 (92,177) 232,354 184,775Gain on foreign currency transactions,
net . . . . . . . . . . . . . . . . . . . . . . . . . . . . . . . . . . . (107,093) (162,692) (267,564) (212,775)Deferred income tax expense (revenue) . . . . 51,671 56,807 (39,993) (31,804)Other, net . . . . . . . . . . . . . . . . . . . . . . . . . . . . . . . 93,138 244,685 (11,007) (8,753)
Changes in assets and liabilities:Decrease (increase) in trading securities,
net . . . . . . . . . . . . . . . . . . . . . . . . . . . . . . . . . . . 426,147 (4,516,599) 3,260,801 2,593,082Decrease (increase) in available-for-sale
securities, net . . . . . . . . . . . . . . . . . . . . . . . . . 4,601,221 (4,043,835) (8,247,015) (6,558,262)Increase in held-to-maturity securities,
net . . . . . . . . . . . . . . . . . . . . . . . . . . . . . . . . . . . (4,164,038) (365,324) (178,625) (142,048)Increase in loans, net . . . . . . . . . . . . . . . . . . . . . (15,413,063) (12,086,713) (17,793,033) (14,149,529)Decrease in derivative assets . . . . . . . . . . . . . . 690,867 888,217 2,268,601 1,804,056Decrease in derivative liabilities . . . . . . . . . . (619,219) (822,691) (2,536,144) (2,016,814)Decrease in other assets . . . . . . . . . . . . . . . . . . (384,272) (1,856,946) 988,157 785,811Increase in other liabilities . . . . . . . . . . . . . . . . 1,582,898 1,193,299 1,677,109 1,333,684Dividend received from equity method
accounted investments . . . . . . . . . . . . . . . . . 18,272 18,268 54,936 43,687Decrease in retirement and severance
benefits . . . . . . . . . . . . . . . . . . . . . . . . . . . . . . . (11,752) (36,778) (45,420) (36,119)Decrease in deposit for severance benefit
insurance . . . . . . . . . . . . . . . . . . . . . . . . . . . . . (57,482) (40,072) (12,193) (9,696)
Net cash used in operating activities . . . . . W(11,378,208) W(18,827,318) W(18,061,979) US$(14,363,403)
See accompanying notes to non-consolidated financial statements.
F-9
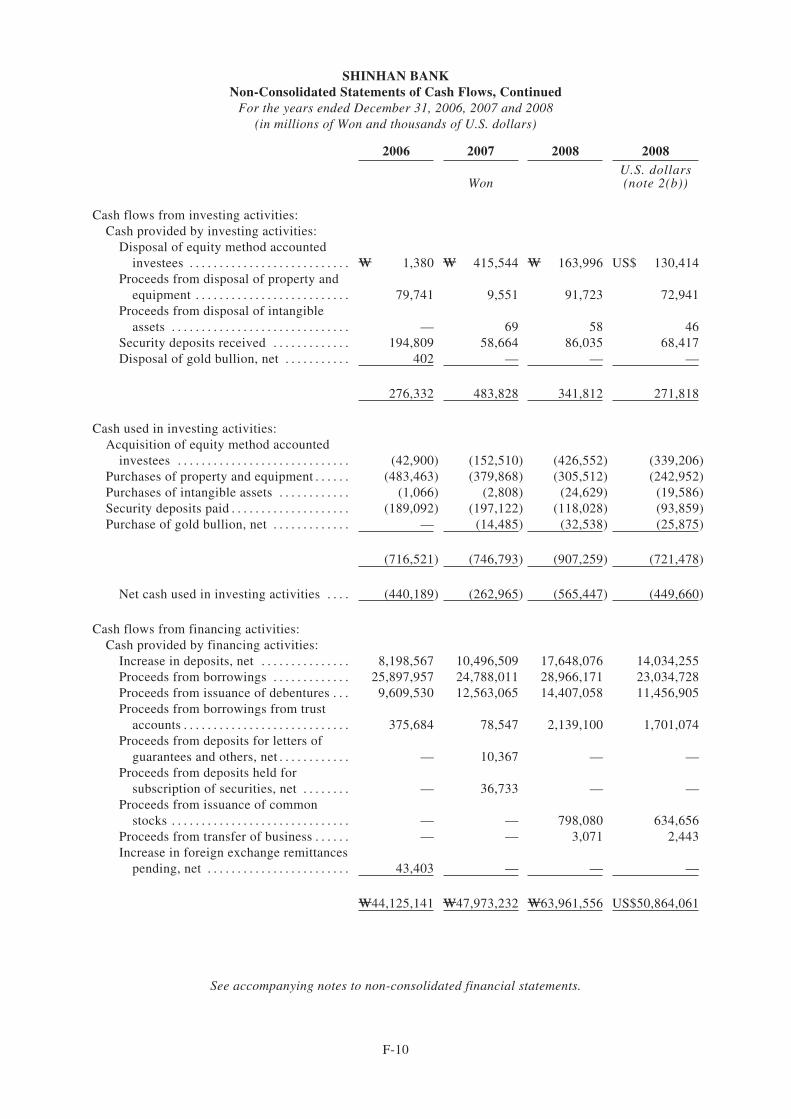
SHINHAN BANKNon-Consolidated Statements of Cash Flows, Continued
For the years ended December 31, 2006, 2007 and 2008(in millions of Won and thousands of U.S. dollars)
2006 2007 2008 2008
WonU.S. dollars(note 2(b))
Cash flows from investing activities:Cash provided by investing activities:
Disposal of equity method accountedinvestees . . . . . . . . . . . . . . . . . . . . . . . . . . . W 1,380 W 415,544 W 163,996 US$ 130,414
Proceeds from disposal of property andequipment . . . . . . . . . . . . . . . . . . . . . . . . . . 79,741 9,551 91,723 72,941
Proceeds from disposal of intangibleassets . . . . . . . . . . . . . . . . . . . . . . . . . . . . . . — 69 58 46
Security deposits received . . . . . . . . . . . . . 194,809 58,664 86,035 68,417Disposal of gold bullion, net . . . . . . . . . . . 402 — — —
276,332 483,828 341,812 271,818
Cash used in investing activities:Acquisition of equity method accounted
investees . . . . . . . . . . . . . . . . . . . . . . . . . . . . . (42,900) (152,510) (426,552) (339,206)Purchases of property and equipment . . . . . . (483,463) (379,868) (305,512) (242,952)Purchases of intangible assets . . . . . . . . . . . . (1,066) (2,808) (24,629) (19,586)Security deposits paid . . . . . . . . . . . . . . . . . . . . (189,092) (197,122) (118,028) (93,859)Purchase of gold bullion, net . . . . . . . . . . . . . — (14,485) (32,538) (25,875)
(716,521) (746,793) (907,259) (721,478)
Net cash used in investing activities . . . . (440,189) (262,965) (565,447) (449,660)
Cash flows from financing activities:Cash provided by financing activities:
Increase in deposits, net . . . . . . . . . . . . . . . 8,198,567 10,496,509 17,648,076 14,034,255Proceeds from borrowings . . . . . . . . . . . . . 25,897,957 24,788,011 28,966,171 23,034,728Proceeds from issuance of debentures . . . 9,609,530 12,563,065 14,407,058 11,456,905Proceeds from borrowings from trust
accounts . . . . . . . . . . . . . . . . . . . . . . . . . . . . 375,684 78,547 2,139,100 1,701,074Proceeds from deposits for letters of
guarantees and others, net . . . . . . . . . . . . — 10,367 — —Proceeds from deposits held for
subscription of securities, net . . . . . . . . — 36,733 — —Proceeds from issuance of common
stocks . . . . . . . . . . . . . . . . . . . . . . . . . . . . . . — — 798,080 634,656Proceeds from transfer of business . . . . . . — — 3,071 2,443Increase in foreign exchange remittances
pending, net . . . . . . . . . . . . . . . . . . . . . . . . 43,403 — — —
W44,125,141 W47,973,232 W63,961,556 US$50,864,061
See accompanying notes to non-consolidated financial statements.
F-10
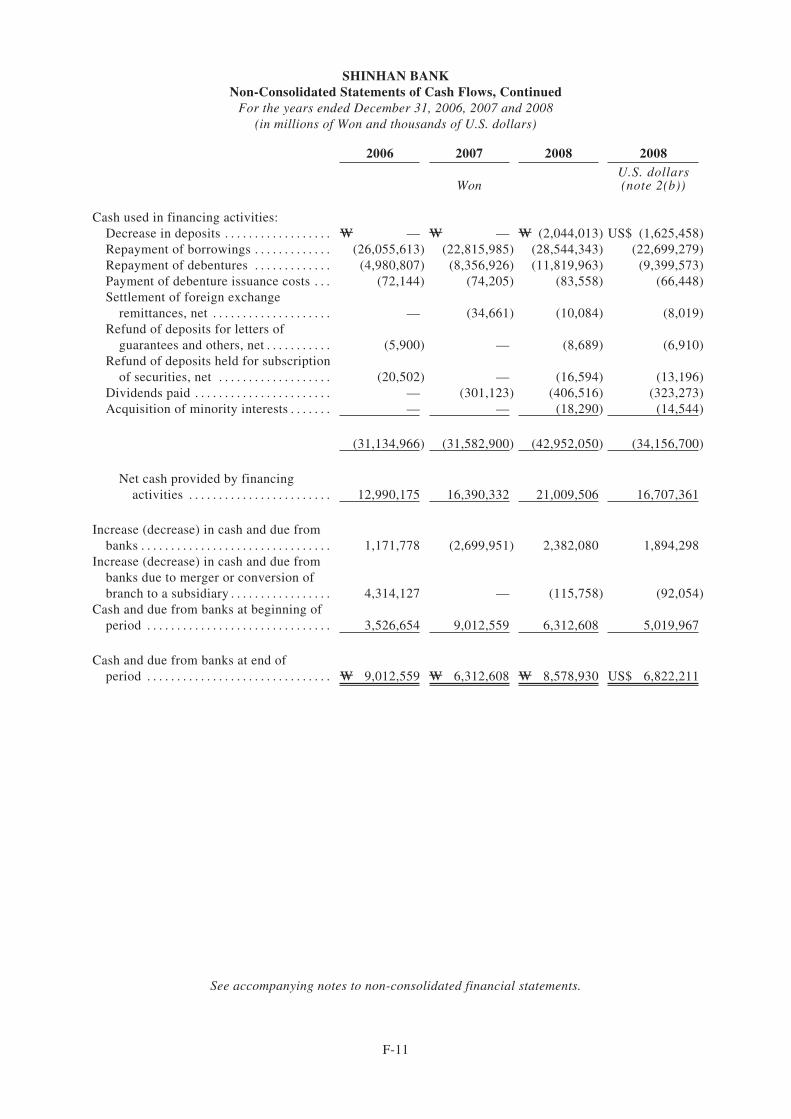
SHINHAN BANKNon-Consolidated Statements of Cash Flows, Continued
For the years ended December 31, 2006, 2007 and 2008(in millions of Won and thousands of U.S. dollars)
2006 2007 2008 2008
WonU.S. dollars(note 2(b))
Cash used in financing activities:Decrease in deposits . . . . . . . . . . . . . . . . . . W — W — W (2,044,013) US$ (1,625,458)Repayment of borrowings . . . . . . . . . . . . . (26,055,613) (22,815,985) (28,544,343) (22,699,279)Repayment of debentures . . . . . . . . . . . . . (4,980,807) (8,356,926) (11,819,963) (9,399,573)Payment of debenture issuance costs . . . (72,144) (74,205) (83,558) (66,448)Settlement of foreign exchange
remittances, net . . . . . . . . . . . . . . . . . . . . — (34,661) (10,084) (8,019)Refund of deposits for letters of
guarantees and others, net . . . . . . . . . . . (5,900) — (8,689) (6,910)Refund of deposits held for subscription
of securities, net . . . . . . . . . . . . . . . . . . . (20,502) — (16,594) (13,196)Dividends paid . . . . . . . . . . . . . . . . . . . . . . . — (301,123) (406,516) (323,273)Acquisition of minority interests . . . . . . . — — (18,290) (14,544)
(31,134,966) (31,582,900) (42,952,050) (34,156,700)
Net cash provided by financingactivities . . . . . . . . . . . . . . . . . . . . . . . . 12,990,175 16,390,332 21,009,506 16,707,361
Increase (decrease) in cash and due frombanks . . . . . . . . . . . . . . . . . . . . . . . . . . . . . . . . 1,171,778 (2,699,951) 2,382,080 1,894,298
Increase (decrease) in cash and due frombanks due to merger or conversion ofbranch to a subsidiary . . . . . . . . . . . . . . . . . 4,314,127 — (115,758) (92,054)
Cash and due from banks at beginning ofperiod . . . . . . . . . . . . . . . . . . . . . . . . . . . . . . . 3,526,654 9,012,559 6,312,608 5,019,967
Cash and due from banks at end ofperiod . . . . . . . . . . . . . . . . . . . . . . . . . . . . . . . W 9,012,559 W 6,312,608 W 8,578,930 US$ 6,822,211
See accompanying notes to non-consolidated financial statements.
F-11
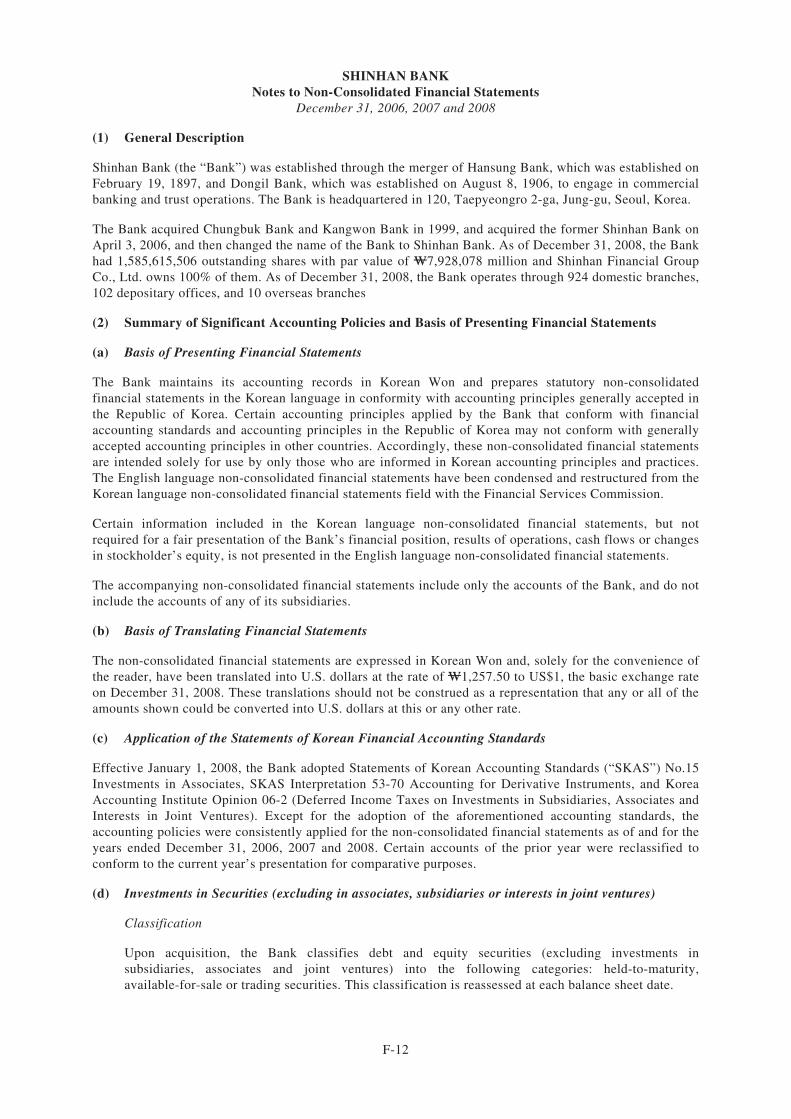
SHINHAN BANKNotes to Non-Consolidated Financial Statements
December 31, 2006, 2007 and 2008
(1) General Description
Shinhan Bank (the “Bank”) was established through the merger of Hansung Bank, which was established onFebruary 19, 1897, and Dongil Bank, which was established on August 8, 1906, to engage in commercialbanking and trust operations. The Bank is headquartered in 120, Taepyeongro 2-ga, Jung-gu, Seoul, Korea.
The Bank acquired Chungbuk Bank and Kangwon Bank in 1999, and acquired the former Shinhan Bank onApril 3, 2006, and then changed the name of the Bank to Shinhan Bank. As of December 31, 2008, the Bankhad 1,585,615,506 outstanding shares with par value of W7,928,078 million and Shinhan Financial GroupCo., Ltd. owns 100% of them. As of December 31, 2008, the Bank operates through 924 domestic branches,102 depositary offices, and 10 overseas branches
(2) Summary of Significant Accounting Policies and Basis of Presenting Financial Statements
(a) Basis of Presenting Financial Statements
The Bank maintains its accounting records in Korean Won and prepares statutory non-consolidatedfinancial statements in the Korean language in conformity with accounting principles generally accepted inthe Republic of Korea. Certain accounting principles applied by the Bank that conform with financialaccounting standards and accounting principles in the Republic of Korea may not conform with generallyaccepted accounting principles in other countries. Accordingly, these non-consolidated financial statementsare intended solely for use by only those who are informed in Korean accounting principles and practices.The English language non-consolidated financial statements have been condensed and restructured from theKorean language non-consolidated financial statements field with the Financial Services Commission.
Certain information included in the Korean language non-consolidated financial statements, but notrequired for a fair presentation of the Bank’s financial position, results of operations, cash flows or changesin stockholder’s equity, is not presented in the English language non-consolidated financial statements.
The accompanying non-consolidated financial statements include only the accounts of the Bank, and do notinclude the accounts of any of its subsidiaries.
(b) Basis of Translating Financial Statements
The non-consolidated financial statements are expressed in Korean Won and, solely for the convenience ofthe reader, have been translated into U.S. dollars at the rate of W1,257.50 to US$1, the basic exchange rateon December 31, 2008. These translations should not be construed as a representation that any or all of theamounts shown could be converted into U.S. dollars at this or any other rate.
(c) Application of the Statements of Korean Financial Accounting Standards
Effective January 1, 2008, the Bank adopted Statements of Korean Accounting Standards (“SKAS”) No.15Investments in Associates, SKAS Interpretation 53-70 Accounting for Derivative Instruments, and KoreaAccounting Institute Opinion 06-2 (Deferred Income Taxes on Investments in Subsidiaries, Associates andInterests in Joint Ventures). Except for the adoption of the aforementioned accounting standards, theaccounting policies were consistently applied for the non-consolidated financial statements as of and for theyears ended December 31, 2006, 2007 and 2008. Certain accounts of the prior year were reclassified toconform to the current year’s presentation for comparative purposes.
(d) Investments in Securities (excluding in associates, subsidiaries or interests in joint ventures)
Classification
Upon acquisition, the Bank classifies debt and equity securities (excluding investments insubsidiaries, associates and joint ventures) into the following categories: held-to-maturity,available-for-sale or trading securities. This classification is reassessed at each balance sheet date.
F-12
Investments in debt securities where the Bank has the positive intent and ability to hold to maturityare classified as held-to-maturity. Securities that are acquired principally for the purpose of selling inthe short term are classified as trading securities. Investments not classified as either held-to-maturityor trading securities are classified as available-for-sale securities.
Initial recognition
Investments in securities (excluding investments in subsidiaries, associates and joint ventures) areinitially recognized at cost.
Subsequent measurement and income recognition
Trading securities are subsequently carried at fair value. Gains and losses arising from changes in thefair value of trading securities are included in the non-consolidated income statement in the period inwhich they arise. Available-for-sale securities are subsequently carried at fair value. Gains and lossesarising from changes in the fair value of available-for-sale securities are recognized as accumulatedother comprehensive income, net of tax, directly in equity. Investments in available-for-sale securitiesthat do not have readily determinable fair values are recognized at cost less impairment, if any.Held-to-maturity investments are carried at amortized cost with interest income and expenserecognized in the non-consolidated income statement using the effective interest method.
Fair value information
The fair value of marketable securities is determined using quoted market prices as of the period end.Non-marketable debt securities are fair valued by discounting cash flows using the prevailing marketrates for debt with a similar credit risk and remaining maturity. Credit risk is determined using theissuer’s credit rating as announced by accredited credit rating agencies in Korea. Non-marketablebeneficiary certificates are recorded at the fair value using the standard trading yield rate determinedby fund management companies.
Impairment
The Bank reviews investments in securities whenever events or changes in circumstances indicate thatthe carrying amount of the investments may not be recoverable. Impairment losses are recognizedwhen the reasonably estimated recoverable amounts are less than the carrying amount and there is noclear evidence that impairment is not necessary. Impairment, if any, is recorded as a reduction in thecarrying amount of the securities and included in the non-consolidated income statement in the periodin which they arise. Recovery of impairment loss, when it is objectively related to an event occurringafter the recognition of impairment loss, is recognized as current income. However, the new carryingamount after the reversal of impairment cannot exceed the carrying value of the investment securitythat would have been measured at the date of reversal had no impairment loss been recognized.
(e) Investments in Associates and Subsidiaries
Associates are all entities of which the Bank has the ability to significantly influence the financial andoperating policies and procedures, generally through 15% to 50% of the voting rights. Subsidiaries areentities controlled by the Bank. Investments in associates and subsidiaries are accounted for using theequity method of accounting and are initially recognized at cost.
The Bank’s investments in associates and subsidiaries include goodwill identified on acquisition (net of anyaccumulated impairment loss). Goodwill is calculated as the excess of the acquisition cost of an investmentin an associate or subsidiary over the Bank’s share of the fair value of the identifiable net assets acquired.Goodwill is amortized using the straight-line method over its estimated useful life of five years.Amortization of goodwill is recorded together with equity income (losses).
F-13
When events or circumstances indicate that the carrying value of goodwill may not be recoverable, the Bankreviews goodwill for impairment and records any impairment loss immediately in the non-consolidatedincome statement.
The Bank’s share of its post-acquisition profits or losses in investments in associates and subsidiaries isrecognized in the non-consolidated income statement, and its share of post-acquisition movements in equityis recognized in equity. The cumulative post-acquisition movements are adjusted against the carryingamount of each investment. Changes in the carrying amount of an investment resulting from dividends byan associate or subsidiary are recognized when the associate or subsidiary declares the dividend. When theBank’s share of losses in an associate or subsidiary equals or exceeds its interest in the associate orsubsidiary, including preferred stock or other long-term loans and receivables issued by the associate orsubsidiary, the Bank does not recognize further losses, unless it has incurred obligations or made paymentson behalf of the associate or subsidiary.
If the investee is a subsidiary, net income and net assets of the parent company’s separate financialstatements should agree with the parent company’s share in the net income and net assets of theconsolidated financial statements, except when the Bank discontinues the application of the equity methoddue to its investment in a subsidiary being reduced to zero.
Unrealized gains on transactions between the Bank and its associates or subsidiaries are eliminated to theextent of the Bank’s interest in each associate or subsidiary.
(f) Interest in Joint Ventures
Joint ventures are those operations or assets over whose activities the Bank has joint control.
In respect of jointly controlled operations, the Bank includes, in its non-consolidated financial statements,the assets that it controls and the liabilities and expenses it has incurred, plus its share of the income fromthe joint operation. For its interest in jointly controlled assets, the Bank recognizes, in the non-consolidatedfinancial statements, its share of the assets it jointly controls, the liabilities jointly incurred and net income,plus the liabilities and expenses it has solely incurred, if any. The Bank accounts for its interest in a jointlycontrolled entity using the equity method of accounting.
(g) Allowance for Loan Losses
In estimating the allowance for corporate and household including credit card loan losses, the Bank recordsthe greater amount resulting from the provisioning methods described below for each loan classification.
(i) Expected Loss Method
The Bank estimates the allowance for corporate and household loan losses by applying the expectedloss method, which analyzes factors of estimated loss based on probability of default (“PD”) and lossgiven default (“LGD”). This provisionary method considers both financial and non-financial factors ofborrowers to assess PD and LGD. PD is determined by considering the type of borrowers, the natureof loans and delinquent days and LGD is determined by considering the type of loan and collateral.The period of historical data used to calculate PD and LGD are updated annually; PD and LGDapplied data for the past seven years and seventy months for corporate loans and five years and sixtymonths for household loans as of December 31, 2008 and for the past six years and fifty-six monthsfor corporate loans and four years and forty-six months for household loans as of December 31, 2007.The allowance for loan losses is calculated by multiplying outstanding loan balance by the PD andLGD.
F-14
(ii) FSS Guideline
The Bank applies the FSS guidelines for corporate and household loans in accordance with theRegulations for the Supervision of Banks revised on December 7, 2007. The prescribed minimumlevels of provision per the FSS guidelines are as follows,
2006 2007 2008
Corporate loans . . . . . . . . . . . Normal (*) . . . . . . . . . . . . 0.7% 0.85% 0.85%Precautionary . . . . . . . . . . 7% 7% 7%Substandard . . . . . . . . . . . 20% 20% 20%Doubtful . . . . . . . . . . . . . . 50% 50% 50%Estimated loss . . . . . . . . . 100% 100% 100%
Household loans . . . . . . . . . . Normal . . . . . . . . . . . . . . . . 1% 1% 1%Precautionary . . . . . . . . . . 10% 10% 10%Substandard . . . . . . . . . . . 20% 20% 20%Doubtful . . . . . . . . . . . . . . 55% 55% 55%Estimated loss . . . . . . . . . 100% 100% 100%
(*) 0.9% for construction, real estate and rental services, retail and wholesale, lodging and restaurant; industriessusceptible to market
In addition, the Bank includes interbank loan, call loan, bills bought under repurchase agreement anddeposit from banks except for Bank of Korea in estimating the allowance for loan losses classified asnormal. Additionally, the Bank considers the borrower’s ability to repay and the recovery value ofcollateral in estimating expected loss on high-risk large volume loan balance.
Loans are charged-off if they are deemed to be uncollectible by falling under any of the followingcategories:
Š Loans for which collection is not foreseeable due to insolvency or bankruptcy, dissolution or theclosure of the business by the debtor;
Š Payments outstanding on unsecured consumer loans, which have been overdue for more than sixmonths; or
Š The portion of loans classified as “estimated loss”, net of any recovery from collateral, which isdeemed to be uncollectible.
(h) Troubled Debt Restructuring
A loan in which the contractual terms are modified in a troubled debt restructuring program is accounted forat the present value of the expected future cash flows of the modified loan discounted at the effectiveinterest rate of the original loan. The excess of the carrying amount over the present value of expectedfuture cash flows is recorded as provision for loan losses in the current period. The present value discountsare recorded in allowance for loan losses and reflected as a deduction from the nominal value of the loans.The present value discounts are amortized using the effective interest method and recognized as interestincome.
(i) Deferred Loan Origination Fees
Certain fees associated with lending activities which meet specified criteria, are deferred and amortizedover the life of the loan as an adjustment to the carrying amount of the loan using the effective yield methodand recognized as interest income.
F-15
(j) Transfer of Assets
Transfers of financial assets to third parties are accounted for as sales when control is surrendered to thetransferee. The Bank derecognizes financial assets from the balance sheet including any related allowance,and recognizes all assets obtained, and liabilities incurred, including any recourse obligations to thetransferee, at fair value. Any resulting gain or loss on the sale is recognized in earnings. Conversely, theBank only recognizes financial assets transferred from third parties on the balance sheet when the Bankobtains control of financial assets.
(k) Interest Income
Interest income on bank deposits, loans and securities is recognized on an accrual basis, except for intereston loans that are past due and loans to customers who are bankrupt which are placed on nonaccrual. Anyunpaid interest previously accrued on such loans is reversed from income, and thereafter interest isrecognized only to the extent payments are received. Payments on delinquent loans are first applied todelinquent interest, to normal interest, and then to the principal balance.
(l) Property and Equipment
Property and equipment are stated at cost except in the case of revaluations made in accordance with theAsset Revaluation Law which allowed for asset revaluation prior to the law being revoked. Assets acquiredthrough investment in kind or donation, are recorded at fair value.
Significant additions or improvements extending useful lives of assets are capitalized. However, normalmaintenance and repairs are charged to expense as incurred.
Depreciation is computed by the declining-balance method using rates based on the estimated useful livesor the straight-line method over the estimated useful lives of the respective assets as follows:
Descriptions Depreciation method Useful lives
Buildings Straight-line 40–60 years
Leasehold improvements Straight-line 5 years
Furniture, office equipment and other Declining-balance 5 years
For property and equipment at overseas branches, the depreciation methods regulated by the respectivelocal regulatory authority are applied.
The Bank reviews property and equipment for impairment whenever events or changes in circumstancesindicate that the carrying amount of an asset may not be recoverable. An impairment loss is recognizedwhen the expected estimated undiscounted future net cash flows from the use of the asset and its eventualdisposal are less than its carrying amount. The Bank recognizes an impairment loss by reducing its carryingamount to the estimated recoverable amount.
(m) Intangible Assets
Intangible assets which mainly consist of software, are stated at cost less accumulated amortization andimpairment loss, if any. Such intangible assets are amortized using the straight-line method over five years.
The Bank reviews intangible assets for impairment whenever events or changes in circumstances indicatethat the carrying amount of an asset may not be recoverable. The Bank reduces its carrying amount to therecoverable amount and the amount impaired is recognized as impairment loss.
(n) Leases
The Bank classifies and accounts for lease transactions as either an operating or capital lease, depending onthe terms of the lease. Leases where the Bank assumes substantially all the risks and rewards of ownershipare classified as capital leases. All other leases are classified as operating leases.
F-16
Substantially all the risks and rewards of ownership are evidenced when one or more of the criteria listedbelow are met:
Š Ownership of the leased property will transfer to the lessee at the end of the lease term.
Š The lessee has a bargain purchase option and it is reasonably certain at the inception of the lease thatthe option will be exercised.
Š The lease term is equal to 75% or more of the estimated economic useful life of the leased property.
Š The present value at the beginning of the lease term of the minimum lease payments equals or exceeds90% of the fair value of the leased property.
In addition, if the leased property is specialized to the extent that only the lessee can use it without anymajor modification, it would be considered a capital lease.
Otherwise, the lease is classified as an operating lease and recognized in income on a straight-line basisover the lease term.
The financing lease is recorded as the net investment in the lease asset at lease inception representing theaggregate future minimum lease payments. Lease income is recognized to approximate a level rate of returnon the net investment by using the effective yield method over the lease term.
The Bank also recognizes initial direct costs incurred in negotiating and arranging leases. Initial direct costsincurred for operating leases are initially recorded as a separate asset and expensed as fee and commissionexpense over the lease term on the same basis in which lease income is recognized. Initial direct costsincurred for financing leases are included in the net investment in the lease asset and reduces lease incomeover the lease term using the effective yield method.
(o) Discount (Premium) on Debentures
Discount (premium) on debentures issued, which represents the difference between the face value andissuance price of debentures, is amortized (accreted) using the effective interest method over the life of thedebentures. The amount amortized (accreted) is included in interest expense.
(p) Retirement and Severance Benefits
Employees who have been with the Bank for more than one year are entitled to lump-sum payments basedon salary rates and length of service at the time they leave the Bank. The Bank’s estimated liability underthe plan which would be payable if all employees left on the balance sheet date is accrued in theaccompanying non-consolidated balance sheets. A portion of the liability is covered by an employees’severance insurance where the employees have a vested interest in the deposit with the insurance companyin trust. The deposit for severance benefit insurance is, therefore, reflected in the accompanyingnon-consolidated balance sheets as a reduction of the liability for retirement and severance benefits.
(q) Allowance for Unused Loan Commitments
The Bank estimates the allowance for unused corporate and household loan commitments by eachclassification considering the credit conversion factor (“CCF”), the ratio in which the off-balance sheetcommitments are converted into outstanding amounts based on historical data. In addition, the Bank appliesthe FSS guidelines for unused corporate and household loan commitments in accordance with theRegulations for the Supervision of Banks revised at December 7, 2007 as follows: for unused corporate loancommitments a minimum of 0.85% for normal (0.9% for construction, real estate and rental services, retailand wholesale, lodging and restaurant; industries susceptible to market), 7% for precautionary, 20% forsubstandard, 50% for doubtful and 100% for estimated loss, respectively; and for unused household loancommitments a minimum of 1.0% for normal, 10% for precautionary, 20% for substandard, 55% fordoubtful and 100% for estimated loss, respectively.
F-17
The Bank records the greater amount resulting from the provisioning methods described above by eachclassification as other allowances included in other liabilities with the respective changes recorded in othernon-interest expense.
(r) Allowance for Loss on Guarantees and Acceptances
The Bank estimates allowance for losses on outstanding guarantees and acceptances, contingent guaranteesand acceptances and endorsed bills in accordance with the same loan classification criteria applied inestimating allowance for loan losses and recorded as other liabilities with the respective changes recordedas other non-interest expense.
(s) Bonds under Resale or Repurchase Agreements
Bonds purchased under resale agreements are recorded as loans and bonds sold under repurchaseagreements are recorded as borrowings when the Bank purchases or sells securities under resale orrepurchase agreements.
(t) Income Taxes
Income tax on the income or loss for the year comprises current and deferred tax. Income tax is recognizedin the non-consolidated statement of income except to the extent that it relates to items recognized directlyin equity, in which case it is recognized in equity.
Current tax is the expected tax payable on the taxable income for the year, using tax rates enacted.
Deferred tax is provided using the asset and liability method, providing for temporary differences betweenthe carrying amounts of assets and liabilities for financial reporting purposes and the amounts used for taxpurposes. The amount of deferred tax provided is based on the expected manner of realization or settlementof the carrying amount of assets and liabilities, using tax rates enacted or substantively enacted at thebalance sheet date.
A deferred tax asset is recognized only to the extent that it is probable that future taxable income will beavailable against which the unused tax losses and credits can be utilized. Deferred tax assets are reduced tothe extent that it is no longer probable that the related tax benefit will be realized.
Deferred tax assets and liabilities are classified as current or non current based on the classification of therelated asset or liability for financial reporting or the expected reversal date of the temporary difference forthose with no related asset or liability such as loss carry forwards and tax credit carryforwards. The deferredtax amounts are presented as a net current asset or liability and a net non current asset or liability.
Changes in deferred taxes due to a change in the tax rate except for those related to items initiallyrecognized outside profit or loss (either in other comprehensive income or directly in equity) are recognizedas income in the current year.
(u) Derivatives and Hedge Accounting
The Bank holds derivative financial instruments to hedge its foreign currency and interest rate riskexposures. Embedded derivatives are separated from the host contract and accounted for separately if theeconomic characteristics and risks of the host contract and the embedded derivative are not closely related,and a separate instrument with the same terms as the embedded derivative would meet the definition of aderivative.
Derivatives are initially recognized at fair value on the date on which a derivative contract is entered intoand are subsequently remeasured at their fair value. Attributable transaction costs are recognized in profit orloss when incurred.
F-18
Hedge accounting
Where a derivative, which meets certain criteria, is used for hedging the exposure to changes in thefair value of a recognized asset, liability or firm commitment, it is designated as a fair value hedge.Where a derivative, which meets certain criteria, is used for hedging the exposure to the variability ofthe future cash flows of a forecasted transaction, it is designated as a cash flow hedge.
The Bank documents, at the inception of the transaction, the relationship between hedging instrumentsand hedged items, as well as its risk management objective and strategy for undertaking various hedgetransactions. The Bank documents its assessment, both at hedge inception and on a monthly basis,whether the derivatives that are used in hedging transactions are highly effective in offsetting thechanges in fair values or cash flows of hedged items.
Fair value hedge
Changes in the fair value of derivatives that are designated and qualify as fair value hedges arerecorded in the nonconsolidated statement of income, together with any changes in the fair value ofthe hedged asset or liability that are attributable to the hedged risk.
Cash flow hedge
The effective portion of changes in the fair value of derivatives that are designated and qualify as cashflow hedges is recognized in equity as other comprehensive income. The gain or loss relating to anyineffective portion is recognized immediately in the earnings. Amounts accumulated in equity arerecycled to the income statement in the periods in which the hedged item will affect profit or loss.When a hedging instrument expires or is sold, or when a hedge no longer meets the criteria for hedgeaccounting, any cumulative gain or loss existing in equity at the time remains in equity and isrecognized when the forecast transaction is ultimately recognized in earnings. When a forecasttransaction is no longer expected to occur, the cumulative gain or loss that was reported in equity isimmediately transferred to the statement of income.
Derivatives that do not qualify for hedge accounting
Changes in the fair value of derivative instruments that are not designated as fair value or cash flowhedges are recognized immediately in the statement of income.
Separable embedded derivatives
Changes in the fair value of separable embedded derivatives are recognized immediately in thestatement of income.
(v) Share-Based Payment
The Bank has granted shares or share options to its employees and other parties. For equity-settled share-based payment transactions, the Bank measures the goods or services received, and the correspondingincrease in equity as a capital adjustment at the fair value of the goods or services received, unless that fairvalue cannot be estimated reliably. If the entity cannot estimate reliably the fair value of the goods orservices received, the Bank measures their value, and the corresponding increase in equity, indirectly, byreference to the fair value of the equity instruments granted. If the fair value of the equity instrumentscannot be estimated reliably at the measurement date, the Bank measures them at their intrinsic value andrecognizes the goods or services received based on the number of equity instruments that ultimately vest.For cash-settled share-based payment transactions, the Bank measures the goods or services acquired andthe liability incurred at the fair value of the liability. Until the liability is settled, the Bank remeasures thefair value of the liability at each reporting date and at the date of settlement, with changes in fair valuerecognized in profit or loss for the period.
F-19
(w) Translation of Foreign Currency Denominated Assets and Liabilities
Assets and liabilities denominated in foreign currencies are translated into Korean Won at the balance sheetdates, with the resulting gains and losses recognized in current results of operations. Assets and liabilitiesdenominated in foreign currencies are translated into Korean Won at W929.60, W938.20 and W1,257.50 toUS $1 based on the basic exchange rate and the cross exchange rates announced by the Seoul MoneyBrokerage Services Ltd. on December 31, 2006, 2007 and 2008, the last business day of each respectiveperiod, respectively.
Foreign currency assets and liabilities of foreign-based operations and branches accounted for using theequity method are translated at the rate of exchange at the respective balance sheet dates. Foreign currencyamounts in the non-consolidated statement of income are translated using an average rate. Translation gainsand losses arising from collective translation of the foreign currency financial statements of foreign-basedoperations are recorded net as accumulated other comprehensive income. These gains and losses aresubsequently recognized as income in the year the foreign operations or companies are liquidated or sold.
(x) Valuation of Receivables and Payables at Present Value
Receivables and payables arising from long-term cash loans/borrowings and other similar transactions arestated at present value. The difference between the nominal value and present value of these receivables orpayables is amortized using the effective interest method. The amount amortized is included in interestexpense or interest income.
(y) Accounting for Trust Accounts
The Bank accounts for trust accounts separately from its bank accounts under the Trust Business Act andthus are not included in the accompanying non-consolidated financial statements. Funds transferred betweena bank account and a trust account is recognized as borrowings from trust accounts in other liabilities withfees for managing the accounts recognized as noninterest income by the Bank. Furthermore, the Bankrecognizes as loss in other noninterest expense any excess amount of the guaranteed principal and earningsover the sum of trust fee income and a special provision which consist of up to 25% of total trust fees or 5%of certain trust accounts.
(z) Provision and Contingent Liabilities
Provisions are recognized when all of the following are met: (1) an entity has a present obligation as a resultof a past event; (2) it is probable that an outflow of resources embodying economic benefits will be requiredto settle the obligation; and (3) a reliable estimate can be made of the amount of the obligation. Where theeffect of the time value of money is material, the amount of a provision is the present value of theexpenditures expected to be required to settle the obligation.
Where the expenditure required to settle a provision is expected to be reimbursed by another party, thereimbursement is recognized as a separate asset when, and only when, it is virtually certain thatreimbursement will be received if the Company settles the obligation. The expense generated by theprovision is presented net of the amount of expected reimbursement.
(aa) Cash Management Account (“CMA”)
The Bank recognizes income from CMA investments consisting of highly liquid investments and expensefrom CMA deposits as other interest income and other interest expense, respectively.
(bb) Use of Estimates
The preparation of non-consolidated financial statements in accordance with accounting principlesgenerally accepted in the Republic of Korea requires management to make estimates and assumptions thataffect the amounts reported in the non-consolidated financial statements and related notes to thenon-consolidated financial statements. Actual results could differ from those estimates.
F-20
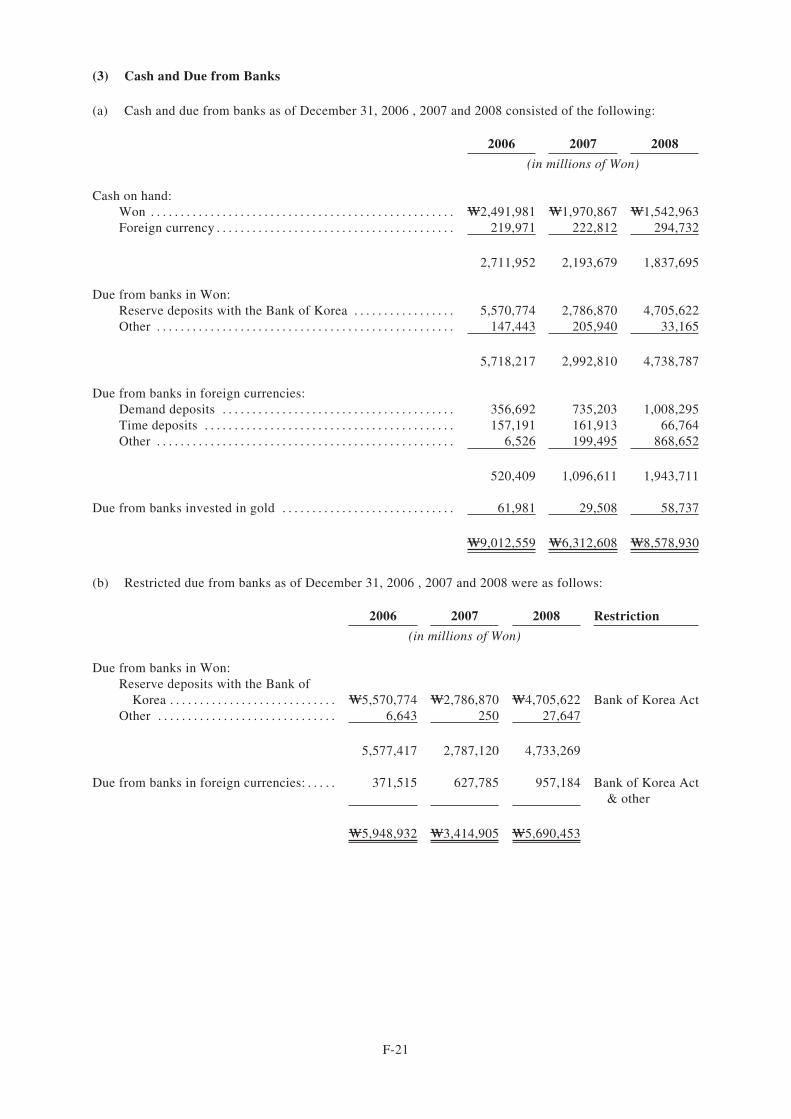
(3) Cash and Due from Banks
(a) Cash and due from banks as of December 31, 2006 , 2007 and 2008 consisted of the following:
2006 2007 2008
(in millions of Won)
Cash on hand:Won . . . . . . . . . . . . . . . . . . . . . . . . . . . . . . . . . . . . . . . . . . . . . . . . . . . W2,491,981 W1,970,867 W1,542,963Foreign currency . . . . . . . . . . . . . . . . . . . . . . . . . . . . . . . . . . . . . . . . 219,971 222,812 294,732
2,711,952 2,193,679 1,837,695
Due from banks in Won:Reserve deposits with the Bank of Korea . . . . . . . . . . . . . . . . . 5,570,774 2,786,870 4,705,622Other . . . . . . . . . . . . . . . . . . . . . . . . . . . . . . . . . . . . . . . . . . . . . . . . . . 147,443 205,940 33,165
5,718,217 2,992,810 4,738,787
Due from banks in foreign currencies:Demand deposits . . . . . . . . . . . . . . . . . . . . . . . . . . . . . . . . . . . . . . . 356,692 735,203 1,008,295Time deposits . . . . . . . . . . . . . . . . . . . . . . . . . . . . . . . . . . . . . . . . . . 157,191 161,913 66,764Other . . . . . . . . . . . . . . . . . . . . . . . . . . . . . . . . . . . . . . . . . . . . . . . . . . 6,526 199,495 868,652
520,409 1,096,611 1,943,711
Due from banks invested in gold . . . . . . . . . . . . . . . . . . . . . . . . . . . . . 61,981 29,508 58,737
W9,012,559 W6,312,608 W8,578,930
(b) Restricted due from banks as of December 31, 2006 , 2007 and 2008 were as follows:
2006 2007 2008 Restriction
(in millions of Won)
Due from banks in Won:Reserve deposits with the Bank of
Korea . . . . . . . . . . . . . . . . . . . . . . . . . . . . W5,570,774 W2,786,870 W4,705,622 Bank of Korea ActOther . . . . . . . . . . . . . . . . . . . . . . . . . . . . . . 6,643 250 27,647
5,577,417 2,787,120 4,733,269
Due from banks in foreign currencies: . . . . . 371,515 627,785 957,184 Bank of Korea Act& other
W5,948,932 W3,414,905 W5,690,453
F-21
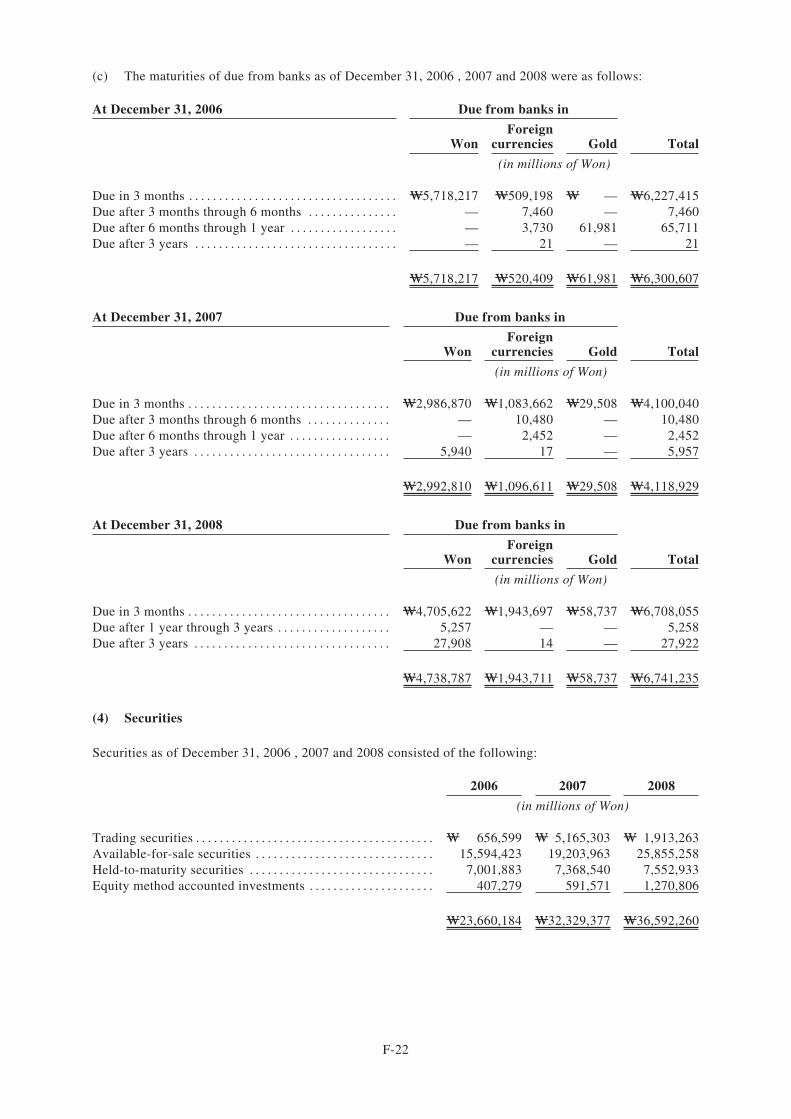
(c) The maturities of due from banks as of December 31, 2006 , 2007 and 2008 were as follows:
At December 31, 2006 Due from banks in
WonForeign
currencies Gold Total
(in millions of Won)
Due in 3 months . . . . . . . . . . . . . . . . . . . . . . . . . . . . . . . . . . . W5,718,217 W509,198 W — W6,227,415Due after 3 months through 6 months . . . . . . . . . . . . . . . — 7,460 — 7,460Due after 6 months through 1 year . . . . . . . . . . . . . . . . . . — 3,730 61,981 65,711Due after 3 years . . . . . . . . . . . . . . . . . . . . . . . . . . . . . . . . . . — 21 — 21
W5,718,217 W520,409 W61,981 W6,300,607
At December 31, 2007 Due from banks in
WonForeign
currencies Gold Total
(in millions of Won)
Due in 3 months . . . . . . . . . . . . . . . . . . . . . . . . . . . . . . . . . . W2,986,870 W1,083,662 W29,508 W4,100,040Due after 3 months through 6 months . . . . . . . . . . . . . . — 10,480 — 10,480Due after 6 months through 1 year . . . . . . . . . . . . . . . . . — 2,452 — 2,452Due after 3 years . . . . . . . . . . . . . . . . . . . . . . . . . . . . . . . . . 5,940 17 — 5,957
W2,992,810 W1,096,611 W29,508 W4,118,929
At December 31, 2008 Due from banks in
WonForeign
currencies Gold Total
(in millions of Won)
Due in 3 months . . . . . . . . . . . . . . . . . . . . . . . . . . . . . . . . . . W4,705,622 W1,943,697 W58,737 W6,708,055Due after 1 year through 3 years . . . . . . . . . . . . . . . . . . . 5,257 — — 5,258Due after 3 years . . . . . . . . . . . . . . . . . . . . . . . . . . . . . . . . . 27,908 14 — 27,922
W4,738,787 W1,943,711 W58,737 W6,741,235
(4) Securities
Securities as of December 31, 2006 , 2007 and 2008 consisted of the following:
2006 2007 2008
(in millions of Won)
Trading securities . . . . . . . . . . . . . . . . . . . . . . . . . . . . . . . . . . . . . . . . W 656,599 W 5,165,303 W 1,913,263Available-for-sale securities . . . . . . . . . . . . . . . . . . . . . . . . . . . . . . 15,594,423 19,203,963 25,855,258Held-to-maturity securities . . . . . . . . . . . . . . . . . . . . . . . . . . . . . . . 7,001,883 7,368,540 7,552,933Equity method accounted investments . . . . . . . . . . . . . . . . . . . . . 407,279 591,571 1,270,806
W23,660,184 W32,329,377 W36,592,260
F-22
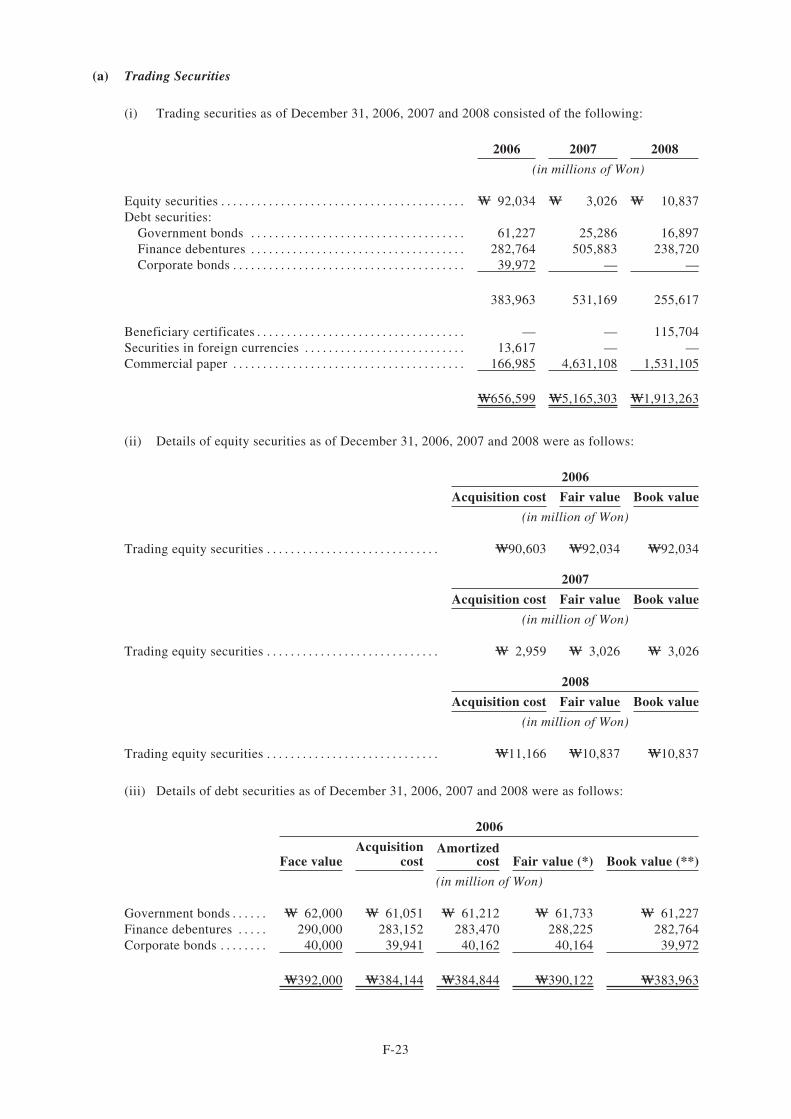
(a) Trading Securities
(i) Trading securities as of December 31, 2006, 2007 and 2008 consisted of the following:
2006 2007 2008
(in millions of Won)
Equity securities . . . . . . . . . . . . . . . . . . . . . . . . . . . . . . . . . . . . . . . . . W 92,034 W 3,026 W 10,837Debt securities:
Government bonds . . . . . . . . . . . . . . . . . . . . . . . . . . . . . . . . . . . . 61,227 25,286 16,897Finance debentures . . . . . . . . . . . . . . . . . . . . . . . . . . . . . . . . . . . . 282,764 505,883 238,720Corporate bonds . . . . . . . . . . . . . . . . . . . . . . . . . . . . . . . . . . . . . . . 39,972 — —
383,963 531,169 255,617
Beneficiary certificates . . . . . . . . . . . . . . . . . . . . . . . . . . . . . . . . . . . — — 115,704Securities in foreign currencies . . . . . . . . . . . . . . . . . . . . . . . . . . . 13,617 — —Commercial paper . . . . . . . . . . . . . . . . . . . . . . . . . . . . . . . . . . . . . . . 166,985 4,631,108 1,531,105
W656,599 W5,165,303 W1,913,263
(ii) Details of equity securities as of December 31, 2006, 2007 and 2008 were as follows:
2006
Acquisition cost Fair value Book value
(in million of Won)
Trading equity securities . . . . . . . . . . . . . . . . . . . . . . . . . . . . . W90,603 W92,034 W92,034
2007
Acquisition cost Fair value Book value
(in million of Won)
Trading equity securities . . . . . . . . . . . . . . . . . . . . . . . . . . . . . W 2,959 W 3,026 W 3,026
2008
Acquisition cost Fair value Book value
(in million of Won)
Trading equity securities . . . . . . . . . . . . . . . . . . . . . . . . . . . . . W11,166 W10,837 W10,837
(iii) Details of debt securities as of December 31, 2006, 2007 and 2008 were as follows:
2006
Face valueAcquisition
costAmortized
cost Fair value (*) Book value (**)
(in million of Won)
Government bonds . . . . . . W 62,000 W 61,051 W 61,212 W 61,733 W 61,227Finance debentures . . . . . 290,000 283,152 283,470 288,225 282,764Corporate bonds . . . . . . . . 40,000 39,941 40,162 40,164 39,972
W392,000 W384,144 W384,844 W390,122 W383,963
F-23
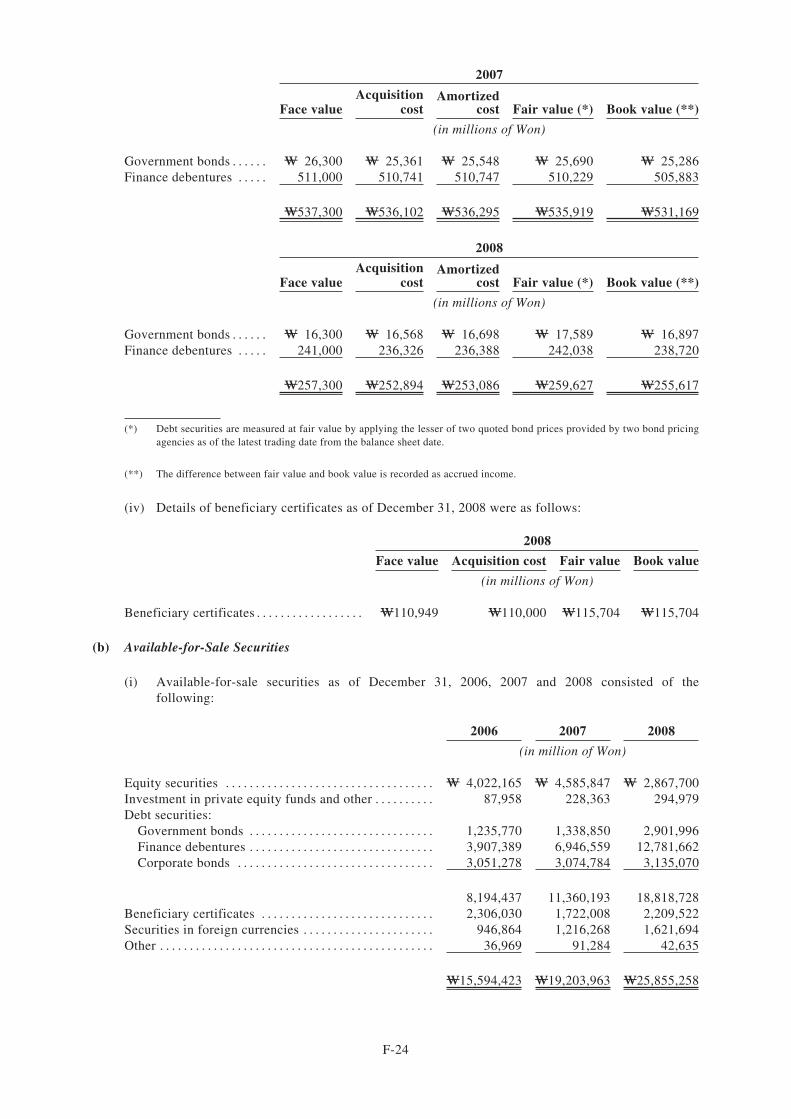
2007
Face valueAcquisition
costAmortized
cost Fair value (*) Book value (**)
(in millions of Won)
Government bonds . . . . . . W 26,300 W 25,361 W 25,548 W 25,690 W 25,286Finance debentures . . . . . 511,000 510,741 510,747 510,229 505,883
W537,300 W536,102 W536,295 W535,919 W531,169
2008
Face valueAcquisition
costAmortized
cost Fair value (*) Book value (**)
(in millions of Won)
Government bonds . . . . . . W 16,300 W 16,568 W 16,698 W 17,589 W 16,897Finance debentures . . . . . 241,000 236,326 236,388 242,038 238,720
W257,300 W252,894 W253,086 W259,627 W255,617
(*) Debt securities are measured at fair value by applying the lesser of two quoted bond prices provided by two bond pricingagencies as of the latest trading date from the balance sheet date.
(**) The difference between fair value and book value is recorded as accrued income.
(iv) Details of beneficiary certificates as of December 31, 2008 were as follows:
2008
Face value Acquisition cost Fair value Book value
(in millions of Won)
Beneficiary certificates . . . . . . . . . . . . . . . . . . W110,949 W110,000 W115,704 W115,704
(b) Available-for-Sale Securities
(i) Available-for-sale securities as of December 31, 2006, 2007 and 2008 consisted of thefollowing:
2006 2007 2008
(in million of Won)
Equity securities . . . . . . . . . . . . . . . . . . . . . . . . . . . . . . . . . . . W 4,022,165 W 4,585,847 W 2,867,700Investment in private equity funds and other . . . . . . . . . . 87,958 228,363 294,979Debt securities:
Government bonds . . . . . . . . . . . . . . . . . . . . . . . . . . . . . . . 1,235,770 1,338,850 2,901,996Finance debentures . . . . . . . . . . . . . . . . . . . . . . . . . . . . . . . 3,907,389 6,946,559 12,781,662Corporate bonds . . . . . . . . . . . . . . . . . . . . . . . . . . . . . . . . . 3,051,278 3,074,784 3,135,070
8,194,437 11,360,193 18,818,728Beneficiary certificates . . . . . . . . . . . . . . . . . . . . . . . . . . . . . 2,306,030 1,722,008 2,209,522Securities in foreign currencies . . . . . . . . . . . . . . . . . . . . . . 946,864 1,216,268 1,621,694Other . . . . . . . . . . . . . . . . . . . . . . . . . . . . . . . . . . . . . . . . . . . . . . 36,969 91,284 42,635
W15,594,423 W19,203,963 W25,855,258
F-24
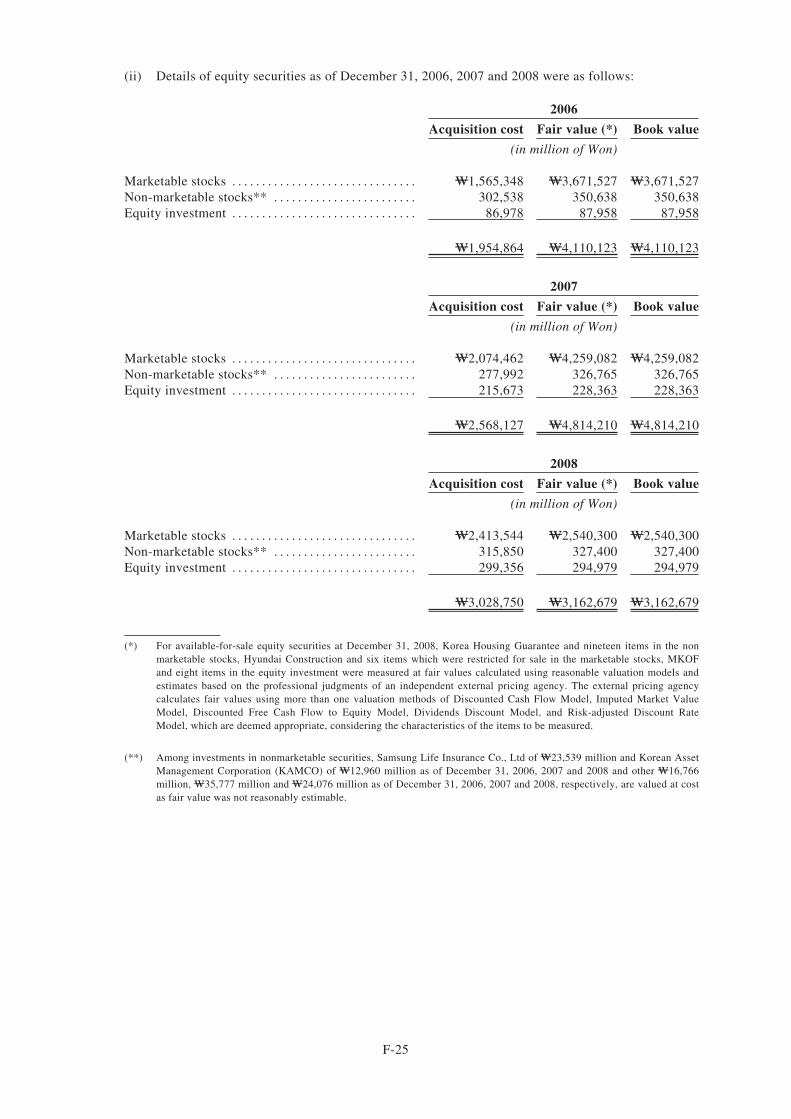
(ii) Details of equity securities as of December 31, 2006, 2007 and 2008 were as follows:
2006
Acquisition cost Fair value (*) Book value
(in million of Won)
Marketable stocks . . . . . . . . . . . . . . . . . . . . . . . . . . . . . . . W1,565,348 W3,671,527 W3,671,527Non-marketable stocks** . . . . . . . . . . . . . . . . . . . . . . . . 302,538 350,638 350,638Equity investment . . . . . . . . . . . . . . . . . . . . . . . . . . . . . . . 86,978 87,958 87,958
W1,954,864 W4,110,123 W4,110,123
2007
Acquisition cost Fair value (*) Book value
(in million of Won)
Marketable stocks . . . . . . . . . . . . . . . . . . . . . . . . . . . . . . . W2,074,462 W4,259,082 W4,259,082Non-marketable stocks** . . . . . . . . . . . . . . . . . . . . . . . . 277,992 326,765 326,765Equity investment . . . . . . . . . . . . . . . . . . . . . . . . . . . . . . . 215,673 228,363 228,363
W2,568,127 W4,814,210 W4,814,210
2008
Acquisition cost Fair value (*) Book value
(in million of Won)
Marketable stocks . . . . . . . . . . . . . . . . . . . . . . . . . . . . . . . W2,413,544 W2,540,300 W2,540,300Non-marketable stocks** . . . . . . . . . . . . . . . . . . . . . . . . 315,850 327,400 327,400Equity investment . . . . . . . . . . . . . . . . . . . . . . . . . . . . . . . 299,356 294,979 294,979
W3,028,750 W3,162,679 W3,162,679
(*) For available-for-sale equity securities at December 31, 2008, Korea Housing Guarantee and nineteen items in the nonmarketable stocks, Hyundai Construction and six items which were restricted for sale in the marketable stocks, MKOFand eight items in the equity investment were measured at fair values calculated using reasonable valuation models andestimates based on the professional judgments of an independent external pricing agency. The external pricing agencycalculates fair values using more than one valuation methods of Discounted Cash Flow Model, Imputed Market ValueModel, Discounted Free Cash Flow to Equity Model, Dividends Discount Model, and Risk-adjusted Discount RateModel, which are deemed appropriate, considering the characteristics of the items to be measured.
(**) Among investments in nonmarketable securities, Samsung Life Insurance Co., Ltd of W23,539 million and Korean AssetManagement Corporation (KAMCO) of W12,960 million as of December 31, 2006, 2007 and 2008 and other W16,766million, W35,777 million and W24,076 million as of December 31, 2006, 2007 and 2008, respectively, are valued at costas fair value was not reasonably estimable.
F-25
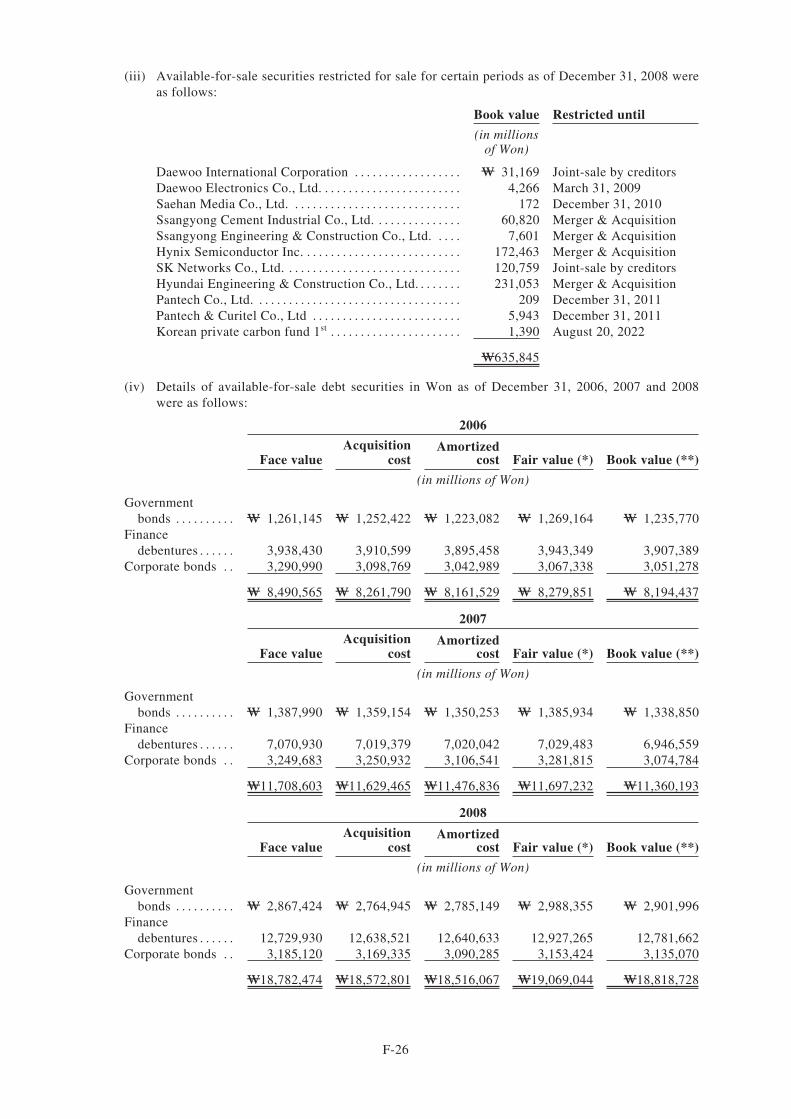
(iii) Available-for-sale securities restricted for sale for certain periods as of December 31, 2008 wereas follows:
Book value Restricted until
(in millionsof Won)
Daewoo International Corporation . . . . . . . . . . . . . . . . . . W 31,169 Joint-sale by creditorsDaewoo Electronics Co., Ltd. . . . . . . . . . . . . . . . . . . . . . . . 4,266 March 31, 2009Saehan Media Co., Ltd. . . . . . . . . . . . . . . . . . . . . . . . . . . . . 172 December 31, 2010Ssangyong Cement Industrial Co., Ltd. . . . . . . . . . . . . . . 60,820 Merger & AcquisitionSsangyong Engineering & Construction Co., Ltd. . . . . 7,601 Merger & AcquisitionHynix Semiconductor Inc. . . . . . . . . . . . . . . . . . . . . . . . . . . 172,463 Merger & AcquisitionSK Networks Co., Ltd. . . . . . . . . . . . . . . . . . . . . . . . . . . . . . 120,759 Joint-sale by creditorsHyundai Engineering & Construction Co., Ltd. . . . . . . . 231,053 Merger & AcquisitionPantech Co., Ltd. . . . . . . . . . . . . . . . . . . . . . . . . . . . . . . . . . . 209 December 31, 2011Pantech & Curitel Co., Ltd . . . . . . . . . . . . . . . . . . . . . . . . . 5,943 December 31, 2011Korean private carbon fund 1st . . . . . . . . . . . . . . . . . . . . . . 1,390 August 20, 2022
W635,845
(iv) Details of available-for-sale debt securities in Won as of December 31, 2006, 2007 and 2008were as follows:
2006
Face valueAcquisition
costAmortized
cost Fair value (*) Book value (**)
(in millions of Won)
Governmentbonds . . . . . . . . . . W 1,261,145 W 1,252,422 W 1,223,082 W 1,269,164 W 1,235,770
Financedebentures . . . . . . 3,938,430 3,910,599 3,895,458 3,943,349 3,907,389
Corporate bonds . . 3,290,990 3,098,769 3,042,989 3,067,338 3,051,278
W 8,490,565 W 8,261,790 W 8,161,529 W 8,279,851 W 8,194,437
2007
Face valueAcquisition
costAmortized
cost Fair value (*) Book value (**)
(in millions of Won)
Governmentbonds . . . . . . . . . . W 1,387,990 W 1,359,154 W 1,350,253 W 1,385,934 W 1,338,850
Financedebentures . . . . . . 7,070,930 7,019,379 7,020,042 7,029,483 6,946,559
Corporate bonds . . 3,249,683 3,250,932 3,106,541 3,281,815 3,074,784
W11,708,603 W11,629,465 W11,476,836 W11,697,232 W11,360,193
2008
Face valueAcquisition
costAmortized
cost Fair value (*) Book value (**)
(in millions of Won)
Governmentbonds . . . . . . . . . . W 2,867,424 W 2,764,945 W 2,785,149 W 2,988,355 W 2,901,996
Financedebentures . . . . . . 12,729,930 12,638,521 12,640,633 12,927,265 12,781,662
Corporate bonds . . 3,185,120 3,169,335 3,090,285 3,153,424 3,135,070
W18,782,474 W18,572,801 W18,516,067 W19,069,044 W18,818,728
F-26
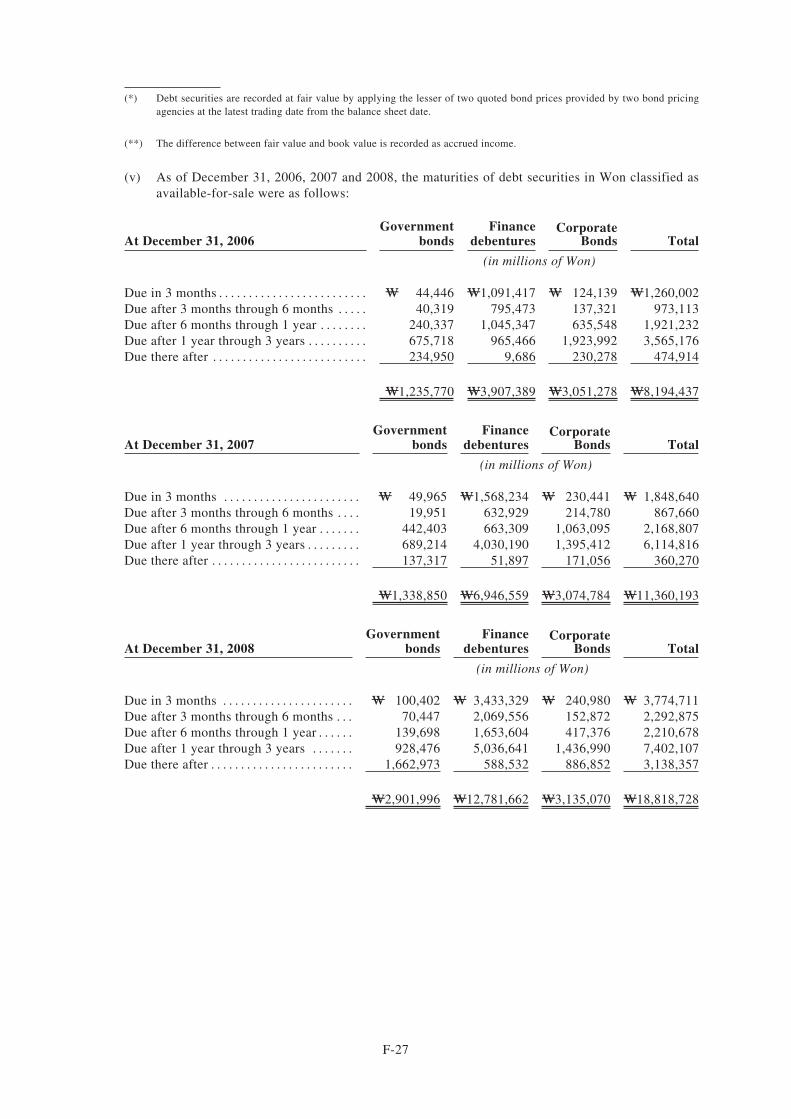
(*) Debt securities are recorded at fair value by applying the lesser of two quoted bond prices provided by two bond pricingagencies at the latest trading date from the balance sheet date.
(**) The difference between fair value and book value is recorded as accrued income.
(v) As of December 31, 2006, 2007 and 2008, the maturities of debt securities in Won classified asavailable-for-sale were as follows:
At December 31, 2006Government
bondsFinance
debenturesCorporate
Bonds Total
(in millions of Won)
Due in 3 months . . . . . . . . . . . . . . . . . . . . . . . . . W 44,446 W1,091,417 W 124,139 W1,260,002Due after 3 months through 6 months . . . . . 40,319 795,473 137,321 973,113Due after 6 months through 1 year . . . . . . . . 240,337 1,045,347 635,548 1,921,232Due after 1 year through 3 years . . . . . . . . . . 675,718 965,466 1,923,992 3,565,176Due there after . . . . . . . . . . . . . . . . . . . . . . . . . . 234,950 9,686 230,278 474,914
W1,235,770 W3,907,389 W3,051,278 W8,194,437
At December 31, 2007Government
bondsFinance
debenturesCorporate
Bonds Total
(in millions of Won)
Due in 3 months . . . . . . . . . . . . . . . . . . . . . . . W 49,965 W1,568,234 W 230,441 W 1,848,640Due after 3 months through 6 months . . . . 19,951 632,929 214,780 867,660Due after 6 months through 1 year . . . . . . . 442,403 663,309 1,063,095 2,168,807Due after 1 year through 3 years . . . . . . . . . 689,214 4,030,190 1,395,412 6,114,816Due there after . . . . . . . . . . . . . . . . . . . . . . . . . 137,317 51,897 171,056 360,270
W1,338,850 W6,946,559 W3,074,784 W11,360,193
At December 31, 2008Government
bondsFinance
debenturesCorporate
Bonds Total
(in millions of Won)
Due in 3 months . . . . . . . . . . . . . . . . . . . . . . W 100,402 W 3,433,329 W 240,980 W 3,774,711Due after 3 months through 6 months . . . 70,447 2,069,556 152,872 2,292,875Due after 6 months through 1 year . . . . . . 139,698 1,653,604 417,376 2,210,678Due after 1 year through 3 years . . . . . . . 928,476 5,036,641 1,436,990 7,402,107Due there after . . . . . . . . . . . . . . . . . . . . . . . . 1,662,973 588,532 886,852 3,138,357
W2,901,996 W12,781,662 W3,135,070 W18,818,728
F-27
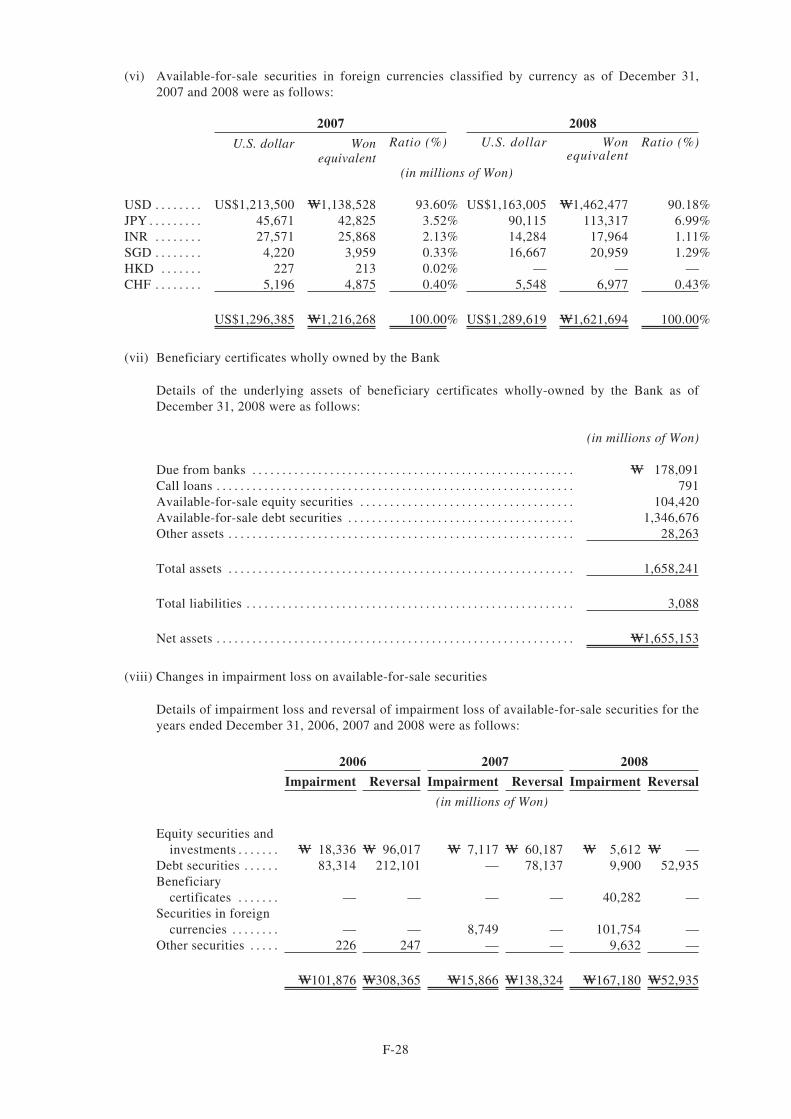
(vi) Available-for-sale securities in foreign currencies classified by currency as of December 31,2007 and 2008 were as follows:
2007 2008
U.S. dollar Wonequivalent
Ratio (%) U.S. dollar Wonequivalent
Ratio (%)
(in millions of Won)
USD . . . . . . . . US$1,213,500 W1,138,528 93.60% US$1,163,005 W1,462,477 90.18%JPY . . . . . . . . . 45,671 42,825 3.52% 90,115 113,317 6.99%INR . . . . . . . . 27,571 25,868 2.13% 14,284 17,964 1.11%SGD . . . . . . . . 4,220 3,959 0.33% 16,667 20,959 1.29%HKD . . . . . . . 227 213 0.02% — — —CHF . . . . . . . . 5,196 4,875 0.40% 5,548 6,977 0.43%
US$1,296,385 W1,216,268 100.00% US$1,289,619 W1,621,694 100.00%
(vii) Beneficiary certificates wholly owned by the Bank
Details of the underlying assets of beneficiary certificates wholly-owned by the Bank as ofDecember 31, 2008 were as follows:
(in millions of Won)
Due from banks . . . . . . . . . . . . . . . . . . . . . . . . . . . . . . . . . . . . . . . . . . . . . . . . . . . . . . W 178,091Call loans . . . . . . . . . . . . . . . . . . . . . . . . . . . . . . . . . . . . . . . . . . . . . . . . . . . . . . . . . . . . 791Available-for-sale equity securities . . . . . . . . . . . . . . . . . . . . . . . . . . . . . . . . . . . . 104,420Available-for-sale debt securities . . . . . . . . . . . . . . . . . . . . . . . . . . . . . . . . . . . . . . 1,346,676Other assets . . . . . . . . . . . . . . . . . . . . . . . . . . . . . . . . . . . . . . . . . . . . . . . . . . . . . . . . . . 28,263
Total assets . . . . . . . . . . . . . . . . . . . . . . . . . . . . . . . . . . . . . . . . . . . . . . . . . . . . . . . . . . 1,658,241
Total liabilities . . . . . . . . . . . . . . . . . . . . . . . . . . . . . . . . . . . . . . . . . . . . . . . . . . . . . . . 3,088
Net assets . . . . . . . . . . . . . . . . . . . . . . . . . . . . . . . . . . . . . . . . . . . . . . . . . . . . . . . . . . . . W1,655,153
(viii) Changes in impairment loss on available-for-sale securities
Details of impairment loss and reversal of impairment loss of available-for-sale securities for theyears ended December 31, 2006, 2007 and 2008 were as follows:
2006 2007 2008
Impairment Reversal Impairment Reversal Impairment Reversal
(in millions of Won)
Equity securities andinvestments . . . . . . . W 18,336 W 96,017 W 7,117 W 60,187 W 5,612 W —
Debt securities . . . . . . 83,314 212,101 — 78,137 9,900 52,935Beneficiary
certificates . . . . . . . — — — — 40,282 —Securities in foreign
currencies . . . . . . . . — — 8,749 — 101,754 —Other securities . . . . . 226 247 — — 9,632 —
W101,876 W308,365 W15,866 W138,324 W167,180 W52,935
F-28
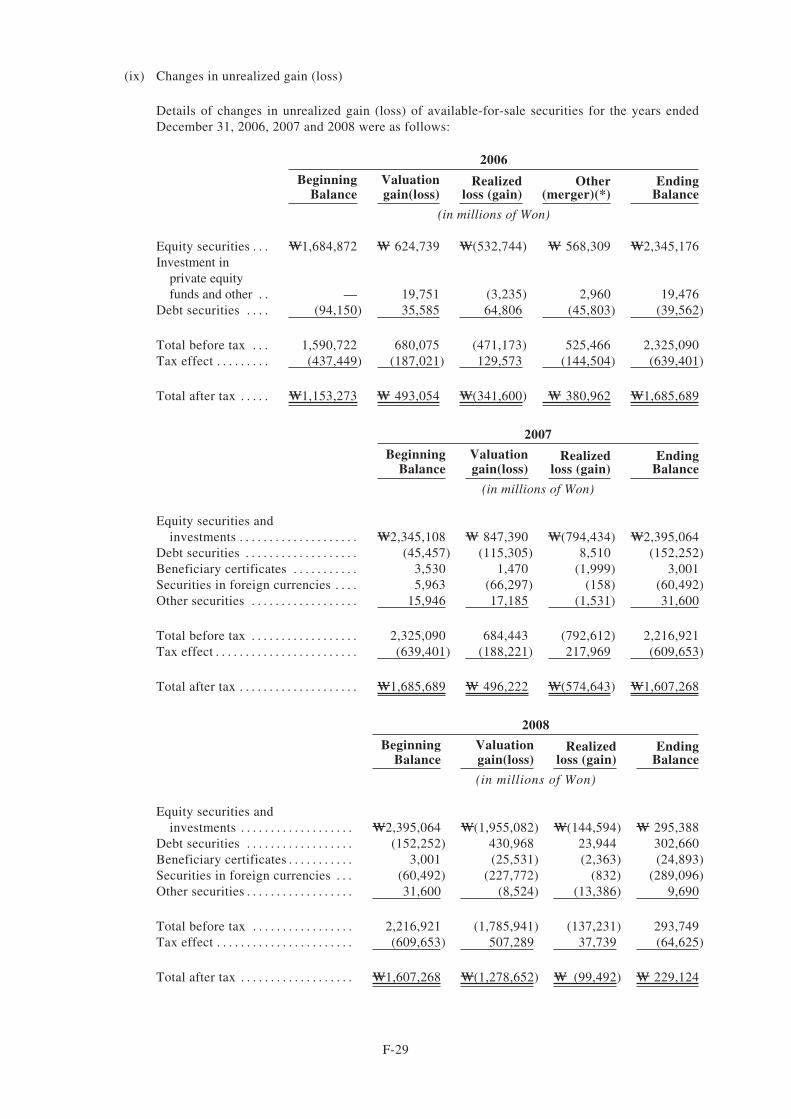
(ix) Changes in unrealized gain (loss)
Details of changes in unrealized gain (loss) of available-for-sale securities for the years endedDecember 31, 2006, 2007 and 2008 were as follows:
2006
BeginningBalance
Valuationgain(loss)
Realizedloss (gain)
Other(merger)(*)
EndingBalance
(in millions of Won)
Equity securities . . . W1,684,872 W 624,739 W(532,744) W 568,309 W2,345,176Investment in
private equityfunds and other . . — 19,751 (3,235) 2,960 19,476
Debt securities . . . . (94,150) 35,585 64,806 (45,803) (39,562)
Total before tax . . . 1,590,722 680,075 (471,173) 525,466 2,325,090Tax effect . . . . . . . . . (437,449) (187,021) 129,573 (144,504) (639,401)
Total after tax . . . . . W1,153,273 W 493,054 W(341,600) W 380,962 W1,685,689
2007
BeginningBalance
Valuationgain(loss)
Realizedloss (gain)
EndingBalance
(in millions of Won)
Equity securities andinvestments . . . . . . . . . . . . . . . . . . . . W2,345,108 W 847,390 W(794,434) W2,395,064
Debt securities . . . . . . . . . . . . . . . . . . . (45,457) (115,305) 8,510 (152,252)Beneficiary certificates . . . . . . . . . . . 3,530 1,470 (1,999) 3,001Securities in foreign currencies . . . . 5,963 (66,297) (158) (60,492)Other securities . . . . . . . . . . . . . . . . . . 15,946 17,185 (1,531) 31,600
Total before tax . . . . . . . . . . . . . . . . . . 2,325,090 684,443 (792,612) 2,216,921Tax effect . . . . . . . . . . . . . . . . . . . . . . . . (639,401) (188,221) 217,969 (609,653)
Total after tax . . . . . . . . . . . . . . . . . . . . W1,685,689 W 496,222 W(574,643) W1,607,268
2008
BeginningBalance
Valuationgain(loss)
Realizedloss (gain)
EndingBalance
(in millions of Won)
Equity securities andinvestments . . . . . . . . . . . . . . . . . . . W2,395,064 W(1,955,082) W(144,594) W 295,388
Debt securities . . . . . . . . . . . . . . . . . . (152,252) 430,968 23,944 302,660Beneficiary certificates . . . . . . . . . . . 3,001 (25,531) (2,363) (24,893)Securities in foreign currencies . . . (60,492) (227,772) (832) (289,096)Other securities . . . . . . . . . . . . . . . . . . 31,600 (8,524) (13,386) 9,690
Total before tax . . . . . . . . . . . . . . . . . 2,216,921 (1,785,941) (137,231) 293,749Tax effect . . . . . . . . . . . . . . . . . . . . . . . (609,653) 507,289 37,739 (64,625)
Total after tax . . . . . . . . . . . . . . . . . . . W1,607,268 W(1,278,652) W (99,492) W 229,124
F-29
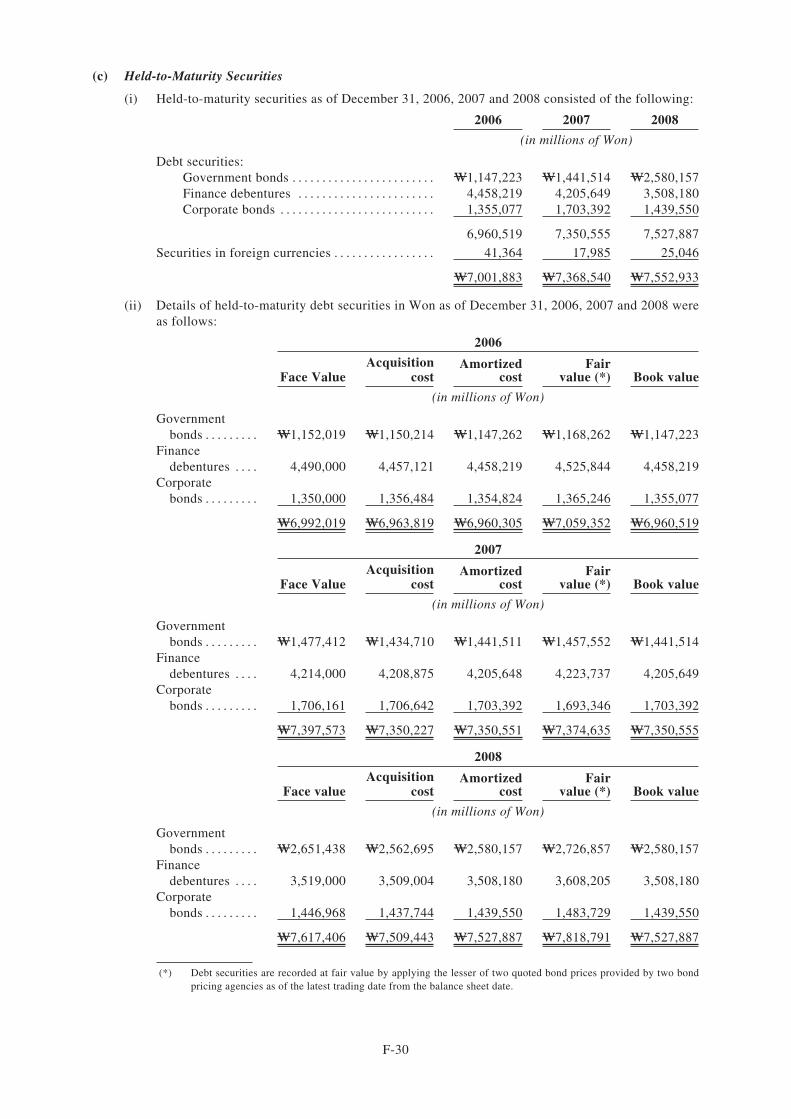
(c) Held-to-Maturity Securities
(i) Held-to-maturity securities as of December 31, 2006, 2007 and 2008 consisted of the following:
2006 2007 2008
(in millions of Won)
Debt securities:Government bonds . . . . . . . . . . . . . . . . . . . . . . . . W1,147,223 W1,441,514 W2,580,157Finance debentures . . . . . . . . . . . . . . . . . . . . . . . 4,458,219 4,205,649 3,508,180Corporate bonds . . . . . . . . . . . . . . . . . . . . . . . . . . 1,355,077 1,703,392 1,439,550
6,960,519 7,350,555 7,527,887
Securities in foreign currencies . . . . . . . . . . . . . . . . . 41,364 17,985 25,046
W7,001,883 W7,368,540 W7,552,933
(ii) Details of held-to-maturity debt securities in Won as of December 31, 2006, 2007 and 2008 wereas follows:
2006
Face ValueAcquisition
costAmortized
costFair
value (*) Book value
(in millions of Won)
Governmentbonds . . . . . . . . . W1,152,019 W1,150,214 W1,147,262 W1,168,262 W1,147,223
Financedebentures . . . . 4,490,000 4,457,121 4,458,219 4,525,844 4,458,219
Corporatebonds . . . . . . . . . 1,350,000 1,356,484 1,354,824 1,365,246 1,355,077
W6,992,019 W6,963,819 W6,960,305 W7,059,352 W6,960,519
2007
Face ValueAcquisition
costAmortized
costFair
value (*) Book value
(in millions of Won)
Governmentbonds . . . . . . . . . W1,477,412 W1,434,710 W1,441,511 W1,457,552 W1,441,514
Financedebentures . . . . 4,214,000 4,208,875 4,205,648 4,223,737 4,205,649
Corporatebonds . . . . . . . . . 1,706,161 1,706,642 1,703,392 1,693,346 1,703,392
W7,397,573 W7,350,227 W7,350,551 W7,374,635 W7,350,555
2008
Face valueAcquisition
costAmortized
costFair
value (*) Book value
(in millions of Won)
Governmentbonds . . . . . . . . . W2,651,438 W2,562,695 W2,580,157 W2,726,857 W2,580,157
Financedebentures . . . . 3,519,000 3,509,004 3,508,180 3,608,205 3,508,180
Corporatebonds . . . . . . . . . 1,446,968 1,437,744 1,439,550 1,483,729 1,439,550
W7,617,406 W7,509,443 W7,527,887 W7,818,791 W7,527,887
(*) Debt securities are recorded at fair value by applying the lesser of two quoted bond prices provided by two bondpricing agencies as of the latest trading date from the balance sheet date.
F-30
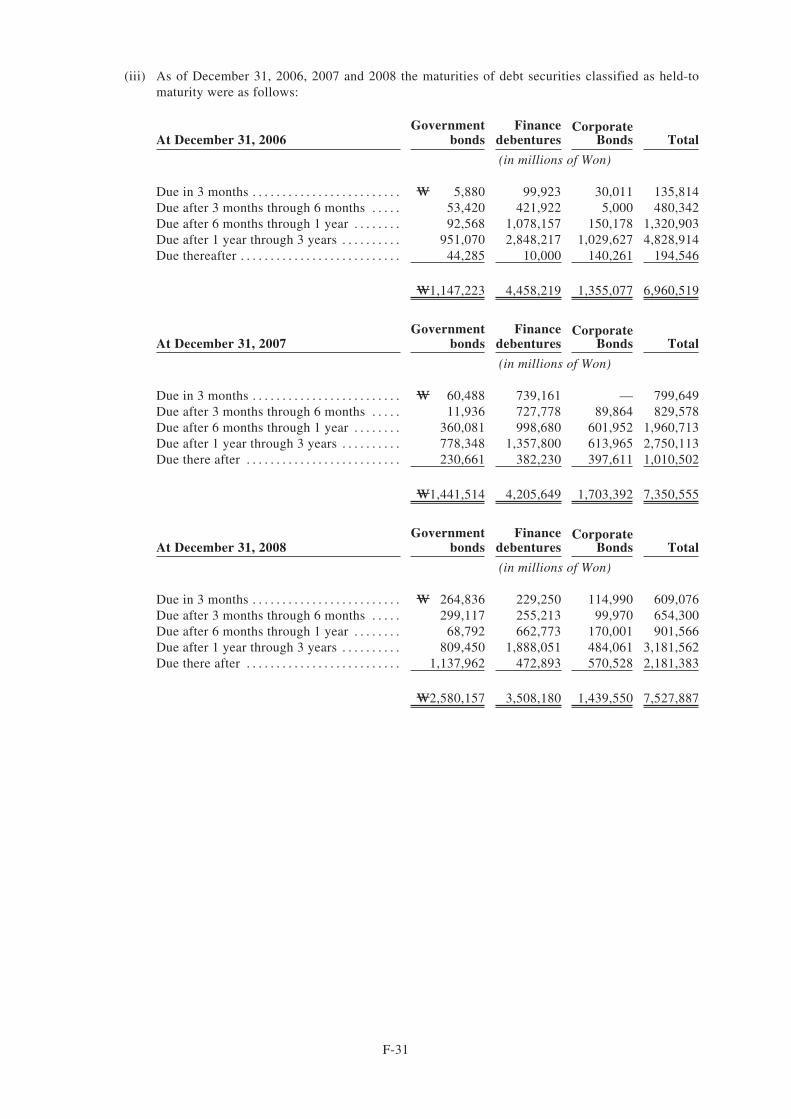
(iii) As of December 31, 2006, 2007 and 2008 the maturities of debt securities classified as held-tomaturity were as follows:
At December 31, 2006Government
bondsFinance
debenturesCorporate
Bonds Total
(in millions of Won)
Due in 3 months . . . . . . . . . . . . . . . . . . . . . . . . . W 5,880 99,923 30,011 135,814Due after 3 months through 6 months . . . . . 53,420 421,922 5,000 480,342Due after 6 months through 1 year . . . . . . . . 92,568 1,078,157 150,178 1,320,903Due after 1 year through 3 years . . . . . . . . . . 951,070 2,848,217 1,029,627 4,828,914Due thereafter . . . . . . . . . . . . . . . . . . . . . . . . . . . 44,285 10,000 140,261 194,546
W1,147,223 4,458,219 1,355,077 6,960,519
At December 31, 2007Government
bondsFinance
debenturesCorporate
Bonds Total
(in millions of Won)
Due in 3 months . . . . . . . . . . . . . . . . . . . . . . . . . W 60,488 739,161 — 799,649Due after 3 months through 6 months . . . . . 11,936 727,778 89,864 829,578Due after 6 months through 1 year . . . . . . . . 360,081 998,680 601,952 1,960,713Due after 1 year through 3 years . . . . . . . . . . 778,348 1,357,800 613,965 2,750,113Due there after . . . . . . . . . . . . . . . . . . . . . . . . . . 230,661 382,230 397,611 1,010,502
W1,441,514 4,205,649 1,703,392 7,350,555
At December 31, 2008Government
bondsFinance
debenturesCorporate
Bonds Total
(in millions of Won)
Due in 3 months . . . . . . . . . . . . . . . . . . . . . . . . . W 264,836 229,250 114,990 609,076Due after 3 months through 6 months . . . . . 299,117 255,213 99,970 654,300Due after 6 months through 1 year . . . . . . . . 68,792 662,773 170,001 901,566Due after 1 year through 3 years . . . . . . . . . . 809,450 1,888,051 484,061 3,181,562Due there after . . . . . . . . . . . . . . . . . . . . . . . . . . 1,137,962 472,893 570,528 2,181,383
W2,580,157 3,508,180 1,439,550 7,527,887
F-31
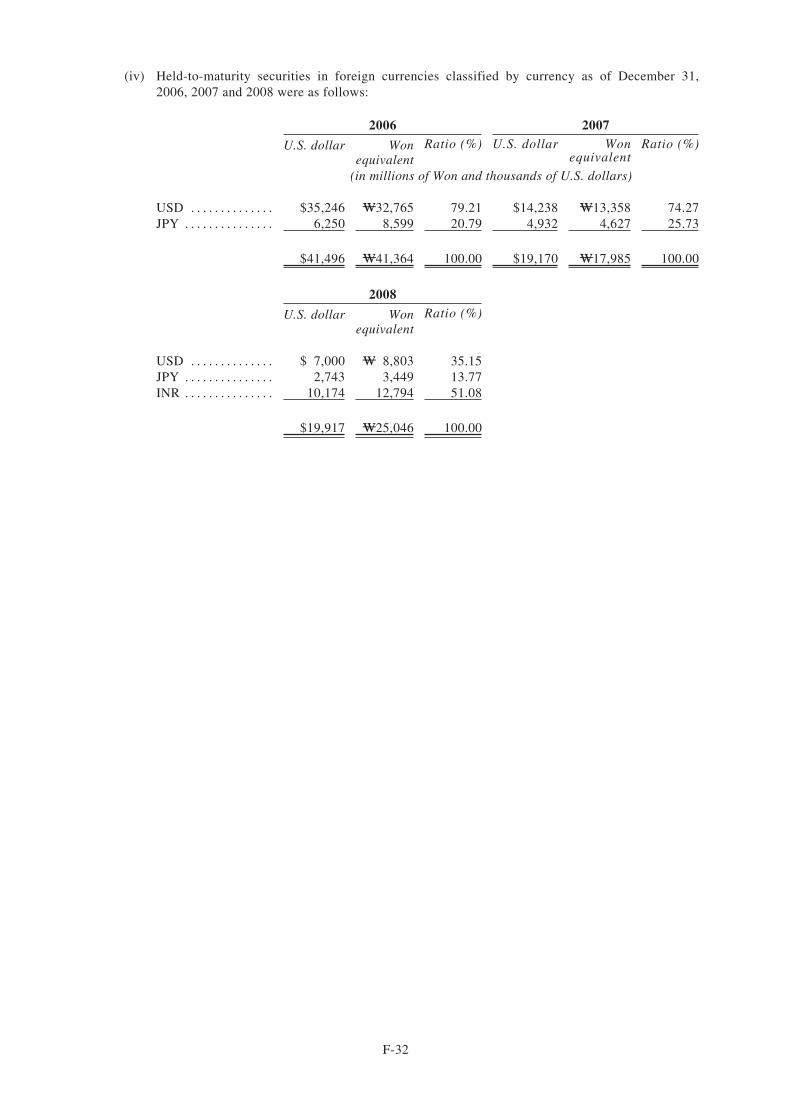
(iv) Held-to-maturity securities in foreign currencies classified by currency as of December 31,2006, 2007 and 2008 were as follows:
2006 2007
U.S. dollar Wonequivalent
Ratio (%) U.S. dollar Wonequivalent
Ratio (%)
(in millions of Won and thousands of U.S. dollars)
USD . . . . . . . . . . . . . . $35,246 W32,765 79.21 $14,238 W13,358 74.27JPY . . . . . . . . . . . . . . . 6,250 8,599 20.79 4,932 4,627 25.73
$41,496 W41,364 100.00 $19,170 W17,985 100.00
2008
U.S. dollar Wonequivalent
Ratio (%)
USD . . . . . . . . . . . . . . $ 7,000 W 8,803 35.15JPY . . . . . . . . . . . . . . . 2,743 3,449 13.77INR . . . . . . . . . . . . . . . 10,174 12,794 51.08
$19,917 W25,046 100.00
F-32
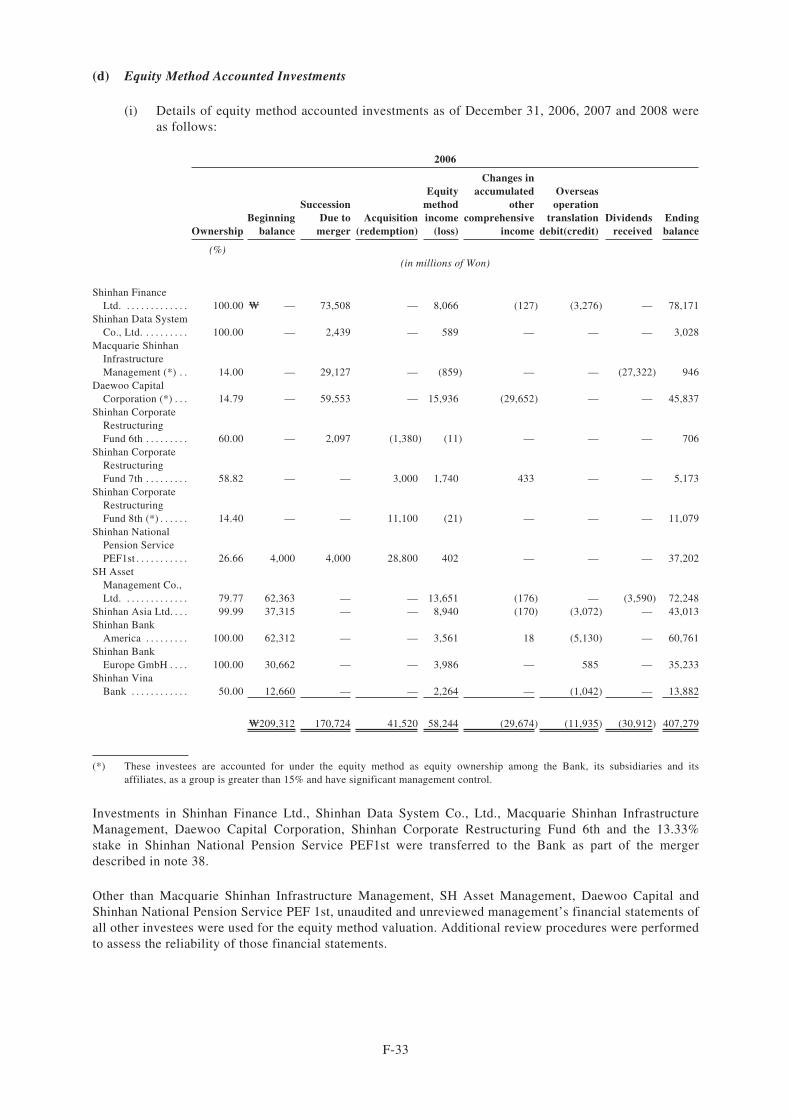
(d) Equity Method Accounted Investments
(i) Details of equity method accounted investments as of December 31, 2006, 2007 and 2008 wereas follows:
2006
OwnershipBeginning
balance
SuccessionDue to
mergerAcquisition
(redemption)
Equitymethodincome
(loss)
Changes inaccumulated
othercomprehensive
income
Overseasoperation
translationdebit(credit)
Dividendsreceived
Endingbalance
(%)(in millions of Won)
Shinhan FinanceLtd. . . . . . . . . . . . . . 100.00 W — 73,508 — 8,066 (127) (3,276) — 78,171
Shinhan Data SystemCo., Ltd. . . . . . . . . . 100.00 — 2,439 — 589 — — — 3,028
Macquarie ShinhanInfrastructureManagement (*) . . 14.00 — 29,127 — (859) — — (27,322) 946
Daewoo CapitalCorporation (*) . . . 14.79 — 59,553 — 15,936 (29,652) — — 45,837
Shinhan CorporateRestructuringFund 6th . . . . . . . . . 60.00 — 2,097 (1,380) (11) — — — 706
Shinhan CorporateRestructuringFund 7th . . . . . . . . . 58.82 — — 3,000 1,740 433 — — 5,173
Shinhan CorporateRestructuringFund 8th (*) . . . . . . 14.40 — — 11,100 (21) — — — 11,079
Shinhan NationalPension ServicePEF1st . . . . . . . . . . . 26.66 4,000 4,000 28,800 402 — — — 37,202
SH AssetManagement Co.,Ltd. . . . . . . . . . . . . . 79.77 62,363 — — 13,651 (176) — (3,590) 72,248
Shinhan Asia Ltd. . . . 99.99 37,315 — — 8,940 (170) (3,072) — 43,013Shinhan Bank
America . . . . . . . . . 100.00 62,312 — — 3,561 18 (5,130) — 60,761Shinhan Bank
Europe GmbH . . . . 100.00 30,662 — — 3,986 — 585 — 35,233Shinhan Vina
Bank . . . . . . . . . . . . 50.00 12,660 — — 2,264 — (1,042) — 13,882
W209,312 170,724 41,520 58,244 (29,674) (11,935) (30,912) 407,279
(*) These investees are accounted for under the equity method as equity ownership among the Bank, its subsidiaries and itsaffiliates, as a group is greater than 15% and have significant management control.
Investments in Shinhan Finance Ltd., Shinhan Data System Co., Ltd., Macquarie Shinhan InfrastructureManagement, Daewoo Capital Corporation, Shinhan Corporate Restructuring Fund 6th and the 13.33%stake in Shinhan National Pension Service PEF1st were transferred to the Bank as part of the mergerdescribed in note 38.
Other than Macquarie Shinhan Infrastructure Management, SH Asset Management, Daewoo Capital andShinhan National Pension Service PEF 1st, unaudited and unreviewed management’s financial statements ofall other investees were used for the equity method valuation. Additional review procedures were performedto assess the reliability of those financial statements.
F-33
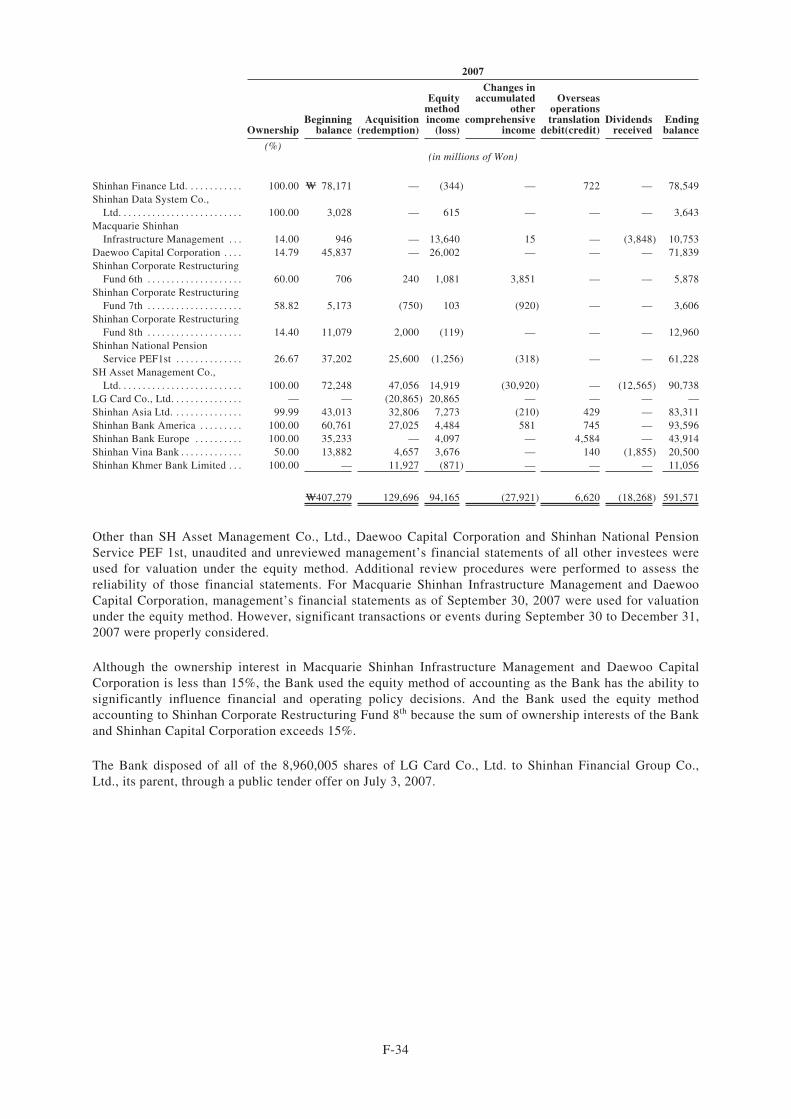
2007
OwnershipBeginning
balanceAcquisition
(redemption)
Equitymethodincome
(loss)
Changes inaccumulated
othercomprehensive
income
Overseasoperationstranslation
debit(credit)Dividends
receivedEndingbalance
(%)(in millions of Won)
Shinhan Finance Ltd. . . . . . . . . . . . 100.00 W 78,171 — (344) — 722 — 78,549Shinhan Data System Co.,
Ltd. . . . . . . . . . . . . . . . . . . . . . . . . . 100.00 3,028 — 615 — — — 3,643Macquarie Shinhan
Infrastructure Management . . . 14.00 946 — 13,640 15 — (3,848) 10,753Daewoo Capital Corporation . . . . 14.79 45,837 — 26,002 — — — 71,839Shinhan Corporate Restructuring
Fund 6th . . . . . . . . . . . . . . . . . . . . 60.00 706 240 1,081 3,851 — — 5,878Shinhan Corporate Restructuring
Fund 7th . . . . . . . . . . . . . . . . . . . . 58.82 5,173 (750) 103 (920) — — 3,606Shinhan Corporate Restructuring
Fund 8th . . . . . . . . . . . . . . . . . . . . 14.40 11,079 2,000 (119) — — — 12,960Shinhan National Pension
Service PEF1st . . . . . . . . . . . . . . 26.67 37,202 25,600 (1,256) (318) — — 61,228SH Asset Management Co.,
Ltd. . . . . . . . . . . . . . . . . . . . . . . . . . 100.00 72,248 47,056 14,919 (30,920) — (12,565) 90,738LG Card Co., Ltd. . . . . . . . . . . . . . . — — (20,865) 20,865 — — — —Shinhan Asia Ltd. . . . . . . . . . . . . . . 99.99 43,013 32,806 7,273 (210) 429 — 83,311Shinhan Bank America . . . . . . . . . 100.00 60,761 27,025 4,484 581 745 — 93,596Shinhan Bank Europe . . . . . . . . . . 100.00 35,233 — 4,097 — 4,584 — 43,914Shinhan Vina Bank . . . . . . . . . . . . . 50.00 13,882 4,657 3,676 — 140 (1,855) 20,500Shinhan Khmer Bank Limited . . . 100.00 — 11,927 (871) — — — 11,056
W407,279 129,696 94,165 (27,921) 6,620 (18,268) 591,571
Other than SH Asset Management Co., Ltd., Daewoo Capital Corporation and Shinhan National PensionService PEF 1st, unaudited and unreviewed management’s financial statements of all other investees wereused for valuation under the equity method. Additional review procedures were performed to assess thereliability of those financial statements. For Macquarie Shinhan Infrastructure Management and DaewooCapital Corporation, management’s financial statements as of September 30, 2007 were used for valuationunder the equity method. However, significant transactions or events during September 30 to December 31,2007 were properly considered.
Although the ownership interest in Macquarie Shinhan Infrastructure Management and Daewoo CapitalCorporation is less than 15%, the Bank used the equity method of accounting as the Bank has the ability tosignificantly influence financial and operating policy decisions. And the Bank used the equity methodaccounting to Shinhan Corporate Restructuring Fund 8th because the sum of ownership interests of the Bankand Shinhan Capital Corporation exceeds 15%.
The Bank disposed of all of the 8,960,005 shares of LG Card Co., Ltd. to Shinhan Financial Group Co.,Ltd., its parent, through a public tender offer on July 3, 2007.
F-34
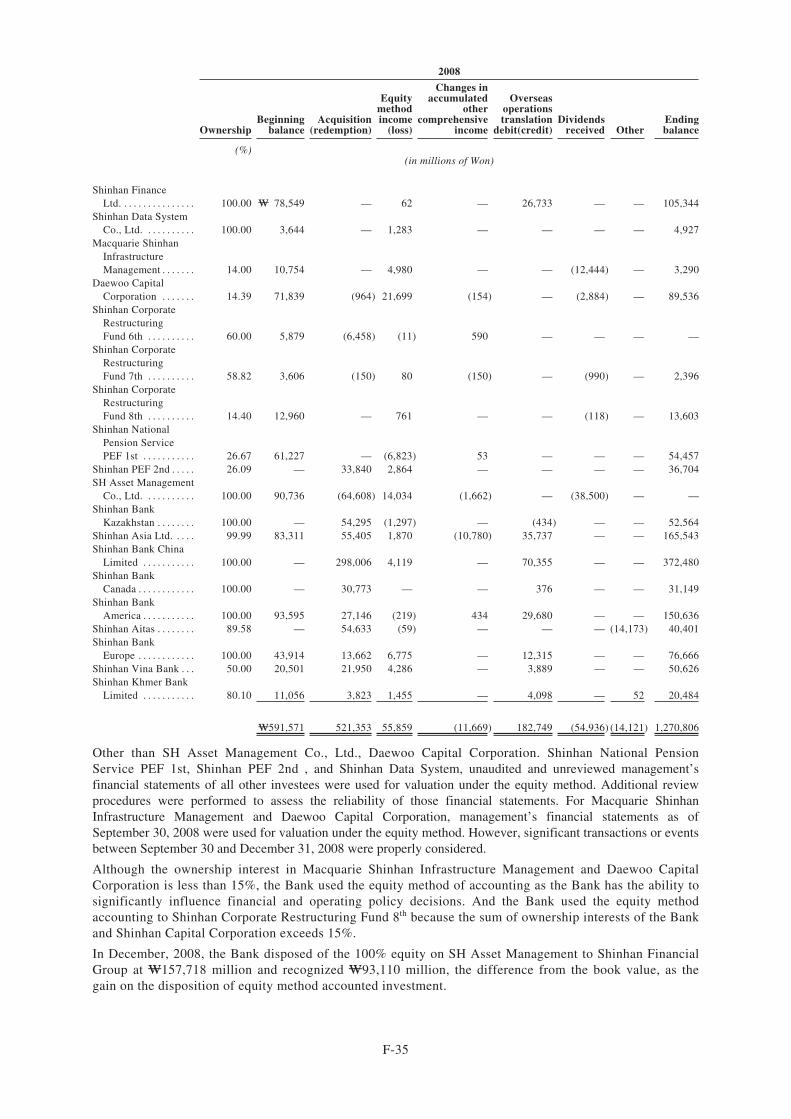
2008
OwnershipBeginning
balanceAcquisition
(redemption)
Equitymethodincome
(loss)
Changes inaccumulated
othercomprehensive
income
Overseasoperationstranslation
debit(credit)Dividends
received OtherEndingbalance
(%)(in millions of Won)
Shinhan FinanceLtd. . . . . . . . . . . . . . . . 100.00 W 78,549 — 62 — 26,733 — — 105,344
Shinhan Data SystemCo., Ltd. . . . . . . . . . . 100.00 3,644 — 1,283 — — — — 4,927
Macquarie ShinhanInfrastructureManagement . . . . . . . 14.00 10,754 — 4,980 — — (12,444) — 3,290
Daewoo CapitalCorporation . . . . . . . 14.39 71,839 (964) 21,699 (154) — (2,884) — 89,536
Shinhan CorporateRestructuringFund 6th . . . . . . . . . . 60.00 5,879 (6,458) (11) 590 — — — —
Shinhan CorporateRestructuringFund 7th . . . . . . . . . . 58.82 3,606 (150) 80 (150) — (990) — 2,396
Shinhan CorporateRestructuringFund 8th . . . . . . . . . . 14.40 12,960 — 761 — — (118) — 13,603
Shinhan NationalPension ServicePEF 1st . . . . . . . . . . . 26.67 61,227 — (6,823) 53 — — — 54,457
Shinhan PEF 2nd . . . . . 26.09 — 33,840 2,864 — — — — 36,704SH Asset Management
Co., Ltd. . . . . . . . . . . 100.00 90,736 (64,608) 14,034 (1,662) — (38,500) — —Shinhan Bank
Kazakhstan . . . . . . . . 100.00 — 54,295 (1,297) — (434) — — 52,564Shinhan Asia Ltd. . . . . 99.99 83,311 55,405 1,870 (10,780) 35,737 — — 165,543Shinhan Bank China
Limited . . . . . . . . . . . 100.00 — 298,006 4,119 — 70,355 — — 372,480Shinhan Bank
Canada . . . . . . . . . . . . 100.00 — 30,773 — — 376 — — 31,149Shinhan Bank
America . . . . . . . . . . . 100.00 93,595 27,146 (219) 434 29,680 — — 150,636Shinhan Aitas . . . . . . . . 89.58 — 54,633 (59) — — — (14,173) 40,401Shinhan Bank
Europe . . . . . . . . . . . . 100.00 43,914 13,662 6,775 — 12,315 — — 76,666Shinhan Vina Bank . . . 50.00 20,501 21,950 4,286 — 3,889 — — 50,626Shinhan Khmer Bank
Limited . . . . . . . . . . . 80.10 11,056 3,823 1,455 — 4,098 — 52 20,484
W591,571 521,353 55,859 (11,669) 182,749 (54,936) (14,121) 1,270,806
Other than SH Asset Management Co., Ltd., Daewoo Capital Corporation. Shinhan National PensionService PEF 1st, Shinhan PEF 2nd , and Shinhan Data System, unaudited and unreviewed management’sfinancial statements of all other investees were used for valuation under the equity method. Additional reviewprocedures were performed to assess the reliability of those financial statements. For Macquarie ShinhanInfrastructure Management and Daewoo Capital Corporation, management’s financial statements as ofSeptember 30, 2008 were used for valuation under the equity method. However, significant transactions or eventsbetween September 30 and December 31, 2008 were properly considered.
Although the ownership interest in Macquarie Shinhan Infrastructure Management and Daewoo CapitalCorporation is less than 15%, the Bank used the equity method of accounting as the Bank has the ability tosignificantly influence financial and operating policy decisions. And the Bank used the equity methodaccounting to Shinhan Corporate Restructuring Fund 8th because the sum of ownership interests of the Bankand Shinhan Capital Corporation exceeds 15%.
In December, 2008, the Bank disposed of the 100% equity on SH Asset Management to Shinhan FinancialGroup at W157,718 million and recognized W93,110 million, the difference from the book value, as thegain on the disposition of equity method accounted investment.
F-35
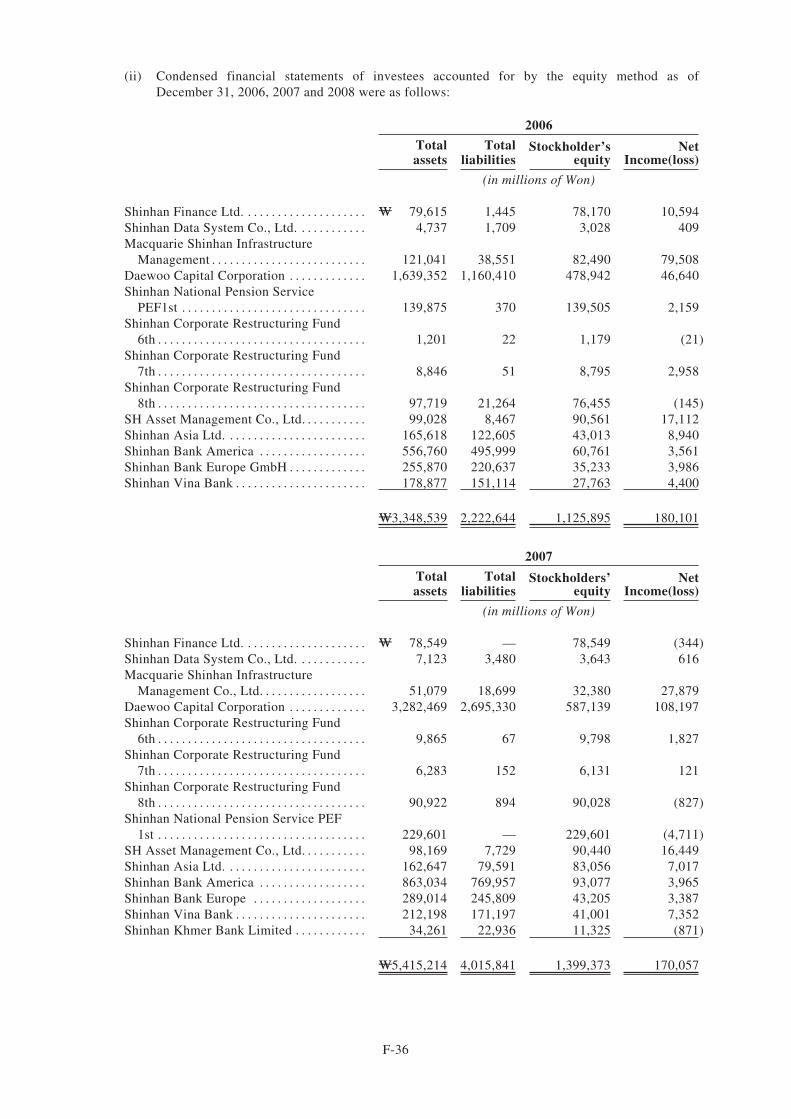
(ii) Condensed financial statements of investees accounted for by the equity method as ofDecember 31, 2006, 2007 and 2008 were as follows:
2006
Totalassets
Totalliabilities
Stockholder’sequity
NetIncome(loss)
(in millions of Won)
Shinhan Finance Ltd. . . . . . . . . . . . . . . . . . . . . W 79,615 1,445 78,170 10,594Shinhan Data System Co., Ltd. . . . . . . . . . . . 4,737 1,709 3,028 409Macquarie Shinhan Infrastructure
Management . . . . . . . . . . . . . . . . . . . . . . . . . . 121,041 38,551 82,490 79,508Daewoo Capital Corporation . . . . . . . . . . . . . 1,639,352 1,160,410 478,942 46,640Shinhan National Pension Service
PEF1st . . . . . . . . . . . . . . . . . . . . . . . . . . . . . . . 139,875 370 139,505 2,159Shinhan Corporate Restructuring Fund
6th . . . . . . . . . . . . . . . . . . . . . . . . . . . . . . . . . . . 1,201 22 1,179 (21)Shinhan Corporate Restructuring Fund
7th . . . . . . . . . . . . . . . . . . . . . . . . . . . . . . . . . . . 8,846 51 8,795 2,958Shinhan Corporate Restructuring Fund
8th . . . . . . . . . . . . . . . . . . . . . . . . . . . . . . . . . . . 97,719 21,264 76,455 (145)SH Asset Management Co., Ltd. . . . . . . . . . . 99,028 8,467 90,561 17,112Shinhan Asia Ltd. . . . . . . . . . . . . . . . . . . . . . . . 165,618 122,605 43,013 8,940Shinhan Bank America . . . . . . . . . . . . . . . . . . 556,760 495,999 60,761 3,561Shinhan Bank Europe GmbH . . . . . . . . . . . . . 255,870 220,637 35,233 3,986Shinhan Vina Bank . . . . . . . . . . . . . . . . . . . . . . 178,877 151,114 27,763 4,400
W3,348,539 2,222,644 1,125,895 180,101
2007
Totalassets
Totalliabilities
Stockholders’equity
NetIncome(loss)
(in millions of Won)
Shinhan Finance Ltd. . . . . . . . . . . . . . . . . . . . . W 78,549 — 78,549 (344)Shinhan Data System Co., Ltd. . . . . . . . . . . . 7,123 3,480 3,643 616Macquarie Shinhan Infrastructure
Management Co., Ltd. . . . . . . . . . . . . . . . . . 51,079 18,699 32,380 27,879Daewoo Capital Corporation . . . . . . . . . . . . . 3,282,469 2,695,330 587,139 108,197Shinhan Corporate Restructuring Fund
6th . . . . . . . . . . . . . . . . . . . . . . . . . . . . . . . . . . . 9,865 67 9,798 1,827Shinhan Corporate Restructuring Fund
7th . . . . . . . . . . . . . . . . . . . . . . . . . . . . . . . . . . . 6,283 152 6,131 121Shinhan Corporate Restructuring Fund
8th . . . . . . . . . . . . . . . . . . . . . . . . . . . . . . . . . . . 90,922 894 90,028 (827)Shinhan National Pension Service PEF
1st . . . . . . . . . . . . . . . . . . . . . . . . . . . . . . . . . . . 229,601 — 229,601 (4,711)SH Asset Management Co., Ltd. . . . . . . . . . . 98,169 7,729 90,440 16,449Shinhan Asia Ltd. . . . . . . . . . . . . . . . . . . . . . . . 162,647 79,591 83,056 7,017Shinhan Bank America . . . . . . . . . . . . . . . . . . 863,034 769,957 93,077 3,965Shinhan Bank Europe . . . . . . . . . . . . . . . . . . . 289,014 245,809 43,205 3,387Shinhan Vina Bank . . . . . . . . . . . . . . . . . . . . . . 212,198 171,197 41,001 7,352Shinhan Khmer Bank Limited . . . . . . . . . . . . 34,261 22,936 11,325 (871)
W5,415,214 4,015,841 1,399,373 170,057
F-36
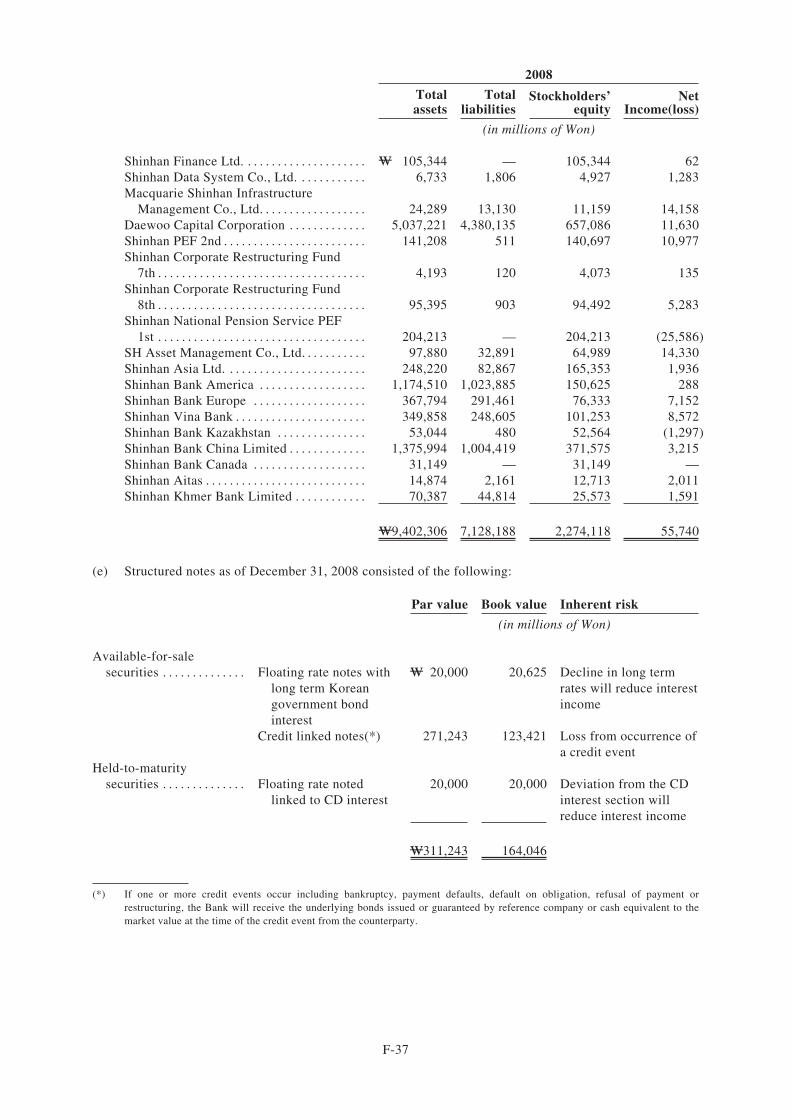
2008
Totalassets
Totalliabilities
Stockholders’equity
NetIncome(loss)
(in millions of Won)
Shinhan Finance Ltd. . . . . . . . . . . . . . . . . . . . . W 105,344 — 105,344 62Shinhan Data System Co., Ltd. . . . . . . . . . . . 6,733 1,806 4,927 1,283Macquarie Shinhan Infrastructure
Management Co., Ltd. . . . . . . . . . . . . . . . . . 24,289 13,130 11,159 14,158Daewoo Capital Corporation . . . . . . . . . . . . . 5,037,221 4,380,135 657,086 11,630Shinhan PEF 2nd . . . . . . . . . . . . . . . . . . . . . . . . 141,208 511 140,697 10,977Shinhan Corporate Restructuring Fund
7th . . . . . . . . . . . . . . . . . . . . . . . . . . . . . . . . . . . 4,193 120 4,073 135Shinhan Corporate Restructuring Fund
8th . . . . . . . . . . . . . . . . . . . . . . . . . . . . . . . . . . . 95,395 903 94,492 5,283Shinhan National Pension Service PEF
1st . . . . . . . . . . . . . . . . . . . . . . . . . . . . . . . . . . . 204,213 — 204,213 (25,586)SH Asset Management Co., Ltd. . . . . . . . . . . 97,880 32,891 64,989 14,330Shinhan Asia Ltd. . . . . . . . . . . . . . . . . . . . . . . . 248,220 82,867 165,353 1,936Shinhan Bank America . . . . . . . . . . . . . . . . . . 1,174,510 1,023,885 150,625 288Shinhan Bank Europe . . . . . . . . . . . . . . . . . . . 367,794 291,461 76,333 7,152Shinhan Vina Bank . . . . . . . . . . . . . . . . . . . . . . 349,858 248,605 101,253 8,572Shinhan Bank Kazakhstan . . . . . . . . . . . . . . . 53,044 480 52,564 (1,297)Shinhan Bank China Limited . . . . . . . . . . . . . 1,375,994 1,004,419 371,575 3,215Shinhan Bank Canada . . . . . . . . . . . . . . . . . . . 31,149 — 31,149 —Shinhan Aitas . . . . . . . . . . . . . . . . . . . . . . . . . . . 14,874 2,161 12,713 2,011Shinhan Khmer Bank Limited . . . . . . . . . . . . 70,387 44,814 25,573 1,591
W9,402,306 7,128,188 2,274,118 55,740
(e) Structured notes as of December 31, 2008 consisted of the following:
Par value Book value Inherent risk
(in millions of Won)
Available-for-salesecurities . . . . . . . . . . . . . . Floating rate notes with
long term Koreangovernment bondinterest
W 20,000 20,625 Decline in long termrates will reduce interestincome
Credit linked notes(*) 271,243 123,421 Loss from occurrence ofa credit event
Held-to-maturitysecurities . . . . . . . . . . . . . . Floating rate noted
linked to CD interest20,000 20,000 Deviation from the CD
interest section willreduce interest income
W311,243 164,046
(*) If one or more credit events occur including bankruptcy, payment defaults, default on obligation, refusal of payment orrestructuring, the Bank will receive the underlying bonds issued or guaranteed by reference company or cash equivalent to themarket value at the time of the credit event from the counterparty.
F-37
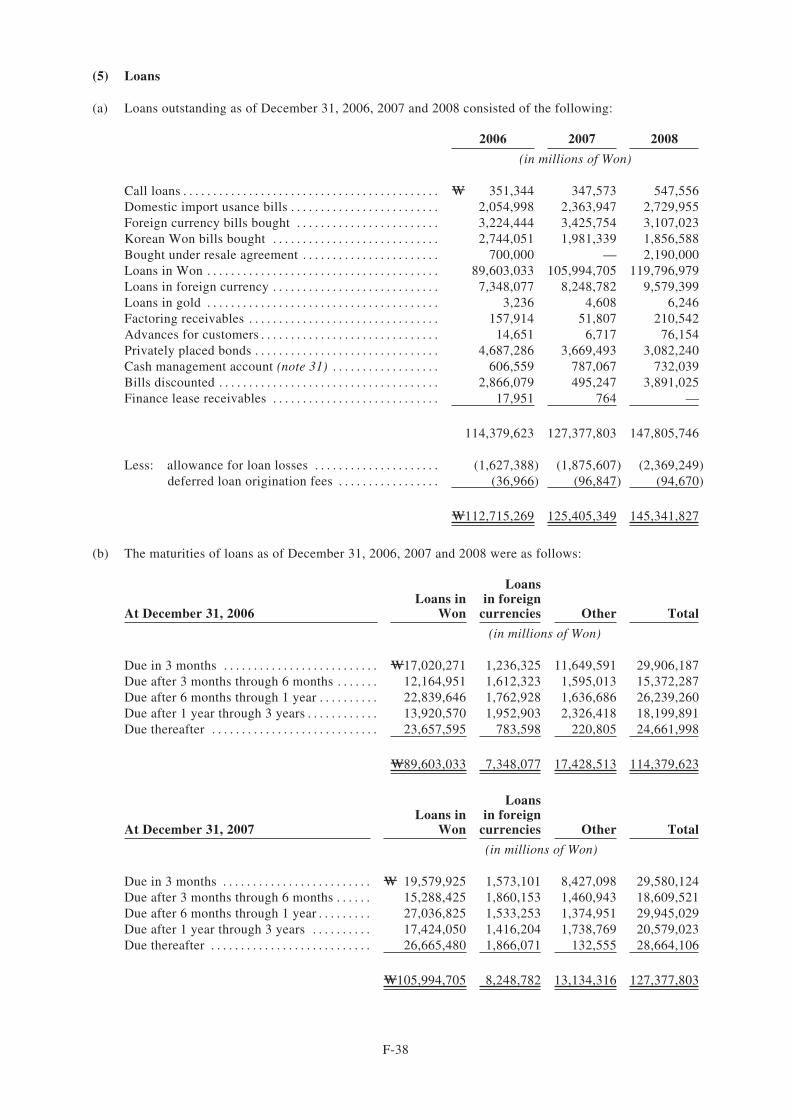
(5) Loans
(a) Loans outstanding as of December 31, 2006, 2007 and 2008 consisted of the following:
2006 2007 2008
(in millions of Won)
Call loans . . . . . . . . . . . . . . . . . . . . . . . . . . . . . . . . . . . . . . . . . . . W 351,344 347,573 547,556Domestic import usance bills . . . . . . . . . . . . . . . . . . . . . . . . . 2,054,998 2,363,947 2,729,955Foreign currency bills bought . . . . . . . . . . . . . . . . . . . . . . . . 3,224,444 3,425,754 3,107,023Korean Won bills bought . . . . . . . . . . . . . . . . . . . . . . . . . . . . 2,744,051 1,981,339 1,856,588Bought under resale agreement . . . . . . . . . . . . . . . . . . . . . . . 700,000 — 2,190,000Loans in Won . . . . . . . . . . . . . . . . . . . . . . . . . . . . . . . . . . . . . . . 89,603,033 105,994,705 119,796,979Loans in foreign currency . . . . . . . . . . . . . . . . . . . . . . . . . . . . 7,348,077 8,248,782 9,579,399Loans in gold . . . . . . . . . . . . . . . . . . . . . . . . . . . . . . . . . . . . . . . 3,236 4,608 6,246Factoring receivables . . . . . . . . . . . . . . . . . . . . . . . . . . . . . . . . 157,914 51,807 210,542Advances for customers . . . . . . . . . . . . . . . . . . . . . . . . . . . . . . 14,651 6,717 76,154Privately placed bonds . . . . . . . . . . . . . . . . . . . . . . . . . . . . . . . 4,687,286 3,669,493 3,082,240Cash management account (note 31) . . . . . . . . . . . . . . . . . . 606,559 787,067 732,039Bills discounted . . . . . . . . . . . . . . . . . . . . . . . . . . . . . . . . . . . . . 2,866,079 495,247 3,891,025Finance lease receivables . . . . . . . . . . . . . . . . . . . . . . . . . . . . 17,951 764 —
114,379,623 127,377,803 147,805,746
Less: allowance for loan losses . . . . . . . . . . . . . . . . . . . . . (1,627,388) (1,875,607) (2,369,249)deferred loan origination fees . . . . . . . . . . . . . . . . . (36,966) (96,847) (94,670)
W112,715,269 125,405,349 145,341,827
(b) The maturities of loans as of December 31, 2006, 2007 and 2008 were as follows:
At December 31, 2006Loans in
Won
Loansin foreign
currencies Other Total
(in millions of Won)
Due in 3 months . . . . . . . . . . . . . . . . . . . . . . . . . . W17,020,271 1,236,325 11,649,591 29,906,187Due after 3 months through 6 months . . . . . . . 12,164,951 1,612,323 1,595,013 15,372,287Due after 6 months through 1 year . . . . . . . . . . 22,839,646 1,762,928 1,636,686 26,239,260Due after 1 year through 3 years . . . . . . . . . . . . 13,920,570 1,952,903 2,326,418 18,199,891Due thereafter . . . . . . . . . . . . . . . . . . . . . . . . . . . . 23,657,595 783,598 220,805 24,661,998
W89,603,033 7,348,077 17,428,513 114,379,623
At December 31, 2007Loans in
Won
Loansin foreign
currencies Other Total
(in millions of Won)
Due in 3 months . . . . . . . . . . . . . . . . . . . . . . . . . W 19,579,925 1,573,101 8,427,098 29,580,124Due after 3 months through 6 months . . . . . . 15,288,425 1,860,153 1,460,943 18,609,521Due after 6 months through 1 year . . . . . . . . . 27,036,825 1,533,253 1,374,951 29,945,029Due after 1 year through 3 years . . . . . . . . . . 17,424,050 1,416,204 1,738,769 20,579,023Due thereafter . . . . . . . . . . . . . . . . . . . . . . . . . . . 26,665,480 1,866,071 132,555 28,664,106
W105,994,705 8,248,782 13,134,316 127,377,803
F-38
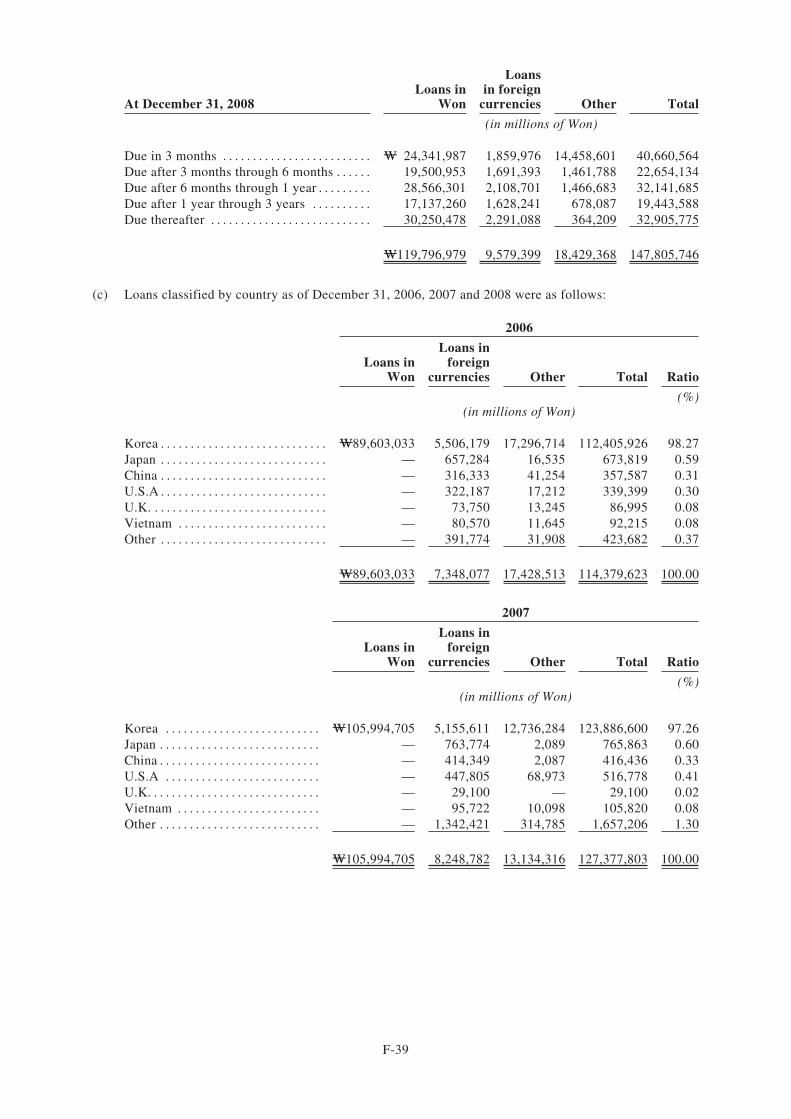
At December 31, 2008Loans in
Won
Loansin foreign
currencies Other Total
(in millions of Won)
Due in 3 months . . . . . . . . . . . . . . . . . . . . . . . . . W 24,341,987 1,859,976 14,458,601 40,660,564Due after 3 months through 6 months . . . . . . 19,500,953 1,691,393 1,461,788 22,654,134Due after 6 months through 1 year . . . . . . . . . 28,566,301 2,108,701 1,466,683 32,141,685Due after 1 year through 3 years . . . . . . . . . . 17,137,260 1,628,241 678,087 19,443,588Due thereafter . . . . . . . . . . . . . . . . . . . . . . . . . . . 30,250,478 2,291,088 364,209 32,905,775
W119,796,979 9,579,399 18,429,368 147,805,746
(c) Loans classified by country as of December 31, 2006, 2007 and 2008 were as follows:
2006
Loans inWon
Loans inforeign
currencies Other Total Ratio
(%)(in millions of Won)
Korea . . . . . . . . . . . . . . . . . . . . . . . . . . . . W89,603,033 5,506,179 17,296,714 112,405,926 98.27Japan . . . . . . . . . . . . . . . . . . . . . . . . . . . . — 657,284 16,535 673,819 0.59China . . . . . . . . . . . . . . . . . . . . . . . . . . . . — 316,333 41,254 357,587 0.31U.S.A . . . . . . . . . . . . . . . . . . . . . . . . . . . . — 322,187 17,212 339,399 0.30U.K. . . . . . . . . . . . . . . . . . . . . . . . . . . . . . — 73,750 13,245 86,995 0.08Vietnam . . . . . . . . . . . . . . . . . . . . . . . . . — 80,570 11,645 92,215 0.08Other . . . . . . . . . . . . . . . . . . . . . . . . . . . . — 391,774 31,908 423,682 0.37
W89,603,033 7,348,077 17,428,513 114,379,623 100.00
2007
Loans inWon
Loans inforeign
currencies Other Total Ratio
(%)(in millions of Won)
Korea . . . . . . . . . . . . . . . . . . . . . . . . . . W105,994,705 5,155,611 12,736,284 123,886,600 97.26Japan . . . . . . . . . . . . . . . . . . . . . . . . . . . — 763,774 2,089 765,863 0.60China . . . . . . . . . . . . . . . . . . . . . . . . . . . — 414,349 2,087 416,436 0.33U.S.A . . . . . . . . . . . . . . . . . . . . . . . . . . — 447,805 68,973 516,778 0.41U.K. . . . . . . . . . . . . . . . . . . . . . . . . . . . . — 29,100 — 29,100 0.02Vietnam . . . . . . . . . . . . . . . . . . . . . . . . — 95,722 10,098 105,820 0.08Other . . . . . . . . . . . . . . . . . . . . . . . . . . . — 1,342,421 314,785 1,657,206 1.30
W105,994,705 8,248,782 13,134,316 127,377,803 100.00
F-39
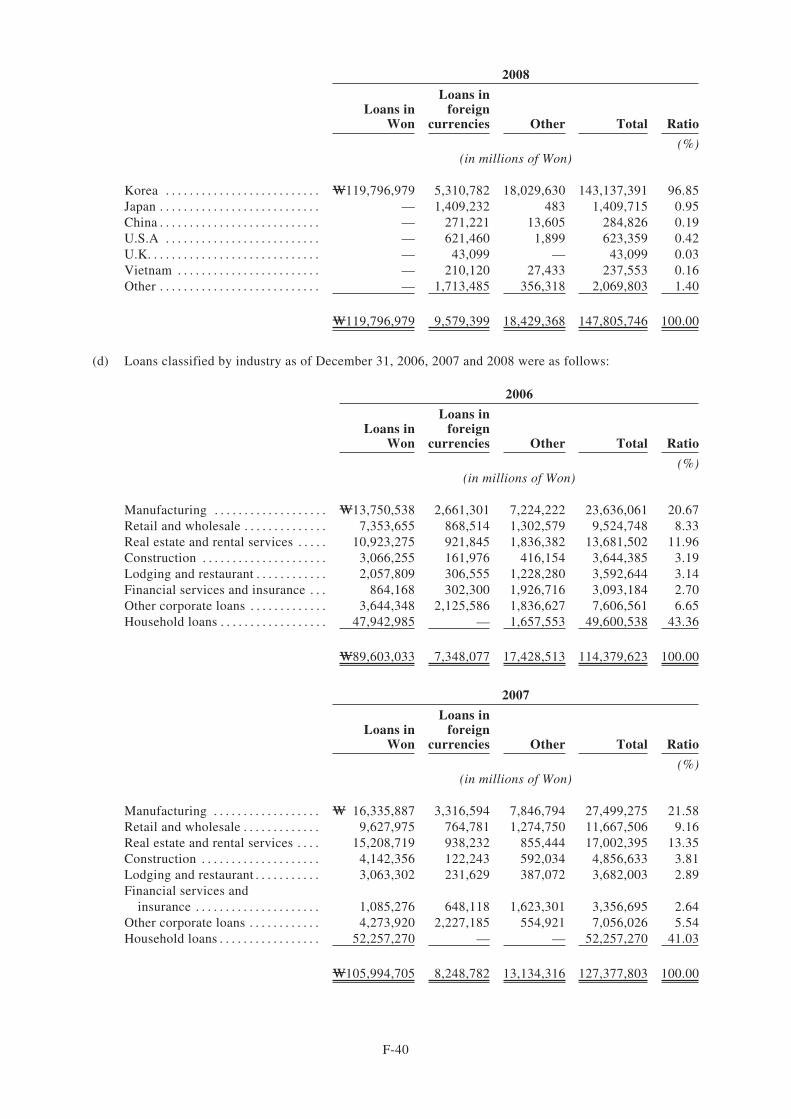
2008
Loans inWon
Loans inforeign
currencies Other Total Ratio
(%)(in millions of Won)
Korea . . . . . . . . . . . . . . . . . . . . . . . . . . W119,796,979 5,310,782 18,029,630 143,137,391 96.85Japan . . . . . . . . . . . . . . . . . . . . . . . . . . . — 1,409,232 483 1,409,715 0.95China . . . . . . . . . . . . . . . . . . . . . . . . . . . — 271,221 13,605 284,826 0.19U.S.A . . . . . . . . . . . . . . . . . . . . . . . . . . — 621,460 1,899 623,359 0.42U.K. . . . . . . . . . . . . . . . . . . . . . . . . . . . . — 43,099 — 43,099 0.03Vietnam . . . . . . . . . . . . . . . . . . . . . . . . — 210,120 27,433 237,553 0.16Other . . . . . . . . . . . . . . . . . . . . . . . . . . . — 1,713,485 356,318 2,069,803 1.40
W119,796,979 9,579,399 18,429,368 147,805,746 100.00
(d) Loans classified by industry as of December 31, 2006, 2007 and 2008 were as follows:
2006
Loans inWon
Loans inforeign
currencies Other Total Ratio
(%)(in millions of Won)
Manufacturing . . . . . . . . . . . . . . . . . . . W13,750,538 2,661,301 7,224,222 23,636,061 20.67Retail and wholesale . . . . . . . . . . . . . . 7,353,655 868,514 1,302,579 9,524,748 8.33Real estate and rental services . . . . . 10,923,275 921,845 1,836,382 13,681,502 11.96Construction . . . . . . . . . . . . . . . . . . . . . 3,066,255 161,976 416,154 3,644,385 3.19Lodging and restaurant . . . . . . . . . . . . 2,057,809 306,555 1,228,280 3,592,644 3.14Financial services and insurance . . . 864,168 302,300 1,926,716 3,093,184 2.70Other corporate loans . . . . . . . . . . . . . 3,644,348 2,125,586 1,836,627 7,606,561 6.65Household loans . . . . . . . . . . . . . . . . . . 47,942,985 — 1,657,553 49,600,538 43.36
W89,603,033 7,348,077 17,428,513 114,379,623 100.00
2007
Loans inWon
Loans inforeign
currencies Other Total Ratio
(%)(in millions of Won)
Manufacturing . . . . . . . . . . . . . . . . . . W 16,335,887 3,316,594 7,846,794 27,499,275 21.58Retail and wholesale . . . . . . . . . . . . . 9,627,975 764,781 1,274,750 11,667,506 9.16Real estate and rental services . . . . 15,208,719 938,232 855,444 17,002,395 13.35Construction . . . . . . . . . . . . . . . . . . . . 4,142,356 122,243 592,034 4,856,633 3.81Lodging and restaurant . . . . . . . . . . . 3,063,302 231,629 387,072 3,682,003 2.89Financial services and
insurance . . . . . . . . . . . . . . . . . . . . . 1,085,276 648,118 1,623,301 3,356,695 2.64Other corporate loans . . . . . . . . . . . . 4,273,920 2,227,185 554,921 7,056,026 5.54Household loans . . . . . . . . . . . . . . . . . 52,257,270 — — 52,257,270 41.03
W105,994,705 8,248,782 13,134,316 127,377,803 100.00
F-40
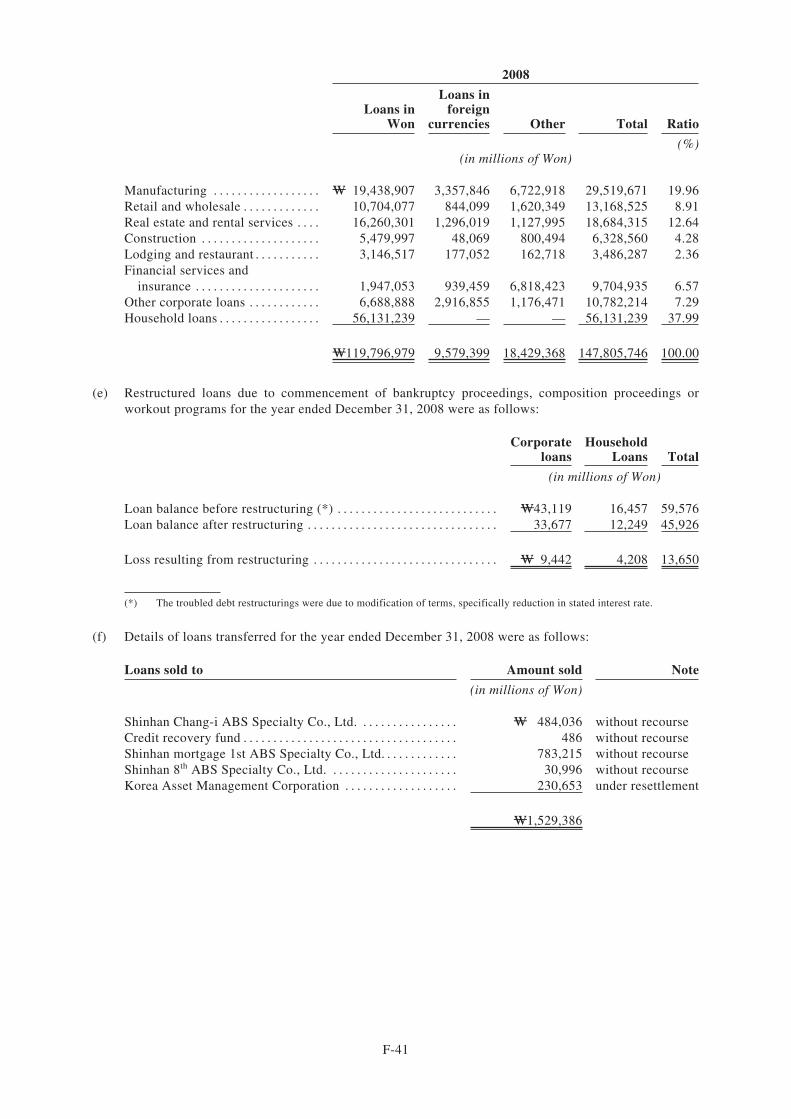
2008
Loans inWon
Loans inforeign
currencies Other Total Ratio
(%)(in millions of Won)
Manufacturing . . . . . . . . . . . . . . . . . . W 19,438,907 3,357,846 6,722,918 29,519,671 19.96Retail and wholesale . . . . . . . . . . . . . 10,704,077 844,099 1,620,349 13,168,525 8.91Real estate and rental services . . . . 16,260,301 1,296,019 1,127,995 18,684,315 12.64Construction . . . . . . . . . . . . . . . . . . . . 5,479,997 48,069 800,494 6,328,560 4.28Lodging and restaurant . . . . . . . . . . . 3,146,517 177,052 162,718 3,486,287 2.36Financial services and
insurance . . . . . . . . . . . . . . . . . . . . . 1,947,053 939,459 6,818,423 9,704,935 6.57Other corporate loans . . . . . . . . . . . . 6,688,888 2,916,855 1,176,471 10,782,214 7.29Household loans . . . . . . . . . . . . . . . . . 56,131,239 — — 56,131,239 37.99
W119,796,979 9,579,399 18,429,368 147,805,746 100.00
(e) Restructured loans due to commencement of bankruptcy proceedings, composition proceedings orworkout programs for the year ended December 31, 2008 were as follows:
Corporateloans
HouseholdLoans Total
(in millions of Won)
Loan balance before restructuring (*) . . . . . . . . . . . . . . . . . . . . . . . . . . . W43,119 16,457 59,576Loan balance after restructuring . . . . . . . . . . . . . . . . . . . . . . . . . . . . . . . . 33,677 12,249 45,926
Loss resulting from restructuring . . . . . . . . . . . . . . . . . . . . . . . . . . . . . . . W 9,442 4,208 13,650
(*) The troubled debt restructurings were due to modification of terms, specifically reduction in stated interest rate.
(f) Details of loans transferred for the year ended December 31, 2008 were as follows:
Loans sold to Amount sold Note
(in millions of Won)
Shinhan Chang-i ABS Specialty Co., Ltd. . . . . . . . . . . . . . . . . W 484,036 without recourseCredit recovery fund . . . . . . . . . . . . . . . . . . . . . . . . . . . . . . . . . . . . 486 without recourseShinhan mortgage 1st ABS Specialty Co., Ltd. . . . . . . . . . . . . 783,215 without recourseShinhan 8th ABS Specialty Co., Ltd. . . . . . . . . . . . . . . . . . . . . . 30,996 without recourseKorea Asset Management Corporation . . . . . . . . . . . . . . . . . . . 230,653 under resettlement
W1,529,386
F-41
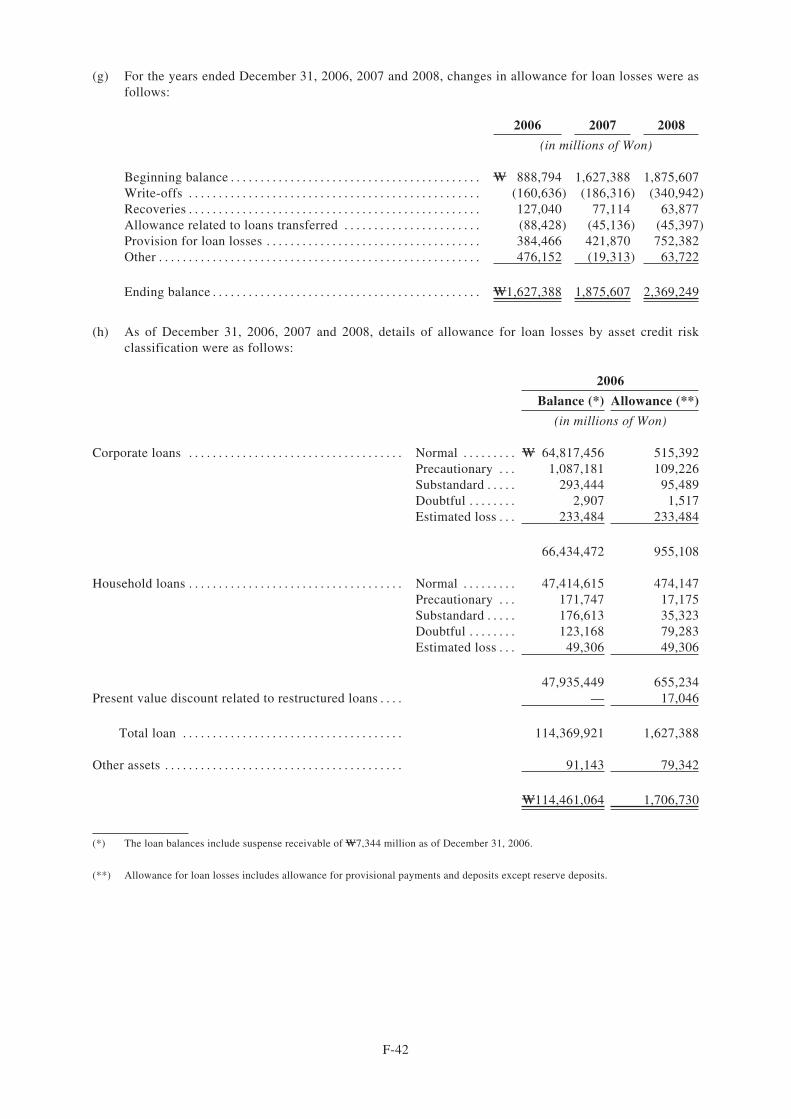
(g) For the years ended December 31, 2006, 2007 and 2008, changes in allowance for loan losses were asfollows:
2006 2007 2008
(in millions of Won)
Beginning balance . . . . . . . . . . . . . . . . . . . . . . . . . . . . . . . . . . . . . . . . . . W 888,794 1,627,388 1,875,607Write-offs . . . . . . . . . . . . . . . . . . . . . . . . . . . . . . . . . . . . . . . . . . . . . . . . . (160,636) (186,316) (340,942)Recoveries . . . . . . . . . . . . . . . . . . . . . . . . . . . . . . . . . . . . . . . . . . . . . . . . . 127,040 77,114 63,877Allowance related to loans transferred . . . . . . . . . . . . . . . . . . . . . . . (88,428) (45,136) (45,397)Provision for loan losses . . . . . . . . . . . . . . . . . . . . . . . . . . . . . . . . . . . . 384,466 421,870 752,382Other . . . . . . . . . . . . . . . . . . . . . . . . . . . . . . . . . . . . . . . . . . . . . . . . . . . . . . 476,152 (19,313) 63,722
Ending balance . . . . . . . . . . . . . . . . . . . . . . . . . . . . . . . . . . . . . . . . . . . . . W1,627,388 1,875,607 2,369,249
(h) As of December 31, 2006, 2007 and 2008, details of allowance for loan losses by asset credit riskclassification were as follows:
2006
Balance (*) Allowance (**)
(in millions of Won)
Corporate loans . . . . . . . . . . . . . . . . . . . . . . . . . . . . . . . . . . . . Normal . . . . . . . . . W 64,817,456 515,392Precautionary . . . 1,087,181 109,226Substandard . . . . . 293,444 95,489Doubtful . . . . . . . . 2,907 1,517Estimated loss . . . 233,484 233,484
66,434,472 955,108
Household loans . . . . . . . . . . . . . . . . . . . . . . . . . . . . . . . . . . . . Normal . . . . . . . . . 47,414,615 474,147Precautionary . . . 171,747 17,175Substandard . . . . . 176,613 35,323Doubtful . . . . . . . . 123,168 79,283Estimated loss . . . 49,306 49,306
47,935,449 655,234Present value discount related to restructured loans . . . . — 17,046
Total loan . . . . . . . . . . . . . . . . . . . . . . . . . . . . . . . . . . . . . 114,369,921 1,627,388
Other assets . . . . . . . . . . . . . . . . . . . . . . . . . . . . . . . . . . . . . . . . 91,143 79,342
W114,461,064 1,706,730
(*) The loan balances include suspense receivable of W7,344 million as of December 31, 2006.
(**) Allowance for loan losses includes allowance for provisional payments and deposits except reserve deposits.
F-42
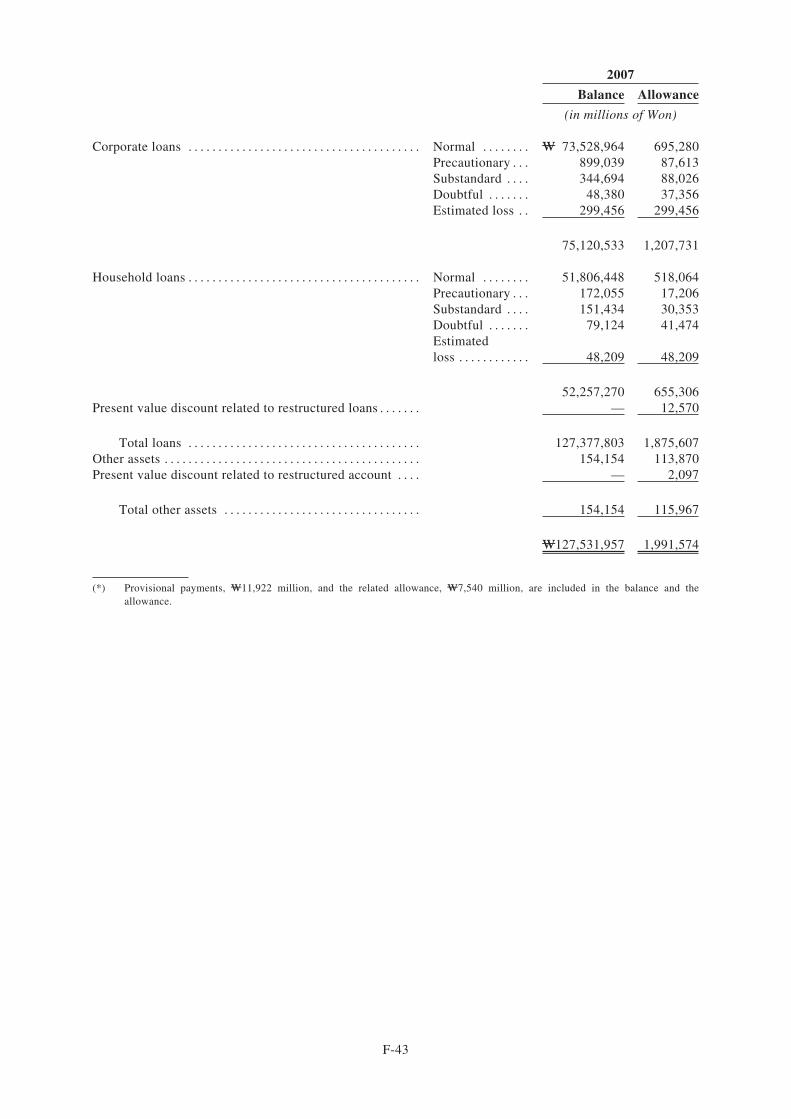
2007
Balance Allowance
(in millions of Won)
Corporate loans . . . . . . . . . . . . . . . . . . . . . . . . . . . . . . . . . . . . . . . Normal . . . . . . . . W 73,528,964 695,280Precautionary . . . 899,039 87,613Substandard . . . . 344,694 88,026Doubtful . . . . . . . 48,380 37,356Estimated loss . . 299,456 299,456
75,120,533 1,207,731
Household loans . . . . . . . . . . . . . . . . . . . . . . . . . . . . . . . . . . . . . . . Normal . . . . . . . . 51,806,448 518,064Precautionary . . . 172,055 17,206Substandard . . . . 151,434 30,353Doubtful . . . . . . . 79,124 41,474Estimatedloss . . . . . . . . . . . . 48,209 48,209
52,257,270 655,306Present value discount related to restructured loans . . . . . . . — 12,570
Total loans . . . . . . . . . . . . . . . . . . . . . . . . . . . . . . . . . . . . . . . 127,377,803 1,875,607Other assets . . . . . . . . . . . . . . . . . . . . . . . . . . . . . . . . . . . . . . . . . . . 154,154 113,870Present value discount related to restructured account . . . . — 2,097
Total other assets . . . . . . . . . . . . . . . . . . . . . . . . . . . . . . . . . 154,154 115,967
W127,531,957 1,991,574
(*) Provisional payments, W11,922 million, and the related allowance, W7,540 million, are included in the balance and theallowance.
F-43
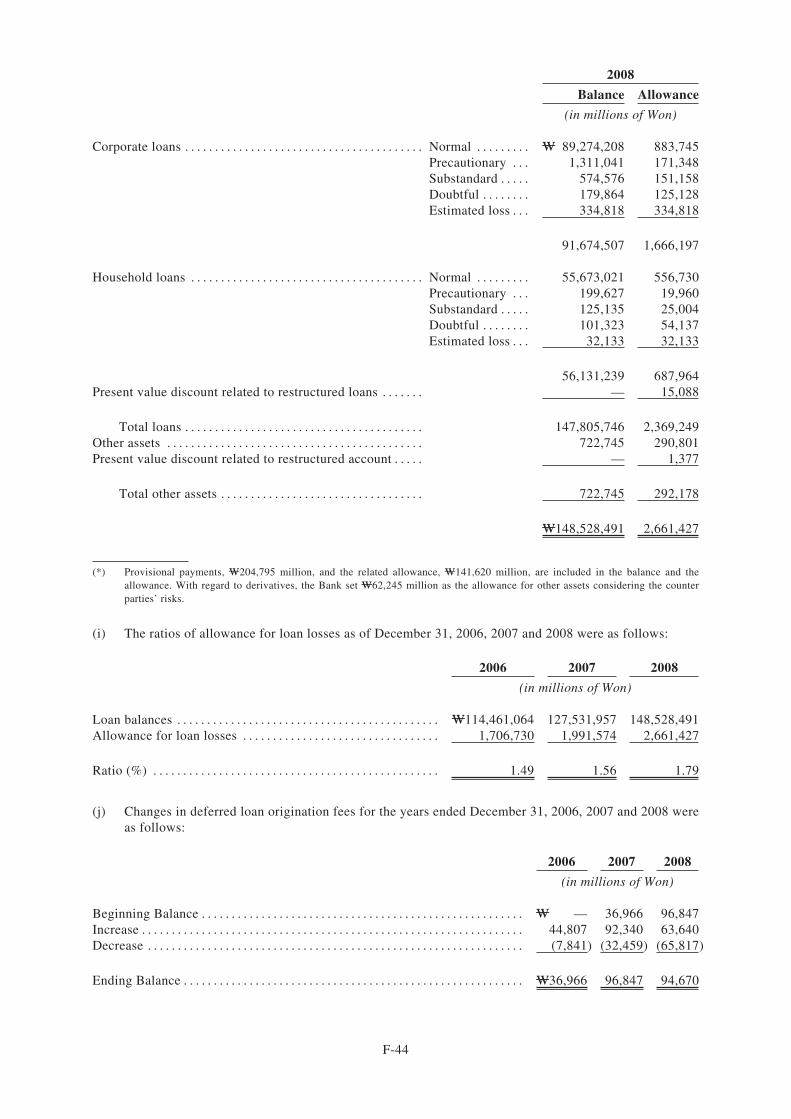
2008
Balance Allowance
(in millions of Won)
Corporate loans . . . . . . . . . . . . . . . . . . . . . . . . . . . . . . . . . . . . . . . . Normal . . . . . . . . . W 89,274,208 883,745Precautionary . . . 1,311,041 171,348Substandard . . . . . 574,576 151,158Doubtful . . . . . . . . 179,864 125,128Estimated loss . . . 334,818 334,818
91,674,507 1,666,197
Household loans . . . . . . . . . . . . . . . . . . . . . . . . . . . . . . . . . . . . . . . Normal . . . . . . . . . 55,673,021 556,730Precautionary . . . 199,627 19,960Substandard . . . . . 125,135 25,004Doubtful . . . . . . . . 101,323 54,137Estimated loss . . . 32,133 32,133
56,131,239 687,964Present value discount related to restructured loans . . . . . . . — 15,088
Total loans . . . . . . . . . . . . . . . . . . . . . . . . . . . . . . . . . . . . . . . . 147,805,746 2,369,249Other assets . . . . . . . . . . . . . . . . . . . . . . . . . . . . . . . . . . . . . . . . . . . 722,745 290,801Present value discount related to restructured account . . . . . — 1,377
Total other assets . . . . . . . . . . . . . . . . . . . . . . . . . . . . . . . . . . 722,745 292,178
W148,528,491 2,661,427
(*) Provisional payments, W204,795 million, and the related allowance, W141,620 million, are included in the balance and theallowance. With regard to derivatives, the Bank set W62,245 million as the allowance for other assets considering the counterparties’ risks.
(i) The ratios of allowance for loan losses as of December 31, 2006, 2007 and 2008 were as follows:
2006 2007 2008
(in millions of Won)
Loan balances . . . . . . . . . . . . . . . . . . . . . . . . . . . . . . . . . . . . . . . . . . . . W114,461,064 127,531,957 148,528,491Allowance for loan losses . . . . . . . . . . . . . . . . . . . . . . . . . . . . . . . . . 1,706,730 1,991,574 2,661,427
Ratio (%) . . . . . . . . . . . . . . . . . . . . . . . . . . . . . . . . . . . . . . . . . . . . . . . . 1.49 1.56 1.79
(j) Changes in deferred loan origination fees for the years ended December 31, 2006, 2007 and 2008 wereas follows:
2006 2007 2008
(in millions of Won)
Beginning Balance . . . . . . . . . . . . . . . . . . . . . . . . . . . . . . . . . . . . . . . . . . . . . . . . . . . . . . W — 36,966 96,847Increase . . . . . . . . . . . . . . . . . . . . . . . . . . . . . . . . . . . . . . . . . . . . . . . . . . . . . . . . . . . . . . . . 44,807 92,340 63,640Decrease . . . . . . . . . . . . . . . . . . . . . . . . . . . . . . . . . . . . . . . . . . . . . . . . . . . . . . . . . . . . . . . (7,841) (32,459) (65,817)
Ending Balance . . . . . . . . . . . . . . . . . . . . . . . . . . . . . . . . . . . . . . . . . . . . . . . . . . . . . . . . . W36,966 96,847 94,670
F-44
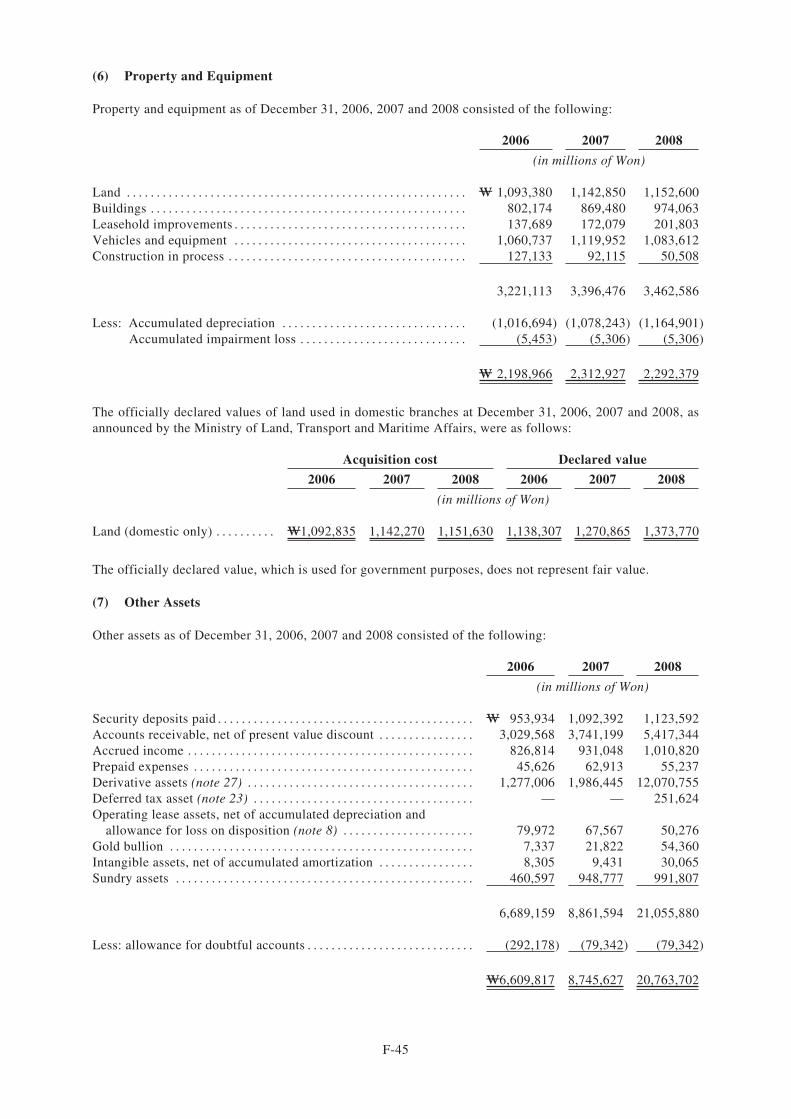
(6) Property and Equipment
Property and equipment as of December 31, 2006, 2007 and 2008 consisted of the following:
2006 2007 2008
(in millions of Won)
Land . . . . . . . . . . . . . . . . . . . . . . . . . . . . . . . . . . . . . . . . . . . . . . . . . . . . . . . . . W 1,093,380 1,142,850 1,152,600Buildings . . . . . . . . . . . . . . . . . . . . . . . . . . . . . . . . . . . . . . . . . . . . . . . . . . . . . 802,174 869,480 974,063Leasehold improvements . . . . . . . . . . . . . . . . . . . . . . . . . . . . . . . . . . . . . . . 137,689 172,079 201,803Vehicles and equipment . . . . . . . . . . . . . . . . . . . . . . . . . . . . . . . . . . . . . . . 1,060,737 1,119,952 1,083,612Construction in process . . . . . . . . . . . . . . . . . . . . . . . . . . . . . . . . . . . . . . . . 127,133 92,115 50,508
3,221,113 3,396,476 3,462,586
Less: Accumulated depreciation . . . . . . . . . . . . . . . . . . . . . . . . . . . . . . . (1,016,694) (1,078,243) (1,164,901)Accumulated impairment loss . . . . . . . . . . . . . . . . . . . . . . . . . . . . (5,453) (5,306) (5,306)
W 2,198,966 2,312,927 2,292,379
The officially declared values of land used in domestic branches at December 31, 2006, 2007 and 2008, asannounced by the Ministry of Land, Transport and Maritime Affairs, were as follows:
Acquisition cost Declared value
2006 2007 2008 2006 2007 2008
(in millions of Won)
Land (domestic only) . . . . . . . . . . W1,092,835 1,142,270 1,151,630 1,138,307 1,270,865 1,373,770
The officially declared value, which is used for government purposes, does not represent fair value.
(7) Other Assets
Other assets as of December 31, 2006, 2007 and 2008 consisted of the following:
2006 2007 2008
(in millions of Won)
Security deposits paid . . . . . . . . . . . . . . . . . . . . . . . . . . . . . . . . . . . . . . . . . . . W 953,934 1,092,392 1,123,592Accounts receivable, net of present value discount . . . . . . . . . . . . . . . . 3,029,568 3,741,199 5,417,344Accrued income . . . . . . . . . . . . . . . . . . . . . . . . . . . . . . . . . . . . . . . . . . . . . . . . 826,814 931,048 1,010,820Prepaid expenses . . . . . . . . . . . . . . . . . . . . . . . . . . . . . . . . . . . . . . . . . . . . . . . 45,626 62,913 55,237Derivative assets (note 27) . . . . . . . . . . . . . . . . . . . . . . . . . . . . . . . . . . . . . . 1,277,006 1,986,445 12,070,755Deferred tax asset (note 23) . . . . . . . . . . . . . . . . . . . . . . . . . . . . . . . . . . . . . — — 251,624Operating lease assets, net of accumulated depreciation and
allowance for loss on disposition (note 8) . . . . . . . . . . . . . . . . . . . . . . 79,972 67,567 50,276Gold bullion . . . . . . . . . . . . . . . . . . . . . . . . . . . . . . . . . . . . . . . . . . . . . . . . . . . 7,337 21,822 54,360Intangible assets, net of accumulated amortization . . . . . . . . . . . . . . . . 8,305 9,431 30,065Sundry assets . . . . . . . . . . . . . . . . . . . . . . . . . . . . . . . . . . . . . . . . . . . . . . . . . . 460,597 948,777 991,807
6,689,159 8,861,594 21,055,880
Less: allowance for doubtful accounts . . . . . . . . . . . . . . . . . . . . . . . . . . . . (292,178) (79,342) (79,342)
W6,609,817 8,745,627 20,763,702
F-45
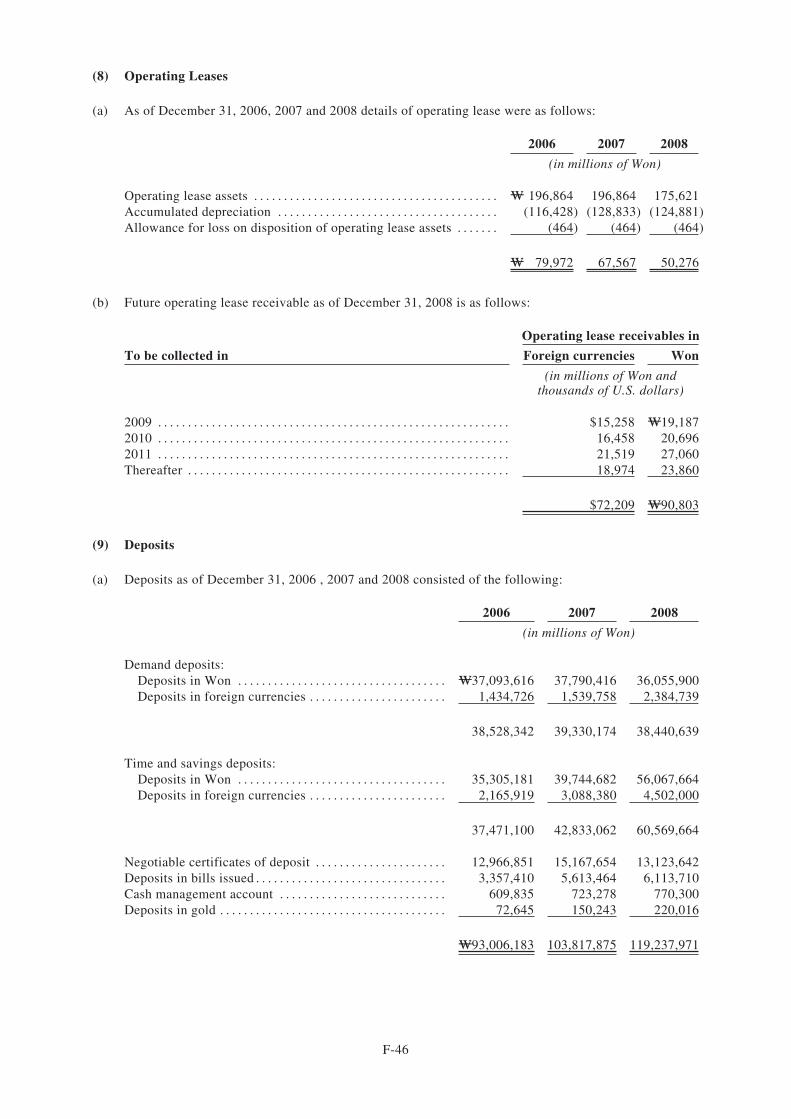
(8) Operating Leases
(a) As of December 31, 2006, 2007 and 2008 details of operating lease were as follows:
2006 2007 2008
(in millions of Won)
Operating lease assets . . . . . . . . . . . . . . . . . . . . . . . . . . . . . . . . . . . . . . . . . W 196,864 196,864 175,621Accumulated depreciation . . . . . . . . . . . . . . . . . . . . . . . . . . . . . . . . . . . . . (116,428) (128,833) (124,881)Allowance for loss on disposition of operating lease assets . . . . . . . (464) (464) (464)
W 79,972 67,567 50,276
(b) Future operating lease receivable as of December 31, 2008 is as follows:
Operating lease receivables in
To be collected in Foreign currencies Won
(in millions of Won andthousands of U.S. dollars)
2009 . . . . . . . . . . . . . . . . . . . . . . . . . . . . . . . . . . . . . . . . . . . . . . . . . . . . . . . . . . . $15,258 W19,1872010 . . . . . . . . . . . . . . . . . . . . . . . . . . . . . . . . . . . . . . . . . . . . . . . . . . . . . . . . . . . 16,458 20,6962011 . . . . . . . . . . . . . . . . . . . . . . . . . . . . . . . . . . . . . . . . . . . . . . . . . . . . . . . . . . . 21,519 27,060Thereafter . . . . . . . . . . . . . . . . . . . . . . . . . . . . . . . . . . . . . . . . . . . . . . . . . . . . . . 18,974 23,860
$72,209 W90,803
(9) Deposits
(a) Deposits as of December 31, 2006 , 2007 and 2008 consisted of the following:
2006 2007 2008
(in millions of Won)
Demand deposits:Deposits in Won . . . . . . . . . . . . . . . . . . . . . . . . . . . . . . . . . . . W37,093,616 37,790,416 36,055,900Deposits in foreign currencies . . . . . . . . . . . . . . . . . . . . . . . 1,434,726 1,539,758 2,384,739
38,528,342 39,330,174 38,440,639
Time and savings deposits:Deposits in Won . . . . . . . . . . . . . . . . . . . . . . . . . . . . . . . . . . . 35,305,181 39,744,682 56,067,664Deposits in foreign currencies . . . . . . . . . . . . . . . . . . . . . . . 2,165,919 3,088,380 4,502,000
37,471,100 42,833,062 60,569,664
Negotiable certificates of deposit . . . . . . . . . . . . . . . . . . . . . . 12,966,851 15,167,654 13,123,642Deposits in bills issued . . . . . . . . . . . . . . . . . . . . . . . . . . . . . . . . 3,357,410 5,613,464 6,113,710Cash management account . . . . . . . . . . . . . . . . . . . . . . . . . . . . 609,835 723,278 770,300Deposits in gold . . . . . . . . . . . . . . . . . . . . . . . . . . . . . . . . . . . . . . 72,645 150,243 220,016
W93,006,183 103,817,875 119,237,971
F-46
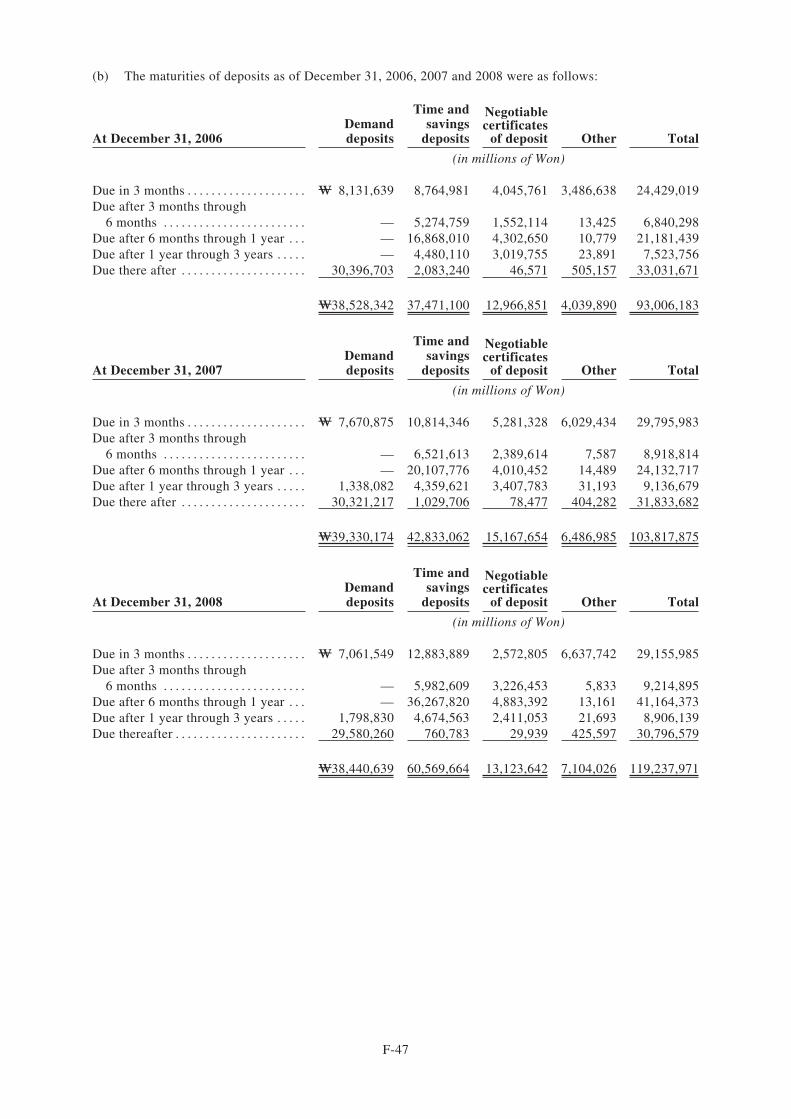
(b) The maturities of deposits as of December 31, 2006, 2007 and 2008 were as follows:
At December 31, 2006Demanddeposits
Time andsavings
deposits
Negotiablecertificates
of deposit Other Total
(in millions of Won)
Due in 3 months . . . . . . . . . . . . . . . . . . . . W 8,131,639 8,764,981 4,045,761 3,486,638 24,429,019Due after 3 months through
6 months . . . . . . . . . . . . . . . . . . . . . . . . — 5,274,759 1,552,114 13,425 6,840,298Due after 6 months through 1 year . . . — 16,868,010 4,302,650 10,779 21,181,439Due after 1 year through 3 years . . . . . — 4,480,110 3,019,755 23,891 7,523,756Due there after . . . . . . . . . . . . . . . . . . . . . 30,396,703 2,083,240 46,571 505,157 33,031,671
W38,528,342 37,471,100 12,966,851 4,039,890 93,006,183
At December 31, 2007Demanddeposits
Time andsavings
deposits
Negotiablecertificates
of deposit Other Total
(in millions of Won)
Due in 3 months . . . . . . . . . . . . . . . . . . . . W 7,670,875 10,814,346 5,281,328 6,029,434 29,795,983Due after 3 months through
6 months . . . . . . . . . . . . . . . . . . . . . . . . — 6,521,613 2,389,614 7,587 8,918,814Due after 6 months through 1 year . . . — 20,107,776 4,010,452 14,489 24,132,717Due after 1 year through 3 years . . . . . 1,338,082 4,359,621 3,407,783 31,193 9,136,679Due there after . . . . . . . . . . . . . . . . . . . . . 30,321,217 1,029,706 78,477 404,282 31,833,682
W39,330,174 42,833,062 15,167,654 6,486,985 103,817,875
At December 31, 2008Demanddeposits
Time andsavings
deposits
Negotiablecertificates
of deposit Other Total
(in millions of Won)
Due in 3 months . . . . . . . . . . . . . . . . . . . . W 7,061,549 12,883,889 2,572,805 6,637,742 29,155,985Due after 3 months through
6 months . . . . . . . . . . . . . . . . . . . . . . . . — 5,982,609 3,226,453 5,833 9,214,895Due after 6 months through 1 year . . . — 36,267,820 4,883,392 13,161 41,164,373Due after 1 year through 3 years . . . . . 1,798,830 4,674,563 2,411,053 21,693 8,906,139Due thereafter . . . . . . . . . . . . . . . . . . . . . . 29,580,260 760,783 29,939 425,597 30,796,579
W38,440,639 60,569,664 13,123,642 7,104,026 119,237,971
F-47
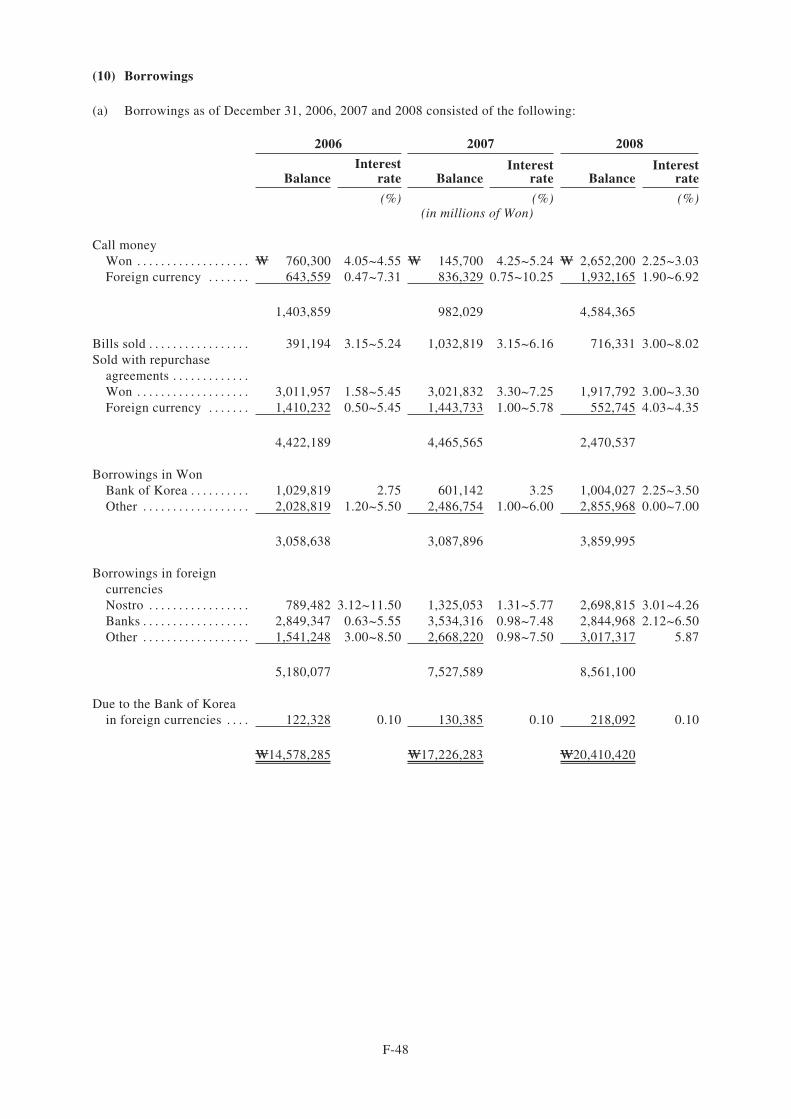
(10) Borrowings
(a) Borrowings as of December 31, 2006, 2007 and 2008 consisted of the following:
2006 2007 2008
BalanceInterest
rate BalanceInterest
rate BalanceInterest
rate
(%) (%) (%)(in millions of Won)
Call moneyWon . . . . . . . . . . . . . . . . . . . W 760,300 4.05~4.55 W 145,700 4.25~5.24 W 2,652,200 2.25~3.03Foreign currency . . . . . . . 643,559 0.47~7.31 836,329 0.75~10.25 1,932,165 1.90~6.92
1,403,859 982,029 4,584,365
Bills sold . . . . . . . . . . . . . . . . . 391,194 3.15~5.24 1,032,819 3.15~6.16 716,331 3.00~8.02Sold with repurchase
agreements . . . . . . . . . . . . .Won . . . . . . . . . . . . . . . . . . . 3,011,957 1.58~5.45 3,021,832 3.30~7.25 1,917,792 3.00~3.30Foreign currency . . . . . . . 1,410,232 0.50~5.45 1,443,733 1.00~5.78 552,745 4.03~4.35
4,422,189 4,465,565 2,470,537
Borrowings in WonBank of Korea . . . . . . . . . . 1,029,819 2.75 601,142 3.25 1,004,027 2.25~3.50Other . . . . . . . . . . . . . . . . . . 2,028,819 1.20~5.50 2,486,754 1.00~6.00 2,855,968 0.00~7.00
3,058,638 3,087,896 3,859,995
Borrowings in foreigncurrenciesNostro . . . . . . . . . . . . . . . . . 789,482 3.12~11.50 1,325,053 1.31~5.77 2,698,815 3.01~4.26Banks . . . . . . . . . . . . . . . . . . 2,849,347 0.63~5.55 3,534,316 0.98~7.48 2,844,968 2.12~6.50Other . . . . . . . . . . . . . . . . . . 1,541,248 3.00~8.50 2,668,220 0.98~7.50 3,017,317 5.87
5,180,077 7,527,589 8,561,100
Due to the Bank of Koreain foreign currencies . . . . 122,328 0.10 130,385 0.10 218,092 0.10
W14,578,285 W17,226,283 W20,410,420
F-48
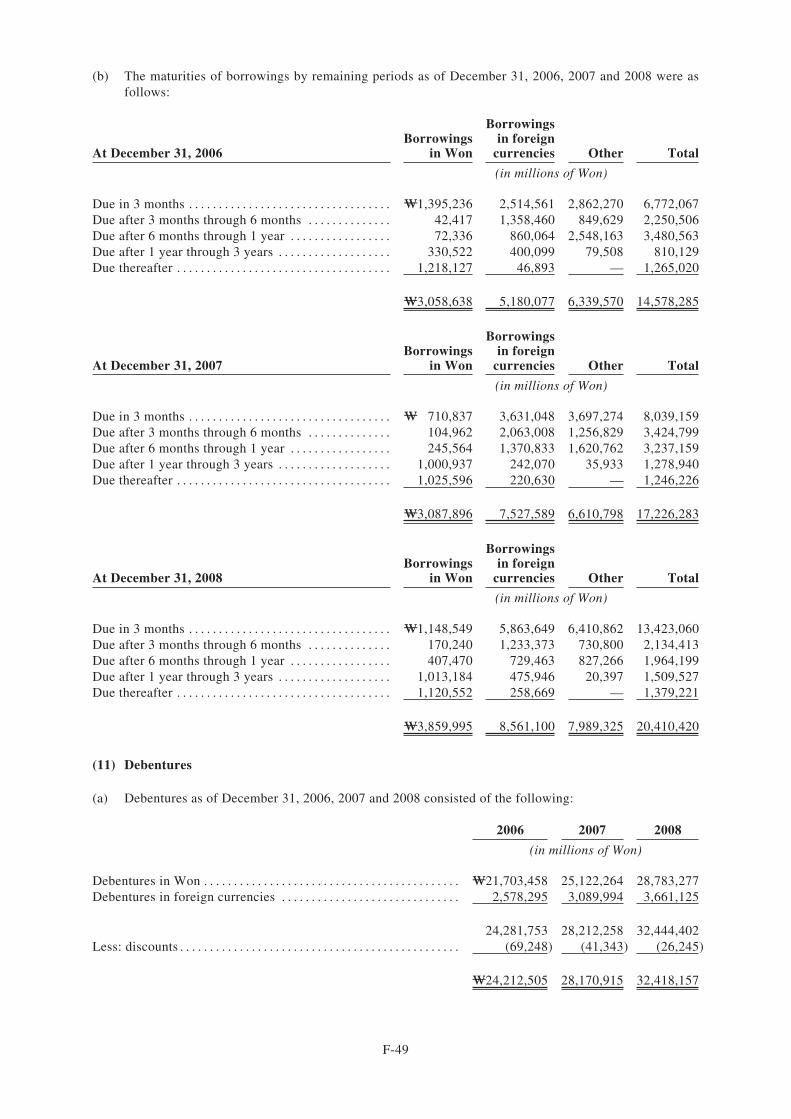
(b) The maturities of borrowings by remaining periods as of December 31, 2006, 2007 and 2008 were asfollows:
At December 31, 2006Borrowings
in Won
Borrowingsin foreign
currencies Other Total
(in millions of Won)
Due in 3 months . . . . . . . . . . . . . . . . . . . . . . . . . . . . . . . . . . W1,395,236 2,514,561 2,862,270 6,772,067Due after 3 months through 6 months . . . . . . . . . . . . . . 42,417 1,358,460 849,629 2,250,506Due after 6 months through 1 year . . . . . . . . . . . . . . . . . 72,336 860,064 2,548,163 3,480,563Due after 1 year through 3 years . . . . . . . . . . . . . . . . . . . 330,522 400,099 79,508 810,129Due thereafter . . . . . . . . . . . . . . . . . . . . . . . . . . . . . . . . . . . . 1,218,127 46,893 — 1,265,020
W3,058,638 5,180,077 6,339,570 14,578,285
At December 31, 2007Borrowings
in Won
Borrowingsin foreign
currencies Other Total
(in millions of Won)
Due in 3 months . . . . . . . . . . . . . . . . . . . . . . . . . . . . . . . . . . W 710,837 3,631,048 3,697,274 8,039,159Due after 3 months through 6 months . . . . . . . . . . . . . . 104,962 2,063,008 1,256,829 3,424,799Due after 6 months through 1 year . . . . . . . . . . . . . . . . . 245,564 1,370,833 1,620,762 3,237,159Due after 1 year through 3 years . . . . . . . . . . . . . . . . . . . 1,000,937 242,070 35,933 1,278,940Due thereafter . . . . . . . . . . . . . . . . . . . . . . . . . . . . . . . . . . . . 1,025,596 220,630 — 1,246,226
W3,087,896 7,527,589 6,610,798 17,226,283
At December 31, 2008Borrowings
in Won
Borrowingsin foreign
currencies Other Total
(in millions of Won)
Due in 3 months . . . . . . . . . . . . . . . . . . . . . . . . . . . . . . . . . . W1,148,549 5,863,649 6,410,862 13,423,060Due after 3 months through 6 months . . . . . . . . . . . . . . 170,240 1,233,373 730,800 2,134,413Due after 6 months through 1 year . . . . . . . . . . . . . . . . . 407,470 729,463 827,266 1,964,199Due after 1 year through 3 years . . . . . . . . . . . . . . . . . . . 1,013,184 475,946 20,397 1,509,527Due thereafter . . . . . . . . . . . . . . . . . . . . . . . . . . . . . . . . . . . . 1,120,552 258,669 — 1,379,221
W3,859,995 8,561,100 7,989,325 20,410,420
(11) Debentures
(a) Debentures as of December 31, 2006, 2007 and 2008 consisted of the following:
2006 2007 2008
(in millions of Won)
Debentures in Won . . . . . . . . . . . . . . . . . . . . . . . . . . . . . . . . . . . . . . . . . . . W21,703,458 25,122,264 28,783,277Debentures in foreign currencies . . . . . . . . . . . . . . . . . . . . . . . . . . . . . . 2,578,295 3,089,994 3,661,125
24,281,753 28,212,258 32,444,402Less: discounts . . . . . . . . . . . . . . . . . . . . . . . . . . . . . . . . . . . . . . . . . . . . . . . (69,248) (41,343) (26,245)
W24,212,505 28,170,915 32,418,157
F-49
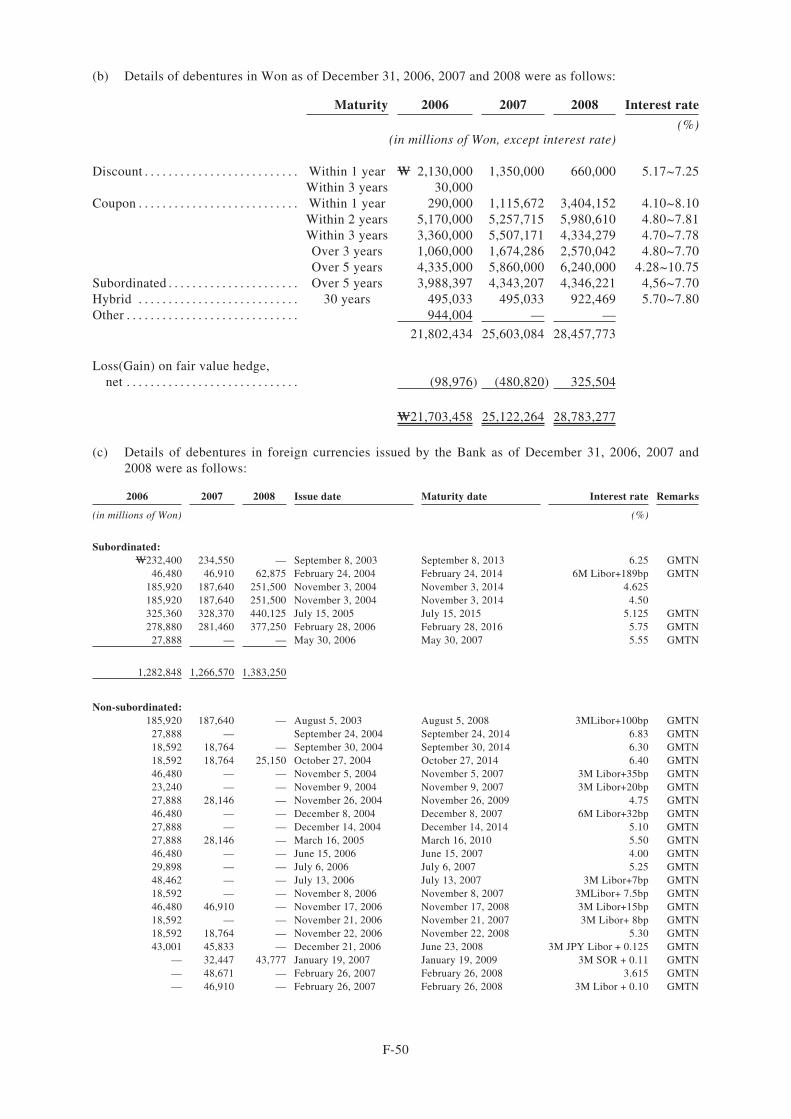
(b) Details of debentures in Won as of December 31, 2006, 2007 and 2008 were as follows:
Maturity 2006 2007 2008 Interest rate
(%)(in millions of Won, except interest rate)
Discount . . . . . . . . . . . . . . . . . . . . . . . . . . Within 1 year W 2,130,000 1,350,000 660,000 5.17~7.25Within 3 years 30,000
Coupon . . . . . . . . . . . . . . . . . . . . . . . . . . . Within 1 year 290,000 1,115,672 3,404,152 4.10~8.10Within 2 years 5,170,000 5,257,715 5,980,610 4.80~7.81Within 3 years 3,360,000 5,507,171 4,334,279 4.70~7.78Over 3 years 1,060,000 1,674,286 2,570,042 4.80~7.70Over 5 years 4,335,000 5,860,000 6,240,000 4.28~10.75
Subordinated . . . . . . . . . . . . . . . . . . . . . . Over 5 years 3,988,397 4,343,207 4,346,221 4,56~7.70Hybrid . . . . . . . . . . . . . . . . . . . . . . . . . . . 30 years 495,033 495,033 922,469 5.70~7.80Other . . . . . . . . . . . . . . . . . . . . . . . . . . . . . 944,004 — —
21,802,434 25,603,084 28,457,773
Loss(Gain) on fair value hedge,net . . . . . . . . . . . . . . . . . . . . . . . . . . . . . (98,976) (480,820) 325,504
W21,703,458 25,122,264 28,783,277
(c) Details of debentures in foreign currencies issued by the Bank as of December 31, 2006, 2007 and2008 were as follows:
2006 2007 2008 Issue date Maturity date Interest rate Remarks
(in millions of Won) (%)
Subordinated:W232,400 234,550 — September 8, 2003 September 8, 2013 6.25 GMTN
46,480 46,910 62,875 February 24, 2004 February 24, 2014 6M Libor+189bp GMTN185,920 187,640 251,500 November 3, 2004 November 3, 2014 4.625185,920 187,640 251,500 November 3, 2004 November 3, 2014 4.50325,360 328,370 440,125 July 15, 2005 July 15, 2015 5.125 GMTN278,880 281,460 377,250 February 28, 2006 February 28, 2016 5.75 GMTN
27,888 — — May 30, 2006 May 30, 2007 5.55 GMTN
1,282,848 1,266,570 1,383,250
Non-subordinated:185,920 187,640 — August 5, 2003 August 5, 2008 3MLibor+100bp GMTN
27,888 — September 24, 2004 September 24, 2014 6.83 GMTN18,592 18,764 — September 30, 2004 September 30, 2014 6.30 GMTN18,592 18,764 25,150 October 27, 2004 October 27, 2014 6.40 GMTN46,480 — — November 5, 2004 November 5, 2007 3M Libor+35bp GMTN23,240 — — November 9, 2004 November 9, 2007 3M Libor+20bp GMTN27,888 28,146 — November 26, 2004 November 26, 2009 4.75 GMTN46,480 — — December 8, 2004 December 8, 2007 6M Libor+32bp GMTN27,888 — — December 14, 2004 December 14, 2014 5.10 GMTN27,888 28,146 — March 16, 2005 March 16, 2010 5.50 GMTN46,480 — — June 15, 2006 June 15, 2007 4.00 GMTN29,898 — — July 6, 2006 July 6, 2007 5.25 GMTN48,462 — — July 13, 2006 July 13, 2007 3M Libor+7bp GMTN18,592 — — November 8, 2006 November 8, 2007 3MLibor+ 7.5bp GMTN46,480 46,910 — November 17, 2006 November 17, 2008 3M Libor+15bp GMTN18,592 — — November 21, 2006 November 21, 2007 3M Libor+ 8bp GMTN18,592 18,764 — November 22, 2006 November 22, 2008 5.30 GMTN43,001 45,833 — December 21, 2006 June 23, 2008 3M JPY Libor + 0.125 GMTN
— 32,447 43,777 January 19, 2007 January 19, 2009 3M SOR + 0.11 GMTN— 48,671 — February 26, 2007 February 26, 2008 3.615 GMTN— 46,910 — February 26, 2007 February 26, 2008 3M Libor + 0.10 GMTN
F-50
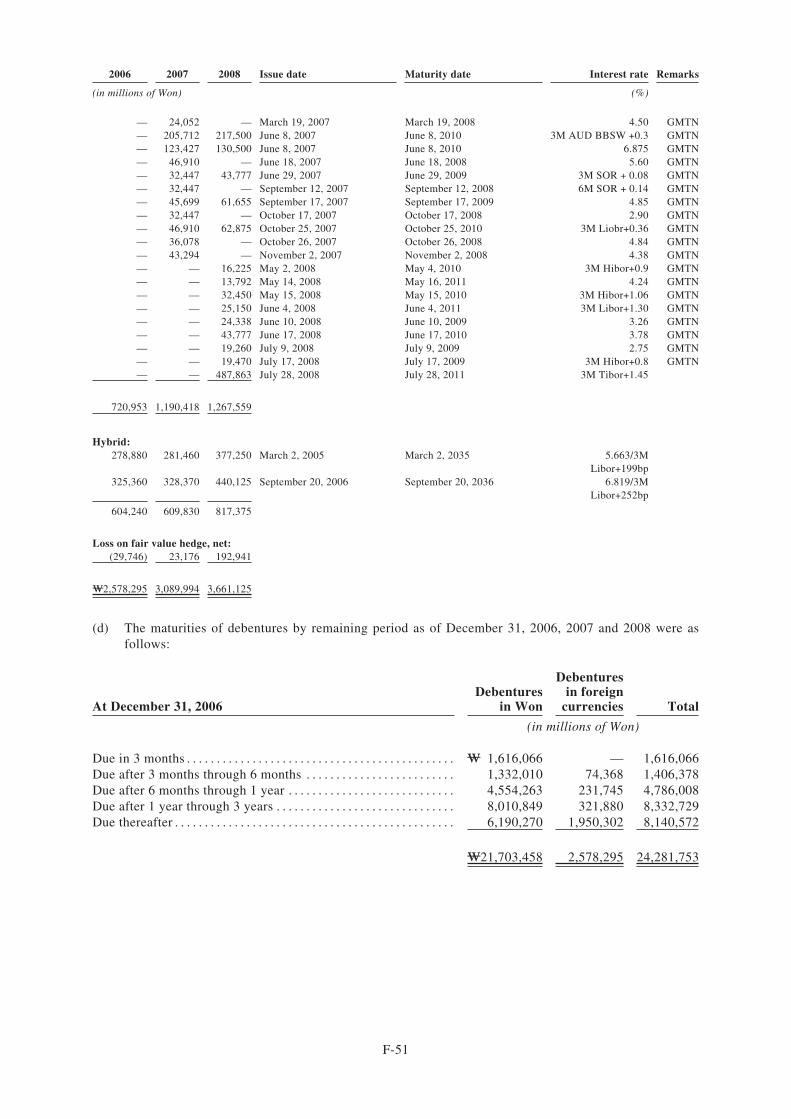
2006 2007 2008 Issue date Maturity date Interest rate Remarks
(in millions of Won) (%)
— 24,052 — March 19, 2007 March 19, 2008 4.50 GMTN— 205,712 217,500 June 8, 2007 June 8, 2010 3M AUD BBSW +0.3 GMTN— 123,427 130,500 June 8, 2007 June 8, 2010 6.875 GMTN— 46,910 — June 18, 2007 June 18, 2008 5.60 GMTN— 32,447 43,777 June 29, 2007 June 29, 2009 3M SOR + 0.08 GMTN— 32,447 — September 12, 2007 September 12, 2008 6M SOR + 0.14 GMTN— 45,699 61,655 September 17, 2007 September 17, 2009 4.85 GMTN— 32,447 — October 17, 2007 October 17, 2008 2.90 GMTN— 46,910 62,875 October 25, 2007 October 25, 2010 3M Liobr+0.36 GMTN— 36,078 — October 26, 2007 October 26, 2008 4.84 GMTN— 43,294 — November 2, 2007 November 2, 2008 4.38 GMTN— — 16,225 May 2, 2008 May 4, 2010 3M Hibor+0.9 GMTN— — 13,792 May 14, 2008 May 16, 2011 4.24 GMTN— — 32,450 May 15, 2008 May 15, 2010 3M Hibor+1.06 GMTN— — 25,150 June 4, 2008 June 4, 2011 3M Libor+1.30 GMTN— — 24,338 June 10, 2008 June 10, 2009 3.26 GMTN— — 43,777 June 17, 2008 June 17, 2010 3.78 GMTN— — 19,260 July 9, 2008 July 9, 2009 2.75 GMTN— — 19,470 July 17, 2008 July 17, 2009 3M Hibor+0.8 GMTN— — 487,863 July 28, 2008 July 28, 2011 3M Tibor+1.45
720,953 1,190,418 1,267,559
Hybrid:278,880 281,460 377,250 March 2, 2005 March 2, 2035 5.663/3M
Libor+199bp325,360 328,370 440,125 September 20, 2006 September 20, 2036 6.819/3M
Libor+252bp
604,240 609,830 817,375
Loss on fair value hedge, net:(29,746) 23,176 192,941
W2,578,295 3,089,994 3,661,125
(d) The maturities of debentures by remaining period as of December 31, 2006, 2007 and 2008 were asfollows:
At December 31, 2006Debentures
in Won
Debenturesin foreign
currencies Total
(in millions of Won)
Due in 3 months . . . . . . . . . . . . . . . . . . . . . . . . . . . . . . . . . . . . . . . . . . . . . W 1,616,066 — 1,616,066Due after 3 months through 6 months . . . . . . . . . . . . . . . . . . . . . . . . . 1,332,010 74,368 1,406,378Due after 6 months through 1 year . . . . . . . . . . . . . . . . . . . . . . . . . . . . 4,554,263 231,745 4,786,008Due after 1 year through 3 years . . . . . . . . . . . . . . . . . . . . . . . . . . . . . . 8,010,849 321,880 8,332,729Due thereafter . . . . . . . . . . . . . . . . . . . . . . . . . . . . . . . . . . . . . . . . . . . . . . . 6,190,270 1,950,302 8,140,572
W21,703,458 2,578,295 24,281,753
F-51
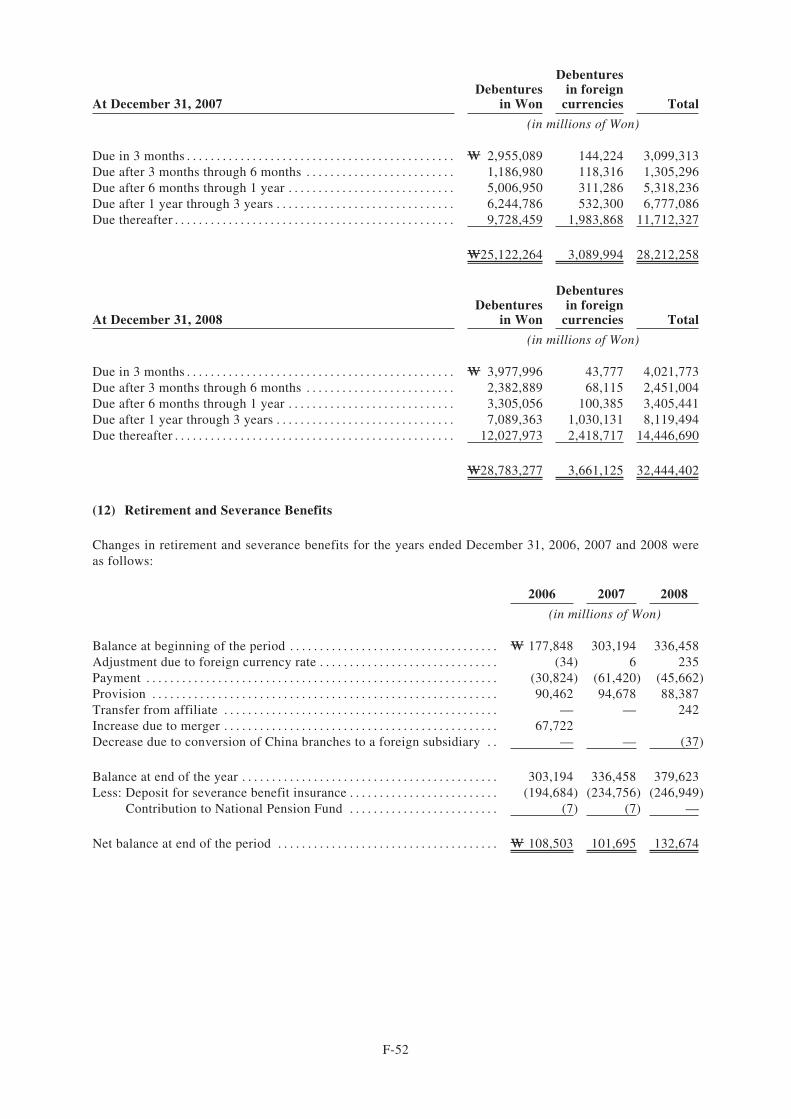
At December 31, 2007Debentures
in Won
Debenturesin foreign
currencies Total
(in millions of Won)
Due in 3 months . . . . . . . . . . . . . . . . . . . . . . . . . . . . . . . . . . . . . . . . . . . . . W 2,955,089 144,224 3,099,313Due after 3 months through 6 months . . . . . . . . . . . . . . . . . . . . . . . . . 1,186,980 118,316 1,305,296Due after 6 months through 1 year . . . . . . . . . . . . . . . . . . . . . . . . . . . . 5,006,950 311,286 5,318,236Due after 1 year through 3 years . . . . . . . . . . . . . . . . . . . . . . . . . . . . . . 6,244,786 532,300 6,777,086Due thereafter . . . . . . . . . . . . . . . . . . . . . . . . . . . . . . . . . . . . . . . . . . . . . . . 9,728,459 1,983,868 11,712,327
W25,122,264 3,089,994 28,212,258
At December 31, 2008Debentures
in Won
Debenturesin foreign
currencies Total
(in millions of Won)
Due in 3 months . . . . . . . . . . . . . . . . . . . . . . . . . . . . . . . . . . . . . . . . . . . . . W 3,977,996 43,777 4,021,773Due after 3 months through 6 months . . . . . . . . . . . . . . . . . . . . . . . . . 2,382,889 68,115 2,451,004Due after 6 months through 1 year . . . . . . . . . . . . . . . . . . . . . . . . . . . . 3,305,056 100,385 3,405,441Due after 1 year through 3 years . . . . . . . . . . . . . . . . . . . . . . . . . . . . . . 7,089,363 1,030,131 8,119,494Due thereafter . . . . . . . . . . . . . . . . . . . . . . . . . . . . . . . . . . . . . . . . . . . . . . . 12,027,973 2,418,717 14,446,690
W28,783,277 3,661,125 32,444,402
(12) Retirement and Severance Benefits
Changes in retirement and severance benefits for the years ended December 31, 2006, 2007 and 2008 wereas follows:
2006 2007 2008
(in millions of Won)
Balance at beginning of the period . . . . . . . . . . . . . . . . . . . . . . . . . . . . . . . . . . . W 177,848 303,194 336,458Adjustment due to foreign currency rate . . . . . . . . . . . . . . . . . . . . . . . . . . . . . . (34) 6 235Payment . . . . . . . . . . . . . . . . . . . . . . . . . . . . . . . . . . . . . . . . . . . . . . . . . . . . . . . . . . . (30,824) (61,420) (45,662)Provision . . . . . . . . . . . . . . . . . . . . . . . . . . . . . . . . . . . . . . . . . . . . . . . . . . . . . . . . . . 90,462 94,678 88,387Transfer from affiliate . . . . . . . . . . . . . . . . . . . . . . . . . . . . . . . . . . . . . . . . . . . . . . — — 242Increase due to merger . . . . . . . . . . . . . . . . . . . . . . . . . . . . . . . . . . . . . . . . . . . . . . 67,722Decrease due to conversion of China branches to a foreign subsidiary . . — — (37)
Balance at end of the year . . . . . . . . . . . . . . . . . . . . . . . . . . . . . . . . . . . . . . . . . . . 303,194 336,458 379,623Less: Deposit for severance benefit insurance . . . . . . . . . . . . . . . . . . . . . . . . . (194,684) (234,756) (246,949)
Contribution to National Pension Fund . . . . . . . . . . . . . . . . . . . . . . . . . (7) (7) —
Net balance at end of the period . . . . . . . . . . . . . . . . . . . . . . . . . . . . . . . . . . . . . W 108,503 101,695 132,674
F-52
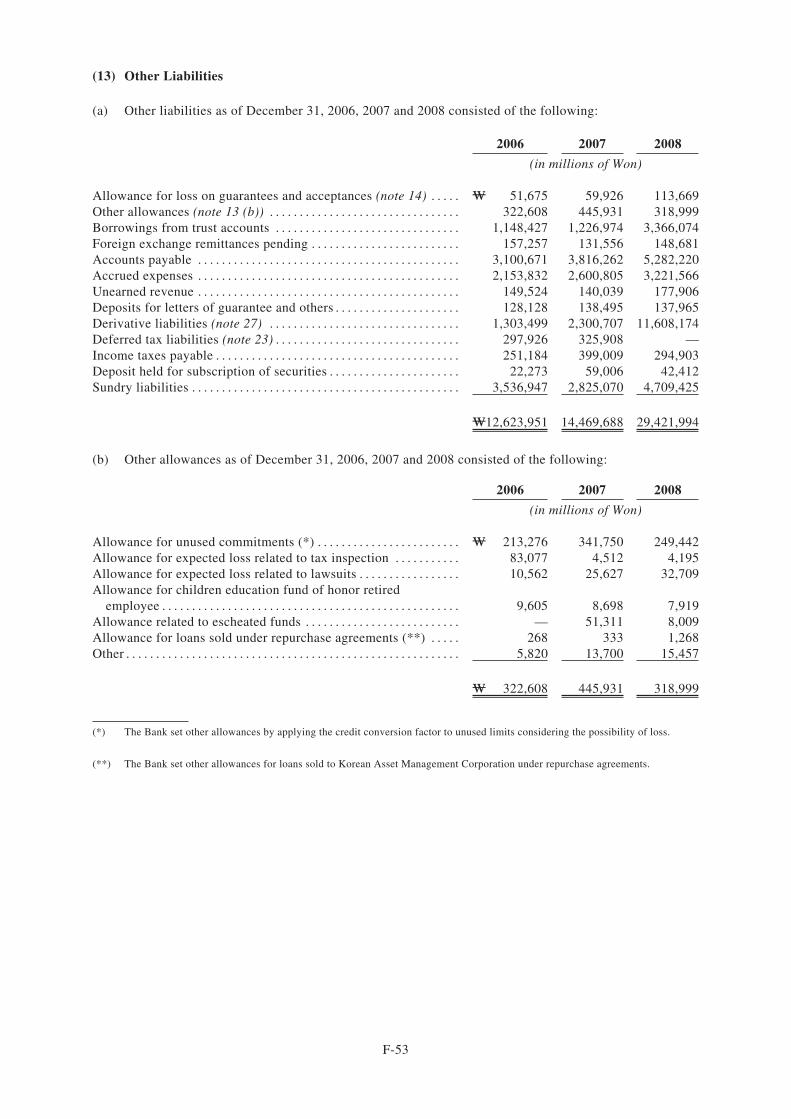
(13) Other Liabilities
(a) Other liabilities as of December 31, 2006, 2007 and 2008 consisted of the following:
2006 2007 2008
(in millions of Won)
Allowance for loss on guarantees and acceptances (note 14) . . . . . W 51,675 59,926 113,669Other allowances (note 13 (b)) . . . . . . . . . . . . . . . . . . . . . . . . . . . . . . . . 322,608 445,931 318,999Borrowings from trust accounts . . . . . . . . . . . . . . . . . . . . . . . . . . . . . . . 1,148,427 1,226,974 3,366,074Foreign exchange remittances pending . . . . . . . . . . . . . . . . . . . . . . . . . 157,257 131,556 148,681Accounts payable . . . . . . . . . . . . . . . . . . . . . . . . . . . . . . . . . . . . . . . . . . . . 3,100,671 3,816,262 5,282,220Accrued expenses . . . . . . . . . . . . . . . . . . . . . . . . . . . . . . . . . . . . . . . . . . . . 2,153,832 2,600,805 3,221,566Unearned revenue . . . . . . . . . . . . . . . . . . . . . . . . . . . . . . . . . . . . . . . . . . . . 149,524 140,039 177,906Deposits for letters of guarantee and others . . . . . . . . . . . . . . . . . . . . . 128,128 138,495 137,965Derivative liabilities (note 27) . . . . . . . . . . . . . . . . . . . . . . . . . . . . . . . . 1,303,499 2,300,707 11,608,174Deferred tax liabilities (note 23) . . . . . . . . . . . . . . . . . . . . . . . . . . . . . . . 297,926 325,908 —Income taxes payable . . . . . . . . . . . . . . . . . . . . . . . . . . . . . . . . . . . . . . . . . 251,184 399,009 294,903Deposit held for subscription of securities . . . . . . . . . . . . . . . . . . . . . . 22,273 59,006 42,412Sundry liabilities . . . . . . . . . . . . . . . . . . . . . . . . . . . . . . . . . . . . . . . . . . . . . 3,536,947 2,825,070 4,709,425
W12,623,951 14,469,688 29,421,994
(b) Other allowances as of December 31, 2006, 2007 and 2008 consisted of the following:
2006 2007 2008
(in millions of Won)
Allowance for unused commitments (*) . . . . . . . . . . . . . . . . . . . . . . . . W 213,276 341,750 249,442Allowance for expected loss related to tax inspection . . . . . . . . . . . 83,077 4,512 4,195Allowance for expected loss related to lawsuits . . . . . . . . . . . . . . . . . 10,562 25,627 32,709Allowance for children education fund of honor retired
employee . . . . . . . . . . . . . . . . . . . . . . . . . . . . . . . . . . . . . . . . . . . . . . . . . . 9,605 8,698 7,919Allowance related to escheated funds . . . . . . . . . . . . . . . . . . . . . . . . . . — 51,311 8,009Allowance for loans sold under repurchase agreements (**) . . . . . 268 333 1,268Other . . . . . . . . . . . . . . . . . . . . . . . . . . . . . . . . . . . . . . . . . . . . . . . . . . . . . . . . 5,820 13,700 15,457
W 322,608 445,931 318,999
(*) The Bank set other allowances by applying the credit conversion factor to unused limits considering the possibility of loss.
(**) The Bank set other allowances for loans sold to Korean Asset Management Corporation under repurchase agreements.
F-53
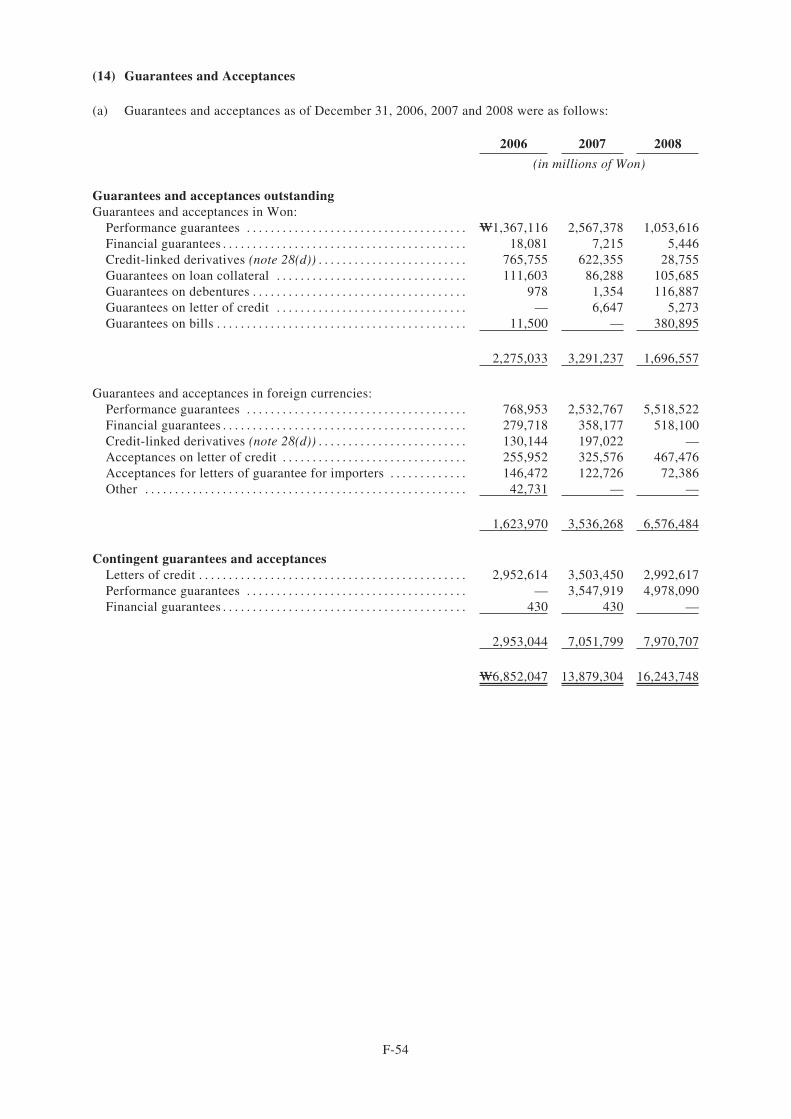
(14) Guarantees and Acceptances
(a) Guarantees and acceptances as of December 31, 2006, 2007 and 2008 were as follows:
2006 2007 2008
(in millions of Won)
Guarantees and acceptances outstandingGuarantees and acceptances in Won:
Performance guarantees . . . . . . . . . . . . . . . . . . . . . . . . . . . . . . . . . . . . . W1,367,116 2,567,378 1,053,616Financial guarantees . . . . . . . . . . . . . . . . . . . . . . . . . . . . . . . . . . . . . . . . . 18,081 7,215 5,446Credit-linked derivatives (note 28(d)) . . . . . . . . . . . . . . . . . . . . . . . . . 765,755 622,355 28,755Guarantees on loan collateral . . . . . . . . . . . . . . . . . . . . . . . . . . . . . . . . 111,603 86,288 105,685Guarantees on debentures . . . . . . . . . . . . . . . . . . . . . . . . . . . . . . . . . . . . 978 1,354 116,887Guarantees on letter of credit . . . . . . . . . . . . . . . . . . . . . . . . . . . . . . . . — 6,647 5,273Guarantees on bills . . . . . . . . . . . . . . . . . . . . . . . . . . . . . . . . . . . . . . . . . . 11,500 — 380,895
2,275,033 3,291,237 1,696,557
Guarantees and acceptances in foreign currencies:Performance guarantees . . . . . . . . . . . . . . . . . . . . . . . . . . . . . . . . . . . . . 768,953 2,532,767 5,518,522Financial guarantees . . . . . . . . . . . . . . . . . . . . . . . . . . . . . . . . . . . . . . . . . 279,718 358,177 518,100Credit-linked derivatives (note 28(d)) . . . . . . . . . . . . . . . . . . . . . . . . . 130,144 197,022 —Acceptances on letter of credit . . . . . . . . . . . . . . . . . . . . . . . . . . . . . . . 255,952 325,576 467,476Acceptances for letters of guarantee for importers . . . . . . . . . . . . . 146,472 122,726 72,386Other . . . . . . . . . . . . . . . . . . . . . . . . . . . . . . . . . . . . . . . . . . . . . . . . . . . . . . 42,731 — —
1,623,970 3,536,268 6,576,484
Contingent guarantees and acceptancesLetters of credit . . . . . . . . . . . . . . . . . . . . . . . . . . . . . . . . . . . . . . . . . . . . . 2,952,614 3,503,450 2,992,617Performance guarantees . . . . . . . . . . . . . . . . . . . . . . . . . . . . . . . . . . . . . — 3,547,919 4,978,090Financial guarantees . . . . . . . . . . . . . . . . . . . . . . . . . . . . . . . . . . . . . . . . . 430 430 —
2,953,044 7,051,799 7,970,707
W6,852,047 13,879,304 16,243,748
F-54
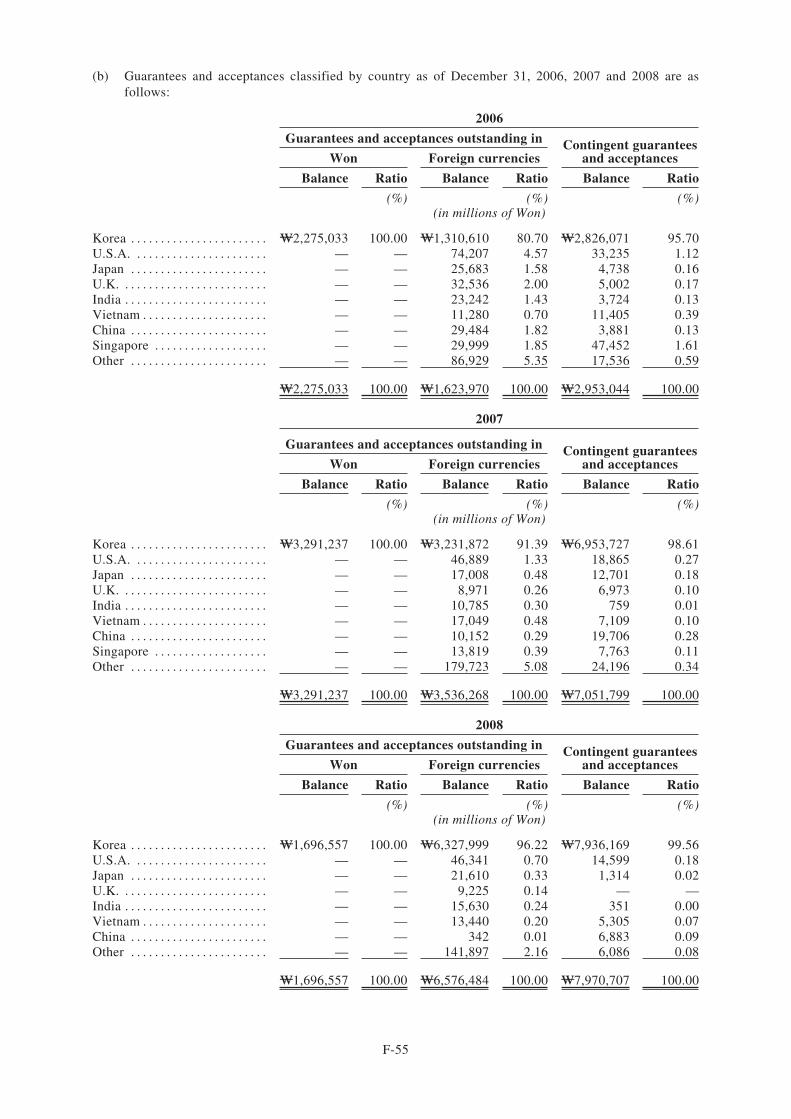
(b) Guarantees and acceptances classified by country as of December 31, 2006, 2007 and 2008 are asfollows:
2006
Guarantees and acceptances outstanding in Contingent guaranteesand acceptancesWon Foreign currencies
Balance Ratio Balance Ratio Balance Ratio
(%) (%) (%)(in millions of Won)
Korea . . . . . . . . . . . . . . . . . . . . . . . W2,275,033 100.00 W1,310,610 80.70 W2,826,071 95.70U.S.A. . . . . . . . . . . . . . . . . . . . . . . — — 74,207 4.57 33,235 1.12Japan . . . . . . . . . . . . . . . . . . . . . . . — — 25,683 1.58 4,738 0.16U.K. . . . . . . . . . . . . . . . . . . . . . . . . — — 32,536 2.00 5,002 0.17India . . . . . . . . . . . . . . . . . . . . . . . . — — 23,242 1.43 3,724 0.13Vietnam . . . . . . . . . . . . . . . . . . . . . — — 11,280 0.70 11,405 0.39China . . . . . . . . . . . . . . . . . . . . . . . — — 29,484 1.82 3,881 0.13Singapore . . . . . . . . . . . . . . . . . . . — — 29,999 1.85 47,452 1.61Other . . . . . . . . . . . . . . . . . . . . . . . — — 86,929 5.35 17,536 0.59
W2,275,033 100.00 W1,623,970 100.00 W2,953,044 100.00
2007
Guarantees and acceptances outstanding in Contingent guaranteesand acceptancesWon Foreign currencies
Balance Ratio Balance Ratio Balance Ratio
(%) (%) (%)(in millions of Won)
Korea . . . . . . . . . . . . . . . . . . . . . . . W3,291,237 100.00 W3,231,872 91.39 W6,953,727 98.61U.S.A. . . . . . . . . . . . . . . . . . . . . . . — — 46,889 1.33 18,865 0.27Japan . . . . . . . . . . . . . . . . . . . . . . . — — 17,008 0.48 12,701 0.18U.K. . . . . . . . . . . . . . . . . . . . . . . . . — — 8,971 0.26 6,973 0.10India . . . . . . . . . . . . . . . . . . . . . . . . — — 10,785 0.30 759 0.01Vietnam . . . . . . . . . . . . . . . . . . . . . — — 17,049 0.48 7,109 0.10China . . . . . . . . . . . . . . . . . . . . . . . — — 10,152 0.29 19,706 0.28Singapore . . . . . . . . . . . . . . . . . . . — — 13,819 0.39 7,763 0.11Other . . . . . . . . . . . . . . . . . . . . . . . — — 179,723 5.08 24,196 0.34
W3,291,237 100.00 W3,536,268 100.00 W7,051,799 100.00
2008
Guarantees and acceptances outstanding in Contingent guaranteesand acceptancesWon Foreign currencies
Balance Ratio Balance Ratio Balance Ratio
(%) (%) (%)(in millions of Won)
Korea . . . . . . . . . . . . . . . . . . . . . . . W1,696,557 100.00 W6,327,999 96.22 W7,936,169 99.56U.S.A. . . . . . . . . . . . . . . . . . . . . . . — — 46,341 0.70 14,599 0.18Japan . . . . . . . . . . . . . . . . . . . . . . . — — 21,610 0.33 1,314 0.02U.K. . . . . . . . . . . . . . . . . . . . . . . . . — — 9,225 0.14 — —India . . . . . . . . . . . . . . . . . . . . . . . . — — 15,630 0.24 351 0.00Vietnam . . . . . . . . . . . . . . . . . . . . . — — 13,440 0.20 5,305 0.07China . . . . . . . . . . . . . . . . . . . . . . . — — 342 0.01 6,883 0.09Other . . . . . . . . . . . . . . . . . . . . . . . — — 141,897 2.16 6,086 0.08
W1,696,557 100.00 W6,576,484 100.00 W7,970,707 100.00
F-55
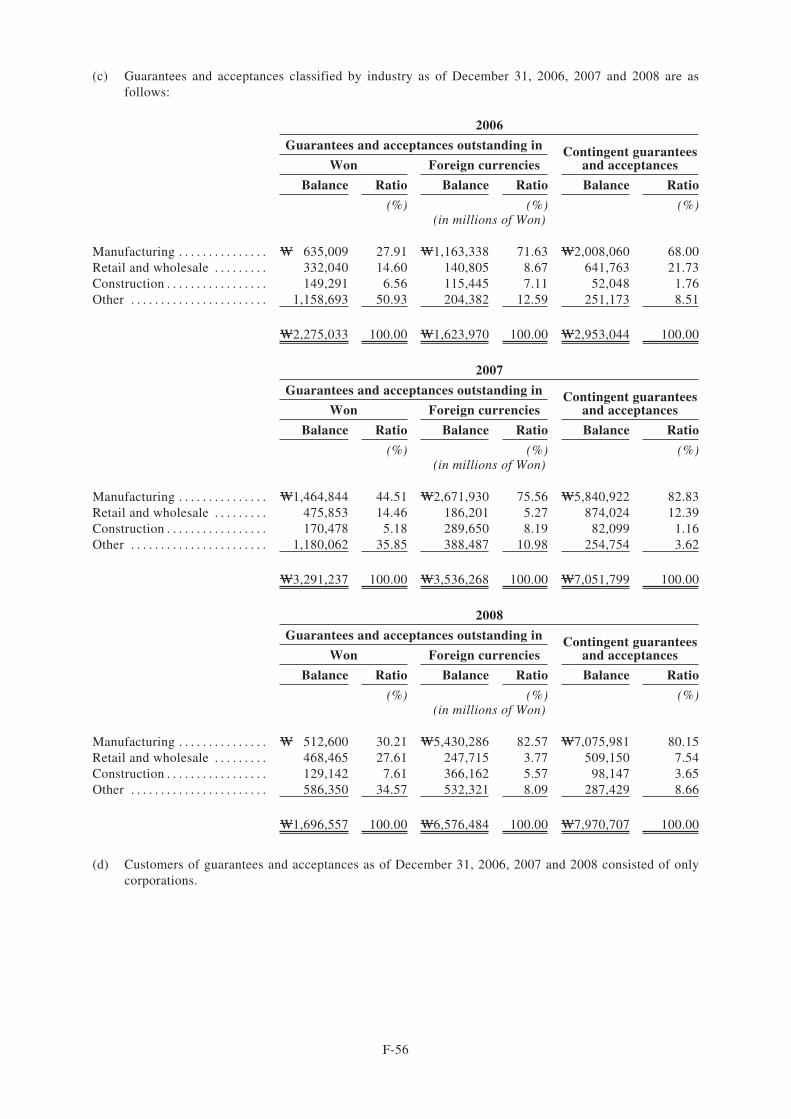
(c) Guarantees and acceptances classified by industry as of December 31, 2006, 2007 and 2008 are asfollows:
2006
Guarantees and acceptances outstanding in Contingent guaranteesand acceptancesWon Foreign currencies
Balance Ratio Balance Ratio Balance Ratio
(%) (%) (%)(in millions of Won)
Manufacturing . . . . . . . . . . . . . . . W 635,009 27.91 W1,163,338 71.63 W2,008,060 68.00Retail and wholesale . . . . . . . . . 332,040 14.60 140,805 8.67 641,763 21.73Construction . . . . . . . . . . . . . . . . . 149,291 6.56 115,445 7.11 52,048 1.76Other . . . . . . . . . . . . . . . . . . . . . . . 1,158,693 50.93 204,382 12.59 251,173 8.51
W2,275,033 100.00 W1,623,970 100.00 W2,953,044 100.00
2007
Guarantees and acceptances outstanding in Contingent guaranteesand acceptancesWon Foreign currencies
Balance Ratio Balance Ratio Balance Ratio
(%) (%) (%)(in millions of Won)
Manufacturing . . . . . . . . . . . . . . . W1,464,844 44.51 W2,671,930 75.56 W5,840,922 82.83Retail and wholesale . . . . . . . . . 475,853 14.46 186,201 5.27 874,024 12.39Construction . . . . . . . . . . . . . . . . . 170,478 5.18 289,650 8.19 82,099 1.16Other . . . . . . . . . . . . . . . . . . . . . . . 1,180,062 35.85 388,487 10.98 254,754 3.62
W3,291,237 100.00 W3,536,268 100.00 W7,051,799 100.00
2008
Guarantees and acceptances outstanding in Contingent guaranteesand acceptancesWon Foreign currencies
Balance Ratio Balance Ratio Balance Ratio
(%) (%) (%)(in millions of Won)
Manufacturing . . . . . . . . . . . . . . . W 512,600 30.21 W5,430,286 82.57 W7,075,981 80.15Retail and wholesale . . . . . . . . . 468,465 27.61 247,715 3.77 509,150 7.54Construction . . . . . . . . . . . . . . . . . 129,142 7.61 366,162 5.57 98,147 3.65Other . . . . . . . . . . . . . . . . . . . . . . . 586,350 34.57 532,321 8.09 287,429 8.66
W1,696,557 100.00 W6,576,484 100.00 W7,970,707 100.00
(d) Customers of guarantees and acceptances as of December 31, 2006, 2007 and 2008 consisted of onlycorporations.
F-56
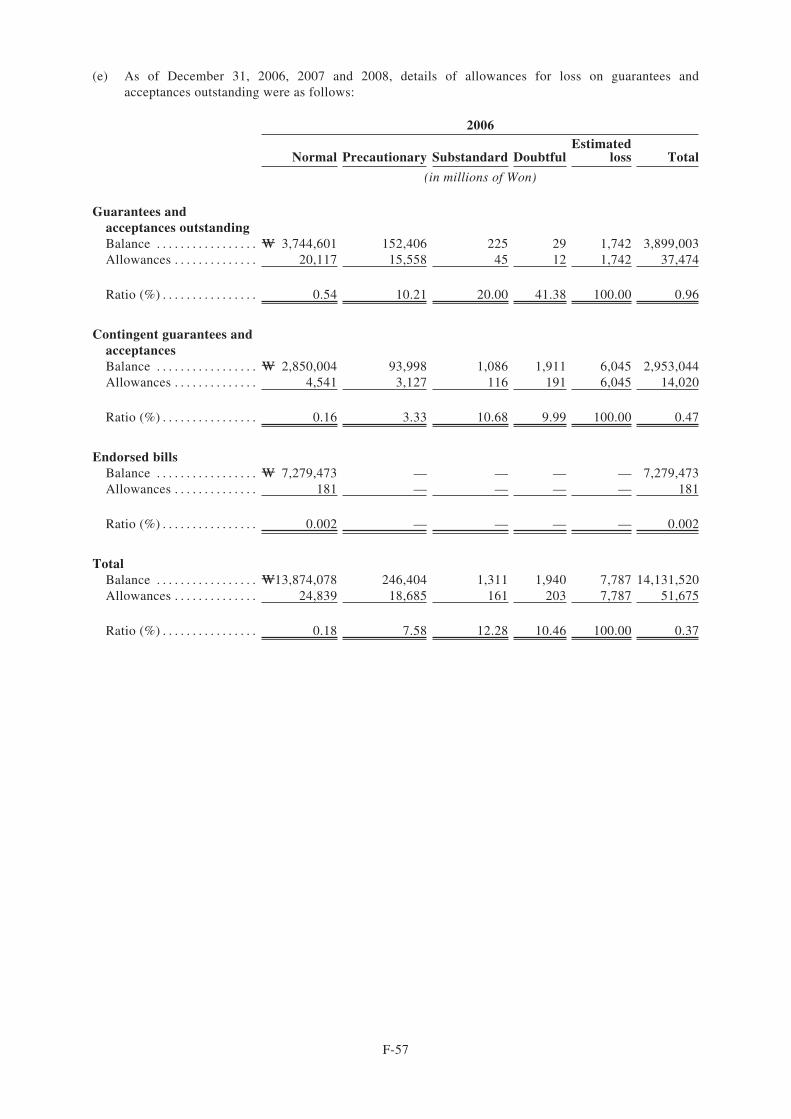
(e) As of December 31, 2006, 2007 and 2008, details of allowances for loss on guarantees andacceptances outstanding were as follows:
2006
Normal Precautionary Substandard DoubtfulEstimated
loss Total
(in millions of Won)
Guarantees andacceptances outstandingBalance . . . . . . . . . . . . . . . . . W 3,744,601 152,406 225 29 1,742 3,899,003Allowances . . . . . . . . . . . . . . 20,117 15,558 45 12 1,742 37,474
Ratio (%) . . . . . . . . . . . . . . . . 0.54 10.21 20.00 41.38 100.00 0.96
Contingent guarantees andacceptancesBalance . . . . . . . . . . . . . . . . . W 2,850,004 93,998 1,086 1,911 6,045 2,953,044Allowances . . . . . . . . . . . . . . 4,541 3,127 116 191 6,045 14,020
Ratio (%) . . . . . . . . . . . . . . . . 0.16 3.33 10.68 9.99 100.00 0.47
Endorsed billsBalance . . . . . . . . . . . . . . . . . W 7,279,473 — — — — 7,279,473Allowances . . . . . . . . . . . . . . 181 — — — — 181
Ratio (%) . . . . . . . . . . . . . . . . 0.002 — — — — 0.002
TotalBalance . . . . . . . . . . . . . . . . . W13,874,078 246,404 1,311 1,940 7,787 14,131,520Allowances . . . . . . . . . . . . . . 24,839 18,685 161 203 7,787 51,675
Ratio (%) . . . . . . . . . . . . . . . . 0.18 7.58 12.28 10.46 100.00 0.37
F-57
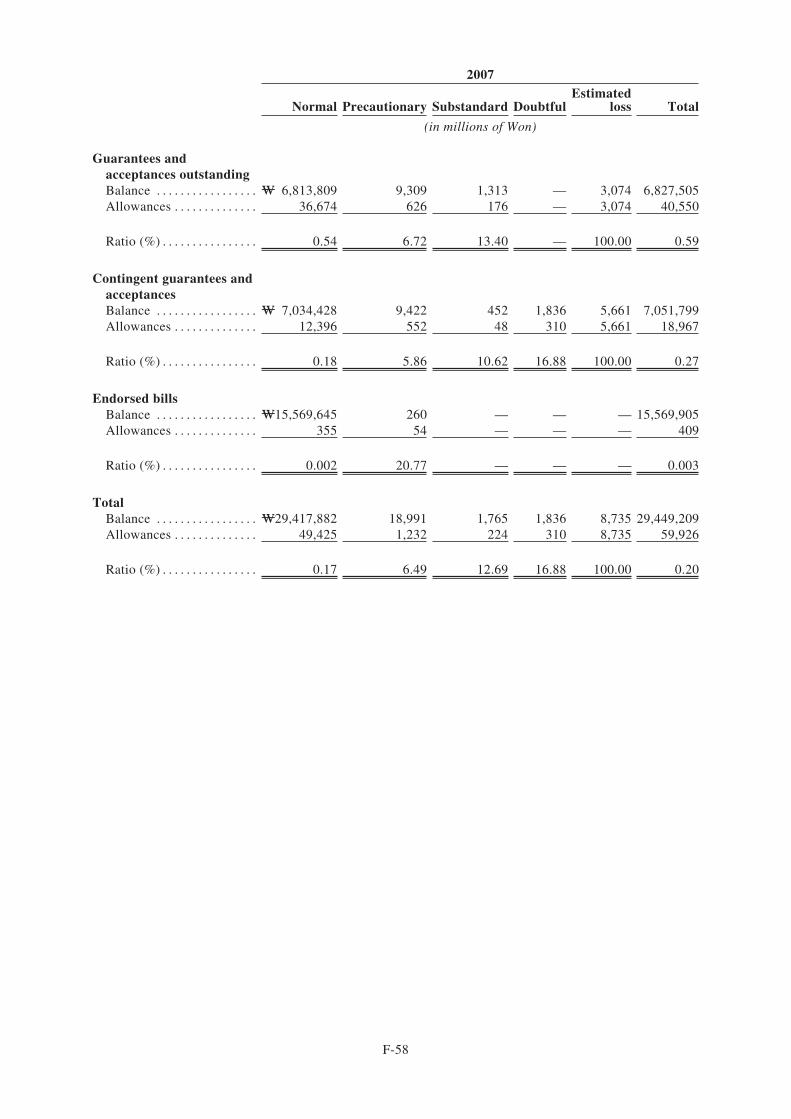
2007
Normal Precautionary Substandard DoubtfulEstimated
loss Total
(in millions of Won)
Guarantees andacceptances outstandingBalance . . . . . . . . . . . . . . . . . W 6,813,809 9,309 1,313 — 3,074 6,827,505Allowances . . . . . . . . . . . . . . 36,674 626 176 — 3,074 40,550
Ratio (%) . . . . . . . . . . . . . . . . 0.54 6.72 13.40 — 100.00 0.59
Contingent guarantees andacceptancesBalance . . . . . . . . . . . . . . . . . W 7,034,428 9,422 452 1,836 5,661 7,051,799Allowances . . . . . . . . . . . . . . 12,396 552 48 310 5,661 18,967
Ratio (%) . . . . . . . . . . . . . . . . 0.18 5.86 10.62 16.88 100.00 0.27
Endorsed billsBalance . . . . . . . . . . . . . . . . . W15,569,645 260 — — — 15,569,905Allowances . . . . . . . . . . . . . . 355 54 — — — 409
Ratio (%) . . . . . . . . . . . . . . . . 0.002 20.77 — — — 0.003
TotalBalance . . . . . . . . . . . . . . . . . W29,417,882 18,991 1,765 1,836 8,735 29,449,209Allowances . . . . . . . . . . . . . . 49,425 1,232 224 310 8,735 59,926
Ratio (%) . . . . . . . . . . . . . . . . 0.17 6.49 12.69 16.88 100.00 0.20
F-58
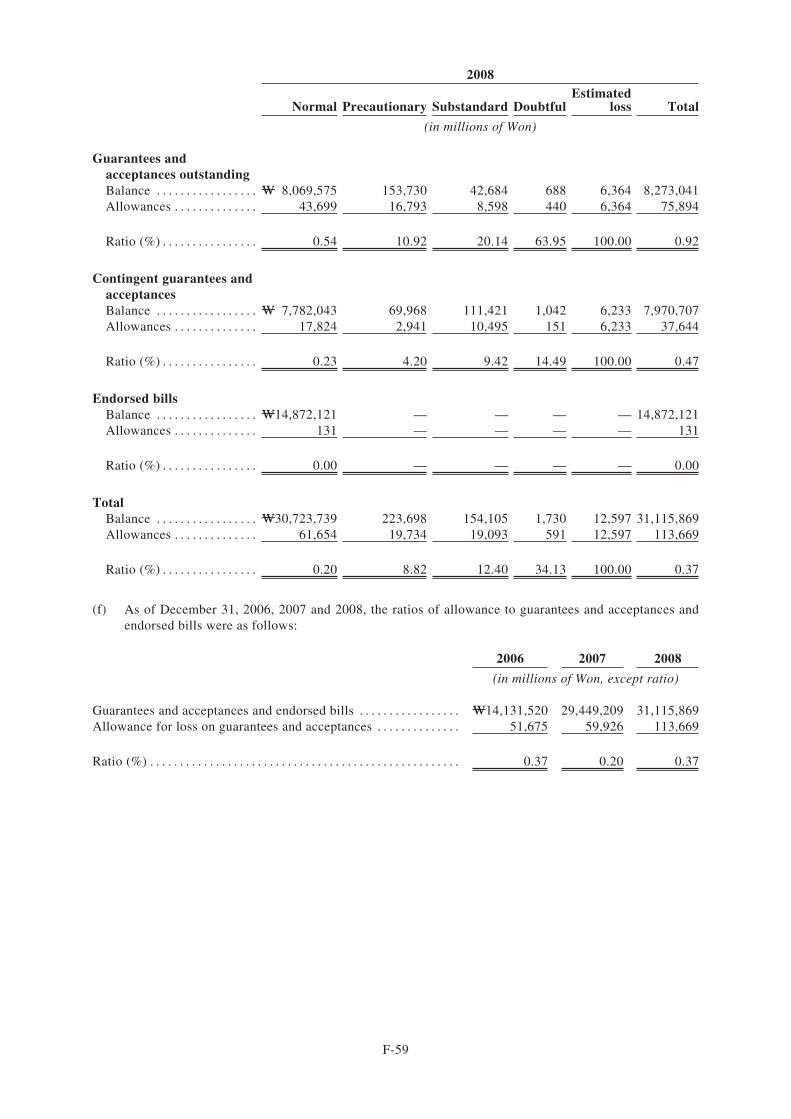
2008
Normal Precautionary Substandard DoubtfulEstimated
loss Total
(in millions of Won)
Guarantees andacceptances outstandingBalance . . . . . . . . . . . . . . . . . W 8,069,575 153,730 42,684 688 6,364 8,273,041Allowances . . . . . . . . . . . . . . 43,699 16,793 8,598 440 6,364 75,894
Ratio (%) . . . . . . . . . . . . . . . . 0.54 10.92 20.14 63.95 100.00 0.92
Contingent guarantees andacceptancesBalance . . . . . . . . . . . . . . . . . W 7,782,043 69,968 111,421 1,042 6,233 7,970,707Allowances . . . . . . . . . . . . . . 17,824 2,941 10,495 151 6,233 37,644
Ratio (%) . . . . . . . . . . . . . . . . 0.23 4.20 9.42 14.49 100.00 0.47
Endorsed billsBalance . . . . . . . . . . . . . . . . . W14,872,121 — — — — 14,872,121Allowances . . . . . . . . . . . . . . 131 — — — — 131
Ratio (%) . . . . . . . . . . . . . . . . 0.00 — — — — 0.00
TotalBalance . . . . . . . . . . . . . . . . . W30,723,739 223,698 154,105 1,730 12,597 31,115,869Allowances . . . . . . . . . . . . . . 61,654 19,734 19,093 591 12,597 113,669
Ratio (%) . . . . . . . . . . . . . . . . 0.20 8.82 12.40 34.13 100.00 0.37
(f) As of December 31, 2006, 2007 and 2008, the ratios of allowance to guarantees and acceptances andendorsed bills were as follows:
2006 2007 2008
(in millions of Won, except ratio)
Guarantees and acceptances and endorsed bills . . . . . . . . . . . . . . . . . W14,131,520 29,449,209 31,115,869Allowance for loss on guarantees and acceptances . . . . . . . . . . . . . . 51,675 59,926 113,669
Ratio (%) . . . . . . . . . . . . . . . . . . . . . . . . . . . . . . . . . . . . . . . . . . . . . . . . . . . . 0.37 0.20 0.37
F-59
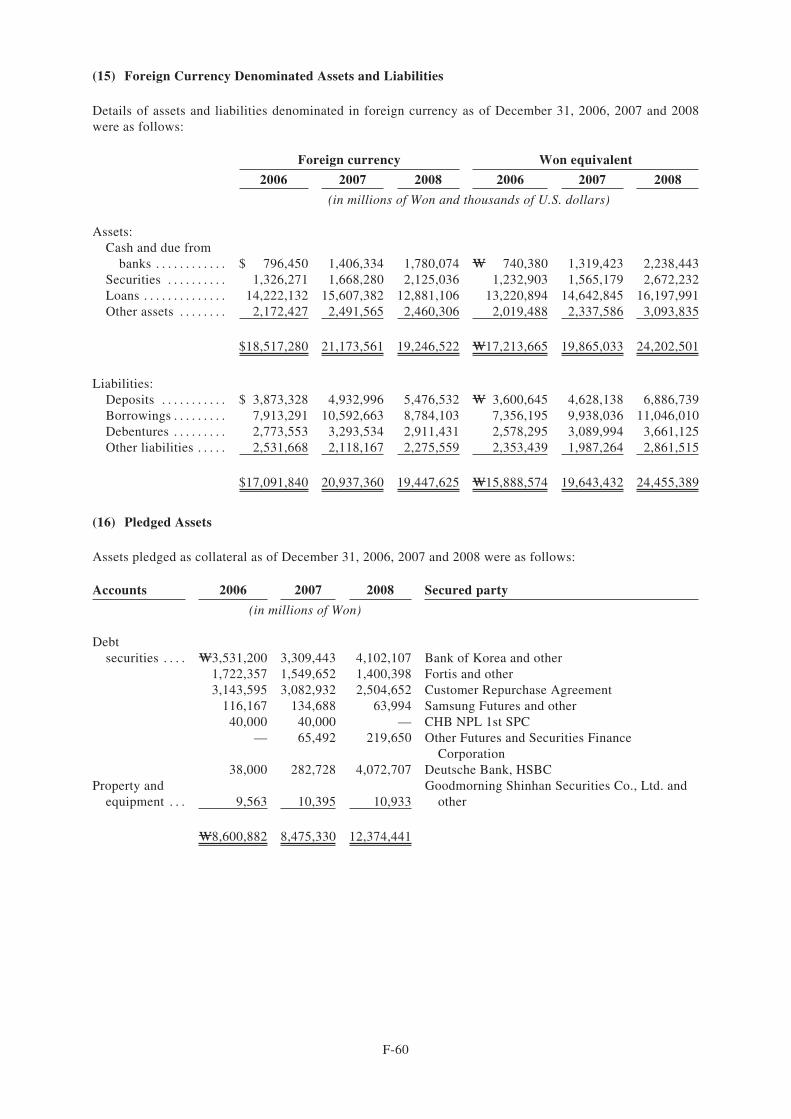
(15) Foreign Currency Denominated Assets and Liabilities
Details of assets and liabilities denominated in foreign currency as of December 31, 2006, 2007 and 2008were as follows:
Foreign currency Won equivalent
2006 2007 2008 2006 2007 2008
(in millions of Won and thousands of U.S. dollars)
Assets:Cash and due from
banks . . . . . . . . . . . . $ 796,450 1,406,334 1,780,074 W 740,380 1,319,423 2,238,443Securities . . . . . . . . . . 1,326,271 1,668,280 2,125,036 1,232,903 1,565,179 2,672,232Loans . . . . . . . . . . . . . . 14,222,132 15,607,382 12,881,106 13,220,894 14,642,845 16,197,991Other assets . . . . . . . . 2,172,427 2,491,565 2,460,306 2,019,488 2,337,586 3,093,835
$18,517,280 21,173,561 19,246,522 W17,213,665 19,865,033 24,202,501
Liabilities:Deposits . . . . . . . . . . . $ 3,873,328 4,932,996 5,476,532 W 3,600,645 4,628,138 6,886,739Borrowings . . . . . . . . . 7,913,291 10,592,663 8,784,103 7,356,195 9,938,036 11,046,010Debentures . . . . . . . . . 2,773,553 3,293,534 2,911,431 2,578,295 3,089,994 3,661,125Other liabilities . . . . . 2,531,668 2,118,167 2,275,559 2,353,439 1,987,264 2,861,515
$17,091,840 20,937,360 19,447,625 W15,888,574 19,643,432 24,455,389
(16) Pledged Assets
Assets pledged as collateral as of December 31, 2006, 2007 and 2008 were as follows:
Accounts 2006 2007 2008 Secured party
(in millions of Won)
Debtsecurities . . . . W3,531,200 3,309,443 4,102,107 Bank of Korea and other
1,722,357 1,549,652 1,400,398 Fortis and other3,143,595 3,082,932 2,504,652 Customer Repurchase Agreement
116,167 134,688 63,994 Samsung Futures and other40,000 40,000 — CHB NPL 1st SPC
— 65,492 219,650 Other Futures and Securities FinanceCorporation
38,000 282,728 4,072,707 Deutsche Bank, HSBCProperty and
equipment . . . 9,563 10,395 10,933Goodmorning Shinhan Securities Co., Ltd. and
other
W8,600,882 8,475,330 12,374,441
F-60
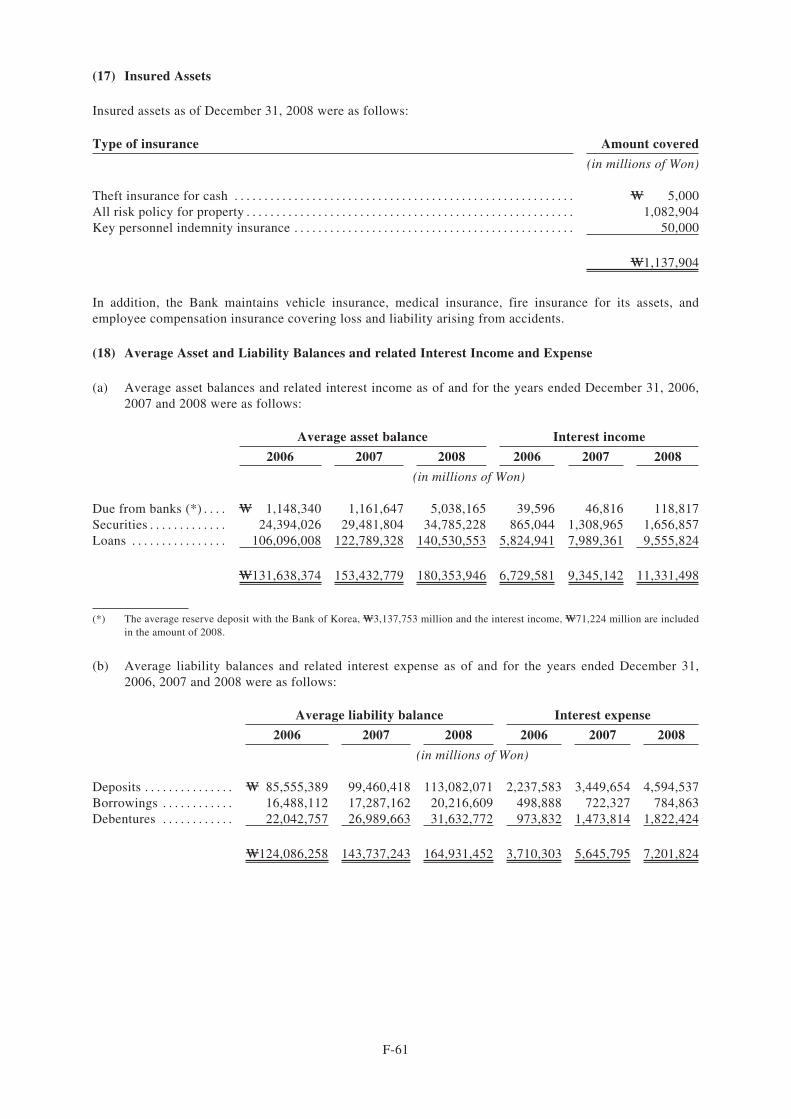
(17) Insured Assets
Insured assets as of December 31, 2008 were as follows:
Type of insurance Amount covered
(in millions of Won)
Theft insurance for cash . . . . . . . . . . . . . . . . . . . . . . . . . . . . . . . . . . . . . . . . . . . . . . . . . . . . . . . . . W 5,000All risk policy for property . . . . . . . . . . . . . . . . . . . . . . . . . . . . . . . . . . . . . . . . . . . . . . . . . . . . . . . 1,082,904Key personnel indemnity insurance . . . . . . . . . . . . . . . . . . . . . . . . . . . . . . . . . . . . . . . . . . . . . . . 50,000
W1,137,904
In addition, the Bank maintains vehicle insurance, medical insurance, fire insurance for its assets, andemployee compensation insurance covering loss and liability arising from accidents.
(18) Average Asset and Liability Balances and related Interest Income and Expense
(a) Average asset balances and related interest income as of and for the years ended December 31, 2006,2007 and 2008 were as follows:
Average asset balance Interest income
2006 2007 2008 2006 2007 2008
(in millions of Won)
Due from banks (*) . . . . W 1,148,340 1,161,647 5,038,165 39,596 46,816 118,817Securities . . . . . . . . . . . . . 24,394,026 29,481,804 34,785,228 865,044 1,308,965 1,656,857Loans . . . . . . . . . . . . . . . . 106,096,008 122,789,328 140,530,553 5,824,941 7,989,361 9,555,824
W131,638,374 153,432,779 180,353,946 6,729,581 9,345,142 11,331,498
(*) The average reserve deposit with the Bank of Korea, W3,137,753 million and the interest income, W71,224 million are includedin the amount of 2008.
(b) Average liability balances and related interest expense as of and for the years ended December 31,2006, 2007 and 2008 were as follows:
Average liability balance Interest expense
2006 2007 2008 2006 2007 2008
(in millions of Won)
Deposits . . . . . . . . . . . . . . . W 85,555,389 99,460,418 113,082,071 2,237,583 3,449,654 4,594,537Borrowings . . . . . . . . . . . . 16,488,112 17,287,162 20,216,609 498,888 722,327 784,863Debentures . . . . . . . . . . . . 22,042,757 26,989,663 31,632,772 973,832 1,473,814 1,822,424
W124,086,258 143,737,243 164,931,452 3,710,303 5,645,795 7,201,824
F-61
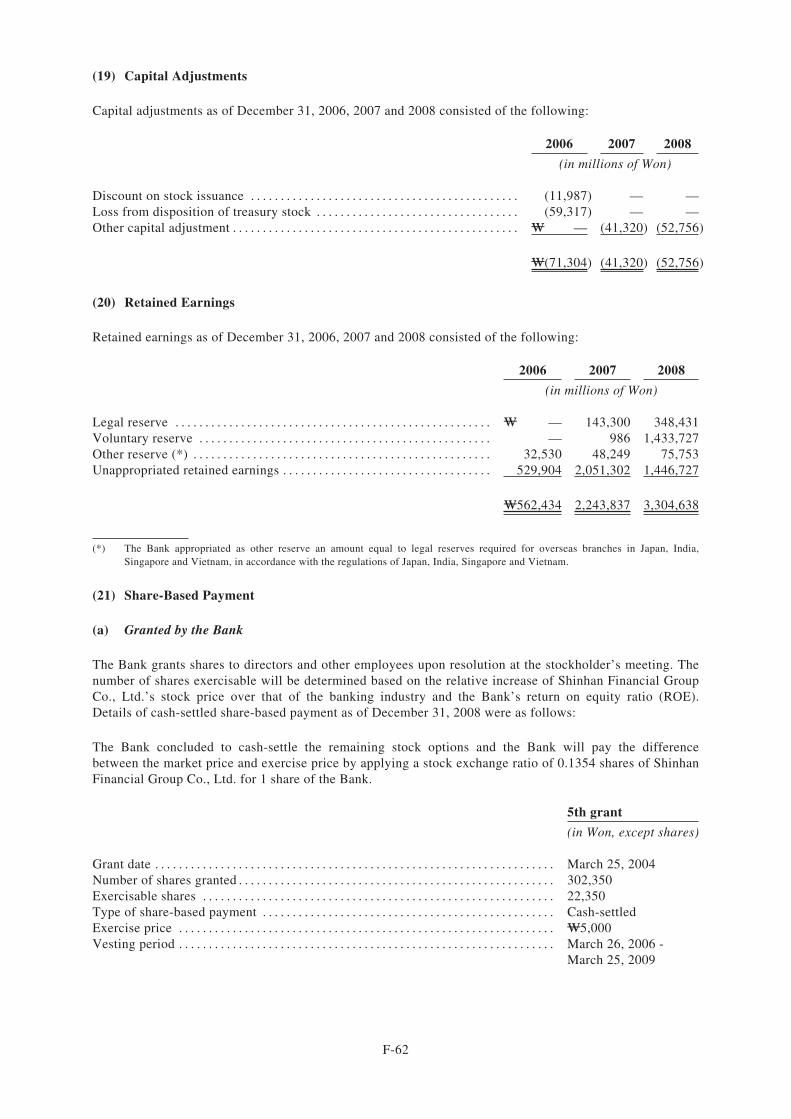
(19) Capital Adjustments
Capital adjustments as of December 31, 2006, 2007 and 2008 consisted of the following:
2006 2007 2008
(in millions of Won)
Discount on stock issuance . . . . . . . . . . . . . . . . . . . . . . . . . . . . . . . . . . . . . . . . . . . . . (11,987) — —Loss from disposition of treasury stock . . . . . . . . . . . . . . . . . . . . . . . . . . . . . . . . . . (59,317) — —Other capital adjustment . . . . . . . . . . . . . . . . . . . . . . . . . . . . . . . . . . . . . . . . . . . . . . . . W — (41,320) (52,756)
W(71,304) (41,320) (52,756)
(20) Retained Earnings
Retained earnings as of December 31, 2006, 2007 and 2008 consisted of the following:
2006 2007 2008
(in millions of Won)
Legal reserve . . . . . . . . . . . . . . . . . . . . . . . . . . . . . . . . . . . . . . . . . . . . . . . . . . . . . W — 143,300 348,431Voluntary reserve . . . . . . . . . . . . . . . . . . . . . . . . . . . . . . . . . . . . . . . . . . . . . . . . . — 986 1,433,727Other reserve (*) . . . . . . . . . . . . . . . . . . . . . . . . . . . . . . . . . . . . . . . . . . . . . . . . . . 32,530 48,249 75,753Unappropriated retained earnings . . . . . . . . . . . . . . . . . . . . . . . . . . . . . . . . . . . 529,904 2,051,302 1,446,727
W562,434 2,243,837 3,304,638
(*) The Bank appropriated as other reserve an amount equal to legal reserves required for overseas branches in Japan, India,Singapore and Vietnam, in accordance with the regulations of Japan, India, Singapore and Vietnam.
(21) Share-Based Payment
(a) Granted by the Bank
The Bank grants shares to directors and other employees upon resolution at the stockholder’s meeting. Thenumber of shares exercisable will be determined based on the relative increase of Shinhan Financial GroupCo., Ltd.’s stock price over that of the banking industry and the Bank’s return on equity ratio (ROE).Details of cash-settled share-based payment as of December 31, 2008 were as follows:
The Bank concluded to cash-settle the remaining stock options and the Bank will pay the differencebetween the market price and exercise price by applying a stock exchange ratio of 0.1354 shares of ShinhanFinancial Group Co., Ltd. for 1 share of the Bank.
5th grant
(in Won, except shares)
Grant date . . . . . . . . . . . . . . . . . . . . . . . . . . . . . . . . . . . . . . . . . . . . . . . . . . . . . . . . . . . . . . . . . . . March 25, 2004Number of shares granted . . . . . . . . . . . . . . . . . . . . . . . . . . . . . . . . . . . . . . . . . . . . . . . . . . . . . 302,350Exercisable shares . . . . . . . . . . . . . . . . . . . . . . . . . . . . . . . . . . . . . . . . . . . . . . . . . . . . . . . . . . . 22,350Type of share-based payment . . . . . . . . . . . . . . . . . . . . . . . . . . . . . . . . . . . . . . . . . . . . . . . . . Cash-settledExercise price . . . . . . . . . . . . . . . . . . . . . . . . . . . . . . . . . . . . . . . . . . . . . . . . . . . . . . . . . . . . . . . W5,000Vesting period . . . . . . . . . . . . . . . . . . . . . . . . . . . . . . . . . . . . . . . . . . . . . . . . . . . . . . . . . . . . . . . March 26, 2006 -
March 25, 2009
F-62
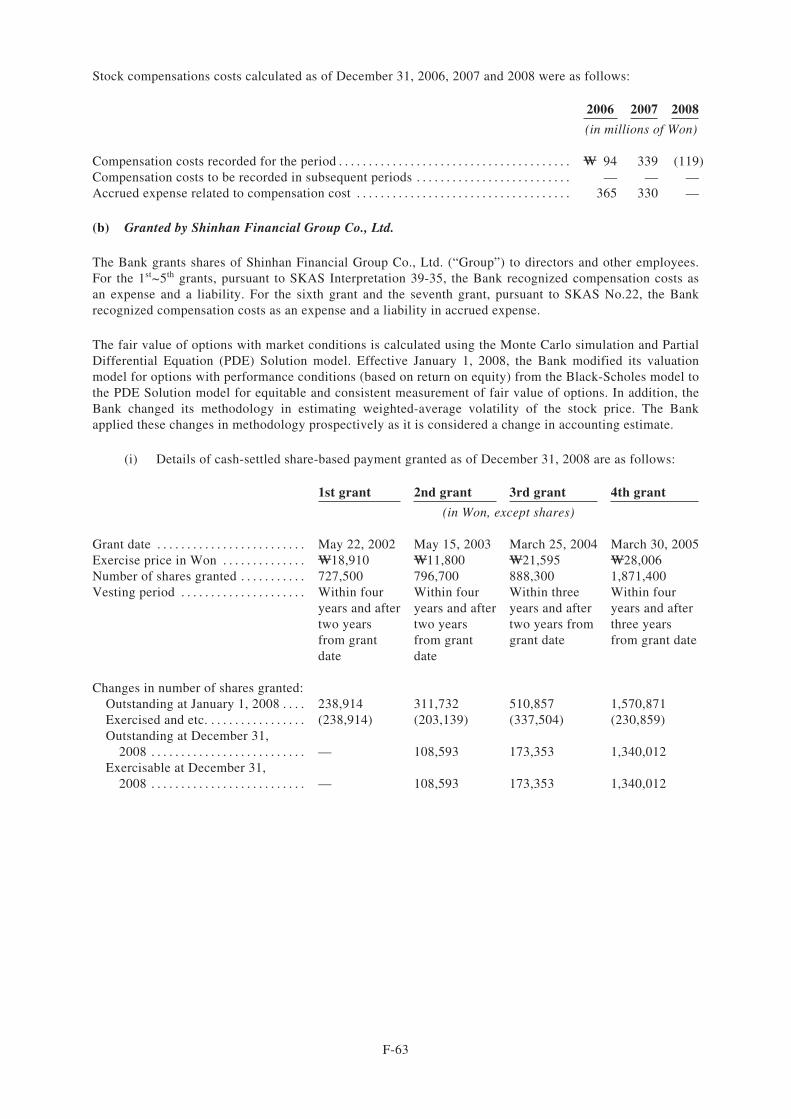
Stock compensations costs calculated as of December 31, 2006, 2007 and 2008 were as follows:
2006 2007 2008
(in millions of Won)
Compensation costs recorded for the period . . . . . . . . . . . . . . . . . . . . . . . . . . . . . . . . . . . . . . . W 94 339 (119)Compensation costs to be recorded in subsequent periods . . . . . . . . . . . . . . . . . . . . . . . . . . — — —Accrued expense related to compensation cost . . . . . . . . . . . . . . . . . . . . . . . . . . . . . . . . . . . . 365 330 —
(b) Granted by Shinhan Financial Group Co., Ltd.
The Bank grants shares of Shinhan Financial Group Co., Ltd. (“Group”) to directors and other employees.For the 1st~5th grants, pursuant to SKAS Interpretation 39-35, the Bank recognized compensation costs asan expense and a liability. For the sixth grant and the seventh grant, pursuant to SKAS No.22, the Bankrecognized compensation costs as an expense and a liability in accrued expense.
The fair value of options with market conditions is calculated using the Monte Carlo simulation and PartialDifferential Equation (PDE) Solution model. Effective January 1, 2008, the Bank modified its valuationmodel for options with performance conditions (based on return on equity) from the Black-Scholes model tothe PDE Solution model for equitable and consistent measurement of fair value of options. In addition, theBank changed its methodology in estimating weighted-average volatility of the stock price. The Bankapplied these changes in methodology prospectively as it is considered a change in accounting estimate.
(i) Details of cash-settled share-based payment granted as of December 31, 2008 are as follows:
1st grant 2nd grant 3rd grant 4th grant
(in Won, except shares)
Grant date . . . . . . . . . . . . . . . . . . . . . . . . . May 22, 2002 May 15, 2003 March 25, 2004 March 30, 2005Exercise price in Won . . . . . . . . . . . . . . W18,910 W11,800 W21,595 W28,006Number of shares granted . . . . . . . . . . . 727,500 796,700 888,300 1,871,400Vesting period . . . . . . . . . . . . . . . . . . . . . Within four
years and aftertwo yearsfrom grantdate
Within fouryears and aftertwo yearsfrom grantdate
Within threeyears and aftertwo years fromgrant date
Within fouryears and afterthree yearsfrom grant date
Changes in number of shares granted:Outstanding at January 1, 2008 . . . . 238,914 311,732 510,857 1,570,871Exercised and etc. . . . . . . . . . . . . . . . . (238,914) (203,139) (337,504) (230,859)Outstanding at December 31,
2008 . . . . . . . . . . . . . . . . . . . . . . . . . . — 108,593 173,353 1,340,012Exercisable at December 31,
2008 . . . . . . . . . . . . . . . . . . . . . . . . . . — 108,593 173,353 1,340,012
F-63
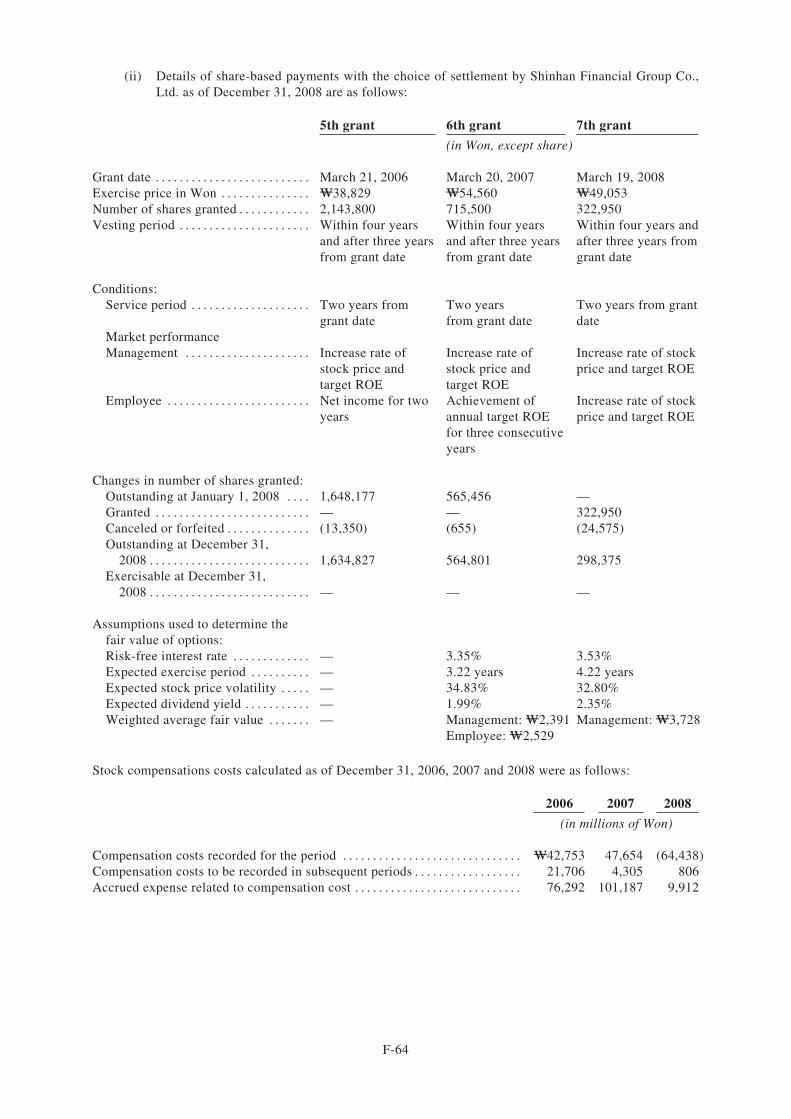
(ii) Details of share-based payments with the choice of settlement by Shinhan Financial Group Co.,Ltd. as of December 31, 2008 are as follows:
5th grant 6th grant 7th grant
(in Won, except share)
Grant date . . . . . . . . . . . . . . . . . . . . . . . . . . March 21, 2006 March 20, 2007 March 19, 2008Exercise price in Won . . . . . . . . . . . . . . . W38,829 W54,560 W49,053Number of shares granted . . . . . . . . . . . . 2,143,800 715,500 322,950Vesting period . . . . . . . . . . . . . . . . . . . . . . Within four years
and after three yearsfrom grant date
Within four yearsand after three yearsfrom grant date
Within four years andafter three years fromgrant date
Conditions:Service period . . . . . . . . . . . . . . . . . . . . Two years from
grant dateTwo yearsfrom grant date
Two years from grantdate
Market performanceManagement . . . . . . . . . . . . . . . . . . . . . Increase rate of
stock price andtarget ROE
Increase rate ofstock price andtarget ROE
Increase rate of stockprice and target ROE
Employee . . . . . . . . . . . . . . . . . . . . . . . . Net income for twoyears
Achievement ofannual target ROEfor three consecutiveyears
Increase rate of stockprice and target ROE
Changes in number of shares granted:Outstanding at January 1, 2008 . . . . 1,648,177 565,456 —Granted . . . . . . . . . . . . . . . . . . . . . . . . . . — — 322,950Canceled or forfeited . . . . . . . . . . . . . . (13,350) (655) (24,575)Outstanding at December 31,
2008 . . . . . . . . . . . . . . . . . . . . . . . . . . . 1,634,827 564,801 298,375Exercisable at December 31,
2008 . . . . . . . . . . . . . . . . . . . . . . . . . . . — — —
Assumptions used to determine thefair value of options:Risk-free interest rate . . . . . . . . . . . . . — 3.35% 3.53%Expected exercise period . . . . . . . . . . — 3.22 years 4.22 yearsExpected stock price volatility . . . . . — 34.83% 32.80%Expected dividend yield . . . . . . . . . . . — 1.99% 2.35%Weighted average fair value . . . . . . . — Management: W2,391
Employee: W2,529Management: W3,728
Stock compensations costs calculated as of December 31, 2006, 2007 and 2008 were as follows:
2006 2007 2008
(in millions of Won)
Compensation costs recorded for the period . . . . . . . . . . . . . . . . . . . . . . . . . . . . . . W42,753 47,654 (64,438)Compensation costs to be recorded in subsequent periods . . . . . . . . . . . . . . . . . . 21,706 4,305 806Accrued expense related to compensation cost . . . . . . . . . . . . . . . . . . . . . . . . . . . . 76,292 101,187 9,912
F-64
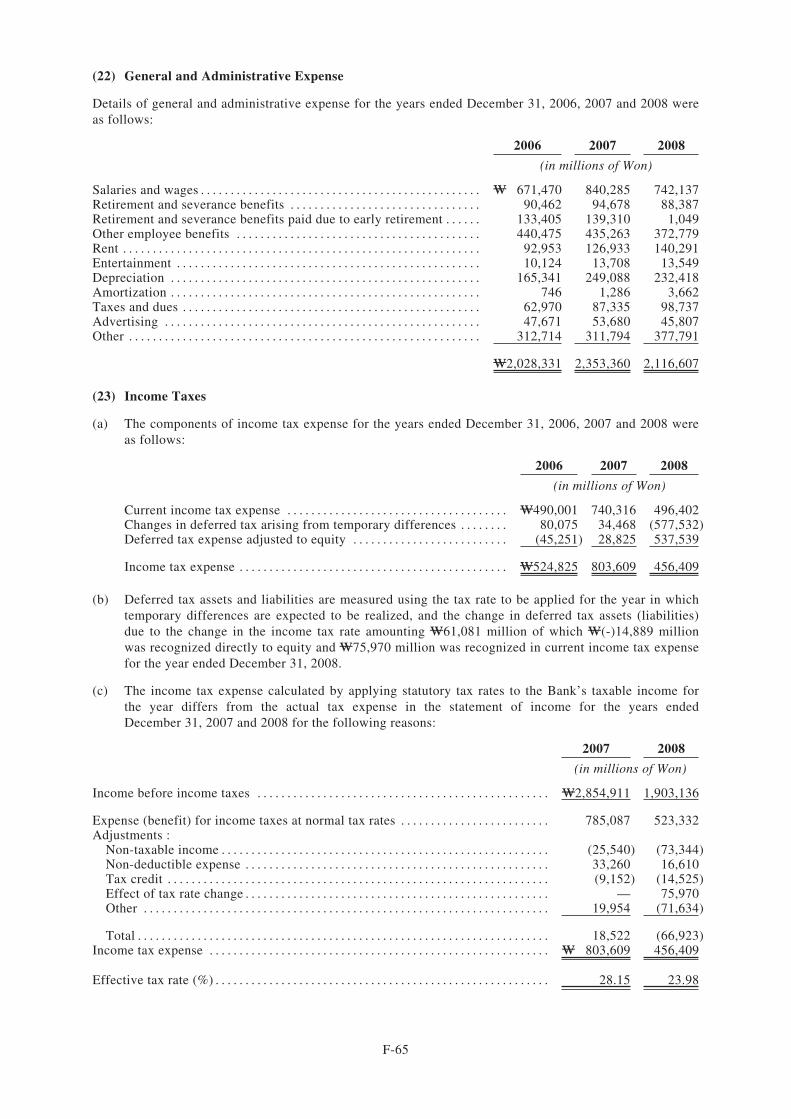
(22) General and Administrative Expense
Details of general and administrative expense for the years ended December 31, 2006, 2007 and 2008 wereas follows:
2006 2007 2008
(in millions of Won)
Salaries and wages . . . . . . . . . . . . . . . . . . . . . . . . . . . . . . . . . . . . . . . . . . . . . . . W 671,470 840,285 742,137Retirement and severance benefits . . . . . . . . . . . . . . . . . . . . . . . . . . . . . . . . 90,462 94,678 88,387Retirement and severance benefits paid due to early retirement . . . . . . 133,405 139,310 1,049Other employee benefits . . . . . . . . . . . . . . . . . . . . . . . . . . . . . . . . . . . . . . . . . 440,475 435,263 372,779Rent . . . . . . . . . . . . . . . . . . . . . . . . . . . . . . . . . . . . . . . . . . . . . . . . . . . . . . . . . . . . 92,953 126,933 140,291Entertainment . . . . . . . . . . . . . . . . . . . . . . . . . . . . . . . . . . . . . . . . . . . . . . . . . . . 10,124 13,708 13,549Depreciation . . . . . . . . . . . . . . . . . . . . . . . . . . . . . . . . . . . . . . . . . . . . . . . . . . . . 165,341 249,088 232,418Amortization . . . . . . . . . . . . . . . . . . . . . . . . . . . . . . . . . . . . . . . . . . . . . . . . . . . . 746 1,286 3,662Taxes and dues . . . . . . . . . . . . . . . . . . . . . . . . . . . . . . . . . . . . . . . . . . . . . . . . . . 62,970 87,335 98,737Advertising . . . . . . . . . . . . . . . . . . . . . . . . . . . . . . . . . . . . . . . . . . . . . . . . . . . . . 47,671 53,680 45,807Other . . . . . . . . . . . . . . . . . . . . . . . . . . . . . . . . . . . . . . . . . . . . . . . . . . . . . . . . . . . 312,714 311,794 377,791
W2,028,331 2,353,360 2,116,607
(23) Income Taxes
(a) The components of income tax expense for the years ended December 31, 2006, 2007 and 2008 wereas follows:
2006 2007 2008
(in millions of Won)
Current income tax expense . . . . . . . . . . . . . . . . . . . . . . . . . . . . . . . . . . . . . W490,001 740,316 496,402Changes in deferred tax arising from temporary differences . . . . . . . . 80,075 34,468 (577,532)Deferred tax expense adjusted to equity . . . . . . . . . . . . . . . . . . . . . . . . . . (45,251) 28,825 537,539
Income tax expense . . . . . . . . . . . . . . . . . . . . . . . . . . . . . . . . . . . . . . . . . . . . . W524,825 803,609 456,409
(b) Deferred tax assets and liabilities are measured using the tax rate to be applied for the year in whichtemporary differences are expected to be realized, and the change in deferred tax assets (liabilities)due to the change in the income tax rate amounting W61,081 million of which W(-)14,889 millionwas recognized directly to equity and W75,970 million was recognized in current income tax expensefor the year ended December 31, 2008.
(c) The income tax expense calculated by applying statutory tax rates to the Bank’s taxable income forthe year differs from the actual tax expense in the statement of income for the years endedDecember 31, 2007 and 2008 for the following reasons:
2007 2008
(in millions of Won)
Income before income taxes . . . . . . . . . . . . . . . . . . . . . . . . . . . . . . . . . . . . . . . . . . . . . . . . . W2,854,911 1,903,136
Expense (benefit) for income taxes at normal tax rates . . . . . . . . . . . . . . . . . . . . . . . . . 785,087 523,332Adjustments :
Non-taxable income . . . . . . . . . . . . . . . . . . . . . . . . . . . . . . . . . . . . . . . . . . . . . . . . . . . . . . . (25,540) (73,344)Non-deductible expense . . . . . . . . . . . . . . . . . . . . . . . . . . . . . . . . . . . . . . . . . . . . . . . . . . . 33,260 16,610Tax credit . . . . . . . . . . . . . . . . . . . . . . . . . . . . . . . . . . . . . . . . . . . . . . . . . . . . . . . . . . . . . . . . (9,152) (14,525)Effect of tax rate change . . . . . . . . . . . . . . . . . . . . . . . . . . . . . . . . . . . . . . . . . . . . . . . . . . . — 75,970Other . . . . . . . . . . . . . . . . . . . . . . . . . . . . . . . . . . . . . . . . . . . . . . . . . . . . . . . . . . . . . . . . . . . . 19,954 (71,634)
Total . . . . . . . . . . . . . . . . . . . . . . . . . . . . . . . . . . . . . . . . . . . . . . . . . . . . . . . . . . . . . . . . . . . . . 18,522 (66,923)Income tax expense . . . . . . . . . . . . . . . . . . . . . . . . . . . . . . . . . . . . . . . . . . . . . . . . . . . . . . . . . W 803,609 456,409
Effective tax rate (%) . . . . . . . . . . . . . . . . . . . . . . . . . . . . . . . . . . . . . . . . . . . . . . . . . . . . . . . . 28.15 23.98
F-65
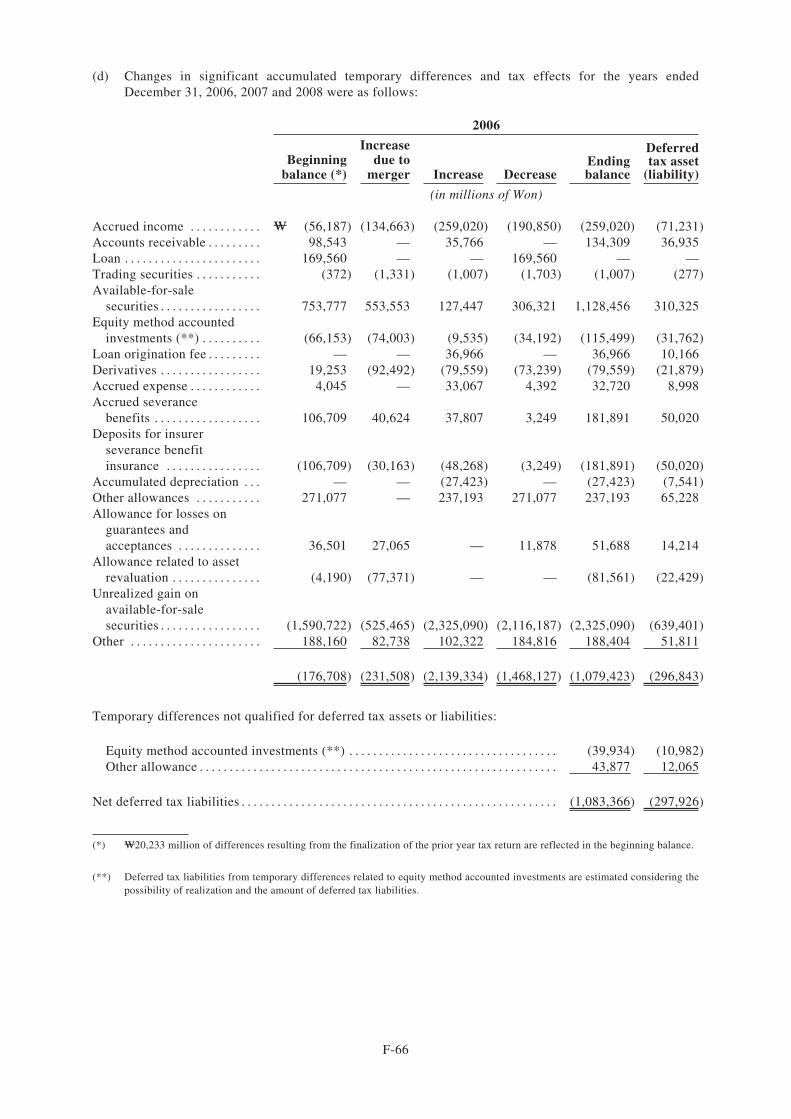
(d) Changes in significant accumulated temporary differences and tax effects for the years endedDecember 31, 2006, 2007 and 2008 were as follows:
2006
Beginningbalance (*)
Increasedue to
merger Increase DecreaseEndingbalance
Deferredtax asset
(liability)
(in millions of Won)
Accrued income . . . . . . . . . . . . W (56,187) (134,663) (259,020) (190,850) (259,020) (71,231)Accounts receivable . . . . . . . . . 98,543 — 35,766 — 134,309 36,935Loan . . . . . . . . . . . . . . . . . . . . . . . 169,560 — — 169,560 — —Trading securities . . . . . . . . . . . (372) (1,331) (1,007) (1,703) (1,007) (277)Available-for-sale
securities . . . . . . . . . . . . . . . . . 753,777 553,553 127,447 306,321 1,128,456 310,325Equity method accounted
investments (**) . . . . . . . . . . (66,153) (74,003) (9,535) (34,192) (115,499) (31,762)Loan origination fee . . . . . . . . . — — 36,966 — 36,966 10,166Derivatives . . . . . . . . . . . . . . . . . 19,253 (92,492) (79,559) (73,239) (79,559) (21,879)Accrued expense . . . . . . . . . . . . 4,045 — 33,067 4,392 32,720 8,998Accrued severance
benefits . . . . . . . . . . . . . . . . . . 106,709 40,624 37,807 3,249 181,891 50,020Deposits for insurer
severance benefitinsurance . . . . . . . . . . . . . . . . (106,709) (30,163) (48,268) (3,249) (181,891) (50,020)
Accumulated depreciation . . . — — (27,423) — (27,423) (7,541)Other allowances . . . . . . . . . . . 271,077 — 237,193 271,077 237,193 65,228Allowance for losses on
guarantees andacceptances . . . . . . . . . . . . . . 36,501 27,065 — 11,878 51,688 14,214
Allowance related to assetrevaluation . . . . . . . . . . . . . . . (4,190) (77,371) — — (81,561) (22,429)
Unrealized gain onavailable-for-salesecurities . . . . . . . . . . . . . . . . . (1,590,722) (525,465) (2,325,090) (2,116,187) (2,325,090) (639,401)
Other . . . . . . . . . . . . . . . . . . . . . . 188,160 82,738 102,322 184,816 188,404 51,811
(176,708) (231,508) (2,139,334) (1,468,127) (1,079,423) (296,843)
Temporary differences not qualified for deferred tax assets or liabilities:
Equity method accounted investments (**) . . . . . . . . . . . . . . . . . . . . . . . . . . . . . . . . . . . (39,934) (10,982)Other allowance . . . . . . . . . . . . . . . . . . . . . . . . . . . . . . . . . . . . . . . . . . . . . . . . . . . . . . . . . . . . 43,877 12,065
Net deferred tax liabilities . . . . . . . . . . . . . . . . . . . . . . . . . . . . . . . . . . . . . . . . . . . . . . . . . . . . . (1,083,366) (297,926)
(*) W20,233 million of differences resulting from the finalization of the prior year tax return are reflected in the beginning balance.
(**) Deferred tax liabilities from temporary differences related to equity method accounted investments are estimated considering thepossibility of realization and the amount of deferred tax liabilities.
F-66
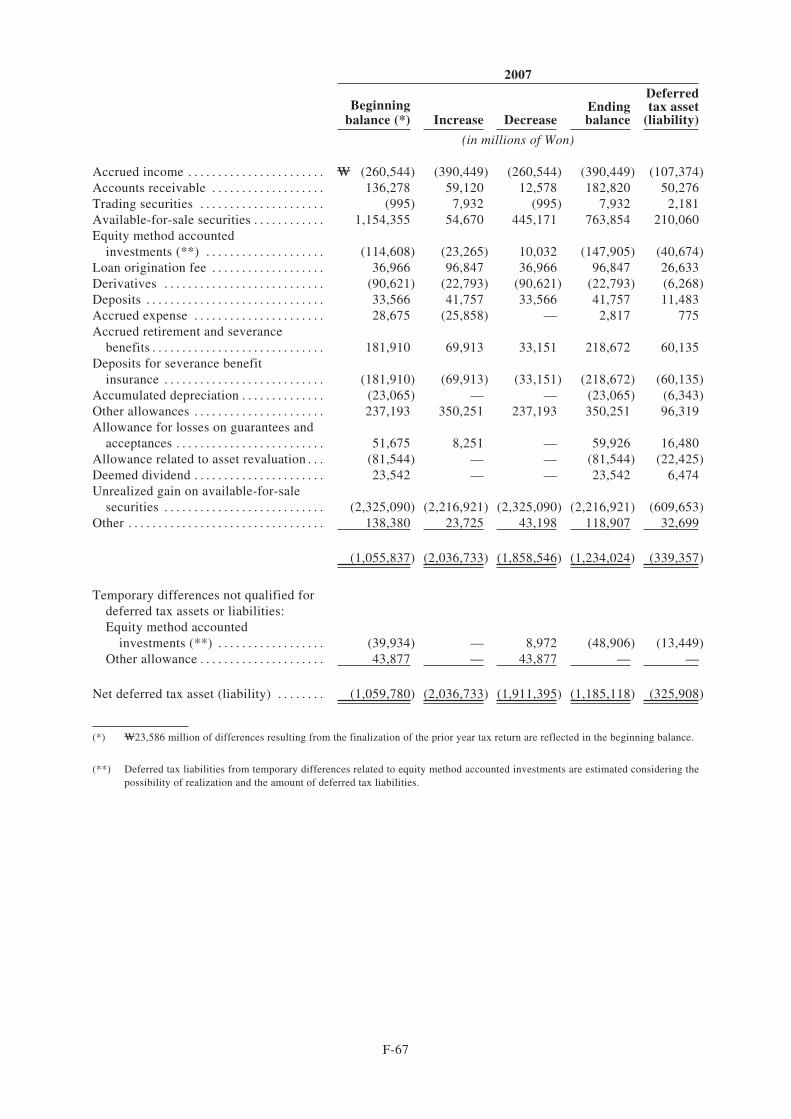
2007
Beginningbalance (*) Increase Decrease
Endingbalance
Deferredtax asset
(liability)
(in millions of Won)
Accrued income . . . . . . . . . . . . . . . . . . . . . . . W (260,544) (390,449) (260,544) (390,449) (107,374)Accounts receivable . . . . . . . . . . . . . . . . . . . 136,278 59,120 12,578 182,820 50,276Trading securities . . . . . . . . . . . . . . . . . . . . . (995) 7,932 (995) 7,932 2,181Available-for-sale securities . . . . . . . . . . . . 1,154,355 54,670 445,171 763,854 210,060Equity method accounted
investments (**) . . . . . . . . . . . . . . . . . . . . (114,608) (23,265) 10,032 (147,905) (40,674)Loan origination fee . . . . . . . . . . . . . . . . . . . 36,966 96,847 36,966 96,847 26,633Derivatives . . . . . . . . . . . . . . . . . . . . . . . . . . . (90,621) (22,793) (90,621) (22,793) (6,268)Deposits . . . . . . . . . . . . . . . . . . . . . . . . . . . . . . 33,566 41,757 33,566 41,757 11,483Accrued expense . . . . . . . . . . . . . . . . . . . . . . 28,675 (25,858) — 2,817 775Accrued retirement and severance
benefits . . . . . . . . . . . . . . . . . . . . . . . . . . . . . 181,910 69,913 33,151 218,672 60,135Deposits for severance benefit
insurance . . . . . . . . . . . . . . . . . . . . . . . . . . . (181,910) (69,913) (33,151) (218,672) (60,135)Accumulated depreciation . . . . . . . . . . . . . . (23,065) — — (23,065) (6,343)Other allowances . . . . . . . . . . . . . . . . . . . . . . 237,193 350,251 237,193 350,251 96,319Allowance for losses on guarantees and
acceptances . . . . . . . . . . . . . . . . . . . . . . . . . 51,675 8,251 — 59,926 16,480Allowance related to asset revaluation . . . (81,544) — — (81,544) (22,425)Deemed dividend . . . . . . . . . . . . . . . . . . . . . . 23,542 — — 23,542 6,474Unrealized gain on available-for-sale
securities . . . . . . . . . . . . . . . . . . . . . . . . . . . (2,325,090) (2,216,921) (2,325,090) (2,216,921) (609,653)Other . . . . . . . . . . . . . . . . . . . . . . . . . . . . . . . . . 138,380 23,725 43,198 118,907 32,699
(1,055,837) (2,036,733) (1,858,546) (1,234,024) (339,357)
Temporary differences not qualified fordeferred tax assets or liabilities:Equity method accounted
investments (**) . . . . . . . . . . . . . . . . . . (39,934) — 8,972 (48,906) (13,449)Other allowance . . . . . . . . . . . . . . . . . . . . . 43,877 — 43,877 — —
Net deferred tax asset (liability) . . . . . . . . (1,059,780) (2,036,733) (1,911,395) (1,185,118) (325,908)
(*) W23,586 million of differences resulting from the finalization of the prior year tax return are reflected in the beginning balance.
(**) Deferred tax liabilities from temporary differences related to equity method accounted investments are estimated considering thepossibility of realization and the amount of deferred tax liabilities.
F-67
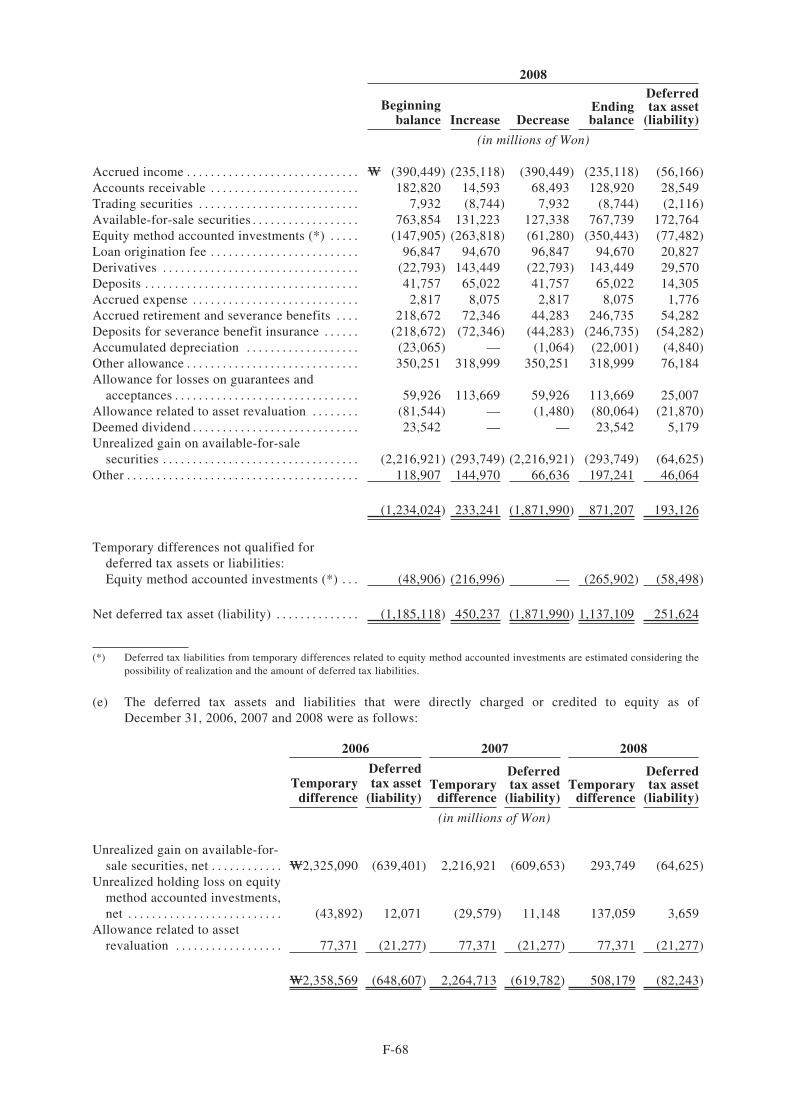
2008
Beginningbalance Increase Decrease
Endingbalance
Deferredtax asset
(liability)
(in millions of Won)
Accrued income . . . . . . . . . . . . . . . . . . . . . . . . . . . . . W (390,449) (235,118) (390,449) (235,118) (56,166)Accounts receivable . . . . . . . . . . . . . . . . . . . . . . . . . 182,820 14,593 68,493 128,920 28,549Trading securities . . . . . . . . . . . . . . . . . . . . . . . . . . . 7,932 (8,744) 7,932 (8,744) (2,116)Available-for-sale securities . . . . . . . . . . . . . . . . . . 763,854 131,223 127,338 767,739 172,764Equity method accounted investments (*) . . . . . (147,905) (263,818) (61,280) (350,443) (77,482)Loan origination fee . . . . . . . . . . . . . . . . . . . . . . . . . 96,847 94,670 96,847 94,670 20,827Derivatives . . . . . . . . . . . . . . . . . . . . . . . . . . . . . . . . . (22,793) 143,449 (22,793) 143,449 29,570Deposits . . . . . . . . . . . . . . . . . . . . . . . . . . . . . . . . . . . . 41,757 65,022 41,757 65,022 14,305Accrued expense . . . . . . . . . . . . . . . . . . . . . . . . . . . . 2,817 8,075 2,817 8,075 1,776Accrued retirement and severance benefits . . . . 218,672 72,346 44,283 246,735 54,282Deposits for severance benefit insurance . . . . . . (218,672) (72,346) (44,283) (246,735) (54,282)Accumulated depreciation . . . . . . . . . . . . . . . . . . . (23,065) — (1,064) (22,001) (4,840)Other allowance . . . . . . . . . . . . . . . . . . . . . . . . . . . . . 350,251 318,999 350,251 318,999 76,184Allowance for losses on guarantees and
acceptances . . . . . . . . . . . . . . . . . . . . . . . . . . . . . . . 59,926 113,669 59,926 113,669 25,007Allowance related to asset revaluation . . . . . . . . (81,544) — (1,480) (80,064) (21,870)Deemed dividend . . . . . . . . . . . . . . . . . . . . . . . . . . . . 23,542 — — 23,542 5,179Unrealized gain on available-for-sale
securities . . . . . . . . . . . . . . . . . . . . . . . . . . . . . . . . . (2,216,921) (293,749) (2,216,921) (293,749) (64,625)Other . . . . . . . . . . . . . . . . . . . . . . . . . . . . . . . . . . . . . . . 118,907 144,970 66,636 197,241 46,064
(1,234,024) 233,241 (1,871,990) 871,207 193,126
Temporary differences not qualified fordeferred tax assets or liabilities:Equity method accounted investments (*) . . . (48,906) (216,996) — (265,902) (58,498)
Net deferred tax asset (liability) . . . . . . . . . . . . . . (1,185,118) 450,237 (1,871,990) 1,137,109 251,624
(*) Deferred tax liabilities from temporary differences related to equity method accounted investments are estimated considering thepossibility of realization and the amount of deferred tax liabilities.
(e) The deferred tax assets and liabilities that were directly charged or credited to equity as ofDecember 31, 2006, 2007 and 2008 were as follows:
2006 2007 2008
Temporarydifference
Deferredtax asset
(liability)Temporary
difference
Deferredtax asset
(liability)Temporary
difference
Deferredtax asset
(liability)
(in millions of Won)
Unrealized gain on available-for-sale securities, net . . . . . . . . . . . . W2,325,090 (639,401) 2,216,921 (609,653) 293,749 (64,625)
Unrealized holding loss on equitymethod accounted investments,net . . . . . . . . . . . . . . . . . . . . . . . . . . (43,892) 12,071 (29,579) 11,148 137,059 3,659
Allowance related to assetrevaluation . . . . . . . . . . . . . . . . . . 77,371 (21,277) 77,371 (21,277) 77,371 (21,277)
W2,358,569 (648,607) 2,264,713 (619,782) 508,179 (82,243)
F-68
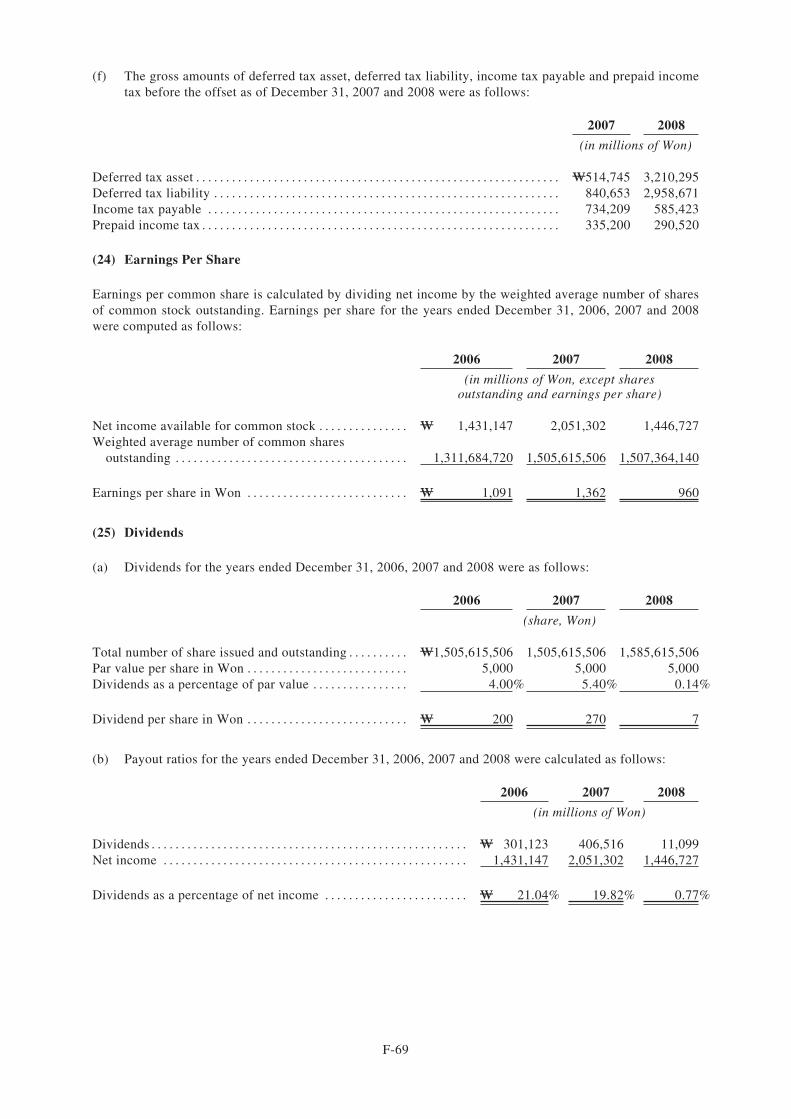
(f) The gross amounts of deferred tax asset, deferred tax liability, income tax payable and prepaid incometax before the offset as of December 31, 2007 and 2008 were as follows:
2007 2008
(in millions of Won)
Deferred tax asset . . . . . . . . . . . . . . . . . . . . . . . . . . . . . . . . . . . . . . . . . . . . . . . . . . . . . . . . . . . . . W514,745 3,210,295Deferred tax liability . . . . . . . . . . . . . . . . . . . . . . . . . . . . . . . . . . . . . . . . . . . . . . . . . . . . . . . . . . 840,653 2,958,671Income tax payable . . . . . . . . . . . . . . . . . . . . . . . . . . . . . . . . . . . . . . . . . . . . . . . . . . . . . . . . . . . 734,209 585,423Prepaid income tax . . . . . . . . . . . . . . . . . . . . . . . . . . . . . . . . . . . . . . . . . . . . . . . . . . . . . . . . . . . . 335,200 290,520
(24) Earnings Per Share
Earnings per common share is calculated by dividing net income by the weighted average number of sharesof common stock outstanding. Earnings per share for the years ended December 31, 2006, 2007 and 2008were computed as follows:
2006 2007 2008
(in millions of Won, except sharesoutstanding and earnings per share)
Net income available for common stock . . . . . . . . . . . . . . . W 1,431,147 2,051,302 1,446,727Weighted average number of common shares
outstanding . . . . . . . . . . . . . . . . . . . . . . . . . . . . . . . . . . . . . . . 1,311,684,720 1,505,615,506 1,507,364,140
Earnings per share in Won . . . . . . . . . . . . . . . . . . . . . . . . . . . W 1,091 1,362 960
(25) Dividends
(a) Dividends for the years ended December 31, 2006, 2007 and 2008 were as follows:
2006 2007 2008
(share, Won)
Total number of share issued and outstanding . . . . . . . . . . W1,505,615,506 1,505,615,506 1,585,615,506Par value per share in Won . . . . . . . . . . . . . . . . . . . . . . . . . . . 5,000 5,000 5,000Dividends as a percentage of par value . . . . . . . . . . . . . . . . 4.00% 5.40% 0.14%
Dividend per share in Won . . . . . . . . . . . . . . . . . . . . . . . . . . . W 200 270 7
(b) Payout ratios for the years ended December 31, 2006, 2007 and 2008 were calculated as follows:
2006 2007 2008
(in millions of Won)
Dividends . . . . . . . . . . . . . . . . . . . . . . . . . . . . . . . . . . . . . . . . . . . . . . . . . . . . . W 301,123 406,516 11,099Net income . . . . . . . . . . . . . . . . . . . . . . . . . . . . . . . . . . . . . . . . . . . . . . . . . . . 1,431,147 2,051,302 1,446,727
Dividends as a percentage of net income . . . . . . . . . . . . . . . . . . . . . . . . W 21.04% 19.82% 0.77%
F-69
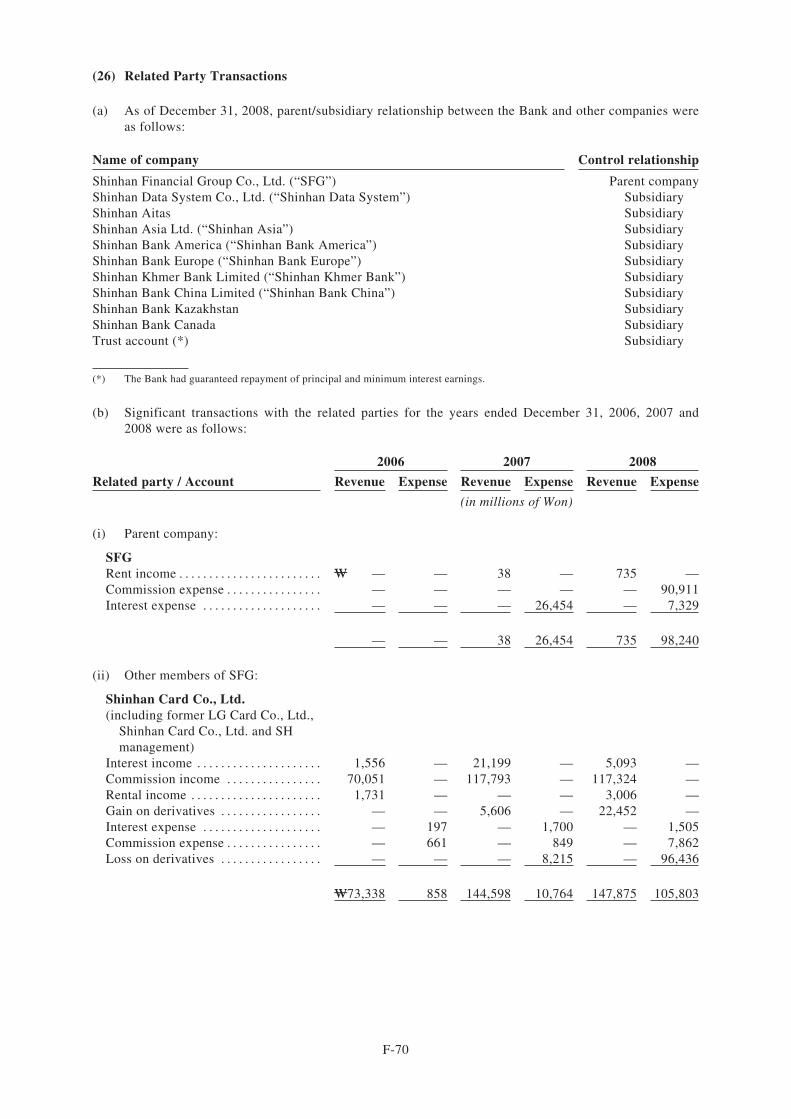
(26) Related Party Transactions
(a) As of December 31, 2008, parent/subsidiary relationship between the Bank and other companies wereas follows:
Name of company Control relationship
Shinhan Financial Group Co., Ltd. (“SFG”) Parent companyShinhan Data System Co., Ltd. (“Shinhan Data System”) SubsidiaryShinhan Aitas SubsidiaryShinhan Asia Ltd. (“Shinhan Asia”) SubsidiaryShinhan Bank America (“Shinhan Bank America”) SubsidiaryShinhan Bank Europe (“Shinhan Bank Europe”) SubsidiaryShinhan Khmer Bank Limited (“Shinhan Khmer Bank”) SubsidiaryShinhan Bank China Limited (“Shinhan Bank China”) SubsidiaryShinhan Bank Kazakhstan SubsidiaryShinhan Bank Canada SubsidiaryTrust account (*) Subsidiary
(*) The Bank had guaranteed repayment of principal and minimum interest earnings.
(b) Significant transactions with the related parties for the years ended December 31, 2006, 2007 and2008 were as follows:
2006 2007 2008
Related party / Account Revenue Expense Revenue Expense Revenue Expense
(in millions of Won)
(i) Parent company:
SFGRent income . . . . . . . . . . . . . . . . . . . . . . . . W — — 38 — 735 —Commission expense . . . . . . . . . . . . . . . . — — — — — 90,911Interest expense . . . . . . . . . . . . . . . . . . . . — — — 26,454 — 7,329
— — 38 26,454 735 98,240
(ii) Other members of SFG:
Shinhan Card Co., Ltd.(including former LG Card Co., Ltd.,
Shinhan Card Co., Ltd. and SHmanagement)
Interest income . . . . . . . . . . . . . . . . . . . . . 1,556 — 21,199 — 5,093 —Commission income . . . . . . . . . . . . . . . . 70,051 — 117,793 — 117,324 —Rental income . . . . . . . . . . . . . . . . . . . . . . 1,731 — — — 3,006 —Gain on derivatives . . . . . . . . . . . . . . . . . — — 5,606 — 22,452 —Interest expense . . . . . . . . . . . . . . . . . . . . — 197 — 1,700 — 1,505Commission expense . . . . . . . . . . . . . . . . — 661 — 849 — 7,862Loss on derivatives . . . . . . . . . . . . . . . . . — — — 8,215 — 96,436
W73,338 858 144,598 10,764 147,875 105,803
F-70
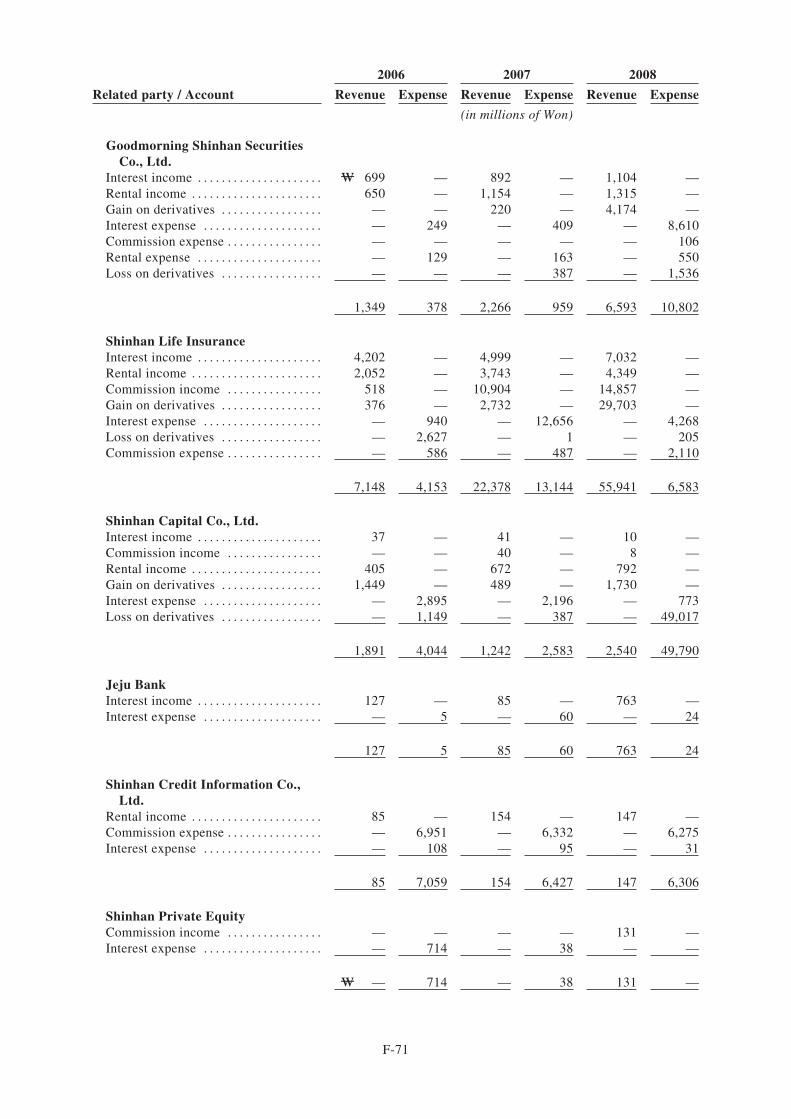
2006 2007 2008
Related party / Account Revenue Expense Revenue Expense Revenue Expense
(in millions of Won)
Goodmorning Shinhan SecuritiesCo., Ltd.
Interest income . . . . . . . . . . . . . . . . . . . . . W 699 — 892 — 1,104 —Rental income . . . . . . . . . . . . . . . . . . . . . . 650 — 1,154 — 1,315 —Gain on derivatives . . . . . . . . . . . . . . . . . — — 220 — 4,174 —Interest expense . . . . . . . . . . . . . . . . . . . . — 249 — 409 — 8,610Commission expense . . . . . . . . . . . . . . . . — — — — — 106Rental expense . . . . . . . . . . . . . . . . . . . . . — 129 — 163 — 550Loss on derivatives . . . . . . . . . . . . . . . . . — — — 387 — 1,536
1,349 378 2,266 959 6,593 10,802
Shinhan Life InsuranceInterest income . . . . . . . . . . . . . . . . . . . . . 4,202 — 4,999 — 7,032 —Rental income . . . . . . . . . . . . . . . . . . . . . . 2,052 — 3,743 — 4,349 —Commission income . . . . . . . . . . . . . . . . 518 — 10,904 — 14,857 —Gain on derivatives . . . . . . . . . . . . . . . . . 376 — 2,732 — 29,703 —Interest expense . . . . . . . . . . . . . . . . . . . . — 940 — 12,656 — 4,268Loss on derivatives . . . . . . . . . . . . . . . . . — 2,627 — 1 — 205Commission expense . . . . . . . . . . . . . . . . — 586 — 487 — 2,110
7,148 4,153 22,378 13,144 55,941 6,583
Shinhan Capital Co., Ltd.Interest income . . . . . . . . . . . . . . . . . . . . . 37 — 41 — 10 —Commission income . . . . . . . . . . . . . . . . — — 40 — 8 —Rental income . . . . . . . . . . . . . . . . . . . . . . 405 — 672 — 792 —Gain on derivatives . . . . . . . . . . . . . . . . . 1,449 — 489 — 1,730 —Interest expense . . . . . . . . . . . . . . . . . . . . — 2,895 — 2,196 — 773Loss on derivatives . . . . . . . . . . . . . . . . . — 1,149 — 387 — 49,017
1,891 4,044 1,242 2,583 2,540 49,790
Jeju BankInterest income . . . . . . . . . . . . . . . . . . . . . 127 — 85 — 763 —Interest expense . . . . . . . . . . . . . . . . . . . . — 5 — 60 — 24
127 5 85 60 763 24
Shinhan Credit Information Co.,Ltd.
Rental income . . . . . . . . . . . . . . . . . . . . . . 85 — 154 — 147 —Commission expense . . . . . . . . . . . . . . . . — 6,951 — 6,332 — 6,275Interest expense . . . . . . . . . . . . . . . . . . . . — 108 — 95 — 31
85 7,059 154 6,427 147 6,306
Shinhan Private EquityCommission income . . . . . . . . . . . . . . . . — — — — 131 —Interest expense . . . . . . . . . . . . . . . . . . . . — 714 — 38 — —
W — 714 — 38 131 —
F-71
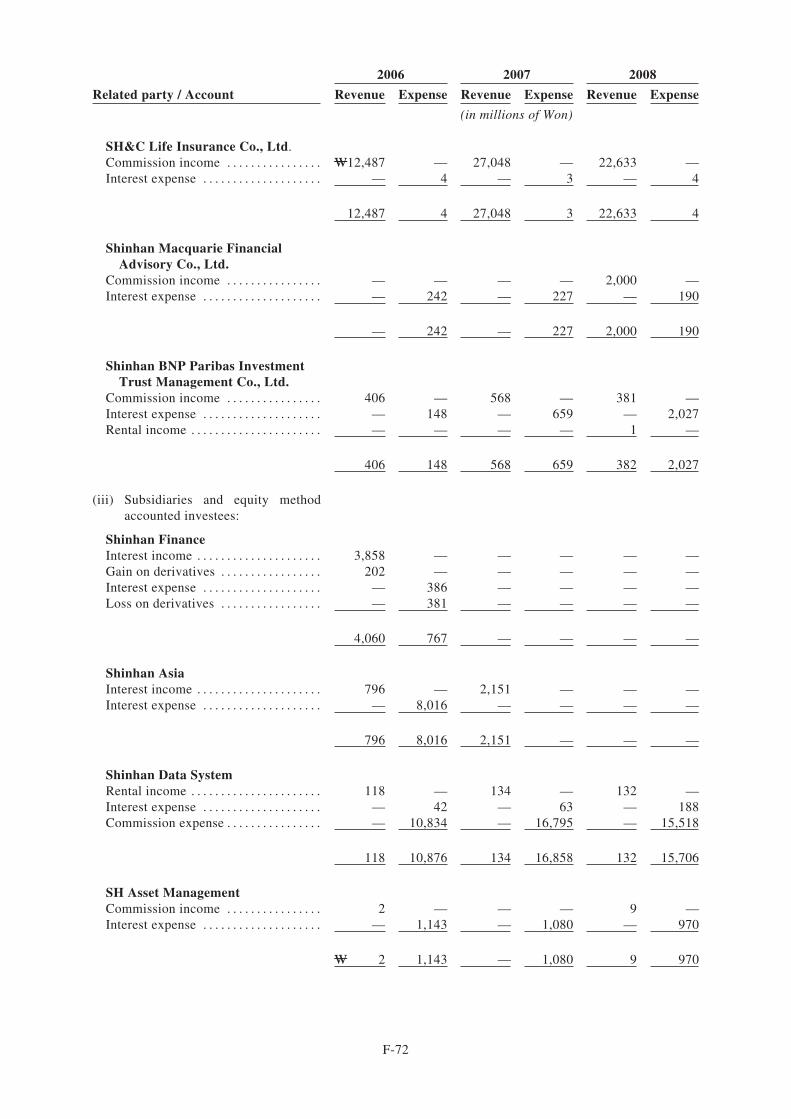
2006 2007 2008
Related party / Account Revenue Expense Revenue Expense Revenue Expense
(in millions of Won)
SH&C Life Insurance Co., Ltd.Commission income . . . . . . . . . . . . . . . . W12,487 — 27,048 — 22,633 —Interest expense . . . . . . . . . . . . . . . . . . . . — 4 — 3 — 4
12,487 4 27,048 3 22,633 4
Shinhan Macquarie FinancialAdvisory Co., Ltd.
Commission income . . . . . . . . . . . . . . . . — — — — 2,000 —Interest expense . . . . . . . . . . . . . . . . . . . . — 242 — 227 — 190
— 242 — 227 2,000 190
Shinhan BNP Paribas InvestmentTrust Management Co., Ltd.
Commission income . . . . . . . . . . . . . . . . 406 — 568 — 381 —Interest expense . . . . . . . . . . . . . . . . . . . . — 148 — 659 — 2,027Rental income . . . . . . . . . . . . . . . . . . . . . . — — — — 1 —
406 148 568 659 382 2,027
(iii) Subsidiaries and equity methodaccounted investees:
Shinhan FinanceInterest income . . . . . . . . . . . . . . . . . . . . . 3,858 — — — — —Gain on derivatives . . . . . . . . . . . . . . . . . 202 — — — — —Interest expense . . . . . . . . . . . . . . . . . . . . — 386 — — — —Loss on derivatives . . . . . . . . . . . . . . . . . — 381 — — — —
4,060 767 — — — —
Shinhan AsiaInterest income . . . . . . . . . . . . . . . . . . . . . 796 — 2,151 — — —Interest expense . . . . . . . . . . . . . . . . . . . . — 8,016 — — — —
796 8,016 2,151 — — —
Shinhan Data SystemRental income . . . . . . . . . . . . . . . . . . . . . . 118 — 134 — 132 —Interest expense . . . . . . . . . . . . . . . . . . . . — 42 — 63 — 188Commission expense . . . . . . . . . . . . . . . . — 10,834 — 16,795 — 15,518
118 10,876 134 16,858 132 15,706
SH Asset ManagementCommission income . . . . . . . . . . . . . . . . 2 — — — 9 —Interest expense . . . . . . . . . . . . . . . . . . . . — 1,143 — 1,080 — 970
W 2 1,143 — 1,080 9 970
F-72
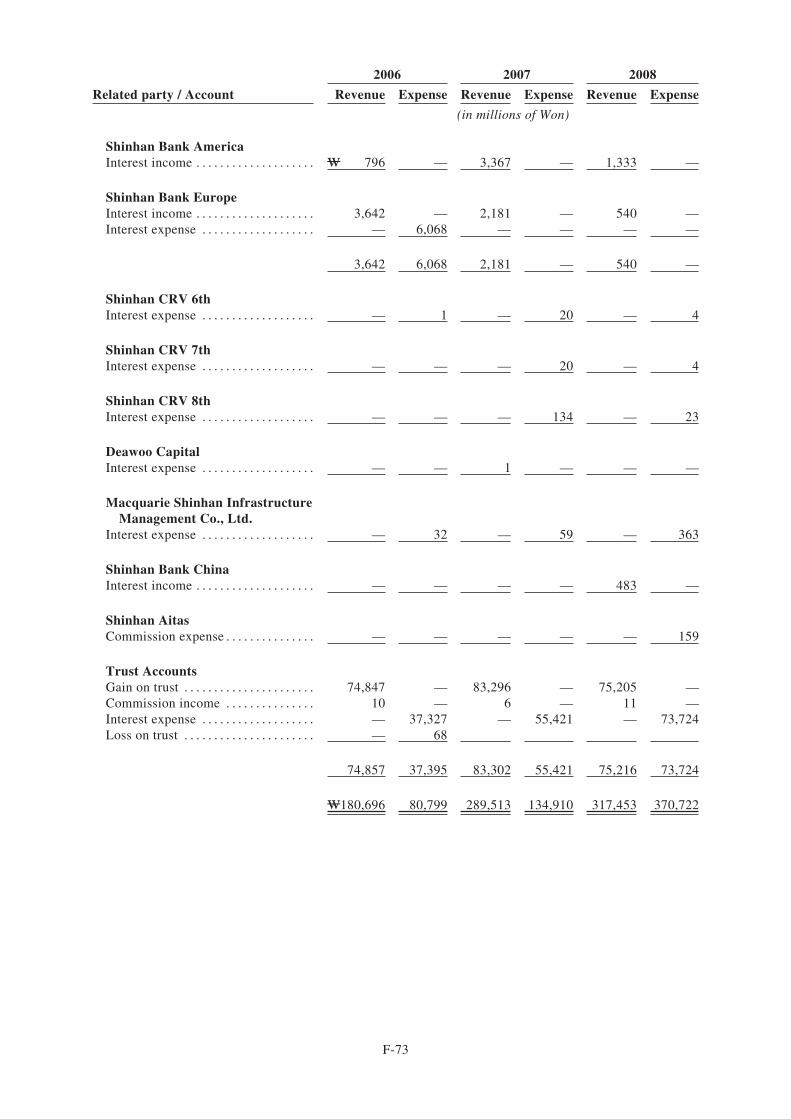
2006 2007 2008
Related party / Account Revenue Expense Revenue Expense Revenue Expense
(in millions of Won)
Shinhan Bank AmericaInterest income . . . . . . . . . . . . . . . . . . . . W 796 — 3,367 — 1,333 —
Shinhan Bank EuropeInterest income . . . . . . . . . . . . . . . . . . . . 3,642 — 2,181 — 540 —Interest expense . . . . . . . . . . . . . . . . . . . — 6,068 — — — —
3,642 6,068 2,181 — 540 —
Shinhan CRV 6thInterest expense . . . . . . . . . . . . . . . . . . . — 1 — 20 — 4
Shinhan CRV 7thInterest expense . . . . . . . . . . . . . . . . . . . — — — 20 — 4
Shinhan CRV 8thInterest expense . . . . . . . . . . . . . . . . . . . — — — 134 — 23
Deawoo CapitalInterest expense . . . . . . . . . . . . . . . . . . . — — 1 — — —
Macquarie Shinhan InfrastructureManagement Co., Ltd.
Interest expense . . . . . . . . . . . . . . . . . . . — 32 — 59 — 363
Shinhan Bank ChinaInterest income . . . . . . . . . . . . . . . . . . . . — — — — 483 —
Shinhan AitasCommission expense . . . . . . . . . . . . . . . — — — — — 159
Trust AccountsGain on trust . . . . . . . . . . . . . . . . . . . . . . 74,847 — 83,296 — 75,205 —Commission income . . . . . . . . . . . . . . . 10 — 6 — 11 —Interest expense . . . . . . . . . . . . . . . . . . . — 37,327 — 55,421 — 73,724Loss on trust . . . . . . . . . . . . . . . . . . . . . . — 68
74,857 37,395 83,302 55,421 75,216 73,724
W180,696 80,799 289,513 134,910 317,453 370,722
F-73
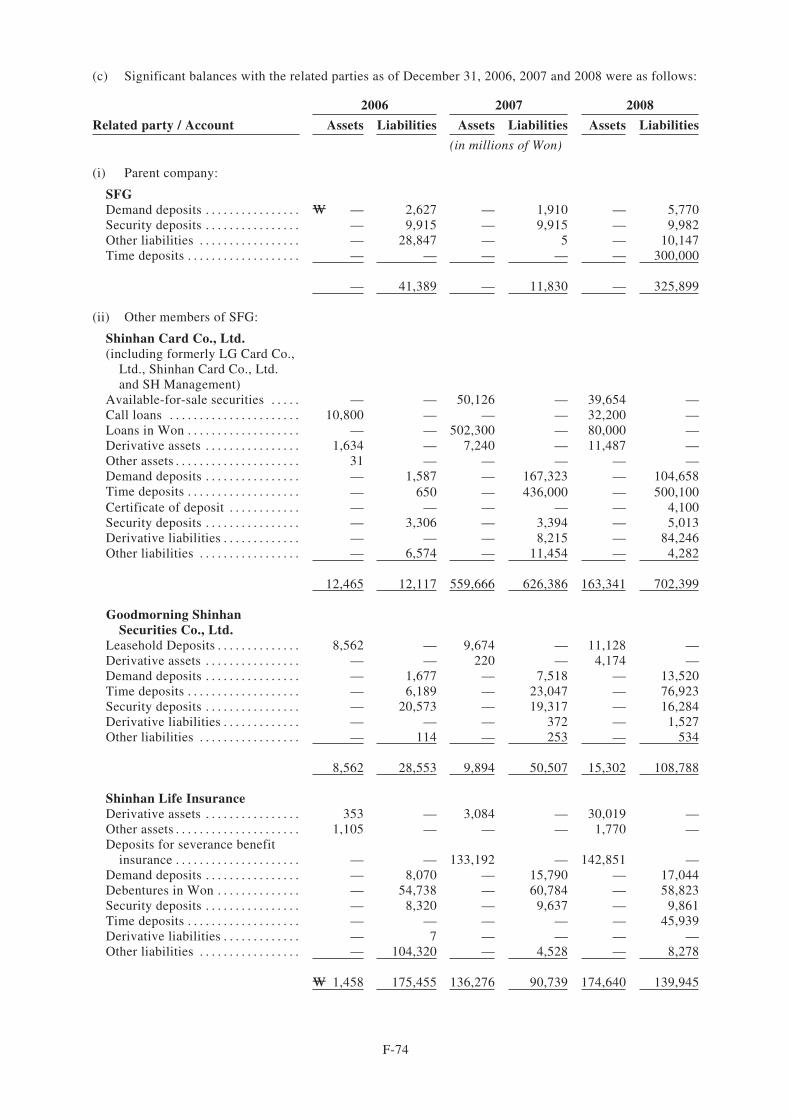
(c) Significant balances with the related parties as of December 31, 2006, 2007 and 2008 were as follows:
2006 2007 2008
Related party / Account Assets Liabilities Assets Liabilities Assets Liabilities
(in millions of Won)
(i) Parent company:
SFGDemand deposits . . . . . . . . . . . . . . . . W — 2,627 — 1,910 — 5,770Security deposits . . . . . . . . . . . . . . . . — 9,915 — 9,915 — 9,982Other liabilities . . . . . . . . . . . . . . . . . — 28,847 — 5 — 10,147Time deposits . . . . . . . . . . . . . . . . . . . — — — — — 300,000
— 41,389 — 11,830 — 325,899
(ii) Other members of SFG:
Shinhan Card Co., Ltd.(including formerly LG Card Co.,
Ltd., Shinhan Card Co., Ltd.and SH Management)
Available-for-sale securities . . . . . — — 50,126 — 39,654 —Call loans . . . . . . . . . . . . . . . . . . . . . . 10,800 — — — 32,200 —Loans in Won . . . . . . . . . . . . . . . . . . . — — 502,300 — 80,000 —Derivative assets . . . . . . . . . . . . . . . . 1,634 — 7,240 — 11,487 —Other assets . . . . . . . . . . . . . . . . . . . . . 31 — — — — —Demand deposits . . . . . . . . . . . . . . . . — 1,587 — 167,323 — 104,658Time deposits . . . . . . . . . . . . . . . . . . . — 650 — 436,000 — 500,100Certificate of deposit . . . . . . . . . . . . — — — — — 4,100Security deposits . . . . . . . . . . . . . . . . — 3,306 — 3,394 — 5,013Derivative liabilities . . . . . . . . . . . . . — — — 8,215 — 84,246Other liabilities . . . . . . . . . . . . . . . . . — 6,574 — 11,454 — 4,282
12,465 12,117 559,666 626,386 163,341 702,399
Goodmorning ShinhanSecurities Co., Ltd.
Leasehold Deposits . . . . . . . . . . . . . . 8,562 — 9,674 — 11,128 —Derivative assets . . . . . . . . . . . . . . . . — — 220 — 4,174 —Demand deposits . . . . . . . . . . . . . . . . — 1,677 — 7,518 — 13,520Time deposits . . . . . . . . . . . . . . . . . . . — 6,189 — 23,047 — 76,923Security deposits . . . . . . . . . . . . . . . . — 20,573 — 19,317 — 16,284Derivative liabilities . . . . . . . . . . . . . — — — 372 — 1,527Other liabilities . . . . . . . . . . . . . . . . . — 114 — 253 — 534
8,562 28,553 9,894 50,507 15,302 108,788
Shinhan Life InsuranceDerivative assets . . . . . . . . . . . . . . . . 353 — 3,084 — 30,019 —Other assets . . . . . . . . . . . . . . . . . . . . . 1,105 — — — 1,770 —Deposits for severance benefit
insurance . . . . . . . . . . . . . . . . . . . . . — — 133,192 — 142,851 —Demand deposits . . . . . . . . . . . . . . . . — 8,070 — 15,790 — 17,044Debentures in Won . . . . . . . . . . . . . . — 54,738 — 60,784 — 58,823Security deposits . . . . . . . . . . . . . . . . — 8,320 — 9,637 — 9,861Time deposits . . . . . . . . . . . . . . . . . . . — — — — — 45,939Derivative liabilities . . . . . . . . . . . . . — 7 — — — —Other liabilities . . . . . . . . . . . . . . . . . — 104,320 — 4,528 — 8,278
W 1,458 175,455 136,276 90,739 174,640 139,945
F-74
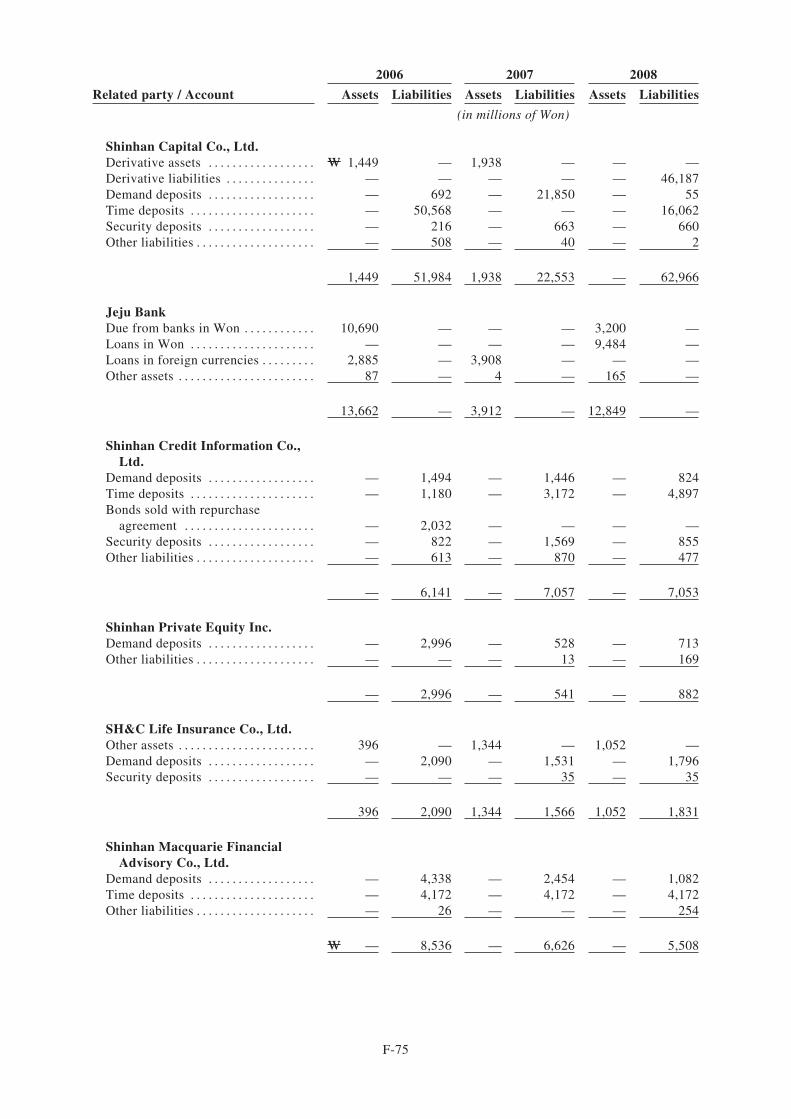
2006 2007 2008
Related party / Account Assets Liabilities Assets Liabilities Assets Liabilities
(in millions of Won)
Shinhan Capital Co., Ltd.Derivative assets . . . . . . . . . . . . . . . . . . W 1,449 — 1,938 — — —Derivative liabilities . . . . . . . . . . . . . . . — — — — — 46,187Demand deposits . . . . . . . . . . . . . . . . . . — 692 — 21,850 — 55Time deposits . . . . . . . . . . . . . . . . . . . . . — 50,568 — — — 16,062Security deposits . . . . . . . . . . . . . . . . . . — 216 — 663 — 660Other liabilities . . . . . . . . . . . . . . . . . . . . — 508 — 40 — 2
1,449 51,984 1,938 22,553 — 62,966
Jeju BankDue from banks in Won . . . . . . . . . . . . 10,690 — — — 3,200 —Loans in Won . . . . . . . . . . . . . . . . . . . . . — — — — 9,484 —Loans in foreign currencies . . . . . . . . . 2,885 — 3,908 — — —Other assets . . . . . . . . . . . . . . . . . . . . . . . 87 — 4 — 165 —
13,662 — 3,912 — 12,849 —
Shinhan Credit Information Co.,Ltd.
Demand deposits . . . . . . . . . . . . . . . . . . — 1,494 — 1,446 — 824Time deposits . . . . . . . . . . . . . . . . . . . . . — 1,180 — 3,172 — 4,897Bonds sold with repurchase
agreement . . . . . . . . . . . . . . . . . . . . . . — 2,032 — — — —Security deposits . . . . . . . . . . . . . . . . . . — 822 — 1,569 — 855Other liabilities . . . . . . . . . . . . . . . . . . . . — 613 — 870 — 477
— 6,141 — 7,057 — 7,053
Shinhan Private Equity Inc.Demand deposits . . . . . . . . . . . . . . . . . . — 2,996 — 528 — 713Other liabilities . . . . . . . . . . . . . . . . . . . . — — — 13 — 169
— 2,996 — 541 — 882
SH&C Life Insurance Co., Ltd.Other assets . . . . . . . . . . . . . . . . . . . . . . . 396 — 1,344 — 1,052 —Demand deposits . . . . . . . . . . . . . . . . . . — 2,090 — 1,531 — 1,796Security deposits . . . . . . . . . . . . . . . . . . — — — 35 — 35
396 2,090 1,344 1,566 1,052 1,831
Shinhan Macquarie FinancialAdvisory Co., Ltd.
Demand deposits . . . . . . . . . . . . . . . . . . — 4,338 — 2,454 — 1,082Time deposits . . . . . . . . . . . . . . . . . . . . . — 4,172 — 4,172 — 4,172Other liabilities . . . . . . . . . . . . . . . . . . . . — 26 — — — 254
W — 8,536 — 6,626 — 5,508
F-75
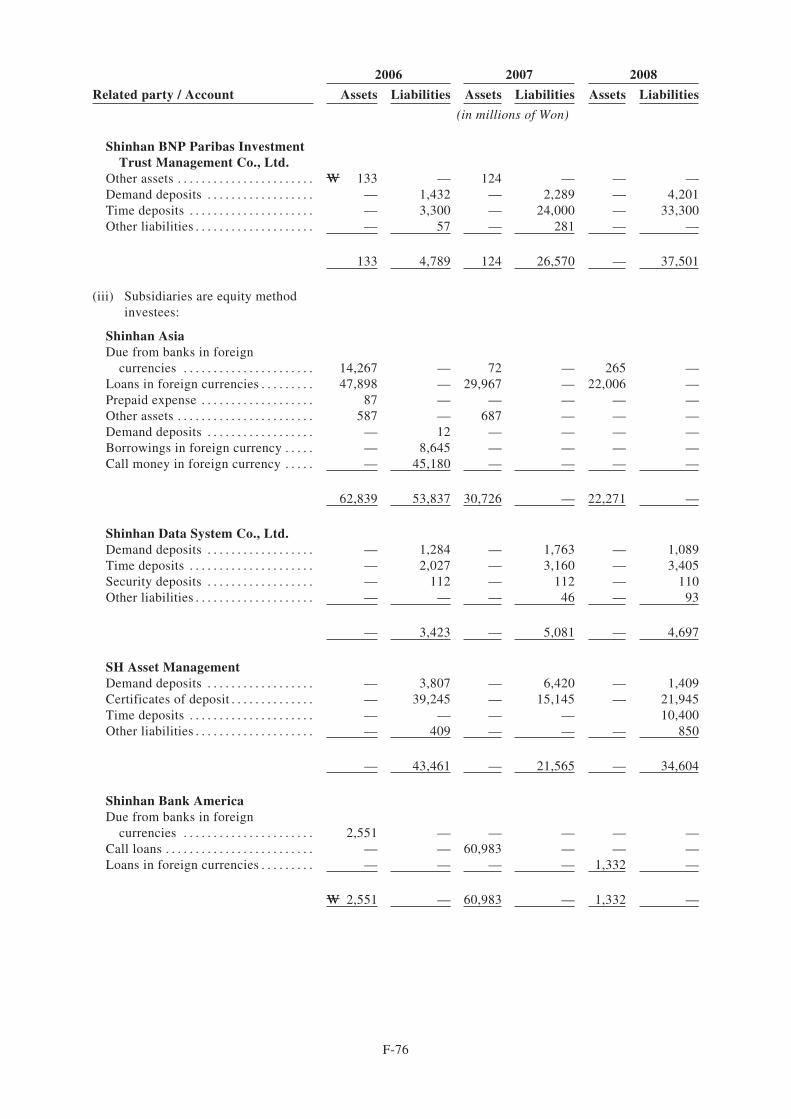
2006 2007 2008
Related party / Account Assets Liabilities Assets Liabilities Assets Liabilities
(in millions of Won)
Shinhan BNP Paribas InvestmentTrust Management Co., Ltd.
Other assets . . . . . . . . . . . . . . . . . . . . . . . W 133 — 124 — — —Demand deposits . . . . . . . . . . . . . . . . . . — 1,432 — 2,289 — 4,201Time deposits . . . . . . . . . . . . . . . . . . . . . — 3,300 — 24,000 — 33,300Other liabilities . . . . . . . . . . . . . . . . . . . . — 57 — 281 — —
133 4,789 124 26,570 — 37,501
(iii) Subsidiaries are equity methodinvestees:
Shinhan AsiaDue from banks in foreign
currencies . . . . . . . . . . . . . . . . . . . . . . 14,267 — 72 — 265 —Loans in foreign currencies . . . . . . . . . 47,898 — 29,967 — 22,006 —Prepaid expense . . . . . . . . . . . . . . . . . . . 87 — — — — —Other assets . . . . . . . . . . . . . . . . . . . . . . . 587 — 687 — — —Demand deposits . . . . . . . . . . . . . . . . . . — 12 — — — —Borrowings in foreign currency . . . . . — 8,645 — — — —Call money in foreign currency . . . . . — 45,180 — — — —
62,839 53,837 30,726 — 22,271 —
Shinhan Data System Co., Ltd.Demand deposits . . . . . . . . . . . . . . . . . . — 1,284 — 1,763 — 1,089Time deposits . . . . . . . . . . . . . . . . . . . . . — 2,027 — 3,160 — 3,405Security deposits . . . . . . . . . . . . . . . . . . — 112 — 112 — 110Other liabilities . . . . . . . . . . . . . . . . . . . . — — — 46 — 93
— 3,423 — 5,081 — 4,697
SH Asset ManagementDemand deposits . . . . . . . . . . . . . . . . . . — 3,807 — 6,420 — 1,409Certificates of deposit . . . . . . . . . . . . . . — 39,245 — 15,145 — 21,945Time deposits . . . . . . . . . . . . . . . . . . . . . — — — — 10,400Other liabilities . . . . . . . . . . . . . . . . . . . . — 409 — — — 850
— 43,461 — 21,565 — 34,604
Shinhan Bank AmericaDue from banks in foreign
currencies . . . . . . . . . . . . . . . . . . . . . . 2,551 — — — — —Call loans . . . . . . . . . . . . . . . . . . . . . . . . . — — 60,983 — — —Loans in foreign currencies . . . . . . . . . — — — — 1,332 —
W 2,551 — 60,983 — 1,332 —
F-76
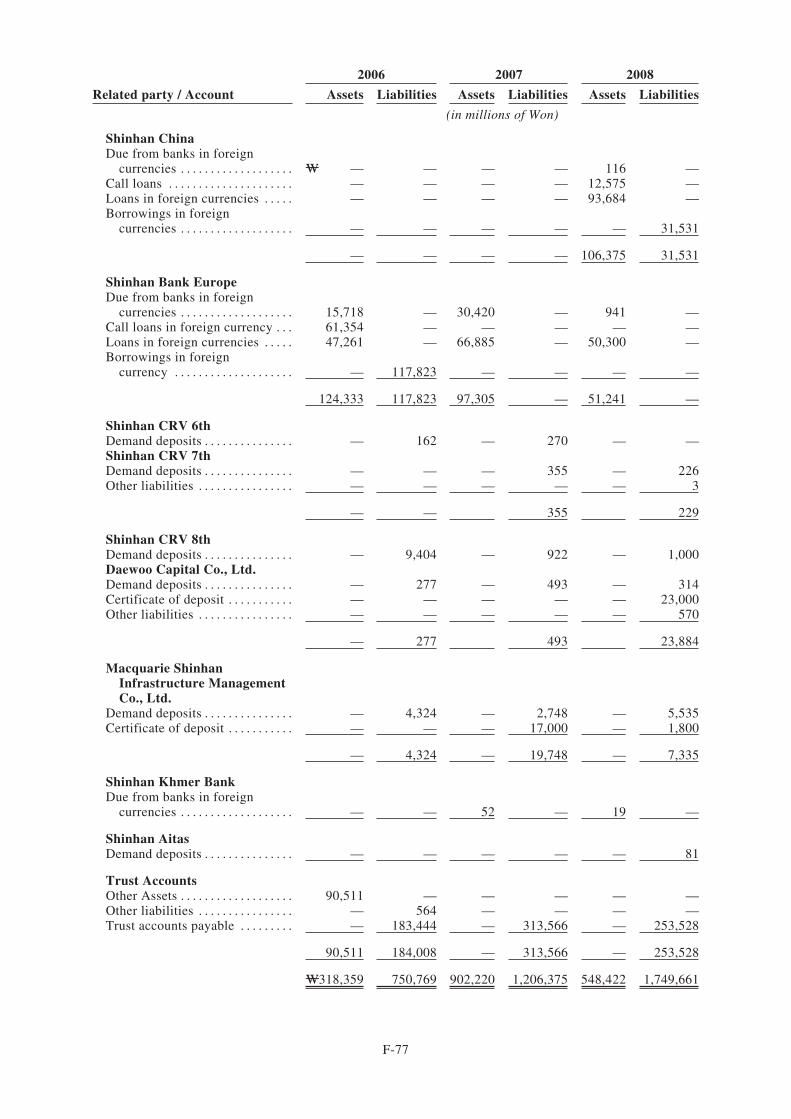
2006 2007 2008
Related party / Account Assets Liabilities Assets Liabilities Assets Liabilities
(in millions of Won)
Shinhan ChinaDue from banks in foreign
currencies . . . . . . . . . . . . . . . . . . . W — — — — 116 —Call loans . . . . . . . . . . . . . . . . . . . . . — — — — 12,575 —Loans in foreign currencies . . . . . — — — — 93,684 —Borrowings in foreign
currencies . . . . . . . . . . . . . . . . . . . — — — — — 31,531
— — — — 106,375 31,531
Shinhan Bank EuropeDue from banks in foreign
currencies . . . . . . . . . . . . . . . . . . . 15,718 — 30,420 — 941 —Call loans in foreign currency . . . 61,354 — — — — —Loans in foreign currencies . . . . . 47,261 — 66,885 — 50,300 —Borrowings in foreign
currency . . . . . . . . . . . . . . . . . . . . — 117,823 — — — —
124,333 117,823 97,305 — 51,241 —
Shinhan CRV 6thDemand deposits . . . . . . . . . . . . . . . — 162 — 270 — —Shinhan CRV 7thDemand deposits . . . . . . . . . . . . . . . — — — 355 — 226Other liabilities . . . . . . . . . . . . . . . . — — — — — 3
— — 355 229
Shinhan CRV 8thDemand deposits . . . . . . . . . . . . . . . — 9,404 — 922 — 1,000Daewoo Capital Co., Ltd.Demand deposits . . . . . . . . . . . . . . . — 277 — 493 — 314Certificate of deposit . . . . . . . . . . . — — — — — 23,000Other liabilities . . . . . . . . . . . . . . . . — — — — — 570
— 277 493 23,884
Macquarie ShinhanInfrastructure ManagementCo., Ltd.
Demand deposits . . . . . . . . . . . . . . . — 4,324 — 2,748 — 5,535Certificate of deposit . . . . . . . . . . . — — — 17,000 — 1,800
— 4,324 — 19,748 — 7,335
Shinhan Khmer BankDue from banks in foreign
currencies . . . . . . . . . . . . . . . . . . . — — 52 — 19 —
Shinhan AitasDemand deposits . . . . . . . . . . . . . . . — — — — — 81
Trust AccountsOther Assets . . . . . . . . . . . . . . . . . . . 90,511 — — — — —Other liabilities . . . . . . . . . . . . . . . . — 564 — — — —Trust accounts payable . . . . . . . . . — 183,444 — 313,566 — 253,528
90,511 184,008 — 313,566 — 253,528
W318,359 750,769 902,220 1,206,375 548,422 1,749,661
F-77
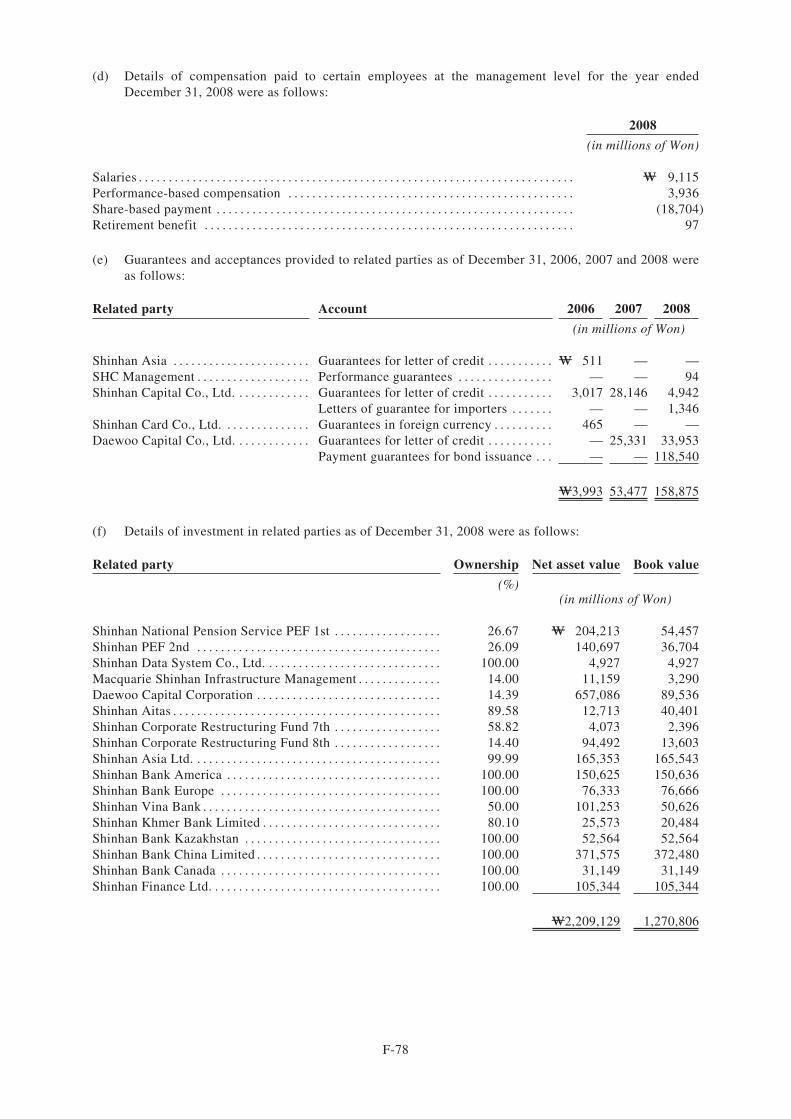
(d) Details of compensation paid to certain employees at the management level for the year endedDecember 31, 2008 were as follows:
2008
(in millions of Won)
Salaries . . . . . . . . . . . . . . . . . . . . . . . . . . . . . . . . . . . . . . . . . . . . . . . . . . . . . . . . . . . . . . . . . . . . . . . . . W 9,115Performance-based compensation . . . . . . . . . . . . . . . . . . . . . . . . . . . . . . . . . . . . . . . . . . . . . . . . 3,936Share-based payment . . . . . . . . . . . . . . . . . . . . . . . . . . . . . . . . . . . . . . . . . . . . . . . . . . . . . . . . . . . . (18,704)Retirement benefit . . . . . . . . . . . . . . . . . . . . . . . . . . . . . . . . . . . . . . . . . . . . . . . . . . . . . . . . . . . . . . 97
(e) Guarantees and acceptances provided to related parties as of December 31, 2006, 2007 and 2008 wereas follows:
Related party Account 2006 2007 2008
(in millions of Won)
Shinhan Asia . . . . . . . . . . . . . . . . . . . . . . . Guarantees for letter of credit . . . . . . . . . . . W 511 — —SHC Management . . . . . . . . . . . . . . . . . . . Performance guarantees . . . . . . . . . . . . . . . . — — 94Shinhan Capital Co., Ltd. . . . . . . . . . . . . Guarantees for letter of credit . . . . . . . . . . . 3,017 28,146 4,942
Letters of guarantee for importers . . . . . . . — — 1,346Shinhan Card Co., Ltd. . . . . . . . . . . . . . . Guarantees in foreign currency . . . . . . . . . . 465 — —Daewoo Capital Co., Ltd. . . . . . . . . . . . . Guarantees for letter of credit . . . . . . . . . . . — 25,331 33,953
Payment guarantees for bond issuance . . . — — 118,540
W3,993 53,477 158,875
(f) Details of investment in related parties as of December 31, 2008 were as follows:
Related party Ownership Net asset value Book value
(%)(in millions of Won)
Shinhan National Pension Service PEF 1st . . . . . . . . . . . . . . . . . . 26.67 W 204,213 54,457Shinhan PEF 2nd . . . . . . . . . . . . . . . . . . . . . . . . . . . . . . . . . . . . . . . . . 26.09 140,697 36,704Shinhan Data System Co., Ltd. . . . . . . . . . . . . . . . . . . . . . . . . . . . . . 100.00 4,927 4,927Macquarie Shinhan Infrastructure Management . . . . . . . . . . . . . . 14.00 11,159 3,290Daewoo Capital Corporation . . . . . . . . . . . . . . . . . . . . . . . . . . . . . . . 14.39 657,086 89,536Shinhan Aitas . . . . . . . . . . . . . . . . . . . . . . . . . . . . . . . . . . . . . . . . . . . . . 89.58 12,713 40,401Shinhan Corporate Restructuring Fund 7th . . . . . . . . . . . . . . . . . . 58.82 4,073 2,396Shinhan Corporate Restructuring Fund 8th . . . . . . . . . . . . . . . . . . 14.40 94,492 13,603Shinhan Asia Ltd. . . . . . . . . . . . . . . . . . . . . . . . . . . . . . . . . . . . . . . . . . 99.99 165,353 165,543Shinhan Bank America . . . . . . . . . . . . . . . . . . . . . . . . . . . . . . . . . . . . 100.00 150,625 150,636Shinhan Bank Europe . . . . . . . . . . . . . . . . . . . . . . . . . . . . . . . . . . . . . 100.00 76,333 76,666Shinhan Vina Bank . . . . . . . . . . . . . . . . . . . . . . . . . . . . . . . . . . . . . . . . 50.00 101,253 50,626Shinhan Khmer Bank Limited . . . . . . . . . . . . . . . . . . . . . . . . . . . . . . 80.10 25,573 20,484Shinhan Bank Kazakhstan . . . . . . . . . . . . . . . . . . . . . . . . . . . . . . . . . 100.00 52,564 52,564Shinhan Bank China Limited . . . . . . . . . . . . . . . . . . . . . . . . . . . . . . . 100.00 371,575 372,480Shinhan Bank Canada . . . . . . . . . . . . . . . . . . . . . . . . . . . . . . . . . . . . . 100.00 31,149 31,149Shinhan Finance Ltd. . . . . . . . . . . . . . . . . . . . . . . . . . . . . . . . . . . . . . . 100.00 105,344 105,344
W2,209,129 1,270,806
F-78
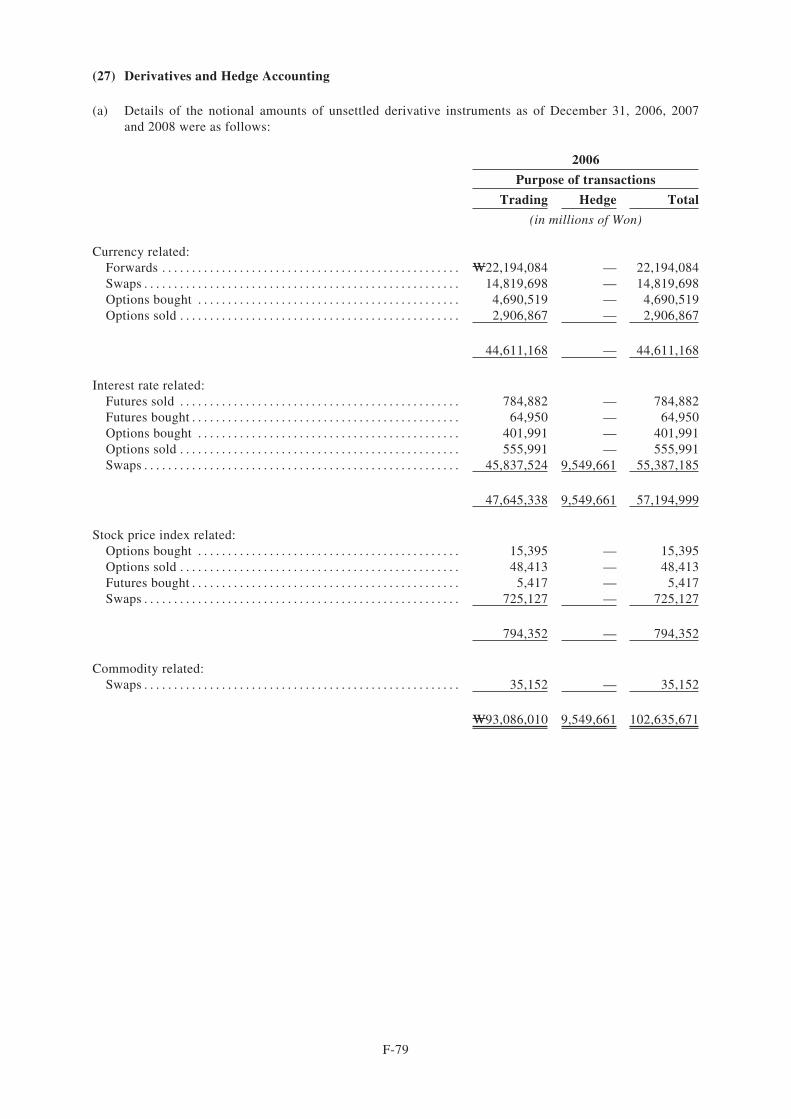
(27) Derivatives and Hedge Accounting
(a) Details of the notional amounts of unsettled derivative instruments as of December 31, 2006, 2007and 2008 were as follows:
2006
Purpose of transactions
Trading Hedge Total
(in millions of Won)
Currency related:Forwards . . . . . . . . . . . . . . . . . . . . . . . . . . . . . . . . . . . . . . . . . . . . . . . . . . W22,194,084 — 22,194,084Swaps . . . . . . . . . . . . . . . . . . . . . . . . . . . . . . . . . . . . . . . . . . . . . . . . . . . . . 14,819,698 — 14,819,698Options bought . . . . . . . . . . . . . . . . . . . . . . . . . . . . . . . . . . . . . . . . . . . . 4,690,519 — 4,690,519Options sold . . . . . . . . . . . . . . . . . . . . . . . . . . . . . . . . . . . . . . . . . . . . . . . 2,906,867 — 2,906,867
44,611,168 — 44,611,168
Interest rate related:Futures sold . . . . . . . . . . . . . . . . . . . . . . . . . . . . . . . . . . . . . . . . . . . . . . . 784,882 — 784,882Futures bought . . . . . . . . . . . . . . . . . . . . . . . . . . . . . . . . . . . . . . . . . . . . . 64,950 — 64,950Options bought . . . . . . . . . . . . . . . . . . . . . . . . . . . . . . . . . . . . . . . . . . . . 401,991 — 401,991Options sold . . . . . . . . . . . . . . . . . . . . . . . . . . . . . . . . . . . . . . . . . . . . . . . 555,991 — 555,991Swaps . . . . . . . . . . . . . . . . . . . . . . . . . . . . . . . . . . . . . . . . . . . . . . . . . . . . . 45,837,524 9,549,661 55,387,185
47,645,338 9,549,661 57,194,999
Stock price index related:Options bought . . . . . . . . . . . . . . . . . . . . . . . . . . . . . . . . . . . . . . . . . . . . 15,395 — 15,395Options sold . . . . . . . . . . . . . . . . . . . . . . . . . . . . . . . . . . . . . . . . . . . . . . . 48,413 — 48,413Futures bought . . . . . . . . . . . . . . . . . . . . . . . . . . . . . . . . . . . . . . . . . . . . . 5,417 — 5,417Swaps . . . . . . . . . . . . . . . . . . . . . . . . . . . . . . . . . . . . . . . . . . . . . . . . . . . . . 725,127 — 725,127
794,352 — 794,352
Commodity related:Swaps . . . . . . . . . . . . . . . . . . . . . . . . . . . . . . . . . . . . . . . . . . . . . . . . . . . . . 35,152 — 35,152
W93,086,010 9,549,661 102,635,671
F-79
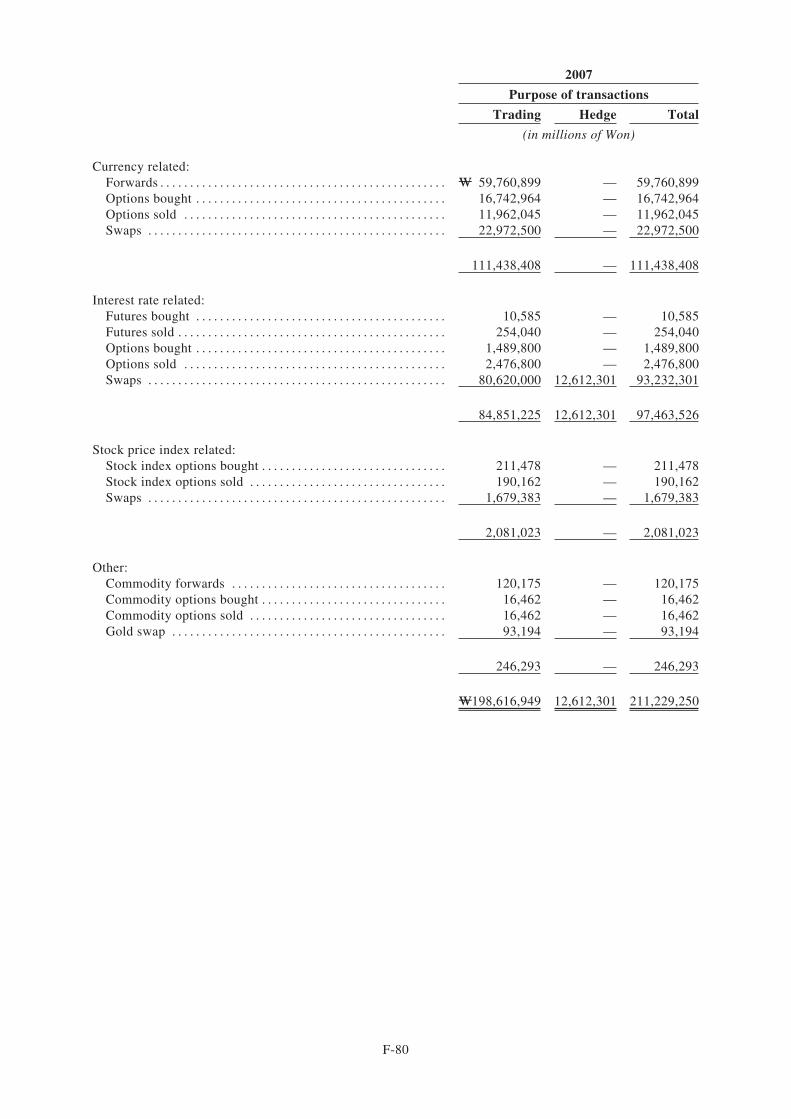
2007
Purpose of transactions
Trading Hedge Total
(in millions of Won)
Currency related:Forwards . . . . . . . . . . . . . . . . . . . . . . . . . . . . . . . . . . . . . . . . . . . . . . . . W 59,760,899 — 59,760,899Options bought . . . . . . . . . . . . . . . . . . . . . . . . . . . . . . . . . . . . . . . . . . 16,742,964 — 16,742,964Options sold . . . . . . . . . . . . . . . . . . . . . . . . . . . . . . . . . . . . . . . . . . . . 11,962,045 — 11,962,045Swaps . . . . . . . . . . . . . . . . . . . . . . . . . . . . . . . . . . . . . . . . . . . . . . . . . . 22,972,500 — 22,972,500
111,438,408 — 111,438,408
Interest rate related:Futures bought . . . . . . . . . . . . . . . . . . . . . . . . . . . . . . . . . . . . . . . . . . 10,585 — 10,585Futures sold . . . . . . . . . . . . . . . . . . . . . . . . . . . . . . . . . . . . . . . . . . . . . 254,040 — 254,040Options bought . . . . . . . . . . . . . . . . . . . . . . . . . . . . . . . . . . . . . . . . . . 1,489,800 — 1,489,800Options sold . . . . . . . . . . . . . . . . . . . . . . . . . . . . . . . . . . . . . . . . . . . . 2,476,800 — 2,476,800Swaps . . . . . . . . . . . . . . . . . . . . . . . . . . . . . . . . . . . . . . . . . . . . . . . . . . 80,620,000 12,612,301 93,232,301
84,851,225 12,612,301 97,463,526
Stock price index related:Stock index options bought . . . . . . . . . . . . . . . . . . . . . . . . . . . . . . . 211,478 — 211,478Stock index options sold . . . . . . . . . . . . . . . . . . . . . . . . . . . . . . . . . 190,162 — 190,162Swaps . . . . . . . . . . . . . . . . . . . . . . . . . . . . . . . . . . . . . . . . . . . . . . . . . . 1,679,383 — 1,679,383
2,081,023 — 2,081,023
Other:Commodity forwards . . . . . . . . . . . . . . . . . . . . . . . . . . . . . . . . . . . . 120,175 — 120,175Commodity options bought . . . . . . . . . . . . . . . . . . . . . . . . . . . . . . . 16,462 — 16,462Commodity options sold . . . . . . . . . . . . . . . . . . . . . . . . . . . . . . . . . 16,462 — 16,462Gold swap . . . . . . . . . . . . . . . . . . . . . . . . . . . . . . . . . . . . . . . . . . . . . . 93,194 — 93,194
246,293 — 246,293
W198,616,949 12,612,301 211,229,250
F-80
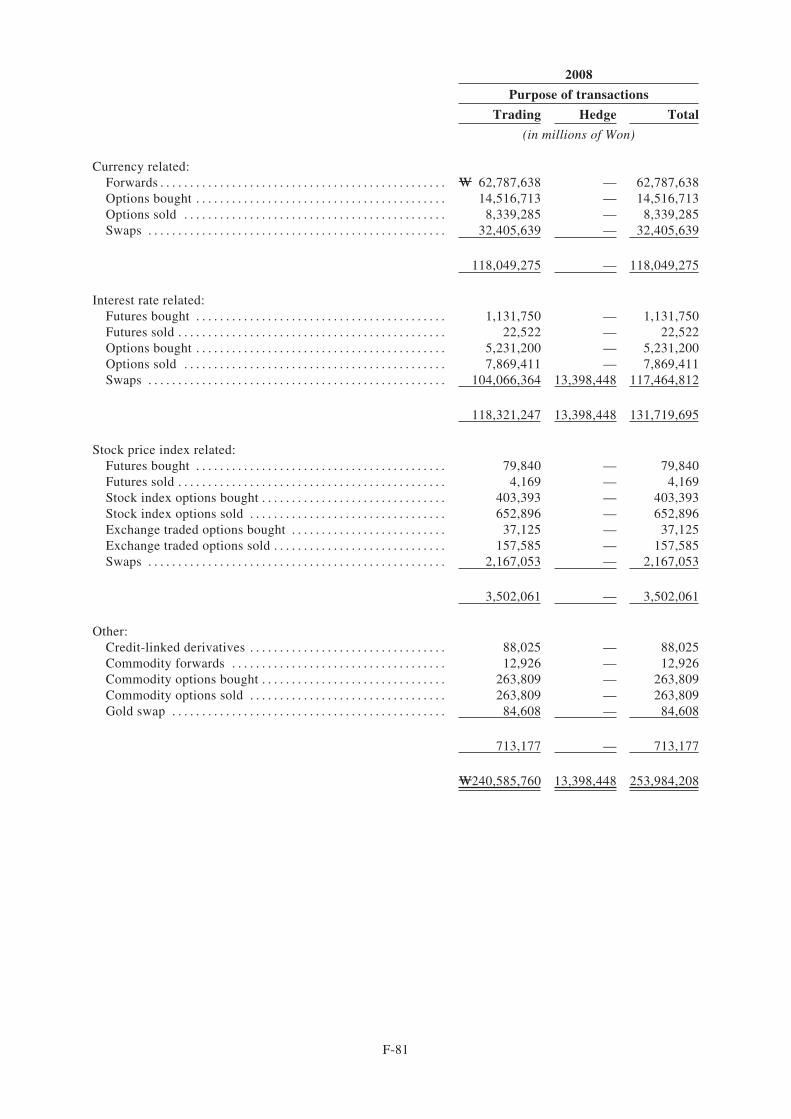
2008
Purpose of transactions
Trading Hedge Total
(in millions of Won)
Currency related:Forwards . . . . . . . . . . . . . . . . . . . . . . . . . . . . . . . . . . . . . . . . . . . . . . . . W 62,787,638 — 62,787,638Options bought . . . . . . . . . . . . . . . . . . . . . . . . . . . . . . . . . . . . . . . . . . 14,516,713 — 14,516,713Options sold . . . . . . . . . . . . . . . . . . . . . . . . . . . . . . . . . . . . . . . . . . . . 8,339,285 — 8,339,285Swaps . . . . . . . . . . . . . . . . . . . . . . . . . . . . . . . . . . . . . . . . . . . . . . . . . . 32,405,639 — 32,405,639
118,049,275 — 118,049,275
Interest rate related:Futures bought . . . . . . . . . . . . . . . . . . . . . . . . . . . . . . . . . . . . . . . . . . 1,131,750 — 1,131,750Futures sold . . . . . . . . . . . . . . . . . . . . . . . . . . . . . . . . . . . . . . . . . . . . . 22,522 — 22,522Options bought . . . . . . . . . . . . . . . . . . . . . . . . . . . . . . . . . . . . . . . . . . 5,231,200 — 5,231,200Options sold . . . . . . . . . . . . . . . . . . . . . . . . . . . . . . . . . . . . . . . . . . . . 7,869,411 — 7,869,411Swaps . . . . . . . . . . . . . . . . . . . . . . . . . . . . . . . . . . . . . . . . . . . . . . . . . . 104,066,364 13,398,448 117,464,812
118,321,247 13,398,448 131,719,695
Stock price index related:Futures bought . . . . . . . . . . . . . . . . . . . . . . . . . . . . . . . . . . . . . . . . . . 79,840 — 79,840Futures sold . . . . . . . . . . . . . . . . . . . . . . . . . . . . . . . . . . . . . . . . . . . . . 4,169 — 4,169Stock index options bought . . . . . . . . . . . . . . . . . . . . . . . . . . . . . . . 403,393 — 403,393Stock index options sold . . . . . . . . . . . . . . . . . . . . . . . . . . . . . . . . . 652,896 — 652,896Exchange traded options bought . . . . . . . . . . . . . . . . . . . . . . . . . . 37,125 — 37,125Exchange traded options sold . . . . . . . . . . . . . . . . . . . . . . . . . . . . . 157,585 — 157,585Swaps . . . . . . . . . . . . . . . . . . . . . . . . . . . . . . . . . . . . . . . . . . . . . . . . . . 2,167,053 — 2,167,053
3,502,061 — 3,502,061
Other:Credit-linked derivatives . . . . . . . . . . . . . . . . . . . . . . . . . . . . . . . . . 88,025 — 88,025Commodity forwards . . . . . . . . . . . . . . . . . . . . . . . . . . . . . . . . . . . . 12,926 — 12,926Commodity options bought . . . . . . . . . . . . . . . . . . . . . . . . . . . . . . . 263,809 — 263,809Commodity options sold . . . . . . . . . . . . . . . . . . . . . . . . . . . . . . . . . 263,809 — 263,809Gold swap . . . . . . . . . . . . . . . . . . . . . . . . . . . . . . . . . . . . . . . . . . . . . . 84,608 — 84,608
713,177 — 713,177
W240,585,760 13,398,448 253,984,208
F-81
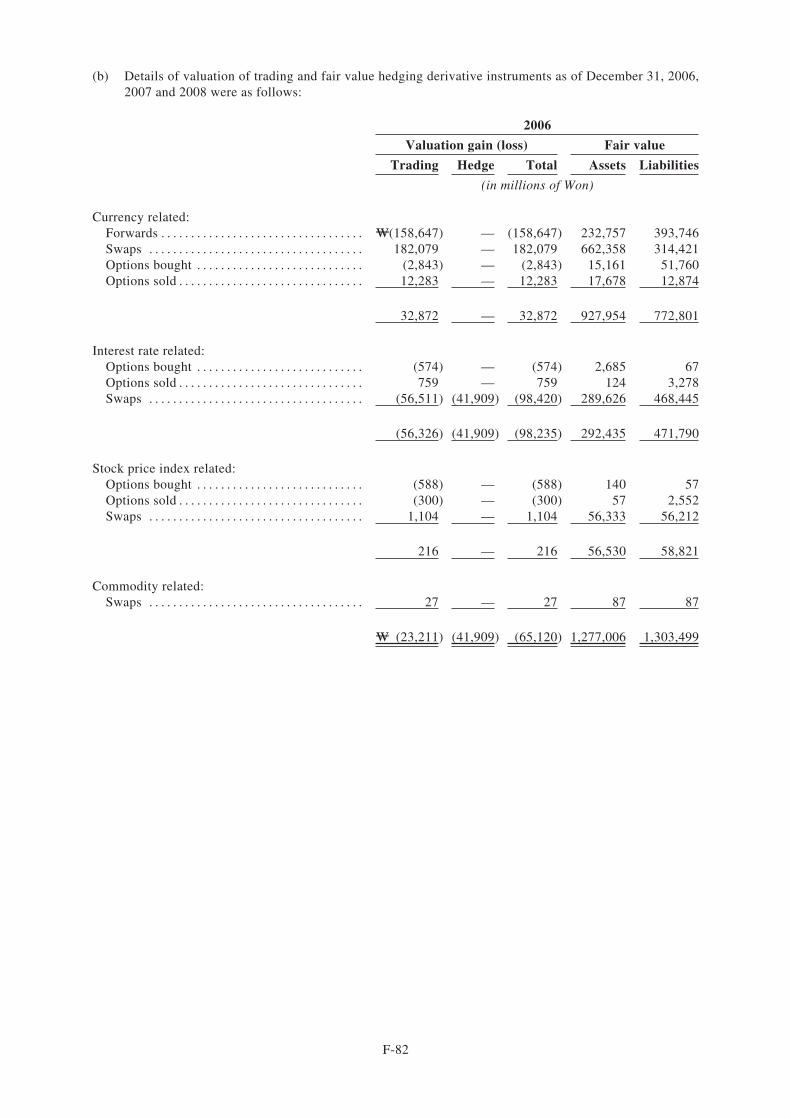
(b) Details of valuation of trading and fair value hedging derivative instruments as of December 31, 2006,2007 and 2008 were as follows:
2006
Valuation gain (loss) Fair value
Trading Hedge Total Assets Liabilities
(in millions of Won)
Currency related:Forwards . . . . . . . . . . . . . . . . . . . . . . . . . . . . . . . . . . W(158,647) — (158,647) 232,757 393,746Swaps . . . . . . . . . . . . . . . . . . . . . . . . . . . . . . . . . . . . 182,079 — 182,079 662,358 314,421Options bought . . . . . . . . . . . . . . . . . . . . . . . . . . . . (2,843) — (2,843) 15,161 51,760Options sold . . . . . . . . . . . . . . . . . . . . . . . . . . . . . . . 12,283 — 12,283 17,678 12,874
32,872 — 32,872 927,954 772,801
Interest rate related:Options bought . . . . . . . . . . . . . . . . . . . . . . . . . . . . (574) — (574) 2,685 67Options sold . . . . . . . . . . . . . . . . . . . . . . . . . . . . . . . 759 — 759 124 3,278Swaps . . . . . . . . . . . . . . . . . . . . . . . . . . . . . . . . . . . . (56,511) (41,909) (98,420) 289,626 468,445
(56,326) (41,909) (98,235) 292,435 471,790
Stock price index related:Options bought . . . . . . . . . . . . . . . . . . . . . . . . . . . . (588) — (588) 140 57Options sold . . . . . . . . . . . . . . . . . . . . . . . . . . . . . . . (300) — (300) 57 2,552Swaps . . . . . . . . . . . . . . . . . . . . . . . . . . . . . . . . . . . . 1,104 — 1,104 56,333 56,212
216 — 216 56,530 58,821
Commodity related:Swaps . . . . . . . . . . . . . . . . . . . . . . . . . . . . . . . . . . . . 27 — 27 87 87
W (23,211) (41,909) (65,120) 1,277,006 1,303,499
F-82
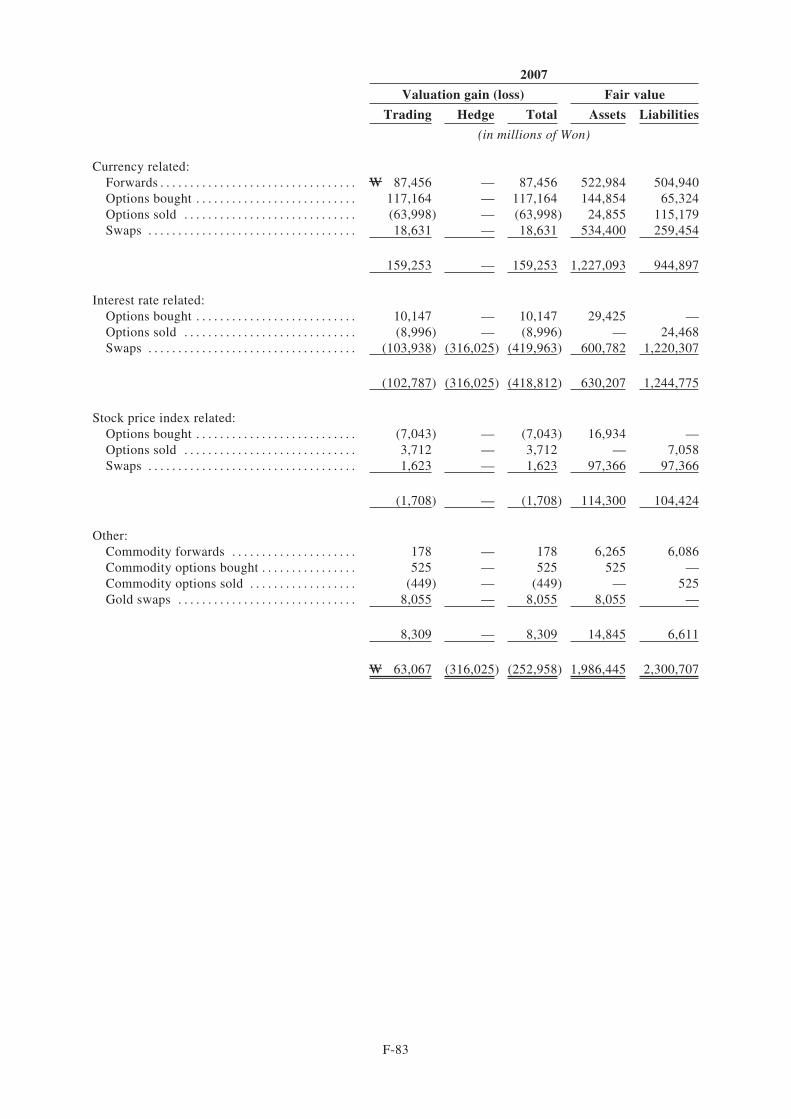
2007
Valuation gain (loss) Fair value
Trading Hedge Total Assets Liabilities
(in millions of Won)
Currency related:Forwards . . . . . . . . . . . . . . . . . . . . . . . . . . . . . . . . . W 87,456 — 87,456 522,984 504,940Options bought . . . . . . . . . . . . . . . . . . . . . . . . . . . 117,164 — 117,164 144,854 65,324Options sold . . . . . . . . . . . . . . . . . . . . . . . . . . . . . (63,998) — (63,998) 24,855 115,179Swaps . . . . . . . . . . . . . . . . . . . . . . . . . . . . . . . . . . . 18,631 — 18,631 534,400 259,454
159,253 — 159,253 1,227,093 944,897
Interest rate related:Options bought . . . . . . . . . . . . . . . . . . . . . . . . . . . 10,147 — 10,147 29,425 —Options sold . . . . . . . . . . . . . . . . . . . . . . . . . . . . . (8,996) — (8,996) — 24,468Swaps . . . . . . . . . . . . . . . . . . . . . . . . . . . . . . . . . . . (103,938) (316,025) (419,963) 600,782 1,220,307
(102,787) (316,025) (418,812) 630,207 1,244,775
Stock price index related:Options bought . . . . . . . . . . . . . . . . . . . . . . . . . . . (7,043) — (7,043) 16,934 —Options sold . . . . . . . . . . . . . . . . . . . . . . . . . . . . . 3,712 — 3,712 — 7,058Swaps . . . . . . . . . . . . . . . . . . . . . . . . . . . . . . . . . . . 1,623 — 1,623 97,366 97,366
(1,708) — (1,708) 114,300 104,424
Other:Commodity forwards . . . . . . . . . . . . . . . . . . . . . 178 — 178 6,265 6,086Commodity options bought . . . . . . . . . . . . . . . . 525 — 525 525 —Commodity options sold . . . . . . . . . . . . . . . . . . (449) — (449) — 525Gold swaps . . . . . . . . . . . . . . . . . . . . . . . . . . . . . . 8,055 — 8,055 8,055 —
8,309 — 8,309 14,845 6,611
W 63,067 (316,025) (252,958) 1,986,445 2,300,707
F-83
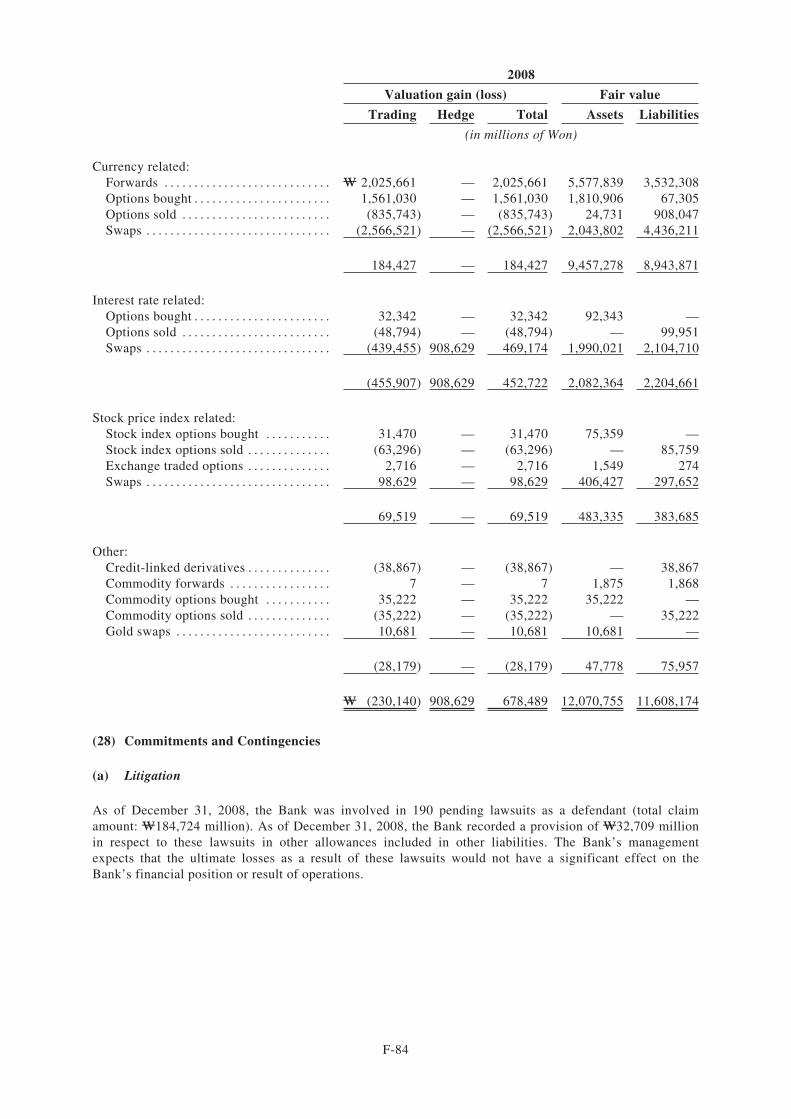
2008
Valuation gain (loss) Fair value
Trading Hedge Total Assets Liabilities
(in millions of Won)
Currency related:Forwards . . . . . . . . . . . . . . . . . . . . . . . . . . . . W 2,025,661 — 2,025,661 5,577,839 3,532,308Options bought . . . . . . . . . . . . . . . . . . . . . . . 1,561,030 — 1,561,030 1,810,906 67,305Options sold . . . . . . . . . . . . . . . . . . . . . . . . . (835,743) — (835,743) 24,731 908,047Swaps . . . . . . . . . . . . . . . . . . . . . . . . . . . . . . . (2,566,521) — (2,566,521) 2,043,802 4,436,211
184,427 — 184,427 9,457,278 8,943,871
Interest rate related:Options bought . . . . . . . . . . . . . . . . . . . . . . . 32,342 — 32,342 92,343 —Options sold . . . . . . . . . . . . . . . . . . . . . . . . . (48,794) — (48,794) — 99,951Swaps . . . . . . . . . . . . . . . . . . . . . . . . . . . . . . . (439,455) 908,629 469,174 1,990,021 2,104,710
(455,907) 908,629 452,722 2,082,364 2,204,661
Stock price index related:Stock index options bought . . . . . . . . . . . 31,470 — 31,470 75,359 —Stock index options sold . . . . . . . . . . . . . . (63,296) — (63,296) — 85,759Exchange traded options . . . . . . . . . . . . . . 2,716 — 2,716 1,549 274Swaps . . . . . . . . . . . . . . . . . . . . . . . . . . . . . . . 98,629 — 98,629 406,427 297,652
69,519 — 69,519 483,335 383,685
Other:Credit-linked derivatives . . . . . . . . . . . . . . (38,867) — (38,867) — 38,867Commodity forwards . . . . . . . . . . . . . . . . . 7 — 7 1,875 1,868Commodity options bought . . . . . . . . . . . 35,222 — 35,222 35,222 —Commodity options sold . . . . . . . . . . . . . . (35,222) — (35,222) — 35,222Gold swaps . . . . . . . . . . . . . . . . . . . . . . . . . . 10,681 — 10,681 10,681 —
(28,179) — (28,179) 47,778 75,957
W (230,140) 908,629 678,489 12,070,755 11,608,174
(28) Commitments and Contingencies
(a) Litigation
As of December 31, 2008, the Bank was involved in 190 pending lawsuits as a defendant (total claimamount: W184,724 million). As of December 31, 2008, the Bank recorded a provision of W32,709 millionin respect to these lawsuits in other allowances included in other liabilities. The Bank’s managementexpects that the ultimate losses as a result of these lawsuits would not have a significant effect on theBank’s financial position or result of operations.
F-84
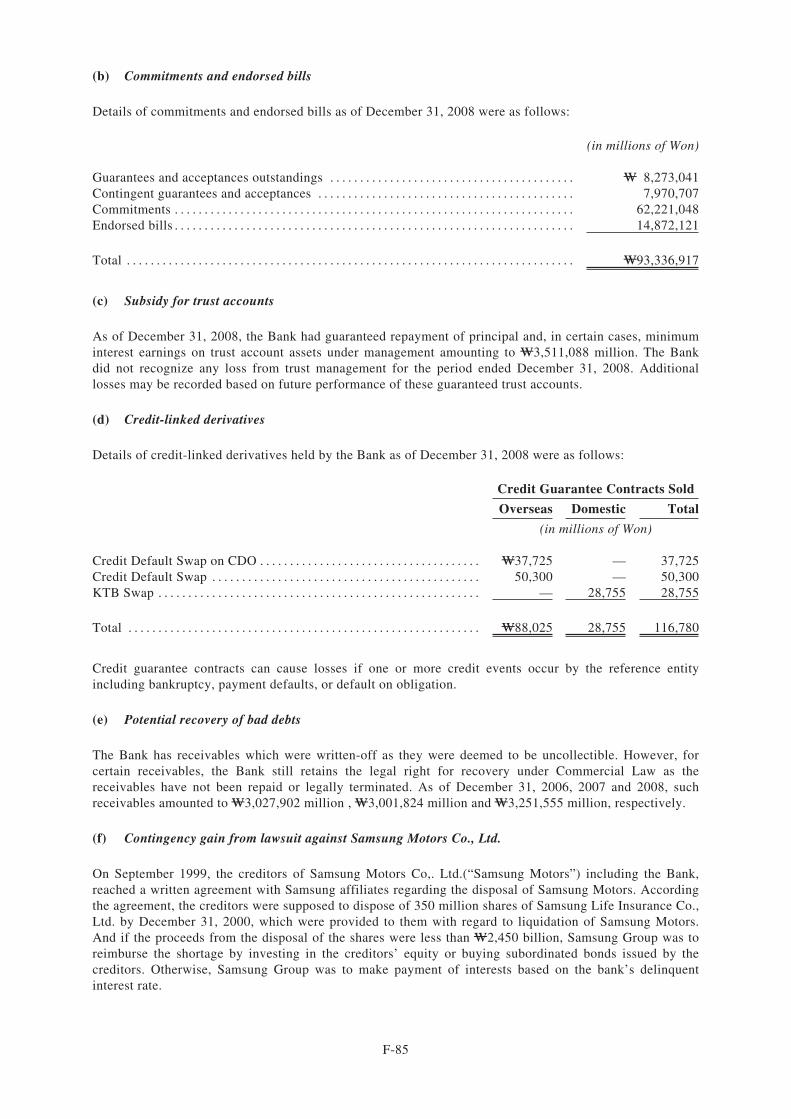
(b) Commitments and endorsed bills
Details of commitments and endorsed bills as of December 31, 2008 were as follows:
(in millions of Won)
Guarantees and acceptances outstandings . . . . . . . . . . . . . . . . . . . . . . . . . . . . . . . . . . . . . . . . . W 8,273,041Contingent guarantees and acceptances . . . . . . . . . . . . . . . . . . . . . . . . . . . . . . . . . . . . . . . . . . . 7,970,707Commitments . . . . . . . . . . . . . . . . . . . . . . . . . . . . . . . . . . . . . . . . . . . . . . . . . . . . . . . . . . . . . . . . . . . 62,221,048Endorsed bills . . . . . . . . . . . . . . . . . . . . . . . . . . . . . . . . . . . . . . . . . . . . . . . . . . . . . . . . . . . . . . . . . . . 14,872,121
Total . . . . . . . . . . . . . . . . . . . . . . . . . . . . . . . . . . . . . . . . . . . . . . . . . . . . . . . . . . . . . . . . . . . . . . . . . . . W93,336,917
(c) Subsidy for trust accounts
As of December 31, 2008, the Bank had guaranteed repayment of principal and, in certain cases, minimuminterest earnings on trust account assets under management amounting to W3,511,088 million. The Bankdid not recognize any loss from trust management for the period ended December 31, 2008. Additionallosses may be recorded based on future performance of these guaranteed trust accounts.
(d) Credit-linked derivatives
Details of credit-linked derivatives held by the Bank as of December 31, 2008 were as follows:
Credit Guarantee Contracts Sold
Overseas Domestic Total
(in millions of Won)
Credit Default Swap on CDO . . . . . . . . . . . . . . . . . . . . . . . . . . . . . . . . . . . . . W37,725 — 37,725Credit Default Swap . . . . . . . . . . . . . . . . . . . . . . . . . . . . . . . . . . . . . . . . . . . . . 50,300 — 50,300KTB Swap . . . . . . . . . . . . . . . . . . . . . . . . . . . . . . . . . . . . . . . . . . . . . . . . . . . . . . — 28,755 28,755
Total . . . . . . . . . . . . . . . . . . . . . . . . . . . . . . . . . . . . . . . . . . . . . . . . . . . . . . . . . . . W88,025 28,755 116,780
Credit guarantee contracts can cause losses if one or more credit events occur by the reference entityincluding bankruptcy, payment defaults, or default on obligation.
(e) Potential recovery of bad debts
The Bank has receivables which were written-off as they were deemed to be uncollectible. However, forcertain receivables, the Bank still retains the legal right for recovery under Commercial Law as thereceivables have not been repaid or legally terminated. As of December 31, 2006, 2007 and 2008, suchreceivables amounted to W3,027,902 million , W3,001,824 million and W3,251,555 million, respectively.
(f) Contingency gain from lawsuit against Samsung Motors Co., Ltd.
On September 1999, the creditors of Samsung Motors Co,. Ltd.(“Samsung Motors”) including the Bank,reached a written agreement with Samsung affiliates regarding the disposal of Samsung Motors. Accordingthe agreement, the creditors were supposed to dispose of 350 million shares of Samsung Life Insurance Co.,Ltd. by December 31, 2000, which were provided to them with regard to liquidation of Samsung Motors.And if the proceeds from the disposal of the shares were less than W2,450 billion, Samsung Group was toreimburse the shortage by investing in the creditors’ equity or buying subordinated bonds issued by thecreditors. Otherwise, Samsung Group was to make payment of interests based on the bank’s delinquentinterest rate.
F-85
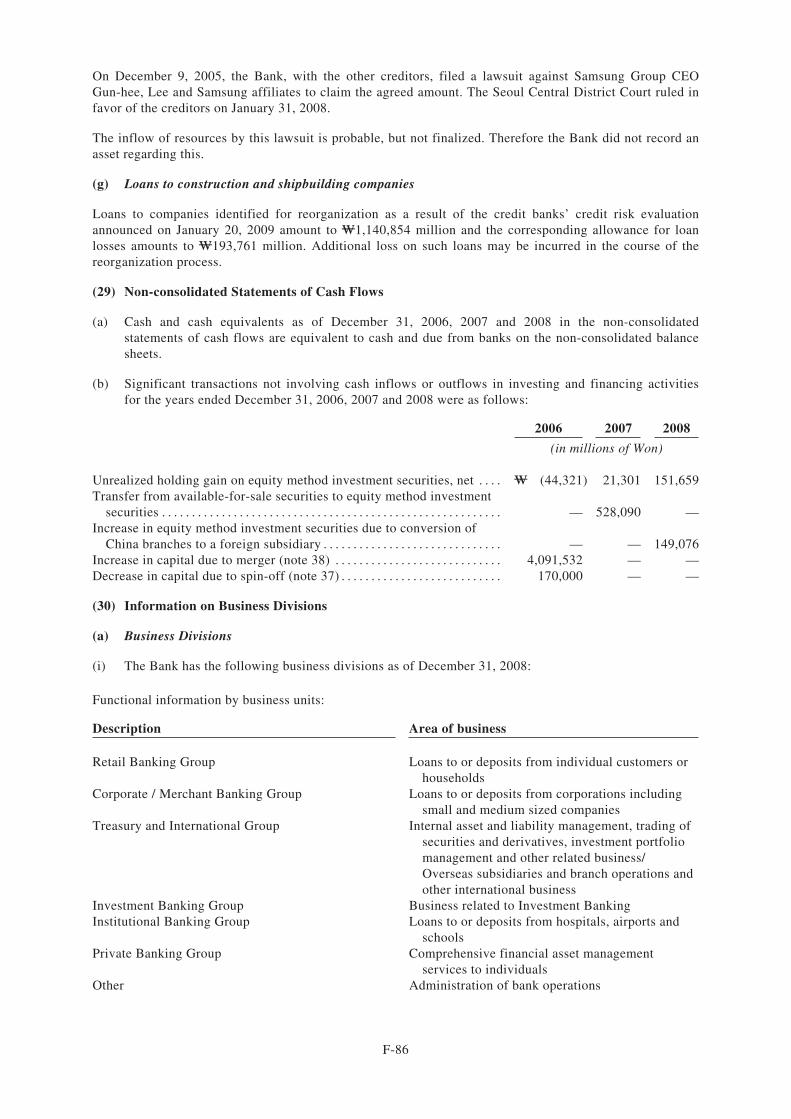
On December 9, 2005, the Bank, with the other creditors, filed a lawsuit against Samsung Group CEOGun-hee, Lee and Samsung affiliates to claim the agreed amount. The Seoul Central District Court ruled infavor of the creditors on January 31, 2008.
The inflow of resources by this lawsuit is probable, but not finalized. Therefore the Bank did not record anasset regarding this.
(g) Loans to construction and shipbuilding companies
Loans to companies identified for reorganization as a result of the credit banks’ credit risk evaluationannounced on January 20, 2009 amount to W1,140,854 million and the corresponding allowance for loanlosses amounts to W193,761 million. Additional loss on such loans may be incurred in the course of thereorganization process.
(29) Non-consolidated Statements of Cash Flows
(a) Cash and cash equivalents as of December 31, 2006, 2007 and 2008 in the non-consolidatedstatements of cash flows are equivalent to cash and due from banks on the non-consolidated balancesheets.
(b) Significant transactions not involving cash inflows or outflows in investing and financing activitiesfor the years ended December 31, 2006, 2007 and 2008 were as follows:
2006 2007 2008
(in millions of Won)
Unrealized holding gain on equity method investment securities, net . . . . W (44,321) 21,301 151,659Transfer from available-for-sale securities to equity method investment
securities . . . . . . . . . . . . . . . . . . . . . . . . . . . . . . . . . . . . . . . . . . . . . . . . . . . . . . . . . — 528,090 —Increase in equity method investment securities due to conversion of
China branches to a foreign subsidiary . . . . . . . . . . . . . . . . . . . . . . . . . . . . . . — — 149,076Increase in capital due to merger (note 38) . . . . . . . . . . . . . . . . . . . . . . . . . . . . 4,091,532 — —Decrease in capital due to spin-off (note 37) . . . . . . . . . . . . . . . . . . . . . . . . . . . 170,000 — —
(30) Information on Business Divisions
(a) Business Divisions
(i) The Bank has the following business divisions as of December 31, 2008:
Functional information by business units:
Description Area of business
Retail Banking Group Loans to or deposits from individual customers orhouseholds
Corporate / Merchant Banking Group Loans to or deposits from corporations includingsmall and medium sized companies
Treasury and International Group Internal asset and liability management, trading ofsecurities and derivatives, investment portfoliomanagement and other related business/Overseas subsidiaries and branch operations andother international business
Investment Banking Group Business related to Investment BankingInstitutional Banking Group Loans to or deposits from hospitals, airports and
schoolsPrivate Banking Group Comprehensive financial asset management
services to individualsOther Administration of bank operations
F-86
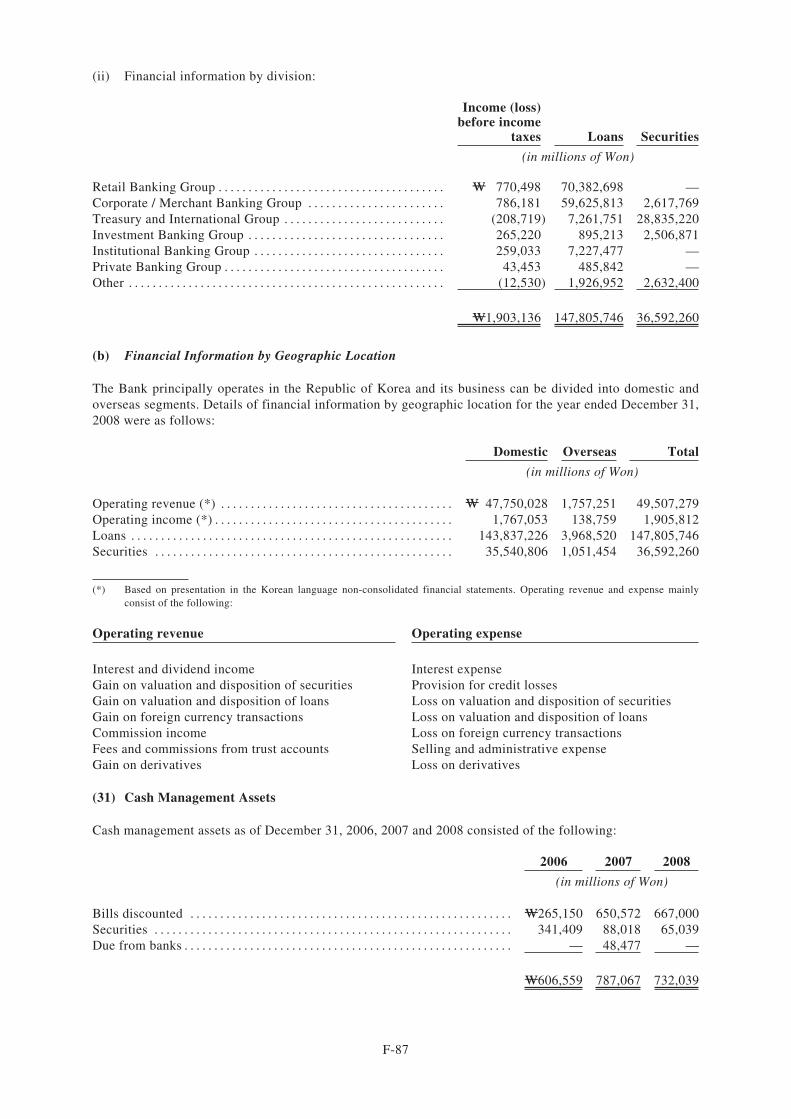
(ii) Financial information by division:
Income (loss)before income
taxes Loans Securities
(in millions of Won)
Retail Banking Group . . . . . . . . . . . . . . . . . . . . . . . . . . . . . . . . . . . . . . W 770,498 70,382,698 —Corporate / Merchant Banking Group . . . . . . . . . . . . . . . . . . . . . . . 786,181 59,625,813 2,617,769Treasury and International Group . . . . . . . . . . . . . . . . . . . . . . . . . . . (208,719) 7,261,751 28,835,220Investment Banking Group . . . . . . . . . . . . . . . . . . . . . . . . . . . . . . . . . 265,220 895,213 2,506,871Institutional Banking Group . . . . . . . . . . . . . . . . . . . . . . . . . . . . . . . . 259,033 7,227,477 —Private Banking Group . . . . . . . . . . . . . . . . . . . . . . . . . . . . . . . . . . . . . 43,453 485,842 —Other . . . . . . . . . . . . . . . . . . . . . . . . . . . . . . . . . . . . . . . . . . . . . . . . . . . . . (12,530) 1,926,952 2,632,400
W1,903,136 147,805,746 36,592,260
(b) Financial Information by Geographic Location
The Bank principally operates in the Republic of Korea and its business can be divided into domestic andoverseas segments. Details of financial information by geographic location for the year ended December 31,2008 were as follows:
Domestic Overseas Total
(in millions of Won)
Operating revenue (*) . . . . . . . . . . . . . . . . . . . . . . . . . . . . . . . . . . . . . . . W 47,750,028 1,757,251 49,507,279Operating income (*) . . . . . . . . . . . . . . . . . . . . . . . . . . . . . . . . . . . . . . . . 1,767,053 138,759 1,905,812Loans . . . . . . . . . . . . . . . . . . . . . . . . . . . . . . . . . . . . . . . . . . . . . . . . . . . . . . 143,837,226 3,968,520 147,805,746Securities . . . . . . . . . . . . . . . . . . . . . . . . . . . . . . . . . . . . . . . . . . . . . . . . . . 35,540,806 1,051,454 36,592,260
(*) Based on presentation in the Korean language non-consolidated financial statements. Operating revenue and expense mainlyconsist of the following:
Operating revenue Operating expense
Interest and dividend income Interest expenseGain on valuation and disposition of securities Provision for credit lossesGain on valuation and disposition of loans Loss on valuation and disposition of securitiesGain on foreign currency transactions Loss on valuation and disposition of loansCommission income Loss on foreign currency transactionsFees and commissions from trust accounts Selling and administrative expenseGain on derivatives Loss on derivatives
(31) Cash Management Assets
Cash management assets as of December 31, 2006, 2007 and 2008 consisted of the following:
2006 2007 2008
(in millions of Won)
Bills discounted . . . . . . . . . . . . . . . . . . . . . . . . . . . . . . . . . . . . . . . . . . . . . . . . . . . . . . W265,150 650,572 667,000Securities . . . . . . . . . . . . . . . . . . . . . . . . . . . . . . . . . . . . . . . . . . . . . . . . . . . . . . . . . . . . 341,409 88,018 65,039Due from banks . . . . . . . . . . . . . . . . . . . . . . . . . . . . . . . . . . . . . . . . . . . . . . . . . . . . . . . — 48,477 —
W606,559 787,067 732,039
F-87
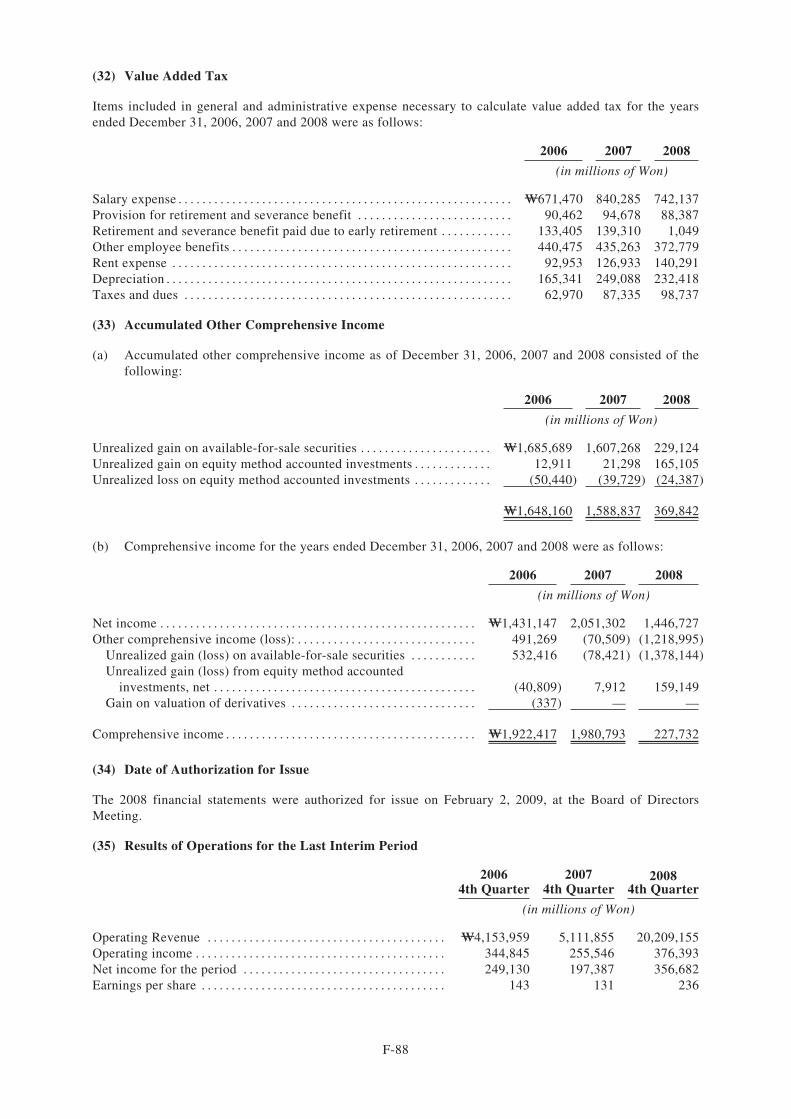
(32) Value Added Tax
Items included in general and administrative expense necessary to calculate value added tax for the yearsended December 31, 2006, 2007 and 2008 were as follows:
2006 2007 2008
(in millions of Won)
Salary expense . . . . . . . . . . . . . . . . . . . . . . . . . . . . . . . . . . . . . . . . . . . . . . . . . . . . . . . . W671,470 840,285 742,137Provision for retirement and severance benefit . . . . . . . . . . . . . . . . . . . . . . . . . . 90,462 94,678 88,387Retirement and severance benefit paid due to early retirement . . . . . . . . . . . . 133,405 139,310 1,049Other employee benefits . . . . . . . . . . . . . . . . . . . . . . . . . . . . . . . . . . . . . . . . . . . . . . . 440,475 435,263 372,779Rent expense . . . . . . . . . . . . . . . . . . . . . . . . . . . . . . . . . . . . . . . . . . . . . . . . . . . . . . . . . 92,953 126,933 140,291Depreciation . . . . . . . . . . . . . . . . . . . . . . . . . . . . . . . . . . . . . . . . . . . . . . . . . . . . . . . . . . 165,341 249,088 232,418Taxes and dues . . . . . . . . . . . . . . . . . . . . . . . . . . . . . . . . . . . . . . . . . . . . . . . . . . . . . . . 62,970 87,335 98,737
(33) Accumulated Other Comprehensive Income
(a) Accumulated other comprehensive income as of December 31, 2006, 2007 and 2008 consisted of thefollowing:
2006 2007 2008
(in millions of Won)
Unrealized gain on available-for-sale securities . . . . . . . . . . . . . . . . . . . . . . W1,685,689 1,607,268 229,124Unrealized gain on equity method accounted investments . . . . . . . . . . . . . 12,911 21,298 165,105Unrealized loss on equity method accounted investments . . . . . . . . . . . . . (50,440) (39,729) (24,387)
W1,648,160 1,588,837 369,842
(b) Comprehensive income for the years ended December 31, 2006, 2007 and 2008 were as follows:
2006 2007 2008
(in millions of Won)
Net income . . . . . . . . . . . . . . . . . . . . . . . . . . . . . . . . . . . . . . . . . . . . . . . . . . . . . W1,431,147 2,051,302 1,446,727Other comprehensive income (loss): . . . . . . . . . . . . . . . . . . . . . . . . . . . . . . 491,269 (70,509) (1,218,995)
Unrealized gain (loss) on available-for-sale securities . . . . . . . . . . . 532,416 (78,421) (1,378,144)Unrealized gain (loss) from equity method accounted
investments, net . . . . . . . . . . . . . . . . . . . . . . . . . . . . . . . . . . . . . . . . . . . . (40,809) 7,912 159,149Gain on valuation of derivatives . . . . . . . . . . . . . . . . . . . . . . . . . . . . . . . (337) — —
Comprehensive income . . . . . . . . . . . . . . . . . . . . . . . . . . . . . . . . . . . . . . . . . . W1,922,417 1,980,793 227,732
(34) Date of Authorization for Issue
The 2008 financial statements were authorized for issue on February 2, 2009, at the Board of DirectorsMeeting.
(35) Results of Operations for the Last Interim Period
20064th Quarter
20074th Quarter
20084th Quarter
(in millions of Won)
Operating Revenue . . . . . . . . . . . . . . . . . . . . . . . . . . . . . . . . . . . . . . . . W4,153,959 5,111,855 20,209,155Operating income . . . . . . . . . . . . . . . . . . . . . . . . . . . . . . . . . . . . . . . . . . 344,845 255,546 376,393Net income for the period . . . . . . . . . . . . . . . . . . . . . . . . . . . . . . . . . . 249,130 197,387 356,682Earnings per share . . . . . . . . . . . . . . . . . . . . . . . . . . . . . . . . . . . . . . . . . 143 131 236
F-88
(36) Accounting Changes
(a) Changes in accounting policies
(i) Statement of Korea Accounting Standards No.15
According to SKAS No.15, Equity Method-Revised, the difference between cost and book value arisingfrom purchase of minority interests of subsidiary shares should be retrospectively reclassified to capitalsurplus or capital adjustment from accumulated other comprehensive income.
Shinhan Bank acquired minority interest of SH Asset Management Co., Ltd. in 2000 and in 2007 and thedifference between acquisition cost and book value was retrospectively reclassified from accumulated othercomprehensive income to other capital adjustment.
(ii) Korea Accounting Institute Opinion 06-2
Korea Accounting Institute Opinion 06-2, Deferred Income Taxes on Investments in Subsidiaries,Associates, and Joint Ventures, was revised to include consideration of deferred taxes related to unrealizedgain/loss arising from intercompany transactions. As a result, deferred income tax is recognized in the samemanner as in consolidated financial statements.
(iii) Interpretation of Generally Accepted Accounting Principles 53-70
According to the revised Interpretation 53-70, Accounting for Derivatives Instruments, credit-linkedderivatives such as credit default swaps, which were previously classified as guarantees, were reclassified toderivatives under the Interpretation 53-70. The bank reversed the existing allowances for possible losses ofacceptance and guarantees by W28,735 million and recorded W38,867 million as derivative liabilities byfair value measurement as of December 31, 2008.
(iv) Reclassification
The Bank accounts for the court deposits for postal charges as other liabilities, which were previouslyclassified as deposits. According to the accounting change, the Bank reclassified deposits amounting toW204,024 million as of December 31, 2007 to other liabilities.
(b) Changes in accounting estimates
In estimating the fair value of options of the sixth and the seventh grants with performance conditions(based on return on equity), the Bank changed its valuation model from the Black-Scholes model which wasused in 2007 to the PDE Solution model for a more reasonable and consistent measurement. Beginning thefirst quarter in 2008, the Bank applies the volatility of individual stock prices in estimating weighted-average volatility of the stock price rather than the volatility of the average stock price.
(37) Spin-off of the Credit Card Division
According to the split-merger agreement dated December 30, 2005 between Chohung Bank and ShinhanCard Co., Ltd. and the approval by the respective shareholders of Chohung Bank and Shinhan Card Co.,Ltd. on February 15, 2006, the credit card division of Chohung Bank was merged with Shinhan Card Co.,Ltd. on April 1, 2006. Shinhan Card Co., Ltd. issued 41,207,856 shares of common stock in consideration(0.980941772 shares in consideration for 1 share of Chohung Bank).
F-89
The Bank transferred all assets, liabilities and stockholder’s equity at book value in the amount ofW1,967,701 million, W1,784,007 million and W13,694 million, respectively. The details of the condensedbalance sheet of the credit card division at April 3, 2006 were as follows:
(in millions of Won)
Assets:
Available-for-sale securities . . . . . . . . . . . . . . . . . . . . . . . . . . . . . . . . . . . . . . . . . . . . . . . . . . . W 24,730Credit card accounts . . . . . . . . . . . . . . . . . . . . . . . . . . . . . . . . . . . . . . . . . . . . . . . . . . . . . . . . . . . 2,034,912Allowance for loan losses . . . . . . . . . . . . . . . . . . . . . . . . . . . . . . . . . . . . . . . . . . . . . . . . . . . . . . (124,497)Property and equipment, net of accumulated depreciation . . . . . . . . . . . . . . . . . . . . . . . . 5,037Other assets . . . . . . . . . . . . . . . . . . . . . . . . . . . . . . . . . . . . . . . . . . . . . . . . . . . . . . . . . . . . . . . . . . 27,519
W1,967,701
Liabilities:
Debentures . . . . . . . . . . . . . . . . . . . . . . . . . . . . . . . . . . . . . . . . . . . . . . . . . . . . . . . . . . . . . . . . . . . W1,690,000Other liabilities . . . . . . . . . . . . . . . . . . . . . . . . . . . . . . . . . . . . . . . . . . . . . . . . . . . . . . . . . . . . . . . 94,007
1,784,007
Stockholders’ equity:
Capital stock . . . . . . . . . . . . . . . . . . . . . . . . . . . . . . . . . . . . . . . . . . . . . . . . . . . . . . . . . . . . . . . . . 210,042Capital surplus . . . . . . . . . . . . . . . . . . . . . . . . . . . . . . . . . . . . . . . . . . . . . . . . . . . . . . . . . . . . . . . . (40,042)Accumulated other comprehensive income . . . . . . . . . . . . . . . . . . . . . . . . . . . . . . . . . . . . . . 13,694
183,694
W1,967,701
(38) Merger with Shinhan Bank
(a) Merger
According to the merger agreement dated December 30, 2005 between Chohung Bank and Shinhan Bankand the approval by the respective shareholders of Chohung Bank and Shinhan Bank on February 15, 2006,Shinhan Bank merged with Chohung Bank (excluding the card division of Chohung Bank) with ChohungBank as the surviving legal entity. In connection with the merger, Chohung Bank issued 828,505,540 sharesof common stock in consideration (3.867799182 shares in consideration for 1 share of Shinhan Bank). Afterthe merger, Chohung Bank changed its name to Shinhan Bank.
(b) General information of Shinhan Bank prior to the merger with Chohung Bank
Shinhan Bank was incorporated on September 15, 1981 under the General Banking Act of the Republic ofKorea to engage in commercial banking and trust business. As of the merger date, April 1, 2006, the capitalstock of Shinhan Bank amounted to W1,224,034 million, it had 409 domestic and overseas branches and162 automated teller machine locations.
The shares of Shinhan Bank were transferred in their entirety to Shinhan Financial Group Co., Ltd. onSeptember 1, 2001 and it became a wholly-owned subsidiary of Shinhan Financial Group Co., Ltd.. As aresult, Shinhan Bank was delisted from the Korea Stock Exchange on September 10, 2001.
F-90
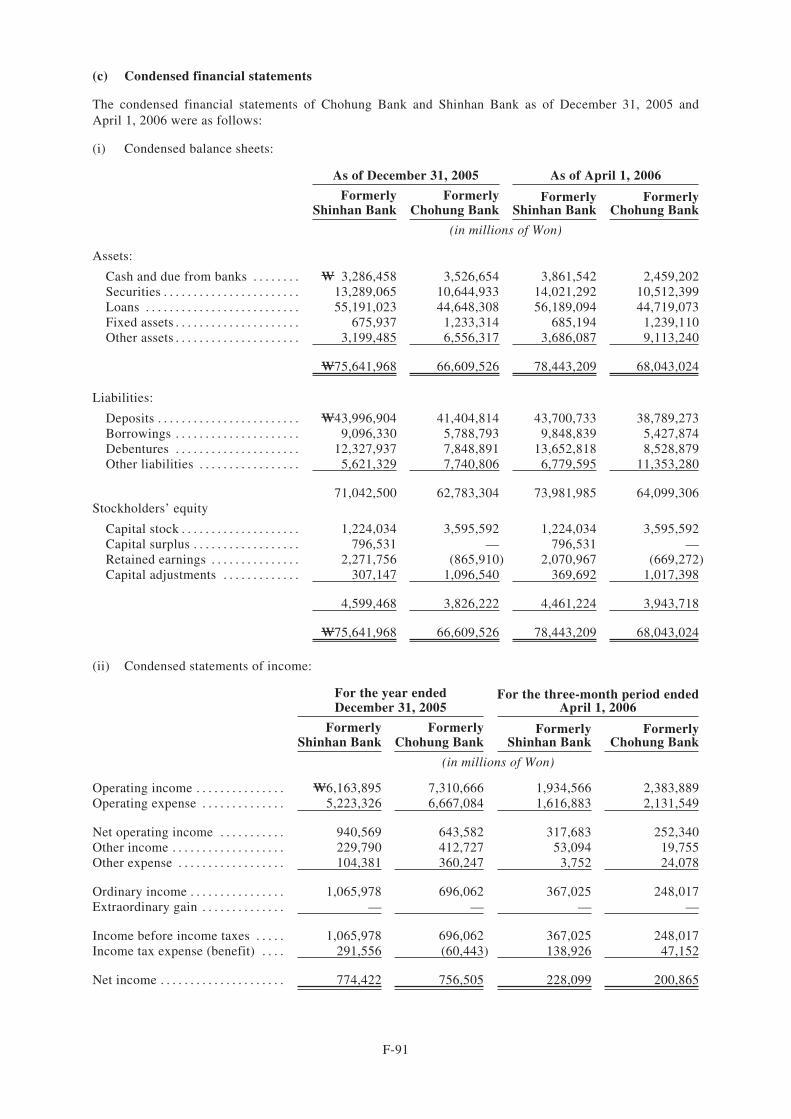
(c) Condensed financial statements
The condensed financial statements of Chohung Bank and Shinhan Bank as of December 31, 2005 andApril 1, 2006 were as follows:
(i) Condensed balance sheets:
As of December 31, 2005 As of April 1, 2006
FormerlyShinhan Bank
FormerlyChohung Bank
FormerlyShinhan Bank
FormerlyChohung Bank
(in millions of Won)
Assets:
Cash and due from banks . . . . . . . . W 3,286,458 3,526,654 3,861,542 2,459,202Securities . . . . . . . . . . . . . . . . . . . . . . . 13,289,065 10,644,933 14,021,292 10,512,399Loans . . . . . . . . . . . . . . . . . . . . . . . . . . 55,191,023 44,648,308 56,189,094 44,719,073Fixed assets . . . . . . . . . . . . . . . . . . . . . 675,937 1,233,314 685,194 1,239,110Other assets . . . . . . . . . . . . . . . . . . . . . 3,199,485 6,556,317 3,686,087 9,113,240
W75,641,968 66,609,526 78,443,209 68,043,024
Liabilities:
Deposits . . . . . . . . . . . . . . . . . . . . . . . . W43,996,904 41,404,814 43,700,733 38,789,273Borrowings . . . . . . . . . . . . . . . . . . . . . 9,096,330 5,788,793 9,848,839 5,427,874Debentures . . . . . . . . . . . . . . . . . . . . . 12,327,937 7,848,891 13,652,818 8,528,879Other liabilities . . . . . . . . . . . . . . . . . 5,621,329 7,740,806 6,779,595 11,353,280
71,042,500 62,783,304 73,981,985 64,099,306Stockholders’ equity
Capital stock . . . . . . . . . . . . . . . . . . . . 1,224,034 3,595,592 1,224,034 3,595,592Capital surplus . . . . . . . . . . . . . . . . . . 796,531 — 796,531 —Retained earnings . . . . . . . . . . . . . . . 2,271,756 (865,910) 2,070,967 (669,272)Capital adjustments . . . . . . . . . . . . . 307,147 1,096,540 369,692 1,017,398
4,599,468 3,826,222 4,461,224 3,943,718
W75,641,968 66,609,526 78,443,209 68,043,024
(ii) Condensed statements of income:
For the year endedDecember 31, 2005
For the three-month period endedApril 1, 2006
FormerlyShinhan Bank
FormerlyChohung Bank
FormerlyShinhan Bank
FormerlyChohung Bank
(in millions of Won)
Operating income . . . . . . . . . . . . . . . W6,163,895 7,310,666 1,934,566 2,383,889Operating expense . . . . . . . . . . . . . . 5,223,326 6,667,084 1,616,883 2,131,549
Net operating income . . . . . . . . . . . 940,569 643,582 317,683 252,340Other income . . . . . . . . . . . . . . . . . . . 229,790 412,727 53,094 19,755Other expense . . . . . . . . . . . . . . . . . . 104,381 360,247 3,752 24,078
Ordinary income . . . . . . . . . . . . . . . . 1,065,978 696,062 367,025 248,017Extraordinary gain . . . . . . . . . . . . . . — — — —
Income before income taxes . . . . . 1,065,978 696,062 367,025 248,017Income tax expense (benefit) . . . . 291,556 (60,443) 138,926 47,152
Net income . . . . . . . . . . . . . . . . . . . . . 774,422 756,505 228,099 200,865
F-91
INDEPENDENT ACCOUNTANTS’ REVIEW REPORT
The Board of Directors and StockholdersShinhan Bank:
We have reviewed the accompanying non-consolidated statement of financial position of Shinhan Bank (the“Bank”) as of March 31, 2009 and the related non-consolidated statements of income, changes in equity andcash flows for the three-month periods ended March 31, 2009 and 2008. These non-consolidated financialstatements are the responsibility of the Bank's management. Our responsibility is to issue a report on thesenon-consolidated financial statements based on our review.
We conducted our review in accordance with the Review Standards for Semiannual Financial Statementsestablished by the Securities and Futures Commission of the Republic of Korea. These Standards requirethat we plan and perform the review to obtain moderate assurance as to whether the financial statements arefree of material misstatement. A review consists principally of inquiries of company personnel andanalytical procedures applied to financial data and, thus provides less assurance than an audit. We have notperformed an audit and, accordingly, we do not express an audit opinion.
Based on our review, nothing has come to our attention that causes us to believe that the non-consolidatedfinancial statements referred to above are not presented fairly, in all material respects, in accordance withaccounting principles generally accepted in the Republic of Korea.
The non-consolidated statement of financial position of the Bank as of December 31, 2008 and the relatednon-consolidated statements of income, appropriation of retained earnings, changes in equity and cashflows for the year then ended, which are not accompanying this report, were audited by us and our reportthereon, dated February 12, 2009, expressed an unqualified opinion. The accompanying non-consolidatedstatement of financial position of the Bank as of December 31, 2008, presented for comparative purposes, isnot different from that audited by us in all material respects.
The accompanying non-consolidated financial statements have been translated into United States dollarssolely for the convenience of the reader. We have reviewed the translation and, nothing has come to ourattention to suggest that the non-consolidated financial statements expressed in Korean Won have not beentranslated into dollars on the basis set forth in note 2(b) to the non-consolidated financial statements.
The following matters may be helpful to the readers in their understanding of the non-consolidated financialstatements:
As discussed in note 2 to the non-consolidated financial statements, accounting principles and reviewstandards and their application in practice vary among countries. The accompanying non-consolidatedfinancial statements are not intended to present the financial position, results of operations, changes inequity and cash flows in accordance with accounting principles and practices generally accepted incountries other than the Republic of Korea. In addition, the procedures and practices utilized in theRepublic of Korea to review such non-consolidated financial statements may differ from those generallyaccepted and applied in other countries. Accordingly, this report and the accompanying non-consolidatedfinancial statements are for use by those knowledgeable about Korean accounting procedures and reviewstandards and their application in practice.
KPMG Samjong Accounting Corp.Seoul, KoreaApril 28, 2009
This report is effective as of April 28, 2009, the review report date. Certain subsequent events or circumstances,which may occur between the review report date and the time of reading this report, could have a material impacton the accompanying non-consolidated financial statements and notes thereto. Accordingly, the readers of thereview report should understand that there is a possibility that the above review report may have to be revised toreflect the impact of such subsequent events or circumstances, if any.
F-92
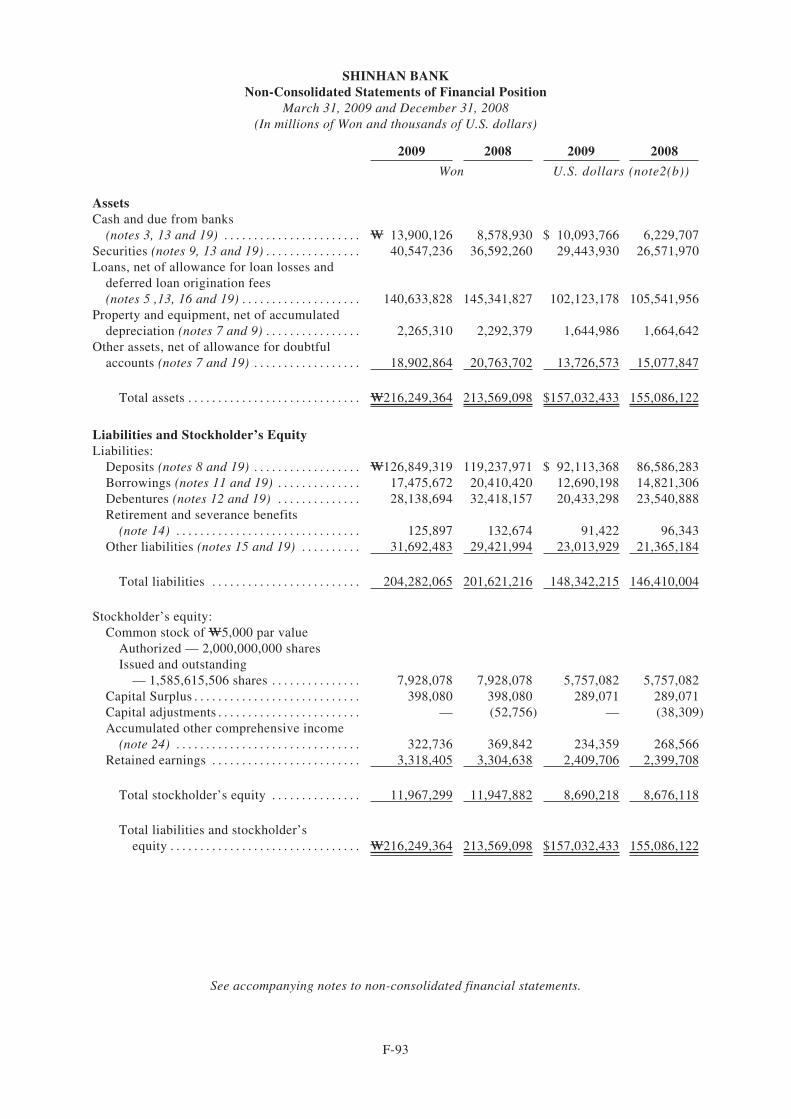
SHINHAN BANKNon-Consolidated Statements of Financial Position
March 31, 2009 and December 31, 2008(In millions of Won and thousands of U.S. dollars)
2009 2008 2009 2008
Won U.S. dollars (note2(b))
AssetsCash and due from banks
(notes 3, 13 and 19) . . . . . . . . . . . . . . . . . . . . . . . W 13,900,126 8,578,930 $ 10,093,766 6,229,707Securities (notes 9, 13 and 19) . . . . . . . . . . . . . . . . 40,547,236 36,592,260 29,443,930 26,571,970Loans, net of allowance for loan losses and
deferred loan origination fees(notes 5 ,13, 16 and 19) . . . . . . . . . . . . . . . . . . . . 140,633,828 145,341,827 102,123,178 105,541,956
Property and equipment, net of accumulateddepreciation (notes 7 and 9) . . . . . . . . . . . . . . . . 2,265,310 2,292,379 1,644,986 1,664,642
Other assets, net of allowance for doubtfulaccounts (notes 7 and 19) . . . . . . . . . . . . . . . . . . 18,902,864 20,763,702 13,726,573 15,077,847
Total assets . . . . . . . . . . . . . . . . . . . . . . . . . . . . . W216,249,364 213,569,098 $157,032,433 155,086,122
Liabilities and Stockholder’s EquityLiabilities:
Deposits (notes 8 and 19) . . . . . . . . . . . . . . . . . . W126,849,319 119,237,971 $ 92,113,368 86,586,283Borrowings (notes 11 and 19) . . . . . . . . . . . . . . 17,475,672 20,410,420 12,690,198 14,821,306Debentures (notes 12 and 19) . . . . . . . . . . . . . . 28,138,694 32,418,157 20,433,298 23,540,888Retirement and severance benefits
(note 14) . . . . . . . . . . . . . . . . . . . . . . . . . . . . . . . 125,897 132,674 91,422 96,343Other liabilities (notes 15 and 19) . . . . . . . . . . 31,692,483 29,421,994 23,013,929 21,365,184
Total liabilities . . . . . . . . . . . . . . . . . . . . . . . . . 204,282,065 201,621,216 148,342,215 146,410,004
Stockholder’s equity:Common stock of W5,000 par value
Authorized — 2,000,000,000 sharesIssued and outstanding
— 1,585,615,506 shares . . . . . . . . . . . . . . . 7,928,078 7,928,078 5,757,082 5,757,082Capital Surplus . . . . . . . . . . . . . . . . . . . . . . . . . . . . 398,080 398,080 289,071 289,071Capital adjustments . . . . . . . . . . . . . . . . . . . . . . . . — (52,756) — (38,309)Accumulated other comprehensive income
(note 24) . . . . . . . . . . . . . . . . . . . . . . . . . . . . . . . 322,736 369,842 234,359 268,566Retained earnings . . . . . . . . . . . . . . . . . . . . . . . . . 3,318,405 3,304,638 2,409,706 2,399,708
Total stockholder’s equity . . . . . . . . . . . . . . . 11,967,299 11,947,882 8,690,218 8,676,118
Total liabilities and stockholder’sequity . . . . . . . . . . . . . . . . . . . . . . . . . . . . . . . . W216,249,364 213,569,098 $157,032,433 155,086,122
See accompanying notes to non-consolidated financial statements.
F-93
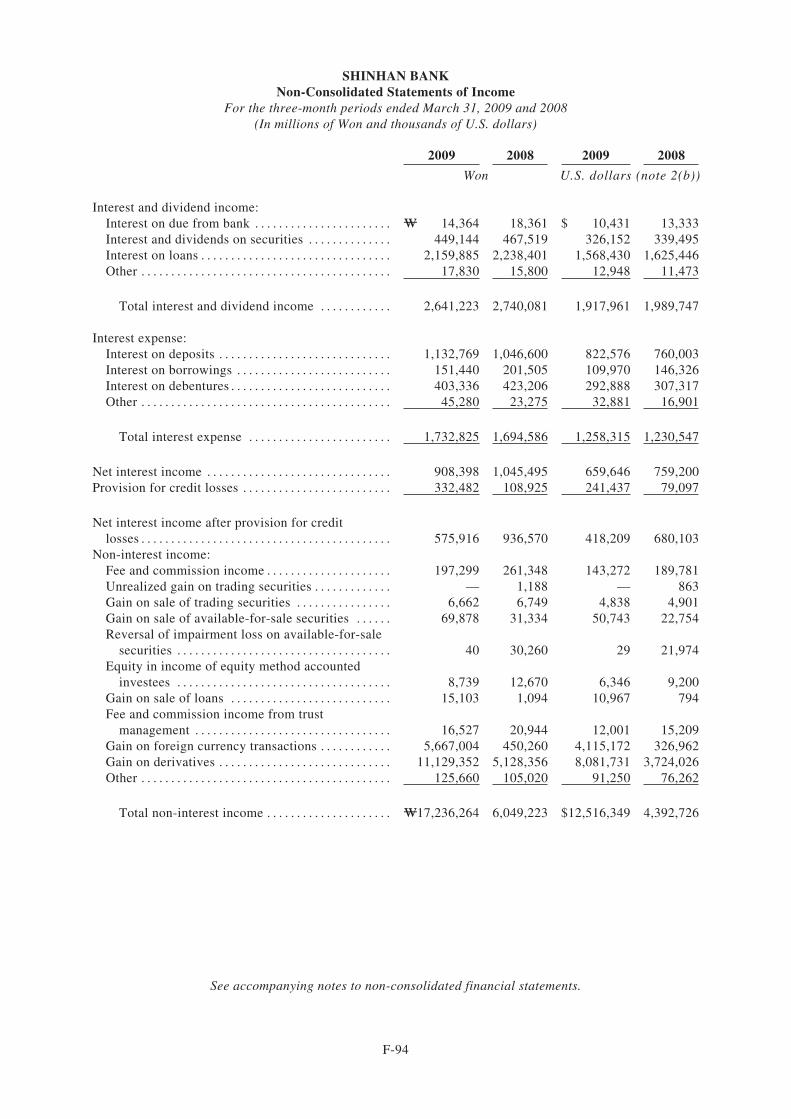
SHINHAN BANKNon-Consolidated Statements of Income
For the three-month periods ended March 31, 2009 and 2008(In millions of Won and thousands of U.S. dollars)
2009 2008 2009 2008
Won U.S. dollars (note 2(b))
Interest and dividend income:Interest on due from bank . . . . . . . . . . . . . . . . . . . . . . . W 14,364 18,361 $ 10,431 13,333Interest and dividends on securities . . . . . . . . . . . . . . 449,144 467,519 326,152 339,495Interest on loans . . . . . . . . . . . . . . . . . . . . . . . . . . . . . . . . 2,159,885 2,238,401 1,568,430 1,625,446Other . . . . . . . . . . . . . . . . . . . . . . . . . . . . . . . . . . . . . . . . . . 17,830 15,800 12,948 11,473
Total interest and dividend income . . . . . . . . . . . . 2,641,223 2,740,081 1,917,961 1,989,747
Interest expense:Interest on deposits . . . . . . . . . . . . . . . . . . . . . . . . . . . . . 1,132,769 1,046,600 822,576 760,003Interest on borrowings . . . . . . . . . . . . . . . . . . . . . . . . . . 151,440 201,505 109,970 146,326Interest on debentures . . . . . . . . . . . . . . . . . . . . . . . . . . . 403,336 423,206 292,888 307,317Other . . . . . . . . . . . . . . . . . . . . . . . . . . . . . . . . . . . . . . . . . . 45,280 23,275 32,881 16,901
Total interest expense . . . . . . . . . . . . . . . . . . . . . . . . 1,732,825 1,694,586 1,258,315 1,230,547
Net interest income . . . . . . . . . . . . . . . . . . . . . . . . . . . . . . . 908,398 1,045,495 659,646 759,200Provision for credit losses . . . . . . . . . . . . . . . . . . . . . . . . . 332,482 108,925 241,437 79,097
Net interest income after provision for creditlosses . . . . . . . . . . . . . . . . . . . . . . . . . . . . . . . . . . . . . . . . . . 575,916 936,570 418,209 680,103
Non-interest income:Fee and commission income . . . . . . . . . . . . . . . . . . . . . 197,299 261,348 143,272 189,781Unrealized gain on trading securities . . . . . . . . . . . . . — 1,188 — 863Gain on sale of trading securities . . . . . . . . . . . . . . . . 6,662 6,749 4,838 4,901Gain on sale of available-for-sale securities . . . . . . 69,878 31,334 50,743 22,754Reversal of impairment loss on available-for-sale
securities . . . . . . . . . . . . . . . . . . . . . . . . . . . . . . . . . . . . 40 30,260 29 21,974Equity in income of equity method accounted
investees . . . . . . . . . . . . . . . . . . . . . . . . . . . . . . . . . . . . 8,739 12,670 6,346 9,200Gain on sale of loans . . . . . . . . . . . . . . . . . . . . . . . . . . . 15,103 1,094 10,967 794Fee and commission income from trust
management . . . . . . . . . . . . . . . . . . . . . . . . . . . . . . . . . 16,527 20,944 12,001 15,209Gain on foreign currency transactions . . . . . . . . . . . . 5,667,004 450,260 4,115,172 326,962Gain on derivatives . . . . . . . . . . . . . . . . . . . . . . . . . . . . . 11,129,352 5,128,356 8,081,731 3,724,026Other . . . . . . . . . . . . . . . . . . . . . . . . . . . . . . . . . . . . . . . . . . 125,660 105,020 91,250 76,262
Total non-interest income . . . . . . . . . . . . . . . . . . . . . W17,236,264 6,049,223 $12,516,349 4,392,726
See accompanying notes to non-consolidated financial statements.
F-94
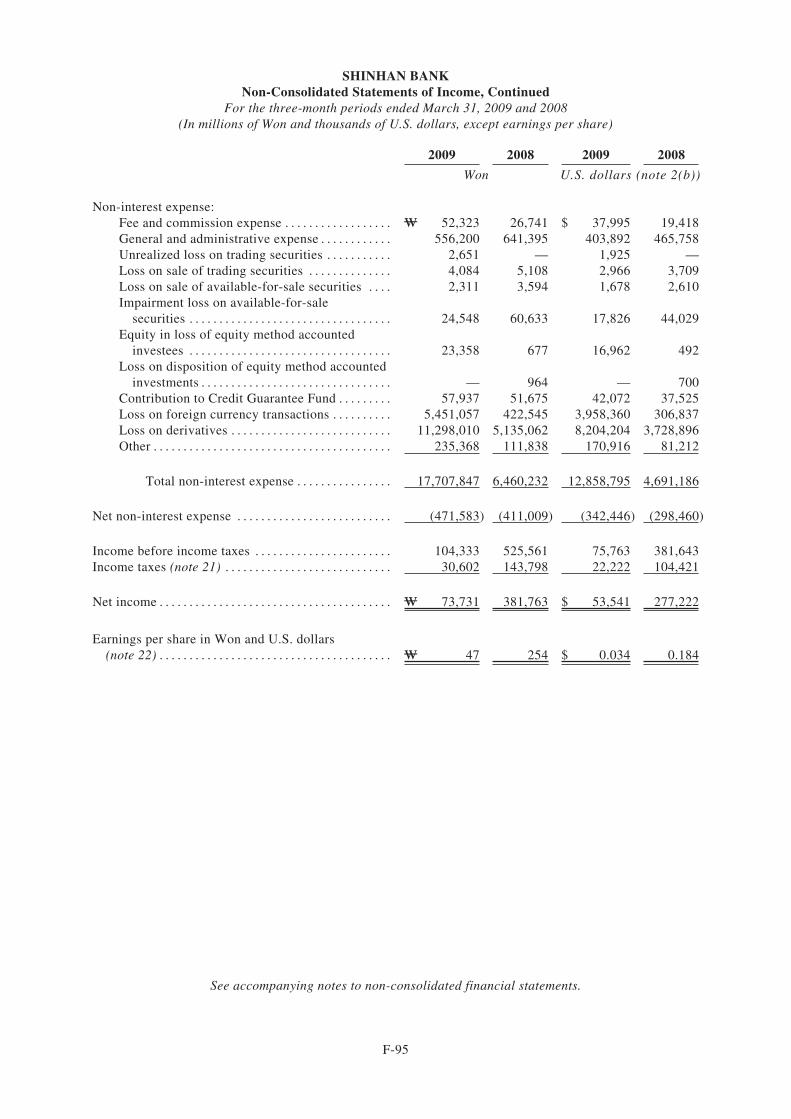
SHINHAN BANKNon-Consolidated Statements of Income, Continued
For the three-month periods ended March 31, 2009 and 2008(In millions of Won and thousands of U.S. dollars, except earnings per share)
2009 2008 2009 2008
Won U.S. dollars (note 2(b))
Non-interest expense:Fee and commission expense . . . . . . . . . . . . . . . . . . W 52,323 26,741 $ 37,995 19,418General and administrative expense . . . . . . . . . . . . 556,200 641,395 403,892 465,758Unrealized loss on trading securities . . . . . . . . . . . 2,651 — 1,925 —Loss on sale of trading securities . . . . . . . . . . . . . . 4,084 5,108 2,966 3,709Loss on sale of available-for-sale securities . . . . 2,311 3,594 1,678 2,610Impairment loss on available-for-sale
securities . . . . . . . . . . . . . . . . . . . . . . . . . . . . . . . . . . 24,548 60,633 17,826 44,029Equity in loss of equity method accounted
investees . . . . . . . . . . . . . . . . . . . . . . . . . . . . . . . . . . 23,358 677 16,962 492Loss on disposition of equity method accounted
investments . . . . . . . . . . . . . . . . . . . . . . . . . . . . . . . . — 964 — 700Contribution to Credit Guarantee Fund . . . . . . . . . 57,937 51,675 42,072 37,525Loss on foreign currency transactions . . . . . . . . . . 5,451,057 422,545 3,958,360 306,837Loss on derivatives . . . . . . . . . . . . . . . . . . . . . . . . . . . 11,298,010 5,135,062 8,204,204 3,728,896Other . . . . . . . . . . . . . . . . . . . . . . . . . . . . . . . . . . . . . . . . 235,368 111,838 170,916 81,212
Total non-interest expense . . . . . . . . . . . . . . . . 17,707,847 6,460,232 12,858,795 4,691,186
Net non-interest expense . . . . . . . . . . . . . . . . . . . . . . . . . . (471,583) (411,009) (342,446) (298,460)
Income before income taxes . . . . . . . . . . . . . . . . . . . . . . . 104,333 525,561 75,763 381,643Income taxes (note 21) . . . . . . . . . . . . . . . . . . . . . . . . . . . . 30,602 143,798 22,222 104,421
Net income . . . . . . . . . . . . . . . . . . . . . . . . . . . . . . . . . . . . . . . W 73,731 381,763 $ 53,541 277,222
Earnings per share in Won and U.S. dollars(note 22) . . . . . . . . . . . . . . . . . . . . . . . . . . . . . . . . . . . . . . . W 47 254 $ 0.034 0.184
See accompanying notes to non-consolidated financial statements.
F-95
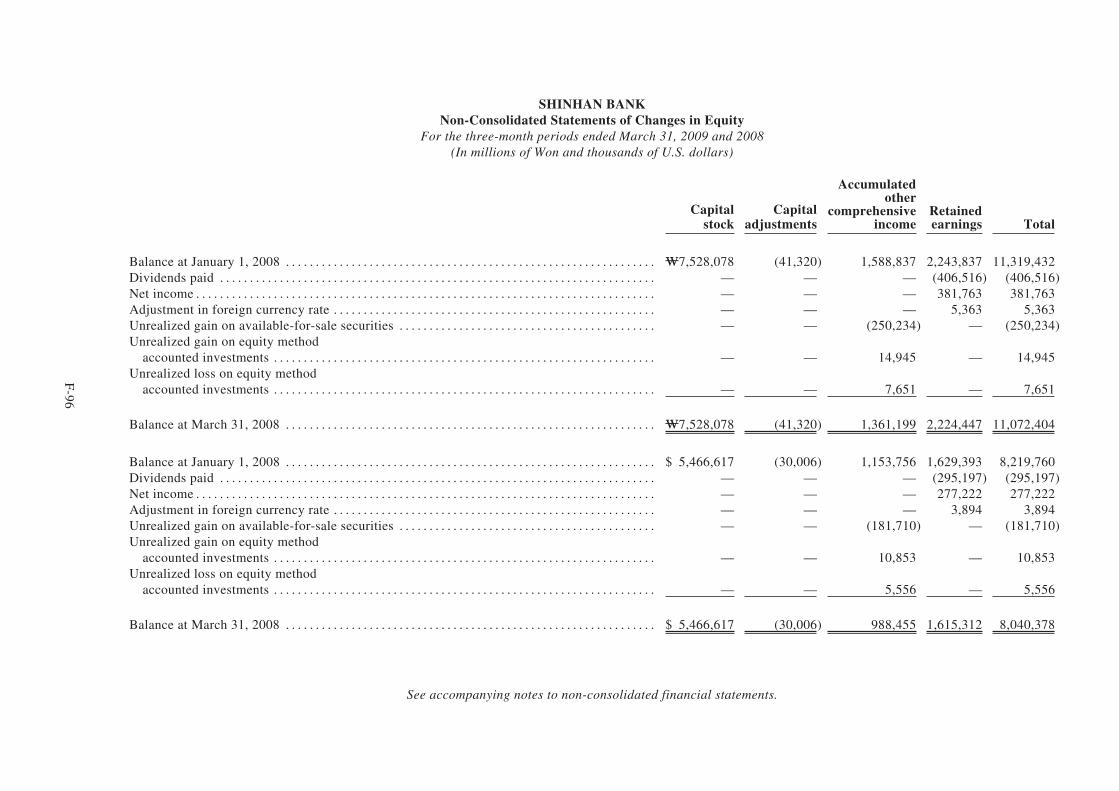
SHINHAN BANKNon-Consolidated Statements of Changes in Equity
For the three-month periods ended March 31, 2009 and 2008(In millions of Won and thousands of U.S. dollars)
Capitalstock
Capitaladjustments
Accumulatedother
comprehensiveincome
Retainedearnings Total
Balance at January 1, 2008 . . . . . . . . . . . . . . . . . . . . . . . . . . . . . . . . . . . . . . . . . . . . . . . . . . . . . . . . . . . . . . W7,528,078 (41,320) 1,588,837 2,243,837 11,319,432Dividends paid . . . . . . . . . . . . . . . . . . . . . . . . . . . . . . . . . . . . . . . . . . . . . . . . . . . . . . . . . . . . . . . . . . . . . . . . . — — — (406,516) (406,516)Net income . . . . . . . . . . . . . . . . . . . . . . . . . . . . . . . . . . . . . . . . . . . . . . . . . . . . . . . . . . . . . . . . . . . . . . . . . . . . . — — — 381,763 381,763Adjustment in foreign currency rate . . . . . . . . . . . . . . . . . . . . . . . . . . . . . . . . . . . . . . . . . . . . . . . . . . . . . . — — — 5,363 5,363Unrealized gain on available-for-sale securities . . . . . . . . . . . . . . . . . . . . . . . . . . . . . . . . . . . . . . . . . . . — — (250,234) — (250,234)Unrealized gain on equity method
accounted investments . . . . . . . . . . . . . . . . . . . . . . . . . . . . . . . . . . . . . . . . . . . . . . . . . . . . . . . . . . . . . . . . — — 14,945 — 14,945Unrealized loss on equity method
accounted investments . . . . . . . . . . . . . . . . . . . . . . . . . . . . . . . . . . . . . . . . . . . . . . . . . . . . . . . . . . . . . . . . — — 7,651 — 7,651
Balance at March 31, 2008 . . . . . . . . . . . . . . . . . . . . . . . . . . . . . . . . . . . . . . . . . . . . . . . . . . . . . . . . . . . . . . W7,528,078 (41,320) 1,361,199 2,224,447 11,072,404
Balance at January 1, 2008 . . . . . . . . . . . . . . . . . . . . . . . . . . . . . . . . . . . . . . . . . . . . . . . . . . . . . . . . . . . . . . $ 5,466,617 (30,006) 1,153,756 1,629,393 8,219,760Dividends paid . . . . . . . . . . . . . . . . . . . . . . . . . . . . . . . . . . . . . . . . . . . . . . . . . . . . . . . . . . . . . . . . . . . . . . . . . — — — (295,197) (295,197)Net income . . . . . . . . . . . . . . . . . . . . . . . . . . . . . . . . . . . . . . . . . . . . . . . . . . . . . . . . . . . . . . . . . . . . . . . . . . . . . — — — 277,222 277,222Adjustment in foreign currency rate . . . . . . . . . . . . . . . . . . . . . . . . . . . . . . . . . . . . . . . . . . . . . . . . . . . . . . — — — 3,894 3,894Unrealized gain on available-for-sale securities . . . . . . . . . . . . . . . . . . . . . . . . . . . . . . . . . . . . . . . . . . . — — (181,710) — (181,710)Unrealized gain on equity method
accounted investments . . . . . . . . . . . . . . . . . . . . . . . . . . . . . . . . . . . . . . . . . . . . . . . . . . . . . . . . . . . . . . . . — — 10,853 — 10,853Unrealized loss on equity method
accounted investments . . . . . . . . . . . . . . . . . . . . . . . . . . . . . . . . . . . . . . . . . . . . . . . . . . . . . . . . . . . . . . . . — — 5,556 — 5,556
Balance at March 31, 2008 . . . . . . . . . . . . . . . . . . . . . . . . . . . . . . . . . . . . . . . . . . . . . . . . . . . . . . . . . . . . . . $ 5,466,617 (30,006) 988,455 1,615,312 8,040,378
See accompanying notes to non-consolidated financial statements.
F-96
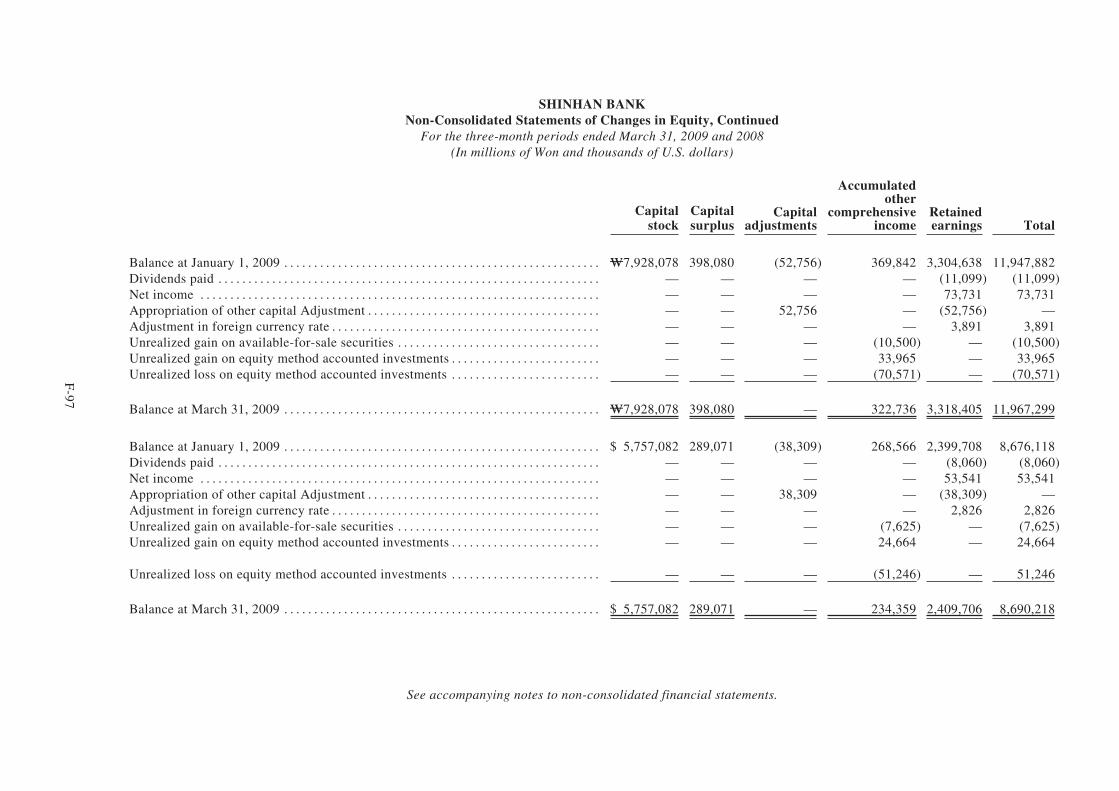
SHINHAN BANKNon-Consolidated Statements of Changes in Equity, Continued
For the three-month periods ended March 31, 2009 and 2008(In millions of Won and thousands of U.S. dollars)
Capitalstock
Capitalsurplus
Capitaladjustments
Accumulatedother
comprehensiveincome
Retainedearnings Total
Balance at January 1, 2009 . . . . . . . . . . . . . . . . . . . . . . . . . . . . . . . . . . . . . . . . . . . . . . . . . . . . . W7,928,078 398,080 (52,756) 369,842 3,304,638 11,947,882Dividends paid . . . . . . . . . . . . . . . . . . . . . . . . . . . . . . . . . . . . . . . . . . . . . . . . . . . . . . . . . . . . . . . . — — — — (11,099) (11,099)Net income . . . . . . . . . . . . . . . . . . . . . . . . . . . . . . . . . . . . . . . . . . . . . . . . . . . . . . . . . . . . . . . . . . . — — — — 73,731 73,731Appropriation of other capital Adjustment . . . . . . . . . . . . . . . . . . . . . . . . . . . . . . . . . . . . . . . — — 52,756 — (52,756) —Adjustment in foreign currency rate . . . . . . . . . . . . . . . . . . . . . . . . . . . . . . . . . . . . . . . . . . . . . — — — — 3,891 3,891Unrealized gain on available-for-sale securities . . . . . . . . . . . . . . . . . . . . . . . . . . . . . . . . . . — — — (10,500) — (10,500)Unrealized gain on equity method accounted investments . . . . . . . . . . . . . . . . . . . . . . . . . — — — 33,965 — 33,965Unrealized loss on equity method accounted investments . . . . . . . . . . . . . . . . . . . . . . . . . — — — (70,571) — (70,571)
Balance at March 31, 2009 . . . . . . . . . . . . . . . . . . . . . . . . . . . . . . . . . . . . . . . . . . . . . . . . . . . . . W7,928,078 398,080 — 322,736 3,318,405 11,967,299
Balance at January 1, 2009 . . . . . . . . . . . . . . . . . . . . . . . . . . . . . . . . . . . . . . . . . . . . . . . . . . . . . $ 5,757,082 289,071 (38,309) 268,566 2,399,708 8,676,118Dividends paid . . . . . . . . . . . . . . . . . . . . . . . . . . . . . . . . . . . . . . . . . . . . . . . . . . . . . . . . . . . . . . . . — — — — (8,060) (8,060)Net income . . . . . . . . . . . . . . . . . . . . . . . . . . . . . . . . . . . . . . . . . . . . . . . . . . . . . . . . . . . . . . . . . . . — — — — 53,541 53,541Appropriation of other capital Adjustment . . . . . . . . . . . . . . . . . . . . . . . . . . . . . . . . . . . . . . . — — 38,309 — (38,309) —Adjustment in foreign currency rate . . . . . . . . . . . . . . . . . . . . . . . . . . . . . . . . . . . . . . . . . . . . . — — — — 2,826 2,826Unrealized gain on available-for-sale securities . . . . . . . . . . . . . . . . . . . . . . . . . . . . . . . . . . — — — (7,625) — (7,625)Unrealized gain on equity method accounted investments . . . . . . . . . . . . . . . . . . . . . . . . . — — — 24,664 — 24,664
Unrealized loss on equity method accounted investments . . . . . . . . . . . . . . . . . . . . . . . . . — — — (51,246) — 51,246
Balance at March 31, 2009 . . . . . . . . . . . . . . . . . . . . . . . . . . . . . . . . . . . . . . . . . . . . . . . . . . . . . $ 5,757,082 289,071 — 234,359 2,409,706 8,690,218
See accompanying notes to non-consolidated financial statements.
F-97
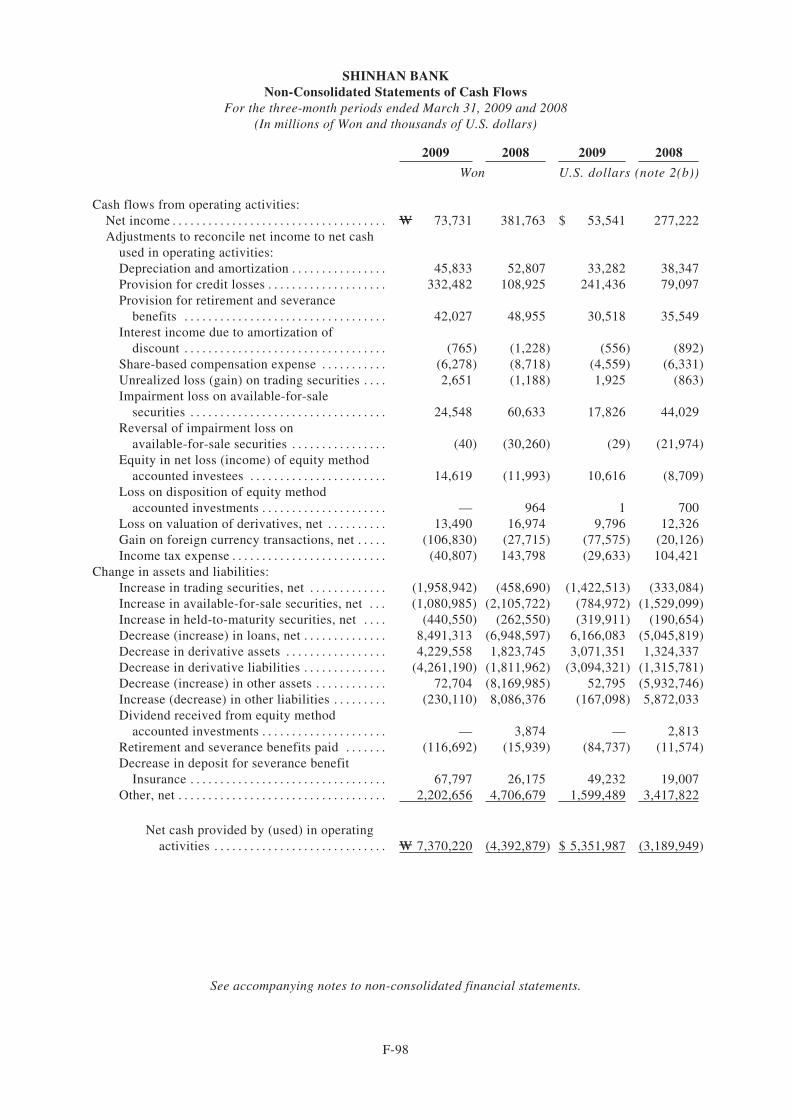
SHINHAN BANKNon-Consolidated Statements of Cash Flows
For the three-month periods ended March 31, 2009 and 2008(In millions of Won and thousands of U.S. dollars)
2009 2008 2009 2008
Won U.S. dollars (note 2(b))
Cash flows from operating activities:Net income . . . . . . . . . . . . . . . . . . . . . . . . . . . . . . . . . . . . W 73,731 381,763 $ 53,541 277,222Adjustments to reconcile net income to net cash
used in operating activities:Depreciation and amortization . . . . . . . . . . . . . . . . 45,833 52,807 33,282 38,347Provision for credit losses . . . . . . . . . . . . . . . . . . . . 332,482 108,925 241,436 79,097Provision for retirement and severance
benefits . . . . . . . . . . . . . . . . . . . . . . . . . . . . . . . . . . 42,027 48,955 30,518 35,549Interest income due to amortization of
discount . . . . . . . . . . . . . . . . . . . . . . . . . . . . . . . . . . (765) (1,228) (556) (892)Share-based compensation expense . . . . . . . . . . . (6,278) (8,718) (4,559) (6,331)Unrealized loss (gain) on trading securities . . . . 2,651 (1,188) 1,925 (863)Impairment loss on available-for-sale
securities . . . . . . . . . . . . . . . . . . . . . . . . . . . . . . . . . 24,548 60,633 17,826 44,029Reversal of impairment loss on
available-for-sale securities . . . . . . . . . . . . . . . . (40) (30,260) (29) (21,974)Equity in net loss (income) of equity method
accounted investees . . . . . . . . . . . . . . . . . . . . . . . 14,619 (11,993) 10,616 (8,709)Loss on disposition of equity method
accounted investments . . . . . . . . . . . . . . . . . . . . . — 964 1 700Loss on valuation of derivatives, net . . . . . . . . . . 13,490 16,974 9,796 12,326Gain on foreign currency transactions, net . . . . . (106,830) (27,715) (77,575) (20,126)Income tax expense . . . . . . . . . . . . . . . . . . . . . . . . . . (40,807) 143,798 (29,633) 104,421
Change in assets and liabilities:Increase in trading securities, net . . . . . . . . . . . . . (1,958,942) (458,690) (1,422,513) (333,084)Increase in available-for-sale securities, net . . . (1,080,985) (2,105,722) (784,972) (1,529,099)Increase in held-to-maturity securities, net . . . . (440,550) (262,550) (319,911) (190,654)Decrease (increase) in loans, net . . . . . . . . . . . . . . 8,491,313 (6,948,597) 6,166,083 (5,045,819)Decrease in derivative assets . . . . . . . . . . . . . . . . . 4,229,558 1,823,745 3,071,351 1,324,337Decrease in derivative liabilities . . . . . . . . . . . . . . (4,261,190) (1,811,962) (3,094,321) (1,315,781)Decrease (increase) in other assets . . . . . . . . . . . . 72,704 (8,169,985) 52,795 (5,932,746)Increase (decrease) in other liabilities . . . . . . . . . (230,110) 8,086,376 (167,098) 5,872,033Dividend received from equity method
accounted investments . . . . . . . . . . . . . . . . . . . . . — 3,874 — 2,813Retirement and severance benefits paid . . . . . . . (116,692) (15,939) (84,737) (11,574)Decrease in deposit for severance benefit
Insurance . . . . . . . . . . . . . . . . . . . . . . . . . . . . . . . . . 67,797 26,175 49,232 19,007Other, net . . . . . . . . . . . . . . . . . . . . . . . . . . . . . . . . . . . 2,202,656 4,706,679 1,599,489 3,417,822
Net cash provided by (used) in operatingactivities . . . . . . . . . . . . . . . . . . . . . . . . . . . . . W 7,370,220 (4,392,879) $ 5,351,987 (3,189,949)
See accompanying notes to non-consolidated financial statements.
F-98
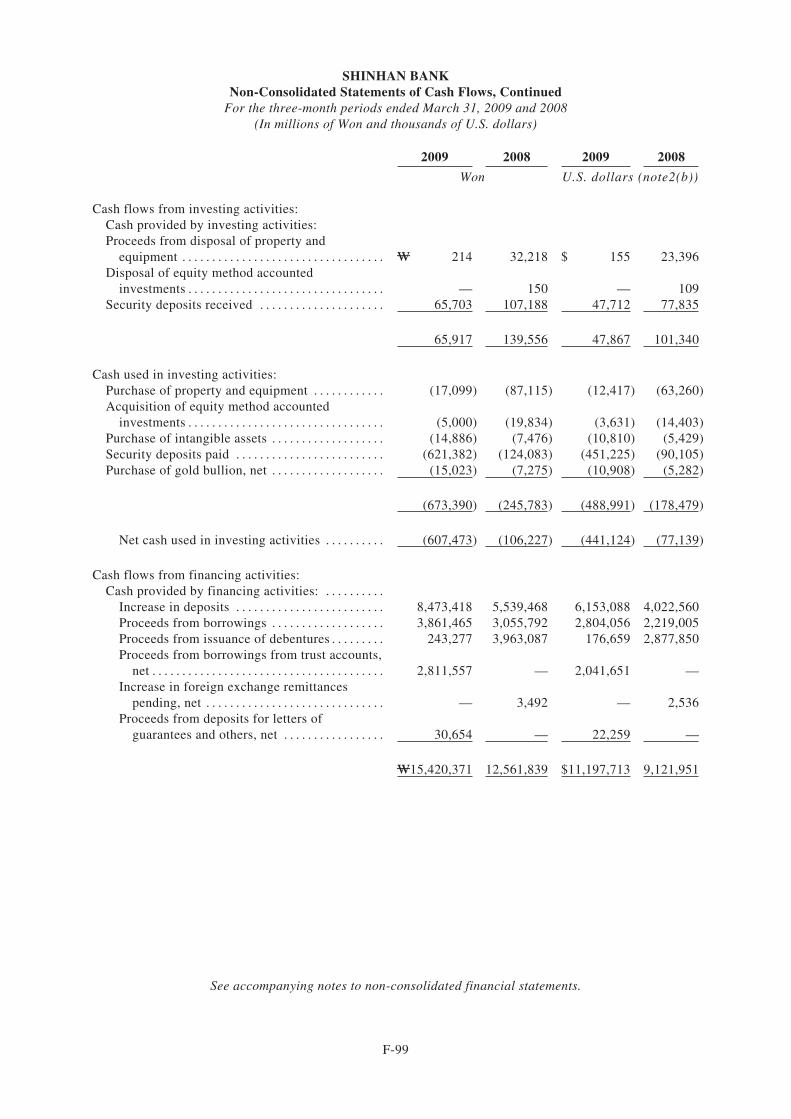
SHINHAN BANKNon-Consolidated Statements of Cash Flows, Continued
For the three-month periods ended March 31, 2009 and 2008(In millions of Won and thousands of U.S. dollars)
2009 2008 2009 2008
Won U.S. dollars (note2(b))
Cash flows from investing activities:Cash provided by investing activities:Proceeds from disposal of property and
equipment . . . . . . . . . . . . . . . . . . . . . . . . . . . . . . . . . . W 214 32,218 $ 155 23,396Disposal of equity method accounted
investments . . . . . . . . . . . . . . . . . . . . . . . . . . . . . . . . . — 150 — 109Security deposits received . . . . . . . . . . . . . . . . . . . . . 65,703 107,188 47,712 77,835
65,917 139,556 47,867 101,340
Cash used in investing activities:Purchase of property and equipment . . . . . . . . . . . . (17,099) (87,115) (12,417) (63,260)Acquisition of equity method accounted
investments . . . . . . . . . . . . . . . . . . . . . . . . . . . . . . . . . (5,000) (19,834) (3,631) (14,403)Purchase of intangible assets . . . . . . . . . . . . . . . . . . . (14,886) (7,476) (10,810) (5,429)Security deposits paid . . . . . . . . . . . . . . . . . . . . . . . . . (621,382) (124,083) (451,225) (90,105)Purchase of gold bullion, net . . . . . . . . . . . . . . . . . . . (15,023) (7,275) (10,908) (5,282)
(673,390) (245,783) (488,991) (178,479)
Net cash used in investing activities . . . . . . . . . . (607,473) (106,227) (441,124) (77,139)
Cash flows from financing activities:Cash provided by financing activities: . . . . . . . . . .
Increase in deposits . . . . . . . . . . . . . . . . . . . . . . . . . 8,473,418 5,539,468 6,153,088 4,022,560Proceeds from borrowings . . . . . . . . . . . . . . . . . . . 3,861,465 3,055,792 2,804,056 2,219,005Proceeds from issuance of debentures . . . . . . . . . 243,277 3,963,087 176,659 2,877,850Proceeds from borrowings from trust accounts,
net . . . . . . . . . . . . . . . . . . . . . . . . . . . . . . . . . . . . . . . 2,811,557 — 2,041,651 —Increase in foreign exchange remittances
pending, net . . . . . . . . . . . . . . . . . . . . . . . . . . . . . . — 3,492 — 2,536Proceeds from deposits for letters of
guarantees and others, net . . . . . . . . . . . . . . . . . 30,654 — 22,259 —
W15,420,371 12,561,839 $11,197,713 9,121,951
See accompanying notes to non-consolidated financial statements.
F-99
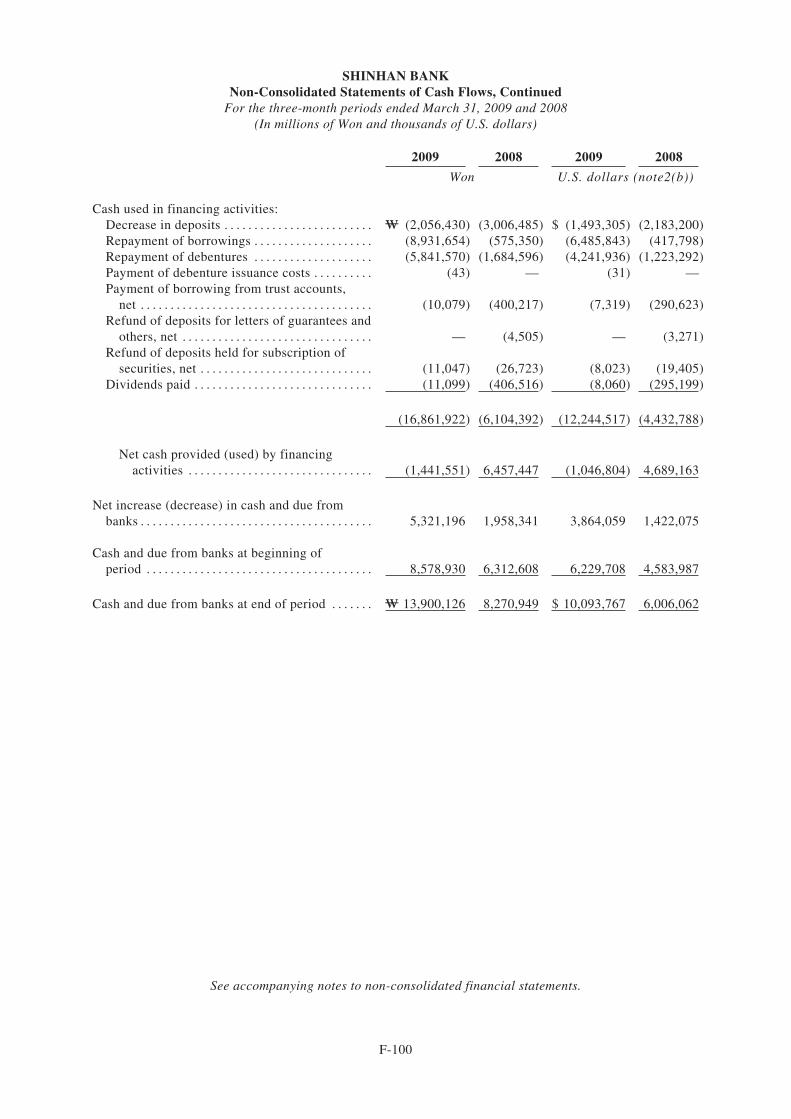
SHINHAN BANKNon-Consolidated Statements of Cash Flows, Continued
For the three-month periods ended March 31, 2009 and 2008(In millions of Won and thousands of U.S. dollars)
2009 2008 2009 2008
Won U.S. dollars (note2(b))
Cash used in financing activities:Decrease in deposits . . . . . . . . . . . . . . . . . . . . . . . . . W (2,056,430) (3,006,485) $ (1,493,305) (2,183,200)Repayment of borrowings . . . . . . . . . . . . . . . . . . . . (8,931,654) (575,350) (6,485,843) (417,798)Repayment of debentures . . . . . . . . . . . . . . . . . . . . (5,841,570) (1,684,596) (4,241,936) (1,223,292)Payment of debenture issuance costs . . . . . . . . . . (43) — (31) —Payment of borrowing from trust accounts,
net . . . . . . . . . . . . . . . . . . . . . . . . . . . . . . . . . . . . . . . (10,079) (400,217) (7,319) (290,623)Refund of deposits for letters of guarantees and
others, net . . . . . . . . . . . . . . . . . . . . . . . . . . . . . . . . — (4,505) — (3,271)Refund of deposits held for subscription of
securities, net . . . . . . . . . . . . . . . . . . . . . . . . . . . . . (11,047) (26,723) (8,023) (19,405)Dividends paid . . . . . . . . . . . . . . . . . . . . . . . . . . . . . . (11,099) (406,516) (8,060) (295,199)
(16,861,922) (6,104,392) (12,244,517) (4,432,788)
Net cash provided (used) by financingactivities . . . . . . . . . . . . . . . . . . . . . . . . . . . . . . . (1,441,551) 6,457,447 (1,046,804) 4,689,163
Net increase (decrease) in cash and due frombanks . . . . . . . . . . . . . . . . . . . . . . . . . . . . . . . . . . . . . . . 5,321,196 1,958,341 3,864,059 1,422,075
Cash and due from banks at beginning ofperiod . . . . . . . . . . . . . . . . . . . . . . . . . . . . . . . . . . . . . . 8,578,930 6,312,608 6,229,708 4,583,987
Cash and due from banks at end of period . . . . . . . W 13,900,126 8,270,949 $ 10,093,767 6,006,062
See accompanying notes to non-consolidated financial statements.
F-100
SHINHAN BANKNotes to Non-Consolidated Financial Statements
March 31, 2009(Unaudited)
(1) General Description
Shinhan Bank (the “Bank”) was established through the merger of Hansung Bank, which was established onFebruary 19, 1897, and Dongil Bank, which was established on August 8, 1906, to engage in commercialbanking and trust operations. The Bank is headquartered in 120 Bungi, Taepyeongro 2-ga, Jung-gu, Seoul,Korea.
The Bank acquired Chungbuk Bank and Kangwon Bank in 1999, and acquired the former Shinhan Bank onApril 1, 2006, and then changed the name of the Bank to Shinhan Bank. As of December 31, 2008, the Bankhas 1,585,615,506 outstanding shares with par value of W7,928,078 million and Shinhan Financial GroupCo., Ltd. owns 100% of them. As of March 31, 2009, the Bank operates through 820 domestic branches,100 depositary offices, and 10 overseas branches.
(2) Summary of Significant Accounting Policies and Basis of Presenting Financial Statements
(a) Basis of Presenting Financial Statements
The Bank maintains its accounting records in Korean Won and prepares statutory non-consolidatedfinancial statements in the Korean language in conformity with accounting principles generally accepted inthe Republic of Korea. Certain accounting principles applied by the Bank that conform with financialaccounting standards and accounting principles in the Republic of Korea may not conform with generallyaccepted accounting principles in other countries. Accordingly, these non-consolidated financial statementsare intended solely for use by those who are informed in Korean accounting principles and practices. TheEnglish non-consolidated financial statements have been condensed and restructured from the Koreanlanguage non-consolidated financial statements filed with the Financial Services Commission.
Certain information included in the Korean language non-consolidated financial statements, but notrequired for a fair presentation of the Bank's financial position, results of operations, cash flows or changesin stockholder’s equity, is not presented in the English non-consolidated financial statements.
The accompanying non-consolidated financial statements include only the accounts of the Bank, and do notinclude the accounts of any of its subsidiaries.
(b) Basis of Translating Financial Statements
The non-consolidated financial statements are expressed in Korean Won and, solely for the convenience ofthe reader, have been translated into U.S. dollars at the rate of W1,377.10 to US$1, the basic exchange rateon March 31, 2009. These translations should not be construed as a representation that any or all of theamounts shown could be converted into U.S. dollars at this or any other rates.
(c) Application of the Statements of Korean Financial Accounting Standards
The accounting policies were consistently applied for the non-consolidated financial statements both as ofand for the three-month period ended March 31, 2009 and as of and for the year ended December 31, 2008.
(d) Investments in Securities (excluding in associates, subsidiaries or interests in joint ventures)
Classification
Upon acquisition, the Bank classifies debt and equity securities (excluding investments insubsidiaries, associates and joint ventures) into the following categories: held-to-maturity,available-for-sale or trading securities. This classification is reassessed at each reporting date.
F-101
Investments in debt securities where the Bank has the positive intent and ability to hold to maturityare classified as held-to-maturity. Securities that are acquired principally for the purpose of selling inthe short term are classified as trading securities. Investments not classified as either held-to-maturityor trading securities are classified as available-for-sale securities.
Initial recognition
Investments in securities (excluding investments in subsidiaries, associates and joint ventures) areinitially recognized at cost. And equity securities and debt securities are recorded by the movingaverage method and the individual identification method, respectively.
Subsequent measurement and income recognition
Trading securities are subsequently carried at fair value. Gains and losses arising from changes in thefair value of trading securities are included in the non-consolidated income statement in the period inwhich they arise. Available-for-sale securities are subsequently carried at fair value. Gains and lossesarising from changes in the fair value of available-for-sale securities are recognized as accumulatedother comprehensive income, net of tax, directly in equity. Investments in available-for-sale securitiesthat do not have readily determinable fair values are recognized at cost less impairment, if any.Held-to-maturity investments are carried at amortized cost with interest income and expenserecognized in the non-consolidated income statement using the effective interest method.
Fair value information
The fair value of marketable securities is determined using quoted market prices as of the period end.Non-marketable equity securities are recorded at the fair value calculated by the valuation modelusing reliable data of independent professional institutes. Non-marketable debt securities are fairvalued by discounting cash flows using the prevailing market rates for debt with a similar credit riskand remaining maturity. Credit risk is determined using the issuer’s credit rating as announced byaccredited credit rating agencies in Korea. Non-marketable beneficiary certificates are recorded at thefair value using the standard trading yield rate determined by fund management companies.
Private placement fund
The invested assets of private placement fund are deposit, call loan and securities. The bankrecognizes the private placement fund as beneficiary certificate and benefit from it as interest income.
Impairment
The Bank reviews investments in securities whenever events or changes in circumstances indicate thatthe carrying amount of the investments may not be recoverable. Impairment losses are recognizedwhen the reasonably estimated recoverable amounts are less than the carrying amount and there is noclear evidence that impairment is not necessary. Impairment, if any, is recorded as a reduction in thecarrying amount of the securities and included in the non-consolidated income statement in the periodin which they arise. Recovery of impairment loss, when it is objectively related to an event occurringafter the recognition of impairment loss, is recognized as current income. However, the new carryingamount after the reversal of impairment cannot exceed the carrying value of the investment securitythat would have been measured at the date of reversal had no impairment loss been recognized.
(e) Investments in Associates and Subsidiaries
Associates are all entities of which the Bank has the ability to significantly influence the financial andoperating policies and procedures, generally through 15% to 50% of the voting rights. Subsidiaries areentities controlled by the Bank. Investments in associates and subsidiaries are accounted for using theequity method of accounting and are initially recognized at cost.
F-102
The Bank’s investments in associates and subsidiaries include goodwill identified on acquisition (net of anyaccumulated impairment loss). Goodwill is calculated as the excess of the acquisition cost of an investmentin an associate or subsidiary over the Bank’s share of the fair value of the identifiable net assets acquired.Goodwill is amortized using the straight-line method over its estimated useful life of five years.Amortization of goodwill is recorded together with equity income (losses).
When events or circumstances indicate that the carrying value of goodwill may not be recoverable, the Bankreviews goodwill for impairment and records any impairment loss immediately in the non-consolidatedincome statement.
The Bank’s share of its post-acquisition profits or losses in investments in associates and subsidiaries isrecognized in the non-consolidated income statement, and its share of post-acquisition movements in equityis recognized in equity. The cumulative post-acquisition movements are adjusted against the carryingamount of each investment. Changes in the carrying amount of an investment resulting from dividends byan associate or subsidiary are recognized when the associate or subsidiary declares the dividend. When theBank’s share of losses in an associate or subsidiary equals or exceeds its interest in the associate orsubsidiary, including preferred stock or other long term loans and receivables issued by the associate orsubsidiary, the Bank does not recognize further losses, unless it has incurred obligations or made paymentson behalf of the associate or subsidiary.
If the investee is a subsidiary, net income and net assets of the parent company’s separate financialstatements should agree with the parent company’s share in the net income and net assets of theconsolidated financial statements, except when the Bank discontinues the application of the equity methoddue to its investment in a subsidiary being reduced to zero.
Unrealized gains on transactions between the Bank and its investees are eliminated from the account ofinvestments in associates and subsidiaries to the extent of the Bank’s interest in each.
(f) Interest in Joint Ventures
Joint ventures are those operations or assets over whose activities the Bank has joint control. With respectto jointly controlled operations, the Bank includes, in its non-consolidated financial statements, the assetsthat it controls and the liabilities and expenses it has incurred, plus its share of the income from the jointoperation. For its interest in jointly controlled assets, the Bank recognizes, in the non-consolidated financialstatements, its share of the assets it jointly controls, the liabilities jointly incurred and net income, plus theliabilities and expenses it has solely incurred, if any. The Bank accounts for its interest in a jointlycontrolled entity using the equity method of accounting.
(g) Allowance for Loan Losses
In estimating the allowance for corporate and household loans including the credit card loan, the Bankrecords the greater amount than the result from the provisioning methods described below.
i) Expected Loss Method
The Bank estimates the allowance for corporate and household loan losses by applying the expectedloss method, which analyzes factors of estimated loss based on probability of default (“PD”) and lossgiven default (“LGD”). This provisionary method considers both financial and non-financial factors ofborrowers to assess PD and LGD. PD is determined by considering the type of borrowers, the natureof loans and delinquent days and LGD is determined by considering the type of loan and collateral.For PD are applied data of the past seven years for corporate loans and of five years for householdloans. For LGD are applied data of the past seventy months for corporate loans, of sixty months forhousehold loans and of one-hundred-eight months for loans secured by real estate. The allowance forloan losses is calculated by multiplying outstanding loan balance by the PD and LGD.
F-103
ii) FSS Guideline
The Bank applies the FSS guidelines for corporate and household loans. The prescribed minimumlevels of provision per the FSS guidelines are as follows,
Corporate loans Household loans
Normal (*) . . . . . . . . . . . . . . . . . . . . . . . . . . . . . . (*) 0.85% 1%Precautionary . . . . . . . . . . . . . . . . . . . . . . . . . . . . 7% 10%Substandard . . . . . . . . . . . . . . . . . . . . . . . . . . . . . 20% 20%Doubtful . . . . . . . . . . . . . . . . . . . . . . . . . . . . . . . . 50% 55%Estimated loss . . . . . . . . . . . . . . . . . . . . . . . . . . . 100% 100%
(*) 0.9% for construction, real estate and rental services, retail and wholesale, lodging and restaurant; industries susceptible tomarket
In addition, the Bank includes interbank loan, call loan, bills bought under repurchase agreement anddeposit from banks except for Bank of Korea in estimating the allowance for loan losses classified asnormal. Additionally, the Bank considers the borrower’s ability to repay and the recovery value of collateralin estimating expected loss on high-risk large volume loan balance.
Loans are charged-off if they are deemed to be uncollectible by falling under any of the followingcategories:
— Loans for which collection is not foreseeable due to insolvency or bankruptcy, dissolution or theclosure of the business by the debtor;
— Payments outstanding on unsecured consumer loans, which have been overdue for more than sixmonths; or
— The portion of loans classified as “estimated loss”, net of any recovery from collateral, which isdeemed to be uncollectible.
(h) Troubled Debt Restructuring
A loan in which the contractual terms are modified in a troubled debt restructuring program is accounted forat the present value of the expected future cash flows of the modified loan discounted at the effectiveinterest rate of the original loan. The excess of the carrying amount over the present value of expectedfuture cash flows is recorded as provision for loan losses in the current period. The present value discountsare recorded in allowance for loan losses and reflected as a deduction from the nominal value of the loans.The present value discounts are amortized using the effective interest method and recognized as interestincome.
(i) Deferred Loan Origination Fees
Certain fees associated with lending activities which meet specified criteria, are deferred and amortizedover the life of the loan as an adjustment to the carrying amount of the loan using the effective yield methodand recognized as interest income.
(j) Transfer of Assets
Transfers of financial assets to third parties are accounted for as sales when control is surrendered to thetransferee. The Bank derecognizes financial assets from the statement of financial position including anyrelated allowance, and recognizes all assets obtained, and liabilities incurred, including any recourseobligations to the transferee, at fair value. Any resulting gain or loss on the sale is recognized in earnings.Conversely, the Bank only recognizes financial assets transferred from third parties on the statement offinancial position when the Bank obtains control of financial assets.
F-104
(k) Interest Income
Interest income on bank deposits, loans and securities is recognized on an accrual basis, except for intereston loans that are past due and loans to customers who are bankrupt which are placed on non-accrual. Anyunpaid interest previously accrued on such loans is reversed from income, and thereafter interest isrecognized only to the extent payments are received. Payments on delinquent loans are first applied todelinquent interest, to normal interest, and then to the principal balance.
(l) Property and Equipment
Property and equipment are stated at cost except in the case of revaluations made in accordance with theAsset Revaluation Law which allowed for asset revaluation prior to the Law being revoked. Assets acquiredthrough investment in kind or donation, are recorded at fair value.
Significant additions or improvements extending useful lives of assets are capitalized. However, normalmaintenance and repairs are charged to expense as incurred.
Depreciation is computed by the declining-balance method using rates based on the estimated useful livesor the straight-line method over the estimated useful lives of the respective assets as follows:
Descriptions Depreciation method Useful lives
Buildings Straight-line 40~60 yearsLeasehold improvements Straight-line 5 yearsFurniture, office equipment and others Declining-balance 5 years
For property and equipment at overseas branches, the depreciation methods regulated by the respectivelocal regulatory authority are applied.
The Bank reviews property and equipment for impairment whenever events or changes in circumstancesindicate that the carrying amount of an asset may not be recoverable. An impairment loss is recognizedwhen the expected estimated undiscounted future net cash flows from the use of the asset and its eventualdisposal are less than its carrying amount. The Bank recognizes an impairment loss by reducing its carryingamount to the estimated recoverable amount.
(m) Intangible Assets
Intangible assets which mainly consist of software are stated at cost less accumulated amortization andimpairment loss, if any. Such intangible assets are amortized using the straight-line method over five years.
The Bank reviews intangible assets for impairment whenever events or changes in circumstances indicatethat the carrying amount of an asset may not be recoverable. The Bank reduces its carrying amount to therecoverable amount and the amount impaired is recognized as impairment loss.
(n) Leases
The Bank classifies and accounts for lease transactions as either an operating or capital lease, depending onthe terms of the lease. Leases where the Bank assumes substantially all the risks and rewards of ownershipare classified as capital leases. All other leases are classified as operating leases.
Substantially all the risks and rewards of ownership are evidenced when one or more of the criteria listedbelow are met:
— Ownership of the leased property will transfer to the lessee at the end of the lease term.
— The lessee has a bargain purchase option and it is reasonably certain at the inception of the lease thatthe option will be exercised.
F-105
— The lease term is equal to 75% or more of the estimated economic useful life of the leased property.
— The present value at the beginning of the lease term of the minimum lease payments equals or exceeds90% of the fair value of the leased property.
In addition, if the leased property is specialized to the extent that only the lessee can use it without anymajor modification, it would be considered a capital lease.
Otherwise, the lease is classified as an operating lease and recognized in income on a straight-line basisover the lease term.
Financing lease is recorded as the net investment in the lease asset at lease inception representing theaggregate future minimum lease payments. Lease income is recognized to approximate a level rate of returnon the net investment by using the effective yield method over the lease term.
The Bank also recognizes initial direct costs incurred in negotiating and arranging leases. Initial direct costsincurred for operating leases are initially recorded as a separate asset and expensed as fee and commissionexpense over the lease term on the same basis in which lease income is recognized. Initial direct costsincurred for financing leases are included in the net investment in the lease asset and reduces lease incomeover the lease term using the effective yield method.
(o) Bonds under Resale or Repurchase Agreements
Bonds purchased under resale agreements are recorded as loans and bonds sold under repurchaseagreements are recorded as borrowings when the Bank purchases or sells securities under resale orrepurchase agreements.
(p) Discount (Premium) on Debentures
Discount (premium) on debentures issued, which represents the difference between the face value andissuance price of debentures, is amortized (accreted) using the effective interest method over the life of thedebentures. The amount amortized (accreted) is included in interest expense.
(q) Retirement and Severance Benefits
Employees who have been with the Bank for more than one year are entitled to lump-sum payments basedon salary rates and length of service at the time they leave the Bank. The Bank's estimated liability underthe plan which would be payable if all employees left on the reporting date is accrued in the accompanyingnon-consolidated statements of financial position. A portion of the liability is covered by an employees’severance insurance where the employees have a vested interest in the deposit with the insurance companyin trust. The deposit for severance benefit insurance is, therefore, reflected in the accompanyingnon-consolidated statements of financial position as a reduction of the liability for retirement and severancebenefits.
(r) Provision and Contingent Liabilities
Provisions are recognized when all of the following are met: (1) an entity has a present obligation as a resultof a past event, (2) it is probable that an outflow of resources embodying economic benefits will be requiredto settle the obligation, and (3) a reliable estimate can be made of the amount of the obligation. Where theeffect of the time value of money is material, the amount of a provision is the present value of theexpenditures expected to be required to settle the obligation.
Where the expenditure required to settle a provision is expected to be reimbursed by another party, thereimbursement is recognized as a separate asset when, and only when, it is virtually certain thatreimbursement will be received if the Company settles the obligation. The expense generated by theprovision is presented net of the amount of expected reimbursement.
F-106
(s) Allowance for Loss on Guarantees and Acceptances
The Bank estimates allowance for losses on outstanding guarantees and acceptances, contingent guaranteesand acceptances and endorsed bills in accordance with the same loan classification criteria applied inestimating allowance for loan losses and recorded as other liabilities with the respective changes recordedas other non-interest expense.
(t) Allowance for Unused Loan Commitments
The Bank estimates the allowance for unused corporate and household loan commitments by eachclassification considering the credit conversion factor (CCF), the ratio in which the off-balance sheetcommitments are converted into outstanding amounts based on historical data. In addition, the Bank appliesthe FSS guidelines for unused corporate and household loan commitments in accordance with theRegulations for the Supervision of Banks revised at December 7, 2007 as follows: for unused corporate loancommitments a minimum of 0.85% for normal (0.9% for construction, real estate and rental services, retailand wholesale, lodging and restaurant; industries susceptible to market), 7% for precautionary, 20% forsubstandard, 50% for doubtful and 100% for estimated loss, respectively; and for unused household loancommitments a minimum of 1.0% for normal, 10% for precautionary, 20% for substandard, 55% fordoubtful and 100% for estimated loss, respectively.
The Bank records the greater amount resulting from the provisioning methods described above by eachclassification as other allowances included in other liabilities with the respective changes recorded in othernon-interest expense.
(u) Translation of Foreign Currency Denominated Assets and Liabilities
Assets and liabilities denominated in foreign currencies are translated into Korean Won at the reportingdate, with the resulting gains and losses recognized in current results of operations. Assets and liabilitiesdenominated in foreign currencies are translated into Korean Won at W1,377.10 and W1,257.50 to US$1based on the basic exchange rate and the cross exchange rates announced by the Seoul Money BrokerageServices Ltd. on March 31, 2009 and December 31, 2008, the last business day of each respective period,respectively. Non-monetary assets and liabilities denominated in foreign currencies, which are stated athistorical cost, are translated into Korean Won at the foreign exchange rate on the date of the transaction.
Foreign currency assets and liabilities of foreign-based operations and branches accounted for using theequity method are translated at the rate of exchange at the respective reporting date. Foreign currencyamounts in the non-consolidated statement of income are translated using an average rate. Translation gainsand losses arising from collective translation of the foreign currency financial statements of foreign-basedoperations are recorded net as accumulated other comprehensive income. These gains and losses aresubsequently recognized as income in the year the foreign operations or companies are liquidated or sold.
(v) Derivatives and Hedge Accounting
The Bank holds derivative financial instruments to hedge its foreign currency and interest rate riskexposures. Embedded derivatives are separated from the host contract and accounted for separately if theeconomic characteristics and risks of the host contract and the embedded derivative are not closely related,and a separate instrument with the same terms as the embedded derivative would meet the definition of aderivative.
Derivatives are initially recognized at fair value on the date on which a derivative contract is entered intoand are subsequently remeasured at their fair value. Attributable transaction costs are recognized in profit orloss when incurred.
Hedge accounting
Where a derivative, which meets certain criteria, is used for hedging the exposure to changes in thefair value of a recognized asset, liability or firm commitment, it is designated as a fair value hedge.Where a derivative, which meets certain criteria, is used for hedging the exposure to the variability ofthe future cash flows of a forecasted transaction it is designated as a cash flow hedge.
F-107
The Bank documents, at the inception of the transaction, the relationship between hedging instrumentsand hedged items, as well as its risk management objective and strategy for undertaking various hedgetransactions. The Bank documents its assessment, both at hedge inception and on a monthly basis,whether the derivatives that are used in hedging transactions are highly effective in offsetting thechanges in fair values or cash flows of hedged items.
Fair value hedge
Changes in the fair value of derivatives that are designated and qualify as fair value hedges arerecorded in the non-consolidated statement of income, together with any changes in the fair value ofthe hedged asset or liability that are attributable to the hedged risk.
Cash flow hedge
The effective portion of changes in the fair value of derivatives that are designated and qualify as cashflow hedges is recognized in equity as other comprehensive income. The gain or loss relating to anyineffective portion is recognized immediately in the earnings. Amounts accumulated in equity arerecycled to the income statement in the periods in which the hedged item will affect profit or loss.When a hedging instrument expires or is sold, or when a hedge no longer meets the criteria for hedgeaccounting, any cumulative gain or loss existing in equity at the time remains in equity and isrecognized when the forecast transaction is ultimately recognized in earnings. When a forecasttransaction is no longer expected to occur, the cumulative gain or loss that was reported in equity isimmediately transferred to the statement of income.
Derivatives that do not qualify for hedge accounting
Changes in the fair value of derivative instruments that are not designated as fair value or cash flowhedges are recognized immediately in the statement of income.
Separable embedded derivatives
Changes in the fair value of separable embedded derivatives are recognized immediately in thestatement of income.
(w) Share-Based Payment
The Bank has granted shares or share options to its employees and other parties. For equity-settled share-based payment transactions, the Bank measures the goods or services received, and the correspondingincrease in equity as a capital adjustment at the fair value of the goods or services received, unless that fairvalue cannot be estimated reliably. If the entity cannot estimate reliably the fair value of the goods orservices received, the Bank measures their value, and the corresponding increase in equity, indirectly, byreference to the fair value of the equity instruments granted. If the fair value of the equity instrumentscannot be estimated reliably at the measurement date, the Bank measures them at their intrinsic value andrecognizes the goods or services received based on the number of equity instruments that ultimately vest.For cash-settled share-based payment transactions, the Bank measures the goods or services acquired andthe liability incurred at the fair value of the liability. Until the liability is settled, the Bank remeasures thefair value of the liability at each reporting date and at the date of settlement, with changes in fair valuerecognized in profit or loss for the period.
(x) Income Taxes
Income tax on the income or loss for the year comprises current and deferred tax. Income tax is recognizedin the non-consolidated statement of income except to the extent that it relates to items recognized directlyin equity, in which case it is recognized in equity.
Current tax is the expected tax payable on the taxable income for the year, using tax rates enacted.
F-108
Deferred tax is provided using the asset and liability method, providing for temporary differences betweenthe carrying amounts of assets and liabilities for financial reporting purposes and the amounts used for taxpurposes. The amount of deferred tax provided is based on the expected manner of realization or settlementof the carrying amount of assets and liabilities, using tax rates enacted or substantively enacted at thereporting date.
A deferred tax asset is recognized only to the extent that it is probable that future taxable income will beavailable against which the unused tax losses and credits can be utilized. Deferred tax assets are reduced tothe extent that it is no longer probable that the related tax benefit will be realized.
Deferred tax assets and liabilities are classified as current or non-current based on the classification of therelated asset or liability for financial reporting or the expected reversal date of the temporary difference forthose with no related asset or liability such as loss carry forwards and tax credit carry forwards. Thedeferred tax amounts are presented as a net current asset or liability and a net non-current asset or liability.
Changes in deferred taxes due to a change in the tax rate except for those related to items initiallyrecognized outside profit or loss (either in other comprehensive income or directly in equity) are recognizedas income in the current year.
(y) Valuation of Receivables and Payables at Present Value
Receivables and payables from long-term cash loans/borrowings and other similar transactions are stated atpresent value. The difference between the nominal value and present value of these receivables or payablesis amortized using the effective interest method. The amount amortized is included in interest expense orinterest income.
(z) Accounting for Trust Accounts
The Bank accounts for trust accounts separately from its bank accounts under the Trust Business Act andthus are not included in the accompanying non-consolidated financial statements. Funds transferred betweena bank account and a trust account are recognized as borrowings from trust accounts in other liabilities withfees for managing the accounts recognized as non-interest income by the Bank. Furthermore, the Bankrecognizes as loss in other non-interest expense any excess amount of the guaranteed principal and earningsover the sum of trust fee income and a special provision which consist of up to 25% of total trust fees or 5%of certain trust accounts.
(aa) Cash Management Account (“CMA”)
The Bank recognizes income from CMA investments consisting of highly liquid investments and expensefrom CMA deposits as other interest income and other interest expense, respectively.
(ab) Use of Estimates
The preparation of non-consolidated financial statements in accordance with accounting principlesgenerally accepted in the Republic of Korea requires management to make estimates and assumptions thataffect the amounts reported in the non-consolidated financial statements and related notes to thenon-consolidated financial statements. Actual results could differ from those estimates.
F-109
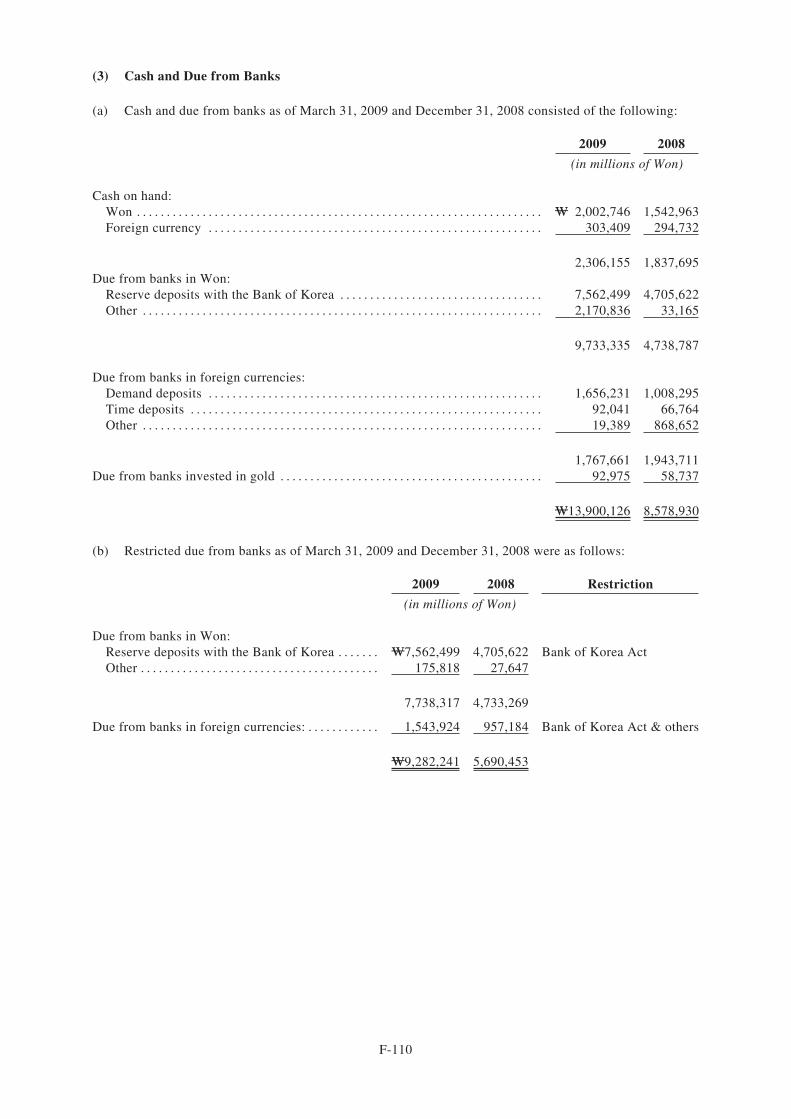
(3) Cash and Due from Banks
(a) Cash and due from banks as of March 31, 2009 and December 31, 2008 consisted of the following:
2009 2008
(in millions of Won)
Cash on hand:Won . . . . . . . . . . . . . . . . . . . . . . . . . . . . . . . . . . . . . . . . . . . . . . . . . . . . . . . . . . . . . . . . . . . . W 2,002,746 1,542,963Foreign currency . . . . . . . . . . . . . . . . . . . . . . . . . . . . . . . . . . . . . . . . . . . . . . . . . . . . . . . . 303,409 294,732
2,306,155 1,837,695Due from banks in Won:
Reserve deposits with the Bank of Korea . . . . . . . . . . . . . . . . . . . . . . . . . . . . . . . . . . 7,562,499 4,705,622Other . . . . . . . . . . . . . . . . . . . . . . . . . . . . . . . . . . . . . . . . . . . . . . . . . . . . . . . . . . . . . . . . . . . 2,170,836 33,165
9,733,335 4,738,787
Due from banks in foreign currencies:Demand deposits . . . . . . . . . . . . . . . . . . . . . . . . . . . . . . . . . . . . . . . . . . . . . . . . . . . . . . . . 1,656,231 1,008,295Time deposits . . . . . . . . . . . . . . . . . . . . . . . . . . . . . . . . . . . . . . . . . . . . . . . . . . . . . . . . . . . 92,041 66,764Other . . . . . . . . . . . . . . . . . . . . . . . . . . . . . . . . . . . . . . . . . . . . . . . . . . . . . . . . . . . . . . . . . . . 19,389 868,652
1,767,661 1,943,711Due from banks invested in gold . . . . . . . . . . . . . . . . . . . . . . . . . . . . . . . . . . . . . . . . . . . . 92,975 58,737
W13,900,126 8,578,930
(b) Restricted due from banks as of March 31, 2009 and December 31, 2008 were as follows:
2009 2008 Restriction
(in millions of Won)
Due from banks in Won:Reserve deposits with the Bank of Korea . . . . . . . W7,562,499 4,705,622 Bank of Korea ActOther . . . . . . . . . . . . . . . . . . . . . . . . . . . . . . . . . . . . . . . . 175,818 27,647
7,738,317 4,733,269
Due from banks in foreign currencies: . . . . . . . . . . . . 1,543,924 957,184 Bank of Korea Act & others
W9,282,241 5,690,453
F-110
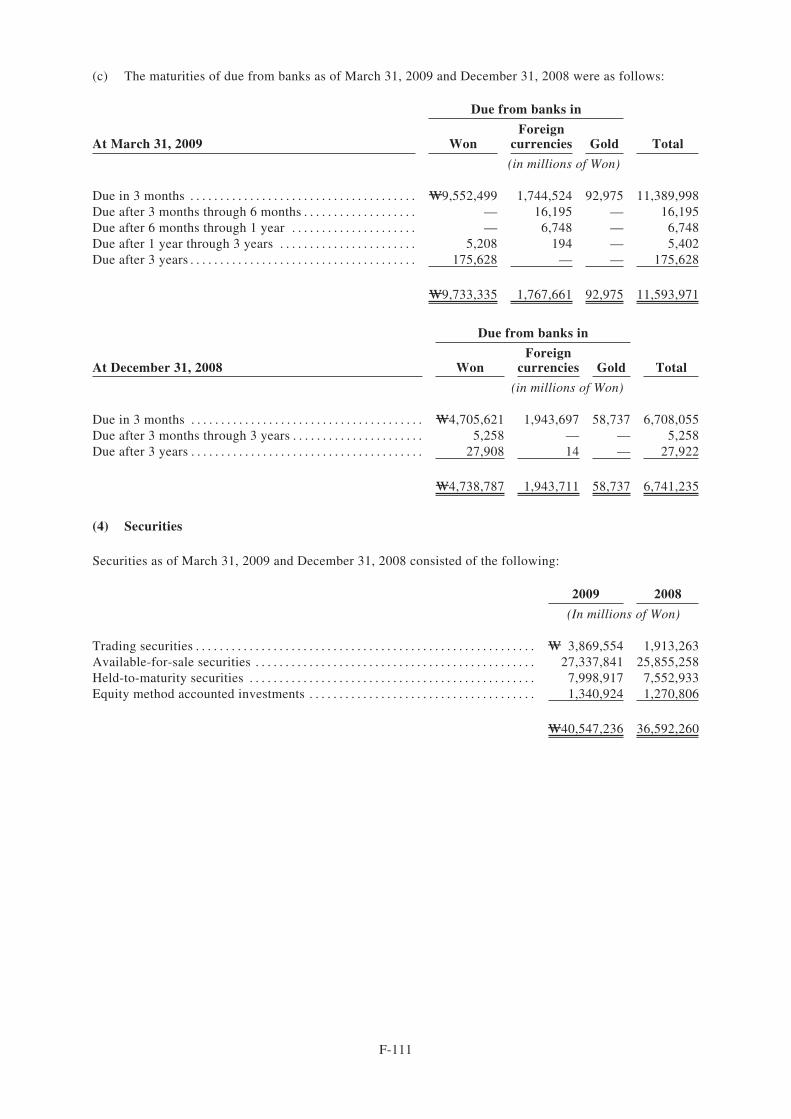
(c) The maturities of due from banks as of March 31, 2009 and December 31, 2008 were as follows:
At March 31, 2009
Due from banks in
TotalWonForeign
currencies Gold
(in millions of Won)
Due in 3 months . . . . . . . . . . . . . . . . . . . . . . . . . . . . . . . . . . . . . . W9,552,499 1,744,524 92,975 11,389,998Due after 3 months through 6 months . . . . . . . . . . . . . . . . . . . — 16,195 — 16,195Due after 6 months through 1 year . . . . . . . . . . . . . . . . . . . . . — 6,748 — 6,748Due after 1 year through 3 years . . . . . . . . . . . . . . . . . . . . . . . 5,208 194 — 5,402Due after 3 years . . . . . . . . . . . . . . . . . . . . . . . . . . . . . . . . . . . . . . 175,628 — — 175,628
W9,733,335 1,767,661 92,975 11,593,971
At December 31, 2008
Due from banks in
TotalWonForeign
currencies Gold
(in millions of Won)
Due in 3 months . . . . . . . . . . . . . . . . . . . . . . . . . . . . . . . . . . . . . . . W4,705,621 1,943,697 58,737 6,708,055Due after 3 months through 3 years . . . . . . . . . . . . . . . . . . . . . . 5,258 — — 5,258Due after 3 years . . . . . . . . . . . . . . . . . . . . . . . . . . . . . . . . . . . . . . . 27,908 14 — 27,922
W4,738,787 1,943,711 58,737 6,741,235
(4) Securities
Securities as of March 31, 2009 and December 31, 2008 consisted of the following:
2009 2008
(In millions of Won)
Trading securities . . . . . . . . . . . . . . . . . . . . . . . . . . . . . . . . . . . . . . . . . . . . . . . . . . . . . . . . . W 3,869,554 1,913,263Available-for-sale securities . . . . . . . . . . . . . . . . . . . . . . . . . . . . . . . . . . . . . . . . . . . . . . . 27,337,841 25,855,258Held-to-maturity securities . . . . . . . . . . . . . . . . . . . . . . . . . . . . . . . . . . . . . . . . . . . . . . . . 7,998,917 7,552,933Equity method accounted investments . . . . . . . . . . . . . . . . . . . . . . . . . . . . . . . . . . . . . . 1,340,924 1,270,806
W40,547,236 36,592,260
F-111
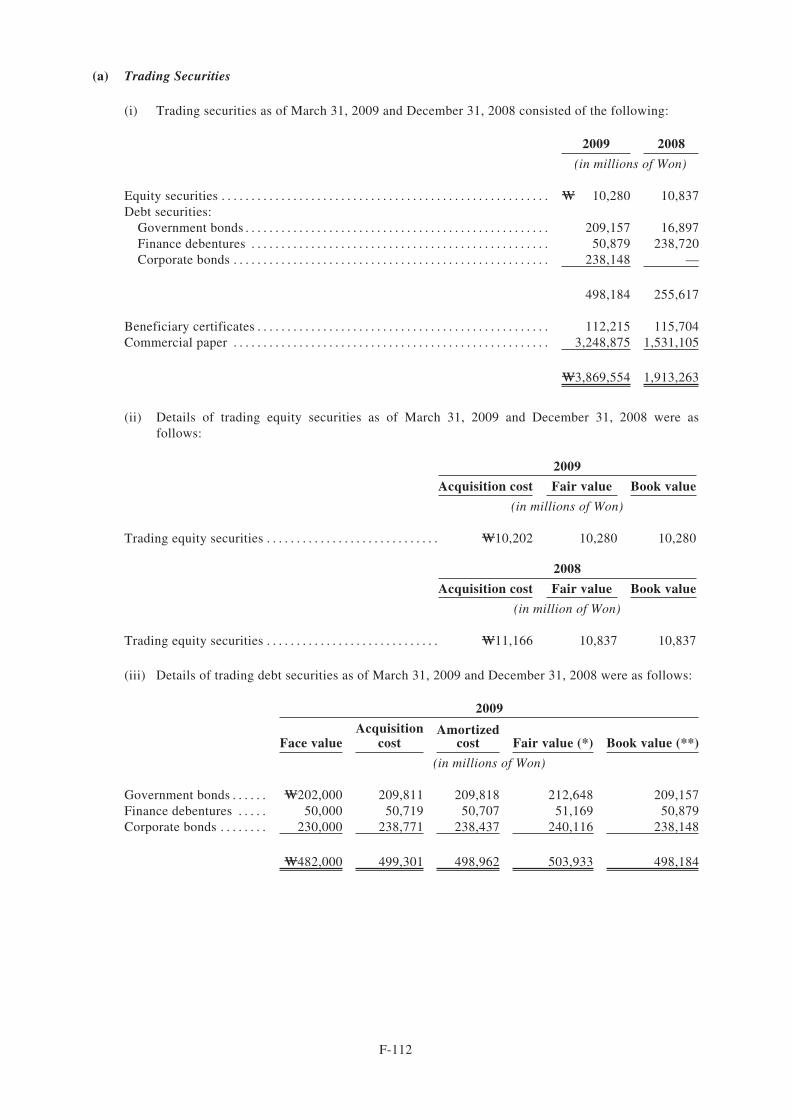
(a) Trading Securities
(i) Trading securities as of March 31, 2009 and December 31, 2008 consisted of the following:
2009 2008
(in millions of Won)
Equity securities . . . . . . . . . . . . . . . . . . . . . . . . . . . . . . . . . . . . . . . . . . . . . . . . . . . . . . . W 10,280 10,837Debt securities:
Government bonds . . . . . . . . . . . . . . . . . . . . . . . . . . . . . . . . . . . . . . . . . . . . . . . . . . . 209,157 16,897Finance debentures . . . . . . . . . . . . . . . . . . . . . . . . . . . . . . . . . . . . . . . . . . . . . . . . . . 50,879 238,720Corporate bonds . . . . . . . . . . . . . . . . . . . . . . . . . . . . . . . . . . . . . . . . . . . . . . . . . . . . . 238,148 —
498,184 255,617
Beneficiary certificates . . . . . . . . . . . . . . . . . . . . . . . . . . . . . . . . . . . . . . . . . . . . . . . . . 112,215 115,704Commercial paper . . . . . . . . . . . . . . . . . . . . . . . . . . . . . . . . . . . . . . . . . . . . . . . . . . . . . 3,248,875 1,531,105
W3,869,554 1,913,263
(ii) Details of trading equity securities as of March 31, 2009 and December 31, 2008 were asfollows:
2009
Acquisition cost Fair value Book value
(in millions of Won)
Trading equity securities . . . . . . . . . . . . . . . . . . . . . . . . . . . . . W10,202 10,280 10,280
2008
Acquisition cost Fair value Book value
(in million of Won)
Trading equity securities . . . . . . . . . . . . . . . . . . . . . . . . . . . . . W11,166 10,837 10,837
(iii) Details of trading debt securities as of March 31, 2009 and December 31, 2008 were as follows:
2009
Face valueAcquisition
costAmortized
cost Fair value (*) Book value (**)
(in millions of Won)
Government bonds . . . . . . W202,000 209,811 209,818 212,648 209,157Finance debentures . . . . . 50,000 50,719 50,707 51,169 50,879Corporate bonds . . . . . . . . 230,000 238,771 238,437 240,116 238,148
W482,000 499,301 498,962 503,933 498,184
F-112
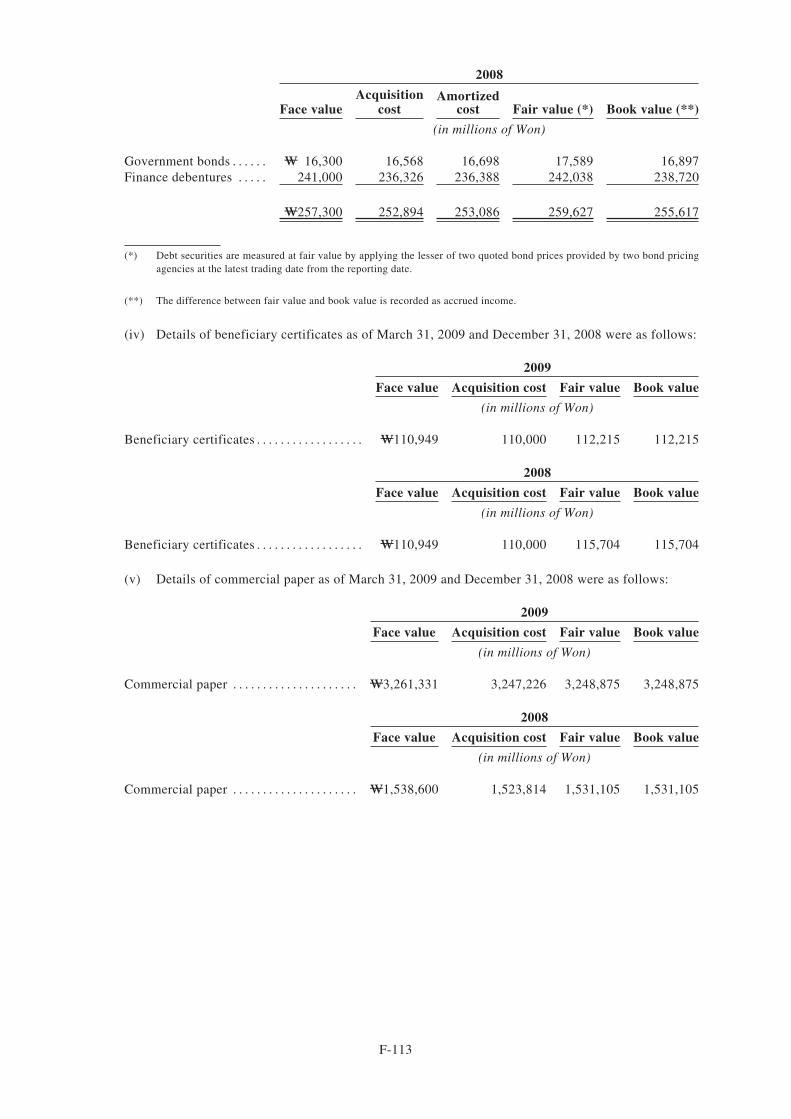
2008
Face valueAcquisition
costAmortized
cost Fair value (*) Book value (**)
(in millions of Won)
Government bonds . . . . . . W 16,300 16,568 16,698 17,589 16,897Finance debentures . . . . . 241,000 236,326 236,388 242,038 238,720
W257,300 252,894 253,086 259,627 255,617
(*) Debt securities are measured at fair value by applying the lesser of two quoted bond prices provided by two bond pricingagencies at the latest trading date from the reporting date.
(**) The difference between fair value and book value is recorded as accrued income.
(iv) Details of beneficiary certificates as of March 31, 2009 and December 31, 2008 were as follows:
2009
Face value Acquisition cost Fair value Book value
(in millions of Won)
Beneficiary certificates . . . . . . . . . . . . . . . . . . W110,949 110,000 112,215 112,215
2008
Face value Acquisition cost Fair value Book value
(in millions of Won)
Beneficiary certificates . . . . . . . . . . . . . . . . . . W110,949 110,000 115,704 115,704
(v) Details of commercial paper as of March 31, 2009 and December 31, 2008 were as follows:
2009
Face value Acquisition cost Fair value Book value
(in millions of Won)
Commercial paper . . . . . . . . . . . . . . . . . . . . . W3,261,331 3,247,226 3,248,875 3,248,875
2008
Face value Acquisition cost Fair value Book value
(in millions of Won)
Commercial paper . . . . . . . . . . . . . . . . . . . . . W1,538,600 1,523,814 1,531,105 1,531,105
F-113
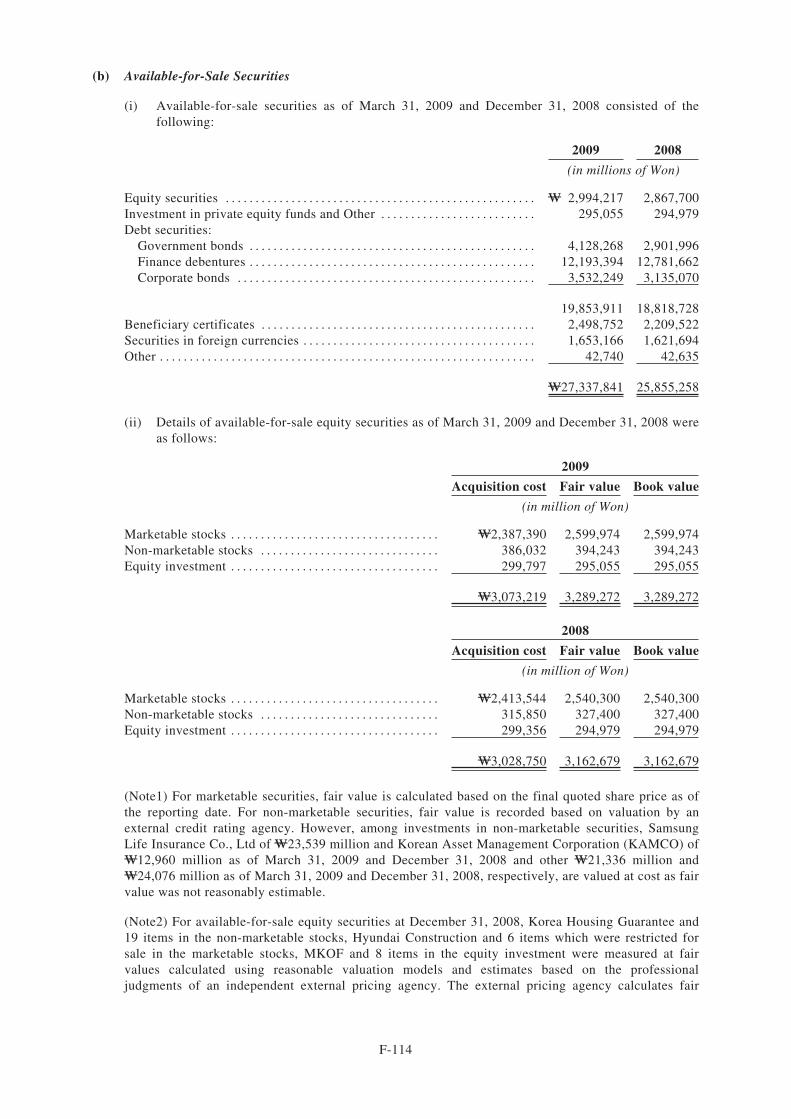
(b) Available-for-Sale Securities
(i) Available-for-sale securities as of March 31, 2009 and December 31, 2008 consisted of thefollowing:
2009 2008
(in millions of Won)
Equity securities . . . . . . . . . . . . . . . . . . . . . . . . . . . . . . . . . . . . . . . . . . . . . . . . . . . . W 2,994,217 2,867,700Investment in private equity funds and Other . . . . . . . . . . . . . . . . . . . . . . . . . . 295,055 294,979Debt securities:
Government bonds . . . . . . . . . . . . . . . . . . . . . . . . . . . . . . . . . . . . . . . . . . . . . . . . 4,128,268 2,901,996Finance debentures . . . . . . . . . . . . . . . . . . . . . . . . . . . . . . . . . . . . . . . . . . . . . . . . 12,193,394 12,781,662Corporate bonds . . . . . . . . . . . . . . . . . . . . . . . . . . . . . . . . . . . . . . . . . . . . . . . . . . 3,532,249 3,135,070
19,853,911 18,818,728Beneficiary certificates . . . . . . . . . . . . . . . . . . . . . . . . . . . . . . . . . . . . . . . . . . . . . . 2,498,752 2,209,522Securities in foreign currencies . . . . . . . . . . . . . . . . . . . . . . . . . . . . . . . . . . . . . . . 1,653,166 1,621,694Other . . . . . . . . . . . . . . . . . . . . . . . . . . . . . . . . . . . . . . . . . . . . . . . . . . . . . . . . . . . . . . . 42,740 42,635
W27,337,841 25,855,258
(ii) Details of available-for-sale equity securities as of March 31, 2009 and December 31, 2008 wereas follows:
2009
Acquisition cost Fair value Book value
(in million of Won)
Marketable stocks . . . . . . . . . . . . . . . . . . . . . . . . . . . . . . . . . . . W2,387,390 2,599,974 2,599,974Non-marketable stocks . . . . . . . . . . . . . . . . . . . . . . . . . . . . . . 386,032 394,243 394,243Equity investment . . . . . . . . . . . . . . . . . . . . . . . . . . . . . . . . . . . 299,797 295,055 295,055
W3,073,219 3,289,272 3,289,272
2008
Acquisition cost Fair value Book value
(in million of Won)
Marketable stocks . . . . . . . . . . . . . . . . . . . . . . . . . . . . . . . . . . . W2,413,544 2,540,300 2,540,300Non-marketable stocks . . . . . . . . . . . . . . . . . . . . . . . . . . . . . . 315,850 327,400 327,400Equity investment . . . . . . . . . . . . . . . . . . . . . . . . . . . . . . . . . . . 299,356 294,979 294,979
W3,028,750 3,162,679 3,162,679
(Note1) For marketable securities, fair value is calculated based on the final quoted share price as ofthe reporting date. For non-marketable securities, fair value is recorded based on valuation by anexternal credit rating agency. However, among investments in non-marketable securities, SamsungLife Insurance Co., Ltd of W23,539 million and Korean Asset Management Corporation (KAMCO) ofW12,960 million as of March 31, 2009 and December 31, 2008 and other W21,336 million andW24,076 million as of March 31, 2009 and December 31, 2008, respectively, are valued at cost as fairvalue was not reasonably estimable.
(Note2) For available-for-sale equity securities at December 31, 2008, Korea Housing Guarantee and19 items in the non-marketable stocks, Hyundai Construction and 6 items which were restricted forsale in the marketable stocks, MKOF and 8 items in the equity investment were measured at fairvalues calculated using reasonable valuation models and estimates based on the professionaljudgments of an independent external pricing agency. The external pricing agency calculates fair
F-114
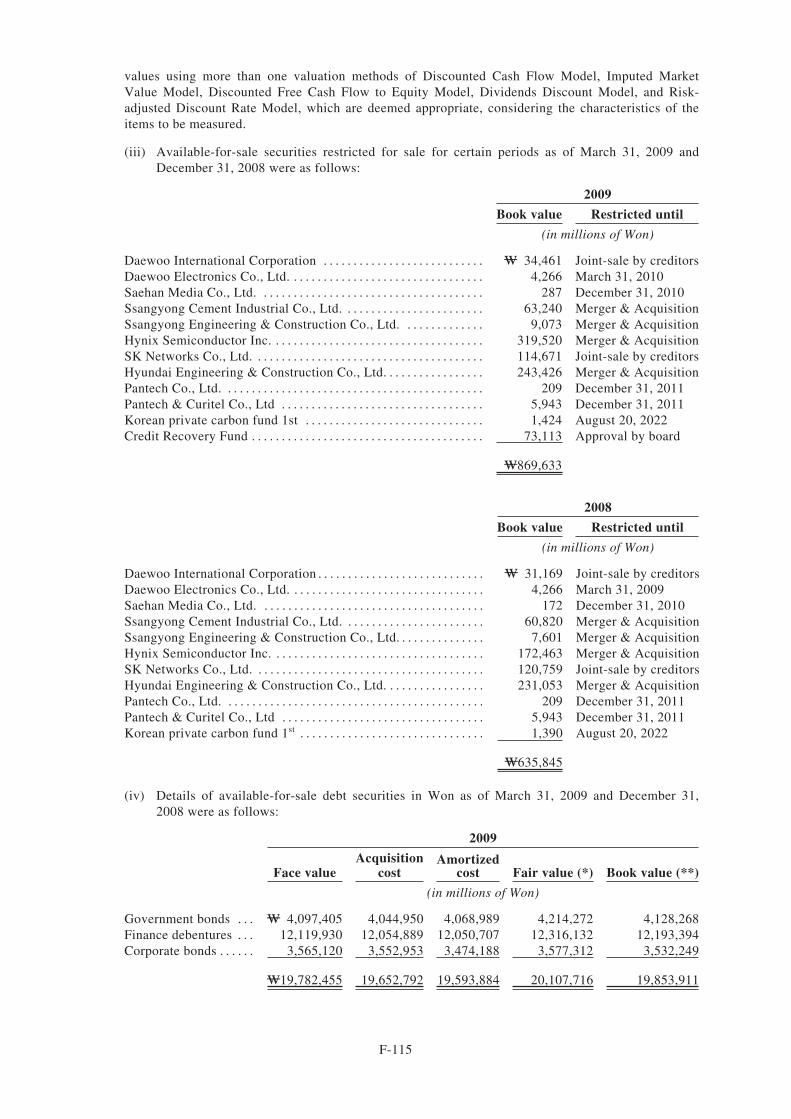
values using more than one valuation methods of Discounted Cash Flow Model, Imputed MarketValue Model, Discounted Free Cash Flow to Equity Model, Dividends Discount Model, and Risk-adjusted Discount Rate Model, which are deemed appropriate, considering the characteristics of theitems to be measured.
(iii) Available-for-sale securities restricted for sale for certain periods as of March 31, 2009 andDecember 31, 2008 were as follows:
2009
Book value Restricted until
(in millions of Won)
Daewoo International Corporation . . . . . . . . . . . . . . . . . . . . . . . . . . . W 34,461 Joint-sale by creditorsDaewoo Electronics Co., Ltd. . . . . . . . . . . . . . . . . . . . . . . . . . . . . . . . . 4,266 March 31, 2010Saehan Media Co., Ltd. . . . . . . . . . . . . . . . . . . . . . . . . . . . . . . . . . . . . . 287 December 31, 2010Ssangyong Cement Industrial Co., Ltd. . . . . . . . . . . . . . . . . . . . . . . . 63,240 Merger & AcquisitionSsangyong Engineering & Construction Co., Ltd. . . . . . . . . . . . . . 9,073 Merger & AcquisitionHynix Semiconductor Inc. . . . . . . . . . . . . . . . . . . . . . . . . . . . . . . . . . . . 319,520 Merger & AcquisitionSK Networks Co., Ltd. . . . . . . . . . . . . . . . . . . . . . . . . . . . . . . . . . . . . . . 114,671 Joint-sale by creditorsHyundai Engineering & Construction Co., Ltd. . . . . . . . . . . . . . . . . 243,426 Merger & AcquisitionPantech Co., Ltd. . . . . . . . . . . . . . . . . . . . . . . . . . . . . . . . . . . . . . . . . . . . 209 December 31, 2011Pantech & Curitel Co., Ltd . . . . . . . . . . . . . . . . . . . . . . . . . . . . . . . . . . 5,943 December 31, 2011Korean private carbon fund 1st . . . . . . . . . . . . . . . . . . . . . . . . . . . . . . 1,424 August 20, 2022Credit Recovery Fund . . . . . . . . . . . . . . . . . . . . . . . . . . . . . . . . . . . . . . . 73,113 Approval by board
W869,633
2008
Book value Restricted until
(in millions of Won)
Daewoo International Corporation . . . . . . . . . . . . . . . . . . . . . . . . . . . . W 31,169 Joint-sale by creditorsDaewoo Electronics Co., Ltd. . . . . . . . . . . . . . . . . . . . . . . . . . . . . . . . . 4,266 March 31, 2009Saehan Media Co., Ltd. . . . . . . . . . . . . . . . . . . . . . . . . . . . . . . . . . . . . . 172 December 31, 2010Ssangyong Cement Industrial Co., Ltd. . . . . . . . . . . . . . . . . . . . . . . . 60,820 Merger & AcquisitionSsangyong Engineering & Construction Co., Ltd. . . . . . . . . . . . . . . 7,601 Merger & AcquisitionHynix Semiconductor Inc. . . . . . . . . . . . . . . . . . . . . . . . . . . . . . . . . . . . 172,463 Merger & AcquisitionSK Networks Co., Ltd. . . . . . . . . . . . . . . . . . . . . . . . . . . . . . . . . . . . . . . 120,759 Joint-sale by creditorsHyundai Engineering & Construction Co., Ltd. . . . . . . . . . . . . . . . . 231,053 Merger & AcquisitionPantech Co., Ltd. . . . . . . . . . . . . . . . . . . . . . . . . . . . . . . . . . . . . . . . . . . . 209 December 31, 2011Pantech & Curitel Co., Ltd . . . . . . . . . . . . . . . . . . . . . . . . . . . . . . . . . . 5,943 December 31, 2011Korean private carbon fund 1st . . . . . . . . . . . . . . . . . . . . . . . . . . . . . . . 1,390 August 20, 2022
W635,845
(iv) Details of available-for-sale debt securities in Won as of March 31, 2009 and December 31,2008 were as follows:
2009
Face valueAcquisition
costAmortized
cost Fair value (*) Book value (**)
(in millions of Won)
Government bonds . . . W 4,097,405 4,044,950 4,068,989 4,214,272 4,128,268Finance debentures . . . 12,119,930 12,054,889 12,050,707 12,316,132 12,193,394Corporate bonds . . . . . . 3,565,120 3,552,953 3,474,188 3,577,312 3,532,249
W19,782,455 19,652,792 19,593,884 20,107,716 19,853,911
F-115
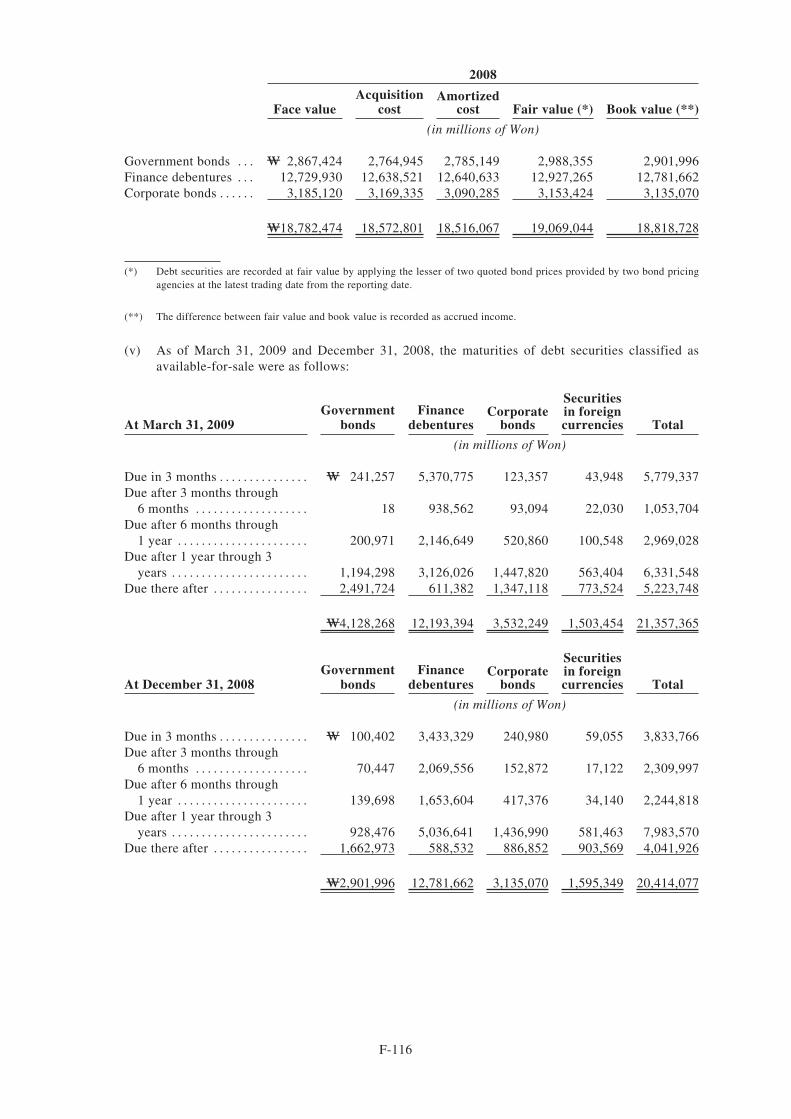
2008
Face valueAcquisition
costAmortized
cost Fair value (*) Book value (**)
(in millions of Won)
Government bonds . . . W 2,867,424 2,764,945 2,785,149 2,988,355 2,901,996Finance debentures . . . 12,729,930 12,638,521 12,640,633 12,927,265 12,781,662Corporate bonds . . . . . . 3,185,120 3,169,335 3,090,285 3,153,424 3,135,070
W18,782,474 18,572,801 18,516,067 19,069,044 18,818,728
(*) Debt securities are recorded at fair value by applying the lesser of two quoted bond prices provided by two bond pricingagencies at the latest trading date from the reporting date.
(**) The difference between fair value and book value is recorded as accrued income.
(v) As of March 31, 2009 and December 31, 2008, the maturities of debt securities classified asavailable-for-sale were as follows:
At March 31, 2009Government
bondsFinance
debenturesCorporate
bonds
Securitiesin foreigncurrencies Total
(in millions of Won)
Due in 3 months . . . . . . . . . . . . . . . W 241,257 5,370,775 123,357 43,948 5,779,337Due after 3 months through
6 months . . . . . . . . . . . . . . . . . . . 18 938,562 93,094 22,030 1,053,704Due after 6 months through
1 year . . . . . . . . . . . . . . . . . . . . . . 200,971 2,146,649 520,860 100,548 2,969,028Due after 1 year through 3
years . . . . . . . . . . . . . . . . . . . . . . . 1,194,298 3,126,026 1,447,820 563,404 6,331,548Due there after . . . . . . . . . . . . . . . . 2,491,724 611,382 1,347,118 773,524 5,223,748
W4,128,268 12,193,394 3,532,249 1,503,454 21,357,365
At December 31, 2008Government
bondsFinance
debenturesCorporate
bonds
Securitiesin foreigncurrencies Total
(in millions of Won)
Due in 3 months . . . . . . . . . . . . . . . W 100,402 3,433,329 240,980 59,055 3,833,766Due after 3 months through
6 months . . . . . . . . . . . . . . . . . . . 70,447 2,069,556 152,872 17,122 2,309,997Due after 6 months through
1 year . . . . . . . . . . . . . . . . . . . . . . 139,698 1,653,604 417,376 34,140 2,244,818Due after 1 year through 3
years . . . . . . . . . . . . . . . . . . . . . . . 928,476 5,036,641 1,436,990 581,463 7,983,570Due there after . . . . . . . . . . . . . . . . 1,662,973 588,532 886,852 903,569 4,041,926
W2,901,996 12,781,662 3,135,070 1,595,349 20,414,077
F-116
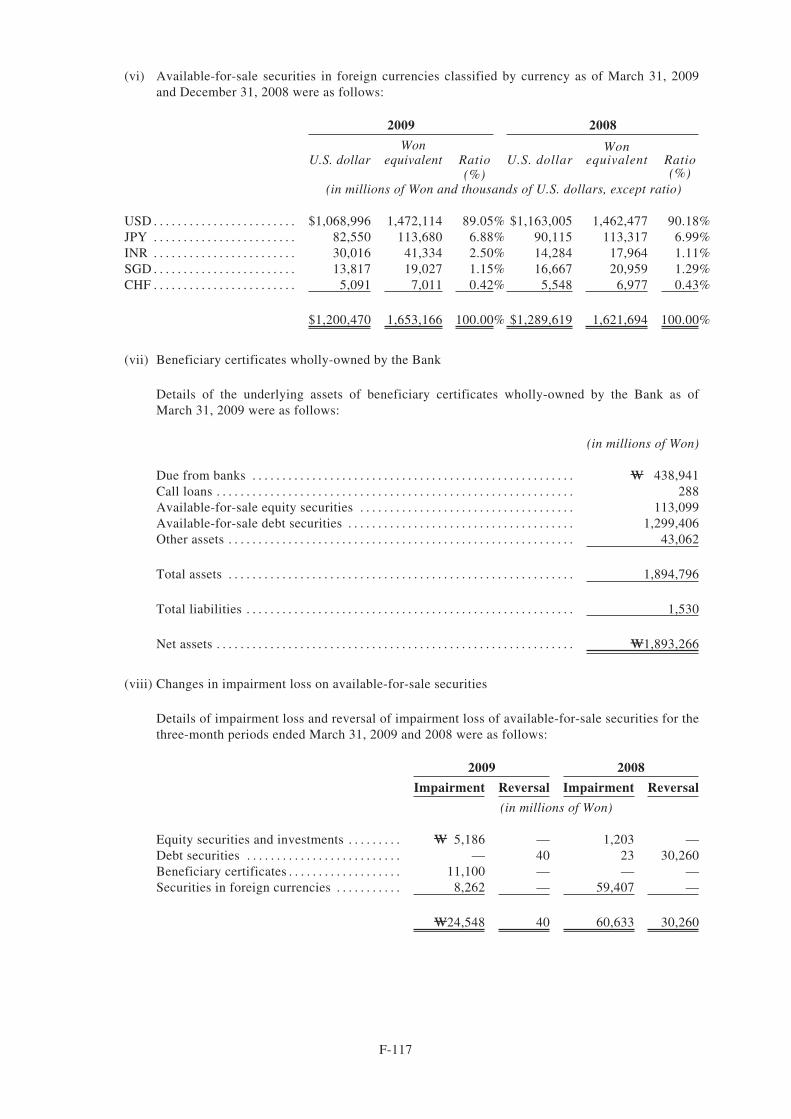
(vi) Available-for-sale securities in foreign currencies classified by currency as of March 31, 2009and December 31, 2008 were as follows:
2009 2008
U.S. dollarWon
equivalent Ratio U.S. dollarWon
equivalent Ratio(%) (%)
(in millions of Won and thousands of U.S. dollars, except ratio)
USD . . . . . . . . . . . . . . . . . . . . . . . . $1,068,996 1,472,114 89.05% $1,163,005 1,462,477 90.18%JPY . . . . . . . . . . . . . . . . . . . . . . . . 82,550 113,680 6.88% 90,115 113,317 6.99%INR . . . . . . . . . . . . . . . . . . . . . . . . 30,016 41,334 2.50% 14,284 17,964 1.11%SGD . . . . . . . . . . . . . . . . . . . . . . . . 13,817 19,027 1.15% 16,667 20,959 1.29%CHF . . . . . . . . . . . . . . . . . . . . . . . . 5,091 7,011 0.42% 5,548 6,977 0.43%
$1,200,470 1,653,166 100.00% $1,289,619 1,621,694 100.00%
(vii) Beneficiary certificates wholly-owned by the Bank
Details of the underlying assets of beneficiary certificates wholly-owned by the Bank as ofMarch 31, 2009 were as follows:
(in millions of Won)
Due from banks . . . . . . . . . . . . . . . . . . . . . . . . . . . . . . . . . . . . . . . . . . . . . . . . . . . . . . W 438,941Call loans . . . . . . . . . . . . . . . . . . . . . . . . . . . . . . . . . . . . . . . . . . . . . . . . . . . . . . . . . . . . 288Available-for-sale equity securities . . . . . . . . . . . . . . . . . . . . . . . . . . . . . . . . . . . . 113,099Available-for-sale debt securities . . . . . . . . . . . . . . . . . . . . . . . . . . . . . . . . . . . . . . 1,299,406Other assets . . . . . . . . . . . . . . . . . . . . . . . . . . . . . . . . . . . . . . . . . . . . . . . . . . . . . . . . . . 43,062
Total assets . . . . . . . . . . . . . . . . . . . . . . . . . . . . . . . . . . . . . . . . . . . . . . . . . . . . . . . . . . 1,894,796
Total liabilities . . . . . . . . . . . . . . . . . . . . . . . . . . . . . . . . . . . . . . . . . . . . . . . . . . . . . . . 1,530
Net assets . . . . . . . . . . . . . . . . . . . . . . . . . . . . . . . . . . . . . . . . . . . . . . . . . . . . . . . . . . . . W1,893,266
(viii) Changes in impairment loss on available-for-sale securities
Details of impairment loss and reversal of impairment loss of available-for-sale securities for thethree-month periods ended March 31, 2009 and 2008 were as follows:
2009 2008
Impairment Reversal Impairment Reversal
(in millions of Won)
Equity securities and investments . . . . . . . . . W 5,186 — 1,203 —Debt securities . . . . . . . . . . . . . . . . . . . . . . . . . . — 40 23 30,260Beneficiary certificates . . . . . . . . . . . . . . . . . . . 11,100 — — —Securities in foreign currencies . . . . . . . . . . . 8,262 — 59,407 —
W24,548 40 60,633 30,260
F-117
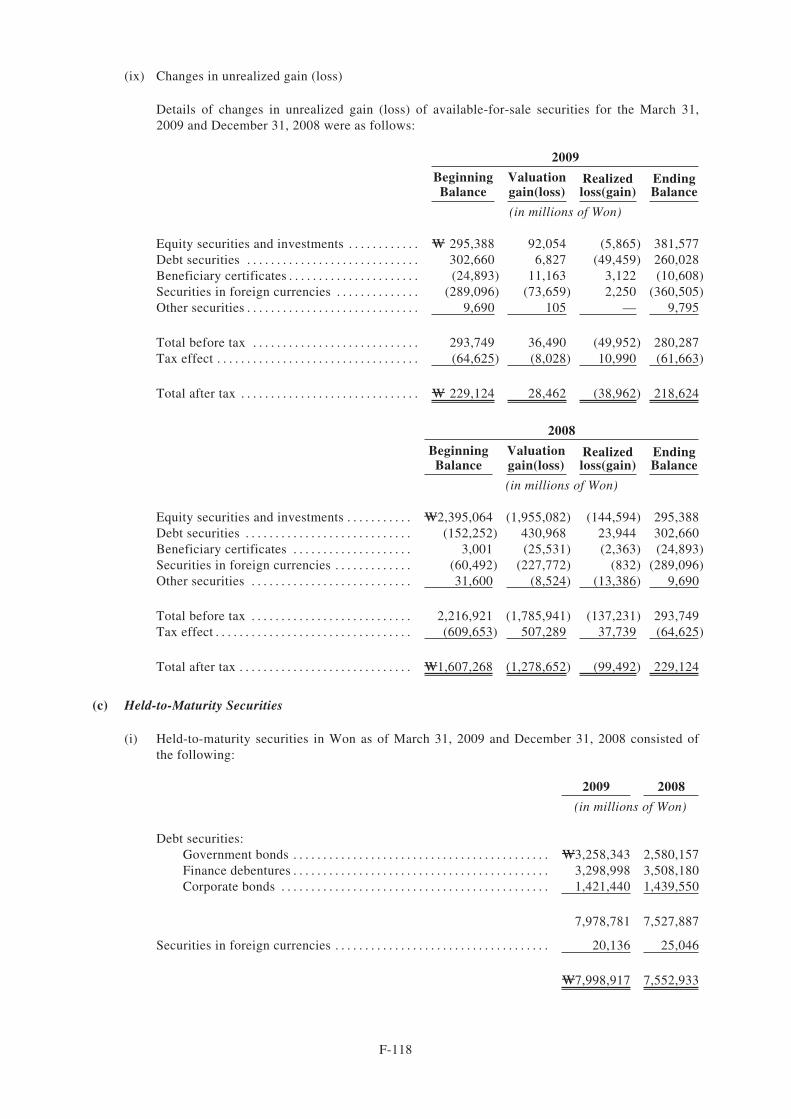
(ix) Changes in unrealized gain (loss)
Details of changes in unrealized gain (loss) of available-for-sale securities for the March 31,2009 and December 31, 2008 were as follows:
2009
BeginningBalance
Valuationgain(loss)
Realizedloss(gain)
EndingBalance
(in millions of Won)
Equity securities and investments . . . . . . . . . . . . W 295,388 92,054 (5,865) 381,577Debt securities . . . . . . . . . . . . . . . . . . . . . . . . . . . . . 302,660 6,827 (49,459) 260,028Beneficiary certificates . . . . . . . . . . . . . . . . . . . . . . (24,893) 11,163 3,122 (10,608)Securities in foreign currencies . . . . . . . . . . . . . . (289,096) (73,659) 2,250 (360,505)Other securities . . . . . . . . . . . . . . . . . . . . . . . . . . . . . 9,690 105 — 9,795
Total before tax . . . . . . . . . . . . . . . . . . . . . . . . . . . . 293,749 36,490 (49,952) 280,287Tax effect . . . . . . . . . . . . . . . . . . . . . . . . . . . . . . . . . . (64,625) (8,028) 10,990 (61,663)
Total after tax . . . . . . . . . . . . . . . . . . . . . . . . . . . . . . W 229,124 28,462 (38,962) 218,624
2008
BeginningBalance
Valuationgain(loss)
Realizedloss(gain)
EndingBalance
(in millions of Won)
Equity securities and investments . . . . . . . . . . . W2,395,064 (1,955,082) (144,594) 295,388Debt securities . . . . . . . . . . . . . . . . . . . . . . . . . . . . (152,252) 430,968 23,944 302,660Beneficiary certificates . . . . . . . . . . . . . . . . . . . . 3,001 (25,531) (2,363) (24,893)Securities in foreign currencies . . . . . . . . . . . . . (60,492) (227,772) (832) (289,096)Other securities . . . . . . . . . . . . . . . . . . . . . . . . . . . 31,600 (8,524) (13,386) 9,690
Total before tax . . . . . . . . . . . . . . . . . . . . . . . . . . . 2,216,921 (1,785,941) (137,231) 293,749Tax effect . . . . . . . . . . . . . . . . . . . . . . . . . . . . . . . . . (609,653) 507,289 37,739 (64,625)
Total after tax . . . . . . . . . . . . . . . . . . . . . . . . . . . . . W1,607,268 (1,278,652) (99,492) 229,124
(c) Held-to-Maturity Securities
(i) Held-to-maturity securities in Won as of March 31, 2009 and December 31, 2008 consisted ofthe following:
2009 2008
(in millions of Won)
Debt securities:Government bonds . . . . . . . . . . . . . . . . . . . . . . . . . . . . . . . . . . . . . . . . . . . W3,258,343 2,580,157Finance debentures . . . . . . . . . . . . . . . . . . . . . . . . . . . . . . . . . . . . . . . . . . . 3,298,998 3,508,180Corporate bonds . . . . . . . . . . . . . . . . . . . . . . . . . . . . . . . . . . . . . . . . . . . . . 1,421,440 1,439,550
7,978,781 7,527,887
Securities in foreign currencies . . . . . . . . . . . . . . . . . . . . . . . . . . . . . . . . . . . . 20,136 25,046
W7,998,917 7,552,933
F-118
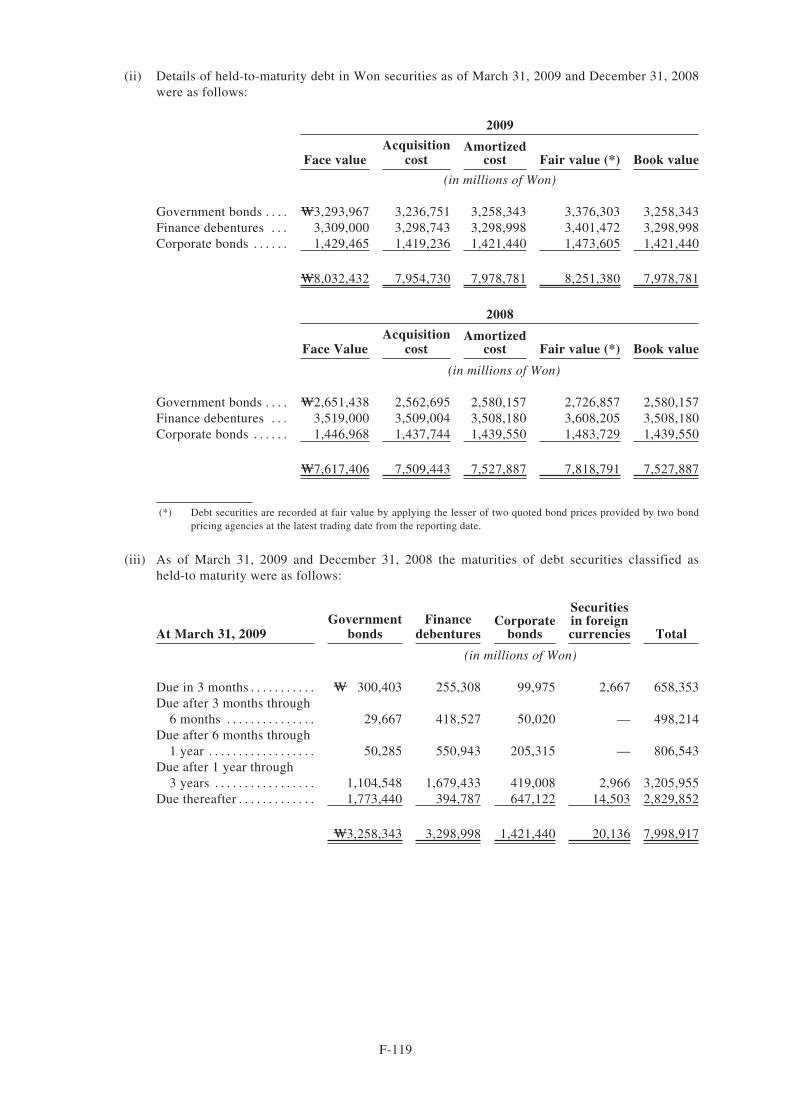
(ii) Details of held-to-maturity debt in Won securities as of March 31, 2009 and December 31, 2008were as follows:
2009
Face valueAcquisition
costAmortized
cost Fair value (*) Book value
(in millions of Won)
Government bonds . . . . W3,293,967 3,236,751 3,258,343 3,376,303 3,258,343Finance debentures . . . 3,309,000 3,298,743 3,298,998 3,401,472 3,298,998Corporate bonds . . . . . . 1,429,465 1,419,236 1,421,440 1,473,605 1,421,440
W8,032,432 7,954,730 7,978,781 8,251,380 7,978,781
2008
Face ValueAcquisition
costAmortized
cost Fair value (*) Book value
(in millions of Won)
Government bonds . . . . W2,651,438 2,562,695 2,580,157 2,726,857 2,580,157Finance debentures . . . 3,519,000 3,509,004 3,508,180 3,608,205 3,508,180Corporate bonds . . . . . . 1,446,968 1,437,744 1,439,550 1,483,729 1,439,550
W7,617,406 7,509,443 7,527,887 7,818,791 7,527,887
(*) Debt securities are recorded at fair value by applying the lesser of two quoted bond prices provided by two bondpricing agencies at the latest trading date from the reporting date.
(iii) As of March 31, 2009 and December 31, 2008 the maturities of debt securities classified asheld-to maturity were as follows:
At March 31, 2009Government
bondsFinance
debenturesCorporate
bonds
Securitiesin foreigncurrencies Total
(in millions of Won)
Due in 3 months . . . . . . . . . . . W 300,403 255,308 99,975 2,667 658,353Due after 3 months through
6 months . . . . . . . . . . . . . . . 29,667 418,527 50,020 — 498,214Due after 6 months through
1 year . . . . . . . . . . . . . . . . . . 50,285 550,943 205,315 — 806,543Due after 1 year through
3 years . . . . . . . . . . . . . . . . . 1,104,548 1,679,433 419,008 2,966 3,205,955Due thereafter . . . . . . . . . . . . . 1,773,440 394,787 647,122 14,503 2,829,852
W3,258,343 3,298,998 1,421,440 20,136 7,998,917
F-119
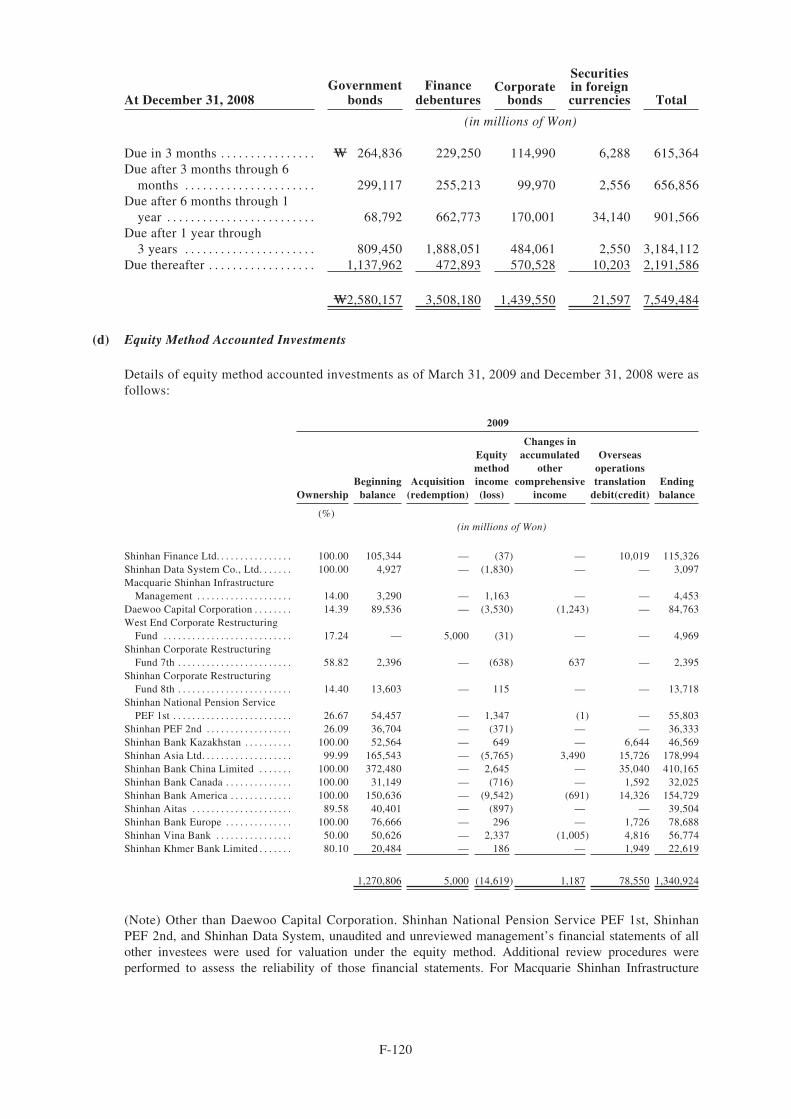
At December 31, 2008Government
bondsFinance
debenturesCorporate
bonds
Securitiesin foreigncurrencies Total
(in millions of Won)
Due in 3 months . . . . . . . . . . . . . . . . W 264,836 229,250 114,990 6,288 615,364Due after 3 months through 6
months . . . . . . . . . . . . . . . . . . . . . . 299,117 255,213 99,970 2,556 656,856Due after 6 months through 1
year . . . . . . . . . . . . . . . . . . . . . . . . . 68,792 662,773 170,001 34,140 901,566Due after 1 year through
3 years . . . . . . . . . . . . . . . . . . . . . . 809,450 1,888,051 484,061 2,550 3,184,112Due thereafter . . . . . . . . . . . . . . . . . . 1,137,962 472,893 570,528 10,203 2,191,586
W2,580,157 3,508,180 1,439,550 21,597 7,549,484
(d) Equity Method Accounted Investments
Details of equity method accounted investments as of March 31, 2009 and December 31, 2008 were asfollows:
2009
OwnershipBeginning
balanceAcquisition
(redemption)
Equitymethodincome(loss)
Changes inaccumulated
othercomprehensive
income
Overseasoperationstranslation
debit(credit)Endingbalance
(%)(in millions of Won)
Shinhan Finance Ltd. . . . . . . . . . . . . . . . 100.00 105,344 — (37) — 10,019 115,326Shinhan Data System Co., Ltd. . . . . . . 100.00 4,927 — (1,830) — — 3,097Macquarie Shinhan Infrastructure
Management . . . . . . . . . . . . . . . . . . . . 14.00 3,290 — 1,163 — — 4,453Daewoo Capital Corporation . . . . . . . . 14.39 89,536 — (3,530) (1,243) — 84,763West End Corporate Restructuring
Fund . . . . . . . . . . . . . . . . . . . . . . . . . . . 17.24 — 5,000 (31) — — 4,969Shinhan Corporate Restructuring
Fund 7th . . . . . . . . . . . . . . . . . . . . . . . . 58.82 2,396 — (638) 637 — 2,395Shinhan Corporate Restructuring
Fund 8th . . . . . . . . . . . . . . . . . . . . . . . . 14.40 13,603 — 115 — — 13,718Shinhan National Pension Service
PEF 1st . . . . . . . . . . . . . . . . . . . . . . . . . 26.67 54,457 — 1,347 (1) — 55,803Shinhan PEF 2nd . . . . . . . . . . . . . . . . . . 26.09 36,704 — (371) — — 36,333Shinhan Bank Kazakhstan . . . . . . . . . . 100.00 52,564 — 649 — 6,644 46,569Shinhan Asia Ltd. . . . . . . . . . . . . . . . . . . 99.99 165,543 — (5,765) 3,490 15,726 178,994Shinhan Bank China Limited . . . . . . . 100.00 372,480 — 2,645 — 35,040 410,165Shinhan Bank Canada . . . . . . . . . . . . . . 100.00 31,149 — (716) — 1,592 32,025Shinhan Bank America . . . . . . . . . . . . . 100.00 150,636 — (9,542) (691) 14,326 154,729Shinhan Aitas . . . . . . . . . . . . . . . . . . . . . 89.58 40,401 — (897) — — 39,504Shinhan Bank Europe . . . . . . . . . . . . . . 100.00 76,666 — 296 — 1,726 78,688Shinhan Vina Bank . . . . . . . . . . . . . . . . 50.00 50,626 — 2,337 (1,005) 4,816 56,774Shinhan Khmer Bank Limited . . . . . . . 80.10 20,484 — 186 — 1,949 22,619
1,270,806 5,000 (14,619) 1,187 78,550 1,340,924
(Note) Other than Daewoo Capital Corporation. Shinhan National Pension Service PEF 1st, ShinhanPEF 2nd, and Shinhan Data System, unaudited and unreviewed management’s financial statements of allother investees were used for valuation under the equity method. Additional review procedures wereperformed to assess the reliability of those financial statements. For Macquarie Shinhan Infrastructure
F-120
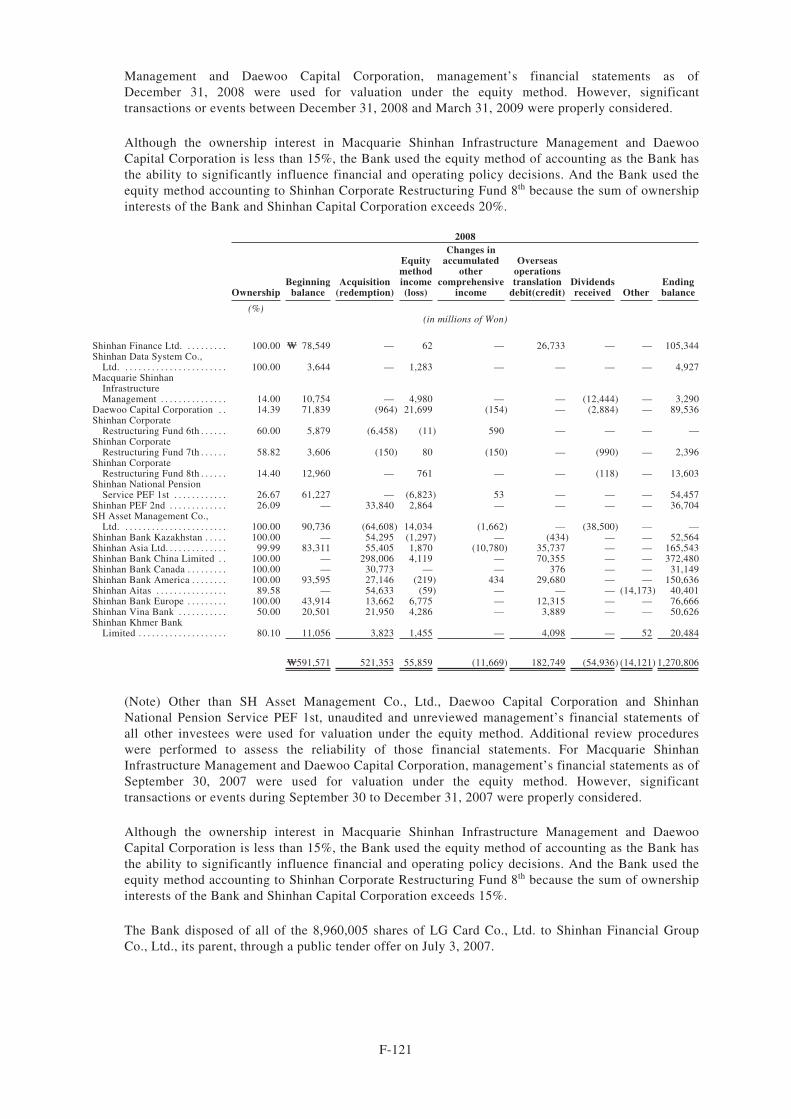
Management and Daewoo Capital Corporation, management’s financial statements as ofDecember 31, 2008 were used for valuation under the equity method. However, significanttransactions or events between December 31, 2008 and March 31, 2009 were properly considered.
Although the ownership interest in Macquarie Shinhan Infrastructure Management and DaewooCapital Corporation is less than 15%, the Bank used the equity method of accounting as the Bank hasthe ability to significantly influence financial and operating policy decisions. And the Bank used theequity method accounting to Shinhan Corporate Restructuring Fund 8th because the sum of ownershipinterests of the Bank and Shinhan Capital Corporation exceeds 20%.
2008
OwnershipBeginning
balanceAcquisition
(redemption)
Equitymethodincome(loss)
Changes inaccumulated
othercomprehensive
income
Overseasoperationstranslation
debit(credit)Dividendsreceived Other
Endingbalance
(%)(in millions of Won)
Shinhan Finance Ltd. . . . . . . . . . 100.00 W 78,549 — 62 — 26,733 — — 105,344Shinhan Data System Co.,
Ltd. . . . . . . . . . . . . . . . . . . . . . . . 100.00 3,644 — 1,283 — — — — 4,927Macquarie Shinhan
InfrastructureManagement . . . . . . . . . . . . . . . 14.00 10,754 — 4,980 — — (12,444) — 3,290
Daewoo Capital Corporation . . 14.39 71,839 (964) 21,699 (154) — (2,884) — 89,536Shinhan Corporate
Restructuring Fund 6th . . . . . . 60.00 5,879 (6,458) (11) 590 — — — —Shinhan Corporate
Restructuring Fund 7th . . . . . . 58.82 3,606 (150) 80 (150) — (990) — 2,396Shinhan Corporate
Restructuring Fund 8th . . . . . . 14.40 12,960 — 761 — — (118) — 13,603Shinhan National Pension
Service PEF 1st . . . . . . . . . . . . 26.67 61,227 — (6,823) 53 — — — 54,457Shinhan PEF 2nd . . . . . . . . . . . . . 26.09 — 33,840 2,864 — — — — 36,704SH Asset Management Co.,
Ltd. . . . . . . . . . . . . . . . . . . . . . . . 100.00 90,736 (64,608) 14,034 (1,662) — (38,500) — —Shinhan Bank Kazakhstan . . . . . 100.00 — 54,295 (1,297) — (434) — — 52,564Shinhan Asia Ltd. . . . . . . . . . . . . . 99.99 83,311 55,405 1,870 (10,780) 35,737 — — 165,543Shinhan Bank China Limited . . 100.00 — 298,006 4,119 — 70,355 — — 372,480Shinhan Bank Canada . . . . . . . . . 100.00 — 30,773 — — 376 — — 31,149Shinhan Bank America . . . . . . . . 100.00 93,595 27,146 (219) 434 29,680 — — 150,636Shinhan Aitas . . . . . . . . . . . . . . . . 89.58 — 54,633 (59) — — — (14,173) 40,401Shinhan Bank Europe . . . . . . . . . 100.00 43,914 13,662 6,775 — 12,315 — — 76,666Shinhan Vina Bank . . . . . . . . . . . 50.00 20,501 21,950 4,286 — 3,889 — — 50,626Shinhan Khmer Bank
Limited . . . . . . . . . . . . . . . . . . . . 80.10 11,056 3,823 1,455 — 4,098 — 52 20,484
W591,571 521,353 55,859 (11,669) 182,749 (54,936) (14,121) 1,270,806
(Note) Other than SH Asset Management Co., Ltd., Daewoo Capital Corporation and ShinhanNational Pension Service PEF 1st, unaudited and unreviewed management’s financial statements ofall other investees were used for valuation under the equity method. Additional review procedureswere performed to assess the reliability of those financial statements. For Macquarie ShinhanInfrastructure Management and Daewoo Capital Corporation, management’s financial statements as ofSeptember 30, 2007 were used for valuation under the equity method. However, significanttransactions or events during September 30 to December 31, 2007 were properly considered.
Although the ownership interest in Macquarie Shinhan Infrastructure Management and DaewooCapital Corporation is less than 15%, the Bank used the equity method of accounting as the Bank hasthe ability to significantly influence financial and operating policy decisions. And the Bank used theequity method accounting to Shinhan Corporate Restructuring Fund 8th because the sum of ownershipinterests of the Bank and Shinhan Capital Corporation exceeds 15%.
The Bank disposed of all of the 8,960,005 shares of LG Card Co., Ltd. to Shinhan Financial GroupCo., Ltd., its parent, through a public tender offer on July 3, 2007.
F-121
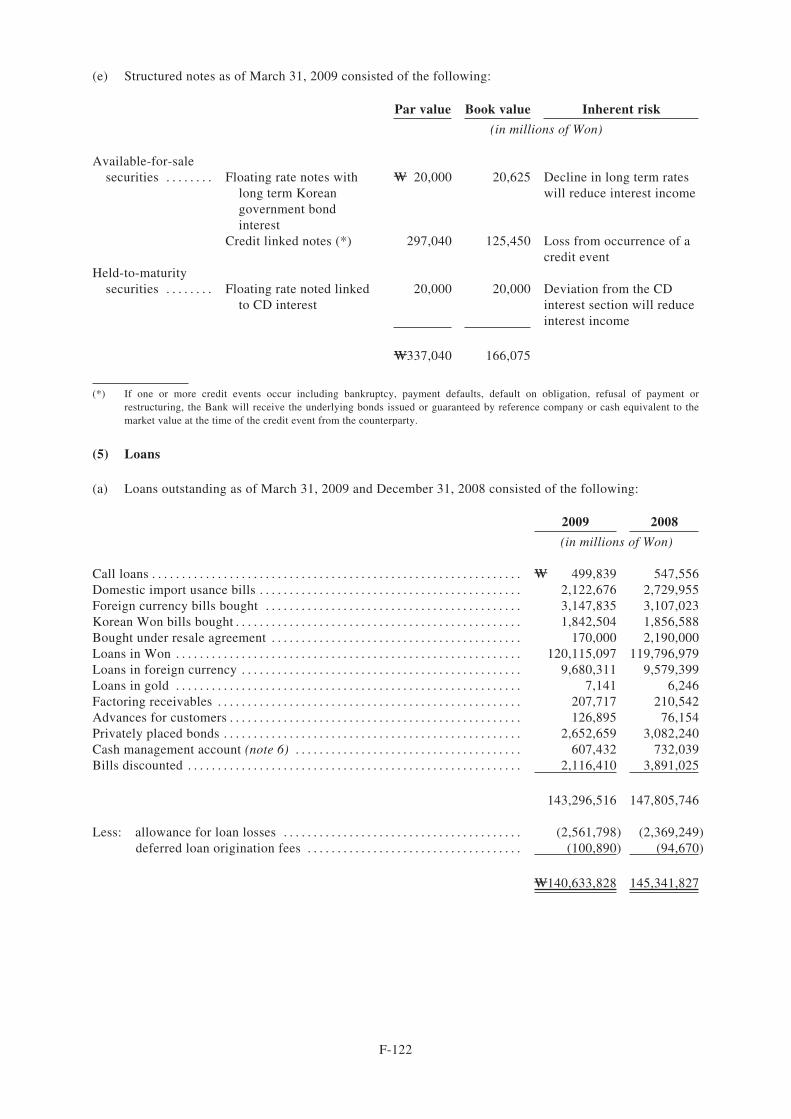
(e) Structured notes as of March 31, 2009 consisted of the following:
Par value Book value Inherent risk
(in millions of Won)
Available-for-salesecurities . . . . . . . . Floating rate notes with
long term Koreangovernment bondinterest
W 20,000 20,625 Decline in long term rateswill reduce interest income
Credit linked notes (*) 297,040 125,450 Loss from occurrence of acredit event
Held-to-maturitysecurities . . . . . . . . Floating rate noted linked
to CD interest20,000 20,000 Deviation from the CD
interest section will reduceinterest income
W337,040 166,075
(*) If one or more credit events occur including bankruptcy, payment defaults, default on obligation, refusal of payment orrestructuring, the Bank will receive the underlying bonds issued or guaranteed by reference company or cash equivalent to themarket value at the time of the credit event from the counterparty.
(5) Loans
(a) Loans outstanding as of March 31, 2009 and December 31, 2008 consisted of the following:
2009 2008
(in millions of Won)
Call loans . . . . . . . . . . . . . . . . . . . . . . . . . . . . . . . . . . . . . . . . . . . . . . . . . . . . . . . . . . . . . . W 499,839 547,556Domestic import usance bills . . . . . . . . . . . . . . . . . . . . . . . . . . . . . . . . . . . . . . . . . . . . 2,122,676 2,729,955Foreign currency bills bought . . . . . . . . . . . . . . . . . . . . . . . . . . . . . . . . . . . . . . . . . . . 3,147,835 3,107,023Korean Won bills bought . . . . . . . . . . . . . . . . . . . . . . . . . . . . . . . . . . . . . . . . . . . . . . . . 1,842,504 1,856,588Bought under resale agreement . . . . . . . . . . . . . . . . . . . . . . . . . . . . . . . . . . . . . . . . . . 170,000 2,190,000Loans in Won . . . . . . . . . . . . . . . . . . . . . . . . . . . . . . . . . . . . . . . . . . . . . . . . . . . . . . . . . . 120,115,097 119,796,979Loans in foreign currency . . . . . . . . . . . . . . . . . . . . . . . . . . . . . . . . . . . . . . . . . . . . . . . 9,680,311 9,579,399Loans in gold . . . . . . . . . . . . . . . . . . . . . . . . . . . . . . . . . . . . . . . . . . . . . . . . . . . . . . . . . . 7,141 6,246Factoring receivables . . . . . . . . . . . . . . . . . . . . . . . . . . . . . . . . . . . . . . . . . . . . . . . . . . . 207,717 210,542Advances for customers . . . . . . . . . . . . . . . . . . . . . . . . . . . . . . . . . . . . . . . . . . . . . . . . . 126,895 76,154Privately placed bonds . . . . . . . . . . . . . . . . . . . . . . . . . . . . . . . . . . . . . . . . . . . . . . . . . . 2,652,659 3,082,240Cash management account (note 6) . . . . . . . . . . . . . . . . . . . . . . . . . . . . . . . . . . . . . . 607,432 732,039Bills discounted . . . . . . . . . . . . . . . . . . . . . . . . . . . . . . . . . . . . . . . . . . . . . . . . . . . . . . . . 2,116,410 3,891,025
143,296,516 147,805,746
Less: allowance for loan losses . . . . . . . . . . . . . . . . . . . . . . . . . . . . . . . . . . . . . . . . (2,561,798) (2,369,249)deferred loan origination fees . . . . . . . . . . . . . . . . . . . . . . . . . . . . . . . . . . . . (100,890) (94,670)
W140,633,828 145,341,827
F-122
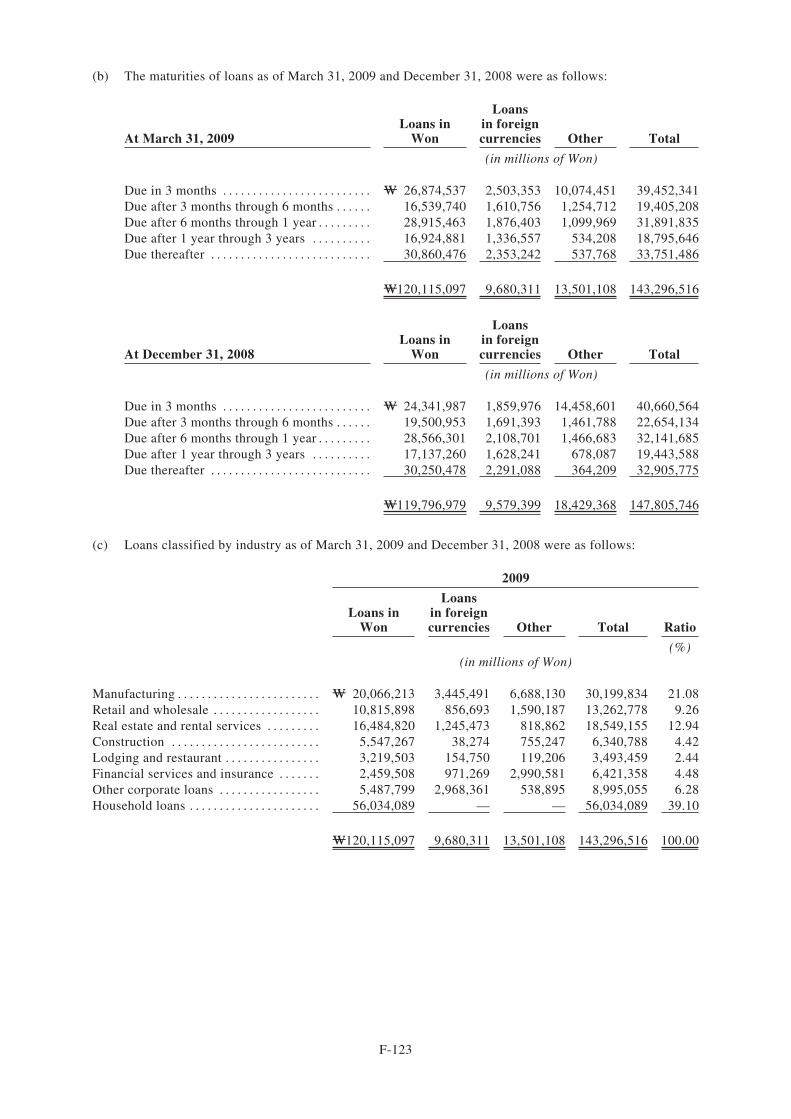
(b) The maturities of loans as of March 31, 2009 and December 31, 2008 were as follows:
At March 31, 2009Loans in
Won
Loansin foreigncurrencies Other Total
(in millions of Won)
Due in 3 months . . . . . . . . . . . . . . . . . . . . . . . . . W 26,874,537 2,503,353 10,074,451 39,452,341Due after 3 months through 6 months . . . . . . 16,539,740 1,610,756 1,254,712 19,405,208Due after 6 months through 1 year . . . . . . . . . 28,915,463 1,876,403 1,099,969 31,891,835Due after 1 year through 3 years . . . . . . . . . . 16,924,881 1,336,557 534,208 18,795,646Due thereafter . . . . . . . . . . . . . . . . . . . . . . . . . . . 30,860,476 2,353,242 537,768 33,751,486
W120,115,097 9,680,311 13,501,108 143,296,516
At December 31, 2008Loans in
Won
Loansin foreigncurrencies Other Total
(in millions of Won)
Due in 3 months . . . . . . . . . . . . . . . . . . . . . . . . . W 24,341,987 1,859,976 14,458,601 40,660,564Due after 3 months through 6 months . . . . . . 19,500,953 1,691,393 1,461,788 22,654,134Due after 6 months through 1 year . . . . . . . . . 28,566,301 2,108,701 1,466,683 32,141,685Due after 1 year through 3 years . . . . . . . . . . 17,137,260 1,628,241 678,087 19,443,588Due thereafter . . . . . . . . . . . . . . . . . . . . . . . . . . . 30,250,478 2,291,088 364,209 32,905,775
W119,796,979 9,579,399 18,429,368 147,805,746
(c) Loans classified by industry as of March 31, 2009 and December 31, 2008 were as follows:
2009
Loans inWon
Loansin foreigncurrencies Other Total Ratio
(%)(in millions of Won)
Manufacturing . . . . . . . . . . . . . . . . . . . . . . . . W 20,066,213 3,445,491 6,688,130 30,199,834 21.08Retail and wholesale . . . . . . . . . . . . . . . . . . 10,815,898 856,693 1,590,187 13,262,778 9.26Real estate and rental services . . . . . . . . . 16,484,820 1,245,473 818,862 18,549,155 12.94Construction . . . . . . . . . . . . . . . . . . . . . . . . . 5,547,267 38,274 755,247 6,340,788 4.42Lodging and restaurant . . . . . . . . . . . . . . . . 3,219,503 154,750 119,206 3,493,459 2.44Financial services and insurance . . . . . . . 2,459,508 971,269 2,990,581 6,421,358 4.48Other corporate loans . . . . . . . . . . . . . . . . . 5,487,799 2,968,361 538,895 8,995,055 6.28Household loans . . . . . . . . . . . . . . . . . . . . . . 56,034,089 — — 56,034,089 39.10
W120,115,097 9,680,311 13,501,108 143,296,516 100.00
F-123
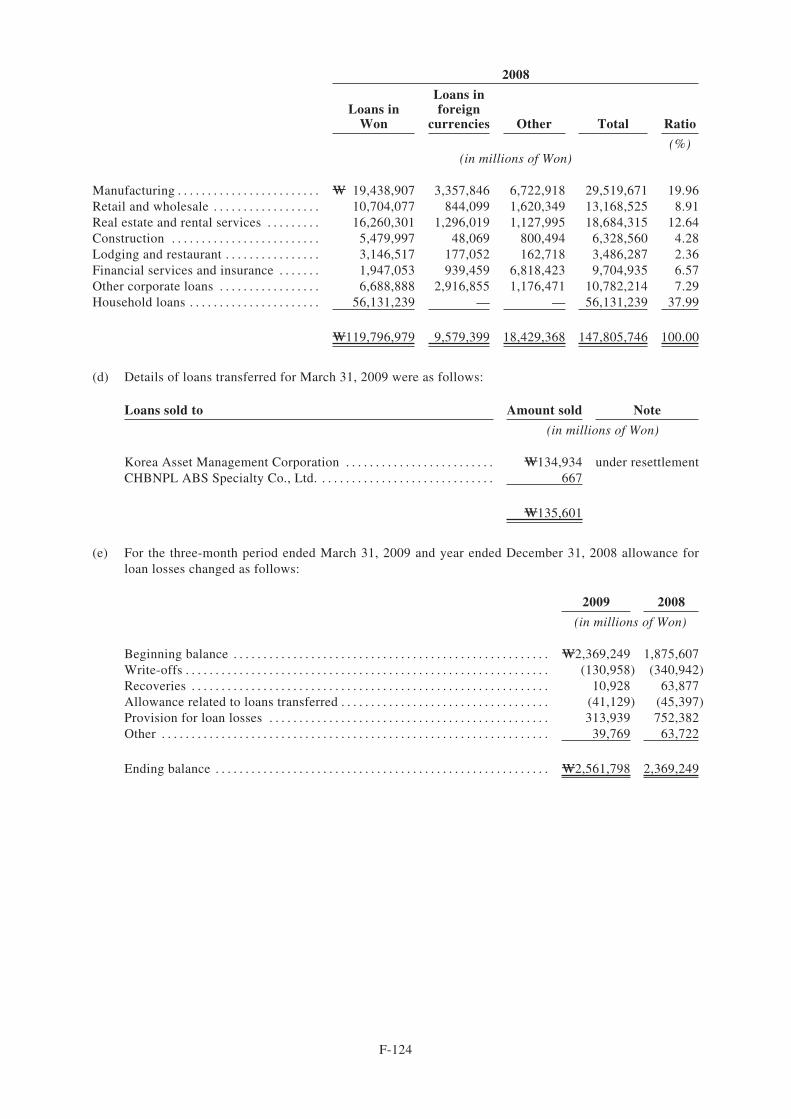
2008
Loans inWon
Loans inforeign
currencies Other Total Ratio
(%)(in millions of Won)
Manufacturing . . . . . . . . . . . . . . . . . . . . . . . . W 19,438,907 3,357,846 6,722,918 29,519,671 19.96Retail and wholesale . . . . . . . . . . . . . . . . . . 10,704,077 844,099 1,620,349 13,168,525 8.91Real estate and rental services . . . . . . . . . 16,260,301 1,296,019 1,127,995 18,684,315 12.64Construction . . . . . . . . . . . . . . . . . . . . . . . . . 5,479,997 48,069 800,494 6,328,560 4.28Lodging and restaurant . . . . . . . . . . . . . . . . 3,146,517 177,052 162,718 3,486,287 2.36Financial services and insurance . . . . . . . 1,947,053 939,459 6,818,423 9,704,935 6.57Other corporate loans . . . . . . . . . . . . . . . . . 6,688,888 2,916,855 1,176,471 10,782,214 7.29Household loans . . . . . . . . . . . . . . . . . . . . . . 56,131,239 — — 56,131,239 37.99
W119,796,979 9,579,399 18,429,368 147,805,746 100.00
(d) Details of loans transferred for March 31, 2009 were as follows:
Loans sold to Amount sold Note
(in millions of Won)
Korea Asset Management Corporation . . . . . . . . . . . . . . . . . . . . . . . . . W134,934 under resettlementCHBNPL ABS Specialty Co., Ltd. . . . . . . . . . . . . . . . . . . . . . . . . . . . . . 667
W135,601
(e) For the three-month period ended March 31, 2009 and year ended December 31, 2008 allowance forloan losses changed as follows:
2009 2008
(in millions of Won)
Beginning balance . . . . . . . . . . . . . . . . . . . . . . . . . . . . . . . . . . . . . . . . . . . . . . . . . . . . . W2,369,249 1,875,607Write-offs . . . . . . . . . . . . . . . . . . . . . . . . . . . . . . . . . . . . . . . . . . . . . . . . . . . . . . . . . . . . . (130,958) (340,942)Recoveries . . . . . . . . . . . . . . . . . . . . . . . . . . . . . . . . . . . . . . . . . . . . . . . . . . . . . . . . . . . . 10,928 63,877Allowance related to loans transferred . . . . . . . . . . . . . . . . . . . . . . . . . . . . . . . . . . . (41,129) (45,397)Provision for loan losses . . . . . . . . . . . . . . . . . . . . . . . . . . . . . . . . . . . . . . . . . . . . . . . 313,939 752,382Other . . . . . . . . . . . . . . . . . . . . . . . . . . . . . . . . . . . . . . . . . . . . . . . . . . . . . . . . . . . . . . . . . 39,769 63,722
Ending balance . . . . . . . . . . . . . . . . . . . . . . . . . . . . . . . . . . . . . . . . . . . . . . . . . . . . . . . . W2,561,798 2,369,249
F-124
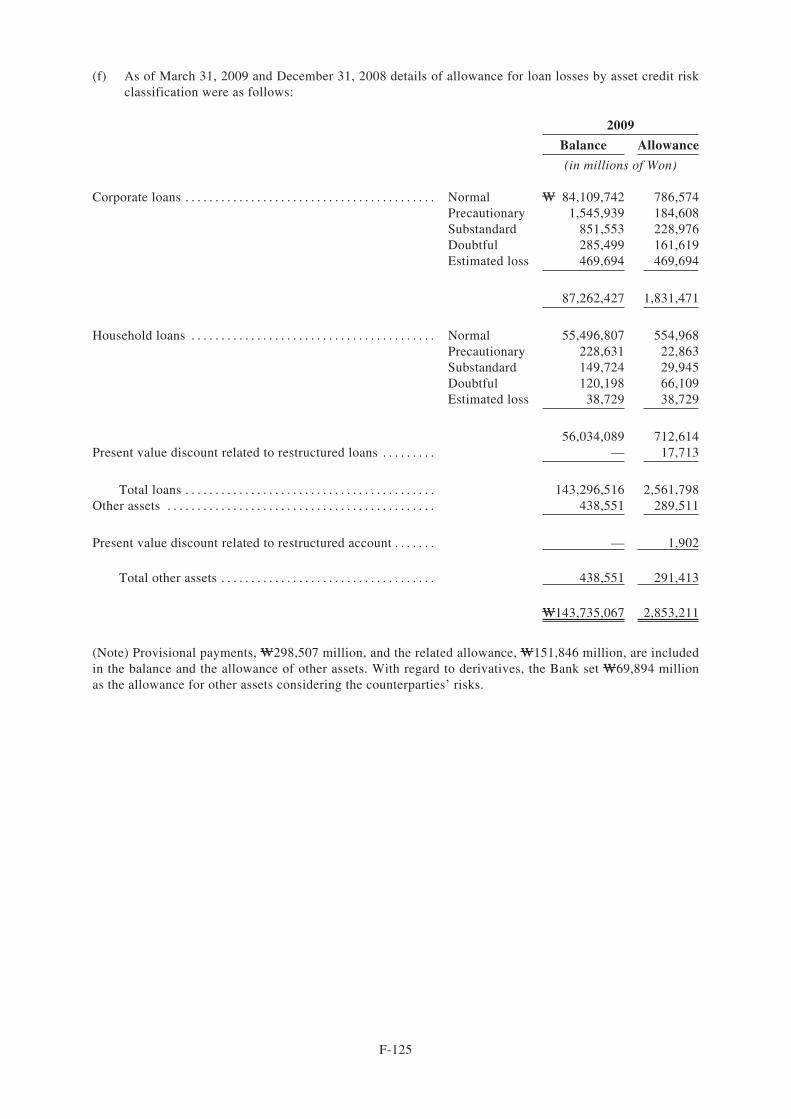
(f) As of March 31, 2009 and December 31, 2008 details of allowance for loan losses by asset credit riskclassification were as follows:
2009
Balance Allowance
(in millions of Won)
Corporate loans . . . . . . . . . . . . . . . . . . . . . . . . . . . . . . . . . . . . . . . . . . Normal W 84,109,742 786,574Precautionary 1,545,939 184,608Substandard 851,553 228,976Doubtful 285,499 161,619Estimated loss 469,694 469,694
87,262,427 1,831,471
Household loans . . . . . . . . . . . . . . . . . . . . . . . . . . . . . . . . . . . . . . . . . Normal 55,496,807 554,968Precautionary 228,631 22,863Substandard 149,724 29,945Doubtful 120,198 66,109Estimated loss 38,729 38,729
56,034,089 712,614Present value discount related to restructured loans . . . . . . . . . — 17,713
Total loans . . . . . . . . . . . . . . . . . . . . . . . . . . . . . . . . . . . . . . . . . . 143,296,516 2,561,798Other assets . . . . . . . . . . . . . . . . . . . . . . . . . . . . . . . . . . . . . . . . . . . . . 438,551 289,511
Present value discount related to restructured account . . . . . . . — 1,902
Total other assets . . . . . . . . . . . . . . . . . . . . . . . . . . . . . . . . . . . . 438,551 291,413
W143,735,067 2,853,211
(Note) Provisional payments, W298,507 million, and the related allowance, W151,846 million, are includedin the balance and the allowance of other assets. With regard to derivatives, the Bank set W69,894 millionas the allowance for other assets considering the counterparties’ risks.
F-125
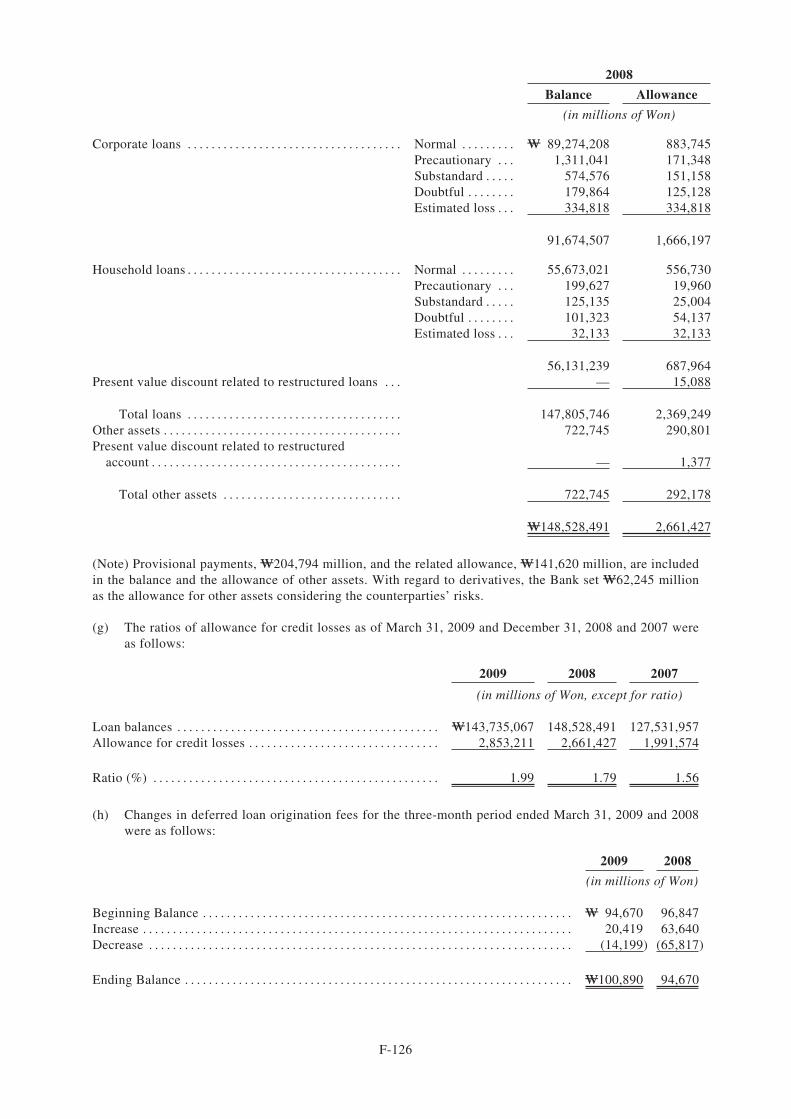
2008
Balance Allowance
(in millions of Won)
Corporate loans . . . . . . . . . . . . . . . . . . . . . . . . . . . . . . . . . . . . Normal . . . . . . . . . W 89,274,208 883,745Precautionary . . . 1,311,041 171,348Substandard . . . . . 574,576 151,158Doubtful . . . . . . . . 179,864 125,128Estimated loss . . . 334,818 334,818
91,674,507 1,666,197
Household loans . . . . . . . . . . . . . . . . . . . . . . . . . . . . . . . . . . . . Normal . . . . . . . . . 55,673,021 556,730Precautionary . . . 199,627 19,960Substandard . . . . . 125,135 25,004Doubtful . . . . . . . . 101,323 54,137Estimated loss . . . 32,133 32,133
56,131,239 687,964Present value discount related to restructured loans . . . — 15,088
Total loans . . . . . . . . . . . . . . . . . . . . . . . . . . . . . . . . . . . . 147,805,746 2,369,249Other assets . . . . . . . . . . . . . . . . . . . . . . . . . . . . . . . . . . . . . . . . 722,745 290,801Present value discount related to restructured
account . . . . . . . . . . . . . . . . . . . . . . . . . . . . . . . . . . . . . . . . . . — 1,377
Total other assets . . . . . . . . . . . . . . . . . . . . . . . . . . . . . . 722,745 292,178
W148,528,491 2,661,427
(Note) Provisional payments, W204,794 million, and the related allowance, W141,620 million, are includedin the balance and the allowance of other assets. With regard to derivatives, the Bank set W62,245 millionas the allowance for other assets considering the counterparties’ risks.
(g) The ratios of allowance for credit losses as of March 31, 2009 and December 31, 2008 and 2007 wereas follows:
2009 2008 2007
(in millions of Won, except for ratio)
Loan balances . . . . . . . . . . . . . . . . . . . . . . . . . . . . . . . . . . . . . . . . . . . . W143,735,067 148,528,491 127,531,957Allowance for credit losses . . . . . . . . . . . . . . . . . . . . . . . . . . . . . . . . 2,853,211 2,661,427 1,991,574
Ratio (%) . . . . . . . . . . . . . . . . . . . . . . . . . . . . . . . . . . . . . . . . . . . . . . . . 1.99 1.79 1.56
(h) Changes in deferred loan origination fees for the three-month period ended March 31, 2009 and 2008were as follows:
2009 2008
(in millions of Won)
Beginning Balance . . . . . . . . . . . . . . . . . . . . . . . . . . . . . . . . . . . . . . . . . . . . . . . . . . . . . . . . . . . . . . W 94,670 96,847Increase . . . . . . . . . . . . . . . . . . . . . . . . . . . . . . . . . . . . . . . . . . . . . . . . . . . . . . . . . . . . . . . . . . . . . . . . 20,419 63,640Decrease . . . . . . . . . . . . . . . . . . . . . . . . . . . . . . . . . . . . . . . . . . . . . . . . . . . . . . . . . . . . . . . . . . . . . . . (14,199) (65,817)
Ending Balance . . . . . . . . . . . . . . . . . . . . . . . . . . . . . . . . . . . . . . . . . . . . . . . . . . . . . . . . . . . . . . . . . W100,890 94,670
F-126
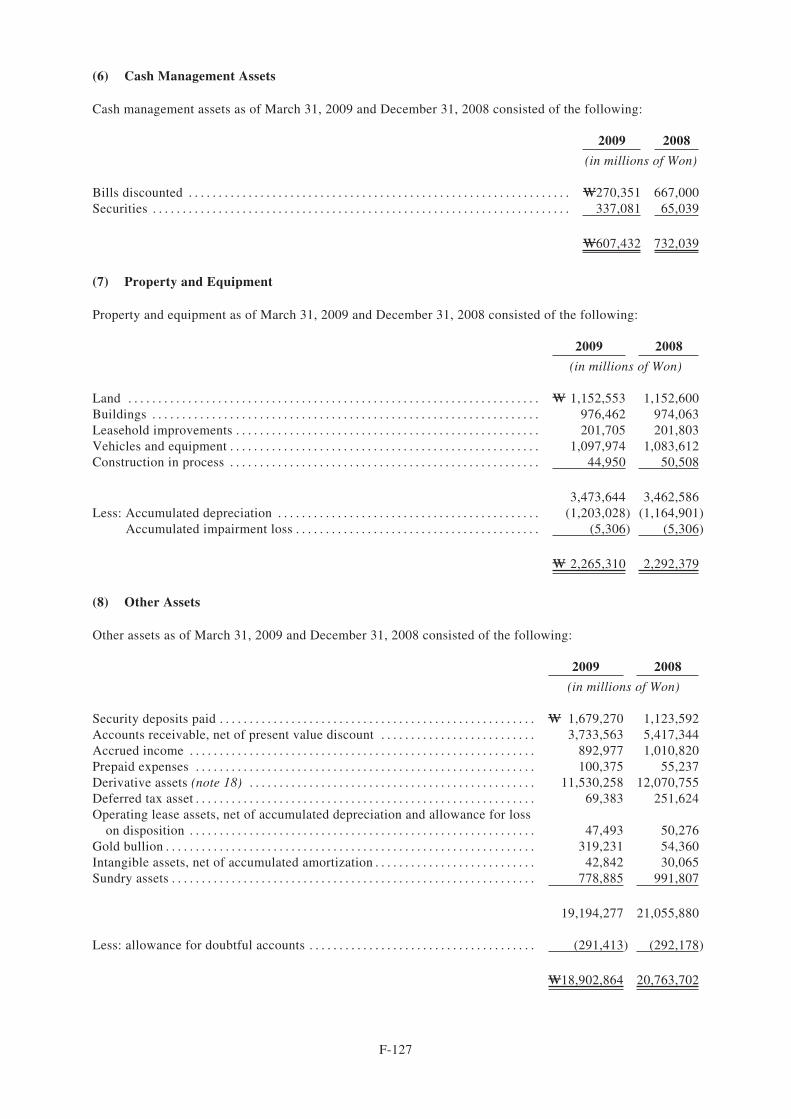
(6) Cash Management Assets
Cash management assets as of March 31, 2009 and December 31, 2008 consisted of the following:
2009 2008
(in millions of Won)
Bills discounted . . . . . . . . . . . . . . . . . . . . . . . . . . . . . . . . . . . . . . . . . . . . . . . . . . . . . . . . . . . . . . . . W270,351 667,000Securities . . . . . . . . . . . . . . . . . . . . . . . . . . . . . . . . . . . . . . . . . . . . . . . . . . . . . . . . . . . . . . . . . . . . . . 337,081 65,039
W607,432 732,039
(7) Property and Equipment
Property and equipment as of March 31, 2009 and December 31, 2008 consisted of the following:
2009 2008
(in millions of Won)
Land . . . . . . . . . . . . . . . . . . . . . . . . . . . . . . . . . . . . . . . . . . . . . . . . . . . . . . . . . . . . . . . . . . . . . W 1,152,553 1,152,600Buildings . . . . . . . . . . . . . . . . . . . . . . . . . . . . . . . . . . . . . . . . . . . . . . . . . . . . . . . . . . . . . . . . . 976,462 974,063Leasehold improvements . . . . . . . . . . . . . . . . . . . . . . . . . . . . . . . . . . . . . . . . . . . . . . . . . . . 201,705 201,803Vehicles and equipment . . . . . . . . . . . . . . . . . . . . . . . . . . . . . . . . . . . . . . . . . . . . . . . . . . . . 1,097,974 1,083,612Construction in process . . . . . . . . . . . . . . . . . . . . . . . . . . . . . . . . . . . . . . . . . . . . . . . . . . . . 44,950 50,508
3,473,644 3,462,586Less: Accumulated depreciation . . . . . . . . . . . . . . . . . . . . . . . . . . . . . . . . . . . . . . . . . . . . (1,203,028) (1,164,901)
Accumulated impairment loss . . . . . . . . . . . . . . . . . . . . . . . . . . . . . . . . . . . . . . . . . (5,306) (5,306)
W 2,265,310 2,292,379
(8) Other Assets
Other assets as of March 31, 2009 and December 31, 2008 consisted of the following:
2009 2008
(in millions of Won)
Security deposits paid . . . . . . . . . . . . . . . . . . . . . . . . . . . . . . . . . . . . . . . . . . . . . . . . . . . . . W 1,679,270 1,123,592Accounts receivable, net of present value discount . . . . . . . . . . . . . . . . . . . . . . . . . . 3,733,563 5,417,344Accrued income . . . . . . . . . . . . . . . . . . . . . . . . . . . . . . . . . . . . . . . . . . . . . . . . . . . . . . . . . . 892,977 1,010,820Prepaid expenses . . . . . . . . . . . . . . . . . . . . . . . . . . . . . . . . . . . . . . . . . . . . . . . . . . . . . . . . . 100,375 55,237Derivative assets (note 18) . . . . . . . . . . . . . . . . . . . . . . . . . . . . . . . . . . . . . . . . . . . . . . . . 11,530,258 12,070,755Deferred tax asset . . . . . . . . . . . . . . . . . . . . . . . . . . . . . . . . . . . . . . . . . . . . . . . . . . . . . . . . . 69,383 251,624Operating lease assets, net of accumulated depreciation and allowance for loss
on disposition . . . . . . . . . . . . . . . . . . . . . . . . . . . . . . . . . . . . . . . . . . . . . . . . . . . . . . . . . . 47,493 50,276Gold bullion . . . . . . . . . . . . . . . . . . . . . . . . . . . . . . . . . . . . . . . . . . . . . . . . . . . . . . . . . . . . . . 319,231 54,360Intangible assets, net of accumulated amortization . . . . . . . . . . . . . . . . . . . . . . . . . . . 42,842 30,065Sundry assets . . . . . . . . . . . . . . . . . . . . . . . . . . . . . . . . . . . . . . . . . . . . . . . . . . . . . . . . . . . . . 778,885 991,807
19,194,277 21,055,880
Less: allowance for doubtful accounts . . . . . . . . . . . . . . . . . . . . . . . . . . . . . . . . . . . . . . (291,413) (292,178)
W18,902,864 20,763,702
F-127
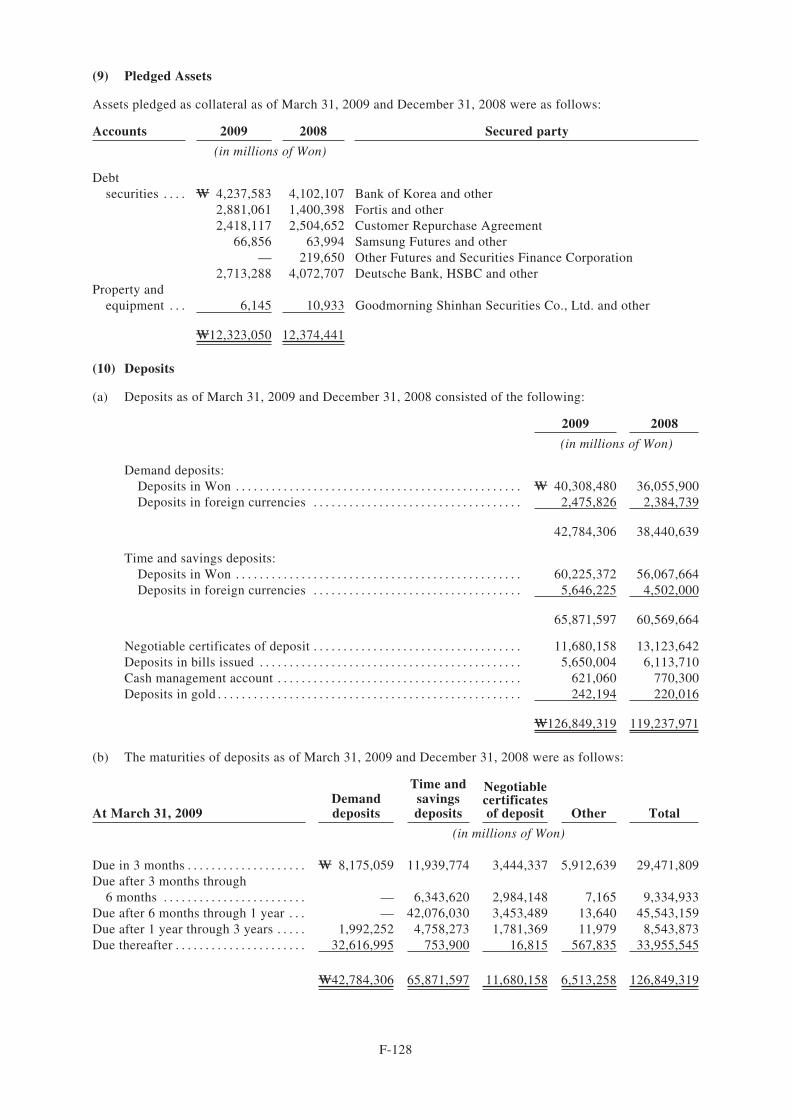
(9) Pledged Assets
Assets pledged as collateral as of March 31, 2009 and December 31, 2008 were as follows:
Accounts 2009 2008 Secured party
(in millions of Won)
Debtsecurities . . . . W 4,237,583 4,102,107 Bank of Korea and other
2,881,061 1,400,398 Fortis and other2,418,117 2,504,652 Customer Repurchase Agreement
66,856 63,994 Samsung Futures and other— 219,650 Other Futures and Securities Finance Corporation
2,713,288 4,072,707 Deutsche Bank, HSBC and otherProperty and
equipment . . . 6,145 10,933 Goodmorning Shinhan Securities Co., Ltd. and other
W12,323,050 12,374,441
(10) Deposits
(a) Deposits as of March 31, 2009 and December 31, 2008 consisted of the following:
2009 2008
(in millions of Won)
Demand deposits:Deposits in Won . . . . . . . . . . . . . . . . . . . . . . . . . . . . . . . . . . . . . . . . . . . . . . . . W 40,308,480 36,055,900Deposits in foreign currencies . . . . . . . . . . . . . . . . . . . . . . . . . . . . . . . . . . . 2,475,826 2,384,739
42,784,306 38,440,639
Time and savings deposits:Deposits in Won . . . . . . . . . . . . . . . . . . . . . . . . . . . . . . . . . . . . . . . . . . . . . . . . 60,225,372 56,067,664Deposits in foreign currencies . . . . . . . . . . . . . . . . . . . . . . . . . . . . . . . . . . . 5,646,225 4,502,000
65,871,597 60,569,664
Negotiable certificates of deposit . . . . . . . . . . . . . . . . . . . . . . . . . . . . . . . . . . . 11,680,158 13,123,642Deposits in bills issued . . . . . . . . . . . . . . . . . . . . . . . . . . . . . . . . . . . . . . . . . . . . 5,650,004 6,113,710Cash management account . . . . . . . . . . . . . . . . . . . . . . . . . . . . . . . . . . . . . . . . . 621,060 770,300Deposits in gold . . . . . . . . . . . . . . . . . . . . . . . . . . . . . . . . . . . . . . . . . . . . . . . . . . . 242,194 220,016
W126,849,319 119,237,971
(b) The maturities of deposits as of March 31, 2009 and December 31, 2008 were as follows:
At March 31, 2009Demanddeposits
Time andsavingsdeposits
Negotiablecertificatesof deposit Other Total
(in millions of Won)
Due in 3 months . . . . . . . . . . . . . . . . . . . . W 8,175,059 11,939,774 3,444,337 5,912,639 29,471,809Due after 3 months through
6 months . . . . . . . . . . . . . . . . . . . . . . . . — 6,343,620 2,984,148 7,165 9,334,933Due after 6 months through 1 year . . . — 42,076,030 3,453,489 13,640 45,543,159Due after 1 year through 3 years . . . . . 1,992,252 4,758,273 1,781,369 11,979 8,543,873Due thereafter . . . . . . . . . . . . . . . . . . . . . . 32,616,995 753,900 16,815 567,835 33,955,545
W42,784,306 65,871,597 11,680,158 6,513,258 126,849,319
F-128
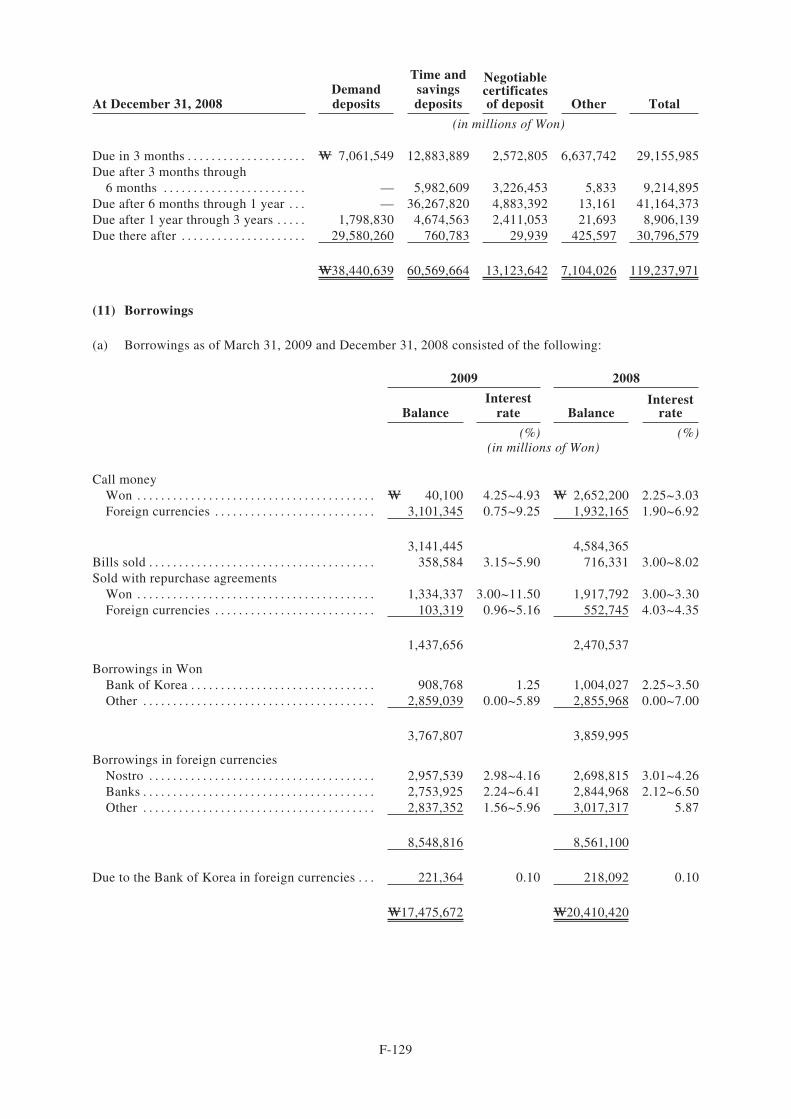
At December 31, 2008Demanddeposits
Time andsavingsdeposits
Negotiablecertificatesof deposit Other Total
(in millions of Won)
Due in 3 months . . . . . . . . . . . . . . . . . . . . W 7,061,549 12,883,889 2,572,805 6,637,742 29,155,985Due after 3 months through
6 months . . . . . . . . . . . . . . . . . . . . . . . . — 5,982,609 3,226,453 5,833 9,214,895Due after 6 months through 1 year . . . — 36,267,820 4,883,392 13,161 41,164,373Due after 1 year through 3 years . . . . . 1,798,830 4,674,563 2,411,053 21,693 8,906,139Due there after . . . . . . . . . . . . . . . . . . . . . 29,580,260 760,783 29,939 425,597 30,796,579
W38,440,639 60,569,664 13,123,642 7,104,026 119,237,971
(11) Borrowings
(a) Borrowings as of March 31, 2009 and December 31, 2008 consisted of the following:
2009 2008
BalanceInterest
rate BalanceInterest
rate
(%) (%)(in millions of Won)
Call moneyWon . . . . . . . . . . . . . . . . . . . . . . . . . . . . . . . . . . . . . . . . W 40,100 4.25~4.93 W 2,652,200 2.25~3.03Foreign currencies . . . . . . . . . . . . . . . . . . . . . . . . . . . 3,101,345 0.75~9.25 1,932,165 1.90~6.92
3,141,445 4,584,365Bills sold . . . . . . . . . . . . . . . . . . . . . . . . . . . . . . . . . . . . . . 358,584 3.15~5.90 716,331 3.00~8.02Sold with repurchase agreements
Won . . . . . . . . . . . . . . . . . . . . . . . . . . . . . . . . . . . . . . . . 1,334,337 3.00~11.50 1,917,792 3.00~3.30Foreign currencies . . . . . . . . . . . . . . . . . . . . . . . . . . . 103,319 0.96~5.16 552,745 4.03~4.35
1,437,656 2,470,537
Borrowings in WonBank of Korea . . . . . . . . . . . . . . . . . . . . . . . . . . . . . . . 908,768 1.25 1,004,027 2.25~3.50Other . . . . . . . . . . . . . . . . . . . . . . . . . . . . . . . . . . . . . . . 2,859,039 0.00~5.89 2,855,968 0.00~7.00
3,767,807 3,859,995
Borrowings in foreign currenciesNostro . . . . . . . . . . . . . . . . . . . . . . . . . . . . . . . . . . . . . . 2,957,539 2.98~4.16 2,698,815 3.01~4.26Banks . . . . . . . . . . . . . . . . . . . . . . . . . . . . . . . . . . . . . . . 2,753,925 2.24~6.41 2,844,968 2.12~6.50Other . . . . . . . . . . . . . . . . . . . . . . . . . . . . . . . . . . . . . . . 2,837,352 1.56~5.96 3,017,317 5.87
8,548,816 8,561,100
Due to the Bank of Korea in foreign currencies . . . 221,364 0.10 218,092 0.10
W17,475,672 W20,410,420
F-129
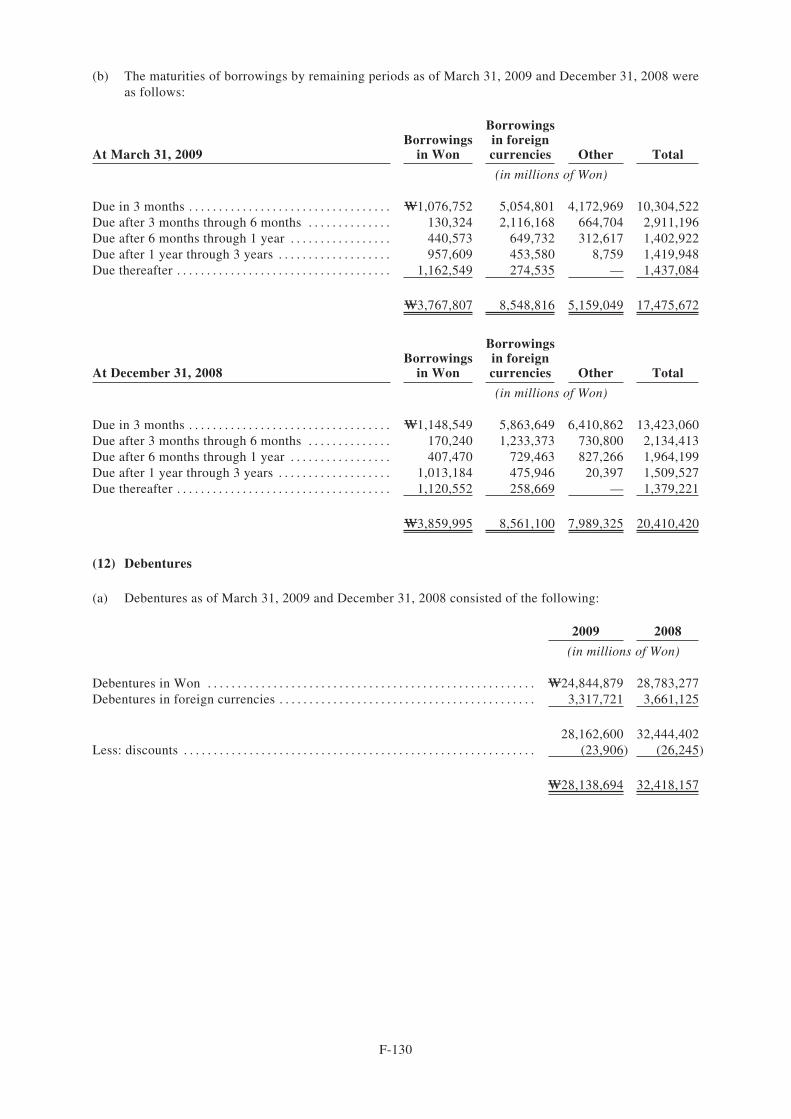
(b) The maturities of borrowings by remaining periods as of March 31, 2009 and December 31, 2008 wereas follows:
At March 31, 2009Borrowings
in Won
Borrowingsin foreigncurrencies Other Total
(in millions of Won)
Due in 3 months . . . . . . . . . . . . . . . . . . . . . . . . . . . . . . . . . . W1,076,752 5,054,801 4,172,969 10,304,522Due after 3 months through 6 months . . . . . . . . . . . . . . 130,324 2,116,168 664,704 2,911,196Due after 6 months through 1 year . . . . . . . . . . . . . . . . . 440,573 649,732 312,617 1,402,922Due after 1 year through 3 years . . . . . . . . . . . . . . . . . . . 957,609 453,580 8,759 1,419,948Due thereafter . . . . . . . . . . . . . . . . . . . . . . . . . . . . . . . . . . . . 1,162,549 274,535 — 1,437,084
W3,767,807 8,548,816 5,159,049 17,475,672
At December 31, 2008Borrowings
in Won
Borrowingsin foreigncurrencies Other Total
(in millions of Won)
Due in 3 months . . . . . . . . . . . . . . . . . . . . . . . . . . . . . . . . . . W1,148,549 5,863,649 6,410,862 13,423,060Due after 3 months through 6 months . . . . . . . . . . . . . . 170,240 1,233,373 730,800 2,134,413Due after 6 months through 1 year . . . . . . . . . . . . . . . . . 407,470 729,463 827,266 1,964,199Due after 1 year through 3 years . . . . . . . . . . . . . . . . . . . 1,013,184 475,946 20,397 1,509,527Due thereafter . . . . . . . . . . . . . . . . . . . . . . . . . . . . . . . . . . . . 1,120,552 258,669 — 1,379,221
W3,859,995 8,561,100 7,989,325 20,410,420
(12) Debentures
(a) Debentures as of March 31, 2009 and December 31, 2008 consisted of the following:
2009 2008
(in millions of Won)
Debentures in Won . . . . . . . . . . . . . . . . . . . . . . . . . . . . . . . . . . . . . . . . . . . . . . . . . . . . . . . W24,844,879 28,783,277Debentures in foreign currencies . . . . . . . . . . . . . . . . . . . . . . . . . . . . . . . . . . . . . . . . . . . 3,317,721 3,661,125
28,162,600 32,444,402Less: discounts . . . . . . . . . . . . . . . . . . . . . . . . . . . . . . . . . . . . . . . . . . . . . . . . . . . . . . . . . . . (23,906) (26,245)
W28,138,694 32,418,157
F-130
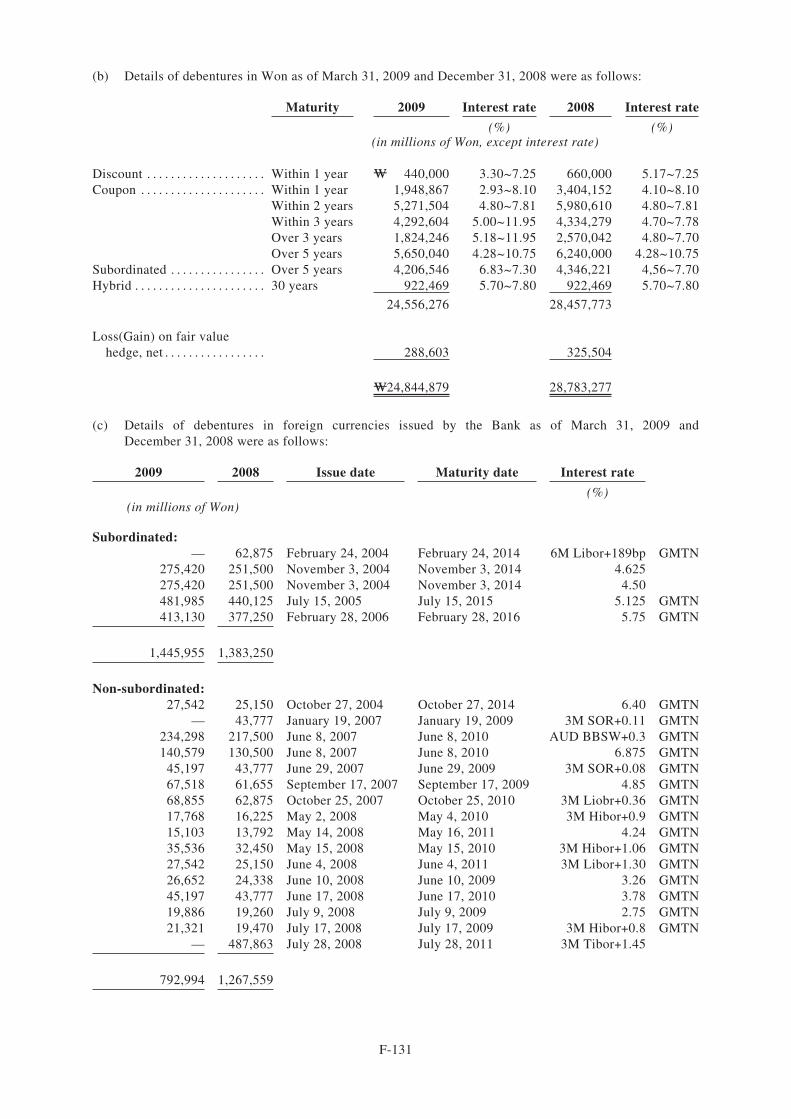
(b) Details of debentures in Won as of March 31, 2009 and December 31, 2008 were as follows:
Maturity 2009 Interest rate 2008 Interest rate
(%) (%)(in millions of Won, except interest rate)
Discount . . . . . . . . . . . . . . . . . . . . Within 1 year W 440,000 3.30~7.25 660,000 5.17~7.25Coupon . . . . . . . . . . . . . . . . . . . . . Within 1 year 1,948,867 2.93~8.10 3,404,152 4.10~8.10
Within 2 years 5,271,504 4.80~7.81 5,980,610 4.80~7.81Within 3 years 4,292,604 5.00~11.95 4,334,279 4.70~7.78Over 3 years 1,824,246 5.18~11.95 2,570,042 4.80~7.70Over 5 years 5,650,040 4.28~10.75 6,240,000 4.28~10.75
Subordinated . . . . . . . . . . . . . . . . Over 5 years 4,206,546 6.83~7.30 4,346,221 4,56~7.70Hybrid . . . . . . . . . . . . . . . . . . . . . . 30 years 922,469 5.70~7.80 922,469 5.70~7.80
24,556,276 28,457,773
Loss(Gain) on fair valuehedge, net . . . . . . . . . . . . . . . . . 288,603 325,504
W24,844,879 28,783,277
(c) Details of debentures in foreign currencies issued by the Bank as of March 31, 2009 andDecember 31, 2008 were as follows:
2009 2008 Issue date Maturity date Interest rate
(%)(in millions of Won)
Subordinated:— 62,875 February 24, 2004 February 24, 2014 6M Libor+189bp GMTN
275,420 251,500 November 3, 2004 November 3, 2014 4.625275,420 251,500 November 3, 2004 November 3, 2014 4.50481,985 440,125 July 15, 2005 July 15, 2015 5.125 GMTN413,130 377,250 February 28, 2006 February 28, 2016 5.75 GMTN
1,445,955 1,383,250
Non-subordinated:27,542 25,150 October 27, 2004 October 27, 2014 6.40 GMTN
— 43,777 January 19, 2007 January 19, 2009 3M SOR+0.11 GMTN234,298 217,500 June 8, 2007 June 8, 2010 AUD BBSW+0.3 GMTN140,579 130,500 June 8, 2007 June 8, 2010 6.875 GMTN
45,197 43,777 June 29, 2007 June 29, 2009 3M SOR+0.08 GMTN67,518 61,655 September 17, 2007 September 17, 2009 4.85 GMTN68,855 62,875 October 25, 2007 October 25, 2010 3M Liobr+0.36 GMTN17,768 16,225 May 2, 2008 May 4, 2010 3M Hibor+0.9 GMTN15,103 13,792 May 14, 2008 May 16, 2011 4.24 GMTN35,536 32,450 May 15, 2008 May 15, 2010 3M Hibor+1.06 GMTN27,542 25,150 June 4, 2008 June 4, 2011 3M Libor+1.30 GMTN26,652 24,338 June 10, 2008 June 10, 2009 3.26 GMTN45,197 43,777 June 17, 2008 June 17, 2010 3.78 GMTN19,886 19,260 July 9, 2008 July 9, 2009 2.75 GMTN21,321 19,470 July 17, 2008 July 17, 2009 3M Hibor+0.8 GMTN
— 487,863 July 28, 2008 July 28, 2011 3M Tibor+1.45
792,994 1,267,559
F-131
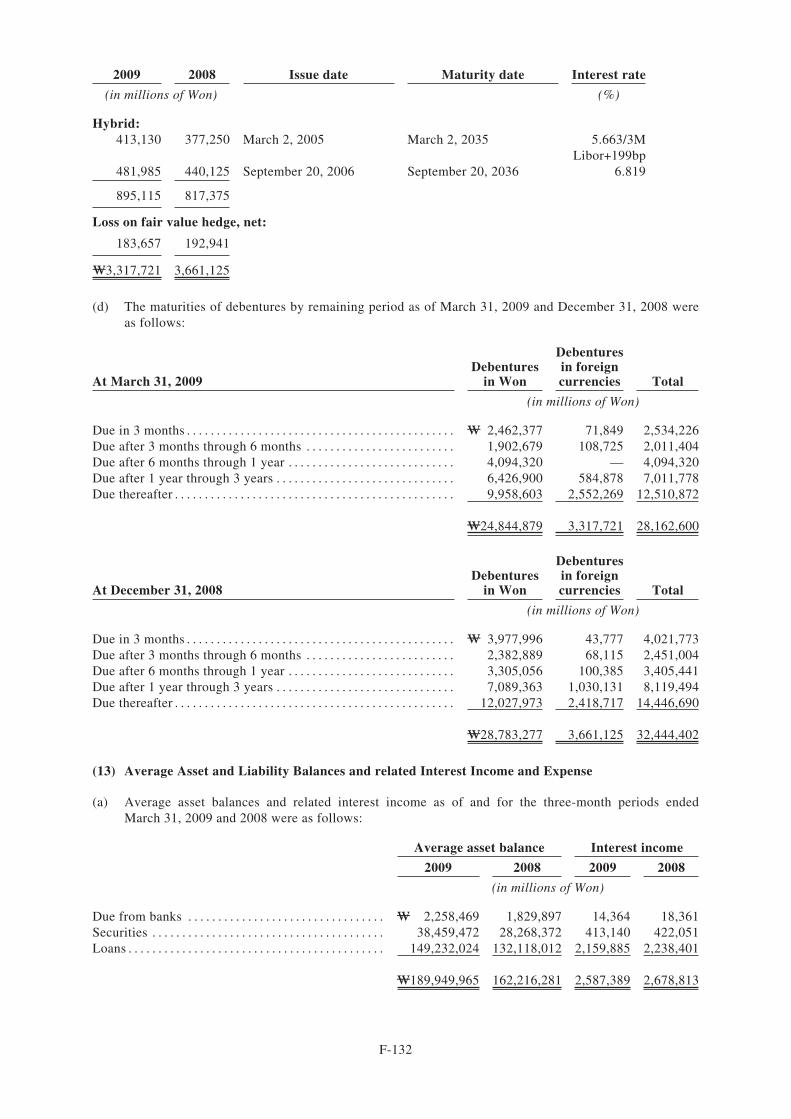
2009 2008 Issue date Maturity date Interest rate
(in millions of Won) (%)
Hybrid:413,130 377,250 March 2, 2005 March 2, 2035 5.663/3M
Libor+199bp481,985 440,125 September 20, 2006 September 20, 2036 6.819
895,115 817,375
Loss on fair value hedge, net:
183,657 192,941
W3,317,721 3,661,125
(d) The maturities of debentures by remaining period as of March 31, 2009 and December 31, 2008 wereas follows:
At March 31, 2009Debentures
in Won
Debenturesin foreigncurrencies Total
(in millions of Won)
Due in 3 months . . . . . . . . . . . . . . . . . . . . . . . . . . . . . . . . . . . . . . . . . . . . . W 2,462,377 71,849 2,534,226Due after 3 months through 6 months . . . . . . . . . . . . . . . . . . . . . . . . . 1,902,679 108,725 2,011,404Due after 6 months through 1 year . . . . . . . . . . . . . . . . . . . . . . . . . . . . 4,094,320 — 4,094,320Due after 1 year through 3 years . . . . . . . . . . . . . . . . . . . . . . . . . . . . . . 6,426,900 584,878 7,011,778Due thereafter . . . . . . . . . . . . . . . . . . . . . . . . . . . . . . . . . . . . . . . . . . . . . . . 9,958,603 2,552,269 12,510,872
W24,844,879 3,317,721 28,162,600
At December 31, 2008Debentures
in Won
Debenturesin foreigncurrencies Total
(in millions of Won)
Due in 3 months . . . . . . . . . . . . . . . . . . . . . . . . . . . . . . . . . . . . . . . . . . . . . W 3,977,996 43,777 4,021,773Due after 3 months through 6 months . . . . . . . . . . . . . . . . . . . . . . . . . 2,382,889 68,115 2,451,004Due after 6 months through 1 year . . . . . . . . . . . . . . . . . . . . . . . . . . . . 3,305,056 100,385 3,405,441Due after 1 year through 3 years . . . . . . . . . . . . . . . . . . . . . . . . . . . . . . 7,089,363 1,030,131 8,119,494Due thereafter . . . . . . . . . . . . . . . . . . . . . . . . . . . . . . . . . . . . . . . . . . . . . . . 12,027,973 2,418,717 14,446,690
W28,783,277 3,661,125 32,444,402
(13) Average Asset and Liability Balances and related Interest Income and Expense
(a) Average asset balances and related interest income as of and for the three-month periods endedMarch 31, 2009 and 2008 were as follows:
Average asset balance Interest income
2009 2008 2009 2008
(in millions of Won)
Due from banks . . . . . . . . . . . . . . . . . . . . . . . . . . . . . . . . . W 2,258,469 1,829,897 14,364 18,361Securities . . . . . . . . . . . . . . . . . . . . . . . . . . . . . . . . . . . . . . . 38,459,472 28,268,372 413,140 422,051Loans . . . . . . . . . . . . . . . . . . . . . . . . . . . . . . . . . . . . . . . . . . . 149,232,024 132,118,012 2,159,885 2,238,401
W189,949,965 162,216,281 2,587,389 2,678,813
F-132
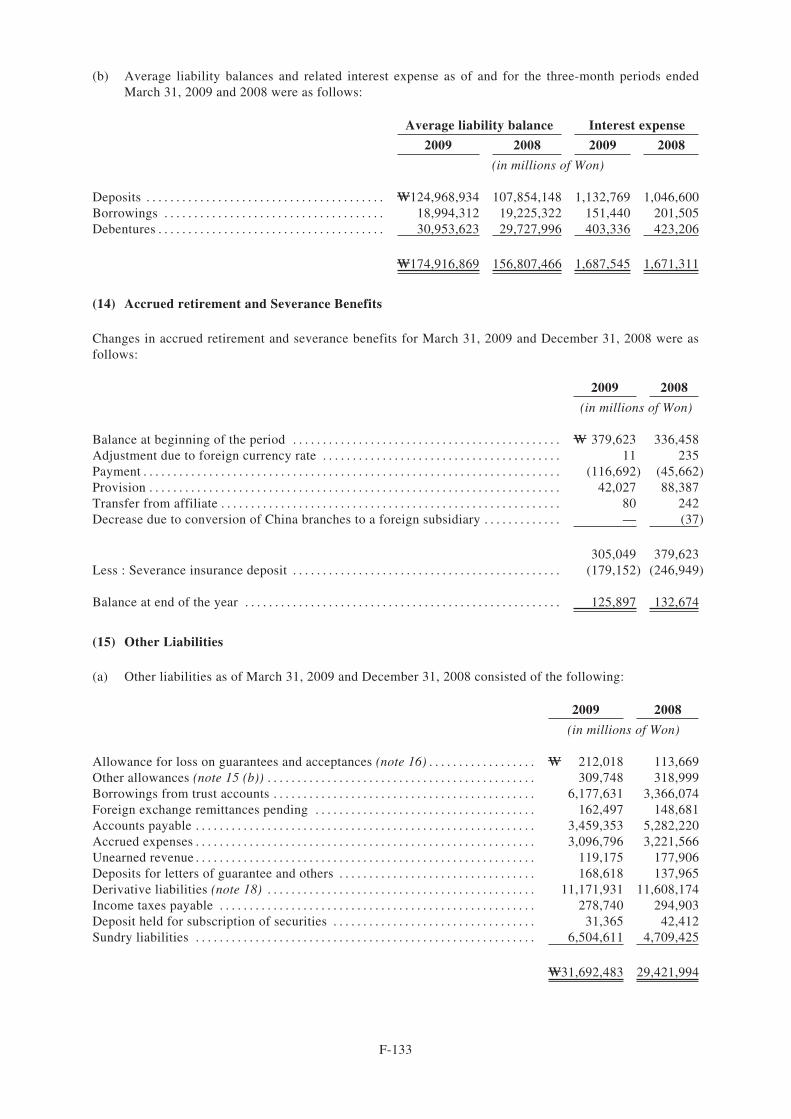
(b) Average liability balances and related interest expense as of and for the three-month periods endedMarch 31, 2009 and 2008 were as follows:
Average liability balance Interest expense
2009 2008 2009 2008
(in millions of Won)
Deposits . . . . . . . . . . . . . . . . . . . . . . . . . . . . . . . . . . . . . . . . W124,968,934 107,854,148 1,132,769 1,046,600Borrowings . . . . . . . . . . . . . . . . . . . . . . . . . . . . . . . . . . . . . 18,994,312 19,225,322 151,440 201,505Debentures . . . . . . . . . . . . . . . . . . . . . . . . . . . . . . . . . . . . . . 30,953,623 29,727,996 403,336 423,206
W174,916,869 156,807,466 1,687,545 1,671,311
(14) Accrued retirement and Severance Benefits
Changes in accrued retirement and severance benefits for March 31, 2009 and December 31, 2008 were asfollows:
2009 2008
(in millions of Won)
Balance at beginning of the period . . . . . . . . . . . . . . . . . . . . . . . . . . . . . . . . . . . . . . . . . . . . . W 379,623 336,458Adjustment due to foreign currency rate . . . . . . . . . . . . . . . . . . . . . . . . . . . . . . . . . . . . . . . . 11 235Payment . . . . . . . . . . . . . . . . . . . . . . . . . . . . . . . . . . . . . . . . . . . . . . . . . . . . . . . . . . . . . . . . . . . . . . (116,692) (45,662)Provision . . . . . . . . . . . . . . . . . . . . . . . . . . . . . . . . . . . . . . . . . . . . . . . . . . . . . . . . . . . . . . . . . . . . . 42,027 88,387Transfer from affiliate . . . . . . . . . . . . . . . . . . . . . . . . . . . . . . . . . . . . . . . . . . . . . . . . . . . . . . . . . 80 242Decrease due to conversion of China branches to a foreign subsidiary . . . . . . . . . . . . . — (37)
305,049 379,623Less : Severance insurance deposit . . . . . . . . . . . . . . . . . . . . . . . . . . . . . . . . . . . . . . . . . . . . . (179,152) (246,949)
Balance at end of the year . . . . . . . . . . . . . . . . . . . . . . . . . . . . . . . . . . . . . . . . . . . . . . . . . . . . . 125,897 132,674
(15) Other Liabilities
(a) Other liabilities as of March 31, 2009 and December 31, 2008 consisted of the following:
2009 2008
(in millions of Won)
Allowance for loss on guarantees and acceptances (note 16) . . . . . . . . . . . . . . . . . . W 212,018 113,669Other allowances (note 15 (b)) . . . . . . . . . . . . . . . . . . . . . . . . . . . . . . . . . . . . . . . . . . . . . 309,748 318,999Borrowings from trust accounts . . . . . . . . . . . . . . . . . . . . . . . . . . . . . . . . . . . . . . . . . . . . 6,177,631 3,366,074Foreign exchange remittances pending . . . . . . . . . . . . . . . . . . . . . . . . . . . . . . . . . . . . . 162,497 148,681Accounts payable . . . . . . . . . . . . . . . . . . . . . . . . . . . . . . . . . . . . . . . . . . . . . . . . . . . . . . . . . 3,459,353 5,282,220Accrued expenses . . . . . . . . . . . . . . . . . . . . . . . . . . . . . . . . . . . . . . . . . . . . . . . . . . . . . . . . . 3,096,796 3,221,566Unearned revenue . . . . . . . . . . . . . . . . . . . . . . . . . . . . . . . . . . . . . . . . . . . . . . . . . . . . . . . . . 119,175 177,906Deposits for letters of guarantee and others . . . . . . . . . . . . . . . . . . . . . . . . . . . . . . . . . 168,618 137,965Derivative liabilities (note 18) . . . . . . . . . . . . . . . . . . . . . . . . . . . . . . . . . . . . . . . . . . . . . 11,171,931 11,608,174Income taxes payable . . . . . . . . . . . . . . . . . . . . . . . . . . . . . . . . . . . . . . . . . . . . . . . . . . . . . 278,740 294,903Deposit held for subscription of securities . . . . . . . . . . . . . . . . . . . . . . . . . . . . . . . . . . 31,365 42,412Sundry liabilities . . . . . . . . . . . . . . . . . . . . . . . . . . . . . . . . . . . . . . . . . . . . . . . . . . . . . . . . . 6,504,611 4,709,425
W31,692,483 29,421,994
F-133
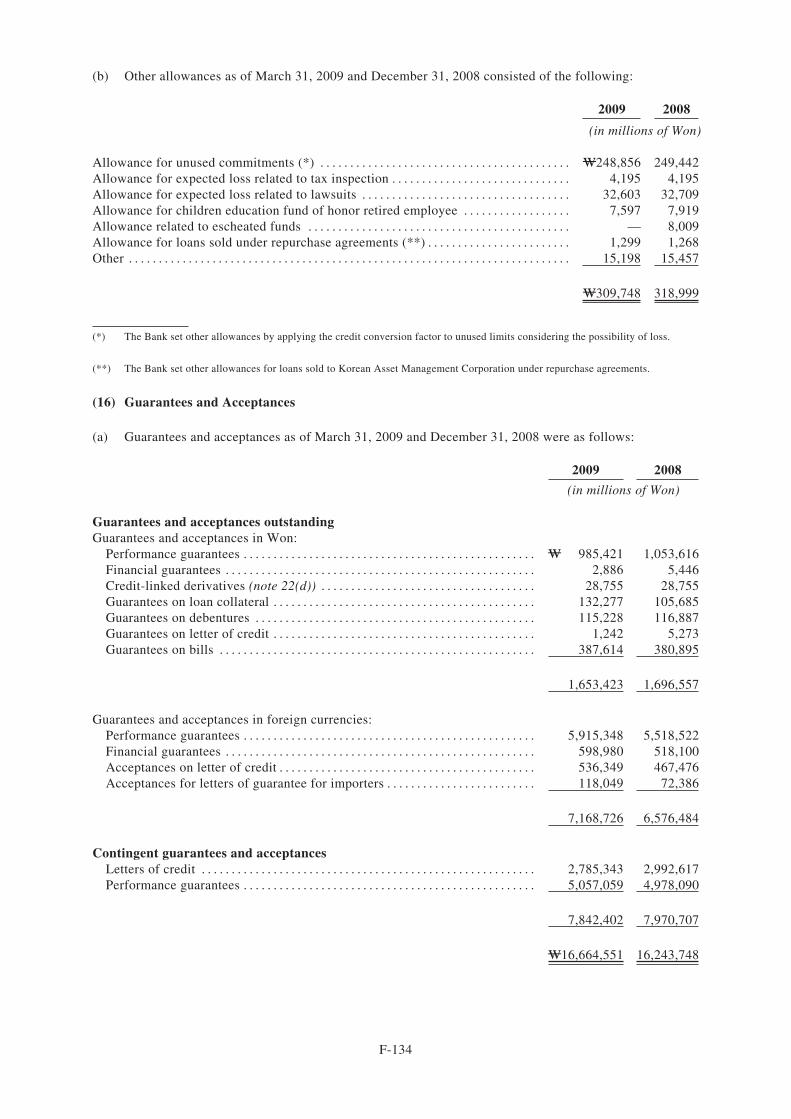
(b) Other allowances as of March 31, 2009 and December 31, 2008 consisted of the following:
2009 2008
(in millions of Won)
Allowance for unused commitments (*) . . . . . . . . . . . . . . . . . . . . . . . . . . . . . . . . . . . . . . . . . . W248,856 249,442Allowance for expected loss related to tax inspection . . . . . . . . . . . . . . . . . . . . . . . . . . . . . . 4,195 4,195Allowance for expected loss related to lawsuits . . . . . . . . . . . . . . . . . . . . . . . . . . . . . . . . . . . 32,603 32,709Allowance for children education fund of honor retired employee . . . . . . . . . . . . . . . . . . 7,597 7,919Allowance related to escheated funds . . . . . . . . . . . . . . . . . . . . . . . . . . . . . . . . . . . . . . . . . . . . — 8,009Allowance for loans sold under repurchase agreements (**) . . . . . . . . . . . . . . . . . . . . . . . . 1,299 1,268Other . . . . . . . . . . . . . . . . . . . . . . . . . . . . . . . . . . . . . . . . . . . . . . . . . . . . . . . . . . . . . . . . . . . . . . . . . . 15,198 15,457
W309,748 318,999
(*) The Bank set other allowances by applying the credit conversion factor to unused limits considering the possibility of loss.
(**) The Bank set other allowances for loans sold to Korean Asset Management Corporation under repurchase agreements.
(16) Guarantees and Acceptances
(a) Guarantees and acceptances as of March 31, 2009 and December 31, 2008 were as follows:
2009 2008
(in millions of Won)
Guarantees and acceptances outstandingGuarantees and acceptances in Won:
Performance guarantees . . . . . . . . . . . . . . . . . . . . . . . . . . . . . . . . . . . . . . . . . . . . . . . . . W 985,421 1,053,616Financial guarantees . . . . . . . . . . . . . . . . . . . . . . . . . . . . . . . . . . . . . . . . . . . . . . . . . . . . 2,886 5,446Credit-linked derivatives (note 22(d)) . . . . . . . . . . . . . . . . . . . . . . . . . . . . . . . . . . . . 28,755 28,755Guarantees on loan collateral . . . . . . . . . . . . . . . . . . . . . . . . . . . . . . . . . . . . . . . . . . . . 132,277 105,685Guarantees on debentures . . . . . . . . . . . . . . . . . . . . . . . . . . . . . . . . . . . . . . . . . . . . . . . 115,228 116,887Guarantees on letter of credit . . . . . . . . . . . . . . . . . . . . . . . . . . . . . . . . . . . . . . . . . . . . 1,242 5,273Guarantees on bills . . . . . . . . . . . . . . . . . . . . . . . . . . . . . . . . . . . . . . . . . . . . . . . . . . . . . 387,614 380,895
1,653,423 1,696,557
Guarantees and acceptances in foreign currencies:Performance guarantees . . . . . . . . . . . . . . . . . . . . . . . . . . . . . . . . . . . . . . . . . . . . . . . . . 5,915,348 5,518,522Financial guarantees . . . . . . . . . . . . . . . . . . . . . . . . . . . . . . . . . . . . . . . . . . . . . . . . . . . . 598,980 518,100Acceptances on letter of credit . . . . . . . . . . . . . . . . . . . . . . . . . . . . . . . . . . . . . . . . . . . 536,349 467,476Acceptances for letters of guarantee for importers . . . . . . . . . . . . . . . . . . . . . . . . . 118,049 72,386
7,168,726 6,576,484
Contingent guarantees and acceptancesLetters of credit . . . . . . . . . . . . . . . . . . . . . . . . . . . . . . . . . . . . . . . . . . . . . . . . . . . . . . . . 2,785,343 2,992,617Performance guarantees . . . . . . . . . . . . . . . . . . . . . . . . . . . . . . . . . . . . . . . . . . . . . . . . . 5,057,059 4,978,090
7,842,402 7,970,707
W16,664,551 16,243,748
F-134
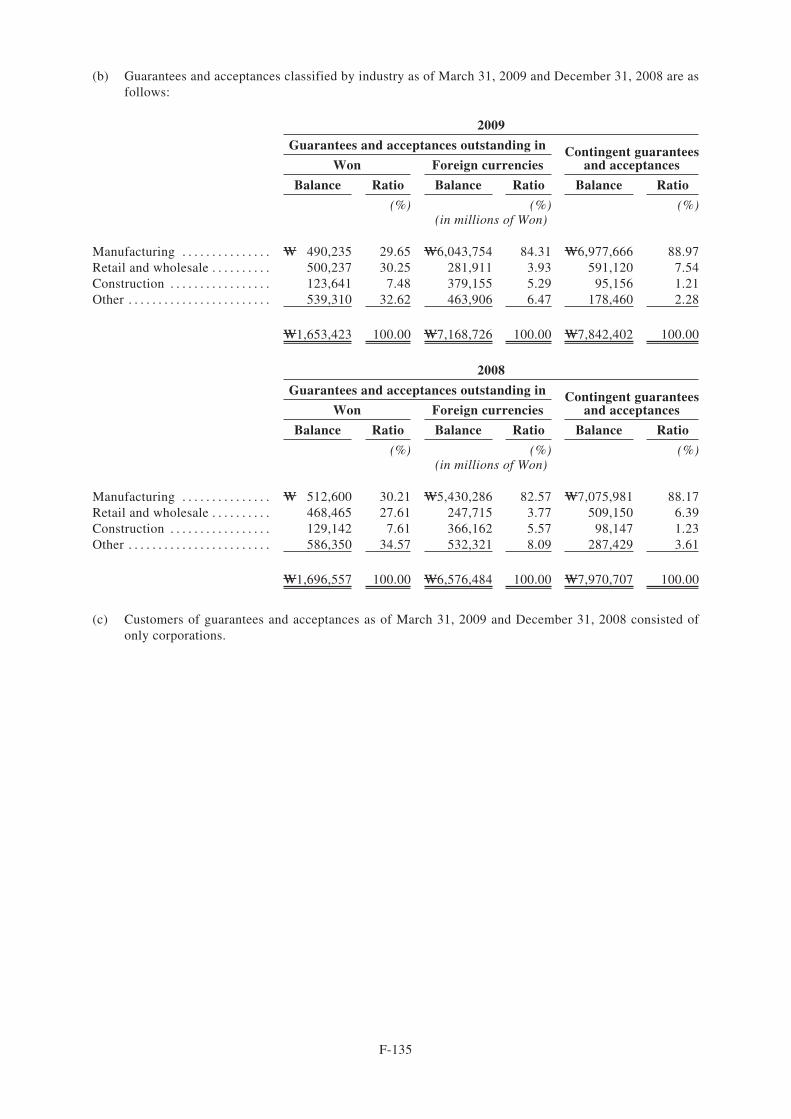
(b) Guarantees and acceptances classified by industry as of March 31, 2009 and December 31, 2008 are asfollows:
2009
Guarantees and acceptances outstanding in Contingent guaranteesand acceptancesWon Foreign currencies
Balance Ratio Balance Ratio Balance Ratio
(%) (%) (%)(in millions of Won)
Manufacturing . . . . . . . . . . . . . . . W 490,235 29.65 W6,043,754 84.31 W6,977,666 88.97Retail and wholesale . . . . . . . . . . 500,237 30.25 281,911 3.93 591,120 7.54Construction . . . . . . . . . . . . . . . . . 123,641 7.48 379,155 5.29 95,156 1.21Other . . . . . . . . . . . . . . . . . . . . . . . . 539,310 32.62 463,906 6.47 178,460 2.28
W1,653,423 100.00 W7,168,726 100.00 W7,842,402 100.00
2008
Guarantees and acceptances outstanding in Contingent guaranteesand acceptancesWon Foreign currencies
Balance Ratio Balance Ratio Balance Ratio
(%) (%) (%)(in millions of Won)
Manufacturing . . . . . . . . . . . . . . . W 512,600 30.21 W5,430,286 82.57 W7,075,981 88.17Retail and wholesale . . . . . . . . . . 468,465 27.61 247,715 3.77 509,150 6.39Construction . . . . . . . . . . . . . . . . . 129,142 7.61 366,162 5.57 98,147 1.23Other . . . . . . . . . . . . . . . . . . . . . . . . 586,350 34.57 532,321 8.09 287,429 3.61
W1,696,557 100.00 W6,576,484 100.00 W7,970,707 100.00
(c) Customers of guarantees and acceptances as of March 31, 2009 and December 31, 2008 consisted ofonly corporations.
F-135
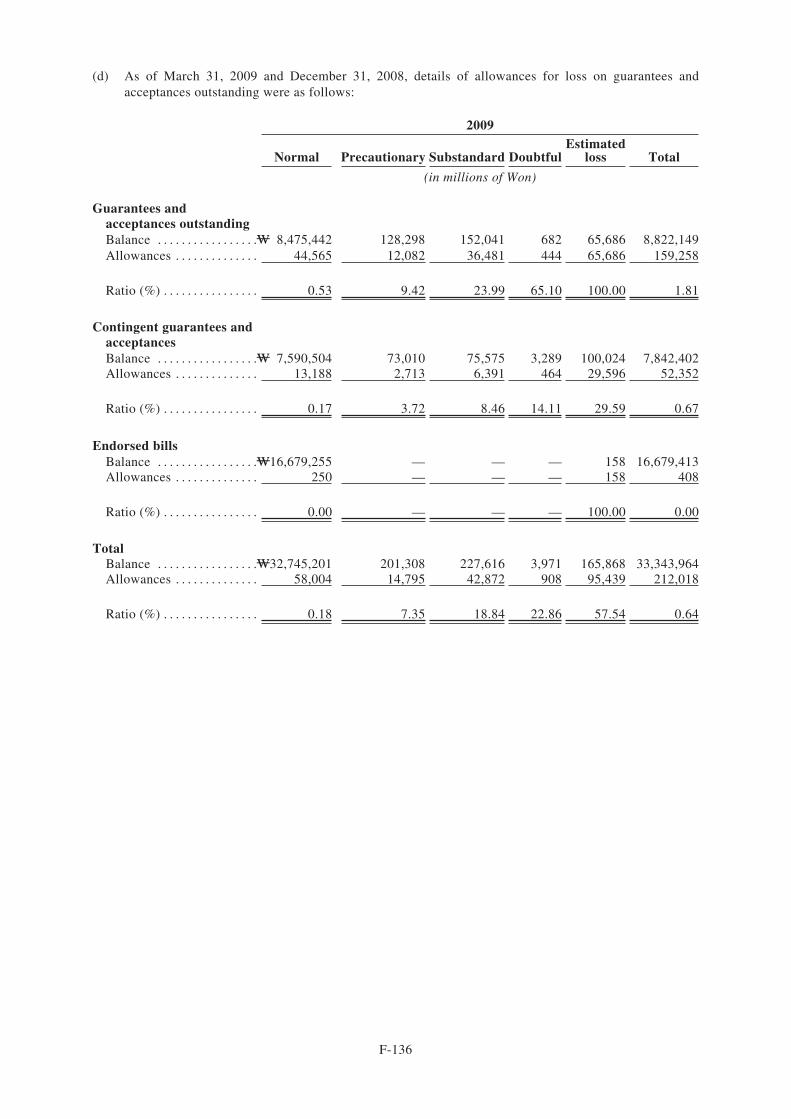
(d) As of March 31, 2009 and December 31, 2008, details of allowances for loss on guarantees andacceptances outstanding were as follows:
2009
Normal Precautionary Substandard DoubtfulEstimated
loss Total
(in millions of Won)
Guarantees andacceptances outstandingBalance . . . . . . . . . . . . . . . . .W 8,475,442 128,298 152,041 682 65,686 8,822,149Allowances . . . . . . . . . . . . . . 44,565 12,082 36,481 444 65,686 159,258
Ratio (%) . . . . . . . . . . . . . . . . 0.53 9.42 23.99 65.10 100.00 1.81
Contingent guarantees andacceptancesBalance . . . . . . . . . . . . . . . . .W 7,590,504 73,010 75,575 3,289 100,024 7,842,402Allowances . . . . . . . . . . . . . . 13,188 2,713 6,391 464 29,596 52,352
Ratio (%) . . . . . . . . . . . . . . . . 0.17 3.72 8.46 14.11 29.59 0.67
Endorsed billsBalance . . . . . . . . . . . . . . . . .W16,679,255 — — — 158 16,679,413Allowances . . . . . . . . . . . . . . 250 — — — 158 408
Ratio (%) . . . . . . . . . . . . . . . . 0.00 — — — 100.00 0.00
TotalBalance . . . . . . . . . . . . . . . . .W32,745,201 201,308 227,616 3,971 165,868 33,343,964Allowances . . . . . . . . . . . . . . 58,004 14,795 42,872 908 95,439 212,018
Ratio (%) . . . . . . . . . . . . . . . . 0.18 7.35 18.84 22.86 57.54 0.64
F-136
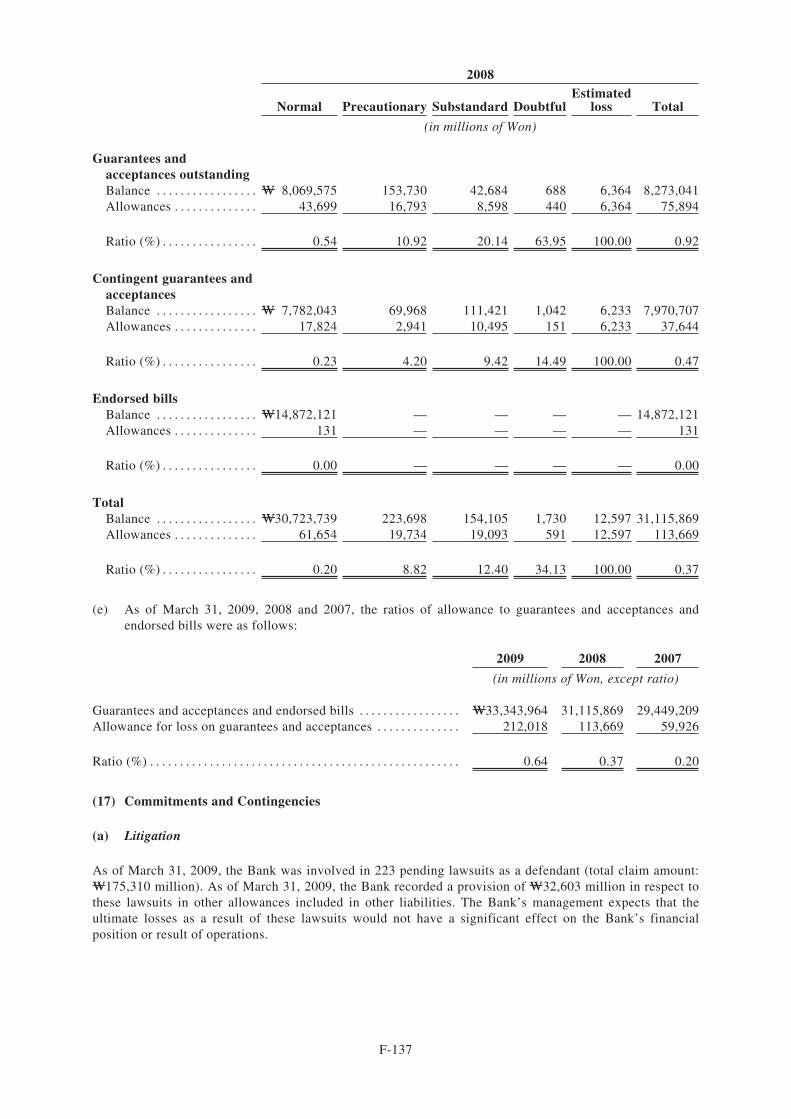
2008
Normal Precautionary Substandard DoubtfulEstimated
loss Total
(in millions of Won)
Guarantees andacceptances outstandingBalance . . . . . . . . . . . . . . . . . W 8,069,575 153,730 42,684 688 6,364 8,273,041Allowances . . . . . . . . . . . . . . 43,699 16,793 8,598 440 6,364 75,894
Ratio (%) . . . . . . . . . . . . . . . . 0.54 10.92 20.14 63.95 100.00 0.92
Contingent guarantees andacceptancesBalance . . . . . . . . . . . . . . . . . W 7,782,043 69,968 111,421 1,042 6,233 7,970,707Allowances . . . . . . . . . . . . . . 17,824 2,941 10,495 151 6,233 37,644
Ratio (%) . . . . . . . . . . . . . . . . 0.23 4.20 9.42 14.49 100.00 0.47
Endorsed billsBalance . . . . . . . . . . . . . . . . . W14,872,121 — — — — 14,872,121Allowances . . . . . . . . . . . . . . 131 — — — — 131
Ratio (%) . . . . . . . . . . . . . . . . 0.00 — — — — 0.00
TotalBalance . . . . . . . . . . . . . . . . . W30,723,739 223,698 154,105 1,730 12,597 31,115,869Allowances . . . . . . . . . . . . . . 61,654 19,734 19,093 591 12,597 113,669
Ratio (%) . . . . . . . . . . . . . . . . 0.20 8.82 12.40 34.13 100.00 0.37
(e) As of March 31, 2009, 2008 and 2007, the ratios of allowance to guarantees and acceptances andendorsed bills were as follows:
2009 2008 2007
(in millions of Won, except ratio)
Guarantees and acceptances and endorsed bills . . . . . . . . . . . . . . . . . W33,343,964 31,115,869 29,449,209Allowance for loss on guarantees and acceptances . . . . . . . . . . . . . . 212,018 113,669 59,926
Ratio (%) . . . . . . . . . . . . . . . . . . . . . . . . . . . . . . . . . . . . . . . . . . . . . . . . . . . . 0.64 0.37 0.20
(17) Commitments and Contingencies
(a) Litigation
As of March 31, 2009, the Bank was involved in 223 pending lawsuits as a defendant (total claim amount:W175,310 million). As of March 31, 2009, the Bank recorded a provision of W32,603 million in respect tothese lawsuits in other allowances included in other liabilities. The Bank’s management expects that theultimate losses as a result of these lawsuits would not have a significant effect on the Bank’s financialposition or result of operations.
F-137
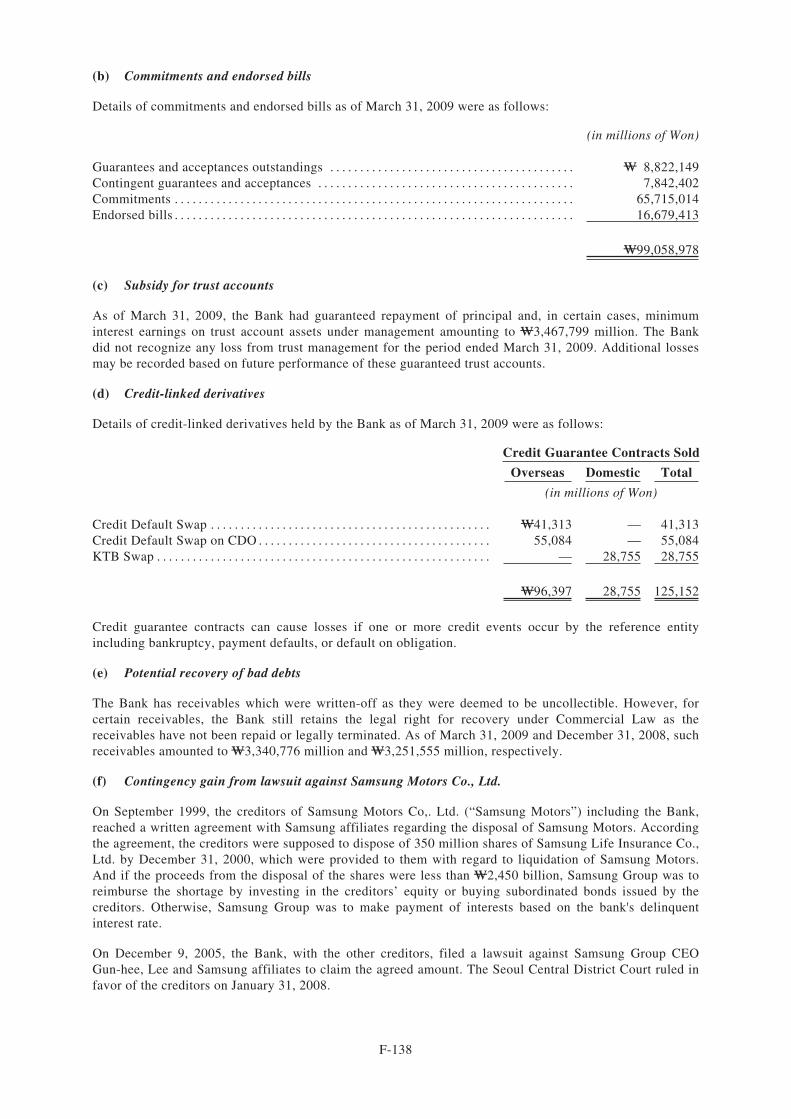
(b) Commitments and endorsed bills
Details of commitments and endorsed bills as of March 31, 2009 were as follows:
(in millions of Won)
Guarantees and acceptances outstandings . . . . . . . . . . . . . . . . . . . . . . . . . . . . . . . . . . . . . . . . . W 8,822,149Contingent guarantees and acceptances . . . . . . . . . . . . . . . . . . . . . . . . . . . . . . . . . . . . . . . . . . . 7,842,402Commitments . . . . . . . . . . . . . . . . . . . . . . . . . . . . . . . . . . . . . . . . . . . . . . . . . . . . . . . . . . . . . . . . . . . 65,715,014Endorsed bills . . . . . . . . . . . . . . . . . . . . . . . . . . . . . . . . . . . . . . . . . . . . . . . . . . . . . . . . . . . . . . . . . . . 16,679,413
W99,058,978
(c) Subsidy for trust accounts
As of March 31, 2009, the Bank had guaranteed repayment of principal and, in certain cases, minimuminterest earnings on trust account assets under management amounting to W3,467,799 million. The Bankdid not recognize any loss from trust management for the period ended March 31, 2009. Additional lossesmay be recorded based on future performance of these guaranteed trust accounts.
(d) Credit-linked derivatives
Details of credit-linked derivatives held by the Bank as of March 31, 2009 were as follows:
Credit Guarantee Contracts Sold
Overseas Domestic Total
(in millions of Won)
Credit Default Swap . . . . . . . . . . . . . . . . . . . . . . . . . . . . . . . . . . . . . . . . . . . . . . . W41,313 — 41,313Credit Default Swap on CDO . . . . . . . . . . . . . . . . . . . . . . . . . . . . . . . . . . . . . . . 55,084 — 55,084KTB Swap . . . . . . . . . . . . . . . . . . . . . . . . . . . . . . . . . . . . . . . . . . . . . . . . . . . . . . . . — 28,755 28,755
W96,397 28,755 125,152
Credit guarantee contracts can cause losses if one or more credit events occur by the reference entityincluding bankruptcy, payment defaults, or default on obligation.
(e) Potential recovery of bad debts
The Bank has receivables which were written-off as they were deemed to be uncollectible. However, forcertain receivables, the Bank still retains the legal right for recovery under Commercial Law as thereceivables have not been repaid or legally terminated. As of March 31, 2009 and December 31, 2008, suchreceivables amounted to W3,340,776 million and W3,251,555 million, respectively.
(f) Contingency gain from lawsuit against Samsung Motors Co., Ltd.
On September 1999, the creditors of Samsung Motors Co,. Ltd. (“Samsung Motors”) including the Bank,reached a written agreement with Samsung affiliates regarding the disposal of Samsung Motors. Accordingthe agreement, the creditors were supposed to dispose of 350 million shares of Samsung Life Insurance Co.,Ltd. by December 31, 2000, which were provided to them with regard to liquidation of Samsung Motors.And if the proceeds from the disposal of the shares were less than W2,450 billion, Samsung Group was toreimburse the shortage by investing in the creditors’ equity or buying subordinated bonds issued by thecreditors. Otherwise, Samsung Group was to make payment of interests based on the bank's delinquentinterest rate.
On December 9, 2005, the Bank, with the other creditors, filed a lawsuit against Samsung Group CEOGun-hee, Lee and Samsung affiliates to claim the agreed amount. The Seoul Central District Court ruled infavor of the creditors on January 31, 2008.
F-138
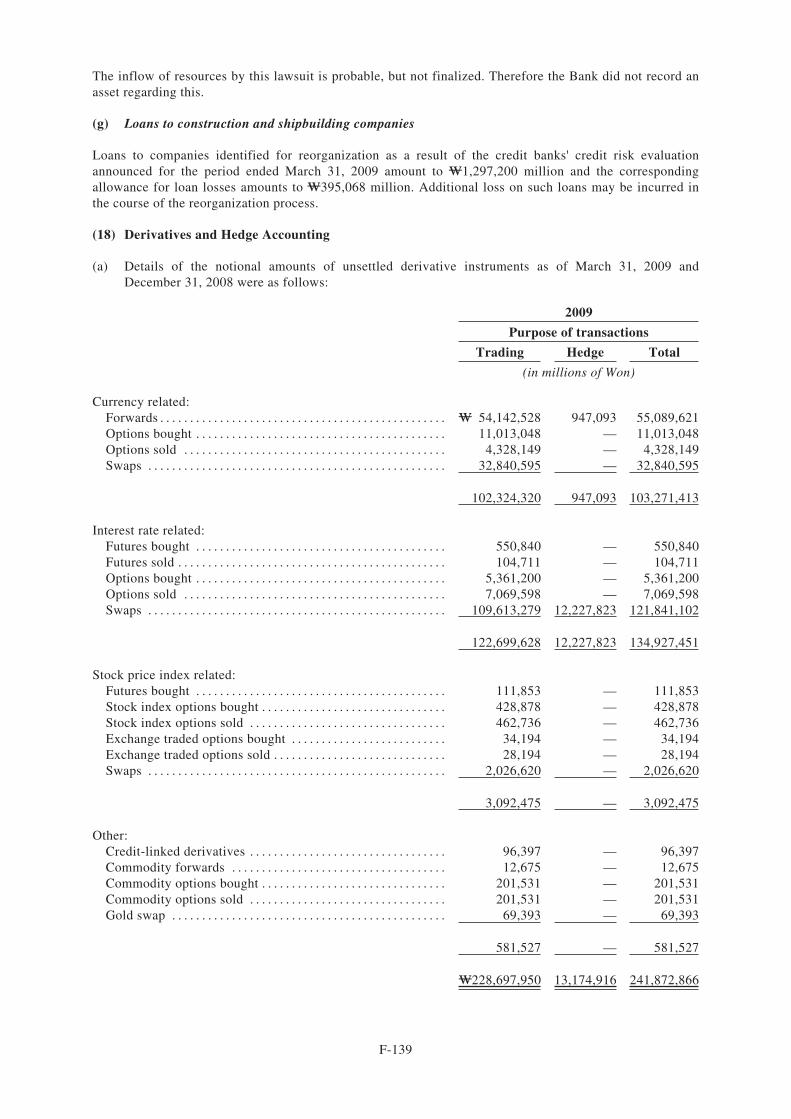
The inflow of resources by this lawsuit is probable, but not finalized. Therefore the Bank did not record anasset regarding this.
(g) Loans to construction and shipbuilding companies
Loans to companies identified for reorganization as a result of the credit banks' credit risk evaluationannounced for the period ended March 31, 2009 amount to W1,297,200 million and the correspondingallowance for loan losses amounts to W395,068 million. Additional loss on such loans may be incurred inthe course of the reorganization process.
(18) Derivatives and Hedge Accounting
(a) Details of the notional amounts of unsettled derivative instruments as of March 31, 2009 andDecember 31, 2008 were as follows:
2009
Purpose of transactions
Trading Hedge Total
(in millions of Won)
Currency related:Forwards . . . . . . . . . . . . . . . . . . . . . . . . . . . . . . . . . . . . . . . . . . . . . . . . W 54,142,528 947,093 55,089,621Options bought . . . . . . . . . . . . . . . . . . . . . . . . . . . . . . . . . . . . . . . . . . 11,013,048 — 11,013,048Options sold . . . . . . . . . . . . . . . . . . . . . . . . . . . . . . . . . . . . . . . . . . . . 4,328,149 — 4,328,149Swaps . . . . . . . . . . . . . . . . . . . . . . . . . . . . . . . . . . . . . . . . . . . . . . . . . . 32,840,595 — 32,840,595
102,324,320 947,093 103,271,413
Interest rate related:Futures bought . . . . . . . . . . . . . . . . . . . . . . . . . . . . . . . . . . . . . . . . . . 550,840 — 550,840Futures sold . . . . . . . . . . . . . . . . . . . . . . . . . . . . . . . . . . . . . . . . . . . . . 104,711 — 104,711Options bought . . . . . . . . . . . . . . . . . . . . . . . . . . . . . . . . . . . . . . . . . . 5,361,200 — 5,361,200Options sold . . . . . . . . . . . . . . . . . . . . . . . . . . . . . . . . . . . . . . . . . . . . 7,069,598 — 7,069,598Swaps . . . . . . . . . . . . . . . . . . . . . . . . . . . . . . . . . . . . . . . . . . . . . . . . . . 109,613,279 12,227,823 121,841,102
122,699,628 12,227,823 134,927,451
Stock price index related:Futures bought . . . . . . . . . . . . . . . . . . . . . . . . . . . . . . . . . . . . . . . . . . 111,853 — 111,853Stock index options bought . . . . . . . . . . . . . . . . . . . . . . . . . . . . . . . 428,878 — 428,878Stock index options sold . . . . . . . . . . . . . . . . . . . . . . . . . . . . . . . . . 462,736 — 462,736Exchange traded options bought . . . . . . . . . . . . . . . . . . . . . . . . . . 34,194 — 34,194Exchange traded options sold . . . . . . . . . . . . . . . . . . . . . . . . . . . . . 28,194 — 28,194Swaps . . . . . . . . . . . . . . . . . . . . . . . . . . . . . . . . . . . . . . . . . . . . . . . . . . 2,026,620 — 2,026,620
3,092,475 — 3,092,475
Other:Credit-linked derivatives . . . . . . . . . . . . . . . . . . . . . . . . . . . . . . . . . 96,397 — 96,397Commodity forwards . . . . . . . . . . . . . . . . . . . . . . . . . . . . . . . . . . . . 12,675 — 12,675Commodity options bought . . . . . . . . . . . . . . . . . . . . . . . . . . . . . . . 201,531 — 201,531Commodity options sold . . . . . . . . . . . . . . . . . . . . . . . . . . . . . . . . . 201,531 — 201,531Gold swap . . . . . . . . . . . . . . . . . . . . . . . . . . . . . . . . . . . . . . . . . . . . . . 69,393 — 69,393
581,527 — 581,527
W228,697,950 13,174,916 241,872,866
F-139
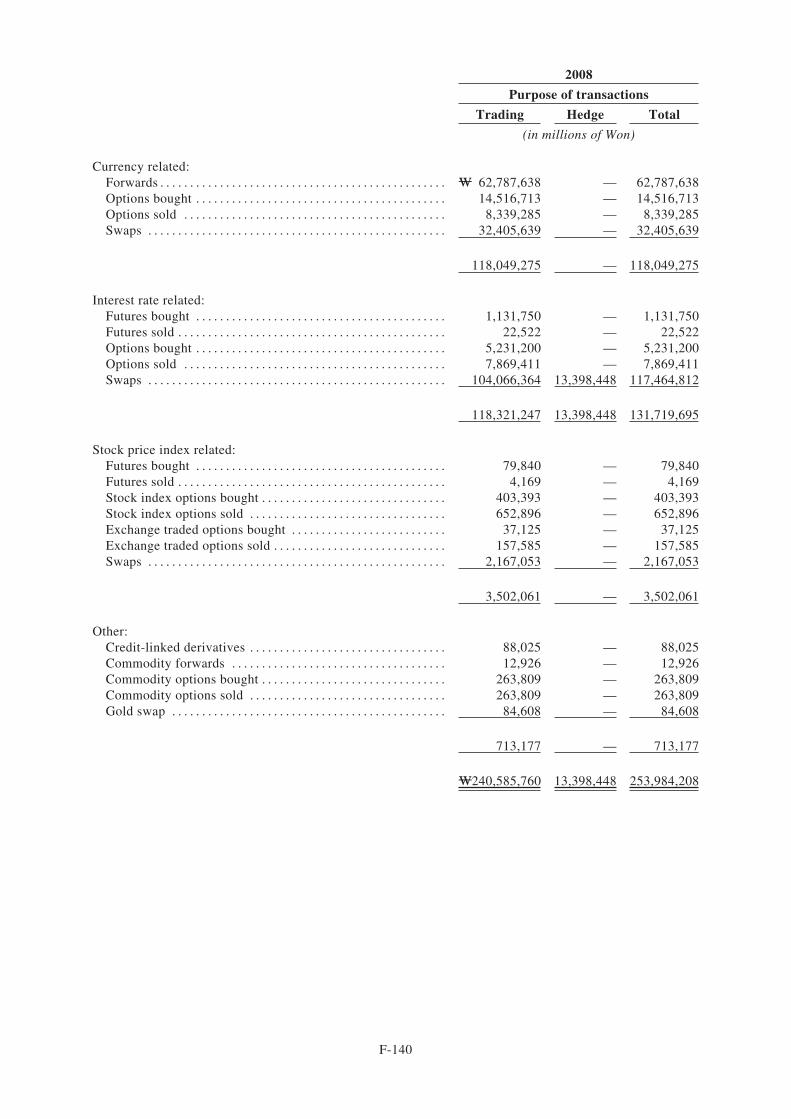
2008
Purpose of transactions
Trading Hedge Total
(in millions of Won)
Currency related:Forwards . . . . . . . . . . . . . . . . . . . . . . . . . . . . . . . . . . . . . . . . . . . . . . . . W 62,787,638 — 62,787,638Options bought . . . . . . . . . . . . . . . . . . . . . . . . . . . . . . . . . . . . . . . . . . 14,516,713 — 14,516,713Options sold . . . . . . . . . . . . . . . . . . . . . . . . . . . . . . . . . . . . . . . . . . . . 8,339,285 — 8,339,285Swaps . . . . . . . . . . . . . . . . . . . . . . . . . . . . . . . . . . . . . . . . . . . . . . . . . . 32,405,639 — 32,405,639
118,049,275 — 118,049,275
Interest rate related:Futures bought . . . . . . . . . . . . . . . . . . . . . . . . . . . . . . . . . . . . . . . . . . 1,131,750 — 1,131,750Futures sold . . . . . . . . . . . . . . . . . . . . . . . . . . . . . . . . . . . . . . . . . . . . . 22,522 — 22,522Options bought . . . . . . . . . . . . . . . . . . . . . . . . . . . . . . . . . . . . . . . . . . 5,231,200 — 5,231,200Options sold . . . . . . . . . . . . . . . . . . . . . . . . . . . . . . . . . . . . . . . . . . . . 7,869,411 — 7,869,411Swaps . . . . . . . . . . . . . . . . . . . . . . . . . . . . . . . . . . . . . . . . . . . . . . . . . . 104,066,364 13,398,448 117,464,812
118,321,247 13,398,448 131,719,695
Stock price index related:Futures bought . . . . . . . . . . . . . . . . . . . . . . . . . . . . . . . . . . . . . . . . . . 79,840 — 79,840Futures sold . . . . . . . . . . . . . . . . . . . . . . . . . . . . . . . . . . . . . . . . . . . . . 4,169 — 4,169Stock index options bought . . . . . . . . . . . . . . . . . . . . . . . . . . . . . . . 403,393 — 403,393Stock index options sold . . . . . . . . . . . . . . . . . . . . . . . . . . . . . . . . . 652,896 — 652,896Exchange traded options bought . . . . . . . . . . . . . . . . . . . . . . . . . . 37,125 — 37,125Exchange traded options sold . . . . . . . . . . . . . . . . . . . . . . . . . . . . . 157,585 — 157,585Swaps . . . . . . . . . . . . . . . . . . . . . . . . . . . . . . . . . . . . . . . . . . . . . . . . . . 2,167,053 — 2,167,053
3,502,061 — 3,502,061
Other:Credit-linked derivatives . . . . . . . . . . . . . . . . . . . . . . . . . . . . . . . . . 88,025 — 88,025Commodity forwards . . . . . . . . . . . . . . . . . . . . . . . . . . . . . . . . . . . . 12,926 — 12,926Commodity options bought . . . . . . . . . . . . . . . . . . . . . . . . . . . . . . . 263,809 — 263,809Commodity options sold . . . . . . . . . . . . . . . . . . . . . . . . . . . . . . . . . 263,809 — 263,809Gold swap . . . . . . . . . . . . . . . . . . . . . . . . . . . . . . . . . . . . . . . . . . . . . . 84,608 — 84,608
713,177 — 713,177
W240,585,760 13,398,448 253,984,208
F-140
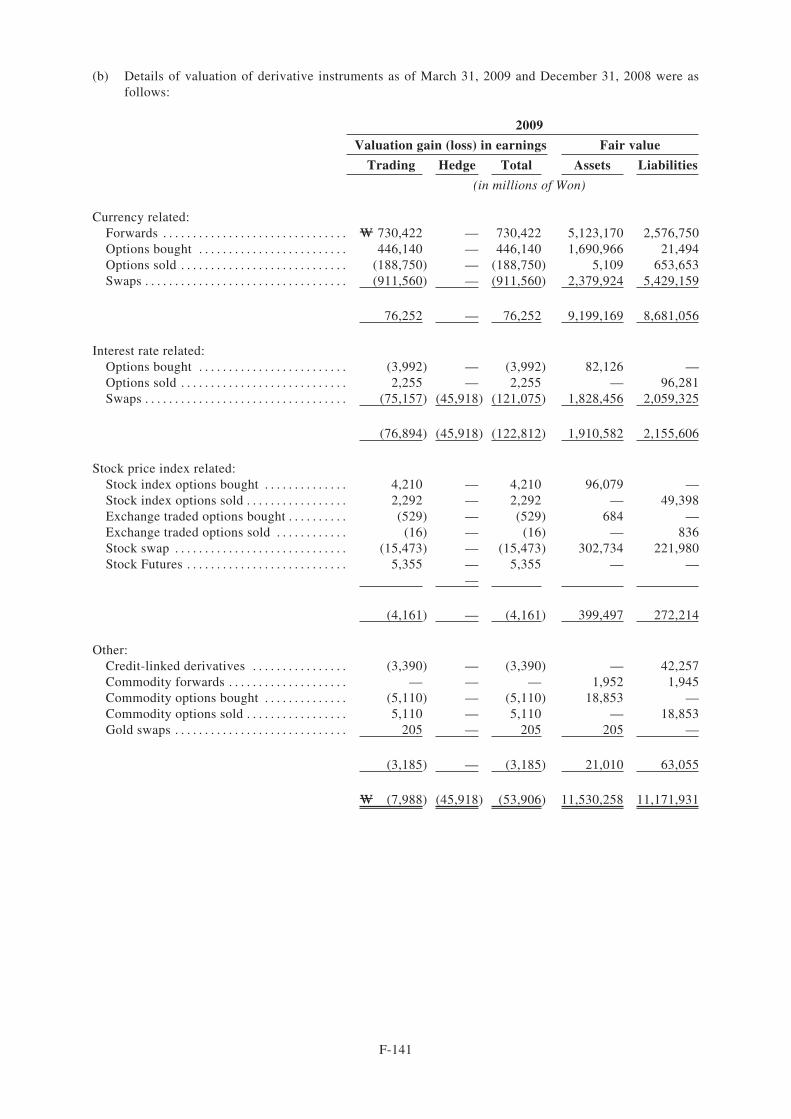
(b) Details of valuation of derivative instruments as of March 31, 2009 and December 31, 2008 were asfollows:
2009
Valuation gain (loss) in earnings Fair value
Trading Hedge Total Assets Liabilities
(in millions of Won)
Currency related:Forwards . . . . . . . . . . . . . . . . . . . . . . . . . . . . . . . W 730,422 — 730,422 5,123,170 2,576,750Options bought . . . . . . . . . . . . . . . . . . . . . . . . . 446,140 — 446,140 1,690,966 21,494Options sold . . . . . . . . . . . . . . . . . . . . . . . . . . . . (188,750) — (188,750) 5,109 653,653Swaps . . . . . . . . . . . . . . . . . . . . . . . . . . . . . . . . . . (911,560) — (911,560) 2,379,924 5,429,159
76,252 — 76,252 9,199,169 8,681,056
Interest rate related:Options bought . . . . . . . . . . . . . . . . . . . . . . . . . (3,992) — (3,992) 82,126 —Options sold . . . . . . . . . . . . . . . . . . . . . . . . . . . . 2,255 — 2,255 — 96,281Swaps . . . . . . . . . . . . . . . . . . . . . . . . . . . . . . . . . . (75,157) (45,918) (121,075) 1,828,456 2,059,325
(76,894) (45,918) (122,812) 1,910,582 2,155,606
Stock price index related:Stock index options bought . . . . . . . . . . . . . . 4,210 — 4,210 96,079 —Stock index options sold . . . . . . . . . . . . . . . . . 2,292 — 2,292 — 49,398Exchange traded options bought . . . . . . . . . . (529) — (529) 684 —Exchange traded options sold . . . . . . . . . . . . (16) — (16) — 836Stock swap . . . . . . . . . . . . . . . . . . . . . . . . . . . . . (15,473) — (15,473) 302,734 221,980Stock Futures . . . . . . . . . . . . . . . . . . . . . . . . . . . 5,355 — 5,355 — —
—
(4,161) — (4,161) 399,497 272,214
Other:Credit-linked derivatives . . . . . . . . . . . . . . . . (3,390) — (3,390) — 42,257Commodity forwards . . . . . . . . . . . . . . . . . . . . — — — 1,952 1,945Commodity options bought . . . . . . . . . . . . . . (5,110) — (5,110) 18,853 —Commodity options sold . . . . . . . . . . . . . . . . . 5,110 — 5,110 — 18,853Gold swaps . . . . . . . . . . . . . . . . . . . . . . . . . . . . . 205 — 205 205 —
(3,185) — (3,185) 21,010 63,055
W (7,988) (45,918) (53,906) 11,530,258 11,171,931
F-141
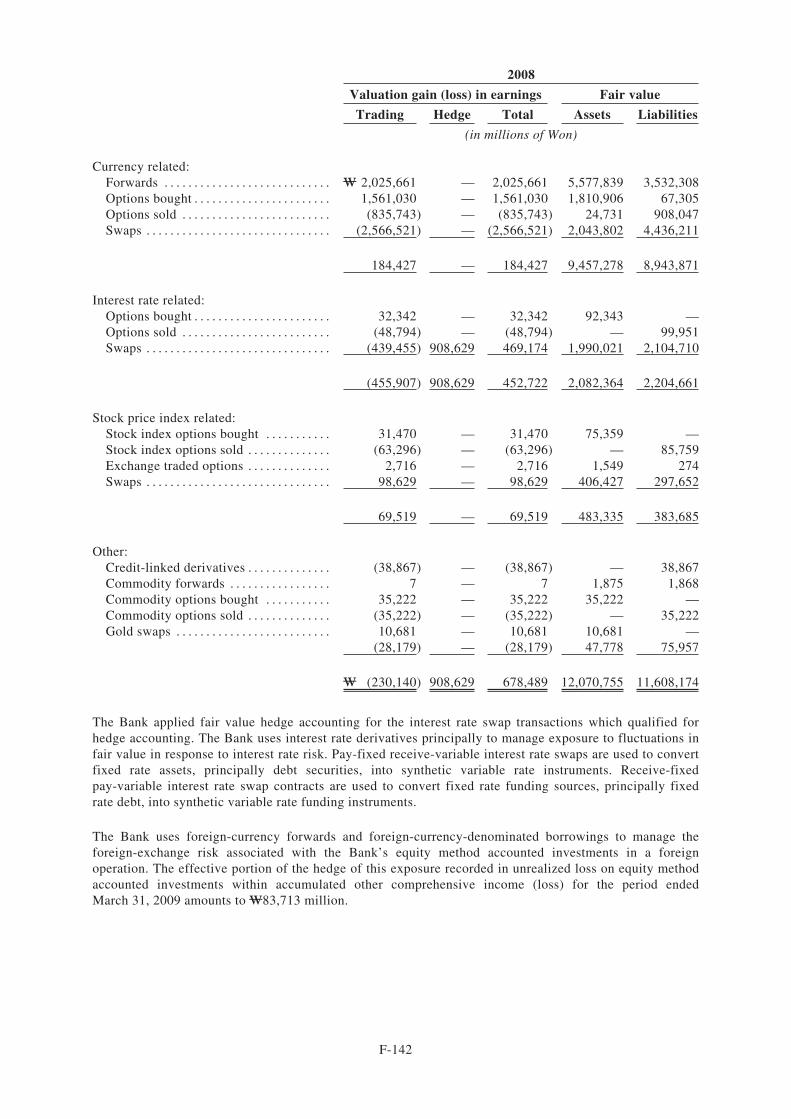
2008
Valuation gain (loss) in earnings Fair value
Trading Hedge Total Assets Liabilities
(in millions of Won)
Currency related:Forwards . . . . . . . . . . . . . . . . . . . . . . . . . . . . W 2,025,661 — 2,025,661 5,577,839 3,532,308Options bought . . . . . . . . . . . . . . . . . . . . . . . 1,561,030 — 1,561,030 1,810,906 67,305Options sold . . . . . . . . . . . . . . . . . . . . . . . . . (835,743) — (835,743) 24,731 908,047Swaps . . . . . . . . . . . . . . . . . . . . . . . . . . . . . . . (2,566,521) — (2,566,521) 2,043,802 4,436,211
184,427 — 184,427 9,457,278 8,943,871
Interest rate related:Options bought . . . . . . . . . . . . . . . . . . . . . . . 32,342 — 32,342 92,343 —Options sold . . . . . . . . . . . . . . . . . . . . . . . . . (48,794) — (48,794) — 99,951Swaps . . . . . . . . . . . . . . . . . . . . . . . . . . . . . . . (439,455) 908,629 469,174 1,990,021 2,104,710
(455,907) 908,629 452,722 2,082,364 2,204,661
Stock price index related:Stock index options bought . . . . . . . . . . . 31,470 — 31,470 75,359 —Stock index options sold . . . . . . . . . . . . . . (63,296) — (63,296) — 85,759Exchange traded options . . . . . . . . . . . . . . 2,716 — 2,716 1,549 274Swaps . . . . . . . . . . . . . . . . . . . . . . . . . . . . . . . 98,629 — 98,629 406,427 297,652
69,519 — 69,519 483,335 383,685
Other:Credit-linked derivatives . . . . . . . . . . . . . . (38,867) — (38,867) — 38,867Commodity forwards . . . . . . . . . . . . . . . . . 7 — 7 1,875 1,868Commodity options bought . . . . . . . . . . . 35,222 — 35,222 35,222 —Commodity options sold . . . . . . . . . . . . . . (35,222) — (35,222) — 35,222Gold swaps . . . . . . . . . . . . . . . . . . . . . . . . . . 10,681 — 10,681 10,681 —
(28,179) — (28,179) 47,778 75,957
W (230,140) 908,629 678,489 12,070,755 11,608,174
The Bank applied fair value hedge accounting for the interest rate swap transactions which qualified forhedge accounting. The Bank uses interest rate derivatives principally to manage exposure to fluctuations infair value in response to interest rate risk. Pay-fixed receive-variable interest rate swaps are used to convertfixed rate assets, principally debt securities, into synthetic variable rate instruments. Receive-fixedpay-variable interest rate swap contracts are used to convert fixed rate funding sources, principally fixedrate debt, into synthetic variable rate funding instruments.
The Bank uses foreign-currency forwards and foreign-currency-denominated borrowings to manage theforeign-exchange risk associated with the Bank’s equity method accounted investments in a foreignoperation. The effective portion of the hedge of this exposure recorded in unrealized loss on equity methodaccounted investments within accumulated other comprehensive income (loss) for the period endedMarch 31, 2009 amounts to W83,713 million.
F-142
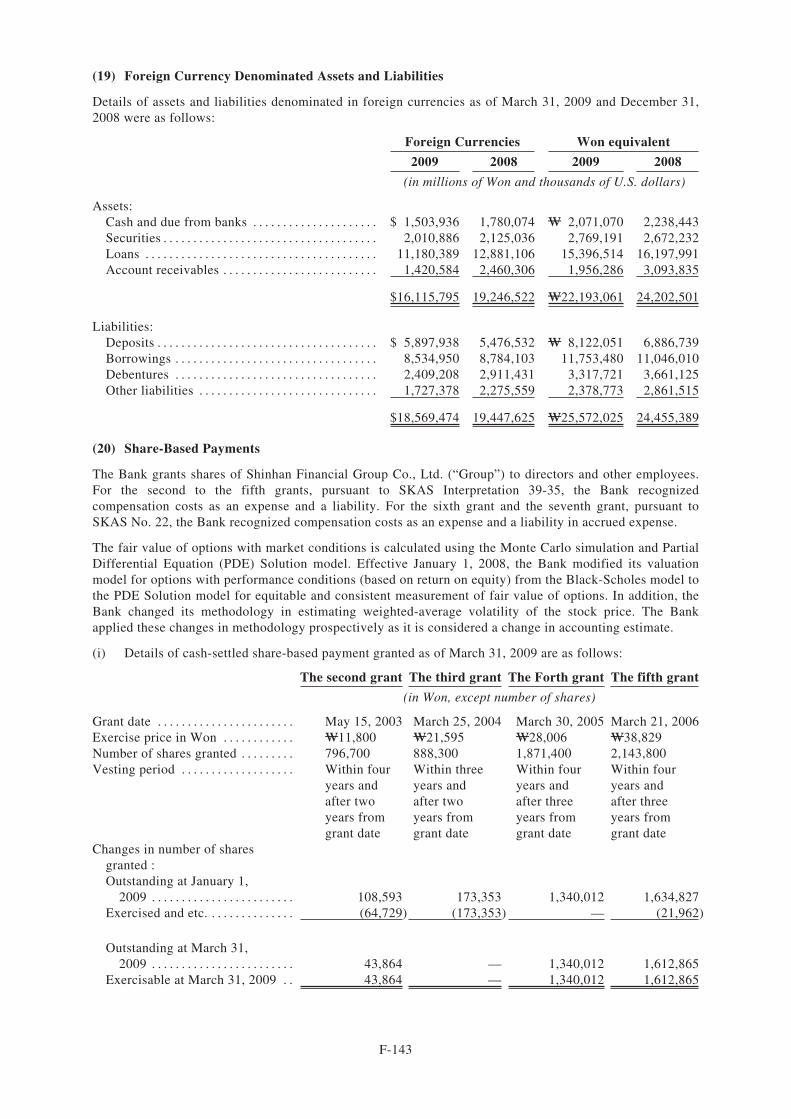
(19) Foreign Currency Denominated Assets and Liabilities
Details of assets and liabilities denominated in foreign currencies as of March 31, 2009 and December 31,2008 were as follows:
Foreign Currencies Won equivalent
2009 2008 2009 2008
(in millions of Won and thousands of U.S. dollars)
Assets:Cash and due from banks . . . . . . . . . . . . . . . . . . . . . $ 1,503,936 1,780,074 W 2,071,070 2,238,443Securities . . . . . . . . . . . . . . . . . . . . . . . . . . . . . . . . . . . . 2,010,886 2,125,036 2,769,191 2,672,232Loans . . . . . . . . . . . . . . . . . . . . . . . . . . . . . . . . . . . . . . . 11,180,389 12,881,106 15,396,514 16,197,991Account receivables . . . . . . . . . . . . . . . . . . . . . . . . . . 1,420,584 2,460,306 1,956,286 3,093,835
$16,115,795 19,246,522 W22,193,061 24,202,501
Liabilities:Deposits . . . . . . . . . . . . . . . . . . . . . . . . . . . . . . . . . . . . . $ 5,897,938 5,476,532 W 8,122,051 6,886,739Borrowings . . . . . . . . . . . . . . . . . . . . . . . . . . . . . . . . . . 8,534,950 8,784,103 11,753,480 11,046,010Debentures . . . . . . . . . . . . . . . . . . . . . . . . . . . . . . . . . . 2,409,208 2,911,431 3,317,721 3,661,125Other liabilities . . . . . . . . . . . . . . . . . . . . . . . . . . . . . . 1,727,378 2,275,559 2,378,773 2,861,515
$18,569,474 19,447,625 W25,572,025 24,455,389
(20) Share-Based Payments
The Bank grants shares of Shinhan Financial Group Co., Ltd. (“Group”) to directors and other employees.For the second to the fifth grants, pursuant to SKAS Interpretation 39-35, the Bank recognizedcompensation costs as an expense and a liability. For the sixth grant and the seventh grant, pursuant toSKAS No. 22, the Bank recognized compensation costs as an expense and a liability in accrued expense.
The fair value of options with market conditions is calculated using the Monte Carlo simulation and PartialDifferential Equation (PDE) Solution model. Effective January 1, 2008, the Bank modified its valuationmodel for options with performance conditions (based on return on equity) from the Black-Scholes model tothe PDE Solution model for equitable and consistent measurement of fair value of options. In addition, theBank changed its methodology in estimating weighted-average volatility of the stock price. The Bankapplied these changes in methodology prospectively as it is considered a change in accounting estimate.
(i) Details of cash-settled share-based payment granted as of March 31, 2009 are as follows:
The second grant The third grant The Forth grant The fifth grant
(in Won, except number of shares)
Grant date . . . . . . . . . . . . . . . . . . . . . . . May 15, 2003 March 25, 2004 March 30, 2005 March 21, 2006Exercise price in Won . . . . . . . . . . . . W11,800 W21,595 W28,006 W38,829Number of shares granted . . . . . . . . . 796,700 888,300 1,871,400 2,143,800Vesting period . . . . . . . . . . . . . . . . . . . Within four
years andafter twoyears fromgrant date
Within threeyears andafter twoyears fromgrant date
Within fouryears andafter threeyears fromgrant date
Within fouryears andafter threeyears fromgrant date
Changes in number of sharesgranted :Outstanding at January 1,
2009 . . . . . . . . . . . . . . . . . . . . . . . . 108,593 173,353 1,340,012 1,634,827Exercised and etc. . . . . . . . . . . . . . . (64,729) (173,353) — (21,962)
Outstanding at March 31,2009 . . . . . . . . . . . . . . . . . . . . . . . . 43,864 — 1,340,012 1,612,865
Exercisable at March 31, 2009 . . 43,864 — 1,340,012 1,612,865
F-143
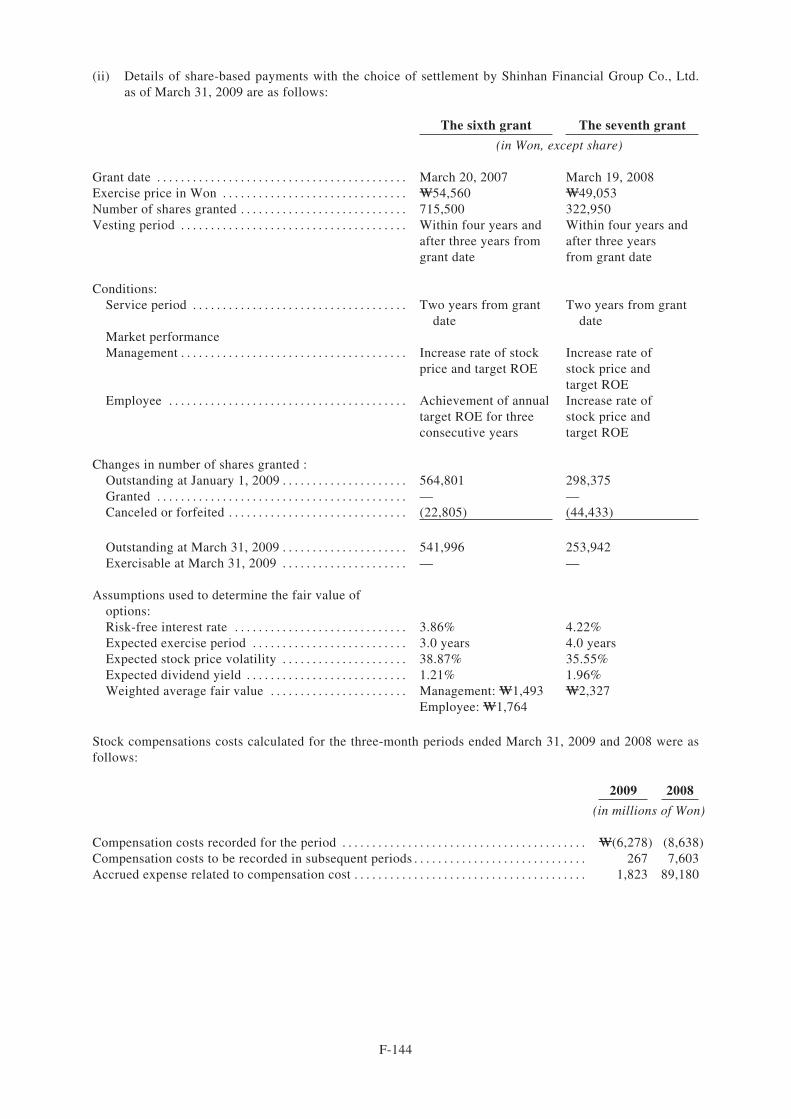
(ii) Details of share-based payments with the choice of settlement by Shinhan Financial Group Co., Ltd.as of March 31, 2009 are as follows:
The sixth grant The seventh grant
(in Won, except share)
Grant date . . . . . . . . . . . . . . . . . . . . . . . . . . . . . . . . . . . . . . . . . . March 20, 2007 March 19, 2008Exercise price in Won . . . . . . . . . . . . . . . . . . . . . . . . . . . . . . . W54,560 W49,053Number of shares granted . . . . . . . . . . . . . . . . . . . . . . . . . . . . 715,500 322,950Vesting period . . . . . . . . . . . . . . . . . . . . . . . . . . . . . . . . . . . . . . Within four years and
after three years fromgrant date
Within four years andafter three yearsfrom grant date
Conditions:Service period . . . . . . . . . . . . . . . . . . . . . . . . . . . . . . . . . . . . Two years from grant
dateTwo years from grant
dateMarket performanceManagement . . . . . . . . . . . . . . . . . . . . . . . . . . . . . . . . . . . . . . Increase rate of stock
price and target ROEIncrease rate ofstock price andtarget ROE
Employee . . . . . . . . . . . . . . . . . . . . . . . . . . . . . . . . . . . . . . . . Achievement of annualtarget ROE for threeconsecutive years
Increase rate ofstock price andtarget ROE
Changes in number of shares granted :Outstanding at January 1, 2009 . . . . . . . . . . . . . . . . . . . . . 564,801 298,375Granted . . . . . . . . . . . . . . . . . . . . . . . . . . . . . . . . . . . . . . . . . . — —Canceled or forfeited . . . . . . . . . . . . . . . . . . . . . . . . . . . . . . (22,805) (44,433)
Outstanding at March 31, 2009 . . . . . . . . . . . . . . . . . . . . . 541,996 253,942Exercisable at March 31, 2009 . . . . . . . . . . . . . . . . . . . . . — —
Assumptions used to determine the fair value ofoptions:Risk-free interest rate . . . . . . . . . . . . . . . . . . . . . . . . . . . . . 3.86% 4.22%Expected exercise period . . . . . . . . . . . . . . . . . . . . . . . . . . 3.0 years 4.0 yearsExpected stock price volatility . . . . . . . . . . . . . . . . . . . . . 38.87% 35.55%Expected dividend yield . . . . . . . . . . . . . . . . . . . . . . . . . . . 1.21% 1.96%Weighted average fair value . . . . . . . . . . . . . . . . . . . . . . . Management: W1,493
Employee: W1,764W2,327
Stock compensations costs calculated for the three-month periods ended March 31, 2009 and 2008 were asfollows:
2009 2008
(in millions of Won)
Compensation costs recorded for the period . . . . . . . . . . . . . . . . . . . . . . . . . . . . . . . . . . . . . . . . . W(6,278) (8,638)Compensation costs to be recorded in subsequent periods . . . . . . . . . . . . . . . . . . . . . . . . . . . . . 267 7,603Accrued expense related to compensation cost . . . . . . . . . . . . . . . . . . . . . . . . . . . . . . . . . . . . . . . 1,823 89,180
F-144
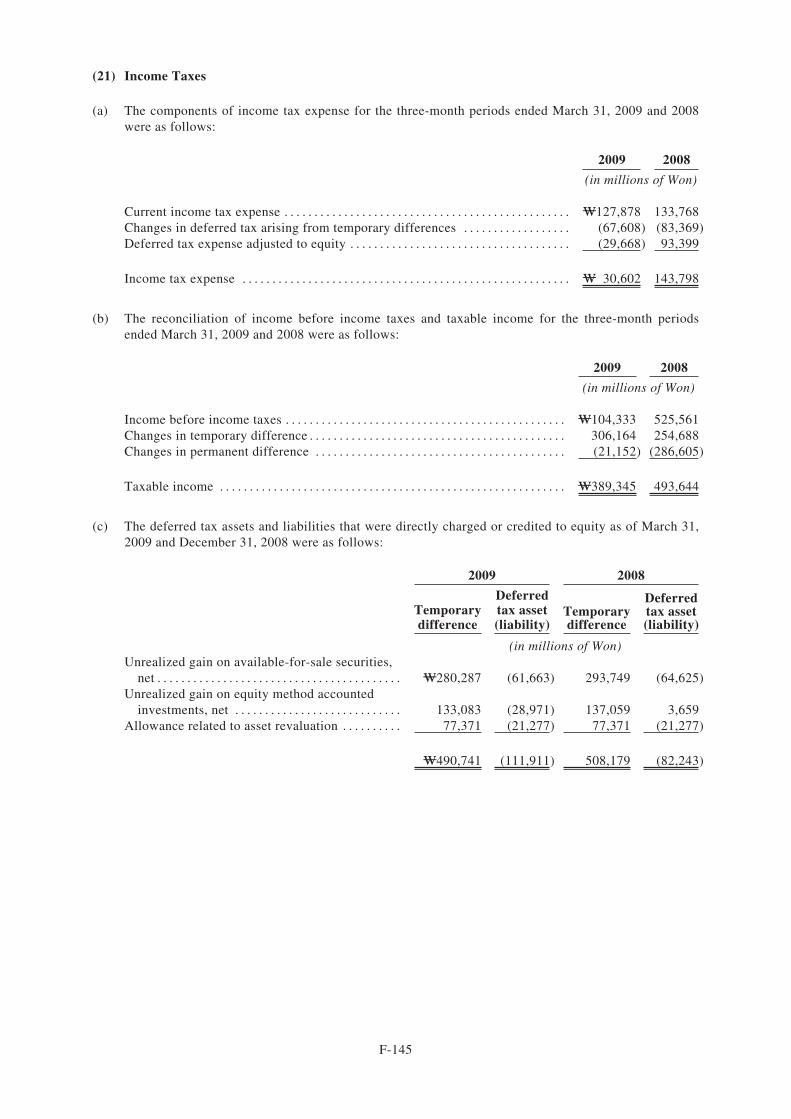
(21) Income Taxes
(a) The components of income tax expense for the three-month periods ended March 31, 2009 and 2008were as follows:
2009 2008
(in millions of Won)
Current income tax expense . . . . . . . . . . . . . . . . . . . . . . . . . . . . . . . . . . . . . . . . . . . . . . . . W127,878 133,768Changes in deferred tax arising from temporary differences . . . . . . . . . . . . . . . . . . (67,608) (83,369)Deferred tax expense adjusted to equity . . . . . . . . . . . . . . . . . . . . . . . . . . . . . . . . . . . . . (29,668) 93,399
Income tax expense . . . . . . . . . . . . . . . . . . . . . . . . . . . . . . . . . . . . . . . . . . . . . . . . . . . . . . . W 30,602 143,798
(b) The reconciliation of income before income taxes and taxable income for the three-month periodsended March 31, 2009 and 2008 were as follows:
2009 2008
(in millions of Won)
Income before income taxes . . . . . . . . . . . . . . . . . . . . . . . . . . . . . . . . . . . . . . . . . . . . . . . W104,333 525,561Changes in temporary difference . . . . . . . . . . . . . . . . . . . . . . . . . . . . . . . . . . . . . . . . . . . 306,164 254,688Changes in permanent difference . . . . . . . . . . . . . . . . . . . . . . . . . . . . . . . . . . . . . . . . . . (21,152) (286,605)
Taxable income . . . . . . . . . . . . . . . . . . . . . . . . . . . . . . . . . . . . . . . . . . . . . . . . . . . . . . . . . . W389,345 493,644
(c) The deferred tax assets and liabilities that were directly charged or credited to equity as of March 31,2009 and December 31, 2008 were as follows:
2009 2008
Temporarydifference
Deferredtax asset(liability)
Temporarydifference
Deferredtax asset(liability)
(in millions of Won)Unrealized gain on available-for-sale securities,
net . . . . . . . . . . . . . . . . . . . . . . . . . . . . . . . . . . . . . . . . . W280,287 (61,663) 293,749 (64,625)Unrealized gain on equity method accounted
investments, net . . . . . . . . . . . . . . . . . . . . . . . . . . . . 133,083 (28,971) 137,059 3,659Allowance related to asset revaluation . . . . . . . . . . 77,371 (21,277) 77,371 (21,277)
W490,741 (111,911) 508,179 (82,243)
F-145
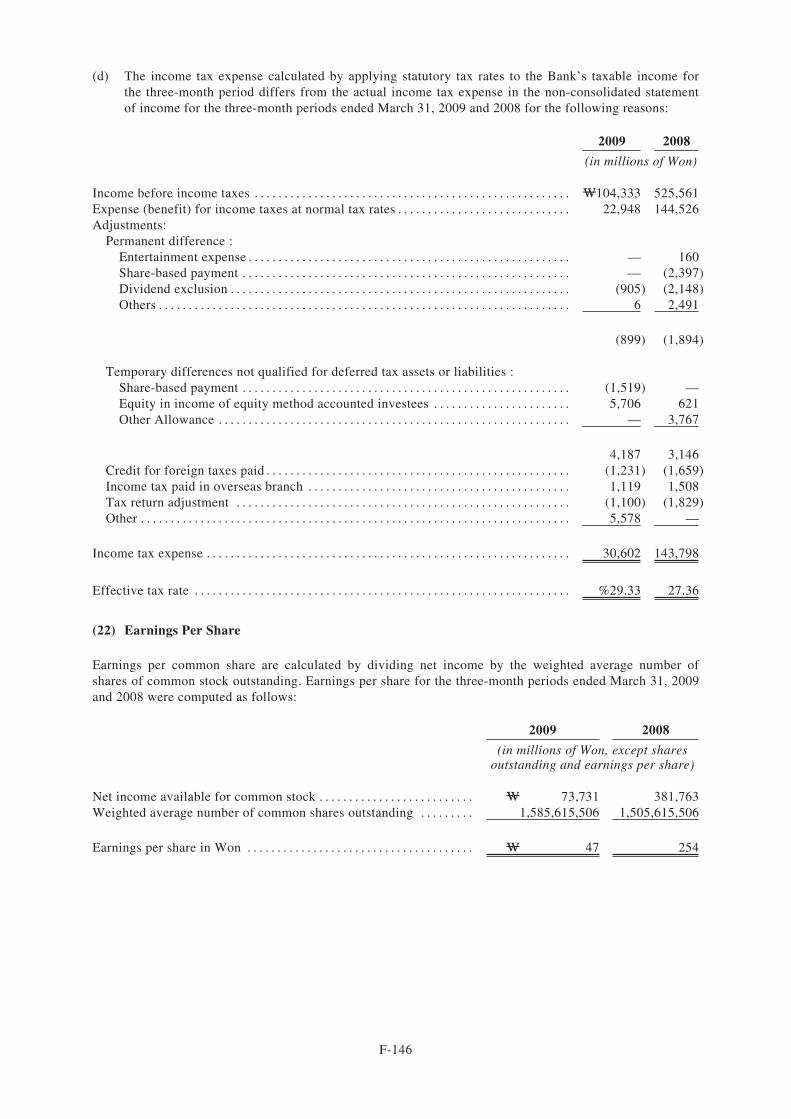
(d) The income tax expense calculated by applying statutory tax rates to the Bank’s taxable income forthe three-month period differs from the actual income tax expense in the non-consolidated statementof income for the three-month periods ended March 31, 2009 and 2008 for the following reasons:
2009 2008
(in millions of Won)
Income before income taxes . . . . . . . . . . . . . . . . . . . . . . . . . . . . . . . . . . . . . . . . . . . . . . . . . . . . . W104,333 525,561Expense (benefit) for income taxes at normal tax rates . . . . . . . . . . . . . . . . . . . . . . . . . . . . . 22,948 144,526Adjustments:
Permanent difference :Entertainment expense . . . . . . . . . . . . . . . . . . . . . . . . . . . . . . . . . . . . . . . . . . . . . . . . . . . . . . — 160Share-based payment . . . . . . . . . . . . . . . . . . . . . . . . . . . . . . . . . . . . . . . . . . . . . . . . . . . . . . . — (2,397)Dividend exclusion . . . . . . . . . . . . . . . . . . . . . . . . . . . . . . . . . . . . . . . . . . . . . . . . . . . . . . . . . (905) (2,148)Others . . . . . . . . . . . . . . . . . . . . . . . . . . . . . . . . . . . . . . . . . . . . . . . . . . . . . . . . . . . . . . . . . . . . . 6 2,491
(899) (1,894)
Temporary differences not qualified for deferred tax assets or liabilities :Share-based payment . . . . . . . . . . . . . . . . . . . . . . . . . . . . . . . . . . . . . . . . . . . . . . . . . . . . . . . (1,519) —Equity in income of equity method accounted investees . . . . . . . . . . . . . . . . . . . . . . . 5,706 621Other Allowance . . . . . . . . . . . . . . . . . . . . . . . . . . . . . . . . . . . . . . . . . . . . . . . . . . . . . . . . . . . — 3,767
4,187 3,146Credit for foreign taxes paid . . . . . . . . . . . . . . . . . . . . . . . . . . . . . . . . . . . . . . . . . . . . . . . . . . . (1,231) (1,659)Income tax paid in overseas branch . . . . . . . . . . . . . . . . . . . . . . . . . . . . . . . . . . . . . . . . . . . . 1,119 1,508Tax return adjustment . . . . . . . . . . . . . . . . . . . . . . . . . . . . . . . . . . . . . . . . . . . . . . . . . . . . . . . . (1,100) (1,829)Other . . . . . . . . . . . . . . . . . . . . . . . . . . . . . . . . . . . . . . . . . . . . . . . . . . . . . . . . . . . . . . . . . . . . . . . . 5,578 —
Income tax expense . . . . . . . . . . . . . . . . . . . . . . . . . . . . . . . . . . . . . . . . . . . . . . . . . . . . . . . . . . . . . 30,602 143,798
Effective tax rate . . . . . . . . . . . . . . . . . . . . . . . . . . . . . . . . . . . . . . . . . . . . . . . . . . . . . . . . . . . . . . . %29.33 27.36
(22) Earnings Per Share
Earnings per common share are calculated by dividing net income by the weighted average number ofshares of common stock outstanding. Earnings per share for the three-month periods ended March 31, 2009and 2008 were computed as follows:
2009 2008
(in millions of Won, except sharesoutstanding and earnings per share)
Net income available for common stock . . . . . . . . . . . . . . . . . . . . . . . . . . W 73,731 381,763Weighted average number of common shares outstanding . . . . . . . . . 1,585,615,506 1,505,615,506
Earnings per share in Won . . . . . . . . . . . . . . . . . . . . . . . . . . . . . . . . . . . . . . W 47 254
F-146
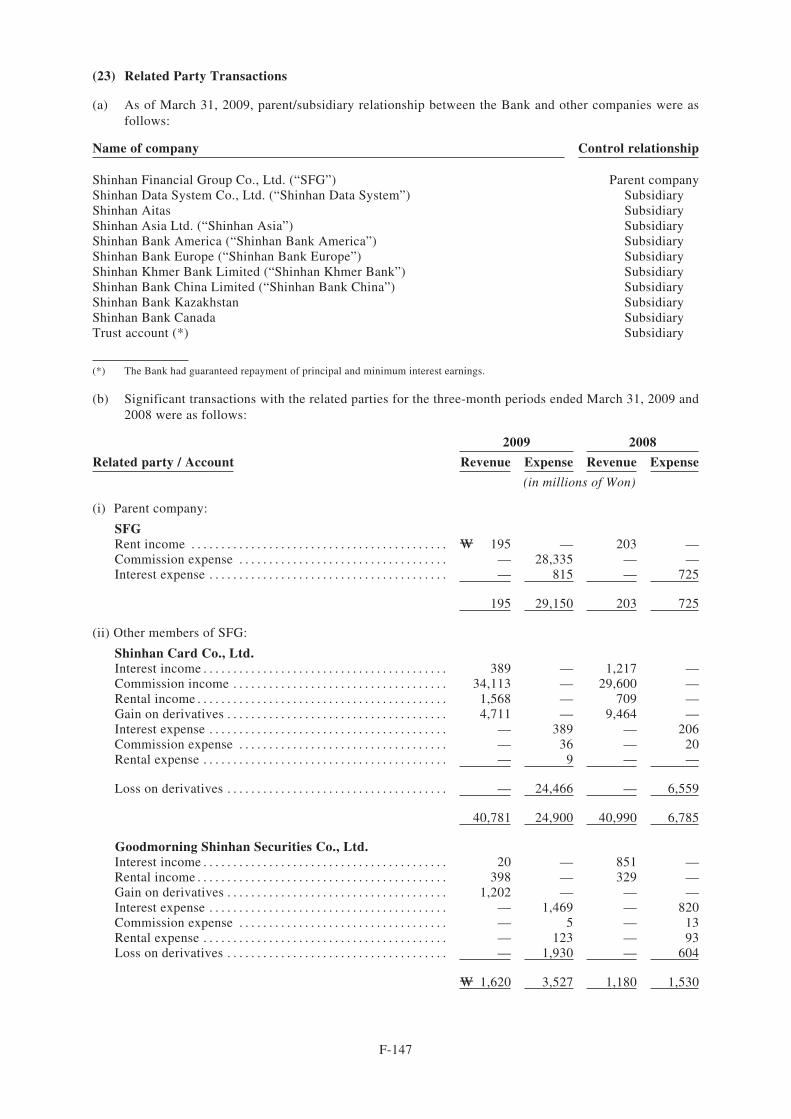
(23) Related Party Transactions
(a) As of March 31, 2009, parent/subsidiary relationship between the Bank and other companies were asfollows:
Name of company Control relationship
Shinhan Financial Group Co., Ltd. (“SFG”) Parent companyShinhan Data System Co., Ltd. (“Shinhan Data System”) SubsidiaryShinhan Aitas SubsidiaryShinhan Asia Ltd. (“Shinhan Asia”) SubsidiaryShinhan Bank America (“Shinhan Bank America”) SubsidiaryShinhan Bank Europe (“Shinhan Bank Europe”) SubsidiaryShinhan Khmer Bank Limited (“Shinhan Khmer Bank”) SubsidiaryShinhan Bank China Limited (“Shinhan Bank China”) SubsidiaryShinhan Bank Kazakhstan SubsidiaryShinhan Bank Canada SubsidiaryTrust account (*) Subsidiary
(*) The Bank had guaranteed repayment of principal and minimum interest earnings.
(b) Significant transactions with the related parties for the three-month periods ended March 31, 2009 and2008 were as follows:
2009 2008
Related party / Account Revenue Expense Revenue Expense
(in millions of Won)
(i) Parent company:
SFGRent income . . . . . . . . . . . . . . . . . . . . . . . . . . . . . . . . . . . . . . . . . . . W 195 — 203 —Commission expense . . . . . . . . . . . . . . . . . . . . . . . . . . . . . . . . . . . — 28,335 — —Interest expense . . . . . . . . . . . . . . . . . . . . . . . . . . . . . . . . . . . . . . . . — 815 — 725
195 29,150 203 725
(ii) Other members of SFG:
Shinhan Card Co., Ltd.Interest income . . . . . . . . . . . . . . . . . . . . . . . . . . . . . . . . . . . . . . . . . 389 — 1,217 —Commission income . . . . . . . . . . . . . . . . . . . . . . . . . . . . . . . . . . . . 34,113 — 29,600 —Rental income . . . . . . . . . . . . . . . . . . . . . . . . . . . . . . . . . . . . . . . . . . 1,568 — 709 —Gain on derivatives . . . . . . . . . . . . . . . . . . . . . . . . . . . . . . . . . . . . . 4,711 — 9,464 —Interest expense . . . . . . . . . . . . . . . . . . . . . . . . . . . . . . . . . . . . . . . . — 389 — 206Commission expense . . . . . . . . . . . . . . . . . . . . . . . . . . . . . . . . . . . — 36 — 20Rental expense . . . . . . . . . . . . . . . . . . . . . . . . . . . . . . . . . . . . . . . . . — 9 — —
Loss on derivatives . . . . . . . . . . . . . . . . . . . . . . . . . . . . . . . . . . . . . — 24,466 — 6,559
40,781 24,900 40,990 6,785
Goodmorning Shinhan Securities Co., Ltd.Interest income . . . . . . . . . . . . . . . . . . . . . . . . . . . . . . . . . . . . . . . . . 20 — 851 —Rental income . . . . . . . . . . . . . . . . . . . . . . . . . . . . . . . . . . . . . . . . . . 398 — 329 —Gain on derivatives . . . . . . . . . . . . . . . . . . . . . . . . . . . . . . . . . . . . . 1,202 — — —Interest expense . . . . . . . . . . . . . . . . . . . . . . . . . . . . . . . . . . . . . . . . — 1,469 — 820Commission expense . . . . . . . . . . . . . . . . . . . . . . . . . . . . . . . . . . . — 5 — 13Rental expense . . . . . . . . . . . . . . . . . . . . . . . . . . . . . . . . . . . . . . . . . — 123 — 93Loss on derivatives . . . . . . . . . . . . . . . . . . . . . . . . . . . . . . . . . . . . . — 1,930 — 604
W 1,620 3,527 1,180 1,530
F-147
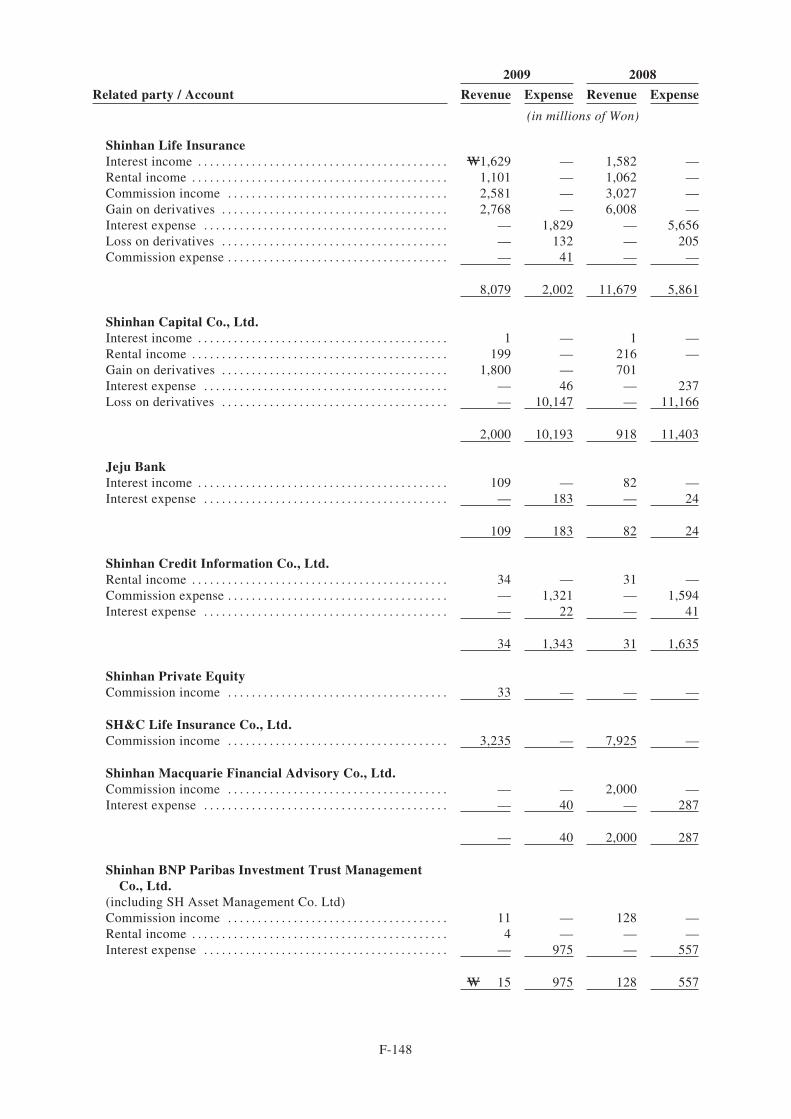
2009 2008
Related party / Account Revenue Expense Revenue Expense
(in millions of Won)
Shinhan Life InsuranceInterest income . . . . . . . . . . . . . . . . . . . . . . . . . . . . . . . . . . . . . . . . . . W1,629 — 1,582 —Rental income . . . . . . . . . . . . . . . . . . . . . . . . . . . . . . . . . . . . . . . . . . . 1,101 — 1,062 —Commission income . . . . . . . . . . . . . . . . . . . . . . . . . . . . . . . . . . . . . 2,581 — 3,027 —Gain on derivatives . . . . . . . . . . . . . . . . . . . . . . . . . . . . . . . . . . . . . . 2,768 — 6,008 —Interest expense . . . . . . . . . . . . . . . . . . . . . . . . . . . . . . . . . . . . . . . . . — 1,829 — 5,656Loss on derivatives . . . . . . . . . . . . . . . . . . . . . . . . . . . . . . . . . . . . . . — 132 — 205Commission expense . . . . . . . . . . . . . . . . . . . . . . . . . . . . . . . . . . . . . — 41 — —
8,079 2,002 11,679 5,861
Shinhan Capital Co., Ltd.Interest income . . . . . . . . . . . . . . . . . . . . . . . . . . . . . . . . . . . . . . . . . . 1 — 1 —Rental income . . . . . . . . . . . . . . . . . . . . . . . . . . . . . . . . . . . . . . . . . . . 199 — 216 —Gain on derivatives . . . . . . . . . . . . . . . . . . . . . . . . . . . . . . . . . . . . . . 1,800 — 701Interest expense . . . . . . . . . . . . . . . . . . . . . . . . . . . . . . . . . . . . . . . . . — 46 — 237Loss on derivatives . . . . . . . . . . . . . . . . . . . . . . . . . . . . . . . . . . . . . . — 10,147 — 11,166
2,000 10,193 918 11,403
Jeju BankInterest income . . . . . . . . . . . . . . . . . . . . . . . . . . . . . . . . . . . . . . . . . . 109 — 82 —Interest expense . . . . . . . . . . . . . . . . . . . . . . . . . . . . . . . . . . . . . . . . . — 183 — 24
109 183 82 24
Shinhan Credit Information Co., Ltd.Rental income . . . . . . . . . . . . . . . . . . . . . . . . . . . . . . . . . . . . . . . . . . . 34 — 31 —Commission expense . . . . . . . . . . . . . . . . . . . . . . . . . . . . . . . . . . . . . — 1,321 — 1,594Interest expense . . . . . . . . . . . . . . . . . . . . . . . . . . . . . . . . . . . . . . . . . — 22 — 41
34 1,343 31 1,635
Shinhan Private EquityCommission income . . . . . . . . . . . . . . . . . . . . . . . . . . . . . . . . . . . . . 33 — — —
SH&C Life Insurance Co., Ltd.Commission income . . . . . . . . . . . . . . . . . . . . . . . . . . . . . . . . . . . . . 3,235 — 7,925 —
Shinhan Macquarie Financial Advisory Co., Ltd.Commission income . . . . . . . . . . . . . . . . . . . . . . . . . . . . . . . . . . . . . — — 2,000 —Interest expense . . . . . . . . . . . . . . . . . . . . . . . . . . . . . . . . . . . . . . . . . — 40 — 287
— 40 2,000 287
Shinhan BNP Paribas Investment Trust ManagementCo., Ltd.
(including SH Asset Management Co. Ltd)Commission income . . . . . . . . . . . . . . . . . . . . . . . . . . . . . . . . . . . . . 11 — 128 —Rental income . . . . . . . . . . . . . . . . . . . . . . . . . . . . . . . . . . . . . . . . . . . 4 — — —Interest expense . . . . . . . . . . . . . . . . . . . . . . . . . . . . . . . . . . . . . . . . . — 975 — 557
W 15 975 128 557
F-148
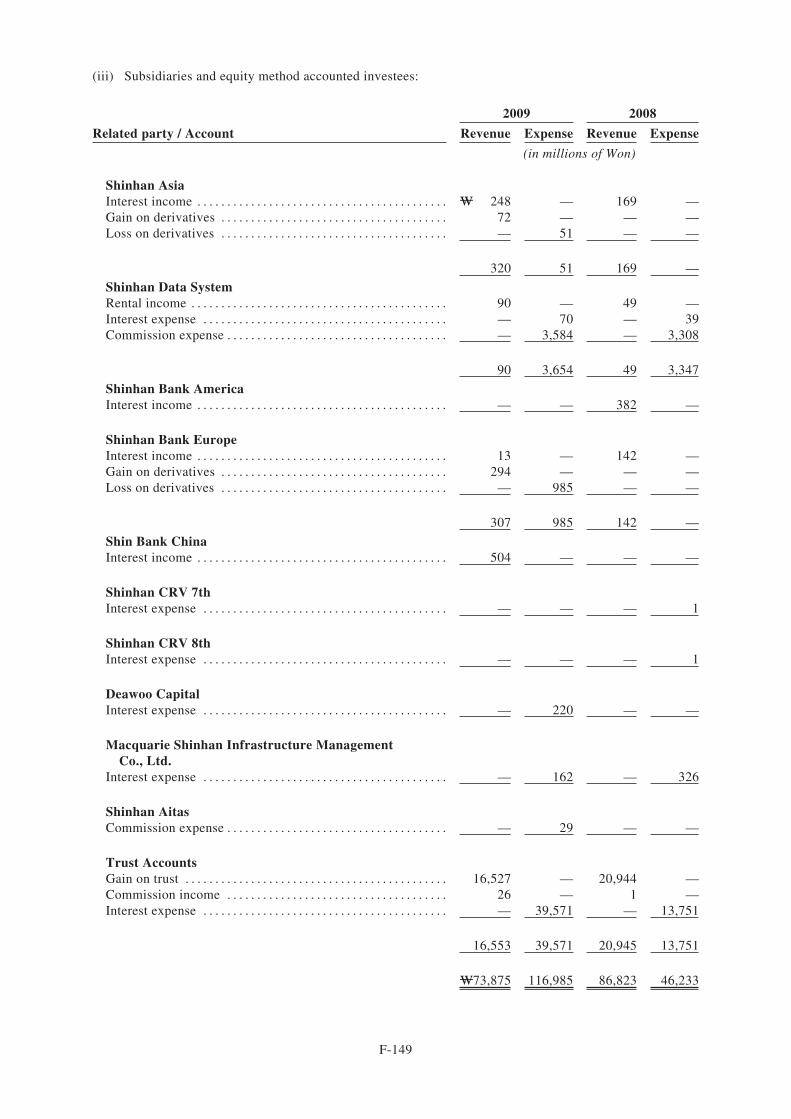
(iii) Subsidiaries and equity method accounted investees:
2009 2008
Related party / Account Revenue Expense Revenue Expense
(in millions of Won)
Shinhan AsiaInterest income . . . . . . . . . . . . . . . . . . . . . . . . . . . . . . . . . . . . . . . . . . W 248 — 169 —Gain on derivatives . . . . . . . . . . . . . . . . . . . . . . . . . . . . . . . . . . . . . . 72 — — —Loss on derivatives . . . . . . . . . . . . . . . . . . . . . . . . . . . . . . . . . . . . . . — 51 — —
320 51 169 —
Shinhan Data SystemRental income . . . . . . . . . . . . . . . . . . . . . . . . . . . . . . . . . . . . . . . . . . . 90 — 49 —Interest expense . . . . . . . . . . . . . . . . . . . . . . . . . . . . . . . . . . . . . . . . . — 70 — 39Commission expense . . . . . . . . . . . . . . . . . . . . . . . . . . . . . . . . . . . . . — 3,584 — 3,308
90 3,654 49 3,347
Shinhan Bank AmericaInterest income . . . . . . . . . . . . . . . . . . . . . . . . . . . . . . . . . . . . . . . . . . — — 382 —
Shinhan Bank EuropeInterest income . . . . . . . . . . . . . . . . . . . . . . . . . . . . . . . . . . . . . . . . . . 13 — 142 —Gain on derivatives . . . . . . . . . . . . . . . . . . . . . . . . . . . . . . . . . . . . . . 294 — — —Loss on derivatives . . . . . . . . . . . . . . . . . . . . . . . . . . . . . . . . . . . . . . — 985 — —
307 985 142 —
Shin Bank ChinaInterest income . . . . . . . . . . . . . . . . . . . . . . . . . . . . . . . . . . . . . . . . . . 504 — — —
Shinhan CRV 7thInterest expense . . . . . . . . . . . . . . . . . . . . . . . . . . . . . . . . . . . . . . . . . — — — 1
Shinhan CRV 8thInterest expense . . . . . . . . . . . . . . . . . . . . . . . . . . . . . . . . . . . . . . . . . — — — 1
Deawoo CapitalInterest expense . . . . . . . . . . . . . . . . . . . . . . . . . . . . . . . . . . . . . . . . . — 220 — —
Macquarie Shinhan Infrastructure ManagementCo., Ltd.
Interest expense . . . . . . . . . . . . . . . . . . . . . . . . . . . . . . . . . . . . . . . . . — 162 — 326
Shinhan AitasCommission expense . . . . . . . . . . . . . . . . . . . . . . . . . . . . . . . . . . . . . — 29 — —
Trust AccountsGain on trust . . . . . . . . . . . . . . . . . . . . . . . . . . . . . . . . . . . . . . . . . . . . 16,527 — 20,944 —Commission income . . . . . . . . . . . . . . . . . . . . . . . . . . . . . . . . . . . . . 26 — 1 —Interest expense . . . . . . . . . . . . . . . . . . . . . . . . . . . . . . . . . . . . . . . . . — 39,571 — 13,751
16,553 39,571 20,945 13,751
W73,875 116,985 86,823 46,233
F-149
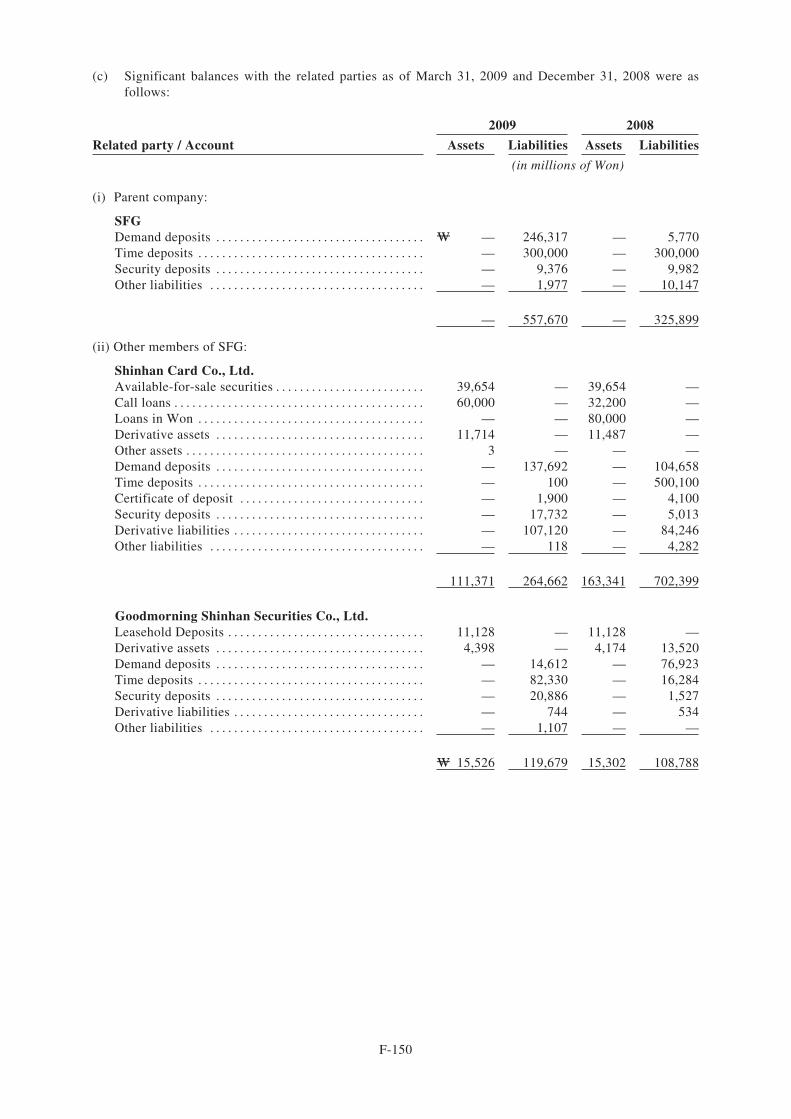
(c) Significant balances with the related parties as of March 31, 2009 and December 31, 2008 were asfollows:
2009 2008
Related party / Account Assets Liabilities Assets Liabilities
(in millions of Won)
(i) Parent company:
SFGDemand deposits . . . . . . . . . . . . . . . . . . . . . . . . . . . . . . . . . . . W — 246,317 — 5,770Time deposits . . . . . . . . . . . . . . . . . . . . . . . . . . . . . . . . . . . . . . — 300,000 — 300,000Security deposits . . . . . . . . . . . . . . . . . . . . . . . . . . . . . . . . . . . — 9,376 — 9,982Other liabilities . . . . . . . . . . . . . . . . . . . . . . . . . . . . . . . . . . . . — 1,977 — 10,147
— 557,670 — 325,899
(ii) Other members of SFG:
Shinhan Card Co., Ltd.Available-for-sale securities . . . . . . . . . . . . . . . . . . . . . . . . . 39,654 — 39,654 —Call loans . . . . . . . . . . . . . . . . . . . . . . . . . . . . . . . . . . . . . . . . . . 60,000 — 32,200 —Loans in Won . . . . . . . . . . . . . . . . . . . . . . . . . . . . . . . . . . . . . . — — 80,000 —Derivative assets . . . . . . . . . . . . . . . . . . . . . . . . . . . . . . . . . . . 11,714 — 11,487 —Other assets . . . . . . . . . . . . . . . . . . . . . . . . . . . . . . . . . . . . . . . . 3 — — —Demand deposits . . . . . . . . . . . . . . . . . . . . . . . . . . . . . . . . . . . — 137,692 — 104,658Time deposits . . . . . . . . . . . . . . . . . . . . . . . . . . . . . . . . . . . . . . — 100 — 500,100Certificate of deposit . . . . . . . . . . . . . . . . . . . . . . . . . . . . . . . — 1,900 — 4,100Security deposits . . . . . . . . . . . . . . . . . . . . . . . . . . . . . . . . . . . — 17,732 — 5,013Derivative liabilities . . . . . . . . . . . . . . . . . . . . . . . . . . . . . . . . — 107,120 — 84,246Other liabilities . . . . . . . . . . . . . . . . . . . . . . . . . . . . . . . . . . . . — 118 — 4,282
111,371 264,662 163,341 702,399
Goodmorning Shinhan Securities Co., Ltd.Leasehold Deposits . . . . . . . . . . . . . . . . . . . . . . . . . . . . . . . . . 11,128 — 11,128 —Derivative assets . . . . . . . . . . . . . . . . . . . . . . . . . . . . . . . . . . . 4,398 — 4,174 13,520Demand deposits . . . . . . . . . . . . . . . . . . . . . . . . . . . . . . . . . . . — 14,612 — 76,923Time deposits . . . . . . . . . . . . . . . . . . . . . . . . . . . . . . . . . . . . . . — 82,330 — 16,284Security deposits . . . . . . . . . . . . . . . . . . . . . . . . . . . . . . . . . . . — 20,886 — 1,527Derivative liabilities . . . . . . . . . . . . . . . . . . . . . . . . . . . . . . . . — 744 — 534Other liabilities . . . . . . . . . . . . . . . . . . . . . . . . . . . . . . . . . . . . — 1,107 — —
W 15,526 119,679 15,302 108,788
F-150
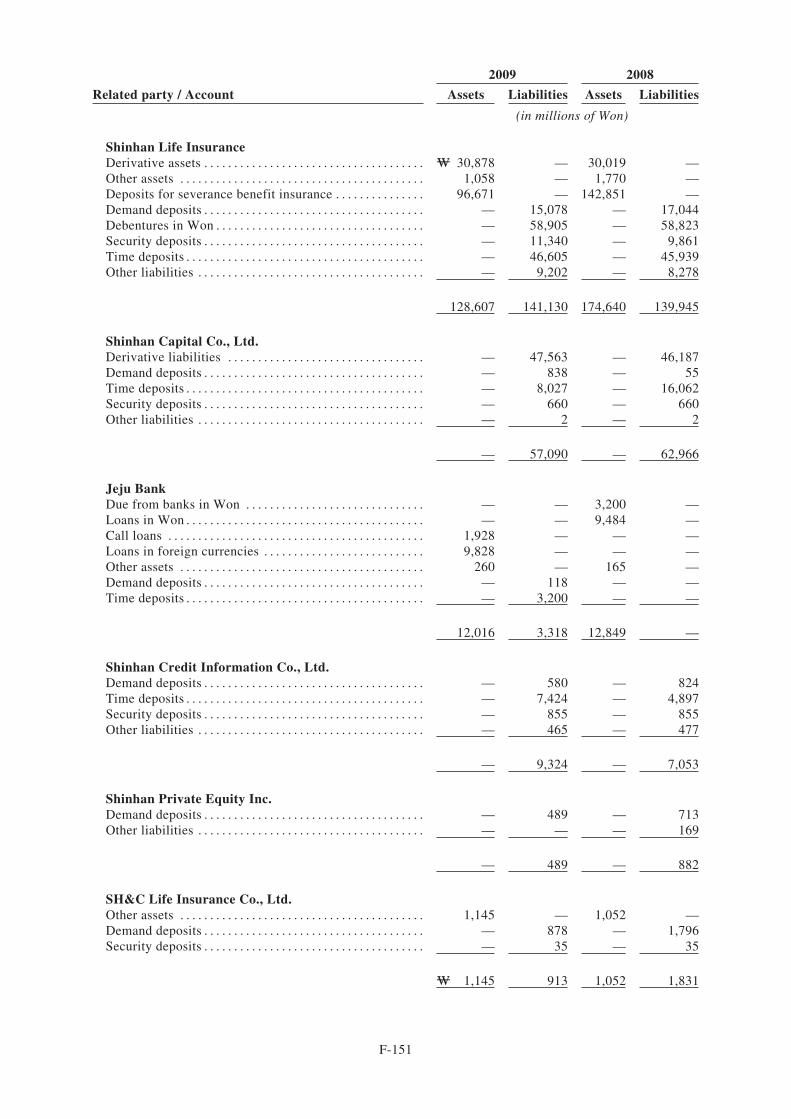
2009 2008
Related party / Account Assets Liabilities Assets Liabilities
(in millions of Won)
Shinhan Life InsuranceDerivative assets . . . . . . . . . . . . . . . . . . . . . . . . . . . . . . . . . . . . . W 30,878 — 30,019 —Other assets . . . . . . . . . . . . . . . . . . . . . . . . . . . . . . . . . . . . . . . . . 1,058 — 1,770 —Deposits for severance benefit insurance . . . . . . . . . . . . . . . 96,671 — 142,851 —Demand deposits . . . . . . . . . . . . . . . . . . . . . . . . . . . . . . . . . . . . . — 15,078 — 17,044Debentures in Won . . . . . . . . . . . . . . . . . . . . . . . . . . . . . . . . . . . — 58,905 — 58,823Security deposits . . . . . . . . . . . . . . . . . . . . . . . . . . . . . . . . . . . . . — 11,340 — 9,861Time deposits . . . . . . . . . . . . . . . . . . . . . . . . . . . . . . . . . . . . . . . . — 46,605 — 45,939Other liabilities . . . . . . . . . . . . . . . . . . . . . . . . . . . . . . . . . . . . . . — 9,202 — 8,278
128,607 141,130 174,640 139,945
Shinhan Capital Co., Ltd.Derivative liabilities . . . . . . . . . . . . . . . . . . . . . . . . . . . . . . . . . — 47,563 — 46,187Demand deposits . . . . . . . . . . . . . . . . . . . . . . . . . . . . . . . . . . . . . — 838 — 55Time deposits . . . . . . . . . . . . . . . . . . . . . . . . . . . . . . . . . . . . . . . . — 8,027 — 16,062Security deposits . . . . . . . . . . . . . . . . . . . . . . . . . . . . . . . . . . . . . — 660 — 660Other liabilities . . . . . . . . . . . . . . . . . . . . . . . . . . . . . . . . . . . . . . — 2 — 2
— 57,090 — 62,966
Jeju BankDue from banks in Won . . . . . . . . . . . . . . . . . . . . . . . . . . . . . . — — 3,200 —Loans in Won . . . . . . . . . . . . . . . . . . . . . . . . . . . . . . . . . . . . . . . . — — 9,484 —Call loans . . . . . . . . . . . . . . . . . . . . . . . . . . . . . . . . . . . . . . . . . . . 1,928 — — —Loans in foreign currencies . . . . . . . . . . . . . . . . . . . . . . . . . . . 9,828 — — —Other assets . . . . . . . . . . . . . . . . . . . . . . . . . . . . . . . . . . . . . . . . . 260 — 165 —Demand deposits . . . . . . . . . . . . . . . . . . . . . . . . . . . . . . . . . . . . . — 118 — —Time deposits . . . . . . . . . . . . . . . . . . . . . . . . . . . . . . . . . . . . . . . . — 3,200 — —
12,016 3,318 12,849 —
Shinhan Credit Information Co., Ltd.Demand deposits . . . . . . . . . . . . . . . . . . . . . . . . . . . . . . . . . . . . . — 580 — 824Time deposits . . . . . . . . . . . . . . . . . . . . . . . . . . . . . . . . . . . . . . . . — 7,424 — 4,897Security deposits . . . . . . . . . . . . . . . . . . . . . . . . . . . . . . . . . . . . . — 855 — 855Other liabilities . . . . . . . . . . . . . . . . . . . . . . . . . . . . . . . . . . . . . . — 465 — 477
— 9,324 — 7,053
Shinhan Private Equity Inc.Demand deposits . . . . . . . . . . . . . . . . . . . . . . . . . . . . . . . . . . . . . — 489 — 713Other liabilities . . . . . . . . . . . . . . . . . . . . . . . . . . . . . . . . . . . . . . — — — 169
— 489 — 882
SH&C Life Insurance Co., Ltd.Other assets . . . . . . . . . . . . . . . . . . . . . . . . . . . . . . . . . . . . . . . . . 1,145 — 1,052 —Demand deposits . . . . . . . . . . . . . . . . . . . . . . . . . . . . . . . . . . . . . — 878 — 1,796Security deposits . . . . . . . . . . . . . . . . . . . . . . . . . . . . . . . . . . . . . — 35 — 35
W 1,145 913 1,052 1,831
F-151
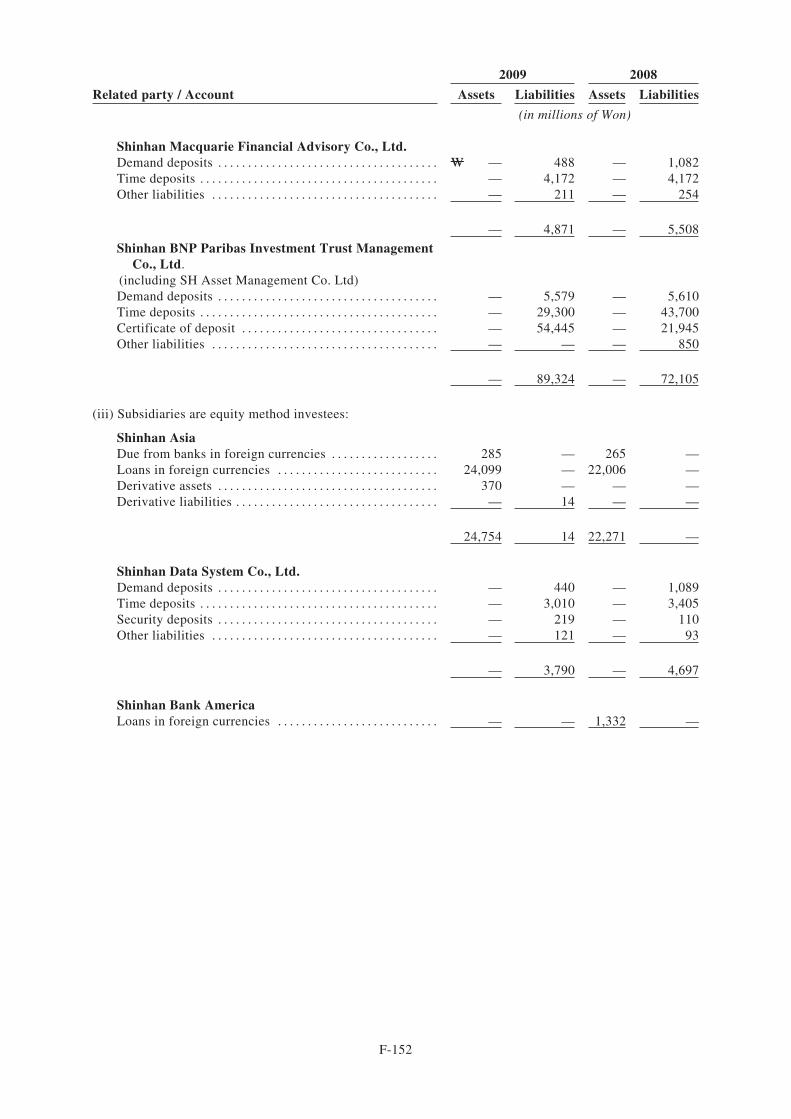
2009 2008
Related party / Account Assets Liabilities Assets Liabilities
(in millions of Won)
Shinhan Macquarie Financial Advisory Co., Ltd.Demand deposits . . . . . . . . . . . . . . . . . . . . . . . . . . . . . . . . . . . . . W — 488 — 1,082Time deposits . . . . . . . . . . . . . . . . . . . . . . . . . . . . . . . . . . . . . . . . — 4,172 — 4,172Other liabilities . . . . . . . . . . . . . . . . . . . . . . . . . . . . . . . . . . . . . . — 211 — 254
— 4,871 — 5,508
Shinhan BNP Paribas Investment Trust ManagementCo., Ltd.
(including SH Asset Management Co. Ltd)Demand deposits . . . . . . . . . . . . . . . . . . . . . . . . . . . . . . . . . . . . . — 5,579 — 5,610Time deposits . . . . . . . . . . . . . . . . . . . . . . . . . . . . . . . . . . . . . . . . — 29,300 — 43,700Certificate of deposit . . . . . . . . . . . . . . . . . . . . . . . . . . . . . . . . . — 54,445 — 21,945Other liabilities . . . . . . . . . . . . . . . . . . . . . . . . . . . . . . . . . . . . . . — — — 850
— 89,324 — 72,105
(iii) Subsidiaries are equity method investees:
Shinhan AsiaDue from banks in foreign currencies . . . . . . . . . . . . . . . . . . 285 — 265 —Loans in foreign currencies . . . . . . . . . . . . . . . . . . . . . . . . . . . 24,099 — 22,006 —Derivative assets . . . . . . . . . . . . . . . . . . . . . . . . . . . . . . . . . . . . . 370 — — —Derivative liabilities . . . . . . . . . . . . . . . . . . . . . . . . . . . . . . . . . . — 14 — —
24,754 14 22,271 —
Shinhan Data System Co., Ltd.Demand deposits . . . . . . . . . . . . . . . . . . . . . . . . . . . . . . . . . . . . . — 440 — 1,089Time deposits . . . . . . . . . . . . . . . . . . . . . . . . . . . . . . . . . . . . . . . . — 3,010 — 3,405Security deposits . . . . . . . . . . . . . . . . . . . . . . . . . . . . . . . . . . . . . — 219 — 110Other liabilities . . . . . . . . . . . . . . . . . . . . . . . . . . . . . . . . . . . . . . — 121 — 93
— 3,790 — 4,697
Shinhan Bank AmericaLoans in foreign currencies . . . . . . . . . . . . . . . . . . . . . . . . . . . — — 1,332 —
F-152
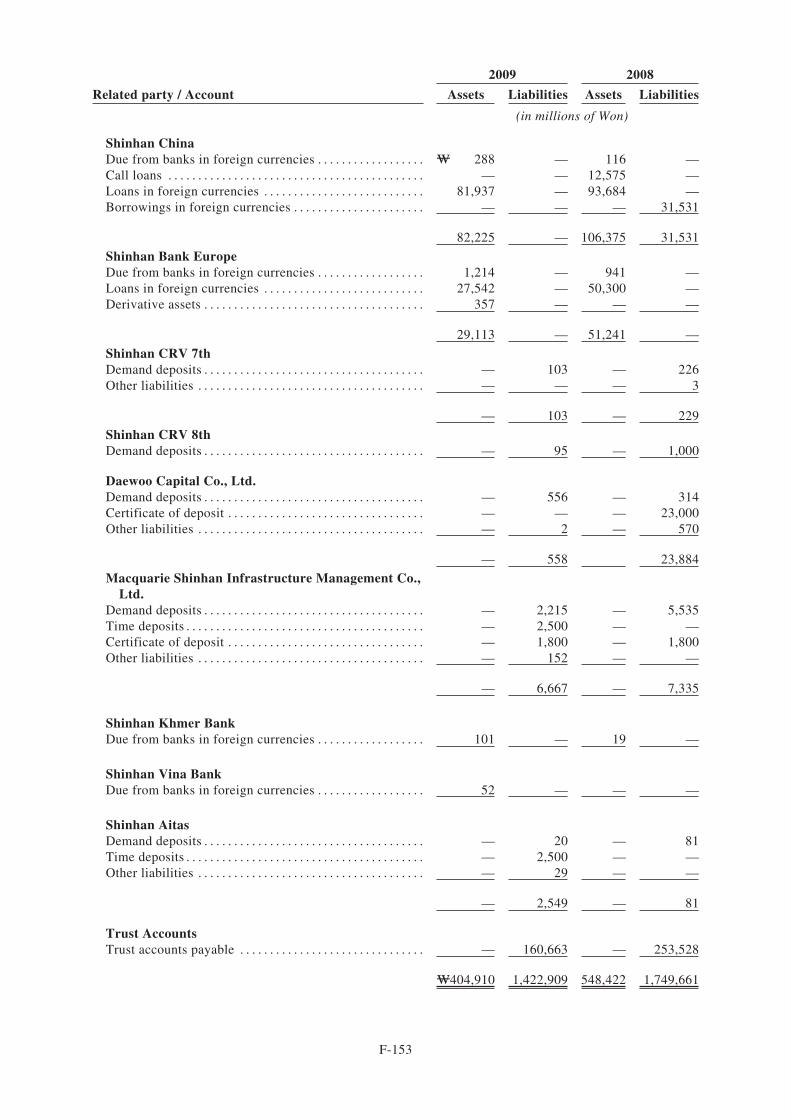
2009 2008
Related party / Account Assets Liabilities Assets Liabilities
(in millions of Won)
Shinhan ChinaDue from banks in foreign currencies . . . . . . . . . . . . . . . . . . W 288 — 116 —Call loans . . . . . . . . . . . . . . . . . . . . . . . . . . . . . . . . . . . . . . . . . . . — — 12,575 —Loans in foreign currencies . . . . . . . . . . . . . . . . . . . . . . . . . . . 81,937 — 93,684 —Borrowings in foreign currencies . . . . . . . . . . . . . . . . . . . . . . — — — 31,531
82,225 — 106,375 31,531
Shinhan Bank EuropeDue from banks in foreign currencies . . . . . . . . . . . . . . . . . . 1,214 — 941 —Loans in foreign currencies . . . . . . . . . . . . . . . . . . . . . . . . . . . 27,542 — 50,300 —Derivative assets . . . . . . . . . . . . . . . . . . . . . . . . . . . . . . . . . . . . . 357 — — —
29,113 — 51,241 —
Shinhan CRV 7thDemand deposits . . . . . . . . . . . . . . . . . . . . . . . . . . . . . . . . . . . . . — 103 — 226Other liabilities . . . . . . . . . . . . . . . . . . . . . . . . . . . . . . . . . . . . . . — — — 3
— 103 — 229
Shinhan CRV 8thDemand deposits . . . . . . . . . . . . . . . . . . . . . . . . . . . . . . . . . . . . . — 95 — 1,000
Daewoo Capital Co., Ltd.Demand deposits . . . . . . . . . . . . . . . . . . . . . . . . . . . . . . . . . . . . . — 556 — 314Certificate of deposit . . . . . . . . . . . . . . . . . . . . . . . . . . . . . . . . . — — — 23,000Other liabilities . . . . . . . . . . . . . . . . . . . . . . . . . . . . . . . . . . . . . . — 2 — 570
— 558 23,884
Macquarie Shinhan Infrastructure Management Co.,Ltd.
Demand deposits . . . . . . . . . . . . . . . . . . . . . . . . . . . . . . . . . . . . . — 2,215 — 5,535Time deposits . . . . . . . . . . . . . . . . . . . . . . . . . . . . . . . . . . . . . . . . — 2,500 — —Certificate of deposit . . . . . . . . . . . . . . . . . . . . . . . . . . . . . . . . . — 1,800 — 1,800Other liabilities . . . . . . . . . . . . . . . . . . . . . . . . . . . . . . . . . . . . . . — 152 — —
— 6,667 — 7,335
Shinhan Khmer BankDue from banks in foreign currencies . . . . . . . . . . . . . . . . . . 101 — 19 —
Shinhan Vina BankDue from banks in foreign currencies . . . . . . . . . . . . . . . . . . 52 — — —
Shinhan AitasDemand deposits . . . . . . . . . . . . . . . . . . . . . . . . . . . . . . . . . . . . . — 20 — 81Time deposits . . . . . . . . . . . . . . . . . . . . . . . . . . . . . . . . . . . . . . . . — 2,500 — —Other liabilities . . . . . . . . . . . . . . . . . . . . . . . . . . . . . . . . . . . . . . — 29 — —
— 2,549 — 81
Trust AccountsTrust accounts payable . . . . . . . . . . . . . . . . . . . . . . . . . . . . . . . — 160,663 — 253,528
W404,910 1,422,909 548,422 1,749,661
F-153
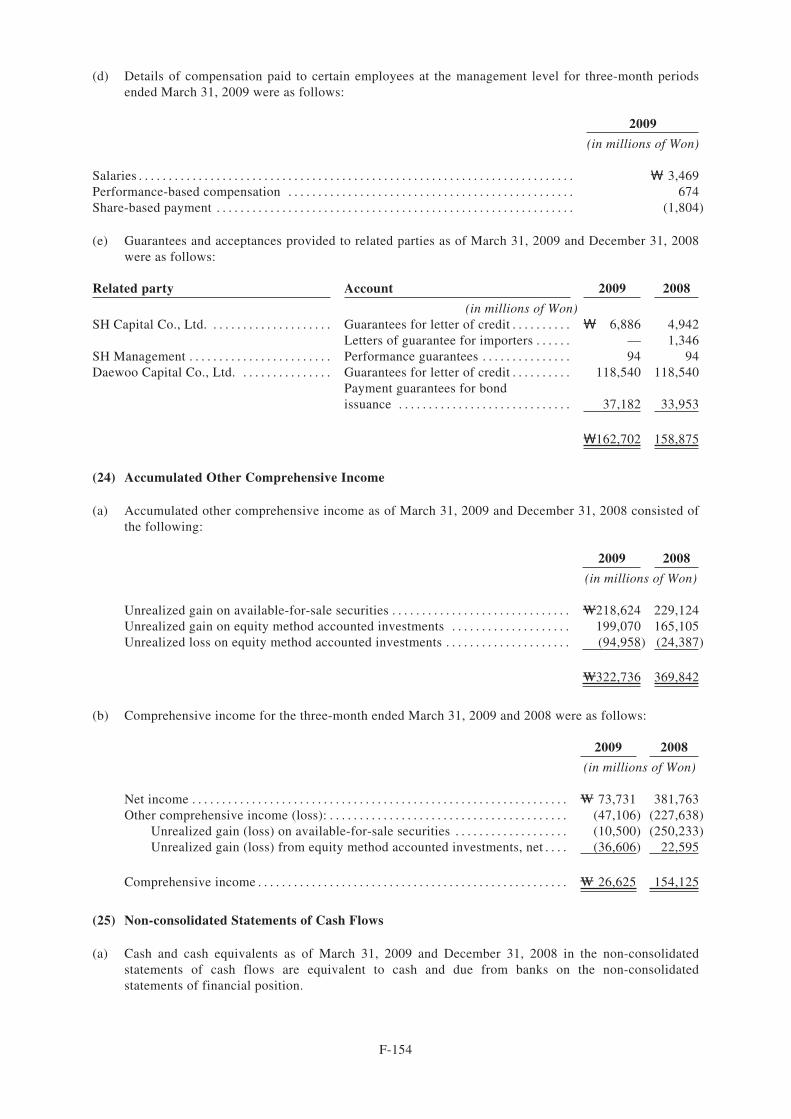
(d) Details of compensation paid to certain employees at the management level for three-month periodsended March 31, 2009 were as follows:
2009
(in millions of Won)
Salaries . . . . . . . . . . . . . . . . . . . . . . . . . . . . . . . . . . . . . . . . . . . . . . . . . . . . . . . . . . . . . . . . . . . . . . . . . Y 3,469Performance-based compensation . . . . . . . . . . . . . . . . . . . . . . . . . . . . . . . . . . . . . . . . . . . . . . . . 674Share-based payment . . . . . . . . . . . . . . . . . . . . . . . . . . . . . . . . . . . . . . . . . . . . . . . . . . . . . . . . . . . . (1,804)
(e) Guarantees and acceptances provided to related parties as of March 31, 2009 and December 31, 2008were as follows:
Related party Account 2009 2008
(in millions of Won)SH Capital Co., Ltd. . . . . . . . . . . . . . . . . . . . . Guarantees for letter of credit . . . . . . . . . . Y 6,886 4,942
Letters of guarantee for importers . . . . . . — 1,346SH Management . . . . . . . . . . . . . . . . . . . . . . . . Performance guarantees . . . . . . . . . . . . . . . 94 94Daewoo Capital Co., Ltd. . . . . . . . . . . . . . . . Guarantees for letter of credit . . . . . . . . . . 118,540 118,540
Payment guarantees for bondissuance . . . . . . . . . . . . . . . . . . . . . . . . . . . . . 37,182 33,953
Y162,702 158,875
(24) Accumulated Other Comprehensive Income
(a) Accumulated other comprehensive income as of March 31, 2009 and December 31, 2008 consisted ofthe following:
2009 2008
(in millions of Won)
Unrealized gain on available-for-sale securities . . . . . . . . . . . . . . . . . . . . . . . . . . . . . . W218,624 229,124Unrealized gain on equity method accounted investments . . . . . . . . . . . . . . . . . . . . 199,070 165,105Unrealized loss on equity method accounted investments . . . . . . . . . . . . . . . . . . . . . (94,958) (24,387)
W322,736 369,842
(b) Comprehensive income for the three-month ended March 31, 2009 and 2008 were as follows:
2009 2008
(in millions of Won)
Net income . . . . . . . . . . . . . . . . . . . . . . . . . . . . . . . . . . . . . . . . . . . . . . . . . . . . . . . . . . . . . . . W 73,731 381,763Other comprehensive income (loss): . . . . . . . . . . . . . . . . . . . . . . . . . . . . . . . . . . . . . . . . (47,106) (227,638)
Unrealized gain (loss) on available-for-sale securities . . . . . . . . . . . . . . . . . . . (10,500) (250,233)Unrealized gain (loss) from equity method accounted investments, net . . . . (36,606) 22,595
Comprehensive income . . . . . . . . . . . . . . . . . . . . . . . . . . . . . . . . . . . . . . . . . . . . . . . . . . . . W 26,625 154,125
(25) Non-consolidated Statements of Cash Flows
(a) Cash and cash equivalents as of March 31, 2009 and December 31, 2008 in the non-consolidatedstatements of cash flows are equivalent to cash and due from banks on the non-consolidatedstatements of financial position.
F-154
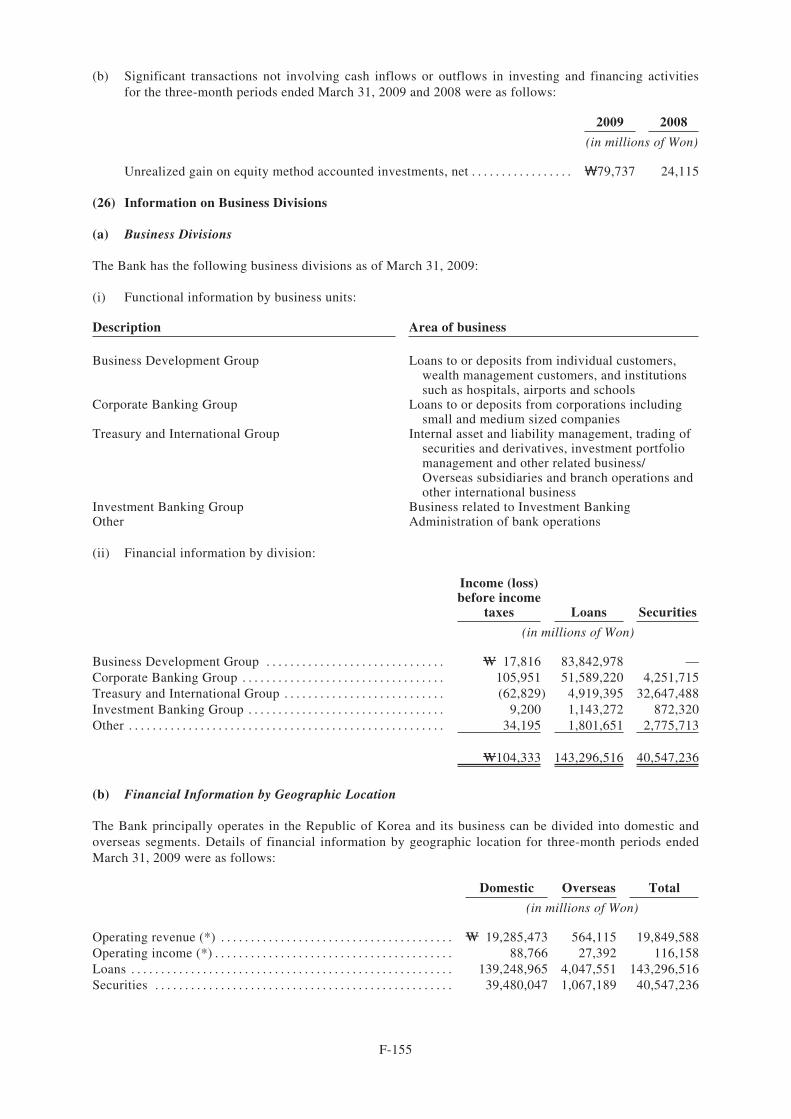
(b) Significant transactions not involving cash inflows or outflows in investing and financing activitiesfor the three-month periods ended March 31, 2009 and 2008 were as follows:
2009 2008
(in millions of Won)
Unrealized gain on equity method accounted investments, net . . . . . . . . . . . . . . . . . Y79,737 24,115
(26) Information on Business Divisions
(a) Business Divisions
The Bank has the following business divisions as of March 31, 2009:
(i) Functional information by business units:
Description Area of business
Business Development Group Loans to or deposits from individual customers,wealth management customers, and institutionssuch as hospitals, airports and schools
Corporate Banking Group Loans to or deposits from corporations includingsmall and medium sized companies
Treasury and International Group Internal asset and liability management, trading ofsecurities and derivatives, investment portfoliomanagement and other related business/Overseas subsidiaries and branch operations andother international business
Investment Banking Group Business related to Investment BankingOther Administration of bank operations
(ii) Financial information by division:
Income (loss)before income
taxes Loans Securities
(in millions of Won)
Business Development Group . . . . . . . . . . . . . . . . . . . . . . . . . . . . . . W 17,816 83,842,978 —Corporate Banking Group . . . . . . . . . . . . . . . . . . . . . . . . . . . . . . . . . . 105,951 51,589,220 4,251,715Treasury and International Group . . . . . . . . . . . . . . . . . . . . . . . . . . . (62,829) 4,919,395 32,647,488Investment Banking Group . . . . . . . . . . . . . . . . . . . . . . . . . . . . . . . . . 9,200 1,143,272 872,320Other . . . . . . . . . . . . . . . . . . . . . . . . . . . . . . . . . . . . . . . . . . . . . . . . . . . . . 34,195 1,801,651 2,775,713
W104,333 143,296,516 40,547,236
(b) Financial Information by Geographic Location
The Bank principally operates in the Republic of Korea and its business can be divided into domestic andoverseas segments. Details of financial information by geographic location for three-month periods endedMarch 31, 2009 were as follows:
Domestic Overseas Total
(in millions of Won)
Operating revenue (*) . . . . . . . . . . . . . . . . . . . . . . . . . . . . . . . . . . . . . . . W 19,285,473 564,115 19,849,588Operating income (*) . . . . . . . . . . . . . . . . . . . . . . . . . . . . . . . . . . . . . . . . 88,766 27,392 116,158Loans . . . . . . . . . . . . . . . . . . . . . . . . . . . . . . . . . . . . . . . . . . . . . . . . . . . . . . 139,248,965 4,047,551 143,296,516Securities . . . . . . . . . . . . . . . . . . . . . . . . . . . . . . . . . . . . . . . . . . . . . . . . . . 39,480,047 1,067,189 40,547,236
F-155
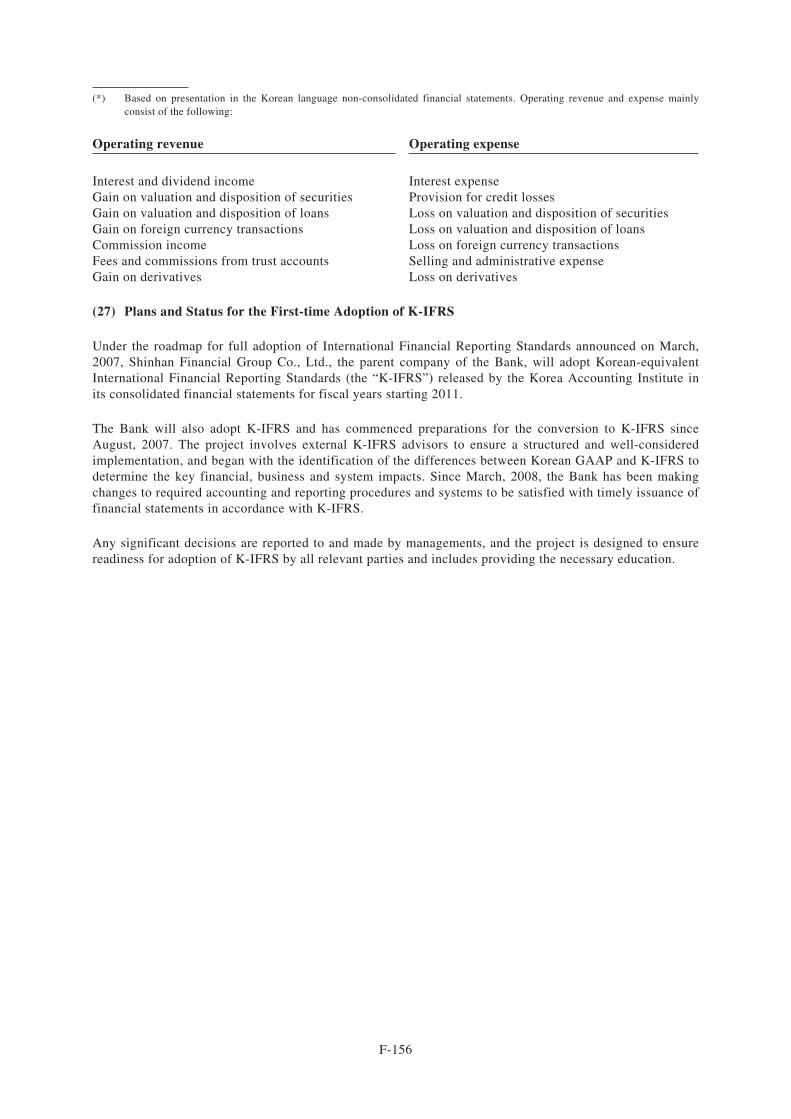
(*) Based on presentation in the Korean language non-consolidated financial statements. Operating revenue and expense mainlyconsist of the following:
Operating revenue Operating expense
Interest and dividend income Interest expenseGain on valuation and disposition of securities Provision for credit lossesGain on valuation and disposition of loans Loss on valuation and disposition of securitiesGain on foreign currency transactions Loss on valuation and disposition of loansCommission income Loss on foreign currency transactionsFees and commissions from trust accounts Selling and administrative expenseGain on derivatives Loss on derivatives
(27) Plans and Status for the First-time Adoption of K-IFRS
Under the roadmap for full adoption of International Financial Reporting Standards announced on March,2007, Shinhan Financial Group Co., Ltd., the parent company of the Bank, will adopt Korean-equivalentInternational Financial Reporting Standards (the “K-IFRS”) released by the Korea Accounting Institute inits consolidated financial statements for fiscal years starting 2011.
The Bank will also adopt K-IFRS and has commenced preparations for the conversion to K-IFRS sinceAugust, 2007. The project involves external K-IFRS advisors to ensure a structured and well-consideredimplementation, and began with the identification of the differences between Korean GAAP and K-IFRS todetermine the key financial, business and system impacts. Since March, 2008, the Bank has been makingchanges to required accounting and reporting procedures and systems to be satisfied with timely issuance offinancial statements in accordance with K-IFRS.
Any significant decisions are reported to and made by managements, and the project is designed to ensurereadiness for adoption of K-IFRS by all relevant parties and includes providing the necessary education.
F-156
THE ISSUER
Registered and Head Office
Shinhan Bank120, 2-Ka, Taepyung-ro
Chung-KuSeoulKorea
LEGAL ADVISERS TO THE ISSUER
As to United States law As to Korean law
Simpson Thacher & Bartlett LLP35th Floor, ICBC Tower
3 Garden RoadCentral
Hong Kong
YulchonTextile Center 12th Floor
944-31 Daechi-dongKangnam-ku
Seoul 135-713Korea
LEGAL ADVISERS TO THE INITIAL PURCHASERS
As to United States law As to Korean law
Davis Polk & WardwellThe Hong Kong Club Building
3A Chater RoadHong Kong
Kim & ChangSeyang Building223 Naeja-dong
Chongro-guSeoul 110-720
Korea
SINGAPORE LISTING AGENT
Shook Lin & Bok LLP1 Robinson Road
#18-00 AIA TowerSingapore 048542
INDEPENDENT ACCOUNTANTS
KPMG Samjong Accounting Corp.10th Floor, Star Tower
737 Yeoksam-dongGangnam-gu
Seoul 135-984Korea
FISCAL AGENT, PRINCIPAL PAYING AGENT, TRANSFER AGENT AND REGISTRAR
The Bank of New York Mellon101 Barclay Street
New YorkNY 10286
USA