Embed Size (px)
Citation preview

Shimadzu Integrated Report 2018
Printed in Japan 0156-09801-500NS
P010-E654
In the interest of environmental-friendliness, this report is printed with vegetable oil ink on
FSC® certified paper, ensures responsible use of the world’s forest resources.
1 Nishinokyo Kuwabara-cho, Nakagyo-ku, Kyoto 604-8511, Japanhttps://www.shimadzu.com
Financial Section

1 Shimadzu Integrated Report 2018
Shimadzu Corporation and Consolidated Subsidiaries
Consolidated Balance SheetMarch 31, 2018
Millions of Yen
Thousands ofU.S. Dollars
(Note 3)2018 2017 2018
ASSETSCURRENT ASSETS:Cash and cash equivalents (Note 13) .............................................................. ¥ 75,090 ¥ 52,763 $ 708,396Time deposits (Note 13) ................................................................................. 1,837 3,935 17,330Trade receivables:
Notes and accounts (Note 13) .................................................................... 119,118 112,878 1,123,755Allowance for doubtful receivables ............................................................ (1,409) (1,143) (13,292)
Net trade receivables ......................................................................... 117,709 111,735 1,110,463Securities ....................................................................................................... 20 189Inventories (Note 5) ........................................................................................ 80,636 76,701 760,717Deferred tax assets (Note 11) .......................................................................... 9,662 9,603 91,151Prepaid expenses and other current assets ..................................................... 8,932 8,344 84,263
Total current assets ............................................................................ 293,886 263,081 2,772,509
PROPERTY, PLANT AND EQUIPMENT (Note 2.f):Land .............................................................................................................. 18,822 18,880 177,566Buildings and structures ................................................................................. 39,985 39,976 377,217Machinery, equipment and vehicles ................................................................ 6,714 5,904 63,340Tools, furniture and fixtures ........................................................................... 12,655 10,853 119,387Lease assets ................................................................................................... 2,735 2,510 25,802Construction in progress ................................................................................ 3,225 628 30,425
Total property, plant and equipment .................................................. 84,136 78,751 793,737
INVESTMENTS AND OTHER ASSETS:Investment securities (Notes 4 and 13) ............................................................ 15,779 13,495 148,858Investments in and advances to unconsolidated subsidiaries and
associated companies (Note 13) ................................................................. 685 284 6,462Software ........................................................................................................ 6,303 6,822 59,462Asset for retirement benefits (Note 8) ............................................................ 8,010 3,706 75,566Deferred tax assets (Note 11) .......................................................................... 3,089 4,161 29,142Other assets ................................................................................................... 7,877 5,054 74,312
Total investments and other assets ..................................................... 41,743 33,522 393,802TOTAL ............................................................................................................ ¥419,765 ¥375,354 $3,960,048
See notes to consolidated financial statements.
2Shimadzu Integrated Report 2018
Millions of Yen
Thousands ofU.S. Dollars
(Note 3)2018 2017 2018
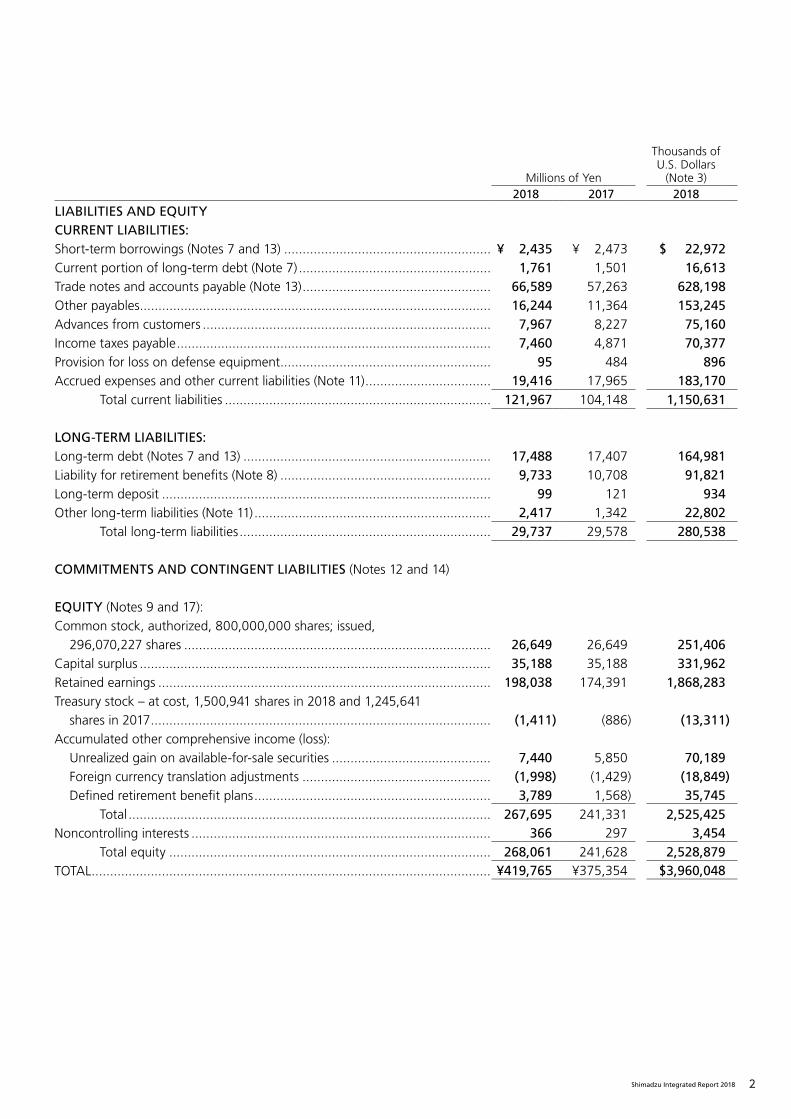
LIABILITIES AND EQUITYCURRENT LIABILITIES:Short-term borrowings (Notes 7 and 13) ........................................................ ¥ 2,435 ¥ 2,473 $ 22,972Current portion of long-term debt (Note 7) .................................................... 1,761 1,501 16,613Trade notes and accounts payable (Note 13) ................................................... 66,589 57,263 628,198Other payables ............................................................................................... 16,244 11,364 153,245Advances from customers .............................................................................. 7,967 8,227 75,160Income taxes payable ..................................................................................... 7,460 4,871 70,377Provision for loss on defense equipment ......................................................... 95 484 896Accrued expenses and other current liabilities (Note 11) .................................. 19,416 17,965 183,170
Total current liabilities ........................................................................ 121,967 104,148 1,150,631
LONG-TERM LIABILITIES:Long-term debt (Notes 7 and 13) ................................................................... 17,488 17,407 164,981Liability for retirement benefits (Note 8) ......................................................... 9,733 10,708 91,821Long-term deposit ......................................................................................... 99 121 934Other long-term liabilities (Note 11) ................................................................ 2,417 1,342 22,802
Total long-term liabilities .................................................................... 29,737 29,578 280,538
COMMITMENTS AND CONTINGENT LIABILITIES (Notes 12 and 14)
EQUITY (Notes 9 and 17):Common stock, authorized, 800,000,000 shares; issued,
296,070,227 shares ................................................................................... 26,649 26,649 251,406Capital surplus ............................................................................................... 35,188 35,188 331,962Retained earnings .......................................................................................... 198,038 174,391 1,868,283Treasury stock – at cost, 1,500,941 shares in 2018 and 1,245,641
shares in 2017 ............................................................................................ (1,411) (886) (13,311)Accumulated other comprehensive income (loss):
Unrealized gain on available-for-sale securities ........................................... 7,440 5,850 70,189Foreign currency translation adjustments ................................................... (1,998) (1,429) (18,849)Defined retirement benefit plans ................................................................ 3,789 1,568) 35,745
Total .................................................................................................. 267,695 241,331 2,525,425Noncontrolling interests ................................................................................. 366 297 3,454
Total equity ....................................................................................... 268,061 241,628 2,528,879TOTAL ............................................................................................................ ¥419,765 ¥375,354 $3,960,048
3 Shimadzu Integrated Report 2018
Shimadzu Corporation and Consolidated Subsidiaries
Consolidated Statement of IncomeYear Ended March 31, 2018
Millions of Yen
Thousands ofU.S. Dollars
(Note 3)2018 2017 2018
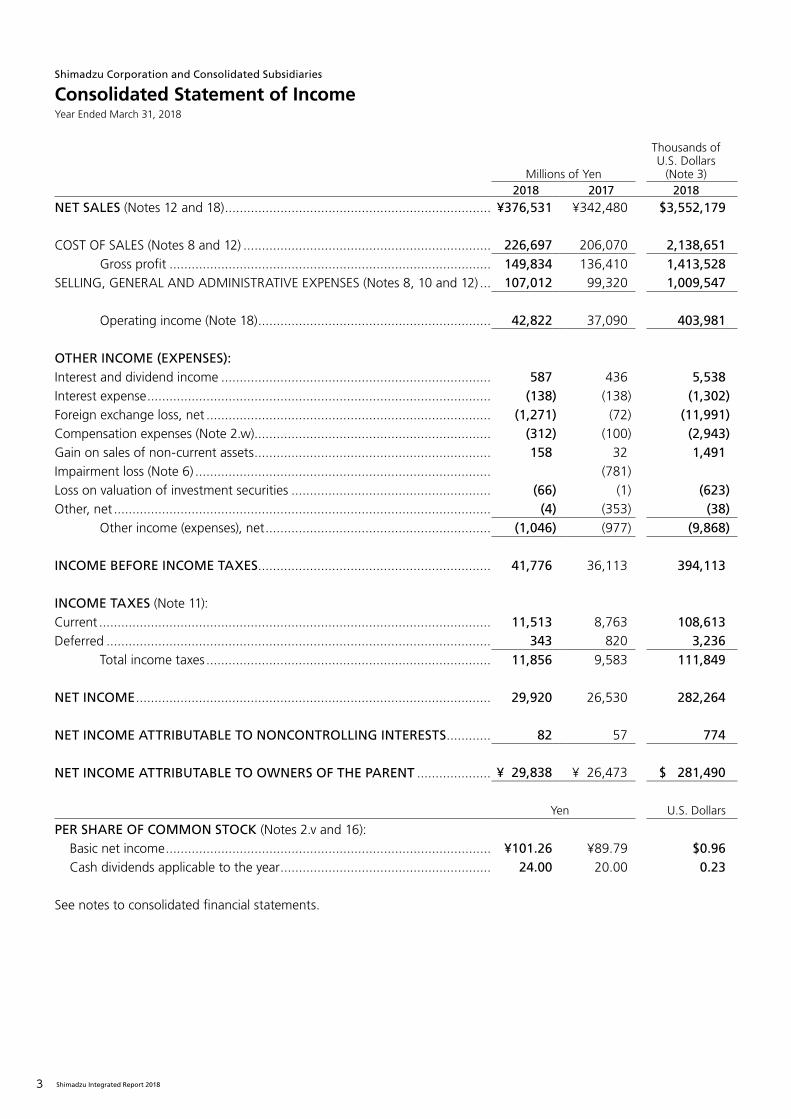
NET SALES (Notes 12 and 18) ........................................................................ ¥376,531 ¥342,480 $3,552,179
COST OF SALES (Notes 8 and 12) ................................................................... 226,697 206,070 2,138,651Gross profit ....................................................................................... 149,834 136,410 1,413,528
SELLING, GENERAL AND ADMINISTRATIVE EXPENSES (Notes 8, 10 and 12) ... 107,012 99,320 1,009,547
Operating income (Note 18) ............................................................... 42,822 37,090 403,981
OTHER INCOME (EXPENSES):Interest and dividend income ......................................................................... 587 436 5,538Interest expense ............................................................................................. (138) (138) (1,302)Foreign exchange loss, net ............................................................................. (1,271) (72) (11,991)Compensation expenses (Note 2.w)................................................................ (312) (100) (2,943)Gain on sales of non-current assets ................................................................ 158 32 1,491Impairment loss (Note 6) ................................................................................ (781)Loss on valuation of investment securities ...................................................... (66) (1) (623)Other, net ...................................................................................................... (4) (353) (38)
Other income (expenses), net ............................................................. (1,046) (977) (9,868)
INCOME BEFORE INCOME TAXES ............................................................... 41,776 36,113 394,113
INCOME TAXES (Note 11):Current .......................................................................................................... 11,513 8,763 108,613Deferred ........................................................................................................ 343 820 3,236
Total income taxes ............................................................................. 11,856 9,583 111,849
NET INCOME ................................................................................................ 29,920 26,530 282,264
NET INCOME ATTRIBUTABLE TO NONCONTROLLING INTERESTS ............ 82 57 774
NET INCOME ATTRIBUTABLE TO OWNERS OF THE PARENT .................... ¥ 29,838 ¥ 26,473 $ 281,490
Yen U.S. Dollars
PER SHARE OF COMMON STOCK (Notes 2.v and 16):Basic net income ........................................................................................ ¥101.26 ¥89.79 $0.96Cash dividends applicable to the year ......................................................... 24.00 20.00 0.23
See notes to consolidated financial statements.

4Shimadzu Integrated Report 2018
Shimadzu Corporation and Consolidated Subsidiaries
Consolidated Statement of Comprehensive IncomeYear Ended March 31, 2018
Millions of Yen
Thousands ofU.S. Dollars
(Note 3)2018 2017 2018
NET INCOME ................................................................................................ ¥29,920 ¥26,530 $282,264
OTHER COMPREHENSIVE INCOME (LOSS) (Note 15):Unrealized gain on available-for-sale securities ........................................... 1,591 813 15,010Foreign currency translation adjustments ................................................... (566) (2,450) (5,340)Defined retirement benefit plans ................................................................ 2,219 2,939 20,934
Total other comprehensive income ..................................................... 3,244 1,302 30,604
COMPREHENSIVE INCOME ......................................................................... ¥33,164 ¥27,832 $312,868
TOTAL COMPREHENSIVE INCOME ATTRIBUTABLE TO:Owners of the parent ................................................................................ ¥33,079 ¥27,787 $312,066Noncontrolling interests ............................................................................. 85 45 802
See notes to consolidated financial statements.

5 Shimadzu Integrated Report 2018
Shimadzu Corporation and Consolidated Subsidiaries
Consolidated Statement of Changes in EquityYear Ended March 31, 2018
Millions of Yen Millions of Yen
Accumulated Other Comprehensive Income (Loss)
Number of Shares of
Common Stock Outstanding
CommonStock
CapitalSurplus
RetainedEarnings
Treasury Stock
Unrealized Gain on
Available-for-Sale Securities
Foreign Currency
Translation Adjustments
Defined Retirement
Benefit Plans TotalNoncontrolling
InterestsTotal
Equity
BALANCE, APRIL 1, 2016 ................................ 294,839,522 ¥26,649 ¥35,188 ¥153,758 ¥ (861) BALANCE, APRIL 1, 2016 ....................... ¥5,037 ¥ 1,294 ¥(1,371) ¥219,694 ¥278 ¥219,972Net income attributable to owners of
the parent ..................................................... 26,473Net income attributable to owners of
the parent ............................................ 26,473 26,473Cash dividends .................................................. (5,601) Cash dividends ......................................... (5,601) (5,601)Change of scope of consolidation ..................... (239) Change of scope of consolidation ............ (239) (239)Purchase of treasury stock ................................. (25) Purchase of treasury stock ........................ (25) (25)Net change in the year ...................................... (14,936) Net change in the year ............................. 813 (2,723) 2,939 1,029 19 1,048BALANCE, MARCH 31, 2017 ........................... 294,824,586 26,649 35,188 174,391 (886) BALANCE, MARCH 31, 2017 .................. 5,850 (1,429) 1,568 241,331 297 241,628Net income attributable to owners of
the parent ..................................................... 29,838Net income attributable to owners of
the parent ............................................ 29,838 29,838Cash dividends .................................................. (6,191) Cash dividends ......................................... (6,191) (6,191)Change of scope of consolidation ..................... Change of scope of consolidation ............Purchase of treasury stock ................................. (525) Purchase of treasury stock ........................ (525) (525)Net change in the year ...................................... (255,300) Net change in the year ............................. 1,590 (569) 2,221 3,242 69 3,311BALANCE, MARCH 31, 2018 ........................... 294,569,286 ¥26,649 ¥35,188 ¥198,038 ¥(1,411) BALANCE, MARCH 31, 2018 .................. ¥7,440 ¥(1,998) ¥ 3,789 ¥267,695 ¥366 ¥268,061
Thousands of U.S. Dollars (Note 3) Thousands of U.S. Dollars (Note 3)
Accumulated Other Comprehensive Income (Loss)
CommonStock
CapitalSurplus
RetainedEarnings
Treasury Stock
Unrealized Gain on
Available-for-Sale Securities
Foreign Currency
Translation Adjustments
Defined Retirement
Benefit Plans TotalNoncontrolling
InterestsTotal
Equity
BALANCE, MARCH 31, 2017 ........................... $251,406 $331,962 $1,645,198 $ (8,358) BALANCE, MARCH 31, 2017 .................. $55,189 $(13,481) $14,792 $2,276,708 $2,803 $2,279,511Net income attributable to owners of
the parent ..................................................... 281,490Net income attributable to owners of
the parent ............................................ 281,490 281,490Cash dividends .................................................. (58,405) Cash dividends ......................................... (58,405) (58,405)Change of scope of consolidation ..................... Change of scope of consolidation ............Purchase of treasury stock ................................. (4,953) Purchase of treasury stock ........................ (4,953) (4,953)Net change in the year ...................................... Net change in the year ............................. 15,000 (5,368) 20,953 30,585 651 31,236BALANCE, MARCH 31, 2018 ........................... $251,406 $331,962 $1,868,283 $(13,311) BALANCE, MARCH 31, 2018 .................. $70,189 $(18,849) $35,745 $2,525,425 $3,454 $2,528,879
See notes to consolidated financial statements. See notes to consolidated financial statements.

6Shimadzu Integrated Report 2018
Millions of Yen Millions of Yen
Accumulated Other Comprehensive Income (Loss)
Number of Shares of
Common Stock Outstanding
CommonStock
CapitalSurplus
RetainedEarnings
Treasury Stock
Unrealized Gain on
Available-for-Sale Securities
Foreign Currency
Translation Adjustments
Defined Retirement
Benefit Plans TotalNoncontrolling
InterestsTotal
Equity
BALANCE, APRIL 1, 2016 ................................ 294,839,522 ¥26,649 ¥35,188 ¥153,758 ¥ (861) BALANCE, APRIL 1, 2016 ....................... ¥5,037 ¥ 1,294 ¥(1,371) ¥219,694 ¥278 ¥219,972Net income attributable to owners of
the parent ..................................................... 26,473Net income attributable to owners of
the parent ............................................ 26,473 26,473Cash dividends .................................................. (5,601) Cash dividends ......................................... (5,601) (5,601)Change of scope of consolidation ..................... (239) Change of scope of consolidation ............ (239) (239)Purchase of treasury stock ................................. (25) Purchase of treasury stock ........................ (25) (25)Net change in the year ...................................... (14,936) Net change in the year ............................. 813 (2,723) 2,939 1,029 19 1,048BALANCE, MARCH 31, 2017 ........................... 294,824,586 26,649 35,188 174,391 (886) BALANCE, MARCH 31, 2017 .................. 5,850 (1,429) 1,568 241,331 297 241,628Net income attributable to owners of
the parent ..................................................... 29,838Net income attributable to owners of
the parent ............................................ 29,838 29,838Cash dividends .................................................. (6,191) Cash dividends ......................................... (6,191) (6,191)Change of scope of consolidation ..................... Change of scope of consolidation ............Purchase of treasury stock ................................. (525) Purchase of treasury stock ........................ (525) (525)Net change in the year ...................................... (255,300) Net change in the year ............................. 1,590 (569) 2,221 3,242 69 3,311BALANCE, MARCH 31, 2018 ........................... 294,569,286 ¥26,649 ¥35,188 ¥198,038 ¥(1,411) BALANCE, MARCH 31, 2018 .................. ¥7,440 ¥(1,998) ¥ 3,789 ¥267,695 ¥366 ¥268,061
Thousands of U.S. Dollars (Note 3) Thousands of U.S. Dollars (Note 3)
Accumulated Other Comprehensive Income (Loss)
CommonStock
CapitalSurplus
RetainedEarnings
Treasury Stock
Unrealized Gain on
Available-for-Sale Securities
Foreign Currency
Translation Adjustments
Defined Retirement
Benefit Plans TotalNoncontrolling
InterestsTotal
Equity
BALANCE, MARCH 31, 2017 ........................... $251,406 $331,962 $1,645,198 $ (8,358) BALANCE, MARCH 31, 2017 .................. $55,189 $(13,481) $14,792 $2,276,708 $2,803 $2,279,511Net income attributable to owners of
the parent ..................................................... 281,490Net income attributable to owners of
the parent ............................................ 281,490 281,490Cash dividends .................................................. (58,405) Cash dividends ......................................... (58,405) (58,405)Change of scope of consolidation ..................... Change of scope of consolidation ............Purchase of treasury stock ................................. (4,953) Purchase of treasury stock ........................ (4,953) (4,953)Net change in the year ...................................... Net change in the year ............................. 15,000 (5,368) 20,953 30,585 651 31,236BALANCE, MARCH 31, 2018 ........................... $251,406 $331,962 $1,868,283 $(13,311) BALANCE, MARCH 31, 2018 .................. $70,189 $(18,849) $35,745 $2,525,425 $3,454 $2,528,879
See notes to consolidated financial statements. See notes to consolidated financial statements.
7 Shimadzu Integrated Report 2018
Shimadzu Corporation and Consolidated Subsidiaries
Consolidated Statement of Cash FlowsYear Ended March 31, 2018
Millions of Yen
Thousands ofU.S. Dollars
(Note 3)2018 2017 2018
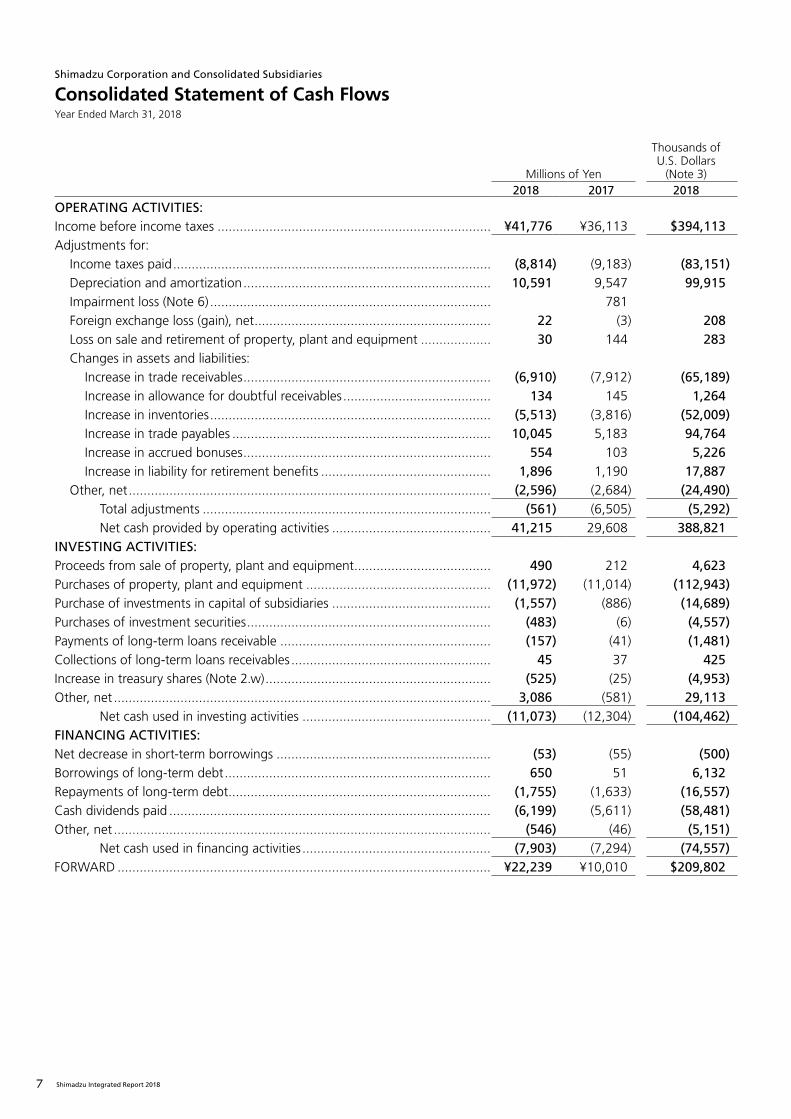
OPERATING ACTIVITIES:Income before income taxes .......................................................................... ¥41,776 ¥36,113 $394,113Adjustments for:
Income taxes paid ...................................................................................... (8,814) (9,183) (83,151)Depreciation and amortization ................................................................... 10,591 9,547 99,915Impairment loss (Note 6) ............................................................................ 781Foreign exchange loss (gain), net ................................................................ 22 (3) 208Loss on sale and retirement of property, plant and equipment ................... 30 144 283Changes in assets and liabilities:
Increase in trade receivables ................................................................... (6,910) (7,912) (65,189)Increase in allowance for doubtful receivables ........................................ 134 145 1,264Increase in inventories ............................................................................ (5,513) (3,816) (52,009)Increase in trade payables ...................................................................... 10,045 5,183 94,764Increase in accrued bonuses ................................................................... 554 103 5,226Increase in liability for retirement benefits .............................................. 1,896 1,190 17,887
Other, net .................................................................................................. (2,596) (2,684) (24,490)Total adjustments .............................................................................. (561) (6,505) (5,292)Net cash provided by operating activities ........................................... 41,215 29,608 388,821
INVESTING ACTIVITIES:Proceeds from sale of property, plant and equipment ..................................... 490 212 4,623Purchases of property, plant and equipment .................................................. (11,972) (11,014) (112,943)Purchase of investments in capital of subsidiaries ........................................... (1,557) (886) (14,689)Purchases of investment securities .................................................................. (483) (6) (4,557)Payments of long-term loans receivable ......................................................... (157) (41) (1,481)Collections of long-term loans receivables ...................................................... 45 37 425Increase in treasury shares (Note 2.w) ............................................................. (525) (25) (4,953)Other, net ...................................................................................................... 3,086 (581) 29,113
Net cash used in investing activities ................................................... (11,073) (12,304) (104,462)FINANCING ACTIVITIES:Net decrease in short-term borrowings .......................................................... (53) (55) (500)Borrowings of long-term debt ........................................................................ 650 51 6,132Repayments of long-term debt ....................................................................... (1,755) (1,633) (16,557)Cash dividends paid ....................................................................................... (6,199) (5,611) (58,481)Other, net ...................................................................................................... (546) (46) (5,151)
Net cash used in financing activities ................................................... (7,903) (7,294) (74,557)FORWARD ..................................................................................................... ¥22,239 ¥10,010 $209,802
8Shimadzu Integrated Report 2018
Shimadzu Corporation and Consolidated Subsidiaries
Consolidated Statement of Cash FlowsYear Ended March 31, 2018
Millions of Yen
Thousands ofU.S. Dollars
(Note 3)2018 2017 2018
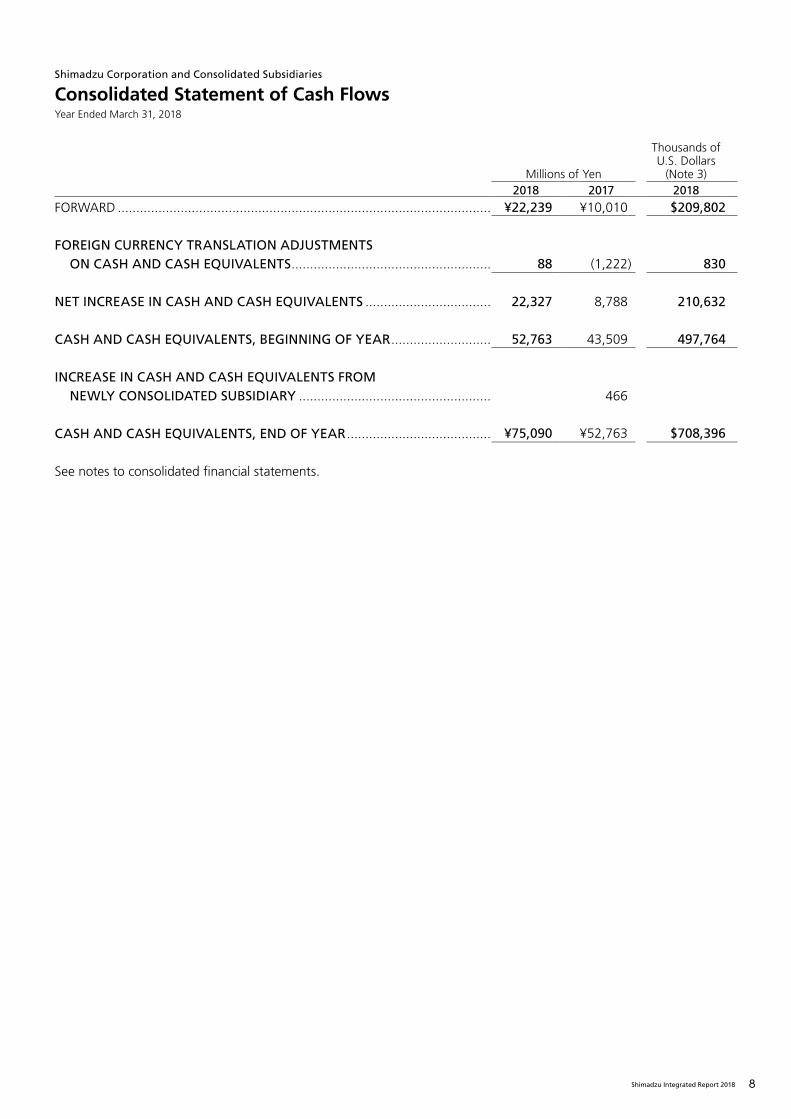
FORWARD ..................................................................................................... ¥22,239 ¥10,010 $209,802
FOREIGN CURRENCY TRANSLATION ADJUSTMENTS ON CASH AND CASH EQUIVALENTS ...................................................... 88 (1,222) 830
NET INCREASE IN CASH AND CASH EQUIVALENTS .................................. 22,327 8,788 210,632
CASH AND CASH EQUIVALENTS, BEGINNING OF YEAR ........................... 52,763 43,509 497,764
INCREASE IN CASH AND CASH EQUIVALENTS FROM NEWLY CONSOLIDATED SUBSIDIARY .................................................... 466
CASH AND CASH EQUIVALENTS, END OF YEAR ....................................... ¥75,090 ¥52,763 $708,396
See notes to consolidated financial statements.

9 Shimadzu Integrated Report 2018
Shimadzu Corporation and Consolidated Subsidiaries
Notes to Consolidated Financial StatementsYear Ended March 31, 2018
1. BASIS OF PRESENTATION OF CONSOLIDATED FINANCIAL STATEMENTS
The accompanying consolidated financial statements of Shimadzu Corporation (the “Company”) and its significant subsidiaries (together, the “Group”) have been prepared in accordance with the provisions set forth in the Japanese Financial Instruments and Exchange Act and its related accounting regulations and in accordance with accounting principles generally accepted in Japan (“Japanese GAAP”), which are different in certain respects as to the application and disclosure requirements of International Financial Reporting Standards (“IFRS”).
In preparing these consolidated financial statements, certain reclassifications and rearrangements have been made to the consolidated financial statements issued domestically in order to present them in a form which is more familiar to readers outside Japan. In addition, certain reclassifications have been made in the 2017 consolidated financial statements to conform to the classifications used in 2018.
2. SUMMARY OF SIGNIFICANT ACCOUNTING POLICIESa. Consolidation - The consolidated financial statements as of
March 31, 2018, include the accounts of the Company and its 23 (24 in 2017) domestic subsidiaries and 51 (50 in 2017) foreign subsidiaries. Consolidation of the remaining subsidiaries would not have a material effect on the accompanying consolidated financial statements.
Under the control concept, those companies in which the Company, directly or indirectly, is able to exercise control over operations are fully consolidated.
Investments in 4 (1 in 2017) unconsolidated subsidiaries and 5 (4 in 2017) associated companies are stated at cost. The effect on the consolidated financial statements of not applying the equity method is immaterial.
All significant intercompany balances and transactions have been eliminated in consolidation. All material unrealized profit included in assets resulting from transactions within the Group is also eliminated.
Shimadzu (Hong Kong) Limited and 11 other subsidiaries have a closing date falling on December 31; however, these companies carry out provisional settlements of accounts on March 31 and use these amounts in consolidated accounts.
During the year ended March 31, 2018, Shimadzu Vacuum Equipment (Shanghai) Co., Ltd. was newly included in the scope of consolidation due to its new establishment.
b. Unification of Accounting Policies Applied to Foreign Subsidiaries for the Consolidated Financial Statements - Under Accounting Standards Board of Japan (“ASBJ”) Practical Issues Task Force (“PITF”) No. 18, “Practical Solution on Unification of Accounting Policies Applied to Foreign Subsidiaries for the Consolidated Financial Statements,” the accounting policies and procedures applied to a parent company and its subsidiaries for similar transactions and events under similar circumstances should in principle be unified for the preparation of the consolidated financial statements. However, financial statements prepared by foreign subsidiaries in accordance
with either International Financial Reporting Standards or generally accepted accounting principles in the United States of America (Financial Accounting Standards Board Accounting Standards Codification) tentatively may be used for the consolidation process, except for the following items that should be adjusted in the consolidation process so that net income is accounted for in accordance with Japanese GAAP, unless they are not material: (a) amortization of goodwill; (b) scheduled amortization of actuarial gain or loss of pensions that has been recorded in equity through other comprehensive income; (c) expensing capitalized development costs of R&D; and (d) cancellation of the fair value model of accounting for property, plant and equipment and investment properties and incorporation of the cost model of accounting.
c. Cash Equivalents - Cash equivalents are short-term investments that are readily convertible into cash exposed to insignificant risk of changes in value.
Cash equivalents include time deposits that mature or become due within three months of the date of acquisition.
d. Marketable and Investment Securities - Marketable and investment securities are classified and accounted for, depending on management’s intent, as follows: (1) trading securities, which are held for the purpose of earning capital gains in the near term, are reported at fair value, and the related unrealized gains and losses are included in earnings; (2) held-to-maturity debt securities, for which there is a positive intent and ability to hold to maturity, are reported at amortized cost; and (3) available-for-sale securities, which are not classified as either of the aforementioned securities, are reported at fair value, with unrealized gains and losses, net of applicable taxes, reported in a separate component of equity.
Non-marketable available-for-sale securities are stated at cost, determined by the moving-average method. For other-than-temporary declines in fair value, investment securities are reduced to net realizable value by a charge to income.
e. Inventories - Inventories are principally stated at the lower of cost, using the periodic average method, or net selling value.
f. Property, Plant and Equipment - Property, plant and equipment are stated at cost. Depreciation of property, plant and equipment is computed by the straight-line method based on the estimated useful lives of the assets. The range of useful lives is principally from 3 to 75 years for buildings and structures; from 4 to 17 years for machinery, equipment, and vehicles; and from 2 to 15 years for tools, furniture, and fixtures. The useful lives for lease assets are the terms of the respective leases.
Accumulated depreciation at March 31, 2018 and 2017, was ¥89,663 million ($845,877 thousand) and ¥85,640 million, respectively.
g. Long-Lived Assets - The Group reviews its long-lived assets

10Shimadzu Integrated Report 2018
for impairment whenever events or changes in circumstances indicate that the carrying amount of an asset or asset group may not be recoverable. An impairment loss is recognized if the carrying amount of an asset or asset group exceeds the sum of the undiscounted future cash flows expected to result from the continued use and eventual disposition of the asset or asset group. The impairment loss would be measured as the amount by which the carrying amount of the asset exceeds its recoverable amount, which is the higher of the discounted cash flows from the continued use and eventual disposition of the asset or the net selling price at disposition.
h. Goodwill - Goodwill is amortized using the straight-line method over 20 years, while immaterial amounts of goodwill are charged to income as incurred. Goodwill is included in the other assets among the investments and other assets section of the consolidated balance sheet.
i. Software - Software costs for internal use are capitalized and amortized by the straight-line method over estimated useful lives of 5 years.
j. Retirement and Pension Plans - The Company and certain domestic subsidiaries have three types of retirement and pension plans covering most of their employees, a cash balance type defined benefit pension plan, a lump-sum severance payment plan, and a defined contribution plan or an advance payment system. Under the defined contribution plan or advance payment system, employees can adopt whichever they consider more preferable. Other domestic subsidiaries have defined benefit pension plans and lump-sum severance payment plans. Certain foreign subsidiaries have non-contributory funded pension plans.
Certain consolidated subsidiaries have adopted a simplified method of calculation with liability for retirement benefits and retirement benefits expense. Under this simplified method, the retirement benefit obligation for employees is stated at the amount which would be required to be paid if all eligible employees voluntarily retired at the balance sheet date.
The Company has an employee retirement benefit trust for payments of retirement benefits. The securities that were contributed to and held in this trust qualify as plan assets.
A subsidiary participates in a multi-employer plan for which the Company cannot reasonably calculate the amount of plan assets corresponding to the contributions made by the Company. Therefore, it is accounted for using the same method as a defined contribution plan.
The domestic subsidiaries also have a retirement plan for directors and Audit & Supervisory Board members. The Group provides a liability for the amount that would be required if all directors and Audit & Supervisory Board members retired at the end of each financial period. The accrued provisions are not funded and any amounts payable upon retirement are included in other long-term liabilities as of March 31, 2018 and 2017.
k. Asset Retirement Obligations - An asset retirement obligation is recorded for a legal obligation imposed either by law or contract that results from the acquisition, construction, development, and normal operation of a tangible fixed asset and is associated with the retirement of such tangible fixed asset. The asset retirement obligation is recognized as the sum of the discounted cash flows required for the future asset retirement and is recorded in the period in which the obligation is incurred if a reasonable estimate can be made. If a reasonable estimate of the asset retirement obligation cannot be made in the period the asset retirement obligation is incurred, the liability should be recognized when a reasonable estimate of the asset retirement obligation can be made. Upon initial recognition of a liability for an asset retirement obligation, an asset retirement cost is capitalized by increasing the carrying amount of the related fixed asset by the amount of the liability. The asset retirement cost is subsequently allocated to expense through depreciation over the remaining useful life of the asset. Over time, the liability is accreted to its present value each period. Any subsequent revisions to the timing or the amount of the original estimate of undiscounted cash flows are reflected as an adjustment to the carrying amount of the liability and the capitalized amount of the related asset retirement cost.
l. Research and Development Costs - Research and development costs are charged to income as incurred.
m. Allowance for Doubtful Receivables - The allowance for doubtful receivables is stated in amounts considered to be appropriate based on the Group’s past credit loss experience and an evaluation of potential losses in the receivables outstanding.
n. Leases - Finance lease transactions are capitalized to recognize lease assets and lease obligations in the balance sheet.
o. Transactions Related to the Board Incentive Plan Trust - Based on the resolution at the general meeting of shareholders held on June 28, 2017, the Company introduced the “Board Incentive Plan Trust” (the “Plan”) as a performance-based stock remuneration plan for directors and titled corporate officers of the Company (excluding corporate officers who are non-residents of Japan). Accounting treatments related to the trust are in accordance with “Practical Solution on Transactions of Delivering the Company’s Own Stock to Employees etc. through Trusts” (Practical Issue Task Force No. 30, March 26, 2015).
The Plan is a stock remuneration plan, wherein a trust established by the Company (Board Incentive Plan Trust) acquires Company shares using the cash contributed by the Company, and through this trust the Company shares and money equivalent to the amount obtained by converting the Company shares into cash, corresponding to the points granted based on the degree of achievement of business performance each fiscal year and according to the individual
11 Shimadzu Integrated Report 2018
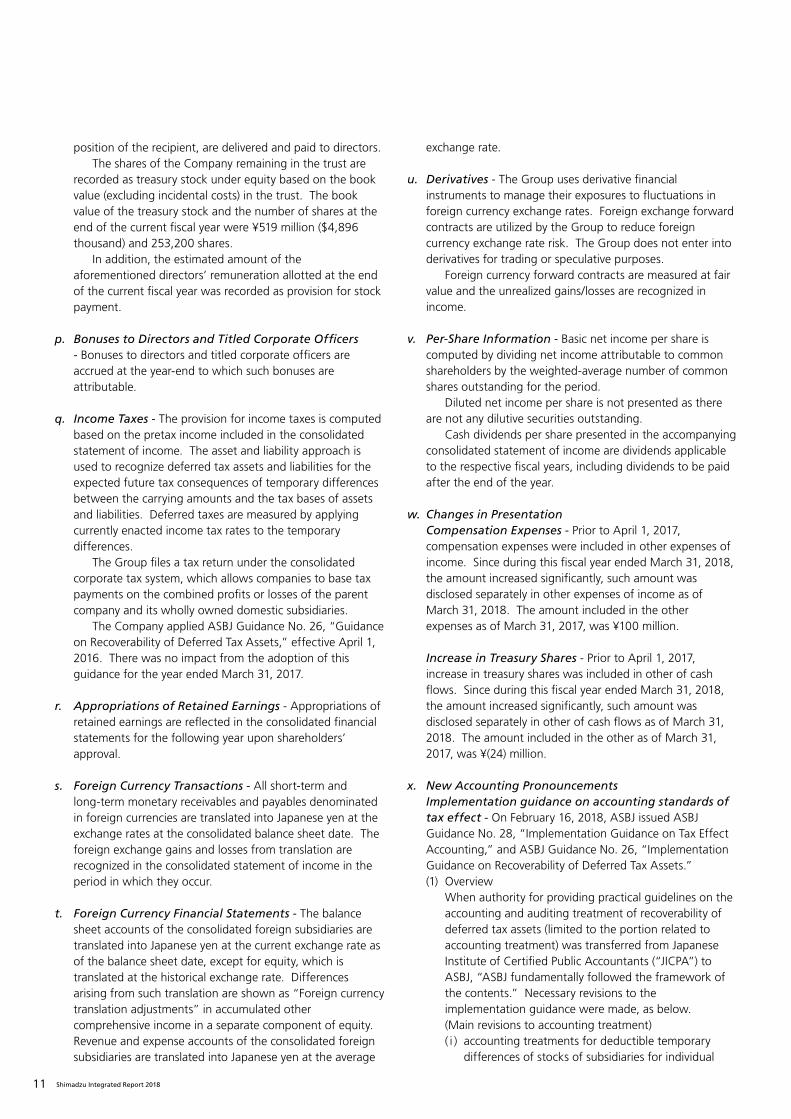
position of the recipient, are delivered and paid to directors.The shares of the Company remaining in the trust are
recorded as treasury stock under equity based on the book value (excluding incidental costs) in the trust. The book value of the treasury stock and the number of shares at the end of the current fiscal year were ¥519 million ($4,896 thousand) and 253,200 shares.
In addition, the estimated amount of the aforementioned directors’ remuneration allotted at the end of the current fiscal year was recorded as provision for stock payment.
p. Bonuses to Directors and Titled Corporate Officers - Bonuses to directors and titled corporate officers are accrued at the year-end to which such bonuses are attributable.
q. Income Taxes - The provision for income taxes is computed based on the pretax income included in the consolidated statement of income. The asset and liability approach is used to recognize deferred tax assets and liabilities for the expected future tax consequences of temporary differences between the carrying amounts and the tax bases of assets and liabilities. Deferred taxes are measured by applying currently enacted income tax rates to the temporary differences.
The Group files a tax return under the consolidated corporate tax system, which allows companies to base tax payments on the combined profits or losses of the parent company and its wholly owned domestic subsidiaries.
The Company applied ASBJ Guidance No. 26, “Guidance on Recoverability of Deferred Tax Assets,” effective April 1, 2016. There was no impact from the adoption of this guidance for the year ended March 31, 2017.
r. Appropriations of Retained Earnings - Appropriations of retained earnings are reflected in the consolidated financial statements for the following year upon shareholders’ approval.
s. Foreign Currency Transactions - All short-term and long-term monetary receivables and payables denominated in foreign currencies are translated into Japanese yen at the exchange rates at the consolidated balance sheet date. The foreign exchange gains and losses from translation are recognized in the consolidated statement of income in the period in which they occur.
t. Foreign Currency Financial Statements - The balance sheet accounts of the consolidated foreign subsidiaries are translated into Japanese yen at the current exchange rate as of the balance sheet date, except for equity, which is translated at the historical exchange rate. Differences arising from such translation are shown as “Foreign currency translation adjustments” in accumulated other comprehensive income in a separate component of equity. Revenue and expense accounts of the consolidated foreign subsidiaries are translated into Japanese yen at the average
exchange rate.
u. Derivatives - The Group uses derivative financial instruments to manage their exposures to fluctuations in foreign currency exchange rates. Foreign exchange forward contracts are utilized by the Group to reduce foreign currency exchange rate risk. The Group does not enter into derivatives for trading or speculative purposes.
Foreign currency forward contracts are measured at fair value and the unrealized gains/losses are recognized in income.
v. Per-Share Information - Basic net income per share is computed by dividing net income attributable to common shareholders by the weighted-average number of common shares outstanding for the period.
Diluted net income per share is not presented as there are not any dilutive securities outstanding.
Cash dividends per share presented in the accompanying consolidated statement of income are dividends applicable to the respective fiscal years, including dividends to be paid after the end of the year.
w. Changes in Presentation Compensation Expenses - Prior to April 1, 2017,
compensation expenses were included in other expenses of income. Since during this fiscal year ended March 31, 2018, the amount increased significantly, such amount was disclosed separately in other expenses of income as of March 31, 2018. The amount included in the other expenses as of March 31, 2017, was ¥100 million.
Increase in Treasury Shares - Prior to April 1, 2017, increase in treasury shares was included in other of cash flows. Since during this fiscal year ended March 31, 2018, the amount increased significantly, such amount was disclosed separately in other of cash flows as of March 31, 2018. The amount included in the other as of March 31, 2017, was ¥(24) million.
x. New Accounting Pronouncements Implementation guidance on accounting standards of
tax effect - On February 16, 2018, ASBJ issued ASBJ Guidance No. 28, “Implementation Guidance on Tax Effect Accounting,” and ASBJ Guidance No. 26, “Implementation Guidance on Recoverability of Deferred Tax Assets.”(1) Overview
When authority for providing practical guidelines on the accounting and auditing treatment of recoverability of deferred tax assets (limited to the portion related to accounting treatment) was transferred from Japanese Institute of Certified Public Accountants (“JICPA”) to ASBJ, “ASBJ fundamentally followed the framework of the contents.” Necessary revisions to the implementation guidance were made, as below.(Main revisions to accounting treatment)( i ) accounting treatments for deductible temporary
differences of stocks of subsidiaries for individual

12Shimadzu Integrated Report 2018
financial statements, and(ii) accounting treatments for recoverability of deferred
tax assets for entities in Category 1.(2) Date of adoption
The Company will adopt the revised implementation guidance from the beginning of the fiscal year ending March 31, 2019.
(3) Impact of the adoption of the implementation guidanceThe Company is in the process of measuring the effects of applying the revised implementation guidance in future applicable periods.
Implementation guidance on accounting standards of revenue recognition - On March 31, 2018, ASBJ issued ASBJ Statement No. 29, “Accounting Standard for Revenue Recognition,” and ASBJ Guidance No. 30, “Implementation Guidance on Accounting Standard for Revenue Recognition.”(1) Overview
The International Accounting Standards Board (“IASB”) and the Financial Accounting Standards Board (“FASB”) have jointly developed and issued a new comprehensive revenue standard, “Revenue from Contracts with Customers” (IFRS 15 issued by IASB and Topic 606 issued by FASB), in May 2014.As a basic policy, the ASBJ has developed comprehensive accounting standards for revenue recognition following the implementation of the requirement for entities to apply IFRS 15 for annual periods beginning on or after January 1, 2018, and Topic 606 for annual periods beginning after December 15, 2017. ASBJ has established a new accounting standard for revenue recognition based on the basic principles of IFRS 15, focusing on ensuring financial statement comparability. Also, the accounting convention for revenue recognition can take priority over the new accounting standard developed by ASBJ, as reasonable to ensure financial statement comparability.
(2) Date of adoptionThe Company will adopt the revised implementation guidance from the beginning of the fiscal year ending March 31, 2022.
(3) Impact of the adoption of the implementation guidanceThe Company is in the process of measuring the effects of applying the revised implementation guidance in future applicable periods.
3. U.S. DOLLAR AMOUNTSThe consolidated financial statements are stated in Japanese yen, the currency of the country in which the Company is incorporated and operates. The translations of Japanese yen amounts into U.S. dollar amounts are included solely for the convenience of readers outside Japan and have been made at the rate of ¥106 to $1, the approximate rate of exchange at March 31, 2018. Such translations should not be construed as representations that the Japanese yen amounts could be converted into U.S. dollars at that or any other rate.
4. INVESTMENT SECURITIESInvestment securities as of March 31, 2018 and 2017, consisted of the following:
The cost and aggregate fair values of investment securities at March 31, 2018 and 2017, were as follows:
5. INVENTORIESInventories at March 31, 2018 and 2017, consisted of the following:
6. LONG-LIVED ASSETSNo impairment loss was recognized for the year ended March 31, 2018.
The Group recognized impairment losses for the year ended March 31, 2017, as follows:March 31, 2017
Long-lived assets are generally grouped by business segments for management accounting. The Group has
Millions of YenThousands of U.S. Dollars
2018 2017 2018
Non-current:Marketable equity securities ... ¥15,405 ¥13,110 $145,330Non-marketable equity
securities ............................. 374 365 3,528Debt securities ........................ 20
Total ................................... ¥15,779 ¥13,495 $148,858
Millions of Yen
CostUnrealized
GainsUnrealized
LossesFair
ValueMarch 31, 2018Securities classified as:
Available-for-sale equity securities .................... ¥4,758 ¥10,820 ¥172 ¥15,406
March 31, 2017Securities classified as:
Available-for-sale equity securities .................... ¥4,751 ¥8,443 ¥84 ¥13,110
Thousands of U.S. Dollars
CostUnrealized
GainsUnrealized
LossesFair
ValueMarch 31, 2018Securities classified as:
Available-for-sale equity securities .................... $44,887 $102,076 $1,623 $145,340
Millions of YenThousands of U.S. Dollars
2018 2017 2018
Merchandise and finished goods ¥40,068 ¥40,588 $378,000Work in process ......................... 19,936 16,899 188,075Raw materials and supplies ........ 20,632 19,214 194,642Total .......................................... ¥80,636 ¥76,701 $760,717
Location Usage DescriptionMillionsof Yen
Brazil, São Paulo State Business assets Goodwill and other assets ¥451Shizuoka Prefecture Idle assets Land 201Ishikawa Prefecture Idle assets Land 129

13 Shimadzu Integrated Report 2018
recognized impairment losses on business assets, due to the fact that originally expected revenue and profitability in the business plan created when the Group acquired the business is no longer expected, and on idle assets due to a significant decline in their market value, by recording these impairment losses as other expenses.
The full amount of the unamortized balance of goodwill and other assets is impaired and recognized as an impairment loss.
The net realizable value for idle assets is based on their net selling price. The selling price is estimated by using their disposal price.
7. SHORT-TERM BORROWINGS AND LONG-TERM DEBTShort-term borrowings primarily consisted of bank overdrafts and financing agreements with banks, which are renewable on an annual basis and bear interest at annual rates ranging from 0.36% to 4.12% and from 0.33% to 4.30%, at March 31, 2018 and 2017, respectively.
Long-term debt at March 31, 2018 and 2017, consisted of the following:
Annual maturities of long-term debt outstanding at March 31, 2018 were as follows:
8. RETIREMENT AND PENSION PLANSThe Company and certain consolidated subsidiaries have severance payment plans for employees. In addition, consolidated domestic subsidiaries have severance payment plans for directors and Audit & Supervisory Board members. Under most circumstances, employees terminating their employment are entitled to retirement benefits determined based on the basic rate of pay at the time of termination, years of service, and certain other factors. Such retirement benefits are made in the form of a lump-sum severance payment from the Company or from certain consolidated domestic subsidiaries
and annuity payments from a trustee. Employees are entitled to larger payments if the termination is involuntary, by retirement at the mandatory retirement age or certain other conditions.
The liability for retirement benefits at March 31, 2018 and 2017, for directors and Audit & Supervisory Board members is ¥169 million ($1,594 thousand) and ¥185 million, respectively. The retirement benefits for directors and Audit & Supervisory Board members are paid subject to the approval of the shareholders of each subsidiary.
(1) The changes in defined benefit obligation for the years ended March 31, 2018 and 2017, were as follows:
(2) The changes in plan assets for the years ended March 31, 2018 and 2017, were as follows:
(3) The changes in net defined benefit liability for the plans to which the simplified method was applied for the years ended March 31, 2018 and 2017, were as follows:
(4) A reconciliation between the liability recorded in the consolidated balance sheet and the balances of defined benefit obligation and plan assets as of March 31, 2018 and 2017, were as follows:
Millions of YenThousands of U.S. Dollars
2018 2017 2018
0.30% unsecured bonds, due June 2019 ........................ ¥15,000 ¥15,000 $141,509
Borrowings, principally from banks, due serially to 2021 with interest rates ranging from 0.35% to 3.60% (from 0.49% to 3.60%, due serially to 2021 at March 31, 2017) .... 1,202 1,141 11,340
Obligations under finance leases .. 3,047 2,767 28,745Total ................................... 19,249 18,908 181,594
Less current portion ................... (1,761) (1,501) (16,613)Long-term debt, less current
portion ................................... ¥17,488 ¥17,407 $164,981
Year Ending March 31 Millions of YenThousands of U.S. Dollars
2019 ................................................ ¥ 1,761 $ 16,6132020 ................................................ 16,113 152,0092021 ................................................ 828 7,8112022 ................................................ 344 3,2462023 ................................................ 175 1,6512024 and thereafter ......................... 28 264Total ................................................ ¥19,249 $181,594
Millions of YenThousands of U.S. Dollars
2018 2017 2018
Balance at beginning of year ...... ¥52,486 ¥51,640 $495,151Current service cost ................ 2,183 2,101 20,594Interest cost ........................... 655 630 6,179Actuarial (gains) losses ............ (351) 1,419 (3,311)Benefits paid .......................... (2,479) (2,438) (23,387)Past service cost ..................... (278) (2,623)Others .................................... 1,329 (866) 12,539
Balance at end of year ............... ¥53,545 ¥52,486 $505,142
Millions of YenThousands of U.S. Dollars
2018 2017 2018
Balance at beginning of year ...... ¥48,177 ¥40,395 $454,500Expected return on plan
assets .................................. 826 930 7,792Actuarial gains ....................... 2,868 4,732 27,057Contributions from the
employer ............................ 4,260 4,347 40,189Benefits paid .......................... (1,703) (1,691) (16,066)Others .................................... 247 (536) 2,330
Balance at end of year ............... ¥54,675 ¥48,177 $515,802
Millions of YenThousands of U.S. Dollars
2018 2017 2018
Balance at beginning of year ...... ¥2,694 ¥2,439 $25,415Net periodic benefit costs ....... 577 625 5,443Benefits paid .......................... (240) (167) (2,264)Contributions from the
employer ............................ (179) (203) (1,688)Balance at end of year ............... ¥2,852 ¥2,694 $26,906
14Shimadzu Integrated Report 2018
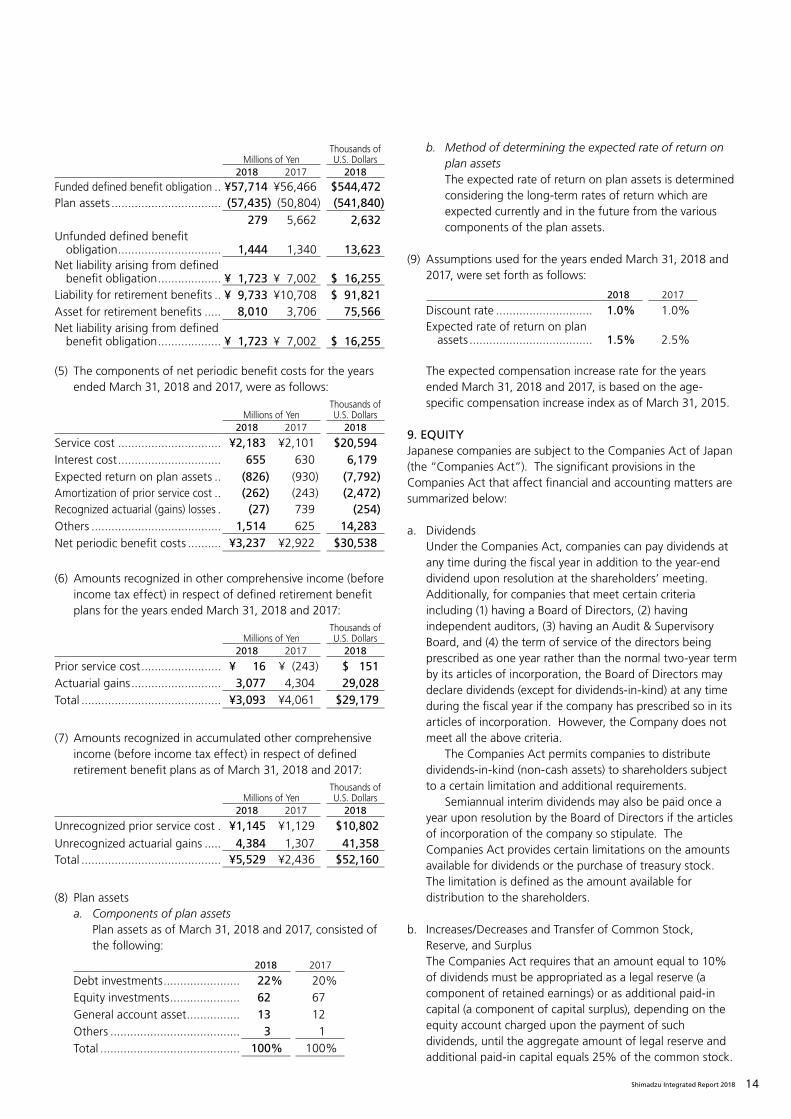
(5) The components of net periodic benefit costs for the years ended March 31, 2018 and 2017, were as follows:
(6) Amounts recognized in other comprehensive income (before income tax effect) in respect of defined retirement benefit plans for the years ended March 31, 2018 and 2017:
(7) Amounts recognized in accumulated other comprehensive income (before income tax effect) in respect of defined retirement benefit plans as of March 31, 2018 and 2017:
(8) Plan assetsa. Components of plan assets
Plan assets as of March 31, 2018 and 2017, consisted of the following:
b. Method of determining the expected rate of return on plan assetsThe expected rate of return on plan assets is determined considering the long-term rates of return which are expected currently and in the future from the various components of the plan assets.
(9) Assumptions used for the years ended March 31, 2018 and 2017, were set forth as follows:
The expected compensation increase rate for the years ended March 31, 2018 and 2017, is based on the age-specific compensation increase index as of March 31, 2015.
9. EQUITYJapanese companies are subject to the Companies Act of Japan (the “Companies Act”). The significant provisions in the Companies Act that affect financial and accounting matters are summarized below:
a. DividendsUnder the Companies Act, companies can pay dividends at any time during the fiscal year in addition to the year-end dividend upon resolution at the shareholders’ meeting. Additionally, for companies that meet certain criteria including (1) having a Board of Directors, (2) having independent auditors, (3) having an Audit & Supervisory Board, and (4) the term of service of the directors being prescribed as one year rather than the normal two-year term by its articles of incorporation, the Board of Directors may declare dividends (except for dividends-in-kind) at any time during the fiscal year if the company has prescribed so in its articles of incorporation. However, the Company does not meet all the above criteria.
The Companies Act permits companies to distribute dividends-in-kind (non-cash assets) to shareholders subject to a certain limitation and additional requirements.
Semiannual interim dividends may also be paid once a year upon resolution by the Board of Directors if the articles of incorporation of the company so stipulate. The Companies Act provides certain limitations on the amounts available for dividends or the purchase of treasury stock. The limitation is defined as the amount available for distribution to the shareholders.
b. Increases/Decreases and Transfer of Common Stock, Reserve, and SurplusThe Companies Act requires that an amount equal to 10% of dividends must be appropriated as a legal reserve (a component of retained earnings) or as additional paid-in capital (a component of capital surplus), depending on the equity account charged upon the payment of such dividends, until the aggregate amount of legal reserve and additional paid-in capital equals 25% of the common stock.
Millions of YenThousands of U.S. Dollars
2018 2017 2018
Funded defined benefit obligation .. ¥57,714 ¥56,466 $544,472Plan assets ................................. (57,435) (50,804) (541,840)
279 5,662 2,632Unfunded defined benefit
obligation ............................... 1,444 1,340 13,623Net liability arising from defined
benefit obligation ................... ¥ 1,723 ¥ 7,002 $ 16,255Liability for retirement benefits .. ¥ 9,733 ¥10,708 $ 91,821Asset for retirement benefits ..... 8,010 3,706 75,566Net liability arising from defined
benefit obligation ................... ¥ 1,723 ¥ 7,002 $ 16,255
Millions of YenThousands of U.S. Dollars
2018 2017 2018
Service cost ............................... ¥2,183 ¥2,101 $20,594Interest cost ............................... 655 630 6,179Expected return on plan assets .. (826) (930) (7,792)Amortization of prior service cost .. (262) (243) (2,472)Recognized actuarial (gains) losses . (27) 739 (254)Others ....................................... 1,514 625 14,283Net periodic benefit costs .......... ¥3,237 ¥2,922 $30,538
Millions of YenThousands of U.S. Dollars
2018 2017 2018
Prior service cost ........................ ¥ 16 ¥ (243) $ 151Actuarial gains ........................... 3,077 4,304 29,028Total .......................................... ¥3,093 ¥4,061 $29,179
Millions of YenThousands of U.S. Dollars
2018 2017 2018
Unrecognized prior service cost . ¥1,145 ¥1,129 $10,802Unrecognized actuarial gains ..... 4,384 1,307 41,358Total .......................................... ¥5,529 ¥2,436 $52,160
2018 2017
Debt investments ....................... 22% 20%Equity investments ..................... 62 67General account asset ................ 13 12Others ....................................... 3 1Total .......................................... 100% 100%
2018 2017
Discount rate ............................. 1.0% 1.0%Expected rate of return on plan
assets ..................................... 1.5% 2.5%

15 Shimadzu Integrated Report 2018
Under the Companies Act, the total amount of additional paid-in capital and legal reserve may be reversed without limitation. The Companies Act also provides that common stock, legal reserve, additional paid-in capital, other capital surplus, and retained earnings can be transferred among the accounts within equity under certain conditions upon resolution of the shareholders.
c. Treasury Stock and Treasury Stock Acquisition RightsThe Companies Act also provides for companies to purchase treasury stock and dispose of such treasury stock by resolution of the Board of Directors. The amount of treasury stock purchased cannot exceed the amount available for distribution to the shareholders, which is determined by a specific formula. Under the Companies Act, stock acquisition rights are presented as a separate component of equity. The Companies Act also provides that companies can purchase both treasury stock acquisition rights and treasury stock. Such treasury stock acquisition rights are presented as a separate component of equity or deducted directly from stock acquisition rights.
10. RESEARCH AND DEVELOPMENT COSTSResearch and development costs charged to income were ¥9,676 million ($91,283 thousand) and ¥9,297 million for the years ended March 31, 2018 and 2017, respectively.
11. INCOME TAXESThe Company and its domestic subsidiaries are subject to Japanese national and local income taxes which, in the aggregate, resulted in a normal effective statutory tax rate of approximately 31% for the years ended March 31, 2018 and 2017.
The tax effects of significant temporary differences and tax loss carryforwards which resulted in deferred tax assets and liabilities at March 31, 2018 and 2017, were as follows:
The above net deferred tax assets and liabilities represent the aggregate amounts of each individual taxpayer’s net deferred tax assets or liabilities.
A reconciliation between the normal effective statutory tax rates and the actual effective tax rates reflected in the accompanying consolidated statement of income for the year ended March 31, 2018, with the corresponding figures for the year ended March 31, 2017, is as follows:
12. LEASESLESSEEThe Group leases certain office space, computer equipment and other assets.
Total rental expenses for the years ended March 31, 2018 and 2017, were ¥7,080 million ($66,792 thousand) and ¥6,489 million, respectively.
Future minimum payments under noncancelable operating leases as of March 31, 2018 and 2017, were as follows:
Millions of YenThousands of U.S. Dollars
2018 2017 2018
Current:Deferred tax assets:
Accrued bonuses ................ ¥2,594 ¥2,471 $24,472Unrealized profit eliminated
from inventories .............. 2,819 2,794 26,594Loss on devaluation of
inventories ....................... 1,104 1,189 10,415Enterprise taxes ................... 442 336 4,170Allowance for doubtful
receivables ....................... 274 242 2,585Other .................................. 2,588 2,679 24,415
Total 9,821 9,711 92,651Less valuation allowance ..... (1) (12) (9)Total deferred tax assets ¥9,820 ¥9,699 $92,642
Deferred tax liability ............... ¥ 159 ¥ 97 $ 1,500Net deferred tax assets ........... ¥9,662 ¥9,603 $91,151Net deferred tax liabilities
(included in other current liabilities) ............................. ¥ 1 ¥ 1 $ 9
Millions of YenThousands of U.S. Dollars
2018 2017 2018
Noncurrent:Deferred tax assets:
Liability for retirement benefits ........................... ¥ 6,326 ¥ 8,209 $59,679
Depreciation ....................... 2,509 2,245 23,670Tax loss carryforwards ......... 23 50 217Loss on impairment of
long-lived assets .............. 301 301 2,840Other .................................. 1,077 812 10,160
Total............................. 10,236 11,617 96,566Less valuation allowance ..... (783) (767) (7,387)Total deferred tax assets ..... ¥ 9,453 ¥10,850 $89,179
Deferred tax liabilities:Gain on securities
contributed to employee retirement benefit trust ... ¥ 4,014 ¥ 4,014 $37,868
Unrealized gain on available-for-sale securities ......................... 3,207 2,508 30,255
Other .................................. 398 494 3,754Total deferred tax liabilities.. ¥ 7,619 ¥ 7,016 $71,877
Net deferred tax assets ........... ¥ 3,089 ¥ 4,161 $29,142Net deferred tax liabilities
(included in other long-term liabilities) ............................. ¥ 1,255 ¥ 327 $11,840
2018 2017
Normal effective statutory tax rate ............... 30.8% 30.8%Expenses not permanently deductible for
income tax purposes ................................ 0.8 0.6Valuation allowance ..................................... 0.8 0.1Per capita inhabitant tax .............................. 0.3 0.3Difference in subsidiaries' tax rates .............. (1.4) (2.0)Tax credit for research and development
costs ........................................................ (4.0) (3.9)Other, net .................................................... 1.1 0.6Actual effective tax rate ............................... 28.4% 26.5%

16Shimadzu Integrated Report 2018
LESSORFuture lease income under noncancelable operating leases as of March 31, 2018 and 2017, was as follows:
13. FINANCIAL INSTRUMENTS AND RELATED DISCLOSURES(1) Group Policy for Financial Instruments
The Group uses financial instruments such as loans from banks, bonds, and commercial paper. Cash surpluses, if any, are invested in low-risk financial assets such as deposits. Derivatives are used, not for speculative purposes, but to manage exposure to financial risks as described in (2) below.
(2) Nature and Extent of Risks Arising from Financial Instruments and Risk Management for Financial InstrumentsReceivables, such as trade notes and trade accounts, are Receivables, such as trade notes and trade accounts, are exposed to customer credit risk. Such customer credit risk is managed by administering the term and balance according to the Group’s policies and by monitoring indications of deterioration of the financial condition of customers. Although receivables in foreign currencies are exposed to the market risk of fluctuation in foreign currency exchange rates, the position is hedged by using forward foreign currency contracts. Investment securities, mainly equity instruments of customers and suppliers of the Group, are exposed to the risk of market price fluctuations. The risk is managed by monitoring market values and financial positions of issuers on a regular basis.
Payment terms of payables, such as trade notes and trade accounts, are generally less than one year. Although payables in foreign currencies are exposed to the market risk of fluctuation in foreign currency exchange rates, those risks are netted against the balance of receivables denominated in the same foreign currencies as noted above.
Short-term loans and commercial paper are mainly used for operating activities, and long-term loans and bonds are mainly used for investment in property, plant and equipment. A part of such loans is exposed to market risks of interest rate fluctuation. Although payables and loans are exposed to liquidity risk, such risk is managed by making monthly cash flow plans.
The Group enters into foreign currency forward contracts to hedge exchange rate risk associated with certain assets and liabilities denominated in foreign currencies. All derivative transactions are entered into to
hedge foreign currency exposures incorporated within the Group’s business. Accordingly, market risk in these derivatives is generally offset by opposite movements in the value of hedged assets or liabilities, except for credit-related market risk.
Because the counterparties to these derivatives are limited to major international financial institutions, the Group does not anticipate any losses arising from credit risk.
Derivative transactions entered into by the Group have been made in accordance with internal policies under the supervision of the director in charge of the finance department.
The contract or notional amounts of derivatives which are shown in the table in Note 14 do not represent the amounts exchanged by the parties and do not measure the Company’s exposure to credit or market risk. Please see Note 14 for more details about derivatives.
(3) Fair Values of Financial InstrumentsCarrying amount, fair value, and unrealized gains (losses) of financial instruments are as follows. Financial instruments whose fair value cannot be reliably determined are not included in the following table.
(a) Fair value of financial instruments
Millions of YenThousands of U.S. Dollars
2018 2017 2018
Due within one year .................. ¥ 857 ¥ 843 $ 8,085Due after one year ..................... 1,222 1,472 11,528Total .......................................... ¥2,079 ¥2,315 $19,613
Millions of YenThousands of U.S. Dollars
2018 2017 2018
Due within one year .................. ¥100 ¥101 $ 943Due after one year ..................... 202 303 1,906Total .......................................... ¥302 ¥404 $2,849
Millions of Yen
March 31, 2018CarryingAmount Fair Value
Unrealized Gains
(Losses)
Cash and cash equivalents .. ¥ 75,090 ¥ 75,090Time deposits ..................... 1,837 1,837Trade receivables ................ 119,118 119,036 ¥(82)Investment securities........... 15,405 15,405Total ................................... ¥211,450 ¥211,368 ¥(82)Short-term borrowings ....... ¥ 2,435 ¥ 2,435Trade notes and accounts
payable ........................... 66,589 66,589Long-term debt: Bonds
payable ........................... 15,000 15,030 ¥(30)Total ................................... ¥ 84,024 ¥ 84,054 ¥(30)Derivatives .......................... ¥ 30 ¥ 30
Millions of Yen
March 31, 2017CarryingAmount Fair Value
Unrealized Gains
(Losses)
Cash and cash equivalents .. ¥ 52,763 ¥ 52,763Time deposits ..................... 3,935 3,935Trade receivables ................ 112,878 112,825 ¥(53)Investment securities........... 13,110 13,110Total ................................... ¥182,686 ¥182,633 ¥(53)Short-term borrowings ....... ¥ 2,473 ¥ 2,473Trade notes and accounts
payable ........................... 57,263 57,263Long-term debt: Bonds
payable ........................... 15,000 15,071 ¥(71)Total ................................... ¥ 74,736 ¥ 74,807 ¥(71)Derivatives .......................... ¥ 51 ¥ 51

17 Shimadzu Integrated Report 2018
Cash and Cash Equivalents and Time DepositsThe carrying values of cash and cash equivalents and time deposits approximate fair value because of their short maturities.
Trade ReceivablesThe fair values of trade receivables are measured at the amount to be received at maturity discounted at the Group-assumed corporate discount rate.
Investment SecuritiesThe fair values of investment securities are measured at the quoted market price of the stock exchange for equity instruments. Fair value information for investment securities by classification is included in Note 4.
Trade Notes and Accounts Payable, Short-Term BorrowingsThe carrying values of trade notes and accounts payable, short-term borrowings, and commercial paper approximate fair value because of their short maturities.
Long-Term Debt: Bonds PayableThe fair values of bonds payable are measured at the market price.
DerivativesFair value information for derivatives is included in Note 14.
(b) Carrying amount of financial instruments whose fair value cannot be reliably determined
It is extremely difficult to calculate their fair values because
there are no market prices. Therefore, these items are not included in “(a) Investment securities.”
(4) Maturity Analysis for Financial Assets and Securities with Contractual Maturities
Please see Note 7 for annual maturities of long-term debt.
14. DERIVATIVESThe Group enters into foreign currency forward contracts to hedge exchange rate risk associated with certain assets and liabilities denominated in foreign currencies. All derivative transactions are entered into to hedge foreign currency exposures incorporated within the Group’s business. Accordingly, market risk in these derivatives is generally offset by opposite movements in the value of hedged assets or liabilities, except for credit-related market risk.
Because the counterparties to these derivatives are limited to major international financial institutions, the Group does not anticipate any losses arising from credit risk.
Derivative transactions entered into by the Group have been made in accordance with internal policies under the supervision of the director in charge of the finance department.
The contract or notional amounts of derivatives which are shown in the following table do not represent the amounts exchanged by the parties and do not measure the Company’s exposure to credit or market risk.
The Company has the following derivative contracts outstanding as of March 31, 2018 and 2017:
Thousands of U.S. Dollars
March 31, 2018CarryingAmount Fair Value
Unrealized Gains
(Losses)
Cash and cash equivalents . $ 708,396 $ 708,396Time deposits .................. 17,330 17,330Trade receivables ............. 1,123,755 1,122,982 $(773)Investment securities........ 145,330 145,330Total ................................ $1,994,811 $1,994,038 $(773)Short-term borrowings .... $ 22,972 $ 22,972Trade notes and accounts
payable ........................ 628,198 628,198Long-term debt: Bonds
payable ........................ 141,509 141,792 $(283)Total ................................ $ 792,679 $ 792,962 $(283)Derivatives ....................... $ 283 $ 283
Millions of YenThousands of U.S. Dollars
2018 2017 2018
Investments in equity instruments that do not have a quoted market price in an active market ......................... ¥ 374 ¥365 $3,528
Stocks of subsidiaries and associated companies ............. 685 284 6,463
Bonds that do not have a quoted market price in an active market ......................... 20
Total .......................................... ¥1,059 ¥669 $9,991
Millions of Yen
March 31, 2018Due in
1 Year or LessDue after
1 Year
Cash and cash equivalents ............. ¥ 75,090Time deposits ................................ 1,837Trade receivables ........................... 118,967 ¥151Total .............................................. ¥195,894 ¥151
Thousands of U.S. Dollars
March 31, 2018Due in
1 Year or LessDue after
1 Year
Cash and cash equivalents ............. $ 708,396Time deposits ................................ 17,330Trade receivables ........................... 1,122,330 $1,425Total .............................................. $1,848,056 $1,425
2018In Thousands Millions of YenContract or
Notional Amount
Fair Value
UnrealizedGains
(Losses)
Forward exchange contracts:Selling USD..........................USD 66,000 ¥ 8 ¥ 8Selling Euro .........................EUR 15,000 23 23Buying USD .........................USD 2,050 (1) (1)
2017In Thousands Millions of YenContract or
Notional Amount
Fair Value
UnrealizedGains
(Losses)
Forward exchange contracts:Selling USD..........................USD 78,000 ¥42 ¥42Selling Euro .........................EUR 15,000 10 10Buying USD .........................USD 1,072 (1) (1)

18Shimadzu Integrated Report 2018
The fair value is estimated based on quotes from financial institutions.
15. OTHER COMPREHENSIVE INCOMEThe components of other comprehensive income for the years ended March 31, 2018 and 2017, were as follows:
16. NET INCOME PER SHAREBasic net income per share (“EPS”) for the years ended March 31, 2018 and 2017, was as follows:
Diluted EPS for the years ended March 31, 2018 and 2017, is not disclosed because no potentially dilutive securities are outstanding.
17. SUBSEQUENT EVENTSAppropriation of Retained EarningsThe following appropriation of retained earnings at March 31, 2018, was approved at the Company’s shareholders’ meeting held on June 27, 2018:
18. SEGMENT INFORMATIONUnder ASBJ Statement No. 17, “Accounting Standard for Disclosures about Segments of an Enterprise and Related Information” and ASBJ Guidance No. 20, “Guidance on Accounting Standard for Disclosures about Segments of an Enterprise and Related Information,” an entity is required to report financial and descriptive information about its reportable segments. Reportable segments are operating segments or aggregations of operating segments that meet specified criteria. Operating segments are components of an entity about which separate financial information is available and for which such information is evaluated regularly by the chief operating decision-maker in deciding how to allocate resources and in assessing performance. Generally, segment information is required to be reported on the same basis as is used internally for evaluating operating segment performance and deciding how to allocate resources to operating segments.
(1) Description of Reportable SegmentsThe Group’s reportable segments are those for which separate financial information is available and regular evaluation by the Company’s management is being performed in order to decide how resources are allocated among the Group. As such, the Group’s reportable segments consist of Analytical and Measuring Instruments, Medical Systems and Equipment, Aircraft Equipment, and Industrial Machinery.
(2) Methods of Measurement for the Amounts of Sales, Profit (Loss), Assets, and Other Items for Each Reportable SegmentThe accounting policies of each reportable segment are consistent with those disclosed in Note 2, “Summary of Significant Accounting Policies.”
2018In Thousands Thousands of U.S. DollarsContract or
Notional Amount
Fair Value
UnrealizedGains
(Losses)
Forward exchange contracts:Selling USD..........................USD 66,000 $ 75 $ 75Selling Euro .........................EUR 15,000 217 217Buying USD .........................USD 2,050 (9) (9)
Millions of YenThousands of U.S. Dollars
2018 2017 2018
Unrealized gain on available-for-sale securities:Gains arising during the year .. ¥2,289 ¥1,178 $21,594Amount before income tax
effect .................................. 2,289 1,178 21,594Income tax effect ................... (698) (365) (6,584)
Total ................................ ¥1,591 ¥813 $15,010Foreign currency translation
adjustments:Adjustments arising during
the year .............................. ¥ (566) ¥(2,450) $(5,340)Total ................................ ¥ (566) ¥(2,450) $(5,340)
Defined retirement benefit plans:Adjustments arising during
the year .............................. ¥3,347 ¥3,565 $31,575Reclassification adjustments
to profit or loss ................... (254) 496 (2,396)Amount before income tax
effect .................................. 3,093 4,061 29,179Income tax effect ................... (874) (1,122) (8,245)
Total ................................ ¥2,219 ¥2,939 $20,934Total other comprehensive
income ................................... ¥3,244 ¥1,302 $30,604
Millions of Yen
Thousands of Shares Yen
U.S.Dollars
Net Income
Weighted-Average Shares EPS
Year Ended March 31, 2018:Basic EPS
Net income available to common shareholders ............ ¥29,838 294,668 ¥101.26 $0.96
Year Ended March 31, 2017:Basic EPS
Net income available to common shareholders ............ ¥26,473 294,832 ¥89.79
Millions of Yen
Thousands of U.S. Dollars
Year-end cash dividends, ¥13.00 ($0.12) per share ............................................... ¥3,832 $36,151
19 Shimadzu Integrated Report 2018
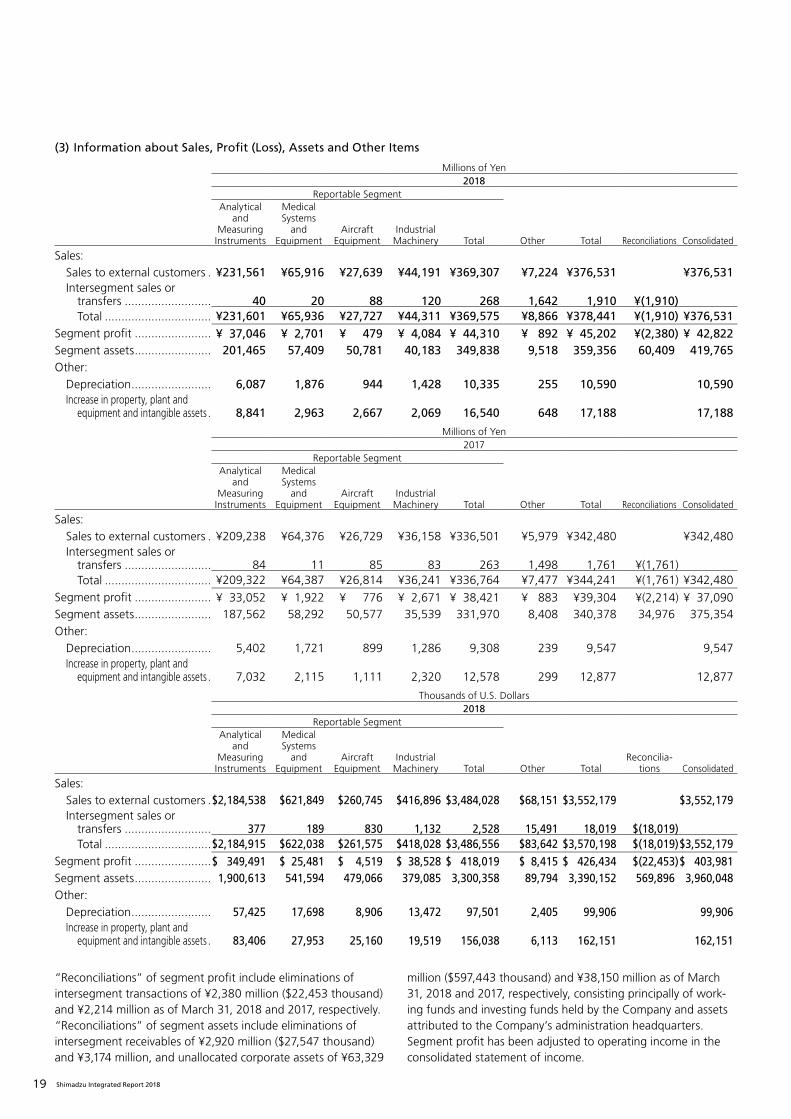
(3) Information about Sales, Profit (Loss), Assets and Other Items
Millions of Yen2018
Reportable SegmentAnalytical
andMeasuringInstruments
Medical Systems
andEquipment
AircraftEquipment
IndustrialMachinery Total Other Total Reconciliations Consolidated
Sales:Sales to external customers . ¥231,561 ¥65,916 ¥27,639 ¥44,191 ¥369,307 ¥7,224 ¥376,531 ¥376,531Intersegment sales or
transfers .......................... 40 20 88 120 268 1,642 1,910 ¥(1,910)Total ................................ ¥231,601 ¥65,936 ¥27,727 ¥44,311 ¥369,575 ¥8,866 ¥378,441 ¥(1,910) ¥376,531
Segment profit ....................... ¥ 37,046 ¥ 2,701 ¥ 479 ¥ 4,084 ¥ 44,310 ¥ 892 ¥ 45,202 ¥(2,380) ¥ 42,822Segment assets ....................... 201,465 57,409 50,781 40,183 349,838 9,518 359,356 60,409 419,765Other:
Depreciation ........................ 6,087 1,876 944 1,428 10,335 255 10,590 10,590Increase in property, plant and
equipment and intangible assets . 8,841 2,963 2,667 2,069 16,540 648 17,188 17,188
Millions of Yen2017
Reportable SegmentAnalytical
andMeasuringInstruments
Medical Systems
andEquipment
AircraftEquipment
IndustrialMachinery Total Other Total Reconciliations Consolidated
Sales:Sales to external customers . ¥209,238 ¥64,376 ¥26,729 ¥36,158 ¥336,501 ¥5,979 ¥342,480 ¥342,480Intersegment sales or
transfers .......................... 84 11 85 83 263 1,498 1,761 ¥(1,761)Total ................................ ¥209,322 ¥64,387 ¥26,814 ¥36,241 ¥336,764 ¥7,477 ¥344,241 ¥(1,761) ¥342,480
Segment profit ....................... ¥ 33,052 ¥ 1,922 ¥ 776 ¥ 2,671 ¥ 38,421 ¥ 883 ¥39,304 ¥(2,214) ¥ 37,090Segment assets ....................... 187,562 58,292 50,577 35,539 331,970 8,408 340,378 34,976 375,354Other:
Depreciation ........................ 5,402 1,721 899 1,286 9,308 239 9,547 9,547Increase in property, plant and
equipment and intangible assets . 7,032 2,115 1,111 2,320 12,578 299 12,877 12,877
Thousands of U.S. Dollars2018
Reportable SegmentAnalytical
andMeasuringInstruments
Medical Systems
andEquipment
AircraftEquipment
IndustrialMachinery Total Other Total
Reconcilia-tions Consolidated
Sales:Sales to external customers .$2,184,538 $621,849 $260,745 $416,896 $3,484,028 $68,151 $3,552,179 $3,552,179 Intersegment sales or
transfers .......................... 377 189 830 1,132 2,528 15,491 18,019 $(18,019)Total ................................$2,184,915 $622,038 $261,575 $418,028 $3,486,556 $83,642 $3,570,198 $(18,019)$3,552,179
Segment profit .......................$ 349,491 $ 25,481 $ 4,519 $ 38,528 $ 418,019 $ 8,415 $ 426,434 $(22,453)$ 403,981 Segment assets ....................... 1,900,613 541,594 479,066 379,085 3,300,358 89,794 3,390,152 569,896 3,960,048Other:
Depreciation ........................ 57,425 17,698 8,906 13,472 97,501 2,405 99,906 99,906Increase in property, plant and
equipment and intangible assets . 83,406 27,953 25,160 19,519 156,038 6,113 162,151 162,151
“Reconciliations” of segment profit include eliminations of intersegment transactions of ¥2,380 million ($22,453 thousand) and ¥2,214 million as of March 31, 2018 and 2017, respectively. “Reconciliations” of segment assets include eliminations of intersegment receivables of ¥2,920 million ($27,547 thousand) and ¥3,174 million, and unallocated corporate assets of ¥63,329
million ($597,443 thousand) and ¥38,150 million as of March 31, 2018 and 2017, respectively, consisting principally of work-ing funds and investing funds held by the Company and assets attributed to the Company’s administration headquarters.Segment profit has been adjusted to operating income in the consolidated statement of income.

20Shimadzu Integrated Report 2018
(4) The Geographical Segments of the Groupa. Sales
b. Property, plant and equipment
(5) Amortization and the Balance of Goodwill of the Group
(6) Impairment Losses on Assets of the GroupNo impairment loss was recognized for the year ended March 31, 2018.
* * * * * *
Millions of Yen
JapanUnited States of America Europe China Other Asia Other Total
2018 .......................................... ¥187,667 ¥41,833 ¥27,605 ¥68,440 ¥34,133 ¥16,853 ¥376,531
Millions of Yen
JapanUnited States of America Europe China Other Asia Other Total
2017 .......................................... ¥175,906 ¥37,033 ¥24,895 ¥56,149 ¥32,951 ¥15,546 ¥342,480
Thousands of U.S. Dollars
JapanUnited States of America Europe China Other Asia Other Total
2018 .......................................... $1,770,443 $394,651 $260,425 $645,660 $322,009 $158,991 $3,552,179
Millions of Yen Thousands of U.S. Dollars
2018 2017 2018
JapanForeign
Countries Total JapanForeign
Countries Total JapanForeign
Countries Total
¥71,421 ¥12,715 ¥84,136 ¥66,945 ¥11,807 ¥78,752 $673,786 $119,954 $793,740
Millions of YenAnalytical
andMeasuringInstruments
MedicalSystems
andEquipment
Aircraft Equipment
IndustrialMachinery Other
Elimination/Corporate Total
Amortization of goodwill ........... ¥34 ¥ 14 ¥ 48Goodwill at March 31, 2018 ...... ¥216 ¥216
Millions of YenAnalytical
andMeasuringInstruments
MedicalSystems
andEquipment
Aircraft Equipment
IndustrialMachinery Other
Elimination/Corporate Total
Amortization of goodwill ........... ¥24 ¥ 13 ¥ 37Goodwill at March 31, 2017....... ¥34 ¥230 ¥264
Thousands of U.S. DollarsAnalytical
andMeasuringInstruments
MedicalSystems
andEquipment
Aircraft Equipment
IndustrialMachinery Other
Elimination/Corporate Total
Amortization of goodwill ........... $321 $ 132 $ 453Goodwill at March 31, 2018 ...... $2,038 $2,038
Millions of Yen
2017Analytical
andMeasuringInstruments
MedicalSystems
andEquipment
Aircraft Equipment
IndustrialMachinery Other
Elimination/Corporate Total
Impairment losses on assets ....... ¥604 ¥83 ¥58 ¥36 ¥781
21 Shimadzu Integrated Report 2018
To the Board of Directors and Shareholders of Shimadzu Corporation:
We have audited the accompanying consolidated balance sheet of Shimadzu Corporation and its consolidated subsidiaries as of March 31, 2018, and the related consolidated statements of income, comprehensive income, changes in equity, and cash flows for the year then ended, and a summary of significant accounting policies and other explanatory information, all expressed in Japanese yen.
Management’s Responsibility for the Consolidated Financial Statements
Management is responsible for the preparation and fair presentation of these consolidated financial statements in accordance with accounting principles generally accepted in Japan, and for such internal control as management determines is necessary to enable the preparation of consolidated financial statements that are free from material misstatement, whether due to fraud or error.
Auditor’s Responsibility
Our responsibility is to express an opinion on these consolidated financial statements based on our audit. We conducted our audit in accordance with auditing standards generally accepted in Japan. Those standards require that we plan and perform the audit to obtain reasonable assurance about whether the consolidated financial statements are free from material misstatement.
An audit involves performing procedures to obtain audit evidence about the amounts and disclosures in the consolidated financial statements. The procedures selected depend on the auditor’s judgment, including the assessment of the risks of material misstatement of the consolidated financial statements, whether due to fraud or error. In making those risk assessments, the auditor considers internal control relevant to the entity’s preparation and fair presentation of the consolidated financial statements in order to design audit procedures that are appropriate in the circumstances, but not for the purpose of expressing an opinion on the effectiveness of the entity’s internal control. An audit also includes evaluating the appropriateness of accounting policies used and the reasonableness of accounting estimates made by management, as well as evaluating the overall presentation of the consolidated financial statements.
We believe that the audit evidence we have obtained is sufficient and appropriate to provide a basis for our audit opinion.
Opinion
In our opinion, the consolidated financial statements referred to above present fairly, in all material respects, the consolidated financial position of Shimadzu Corporation and its consolidated subsidiaries as of March 31, 2018, and the consolidated results of their operations and their cash flows for the year then ended in accordance with accounting principles generally accepted in Japan.
Convenience Translation
Our audit also comprehended the translation of Japanese yen amounts into U.S. dollar amounts and, in our opinion, such translation has been made in accordance with the basis stated in Note 3 to the consolidated financial statements. Such U.S. dollar amounts are presented solely for the convenience of readers outside Japan.
June 28, 2018
Member ofDeloitte Touche Tohmatsu Limited
INDEPENDENT AUDITOR'S REPORT
Deloitte Touche Tohmatsu LLCShijokarasuma FT Square20, Naginataboko-choKarasuma-higashiiru, Shijo-doriShimogyo-ku, Kyoto 600-8008Japan
Tel: +81 (75) 222 0181Fax: +81 (75) 231 2703www.deloitte.com/jp

Shimadzu Integrated Report 2018
Printed in Japan 0156-09801-500NS
P010-E654
In the interest of environmental-friendliness, this report is printed with vegetable oil ink on
FSC® certified paper, ensures responsible use of the world’s forest resources.
1 Nishinokyo Kuwabara-cho, Nakagyo-ku, Kyoto 604-8511, Japanhttps://www.shimadzu.com
Financial Section