Embed Size (px)
Citation preview
Kansas State University Libraries Kansas State University Libraries
New Prairie Press New Prairie Press
Conference on Applied Statistics in Agriculture 2015 - 27th Annual Conference Proceedings
SHIGA TOXIN-PRODUCING ESCHERICHIA COLI IN MEAT: A SHIGA TOXIN-PRODUCING ESCHERICHIA COLI IN MEAT: A
PRELIMINARY SIMULATION STUDY ON DETECTION PRELIMINARY SIMULATION STUDY ON DETECTION
CAPABILITIES FOR THREE SAMPLING METHODS CAPABILITIES FOR THREE SAMPLING METHODS
Julie Couton University of Nebraska-Lincoln, [email protected]
David Marx University of Nebraska-Lincoln
John Luchaansky USDA-ARS Wyndmoor, PA
Randall Phebus Kansas State University
Anna Porto-Fett USDA-ARS Wyndmoor, PA
See next page for additional authors Follow this and additional works at: https://newprairiepress.org/agstatconference
Part of the Agriculture Commons, Applied Statistics Commons, and the Food Processing Commons
This work is licensed under a Creative Commons Attribution-Noncommercial-No Derivative Works 4.0 License.
Recommended Citation Recommended Citation Couton, Julie; Marx, David; Luchaansky, John; Phebus, Randall; Porto-Fett, Anna; Sevart, Nicholas; Singh, Manpreet; and Thippareddi, Harshavardhan (2015). "SHIGA TOXIN-PRODUCING ESCHERICHIA COLI IN MEAT: A PRELIMINARY SIMULATION STUDY ON DETECTION CAPABILITIES FOR THREE SAMPLING METHODS," Conference on Applied Statistics in Agriculture. https://doi.org/10.4148/2475-7772.1090
This Event is brought to you for free and open access by the Conferences at New Prairie Press. It has been accepted for inclusion in Conference on Applied Statistics in Agriculture by an authorized administrator of New Prairie Press. For more information, please contact [email protected].

Author Information Author Information Julie Couton, David Marx, John Luchaansky, Randall Phebus, Anna Porto-Fett, Nicholas Sevart, Manpreet Singh, and Harshavardhan Thippareddi
This event is available at New Prairie Press: https://newprairiepress.org/agstatconference/2015/proceedings/7
SHIGA TOXIN-PRODUCING ESCHERICHIA COLI IN MEAT: A PRELIMINARY SIMULATION STUDY ON DETECTION CAPABILITIES
FOR THREE SAMPLING METHODS
Julie Couton, Department of Statistics, University of Nebraska- Lincoln David Marx, Department of Statistics, University of Nebraska- Lincoln John Luchansky, Eastern Regional Research Center, USDA-ARS, Wyndmoor, PA Randall Phebus, Food Science Institute, Kansas State University Anna Porto-Fett, Eastern Regional Research Center, USDA-ARS, Wyndmoor, PA Nicholas Sevart, Food Science Institute, Kansas State University Manpreet Singh, Department of Food Sciences, Purdue University Harshavardhan Thippareddi, Department of Poultry Science, University of Georgia
ABSTRACT
Contamination by Shiga Toxin-producing Escherichia coli (STEC) is a continuing concern for meat production facility management throughout the United States. Several methods have been used to detect STEC during meat processing, however the excessive experimental cost of determining the optimal method is rarely feasible. The objective of this preliminary simulation study is to determine which sampling method (Cozzini core sampler, core drill shaving, and N-60 surface excision) will better detect STEC at varying levels of contamination present in the meat. 1000 simulated experiments were studied using a binary model for rare occurrences to find the optimal method. We found that for meat contamination levels less than 0.1% or greater than 10% all sampling methods perform equally. At moderate levels of contamination (between 0.1% and 10%) core drill shaving and N-60 perform significantly better than Cozzini core sampler. However, there does not appear to be a significant difference between core drill shaving and N-60. This project was supported by an Agriculture and Food Research Initiative CompetitiveGrant no. 2012-68003-30155 from the USDA National Institute of Food and Agriculture.
Key Words: simulation study; binary response variable; rare occurrence model; STEC
INTRODUCTION
Contamination by Shiga Toxin-producing Escherichia coli (STEC) is a continued concern among meat production facilities throughout the United States. A variety of methods have been developed to detect STEC during meat processing, however full experimental implementation is costly.
This simulation study focuses on the detection capabilities of three of these methods: Cozzini core sampler, core drill shaving, and N-60 surface excision. While all three methods perform well when high percentages of contaminated meat are present, results differs across methods as the percentage of contaminated meat decreases. The primary research question is which of the three methods is best able to detect STEC with varying levels of contamination present among the meat.
90
Conference on Applied Statistics in AgricultureKansas State University
New Prairie Presshttps://newprairiepress.org/agstatconference/2015/proceedings/7
MEAT PROCESSING AND SAMPLING
Typically in production, the carcass is processed and cuts of meat are sent down a conveyor belt then collected in large bins, called combos. Combos are selected at random to be tested. One of the sampling methods is used to collect cuts of meat which are then ground together and enriched before undergoing contamination analysis. If STEC is found to be present in the sample, all of the meat in the combo cannot be processed for human consumption and the bin is considered to be contaminated (1) otherwise it is considered to not be contaminated (0). Contamination is typically found on the surface of the individual cuts of meat.
Loading Process- Simulation
In this simulation study, all meat was considered to be the same size (2000cm3) with varying orientation determined at random. See Figure 1 in the Appendix.
Meat was loaded into a combo (80 cm long × 80 cm wide × 100 cm tall) layered from the bottom until the combo was filled. The randomly assigned orientations acted as a packing mechanism to ensure that all pieces of generated meat would fit within the combo. Once filled the combos held on average 225-250 cuts of meat. Figure 2 in the Appendix shows a transverse view of the combo from above once it had been filled.
The combo was then chosen to have one of six levels of contamination: 0.1%, 1%, 3%, 5%, 10%, or 15%. Using the assigned level of contamination, the cuts of meat within each combo were then uniformly contaminated at random. Whether the combo contains 1 cut or 100 cuts of meat that are contaminated the entire combo is deemed to be unfit for human consumption.
This process was repeated to form 1000 combos for each level of contamination resulting in 6000 total combos used for analysis. The three sampling methods discussed in a subsequent section were used on each combo.
Assumptions
Several assumptions were made in the process of this preliminary simulation study. First, the meat is assumed to be contaminated by STEC at random; no clustering mechanism was established for cuts of meat from the same carcass. Additionally all cuts of meat were assumed to be the same size. As mentioned above, after random contamination the cuts were assumed to be uniformly contaminated. If a piece of contaminated meat was sampled, it was assumed that the contamination was captured and then perfectly detected.
Sampling Methods
1. N-60 Surface Excision
With N-60 Surface Excision (N60), 60 samples are drawn from the surface of the combo (see
Figure 3). This method is commonly used in practice, because it is the simplest to implement. A
variant of this method is N-90 where an additional 30 samples are drawn from the surface.
91
Conference on Applied Statistics in AgricultureKansas State University
New Prairie Presshttps://newprairiepress.org/agstatconference/2015/proceedings/7

In Figure 2 in the appendix, the transect shows 40 cuts of meat. To obtain N60, 60 cuts of meat
on the top of the combo were sampled, meaning that sampling continued into the second layer
of meat. This is commonly done in practice.
2. Cozzini Core Sampler The Cozzini core sampler (Cozz) is 4.4 cm in diameter and permeates to the bottom of the combo. This core samples both the surface and interior of the individual cuts of meat (see Figure 4). In this method, five cores are drawn from the combo: one from each corner and one from the center. Within each of these areas, the specific placement of the sampler is chosen at random (see Figure 5). These cores are then combined and collectively act as a sample from the combo.
3. Core Drill Shaving The core drill shaving method (Core) utilizes a shaver that is 3.2 cm in diameter. Although the shaver is shorter in length than the Cozzini core, reaching only halfway down into the combo, it collects samples from primarily the surface area of each cut (see Figure 6). While the Cozzini permeates through the cuts of meat, the Core shaves all meats surrounding it, at times traveling horizontally rather than strictly vertically. Like the Cozzini, 5 shavings are drawn from the combo, one from each corner with an additional shaving collected in the center (see Figure 7). These shavings are combined and considered to be a single sample from the combo.
Basic Data Summary
Due to our assumptions, it is apparent that a large component of successful detection of STEC is the number of pieces of meat sampled.
Table 1: Average number of pieces sampled within each combo.
We assumed that meat is contaminated strictly at random (without a clustering mechanism), thus the more pieces of meat that are sampled the better the detection will be. In Table 1, Cozz is sampling fewer pieces of meat on average than the other methods, while N60 and Core are performing similarly on average.
ANALYSIS AND RESULTS
Recall that the sampling method either detects contamination (1) or does not (0). Following the notation of Stroup (2013), this binary response variable was modeled as follows:
92
Conference on Applied Statistics in AgricultureKansas State University
New Prairie Presshttps://newprairiepress.org/agstatconference/2015/proceedings/7
𝑦𝑖𝑗𝑘|𝑏(𝑐)𝑗𝑘~𝐵𝑖𝑛𝑎𝑟𝑦(𝜋𝑖𝑗𝑘), 𝜂𝑖𝑗𝑘 = 𝑙𝑜𝑔𝑖𝑡(𝜋𝑖𝑗𝑘) = 𝑙𝑜𝑔 (𝜋𝑖𝑗𝑘
1 − 𝜋𝑖𝑗𝑘)
𝜂𝑖𝑗𝑘 = 𝜂 + 𝑚𝑖 + 𝑐𝑗 + 𝑚𝑐𝑖𝑗 + 𝑏(𝑐)𝑗𝑘 , 𝑏(𝑐)𝑗𝑘~𝐺𝑎𝑢𝑠𝑠𝑖𝑎𝑛(0, 𝜎𝐵2)
Where 𝜂𝑖𝑗𝑘 is the linear predictor, 𝑚𝑖 represents the main effect of sampling method 𝑖, 𝑐𝑗
represents the main effect of contamination level 𝑗 (0.1%, 1%, 3%, 5%, 10%, or 15%), and 𝑚𝑐𝑖𝑗
represents their interaction. Observed response 𝑦𝑖𝑗𝑘 represents the contamination (0 or 1)
which is conditioned on the random effect 𝑏(𝑐)𝑗𝑘 because the observation occurs within each
combo or block, 𝑏𝑘, assigned a level of contamination. Here, combos are considered to be random due to the nature of the testing procedure in reality (each combo is a sample from a large population of combos) which was emulated in the simulation process. Combos are
assumed to be normally distributed with mean 0 and variance 𝜎𝐵2. All simulated replications
were combined and analyzed using SAS PROC GLIMMIX™.
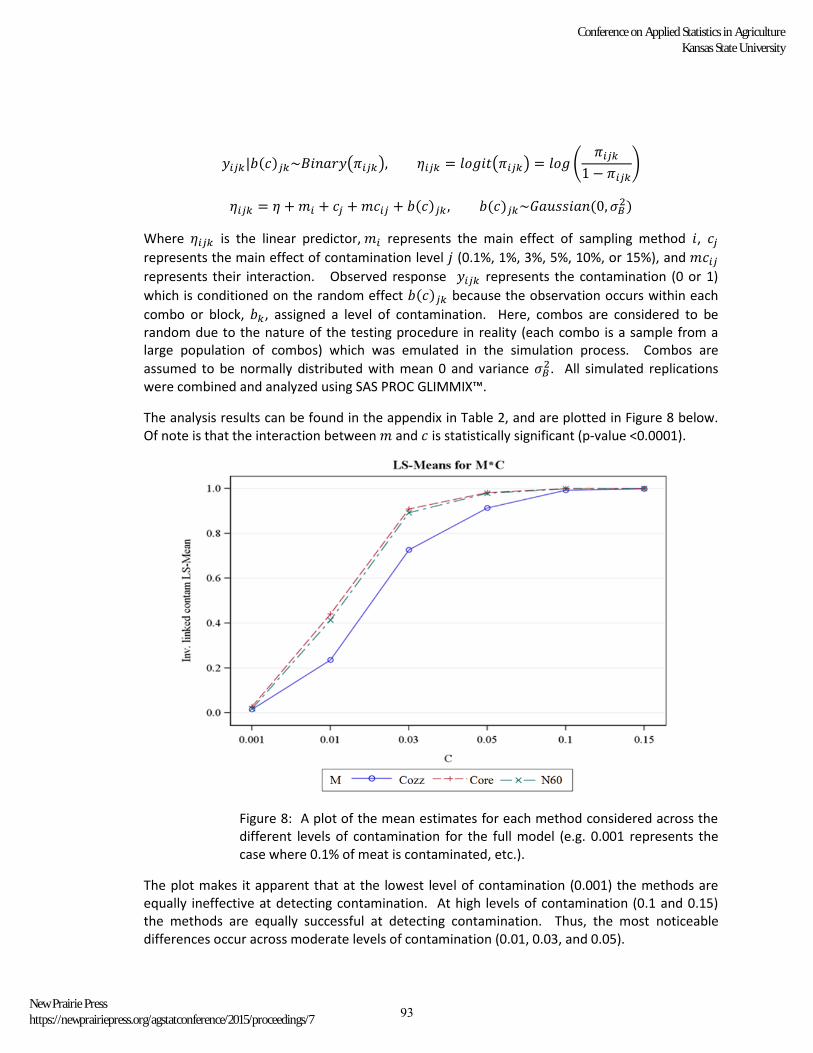
The analysis results can be found in the appendix in Table 2, and are plotted in Figure 8 below. Of note is that the interaction between 𝑚 and 𝑐 is statistically significant (p-value <0.0001).
Figure 8: A plot of the mean estimates for each method considered across the different levels of contamination for the full model (e.g. 0.001 represents the case where 0.1% of meat is contaminated, etc.).
The plot makes it apparent that at the lowest level of contamination (0.001) the methods are equally ineffective at detecting contamination. At high levels of contamination (0.1 and 0.15) the methods are equally successful at detecting contamination. Thus, the most noticeable differences occur across moderate levels of contamination (0.01, 0.03, and 0.05).
93
Conference on Applied Statistics in AgricultureKansas State University
New Prairie Presshttps://newprairiepress.org/agstatconference/2015/proceedings/7
Restricting the analysis to moderate levels of contamination, we again find that the interaction between 𝑚 and 𝑐 is statistically significant (p-value = 0.0042, Table 3 in the Appendix). These results are considered to be statistically significant, which largely occurred due to the large number of replications.
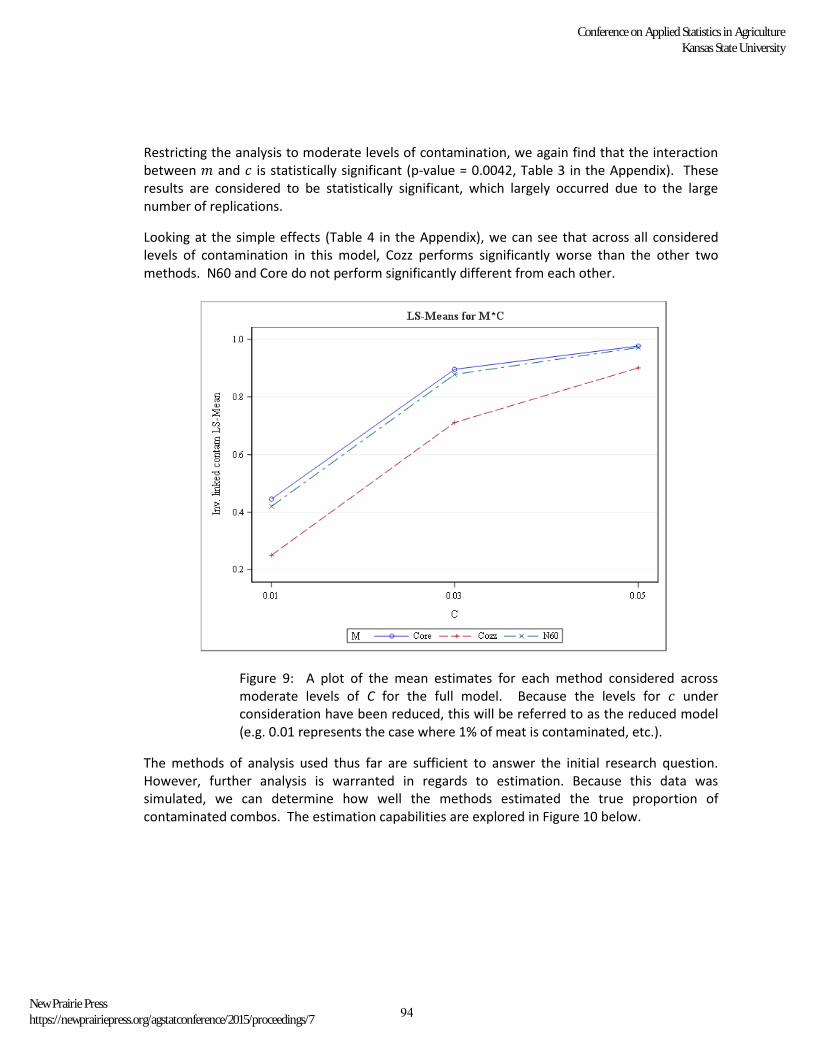
Looking at the simple effects (Table 4 in the Appendix), we can see that across all considered levels of contamination in this model, Cozz performs significantly worse than the other two methods. N60 and Core do not perform significantly different from each other.
Figure 9: A plot of the mean estimates for each method considered across moderate levels of C for the full model. Because the levels for 𝑐 under consideration have been reduced, this will be referred to as the reduced model (e.g. 0.01 represents the case where 1% of meat is contaminated, etc.).
The methods of analysis used thus far are sufficient to answer the initial research question. However, further analysis is warranted in regards to estimation. Because this data was simulated, we can determine how well the methods estimated the true proportion of contaminated combos. The estimation capabilities are explored in Figure 10 below.
94
Conference on Applied Statistics in AgricultureKansas State University
New Prairie Presshttps://newprairiepress.org/agstatconference/2015/proceedings/7
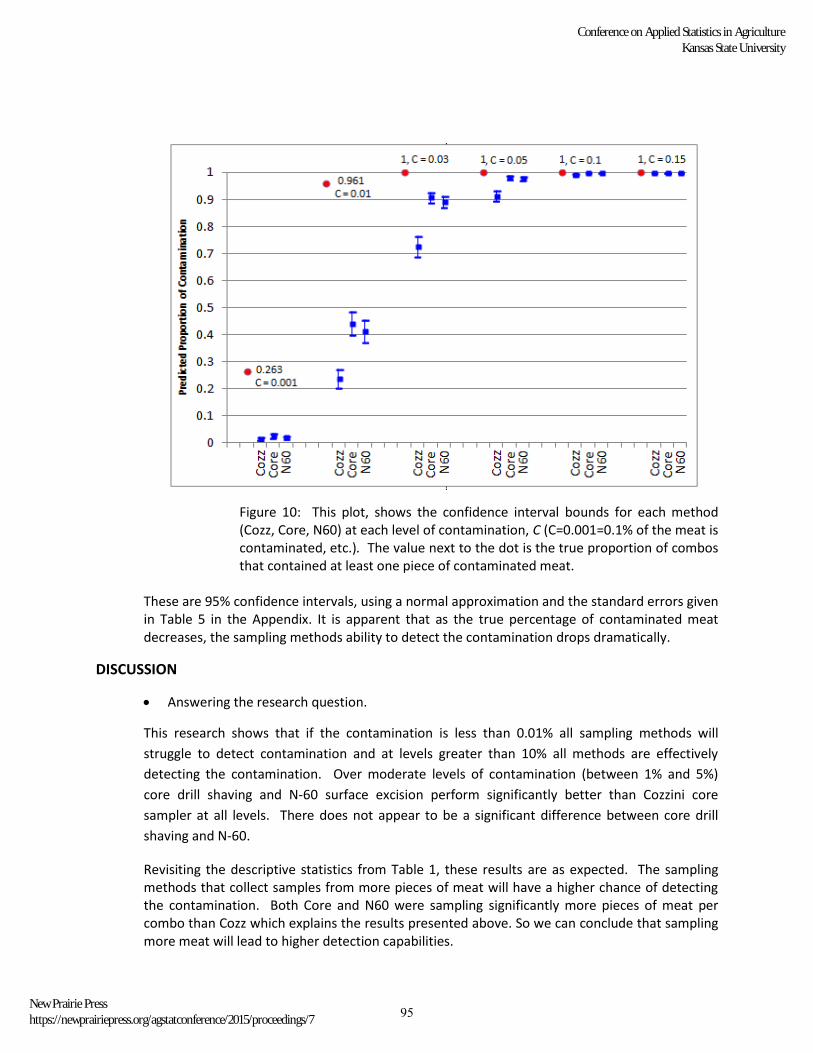
Figure 10: This plot, shows the confidence interval bounds for each method (Cozz, Core, N60) at each level of contamination, C (C=0.001=0.1% of the meat is contaminated, etc.). The value next to the dot is the true proportion of combos that contained at least one piece of contaminated meat.
These are 95% confidence intervals, using a normal approximation and the standard errors given in Table 5 in the Appendix. It is apparent that as the true percentage of contaminated meat decreases, the sampling methods ability to detect the contamination drops dramatically.
DISCUSSION
Answering the research question.
This research shows that if the contamination is less than 0.01% all sampling methods will
struggle to detect contamination and at levels greater than 10% all methods are effectively
detecting the contamination. Over moderate levels of contamination (between 1% and 5%)
core drill shaving and N-60 surface excision perform significantly better than Cozzini core
sampler at all levels. There does not appear to be a significant difference between core drill
shaving and N-60.
Revisiting the descriptive statistics from Table 1, these results are as expected. The sampling methods that collect samples from more pieces of meat will have a higher chance of detecting the contamination. Both Core and N60 were sampling significantly more pieces of meat per combo than Cozz which explains the results presented above. So we can conclude that sampling more meat will lead to higher detection capabilities.
95
Conference on Applied Statistics in AgricultureKansas State University
New Prairie Presshttps://newprairiepress.org/agstatconference/2015/proceedings/7
However, this conclusion is valid for this simulation only. The result would likely change if the assumptions made in the simulation process were altered, to incorporate more realistic conditions. Specifically, the simulation warrants the incorporation of different sizes of meat and the inclusion of a clustering mechanism. In production facilities, each piece of meat is not contaminated completely at random. If there is contamination on the hide of the carcass, the contamination is more likely to occur on meat from that carcass. Inclusion of these components is paramount before any firm conclusions can be drawn in regards to these sampling methods.
Looking beyond the research question towards estimation capabilities.
The results of this study show that as the presence of contamination (𝑐 < 0.05) decreases, the sampling methods ability to capture this contamination drops dramatically. It is unclear if this trend will be present as the simulation assumptions are relaxed.
By incorporating the estimation into this preliminary simulation study, we have come to realize that simply determining which method is superior is far from adequate. We must ensure that the sampling methods result in accurate determination of contamination due to the high consequences of misclassifying a combo as safe for consumption.
FUTURE RESEARCH
This study is intended as a first step in a sequence of simulation studies that further incorporate realistic scenarios with less restrictive assumptions. Specifically, incorporating various sized meats (proportional to those that are currently processed in the production facilities) and a clustering mechanism. Finally, assuming perfect detection (no false positives or false negatives) is not realistic. This should also be incorporated into subsequent simulations and analyses.
ACKNOWLEDGEMENTS
This project was supported by an Agriculture and Food Research Initiative Competitive Grant no. 2012-68003-30155 from the USDA National Institute of Food and Agriculture.
REFERENCES
Stroup, W.W. 2013. Generalized Linear Mixed Models. Boca Raton, FL. CRC Press.
96
Conference on Applied Statistics in AgricultureKansas State University
New Prairie Presshttps://newprairiepress.org/agstatconference/2015/proceedings/7
APPENDIX
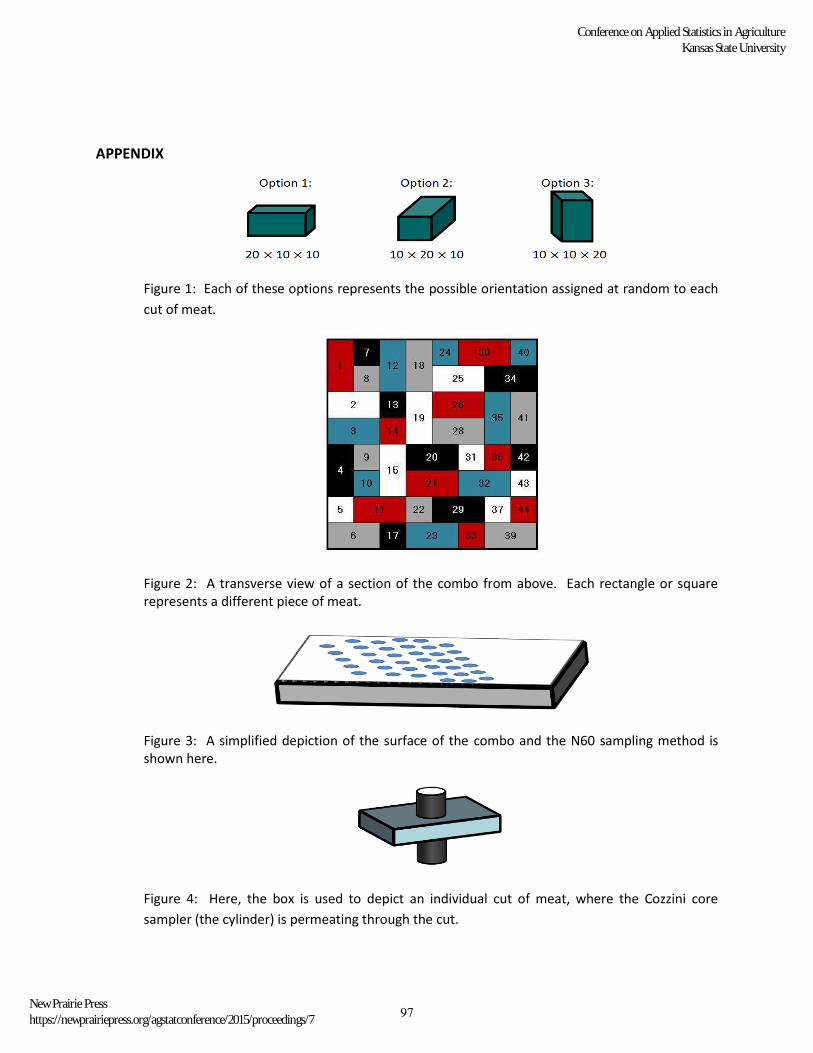
Figure 1: Each of these options represents the possible orientation assigned at random to each
cut of meat.
Figure 2: A transverse view of a section of the combo from above. Each rectangle or square represents a different piece of meat.
Figure 3: A simplified depiction of the surface of the combo and the N60 sampling method is shown here.
Figure 4: Here, the box is used to depict an individual cut of meat, where the Cozzini core
sampler (the cylinder) is permeating through the cut.
97
Conference on Applied Statistics in AgricultureKansas State University
New Prairie Presshttps://newprairiepress.org/agstatconference/2015/proceedings/7
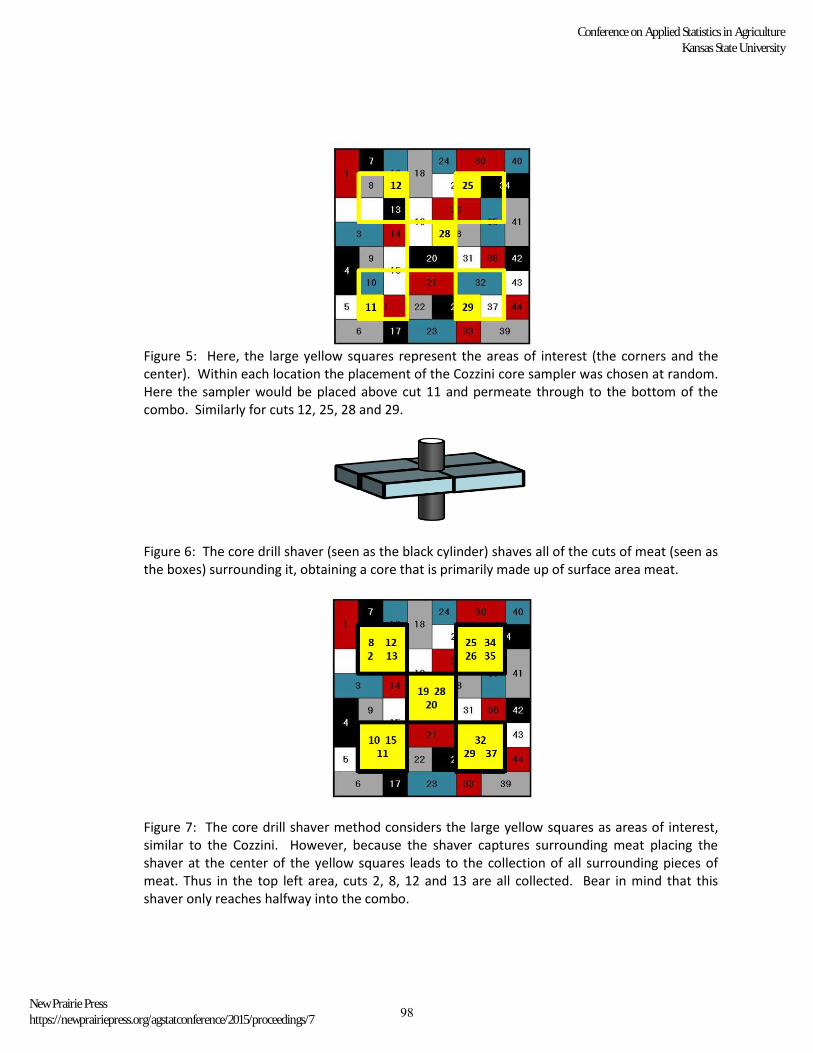
Figure 5: Here, the large yellow squares represent the areas of interest (the corners and the center). Within each location the placement of the Cozzini core sampler was chosen at random. Here the sampler would be placed above cut 11 and permeate through to the bottom of the combo. Similarly for cuts 12, 25, 28 and 29.
Figure 6: The core drill shaver (seen as the black cylinder) shaves all of the cuts of meat (seen as the boxes) surrounding it, obtaining a core that is primarily made up of surface area meat.
Figure 7: The core drill shaver method considers the large yellow squares as areas of interest, similar to the Cozzini. However, because the shaver captures surrounding meat placing the shaver at the center of the yellow squares leads to the collection of all surrounding pieces of meat. Thus in the top left area, cuts 2, 8, 12 and 13 are all collected. Bear in mind that this shaver only reaches halfway into the combo.
98
Conference on Applied Statistics in AgricultureKansas State University
New Prairie Presshttps://newprairiepress.org/agstatconference/2015/proceedings/7
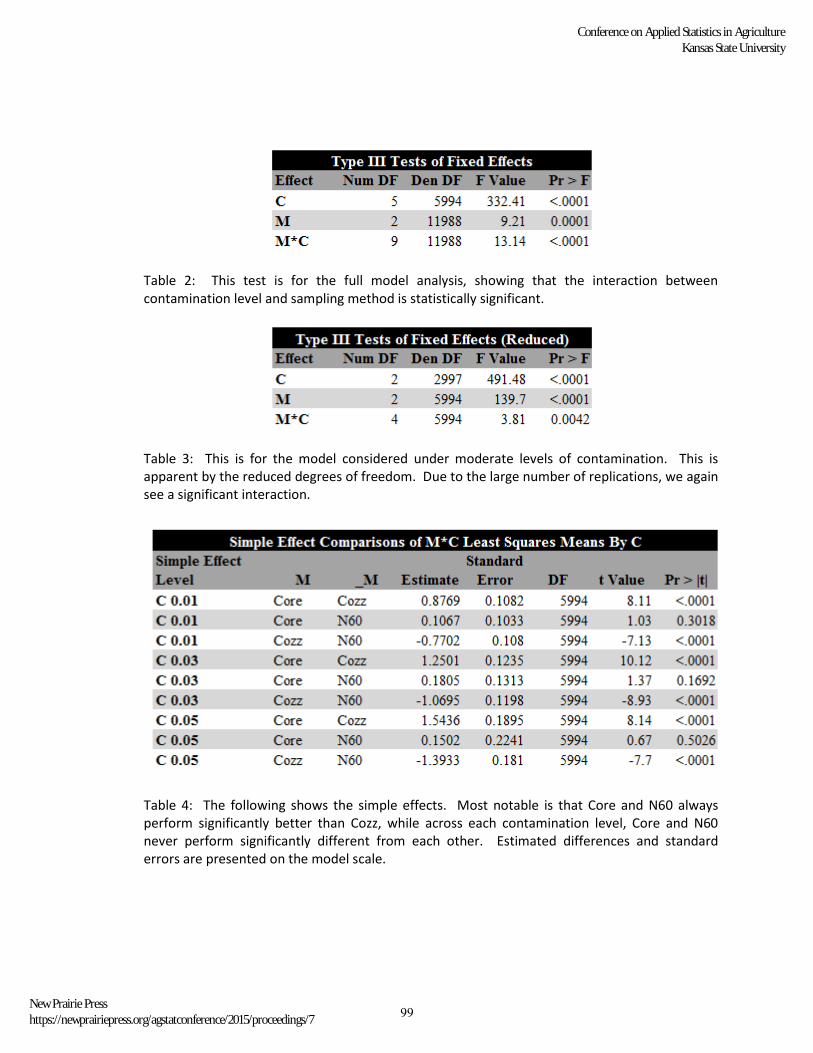
Table 2: This test is for the full model analysis, showing that the interaction between contamination level and sampling method is statistically significant.
Table 3: This is for the model considered under moderate levels of contamination. This is apparent by the reduced degrees of freedom. Due to the large number of replications, we again see a significant interaction.
Table 4: The following shows the simple effects. Most notable is that Core and N60 always perform significantly better than Cozz, while across each contamination level, Core and N60 never perform significantly different from each other. Estimated differences and standard errors are presented on the model scale.
99
Conference on Applied Statistics in AgricultureKansas State University
New Prairie Presshttps://newprairiepress.org/agstatconference/2015/proceedings/7
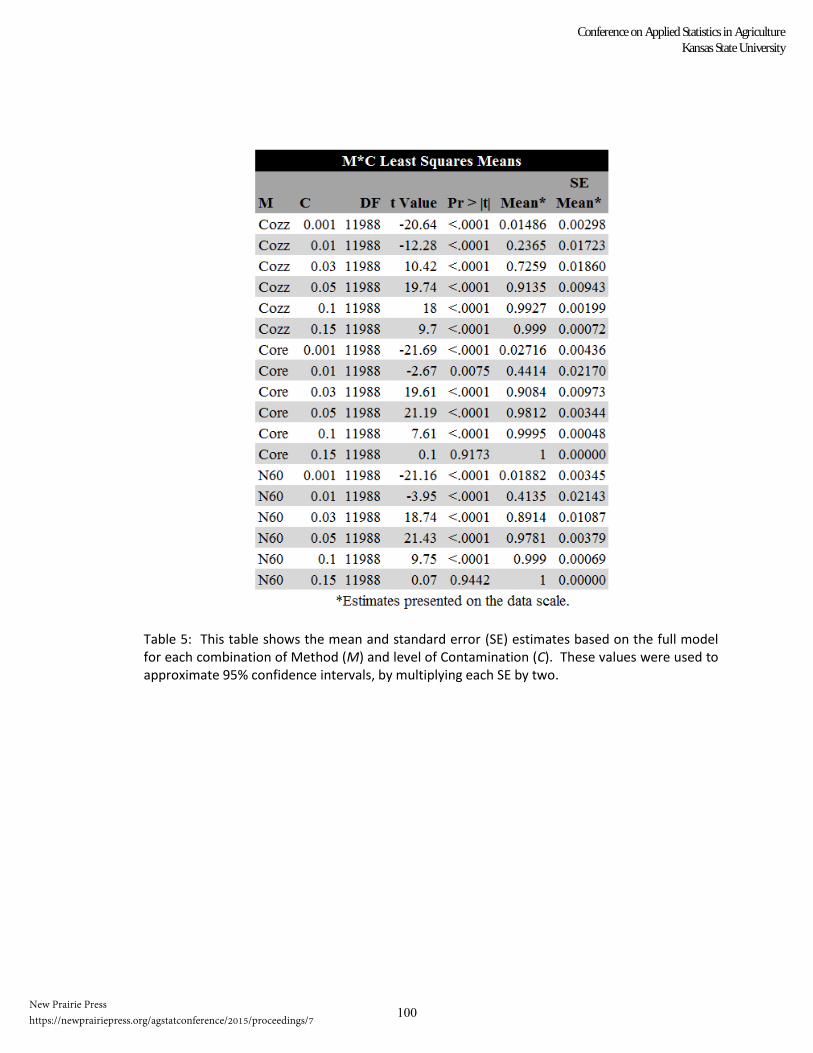
Table 5: This table shows the mean and standard error (SE) estimates based on the full model for each combination of Method (M) and level of Contamination (C). These values were used to approximate 95% confidence intervals, by multiplying each SE by two.
100
Conference on Applied Statistics in AgricultureKansas State University
New Prairie Presshttps://newprairiepress.org/agstatconference/2015/proceedings/7