Embed Size (px)
Citation preview
World Development Vol. 32, No. 7, pp. 1139–1157, 2004� 2004 Elsevier Ltd. All rights reserved
Printed in Great Britain0305-750X/$ - see front matter
lddev.2004.01.011
www.elsevier.com/locate/worlddevdoi:10.1016/j.wor
Shifts in the Composition of Government Spending
in Response to External Debt Burden
SAEID MAHDAVI *The University of Texas at San Antonio, USA
Summary. — This paper examines the effects of external public debt burden on the composition ofpublic spending in a sample of 47 developing countries for 1972–2001. We specify a system ofequations for the relative spending shares of six economic categories and estimate it using severalestimation methods and samples. We find support for the adverse effect of the debt burden on‘‘capital expenditure’’ in the full sample and in the Middle East-North Africa and sub-SaharanAfrica subsamples where the debt burden was relatively high. Among components of ‘‘currentexpenditure,’’ increased debt burden shifted the shares against ‘‘nonwage goods services’’ and‘‘subsidy and transfers’’ while leaving the share of politically sensitive category of ‘‘wages andsalaries’’ unscathed in most cases.� 2004 Elsevier Ltd. All rights reserved.
Key words — developing countries, external public debt, public finance, public spending
composition
*The author is grateful to two anonymous referees of
the journal for their helpful comments and suggestions.
All remaining errors and omissions are the sole
responsibility of the author. The research on this paper
was supported by the University of Texas at San
Antonio through a ‘‘Faculty Development Leave’’
award in the Fall 2003. Final revision accepted: 8
January 2004.
1. INTRODUCTION
In the past three decades or so, a number ofdeveloping countries (DCs) experienced majorepisodes of financial crisis that were charac-terized by unsustainable fiscal deficits and ris-ing external debt. The deficits raise the level ofexternal public (and publicly guaranteed debt)through two channels: Directly, they causemore external public borrowing for financingpurposes. Indirectly, when coupled with over-valued exchange rates, they encourage capitalflight. This, in turn, drains national foreignexchange reserves and leads to ‘‘flight-drivenexternal borrowing.’’ 1 Not surprisingly, sincethe ‘‘debt crisis’’ of the early 1980s, fiscal deficitreduction became a key component of themacroeconomic adjustment programs thatmany indebted countries had to undertake as acondition for their inclusion in debt restruc-turing and debt relief initiatives and/or eligi-bility for the IMF’s ‘‘rescue packages.’’Two main issues arise in relation to efforts
aimed at containing the fiscal deficits. The firstissue is the distribution of total reduction in thesize of the deficit between spending cuts andhigher (tax) revenues. It may be argued that, ingeneral, the spending side of the budget is likelyto bear a heavier burden of deficit containmentthan its revenue side. For one reason, spendingcuts can be more quickly implemented than
113
measures that can generate more tax receipts.Moreover, raising taxes may be perceived as apolicy with distortionary effects and in conflictwith reducing the role of government (Wood-ward, 1992). 2 The second issue is the distri-bution of total spending cuts among variouscategories of public spending. Since interestpayments on the public debt is a relativelysubstantial and inflexible component of totalpublic spending, such distribution presents aparticularly challenging problem: If spendingcuts mainly fall on expenditure categories thataffect current income and consumption levels oflarge segments of population, they will haveadverse welfare (poverty) implications. Thelatter may, in turn, lead to a rise in the levels ofpublic discontent and political instability. Onthe other hand, if the brunt of spendingreductions is borne by categories that maintainand enhance the economy’s productive capa-city, it may well endanger the long-term
9
WORLD DEVELOPMENT1140
economic growth. 3 This is particularly true incountries where the public sector is the sourceof much of total investment in infrastructureand fixed capital.Concerns regarding the growth and welfare
implications of public spending cuts, particu-larly under IMF-supported adjustment pro-grams, generated many debates. Attempts toshed light on various aspects of these debatesresulted in a large body of empirical studies. Arelatively small branch of these studies focusedon the distribution of the burden of spendingadjustment among the relative shares of variousfunctional and economic categories of publicspending. 4 Hicks and Kubisch (1984), forexample, noted that unlike capital expendi-tures, social and defense expenditures tended tobe well protected during periods of fiscalretrenchment over the period 1972–80. A laterstudy by Hicks (1989), essentially confirmedthis finding. After examining the data from asample of 11 ‘‘high-debt’’ countries during1978–84, Hicks concluded that the major bur-den of expenditure reductions fell on theheavily capital-intensive sectors (particularlyinfrastructure) as well as real wages and salariesof government employees. At the same time,social and defense sectors were sheltered. In amore formal and extensive study, Heller andDiamond (1990) analyzed the data for a largenumber of DCs over 1975–86. An importantfinding of their study was that, among theeconomic categories of spending, the shift inspending patterns turned out to be most pro-nounced against ‘‘fixed assets and capitaltransfers and toward interest, subsidy andtransfer payments, given the functional struc-tures of expenditures over the period’’ (p. 2).Papagapitos (1992) attempted to address
widespread concerns regarding stabilizationprograms by estimating the impact of variousproxy variables for the programs on the shareof ‘‘developmental expenditure.’’ Using a sam-ple of 25 DCs over 1972–88, he estimated therelative share equations for various func-tional categories of government expenditures.Interestingly enough, he found that ‘‘for themost part, stabilization programs do notappear to consistently shift public expendituresaway from growth-augmenting areas.’’ (p. 85).Habibi’s (1994) study focused on the politicaldimension of the allocation of total spendingamong competing functional and economicexpenditure categories. His analysis of the datafor a cross-section of 67 countries (with 1984 asthe reference year) suggested that a higher level
of political democratization was associatedwith a higher relative budget share of ‘‘subsi-dies and other current transfers’’ and a lowershare of ‘‘nonwage goods and services.’’As its main objective, the present study seeks
to investigate empirically the way an increasein the external public debt––directly (throughchanges in spending priorities) or indirectly(through higher interest payments)––shifted therelative shares of economic categories of publicspending in a sample of indebted DCs. Ourinvestigation is motivated by the fact that: (a)Debt-induced changes in public spendingpriorities and their social and economic impli-cations continue to generate debates amongprofessional economists and draw criticismsfrom nongovernmental organizations (NGOs). 5
(b) The nexus between public debt and the mixof public spending is an important link in the‘‘causal chain’’ running from public debt toeconomic growth or welfare. As such, ourempirical examination of this nexus nicelycomplements the results of several recent stud-ies in which public debt or spending composi-tion was directly related to economic growthrate, private investment, or measures of pov-erty. 6
Some more specific features of our empiricalanalysis are as follows: First, we use an updatedpooled data set that contains observations for47 developing countries collected over a timeperiod spanning roughly three decades (1972–2001). The extended time-series dimension ofthe pooled data set employed here should yielda more accurate assessment of the impact ofpublic debt burden and other variables on thecomposition of public spending than thosereported by Heller and Diamond (1990) for1978–86. Second, unlike many previous studies,we define various economic expenditure cate-gories in terms of their relative shares in totalgovernment expenditure. This definition isintuitively more appealing for, as noted byHabibi (1994), fiscal decision makers are likelyto be more concerned about funds allocated toa particular spending category as a percentageof total spending than GDP. Third, we test thesensitivity of our results to various ways inwhich the (unobservable) country- and/or time-specific effects in the pooled data set may becaptured and to the sample composition. 7
Finally, as an extension of our analysis, we alsoestimate the impact of external debt on the sizeof the public sector.In view of the features noted above, it would
be interesting to see whether our results are
GOVERNMENT SPENDING AND EXTERNAL DEBT BURDEN 1141
consistent with those obtained from earlierstudies. Our findings should also be of interestin relation to sustainability of fiscal adjustmentprograms and debt relief, for both depend onthe reorientation of the composition of publicspending toward ‘‘productive’’ and away from‘‘unproductive’’ spending categories. In Section2 of what follows, we specify a system of rela-tive share equations. Section 3 provides a briefdescription of the data set. Section 4 presentsour empirical results. The last section containsa summary of the major findings and conclud-ing remarks.
2. THE MODEL
In this section, we specify models for therelative budget shares of six major economiccategories of public spending using the IMFclassifications. These categories are: (1) wagesand salaries of public employees including themilitary, (2) purchases of nonwage goods andservices including spending on maintenance andoperations (M&O), (3) interest payments onpublic debt, (4) subsidies and other currenttransfers to households, public and privateenterprises and other levels of government, (5)capital expenditures including spending on fixedcapital assets and (6) other economic category (aresidual category). We draw from the literatureto identify some potential determinants ofinternal budget allocation. A brief discussion ofthese determinants follows.
(a) The level of (economic) development
The German economist Adolph Wagner(1883/1953) hypothesized that governmentexpenditures would increase in the course ofdevelopment of a modern industrial society.This positive relationship between the level ofeconomic development and the size of govern-ment––which have come to be known as‘‘Wagner’s Law’’––reflects a greater role for thegovernment as the economy becomes morecomplex and the demand for public goods andsocial programs rises.On this basis, we may infer certain changes in
the composition of public spending as the roleof the public sector changes in the long-termprocess of (economic) development. In theearly stages of development, the public sectorplays a major role as an employer, an investorin infrastructure and human capital, and abuyer of goods and services. But, as the private
sector gains in size and influence in the courseof development, it begins to increasinglyassume these roles. In later stages, the publicsector’s role as a provider of transfers maybecome more important as it expands the cov-erage of its ‘‘social safety net’’ and ‘‘incomemaintenance’’ programs. 8 This long-term shiftin emphasis changes priorities attached to var-ious spending categories and, thus, theirrespective shares in total public spending. Morespecifically, we expect the shares of wages andsalaries, nonwage goods and services, andcapital spending to fall and the share of subsi-dies and transfers to rise at higher levels ofdevelopment. To the extent that the publicsector becomes more reliant on debt (ratherthan aid) in the course of development, theshare of interest payments may also be expectedto increase.
(b) The relative size of the public sector
The inclusion of a proxy for the size of gov-ernment in addition to the level of developmentmay be justified for several reasons. First,research in the area of political economicssuggests that the size of government is posi-tively associated with factors that may impactthe composition of total spending. Theseinclude the level of corruption (Goel & Nelson,1998), exposure to external risks such as tradeshocks (Rodrik, 1996), and internal risks suchas political instability and social conflicts dueto, for example, religion, ethnic, or linguisticfractionalization of the society (Annett,2001). 9 One would expect, therefore, toobserve a tilt toward those categories of publicspending which are more prone or vulnerableto rent-seeking behavior and/or can be influ-enced by bribery as the reach of governmentexpands with its size. 10 Similarly, to the extentthat the size of government reflects the exis-tence of external and internal risks, largergovernments may allocate larger shares tosubsidies and other current transfers that tendto mitigate those risks and/or act as a socialbuffer against them.Second, while the level of development serves
as a proxy for factors that affect the composi-tion of spending in the long-term, the relativesize of the government tends to capture theeffects of more cyclical factors. The latterinclude, for example, changes in the tax-baseand government nontax revenues. Accordingly,a given level of development may be associatedwith different relative sizes of the public sector
WORLD DEVELOPMENT1142
reflecting the influence of these cyclical factors.Finally, the relative size of the public sectorserves as a control variable whose inclusionallows for more accurate interpretation ofchanges in the relative spending shares. Forexample, a decline in the relative share of aparticular category of spending in response toincreased level of public debt burden may bemore correctly interpreted as an indication of alower priority attached by budgetary authoritiesto (and a lower share in GDP of) that categoryonly if the size of government spending pie iscontrolled for.
(c) The size (burden) of public and publiclyguaranteed external debt
Excessive fiscal expansion, through higherbudget deficits, raises the stock of externalpublic (and publicly guaranteed) debt. As notedearlier, the initial change in the stock of debtmay be augmented by ‘‘flight-driven externalborrowing.’’ As the stock of debt rises, theallocation of budget shifts in favor of the rela-tive share of interest payments. Since this shifthas to necessarily take place at the expense ofthe shares of some (or all) of the remainingspending categories, the ‘‘indirect crowding-outeffect’’ of the debt is negative. The extent of thisindirect effect on a particular category, how-ever, is not easy to predict, for it depends on theeconomic and political priorities that fiscalauthorities attach to it.The public debt burden may more directly
impact the composition of government spend-ing. The ‘‘debt-overhang’’ hypothesis (Krug-man, 1988) suggests that an increase in theburden of the debt beyond a certain thresholdvalue may generate a disincentive for the publicsector to carry out macroeconomic reforms andincrease public investment. This is becauseexternal creditors will effectively ‘‘tax’’ a largeportion of the additional output/income as debtservice. The stock of debt, signaling the burdenof future debt services, may thus depress pres-ent public spending on new capital stock andmaintenance and operation of existing capitalstock. 11
(d) The structure of functional categoriesof total spending
The current allocation of total spendingamong the economic categories also reflects thestructure of the functional spending categories.As noted by Heller and Diamond (1990), each
functional category may be assumed to have an‘‘underlying implicit technology of production’’characterized by a category-specific degree ofintensity of utilization of labor, capital, andmaterials. Accordingly, the allocation of alarger share of the total spending to a relativelylabor-intensive functional category such aseducation tends to increase the relative share ofthe economic category of wages and salaries.An increase in the relative share of economicservices, on the other hand, may boost therelative shares of nonwage goods and servicesand capital expenditure as the government triesto maintain the existing capital stock or add toit. Finally, a labor- and material-intensive cate-gory such as defense may raise the shares ofboth wages and salaries and nonwage goodsand services. 12
(e) The political environment
The extent of civil liberties and politicalrights of members of the public, or simply thelevel of democratization, may influence publicspending priorities. It is generally agreed thatcertain civil liberties increase the degree ofpublic participation in and scrutiny of resourceallocation process within the public sector. But,the extent to which various socioeconomicgroups are able to translate their perceivedinterests and priorities into actual changes inthe budget allocation crucially depends on theirrelative position in the political power struc-ture. A high level of political institutionaliza-tion facilitated by political rights makes thepolitical power structure more representative.Civil liberties when combined with politicalrights can also more effectively limit the influ-ence of corruption and rent-seeking behavioron budget allocation and raise the political costof ignoring public interests to fiscal authori-ties. 13
Accordingly, one may argue that it would bepolitically easier for a repressive or anauthoritarian government to make budgetallocation a reflection of its own priorities thanit would be for a more democratic government.The theory of ‘‘public choice’’ (Buchanan &Tullock, 1962) predicts that in more demo-cratic forms of government ‘‘political entre-preneurs’’ tilt toward current and againstcapital expenditures. 14 Moreover, certain fea-tures of the political and electoral systems mayaffect the composition of current public spend-ing. For example, within a ‘‘legislative bargain-ing’’ framework, Milesi-Ferretti, Perotti, and
GOVERNMENT SPENDING AND EXTERNAL DEBT BURDEN 1143
Rostagno (2001) show that ‘‘proportional sys-tems’’ are more geared to spending on transferpayments (which are easier to target acrosssocial groups) while ‘‘majoritarian systems’’tend to spendmore on goods and services (whichare easier to target geographically).
(f) IMF-supported programs
Fiscal adjustment has been the cornerstoneof ‘‘IMF-supported programs’’ in most coun-tries where these programs are present (Bulir &Moon, 2003). An important component of theIMF’s fiscal policy advice to its member coun-tries has been improving the public spendingmix by raising the share of ‘‘productive’’spending and reducing the share of ‘‘unpro-ductive’’ spending (see, for example, IMF, 1997and Gupta et al., 2002b). Not surprisingly,productive spending categories include physicalcapital outlays. 15 Unproductive public expen-ditures are defined as ‘‘those public outlays thatcan be reduced without affecting governmentoutputs’’ (IMF, 1997, p. 49). Included in thiscategory are wages and salaries that reflect both‘‘inappropriate wage policy and overstaffing’’as well as ‘‘generalized consumer subsidies,’’‘‘inefficient producer subsidies,’’ and ‘‘subsi-dized credit to inefficient public enterprises.’’Accordingly, one would expect the presence ofthese programs (usually represented by adummy variable) to be associated with a highershare of capital spending and lower shares ofwages and subsidies. The budget share ofinterest payments may also rise to the extentthat the programs succeed in freeing upresources from current spending categoriesand/or attach priority to interest payments forcredibility and symbolic reasons.Empirical studies on the impacts of IMF-
supported programs raise several caveats thatare worth noting here. First, the effectiveness ofIMF-supported programs in achieving theirdepends on factors that affect their implemen-tation. 16 Second, empirical assessment of theindependent effects of the programs on theirtargets is ‘‘notoriously complex,’’ for it is diffi-cult to disentangle the programs’ effects fromthose associated with the initial conditions inand external shocks to a country (Bulir &Moon, 2003). Third, various aspects of a pro-gram (for example, the existence and number ofstructural conditions) determine the degree ofits effectiveness.Based on the discussions above, we initially
specify the following basic equation for the
relative share of the ith economic category forthe jth country at time t ðSijtÞ:Sijt ¼ ai þ biðRPCGNPÞjt
þ ciðGEXGDPÞjt þ diðPPDGNPÞjtþ giðDEFÞjt þ hiðSOEXÞjtþ kiðECSÞjt þ /iðFINDXÞjtþ xiðIMFDÞjt þ lijt; ð1Þ
where i ¼ 1; 2; . . . ; 6. The variables of themodel are briefly defined as follows:
–– S1 ¼ ðWGSÞ, S2 ¼ ðOGSÞ, S3 ¼ ðINTÞ,S4 ¼ ðSTRÞ, S5 ¼ ðCEXÞ, S6 ¼ ðOTEÞ arethe relative shares of the wages and salariesof public employees, nonwage purchases ofgoods and services, interest payments, subsi-dies and other current transfers, capitalexpenditures, and other (residual) economiccategories, respectively. All of the relativeshare variables are defined as percentages of‘‘total central government expenditure andlending minus and repayments.’’ 17
––RPCGNP is real per capita GNP thatserves as a proxy for the level of develop-ment.––GEXGDP is the ratio of total governmentspending to GDP. It is a measure of the rel-ative size of the government.–– PPDGNP is the ratio of long-term publicand publicly guaranteed external debt stockto GNP. It is a measure of the ‘‘debt bur-den.’’––DEF, SOEX and ECS are the relativeshares of spending on defense, ‘‘social expen-ditures’’ (defined as combined spending onsocial security and welfare, health, education,housing and community amenities), and eco-nomic services, respectively. They representof the functional spending categories. (Theresidual functional category, mainly ‘‘generalpublic services,’’ is not included to avoid per-fect collinearity).––FINDX is the ‘‘freedom index’’ whichserves as a proxy for the ‘‘political environ-ment’’ or the ‘‘level of democratization’’ ina country. It is the average value of an indexof civil liberties and an index of politicalrights. Each index is constructed on a one-to-seven scale. The levels of civil libertiesand political rights diminish as one movesfrom a score one to a score seven.–– IMFD is a dummy variable representingthe presence of IMF-supported programs inthree-year intervals within our sample period
WORLD DEVELOPMENT1144
(1972–2001). In each interval, IMFD takesvalue one if a country had a program in atleast two years and zero otherwise. (SeeAppendix A for data sources).The error terms in various equations are
correlated due to the restriction that the relativespending shares in the jth country at time tmust necessarily add up to or one (or 100% ofthe total). More formally, we have
X6
i¼1
Sijt ¼X6
i¼1
ai þX6
i¼1
biðRPCGNPÞjt
þX6
i¼1
ciðGEXGDPÞjt
þX6
i¼1
diðPPDGNPÞjt þX6
i¼1
giðDEFÞjt
þX6
i¼1
hiðSOEXÞjt þX6
i¼1
kiðECSÞjt
þX6
i¼1
/iðFINDXÞjt
þX6
i¼1
xiðIMFDÞjt þX6
j¼1
lijt ¼ 1 ð2Þ
Since the above equation must necessarily andidentically hold true for each annual observa-tion, it imposes the following restrictions on theparameters of the share equations:
X6
i¼1
bi ¼X6
i¼1
ci ¼X6
i¼1
di ¼X6
i¼1
gi ¼X6
i¼1
hi
¼X6
i¼1
ki ¼X6
i¼1
/i ¼X6
i¼1
xi ¼ 0 ð3aÞ
X6
i¼1
li ¼ 0; ð3bÞ
X6
i¼1
ai ¼ 1 ð3cÞ
According to restriction (3b), for the jthcountry in period t, underestimation of theshare of some spending categories (implyingpositive error terms) is associated with overes-timation of the remaining shares (implying anegative error terms). Therefore, the error-terms across the share equations are correlated.The relative share equations comprise a seem-ingly unrelated system of equations that can,under certain conditions, be more efficiently
estimated using the SURE estimation method(Zellner, 1962) than the ordinary least square(OLS). 18 In this connection, two technicalpoints need to be kept in mind: First, in asystem consisting of n equations only n� 1equations can be independently estimated due tothe system’s internal parameter restrictions.Second, the SURE and OLS methods yieldidentical parameter estimates in the special casethat an identical set of explanatory variables isincluded in all equations of the system.
3. DATA
We collected annual observations on thevariables of the model for a large number ofdeveloping countries over 1972–2001. Severalcountries had missing observations for at leastone year over the sample period. This wasparticularly true of the relative spending shares.To make the maximum use of available obser-vations, we divided the sample period into 10three-year intervals beginning with the year1972. For each interval, we calculated theaverage values of available annual observationsin that interval. 19 We then dropped countrieswhose relative spending shares did not add upto approximately 100% and/or did not havedata for at least two consecutive intervals. Ourfinal pooled data set is an unbalanced one,because not all the countries have observationsfor all the intervals. It consists of a total of 237country-interval observations from 47 devel-oping countries. These countries may be divi-ded into five regional groups as follows: CentralAmerica, South America, and the Caribbean(CSAMC, 13 countries), Asia (ASIA, ninecountries), sub-Saharan Africa (SSAF, 16countries), the Middle East and North Africa(MENA, six countries), and central Europe(CEURO, two countries). (See Appendix A forthe sample composition).
4. EMPIRICAL RESULTS
To take into account the (unobservable)country- and/or time-specific characteristics ofour pooled data set, we employ the followingspecifications in estimating our basic model.The fixed-effects model (FEM) assumes that
country- and/or time-specific effects (due to, forexample, institutional and historical factors ordifferences in data coverage and methodology)are fixed. It attempts to capture these effects
GOVERNMENT SPENDING AND EXTERNAL DEBT BURDEN 1145
that are responsible for the ‘‘individuality’’ ofcross-sectional units through a varying inter-cept term. If the fixed effects are assumed to betime invariant, then only country-specificdummy variables are included (‘‘one-way’’FEM or FEMONE model). But, if the fixedeffects are assumed to vary both across coun-tries and time periods, then the time perioddummies are also included (‘‘two-way’’ FEM,or FEMTWO model).Random-effects model (REM) is an alterna-
tive specification based on the assumption thatthe country- and/or time-specific influences arerandom. This assumption is justified if theobservations in the sample are drawings from amuch larger population. The random effects arecaptured by allowing the intercept term toinclude a constant mean and a random com-ponent. REM is an appropriate specification ifthe error component of the intercept term andregressors are uncorrelated. Furthermore, if thenumber of cross-sectional units is large andnumber of time-series observations is small, asin our sample, then REM estimators are moreefficient than FEM estimators. A one- or two-way version of REM (REMONE and REM-TWO, respectively) may be specified dependingon whether the random component is assumedto be country sensitive only or both countryand time sensitive. 20
(a) Debt burden and spending composition:full sample results
In Table 1 Panel A presents the estimationresults based on FEMONE specification andautocorrelation- and heteroskedasticity-consis-tent (Newy & West, 1987) standard errors. 21
The p-values associated with the F -test of jointsignificance of the country dummy variablesimply that country-specific effects matter inexplaining variations in all the relative spendingshares. This supports the choice of fixed-effectsmodels over simple pooled models estimated inmost previous studies. Furthermore, the valueof a diagnostic test suggested by Belsley et al.(1980) indicates that muliticollinearity amongthe variables does not seem to be seriousproblems. 22
In Panel A, the debt burden variable(PPDGNP) is positively and significantly rela-ted to the relative share of interest payment(INT), as one would expect. But, an increase inthe debt burden (through its direct and indirecteffects) is associated with a statistically signifi-cant shift in the composition of spending
against other (nonwage) goods and services(OGS) and capital expenditure (CEX). Theseresults imply that both capital accumulationand probably capital maintenance are adverselyaffected by an increase in the public debt bur-den. The debt burden is also significantlyassociated with a smaller share of subsidies andother current transfers (STR) and larger shareof the politically sensitive wages and salaries ofpublic sector employees (WGS). It thus hasmixed effects on expenditure categories that canmore directly affect welfare (poverty) in theshort term. 23
An examination of the statistically significantcoefficients of other (control) variables acrossthe six equations reveals that a rise in the levelof development (RPCGNP) redistributes sharesin favor of STR and INT and against OGS andCEX. These effects generally support thehypothesized changes in public spending com-position due to changes in the role of the publicsector in the course of development. At a giventhe level of development, an increase in therelative size of the public sector (GEXGDP)seems to significantly shift spending sharestoward STR and away from WGS and OGS.These results are broadly consistent withexpectations to the extent that a larger GE-XGDP can be taken as a proxy for a higherdegree of corruption, rent-seeking opportuni-ties, and exposure to external economic shocks.The coefficient of GEXGDP is positive butinsignificant in the INT equation implying thatthe share of interest payments on the publicdebt is independent of the size of the govern-ment in our sample.The functional categories of public spending
represented by DEF, SOEX, and ECS arecorrelated with the relative shares of the eco-nomic categories in ways that accord with priorexpectations. Specifically, as a functional cate-gory that is both labor- and goods-intensive anincrease in DEF raises both WGS and OGS.This comes at expense of lower INT and CEX.Note that the negative and relatively sizableimpact of defense spending on CEX is consis-tent with the findings of other studies suggest-ing that increased military spending slowsdown the rate of economic growth (See, forexample, Knight, Loayza, & Villanueva, 1995).The relatively more labor-intensive ‘‘socialexpenditure’’ category (SOEX) boosts WGSand STR as expected, but depresses INT andOTE. Finally, the relatively more capital-intensive functional category ECS significantlyincreases CEX and OTE at the expense of
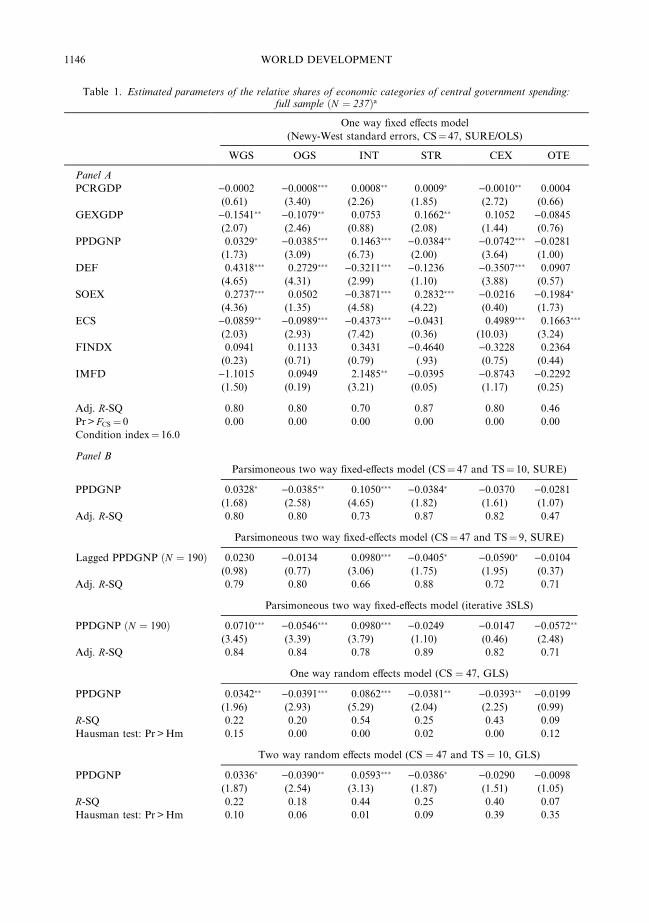
Table 1. Estimated parameters of the relative shares of economic categories of central government spending:full sample ðN ¼ 237Þa
One way fixed effects model
(Newy-West standard errors, CS¼ 47, SURE/OLS)
WGS OGS INT STR CEX OTE
Panel A
PCRGDP )0.0002 )0.0008��� 0.0008�� 0.0009� )0.0010�� 0.0004
(0.61) (3.40) (2.26) (1.85) (2.72) (0.66)
GEXGDP )0.1541�� )0.1079�� 0.0753 0.1662�� 0.1052 )0.0845(2.07) (2.46) (0.88) (2.08) (1.44) (0.76)
PPDGNP 0.0329� )0.0385��� 0.1463��� )0.0384�� )0.0742��� )0.0281(1.73) (3.09) (6.73) (2.00) (3.64) (1.00)
DEF 0.4318��� 0.2729��� )0.3211��� )0.1236 )0.3507��� 0.0907
(4.65) (4.31) (2.99) (1.10) (3.88) (0.57)
SOEX 0.2737��� 0.0502 )0.3871��� 0.2832��� )0.0216 )0.1984�
(4.36) (1.35) (4.58) (4.22) (0.40) (1.73)
ECS )0.0859�� )0.0989��� )0.4373��� )0.0431 0.4989��� 0.1663���
(2.03) (2.93) (7.42) (0.36) (10.03) (3.24)
FINDX 0.0941 0.1133 0.3431 )0.4640 )0.3228 0.2364
(0.23) (0.71) (0.79) (.93) (0.75) (0.44)
IMFD )1.1015 0.0949 2.1485�� )0.0395 )0.8743 )0.2292(1.50) (0.19) (3.21) (0.05) (1.17) (0.25)
Adj. R-SQ 0.80 0.80 0.70 0.87 0.80 0.46
Pr> FCS ¼ 0 0.00 0.00 0.00 0.00 0.00 0.00
Condition index¼ 16.0
Panel B
Parsimoneous two way fixed-effects model (CS¼ 47 and TS¼ 10, SURE)
PPDGNP 0.0328� )0.0385�� 0.1050��� )0.0384� )0.0370 )0.0281(1.68) (2.58) (4.65) (1.82) (1.61) (1.07)
Adj. R-SQ 0.80 0.80 0.73 0.87 0.82 0.47
Parsimoneous two way fixed-effects model (CS¼ 47 and TS¼ 9, SURE)
Lagged PPDGNP ðN ¼ 190Þ 0.0230 )0.0134 0.0980��� )0.0405� )0.0590� )0.0104(0.98) (0.77) (3.06) (1.75) (1.95) (0.37)
Adj. R-SQ 0.79 0.80 0.66 0.88 0.72 0.71
Parsimoneous two way fixed-effects model (iterative 3SLS)
PPDGNP ðN ¼ 190Þ 0.0710��� )0.0546��� 0.0980��� )0.0249 )0.0147 )0.0572��
(3.45) (3.39) (3.79) (1.10) (0.46) (2.48)
Adj. R-SQ 0.84 0.84 0.78 0.89 0.82 0.71
One way random effects model (CS ¼ 47, GLS)
PPDGNP 0.0342�� )0.0391��� 0.0862��� )0.0381�� )0.0393�� )0.0199(1.96) (2.93) (5.29) (2.04) (2.25) (0.99)
R-SQ 0.22 0.20 0.54 0.25 0.43 0.09
Hausman test: Pr>Hm 0.15 0.00 0.00 0.02 0.00 0.12
Two way random effects model (CS ¼ 47 and TS ¼ 10, GLS)
PPDGNP 0.0336� )0.0390�� 0.0593��� )0.0386� )0.0290 )0.0098(1.87) (2.54) (3.13) (1.87) (1.51) (1.05)
R-SQ 0.22 0.18 0.44 0.25 0.40 0.07
Hausman test: Pr>Hm 0.10 0.06 0.01 0.09 0.39 0.35
WORLD DEVELOPMENT1146
Table 1––continued
Notes: CS and TS refer to the ‘‘cross-sectional’’ and ‘‘time-series’’ units, respectively. Pr> FCS refer to the ‘‘p-value’’for the joint significance of all the variables of the model and cross-sectional dummy variables, respectively. Con-
dition index corresponds to the intercept-adjusted value of the multicollinearity diagnostic test suggested by Belsley,
Kuh, and Welsch (1980). Hm is the test statistic in the Hausman (1978) test. The rejection of the null hypothesis (low
p-value) suggests that the fixed-effects model may be more appropriate. Adjusted R-Sq values in the fixed-effects
models are from the first-stage estimations. Absolute value of the t-statistic in parentheses.a The Newy-West standard errors (Newy & West, 1987) are corrected for autocorrelation and heteroscedasticity.* Significant at the 10% level.** Significant at the 5% level.*** Significant at the 1% level.
GOVERNMENT SPENDING AND EXTERNAL DEBT BURDEN 1147
WGS, OGS, and INT. The coefficients of theFINDX variable are insignificant in all equa-tions. Finally, the presence of IMF-supportedprograms (as represented by IMFD) seems toonly boost INT in a statistically significantfashion. Interestingly enough, the sign ofIMFD in the equation for CEX is negative, butit does not pass the significance test at theconventional levels.Next, we re-estimate the share equations
using different specifications and/or estimationmethods. Due to space limitations, we onlyreport the results corresponding to the coeffi-cients of the debt burden in Panel B. 24 The firstset of results correspond to a ‘‘parsimonious’’version of FEMTWO in which the time dummyvariables are kept in an equation only if theyare jointly significant (the INT and CEXequations in this case). Since the set of theexplanatory variables in all the equations is notidentical, the OLS and SURE estimates of theequations are not the same. 25 As before, theburden of debt boosts WGS and INT andcrowds out the remaining categories; althoughnot significantly so in all the cases. In particu-lar, note that the addition of time-specific fixedeffects to the CEX equation renders the coeffi-cient of the debt burden variable insignificant.The use of contemporaneous values of the
explanatory variables in the spending shareequations may raise concerns regarding thepossibility of ‘‘reverse causality’’ or ‘‘bidirec-tional causality’’ in relation to some vari-ables. 26 Given the multiequation nature of ourmodel, these concerns can be satisfactorilyaddressed in the context of a fully simultaneousmodel. A less ambitious approach, however, isto re-specify the models in terms of the laggedvalues of the explanatory variables. In a laggedspecification, the possibility that results reflectreverse or bidirectional causalities can belargely ruled out. At the same time, the use of
lagged values provides an opportunity to assessthe delayed impact of the debt burden variable.The main disadvantage of a lagged specifica-tion, however, is the loss of a relatively largenumber of observations. The reported resultscorrespond to a parsimonious FEMTWOmodel using one-period lagged values of theexplanatory variables (the time dummy vari-ables turn out to be jointly significant in theequations for INT and OTE in this case).According to these results, the effect of laggedvalue of debt burden on INT is very similar tothe effect of its contemporaneous value. Inaddition, the lagged debt burden seems to havea significant depressing effect on STR andCEX, albeit at the 10% level of significance.Another complicating factor in assessing the
impact of the debt burden is the possible end-ogeneity of the variable RPCGDP. 27 A suit-able estimation technique in this situation is(iterative) 3SLS, for it combines the instru-mental-variable approach of 2SLS with SURE.Finding appropriate instruments, however, isnot a trivial task. For our purpose, we conser-vatively select the lagged values of the explan-atory variables and age dependency ratio(roughly defined as ‘‘young’’ plus ‘‘old’’ frac-tion of total population) as our instruments.We then re-estimate the parsimonious FEM-TWO while treating RPCGDP as an endoge-nous variable. As can be seen, the sign patternof the coefficients of the debt burden remainsunchanged. But, its quantitative impacts arenow significantly larger in the equations forWGS, OGS, and OTE and much smaller in theequation for INT.Finally, since our sample is small relative to
the size of the relevant universe, there is apossibility that the country- and/or periodspecific characteristics are random in nature.To test this possibility, we re-estimate thesystem of equations using REMONE and
WORLD DEVELOPMENT1148
REMTWO. The estimated coefficients for thedebt burden variable obtained from thesemodels are largely similar to those obtainedfrom FEM in terms of sign pattern and statis-tical significance. But, the results of a test sug-gested by Hausman (1978) indicate that, withthe exception of a few equations, REM cannotbe favored over FEM. This confirms our earlierobservation regarding the importance of thefixed effects.
(b) Debt burden and spending composition:subsample results
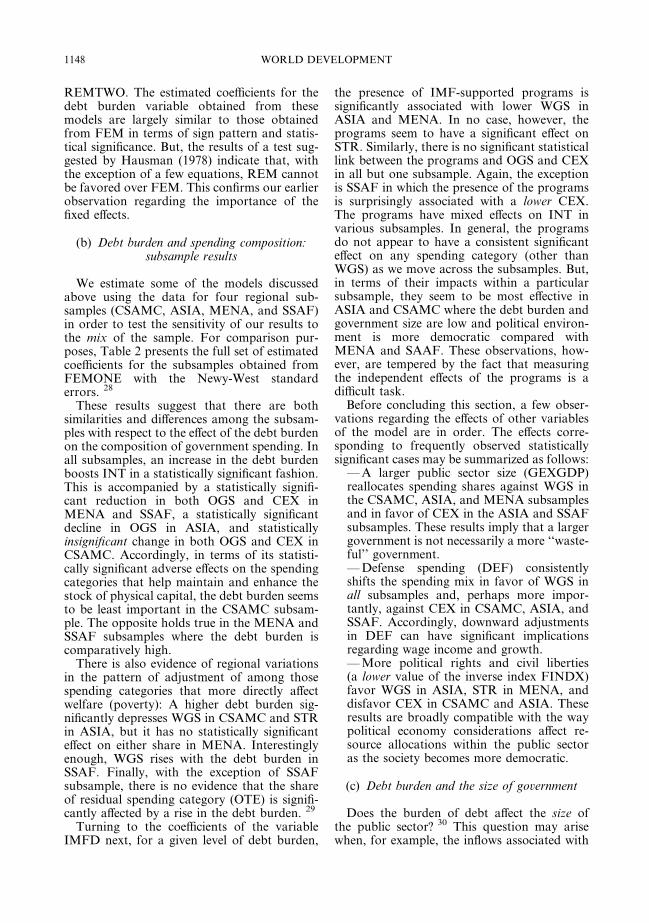
We estimate some of the models discussedabove using the data for four regional sub-samples (CSAMC, ASIA, MENA, and SSAF)in order to test the sensitivity of our results tothe mix of the sample. For comparison pur-poses, Table 2 presents the full set of estimatedcoefficients for the subsamples obtained fromFEMONE with the Newy-West standarderrors. 28
These results suggest that there are bothsimilarities and differences among the subsam-ples with respect to the effect of the debt burdenon the composition of government spending. Inall subsamples, an increase in the debt burdenboosts INT in a statistically significant fashion.This is accompanied by a statistically signifi-cant reduction in both OGS and CEX inMENA and SSAF, a statistically significantdecline in OGS in ASIA, and statisticallyinsignificant change in both OGS and CEX inCSAMC. Accordingly, in terms of its statisti-cally significant adverse effects on the spendingcategories that help maintain and enhance thestock of physical capital, the debt burden seemsto be least important in the CSAMC subsam-ple. The opposite holds true in the MENA andSSAF subsamples where the debt burden iscomparatively high.There is also evidence of regional variations
in the pattern of adjustment of among thosespending categories that more directly affectwelfare (poverty): A higher debt burden sig-nificantly depresses WGS in CSAMC and STRin ASIA, but it has no statistically significanteffect on either share in MENA. Interestinglyenough, WGS rises with the debt burden inSSAF. Finally, with the exception of SSAFsubsample, there is no evidence that the shareof residual spending category (OTE) is signifi-cantly affected by a rise in the debt burden. 29
Turning to the coefficients of the variableIMFD next, for a given level of debt burden,
the presence of IMF-supported programs issignificantly associated with lower WGS inASIA and MENA. In no case, however, theprograms seem to have a significant effect onSTR. Similarly, there is no significant statisticallink between the programs and OGS and CEXin all but one subsample. Again, the exceptionis SSAF in which the presence of the programsis surprisingly associated with a lower CEX.The programs have mixed effects on INT invarious subsamples. In general, the programsdo not appear to have a consistent significanteffect on any spending category (other thanWGS) as we move across the subsamples. But,in terms of their impacts within a particularsubsample, they seem to be most effective inASIA and CSAMC where the debt burden andgovernment size are low and political environ-ment is more democratic compared withMENA and SAAF. These observations, how-ever, are tempered by the fact that measuringthe independent effects of the programs is adifficult task.Before concluding this section, a few obser-
vations regarding the effects of other variablesof the model are in order. The effects corre-sponding to frequently observed statisticallysignificant cases may be summarized as follows:
––A larger public sector size (GEXGDP)reallocates spending shares against WGS inthe CSAMC, ASIA, and MENA subsamplesand in favor of CEX in the ASIA and SSAFsubsamples. These results imply that a largergovernment is not necessarily a more ‘‘waste-ful’’ government.––Defense spending (DEF) consistentlyshifts the spending mix in favor of WGS inall subsamples and, perhaps more impor-tantly, against CEX in CSAMC, ASIA, andSSAF. Accordingly, downward adjustmentsin DEF can have significant implicationsregarding wage income and growth.––More political rights and civil liberties(a lower value of the inverse index FINDX)favor WGS in ASIA, STR in MENA, anddisfavor CEX in CSAMC and ASIA. Theseresults are broadly compatible with the waypolitical economy considerations affect re-source allocations within the public sectoras the society becomes more democratic.
(c) Debt burden and the size of government
Does the burden of debt affect the size ofthe public sector? 30 This question may arisewhen, for example, the inflows associated with
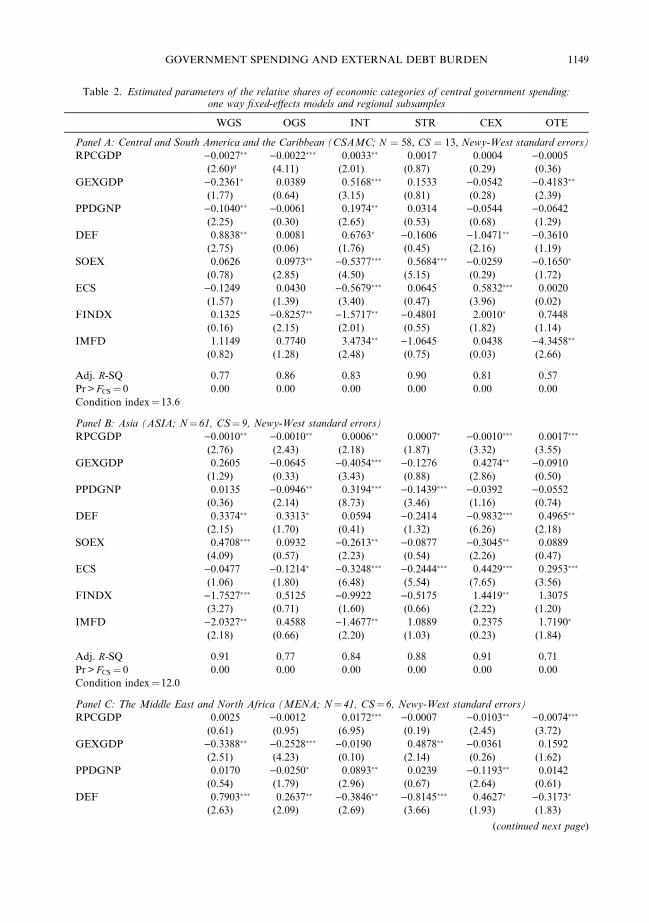
Table 2. Estimated parameters of the relative shares of economic categories of central government spending:one way fixed-effects models and regional subsamples
WGS OGS INT STR CEX OTE
Panel A: Central and South America and the Caribbean (CSAMC; N ¼ 58, CS ¼ 13, Newy-West standard errors)
RPCGDP )0.0027�� )0.0022��� 0.0033�� 0.0017 0.0004 )0.0005(2.60)a (4.11) (2.01) (0.87) (0.29) (0.36)
GEXGDP )0.2361� 0.0389 0.5168��� 0.1533 )0.0542 )0.4183��
(1.77) (0.64) (3.15) (0.81) (0.28) (2.39)
PPDGNP )0.1040�� )0.0061 0.1974�� 0.0314 )0.0544 )0.0642(2.25) (0.30) (2.65) (0.53) (0.68) (1.29)
DEF 0.8838�� 0.0081 0.6763� )0.1606 )1.0471�� )0.3610(2.75) (0.06) (1.76) (0.45) (2.16) (1.19)
SOEX 0.0626 0.0973�� )0.5377��� 0.5684��� )0.0259 )0.1650�
(0.78) (2.85) (4.50) (5.15) (0.29) (1.72)
ECS )0.1249 0.0430 )0.5679��� 0.0645 0.5832��� 0.0020
(1.57) (1.39) (3.40) (0.47) (3.96) (0.02)
FINDX 0.1325 )0.8257�� )1.5717�� )0.4801 2.0010� 0.7448
(0.16) (2.15) (2.01) (0.55) (1.82) (1.14)
IMFD 1.1149 0.7740 3.4734�� )1.0645 0.0438 )4.3458��
(0.82) (1.28) (2.48) (0.75) (0.03) (2.66)
Adj. R-SQ 0.77 0.86 0.83 0.90 0.81 0.57
Pr> FCS ¼ 0 0.00 0.00 0.00 0.00 0.00 0.00
Condition index¼ 13.6
Panel B: Asia (ASIA; N¼ 61, CS¼ 9, Newy-West standard errors)
RPCGDP )0.0010�� )0.0010�� 0.0006�� 0.0007� )0.0010��� 0.0017���
(2.76) (2.43) (2.18) (1.87) (3.32) (3.55)
GEXGDP 0.2605 )0.0645 )0.4054��� )0.1276 0.4274�� )0.0910(1.29) (0.33) (3.43) (0.88) (2.86) (0.50)
PPDGNP 0.0135 )0.0946�� 0.3194��� )0.1439��� )0.0392 )0.0552(0.36) (2.14) (8.73) (3.46) (1.16) (0.74)
DEF 0.3374�� 0.3313� 0.0594 )0.2414 )0.9832��� 0.4965��
(2.15) (1.70) (0.41) (1.32) (6.26) (2.18)
SOEX 0.4708��� 0.0932 )0.2613�� )0.0877 )0.3045�� 0.0889
(4.09) (0.57) (2.23) (0.54) (2.26) (0.47)
ECS )0.0477 )0.1214� )0.3248��� )0.2444��� 0.4429��� 0.2953���
(1.06) (1.80) (6.48) (5.54) (7.65) (3.56)
FINDX )1.7527��� 0.5125 )0.9922 )0.5175 1.4419�� 1.3075
(3.27) (0.71) (1.60) (0.66) (2.22) (1.20)
IMFD )2.0327�� 0.4588 )1.4677�� 1.0889 0.2375 1.7190�
(2.18) (0.66) (2.20) (1.03) (0.23) (1.84)
Adj. R-SQ 0.91 0.77 0.84 0.88 0.91 0.71
Pr> FCS ¼ 0 0.00 0.00 0.00 0.00 0.00 0.00
Condition index¼ 12.0
Panel C: The Middle East and North Africa (MENA; N¼ 41, CS¼ 6, Newy-West standard errors)
RPCGDP 0.0025 )0.0012 0.0172��� )0.0007 )0.0103�� )0.0074���
(0.61) (0.95) (6.95) (0.19) (2.45) (3.72)
GEXGDP )0.3388�� )0.2528��� )0.0190 0.4878�� )0.0361 0.1592
(2.51) (4.23) (0.10) (2.14) (0.26) (1.62)
PPDGNP 0.0170 )0.0250� 0.0893�� 0.0239 )0.1193�� 0.0142
(0.54) (1.79) (2.96) (0.67) (2.64) (0.61)
DEF 0.7903��� 0.2637�� )0.3846�� )0.8145��� 0.4627� )0.3173�
(2.63) (2.09) (2.69) (3.66) (1.93) (1.83)
(continued next page)
GOVERNMENT SPENDING AND EXTERNAL DEBT BURDEN 1149
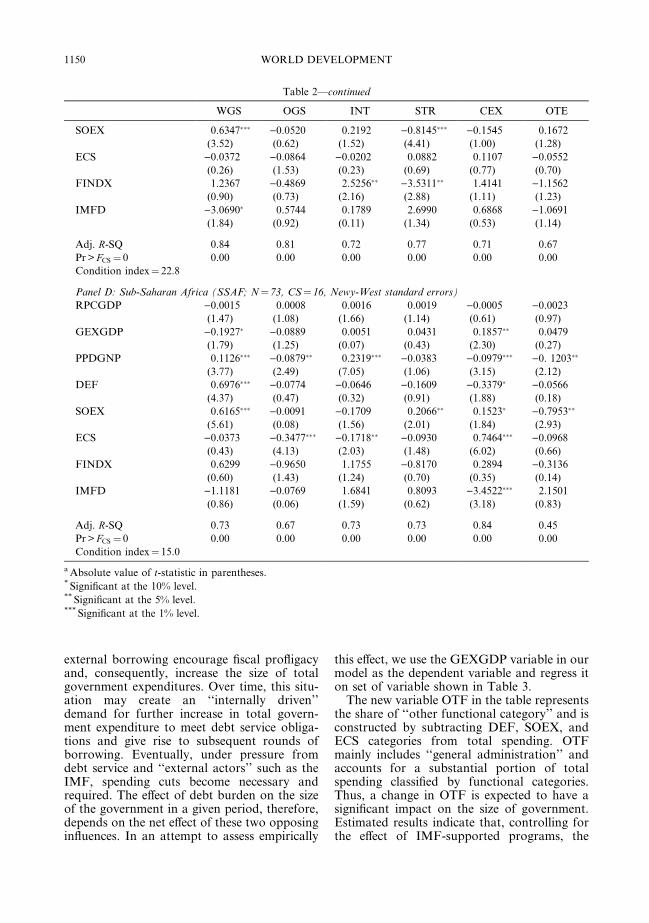
Table 2––continued
WGS OGS INT STR CEX OTE
SOEX 0.6347��� )0.0520 0.2192 )0.8145��� )0.1545 0.1672
(3.52) (0.62) (1.52) (4.41) (1.00) (1.28)
ECS )0.0372 )0.0864 )0.0202 0.0882 0.1107 )0.0552(0.26) (1.53) (0.23) (0.69) (0.77) (0.70)
FINDX 1.2367 )0.4869 2.5256�� )3.5311�� 1.4141 )1.1562(0.90) (0.73) (2.16) (2.88) (1.11) (1.23)
IMFD )3.0690� 0.5744 0.1789 2.6990 0.6868 )1.0691(1.84) (0.92) (0.11) (1.34) (0.53) (1.14)
Adj. R-SQ 0.84 0.81 0.72 0.77 0.71 0.67
Pr> FCS ¼ 0 0.00 0.00 0.00 0.00 0.00 0.00
Condition index¼ 22.8
Panel D: Sub-Saharan Africa (SSAF; N¼ 73, CS¼ 16, Newy-West standard errors)
RPCGDP )0.0015 0.0008 0.0016 0.0019 )0.0005 )0.0023(1.47) (1.08) (1.66) (1.14) (0.61) (0.97)
GEXGDP )0.1927� )0.0889 0.0051 0.0431 0.1857�� 0.0479
(1.79) (1.25) (0.07) (0.43) (2.30) (0.27)
PPDGNP 0.1126��� )0.0879�� 0.2319��� )0.0383 )0.0979��� )0. 1203��
(3.77) (2.49) (7.05) (1.06) (3.15) (2.12)
DEF 0.6976��� )0.0774 )0.0646 )0.1609 )0.3379� )0.0566(4.37) (0.47) (0.32) (0.91) (1.88) (0.18)
SOEX 0.6165��� )0.0091 )0.1709 0.2066�� 0.1523� )0.7953��
(5.61) (0.08) (1.56) (2.01) (1.84) (2.93)
ECS )0.0373 )0.3477��� )0.1718�� )0.0930 0.7464��� )0.0968(0.43) (4.13) (2.03) (1.48) (6.02) (0.66)
FINDX 0.6299 )0.9650 1.1755 )0.8170 0.2894 )0.3136(0.60) (1.43) (1.24) (0.70) (0.35) (0.14)
IMFD )1.1181 )0.0769 1.6841 0.8093 )3.4522��� 2.1501
(0.86) (0.06) (1.59) (0.62) (3.18) (0.83)
Adj. R-SQ 0.73 0.67 0.73 0.73 0.84 0.45
Pr> FCS ¼ 0 0.00 0.00 0.00 0.00 0.00 0.00
Condition index¼ 15.0
aAbsolute value of t-statistic in parentheses.* Significant at the 10% level.** Significant at the 5% level.*** Significant at the 1% level.
WORLD DEVELOPMENT1150
external borrowing encourage fiscal profligacyand, consequently, increase the size of totalgovernment expenditures. Over time, this situ-ation may create an ‘‘internally driven’’demand for further increase in total govern-ment expenditure to meet debt service obliga-tions and give rise to subsequent rounds ofborrowing. Eventually, under pressure fromdebt service and ‘‘external actors’’ such as theIMF, spending cuts become necessary andrequired. The effect of debt burden on the sizeof the government in a given period, therefore,depends on the net effect of these two opposinginfluences. In an attempt to assess empirically
this effect, we use the GEXGDP variable in ourmodel as the dependent variable and regress iton set of variable shown in Table 3.The new variable OTF in the table represents
the share of ‘‘other functional category’’ and isconstructed by subtracting DEF, SOEX, andECS categories from total spending. OTFmainly includes ‘‘general administration’’ andaccounts for a substantial portion of totalspending classified by functional categories.Thus, a change in OTF is expected to have asignificant impact on the size of government.Estimated results indicate that, controlling forthe effect of IMF-supported programs, the
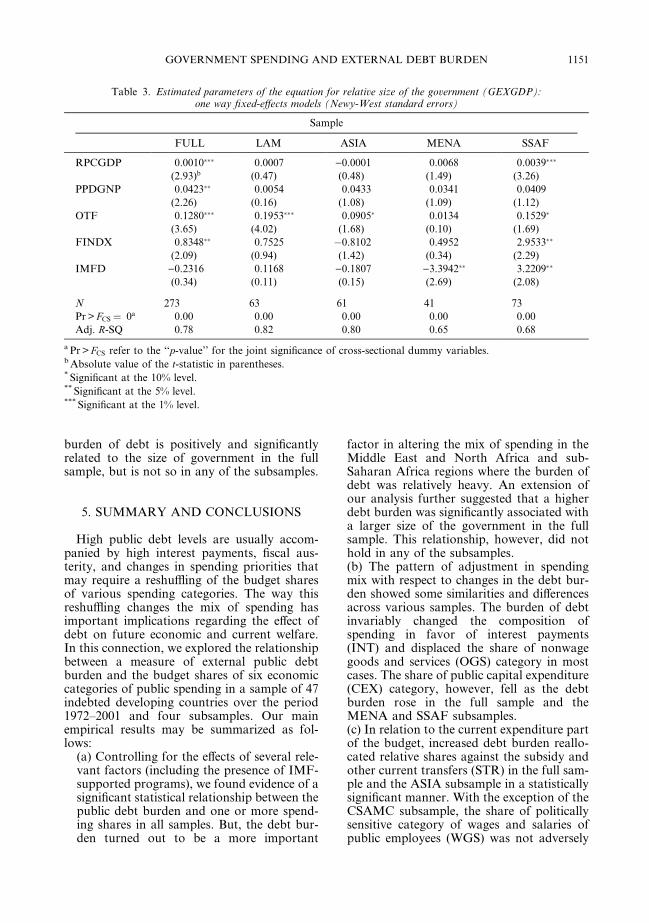
Table 3. Estimated parameters of the equation for relative size of the government (GEXGDP):one way fixed-effects models (Newy-West standard errors)
Sample
FULL LAM ASIA MENA SSAF
RPCGDP 0.0010��� 0.0007 )0.0001 0.0068 0.0039���
(2.93)b (0.47) (0.48) (1.49) (3.26)
PPDGNP 0.0423�� 0.0054 0.0433 0.0341 0.0409
(2.26) (0.16) (1.08) (1.09) (1.12)
OTF 0.1280��� 0.1953��� 0.0905� 0.0134 0.1529�
(3.65) (4.02) (1.68) (0.10) (1.69)
FINDX 0.8348�� 0.7525 �0.8102 0.4952 2.9533��
(2.09) (0.94) (1.42) (0.34) (2.29)
IMFD )0.2316 0.1168 )0.1807 )3.3942�� 3.2209��
(0.34) (0.11) (0.15) (2.69) (2.08)
N 273 63 61 41 73
Pr> FCS ¼ 0a 0.00 0.00 0.00 0.00 0.00
Adj. R-SQ 0.78 0.82 0.80 0.65 0.68
a Pr> FCS refer to the ‘‘p-value’’ for the joint significance of cross-sectional dummy variables.bAbsolute value of the t-statistic in parentheses.* Significant at the 10% level.** Significant at the 5% level.*** Significant at the 1% level.
GOVERNMENT SPENDING AND EXTERNAL DEBT BURDEN 1151
burden of debt is positively and significantlyrelated to the size of government in the fullsample, but is not so in any of the subsamples.
5. SUMMARY AND CONCLUSIONS
High public debt levels are usually accom-panied by high interest payments, fiscal aus-terity, and changes in spending priorities thatmay require a reshuffling of the budget sharesof various spending categories. The way thisreshuffling changes the mix of spending hasimportant implications regarding the effect ofdebt on future economic and current welfare.In this connection, we explored the relationshipbetween a measure of external public debtburden and the budget shares of six economiccategories of public spending in a sample of 47indebted developing countries over the period1972–2001 and four subsamples. Our mainempirical results may be summarized as fol-lows:
(a) Controlling for the effects of several rele-vant factors (including the presence of IMF-supported programs), we found evidence of asignificant statistical relationship between thepublic debt burden and one or more spend-ing shares in all samples. But, the debt bur-den turned out to be a more important
factor in altering the mix of spending in theMiddle East and North Africa and sub-Saharan Africa regions where the burden ofdebt was relatively heavy. An extension ofour analysis further suggested that a higherdebt burden was significantly associated witha larger size of the government in the fullsample. This relationship, however, did nothold in any of the subsamples.(b) The pattern of adjustment in spendingmix with respect to changes in the debt bur-den showed some similarities and differencesacross various samples. The burden of debtinvariably changed the composition ofspending in favor of interest payments(INT) and displaced the share of nonwagegoods and services (OGS) category in mostcases. The share of public capital expenditure(CEX) category, however, fell as the debtburden rose in the full sample and theMENA and SSAF subsamples.(c) In relation to the current expenditure partof the budget, increased debt burden reallo-cated relative shares against the subsidy andother current transfers (STR) in the full sam-ple and the ASIA subsample in a statisticallysignificant manner. With the exception of theCSAMC subsample, the share of politicallysensitive category of wages and salaries ofpublic employees (WGS) was not adversely
WORLD DEVELOPMENT1152
affected by the debt burden. In fact, the pub-lic debt burden had a significant positive im-pact on this category in the full sample andthe SSAF subsample.Two composite pictures seem to emerge
based on the frequency of statistically signifi-cant coefficients of the debt burden in variousequations and samples: (i) Among the relativeshares, the share of nonwage goods and serviceswas the least protected category from directand indirect effects of the debt burden, whilethe share of wages and salaries was well shel-tered. (ii) Among the subsamples, the patternadjustment in the spending shares in the SSAFsubsample was most favorable toward shelter-ing current expenditures (mainly wages andsubsidies) and against spending that raise andmaintain physical capital stock. These obser-vations perhaps reflect relatively lower politicalcosts of shifting the burden of debt relatedadjustments to a spending category whosebenefits are less direct and concentrated, andhigher priorities attached to sheltering directsources of current income and consumptionespecially where they are low to begin with.The implications of our results regarding
debt relief initiatives and reorientation of themix of public spending crucially depend on the
extent to which each of the aggregate spendingcategories can be considered as ‘‘productive.’’ Ifone simply considers WGS and STR as(mainly) ‘‘unproductive’’ and OGS and CEX as(mainly) ‘‘productive’’ spending categories,then fiscal reforms that reorient spending mixaway from the former and toward the lattercategories would be desirable especially in theMENA and SSAF regions. In this case, debtrelief initiatives that tie debt reductions to suchreforms should raise growth. 31 The implica-tions of our results may however, be lessstraightforward in view of the findings of sev-eral recent studies suggesting that, dependingon a number of factors, increases in somecomponents of current expenditure may pro-mote growth while further capital expendituremay actually retard it. 32 If so, changes in thedistribution of shares within the currentexpenditure portion of total spending matter;for they affect not only the current welfare(poverty) of different groups but also the long-term growth. Therefore, especially in low-income countries, it is even more imperative toadopt a careful and selective approach to cut-ting components of current expenditure as acondition for debt relief during periods of fiscalretrenchment.
NOTES
1. Capital flight may also encourage external borrow-
ing through a phenomenon known as ‘‘back-to-back
loans’’ or ‘‘round tripping.’’ This channel is referred to
as ‘‘flight-fueled external borrowing.’’ See Ndikumana
and Boyce (2003) for a discussion of these terms and the
interaction between capital flight and external debt.
2. This contention seems to be supported by an IMF
staff finding (IMF, 2002) based on a review of fiscal
adjustment programs. Evidence presented by Bulir and
Moon (2003)––based on their formal analysis of data for
a sample of 112 countries (with and without IMF-
supported programs) in the 1990s––also underscores the
role of spending adjustment. The authors conclude that
‘‘In nonprogram countries, revenue increased modestly
and expenditure declined sharply, while in program
countries both revenue and expenditure declined. More-
over, in IMF-supported programs that included struc-
tural conditions, the adjustment was effected primarily
through sharp expenditure compression in order to offset
revenue declines.’’ (p. 3).
3. See Turnovsky and Fisher (1995) and Devarajan,
Swaroop, and Zou (1996) for discussions of some of the
parameters that determine the growth and welfare effects
of the composition of public expenditure in the context
of formal theoretical models.
4. The economic categories are classified based on the
economic characteristic or type of spending (for exam-
ple, wages and salaries). The functional categories,
however, are classified based on the purpose of spending
(for example, education).
5. For example, Adedeji (1999), a former UN Under-
Secretary, observed in relation to African countries that
‘‘so severe has been the burden of debt on ordinary
people in debt-distressed countries, that its destructive
impact is comparable to war.’’ (p. 526). An IMF official,
on the other hand, contended that ‘‘the IMF’s critics are
patently wrong when they claim that IMF programs
forces countries to cut spending on social programs’’
(Larsen, 2001, p. 56). See also the IMF (2002) for a
GOVERNMENT SPENDING AND EXTERNAL DEBT BURDEN 1153
summary of external comments and criticisms of
the programs by the IMF’s Independent Evaluation
Office.
6. Devarajan et al. (1996), Odedokun (2001) and
Gupta, Clements, Baldacci, and Mulas-Granados
(2002a), for example, conducted an empirical analysis
of the link between public spending composition (as
represented by relative spending shares) and per capita
income growth rate in pooled samples of developing
countries. Kweka and Morrissey (1999) examined this
link in Tanzania. With the exception of Gupta et al.
(2002a), all of these studies reported counterintuitive
evidence that increased capital expenditure was associ-
ated with lower growth rate. Chowdhury (2001), Dijk-
stra and Hermes (2001), and Pattillo, Poirson, and Ricci
(2002), on the other hand, investigated the impact of
external debt on economic growth in (heavily) indebted
developing countries and found it to be negative.
Hermes and Lensink (2001) explored the existence of a
nonlinear relationship between various fiscal variables
(including spending composition) and private invest-
ment. Were (2001) found that external debt had negative
effects on growth and private investment in Kenya.
Finally, Loko, Malchila, Nallari, and Kalonji (2003)
found that the debt burden contributed to some nonin-
come indicators of poverty.
7. Heller and Diamond (1990, Table 6), on the other
hand, specified the equations for various economic
categories (as a percentage of GDP) and estimated them
using the OLS method without fixed effects. They
included the debt variable in the equation for ‘‘interest
payments’’ only. They inferred shifts in spending prior-
ities by calculating the ratio of the actual value of a
category to its predicated value obtained from the
corresponding regression equation.
8. Technically speaking, public services that are
income elastic are expected to grow faster than those
that are income inelastic. The relationship between the
level of development and the size of the public sector or,
for that matter, the budget shares of various economic
categories is likely to be nonlinear over the entire range
of the measure of development.
9. As it is often the case in studies of this kind, the
choice of variables is dictated by data availability. In
particular, it would have been desirable to include a
direct measure of corruption in the model. But, the data
on two popular corruption measures––published by
International Country Risk Guide and Transparency
International––are available from 1985 and 1995 on,
respectively. This covers only part of our sample
period.
10. In this connection, Odedokun (2001) noted that:
‘‘Corrupt practices and other rent-seeking vices are
likely to be more characteristic of supply of goods and
services to the government sector (particularly, in typical
cases, where government procurement as well as custody
or storage procedure are weak) than in the case of
payment of wages and salaries’’ (p. 12). Also, Tanzi and
Davoodi (2003) found evidence that corruption leads to
allocation in favor of less productive investment projects
and against nonwage operation and maintenance expen-
ditures.
11. The uncertainty and poorer macroeconomic policy
environment accompanying a heavy debt burden may
also discourage private investment as individual investors
adopt a ‘‘wait-and-see’’ attitude. (See Serven & Soli-
mano, 1993 for empirical evidence.) The link between
private investment and public spending composition,
however, is indirect as it depends on the way depressed
private investment affect employment and economic
activity.
12. The functional spending categories may also pick
up the influence of certain long-term changes (i.e., those
in the structures of the economy’s output and labor
force, the age composition of the population, and the
distribution of population between urban centers and
rural areas) to the extent that they are not captured by
other variables included in the model. Similarly, since
the functional category of military/defense spending, in
particular, has been shown to have strong positive
correlation with the level of corruption (see, for
example, Gupta, de Mello, & Sharan, 2001), its
inclusion provide another channel for the effect of
corruption on the composition of economic categories
of spending.
13. In fact, the simple correlation coefficient between
the extent of civil liberties and the degree of corruption is
negative and relatively large in a few recent years for
which the data on both variables were available.
14. This reflects a tendency on the part of politicians
and public-sector decision makers to favor allocation of
more resources to categories that provide tangible short-
term benefits to politically powerful special interest
groups. Autocratic and unpopular regimes may also
adopt this pattern of budget allocation in order to secure
their political power base and/or placate certain socio-
economic groups in the society. On the other hand, as
the experience of some Asian countries indicates, rela-
tively stable authoritarian regimes whose elites are
perceived as trustees of national interests may pursue a
growth-oriented budget allocation. Authoritarian
regimes of this type can politically afford to be less
WORLD DEVELOPMENT1154
sensitive to the short-term political costs associated with,
for example, public sector downsizing.
15. According to Gupta et al. (2002b) ‘‘Under reform
programs supported by the IMF’s PRGF, physical
capital expenditures are targeted to rise, on average, by
3/4 of 1 percentage point of GDP.’’ (p. 9).
16. Ivanova, Mayer, Mourmouras, and Anayiotos
(2003) identify some of these factors as initial domestic
and external economic conditions, IMF effort, IMF
conditionality, and political conditions in program
countries. They find that the domestic political economy
conditions as the primary influence on program imple-
mentation.
17. The bulk of data on spending shares are available
at the central level of government. For a relatively small
number of countries in our sample spending by state
and local levels of government is rather significant. In
these cases, the central government spending mix may
differ from the mix at the general government level. The
effects of this heterogeneity on our results may be
mitigated by the use of fixed-effects models discussed
later.
18. The SURE estimation method increases efficiency
by incorporating the crosscorrelation of the error terms
into the estimation procedure. The OLS estimates,
although less efficient, are still unbiased and consistent.
19. The use of average values has several desirable by
products: It reduces the impact of cyclical factors on the
values of the variables, the number of degrees of
freedom lost in estimating fixed-effects models with time
dummy variables, and the degree of autocorrelation of
the residuals.
20. See Gujarati (2003, Chapter 16) for more details.
The estimation method in REM is an estimated
generalized least squares (EGLS) procedure that
involves estimating the variance components in the first
stage and using the estimated variance covariance matrix
thus obtained to apply generalized least squares (GLS)
to the data.
21. The coefficients of the dummy variables (or ‘‘dif-
ferential intercept dummies’’) are not reported here. To
avoid the ‘‘dummy-variable trap,’’ one country (and one
period in the two-way models) had to be excluded.
22. The multicollinearity diagnostic test is based on the
‘‘intercept-adjusted’’ values of the ‘‘condition number.’’
An index value of about 30 is usually considered as
indication of serious multicollinearity problem (See
Belsley et al., 1980).
23. Two points regarding the coefficients of the debt
variable are worth emphasizing. (a) The effects of
PPDGNP onWGS and STR imply different adjustments
than those reported by Hicks (1989) and Heller and
Diamond (1990). (b) Based on the size of ‘‘standardized
beta’’ coefficients (STB), the impact of PPDGNP is the
largest on INT ðSTB ¼ 0:55Þ and the smallest on STR
ðSTB ¼ �0:09Þ. Compared with other variables of the
model the debt variable does fairly well: It ranks among
the largest four in each of the six equations in terms of
the absolute size of its STB.
24. The coefficients of the remaining variables are
fairly similar to those reported in Panel A, especially in
terms of their sign patterns. Complete results are
available from the author upon request.
25. Note that the Newy-West standard errors cannot
be computed in models with the time dummy variables.
26. For example, a referee pointed out that this might
be the case in the relationship between INT and
PPDGDP, because the need to pay interest on out-
standing debt may induce new borrowings. In this
connection, it is worth noting that our debt measure is
based on the long-term debt stock, but loans to cover
interest payments are typically short term.
27. We are aware of the fact that other variables of the
model may be potentially endogenous, for truly ‘‘exo-
genous’’ variables are rare at high levels of data
aggregation.
28. It should be pointed out that the time dummy
variables were statistically insignificant in most equa-
tions and regions. Furthermore, we did not attempt to
estimate models that involved lagged values, because the
some subsamples were too small to yield reasonably
reliable parameter estimates and test statistics that are
asymptotically valid. The random-effects model results a
generally similar to those reported in Table 2 in terms of
the sign patterns and statistically significant coefficients.
These results are available upon request.
29. Quantitatively, the STB of the debt variable is the
largest in the INT equation in all the subsamples. It
ranks high in more equations in the SSAF subsample
than in other subsamples.
30. This discussion is based on comments by a
referee.
GOVERNMENT SPENDING AND EXTERNAL DEBT BURDEN 1155
31. The results of a study by Gupta et al. (2002a) seem
to be compatible with this view. According to these
results a higher public wage bill (both as a percentage of
GDP and total public expenditure) retarded economic
growth while higher public expenditures on capital and
nonwage goods and service (both as a percentage of
GDP and total public expenditure) promoted it.
32. Devarajan et al. (1996) found that while an increase
in the current expenditure sharewas pro growth an increase
in the share of capital expenditure retarded growth. The
authors explained their surprising findings by noting that:
‘‘because they are squeezed by capital spending, current
expenditures are actually productive at the margin.’’ (p.
339). Hermes and Lensink (2001), presented evidence
indicating that the shares in GDP of wage and capital
expenditure categories were related to private investment
(as a percentage of GDP) in a nonlinear fashion (inverted-
U curve andU-curve, respectively). They interpreted their
results by suggesting that an increase in the size of civil
servants, up to a point, can increase efficiency with which
public services are offered and a minimum level of public
capital expenditures is required before they can help
private investment through positive externalities. In addi-
tion, Odedokun (2001) found that wages and salaries of
public employees and subsidies and transfers positively
affected growth (in low-income and/or aid receiving
countries), while public capital expenditure and spending
on nonwage goods and services had a detrimental impact
on it (especially in mineral-exporting countries). They
attributed these results to the impact of rent-seeking
syndrome on productivity of spending.
REFERENCES
Adedeji, A. (1999). Structural adjustment policies inAfrica. Paris: UNESCO.
Annett, A. (2001). Social fractionalization, politicalinstability, and the size of government. IMF StaffPapers, 48(3), 561–592.
Belsley, D. A., Kuh, E., & Welsch, R. E. (1980).Regression diagnostics: identifying influential data andsources of collinearity. New York: John Wiley andSons.
Buchanan, J. M., & Tullock, G. (1962). The calculus ofconsent: logical foundations of a democracy. AnnArbor: University of Michigan Press.
Bulir, A., & Moon, S. (2003). Do IMF-supportedprograms help make fiscal policy more durable?IMF working paper 38. International MonetaryFund, Washington, DC.
Chowdhury, A. R. (2001). External debt and growth indeveloping countries: A sensitivity and causal anal-ysis. Discussion paper 95. World Institute forDevelopment Economics Research (WIDER), Uni-ted Nations University, Helsinki.
Devarajan, S., Swaroop, V., & Zou, H. (1996). Thecomposition of public expenditure and economicgrowth. Journal of Monetary Economics (37), 313–344.
Dijkstra, G., & Hermes, N. (2001). The uncertainty ofdebt service payments and economic growth ofHIPCs: Is there a case for debt relief? Discussionpaper 122. World Institute for Development Eco-nomics Research (WIDER), United Nations Univer-sity, Helsinki.
Goel, R. K., & Nelson, M. A. (1998). Corruption andgovernment size: a disaggregated analysis. PublicChoice, 97(1–2), 107–120.
Gujarati, D. N. (2003). Basic econometrics (4th ed.).New York: McGraw Hill.
Gupta, S., Clements, B., McDonald, C., & Schiller, C.(1998). The IMF and the poor. IMF pamphlet series52. International Monetary Fund, Washington, DC.
Gupta, S., de Mello, L., & Sharan, R. (2001). Corrup-tion and military spending. European Journal ofPolitical Economy, 17, 749–777.
Gupta, S., Clements, B., Baldacci, E., & Mulas-Grana-dos, C. (2002a). Expenditure composition, fiscaladjustment, and growth in low-income countries.IMF working papers 77. International MonetaryFund, Washington, DC.
Gupta, S., Keen, M., Clements, B., Feletcher, K., deMello, L., & Mani, M. (2002b). Fiscal dimensions ofsustainable development. Pamphlet series 54. Inter-national Monetary Fund, Washington, DC.
Habibi, N. (1994). Budgetary policy and political liberty:A cross-sectional analysis.World Development, 22(4),579–586.
Hausman, J. A. (1978). Specification tests in economet-rics. Econometrica, 46, 1251–1271.
Heller, P. S., & Diamond, J. (1990). Internationalcomparisons of government expenditure revisited:The developing countries, 1975–86. Occasionalpaper 69. International Monetary Fund, Washing-ton, DC.
Hermes, N., & Lensink, R. (2001). Fiscal policy andprivate investment in less developed countries. Dis-cussion paper 32, World Institute for DevelopmentEconomics Research (WIDER), United NationsUniversity, Helsinki.
Hicks, N. L. (1989). Expenditure reductions in high-debtcountries. Finance and Development, 26, 35–37.
Hicks, N. L., & Kubisch, A. (1984). Recent experience incutting government expenditures. Finance and Devel-opment, 21, 37–39.
IMF (1997). Reducing unproductive expenditures isimportant for fiscal adjustment. IMF survey, pp. 49–50.
IMF (Independent Evaluation Office) (2002). Fiscaladjustment in IMF-supported programs. Pamphletseries, International Monetary Fund, Washington,DC.
WORLD DEVELOPMENT1156
Ivanova, A., Mayer, W., Mourmouras, A. T., &Anayiotos, G. C. (2003). What determines theimplementation of IMF-supported programs? IMFworking paper 8. International Monetary Fund,Washington, DC.
Knight, M., Loayza, N., & Villanueva, D. (1995). Thepeace dividend: military spending cuts and economicgrowth. IMF working paper 53-EA. InternationalMonetary Fund, Washington, DC.
Krugman, P. (1988). Financing versus forgiving debtoverhang. Journal of Development Economics, 29,253–268.
Kweka, J. P., & Morrissey, O. (1999). Governmentspending and economic growth: empirical evidence fromTanzania (1965–1996), University of Bath, Bath.
Larsen, F. (2001). The IMF’s dialogue with nongovern-mental organizations. Finance and Development, 38,54–56.
Loko, B., Malchila, M., Nallari, R., & Kalonji, K.(2003). The impact of external indebtedness onpoverty in low-income countries. IMF workingpaper 61. International Monetary Fund, Washing-ton, DC.
Milesi-Ferretti, G. M., Perotti, R., & Rostagno, M.(2001). Electoral systems and public spending. IMFworking paper 22. International Monetary Fund,Washington, DC.
Ndikumana, L., & Boyce, J. (2003). Public debts andprivate assets: Explaining capital flights from sub-Saharan African countries. World Development,31(1), 107–130.
Newy, W. K., & West, K. (1987). A simple positive semi-definite heteroscedasticity and autocorrelation con-sistent covariance matrix. Econometrica, 55, 703–708.
Odedokun, M. O. (2001). Public finance and economicgrowth: empirical evidence from developing coun-tries. Discussion paper 72. World Institute forDevelopment Economics Research (WIDER), Uni-ted Nations University.
Papagapitos, A. (1992). The effects of stabilizationprograms on the composition of public expenditure indeveloping countries: 1972–1988. Unpublished doc-toral dissertation, The Ohio State University, Ohio.
Pattillo, C., Poirson, H., & Ricci, L. (2002). Externaldebt and growth. IMF working paper 69. Interna-tional Monetary Fund, Washington, DC.
Rodrik, D. (1996). Why do more open economies havebigger governments? NBER working paper 5537.National Bureau of Economic Research, Cambridge,MA.
Serven, L., & Solimano, A. (1993). Debt crisis, adjust-ment policies and capital formation in developingcountries: Where do we stand? World Development,21, 127–140.
Tanzi, V., & Davoodi, H. R. (2003). Corruption, publicinvestment and growth. In G. T. Abed & S. Gupta(Eds.), Governance, corruption and economic perfor-mance. Washington, DC: International Monetary Fund.
Turnovsky, S. J., & Fisher, W. H. (1995). The compo-sition of government expenditure and its conse-quences for macroeconomic performance. Journal ofEconomic Dynamics and Control, 19, 747–786.
Wagner, A. (1883/1953). Finazwissenschaft (Liepzig:Part I, 3rd ed.). In R. A. Musgrave & A. T. Peacok(Eds.), Classics in theory of public finance. Londonand New York: Macmillan.
Were, M. (2001). The impact of external debt oneconomic growth in Kenya: An empirical assess-ment. Discussion paper 116. World Institute forDevelopment Economics Research (WIDER), Uni-ted Nations University.
Woodward, D. (1992). Debt, adjustment and poverty indeveloping countries: Vol. II (Chapter 5). London:Printer Publishers.
Zellner, A. (1962). An efficient method of estimatingseemingly unrelated regressions and tests for aggre-gation bias. Journal of the American StatisticalAssociation, 57, 348–368.
UNDP (2002). Human development report. New York:UNDP.
APPENDIX A. DATA
A.1. Data sources
––Economic and functional categories ofpublic expenditure: Government Finance Sta-tistics Yearbook (International MonetaryFund, Washington, DC, various years).––Real per capita GNP and the age depen-dency ratio: World Development Indicators(World Bank, Washington, CD-ROM).––Public and publicly guaranteed long-termdebt to GNP ratio: World Debt Tables(World Bank, Washington, DC, variousyears).––Civil liberties and political rights indexes:Annual Survey of Freedom Country Ratings,1972–73 to 1999–2000 (Freedom House,www.freedomhouse.org).––IMF-supported programs dummy vari-able (IMFD): Constructed by the authorbased on a data file provided by Ales Bulir.
A.2. The sample
The full sample consists of 47 countries thatare divided into the following five subsamples:
(a) Sub-Saharan Africa (SSAF, n ¼ 16):Benin�� (0.5), Botswana (5.1), Burundi��
()0.7), Cameroon� ()0.6), Gambia�� ()0.3),Ghana�� (0.1), Kenya�� (0.4), Mali�� ()0.5),Mauritius� (4.1), Malawi�� (0.2), Nigeria�
()0.7), Niger�� ()2.1), Sierra Leone��
()2.6), Togo�� ()1.2), Zambia� ()2.3), andZimbabwe�� (0.3).
GOVERNMENT SPENDING AND EXTERNAL DEBT BURDEN 1157
(b) Asia (ASIA, n ¼ 9): Fiji (0.7), India�
(3.2), Indonesia� (4.4), Korean Republic�
(6.2), Pakistan�� (2.8), the Philippines�
(0.1), Papua New Guinea� (0.5), Sri Lanka�
(3.2), and Thailand� (5.5).(c) Central America, South America, andCaribbean (CSAMC, n ¼ 14): Argentina�
(0.4), Bolivia�� ()0.5), Brazil� (0.8), Chile�
(4.1), Colombia� (1.6), Costa Rica� (1.1),Dominican Republic� (1.7), Ecuador� (0.2),Guyana�� (0.3), Jamaica� (0.5), Mexico�
(0.9), Panama� (0.8), Uruguay� (1.4), andVenezuela� ()0.9).(d) The Middle East and North Africa(MENA, n ¼ 6): Egypt� (2.9), Jordan�
(0.4), Morocco� (1.3), Tunisia� (2.0), Tur-key� (2.1), and Yemen� ()0.4).(e) Central Europe (CEURO, n ¼ 2): Bul-garia� ()0.2) and Hungry� (0.9).
Countries whose names appear in bold italicare currently classified by the World Bank as‘‘Heavily Indebted Poor Countries,’’ or HIPCs.An � after a country’s name indicates thepresence of IMF-supported programs in thecountry during some intervals over the sampleperiod (1972–2001). A �� indicates that that thecountry had IMF-supported programs andreceived long-term loans on concessional termsunder the IMF’s (Enhanced) StructuralAdjustment Facility (ESAF/SAF). (Source:Gupta, Clements, McDonald, & Schiller, 1998,Tables 1 and 2). The figure in parentheses is therate of growth of per capita GDP over theperiod 1975–2000 (source: Human Develop-ment Report, UNDP, 2002).