Embed Size (px)
Citation preview

SHIFTING FOCUSTo
MARMATO’s UNDERGROUNDMINING POTENTIAL
November 2017

2

3
MARMATO GOLD DEPOSITProperty Location
La Maruja mine operated by Mineros Nacionales
Caldas Dept.
4
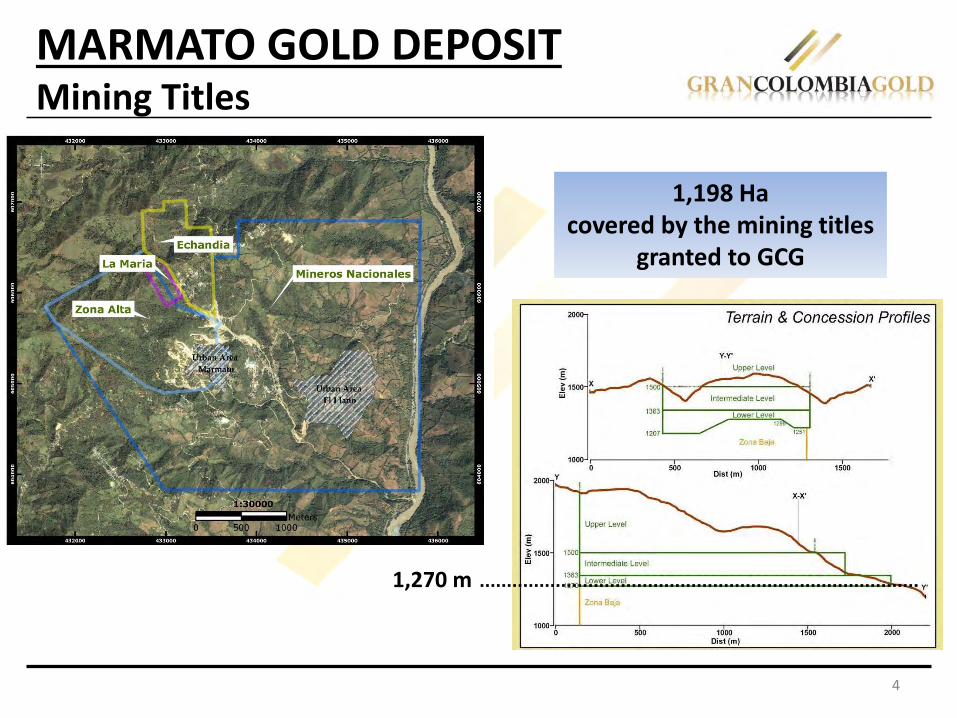
1,198 Hacovered by the mining titles
granted to GCG
MARMATO GOLD DEPOSITMining Titles
1,270 m

5
Mineros Nacionales
Cerro El Burro
Cien Pesos
Echandía
Pantano Creek
1,270 m
MARMATO GOLD DEPOSITPanoramic View

6
❖ There are no published records of the historical and actual gold and silver production.
❖ Historical research in archives was carried out, which allowed to obtain recovered gold production data for six incomplete periods: 1778-1823; 1832-1836; 1909-1914; 1931-1935; 1941-1944; and 1967 to 1998 . Data excludes Echandía and Zona Baja post-1925.
❖ The total production recorded is 205,834 ounces in 56 years out of a period of 231 years (data for 24% of years) from 1778 to 2008, with an average of 3,954 ounces per year (based on 50 years with complete data).
❖ Total production for the period 1778 to 2008 is estimated at 900,000 ounces using the average annual production figure of 3,954 ounces per year. In addition there is contraband gold plus two millennia of pre-Colombian gold mining. A guestimate of 0.5 to 1.0 million ounces is made for this period, giving an estimated total gold production of about 1.4 to 1.9 million ounces at Marmato. To this can be added a further 300,000 ounces for Zona Baja (1993-2008) and estimated 50,000 ounces for Echandia (1929-2009). This gives a total estimated gold mined of 2.6 to 3.5 million ounces for all Marmato.
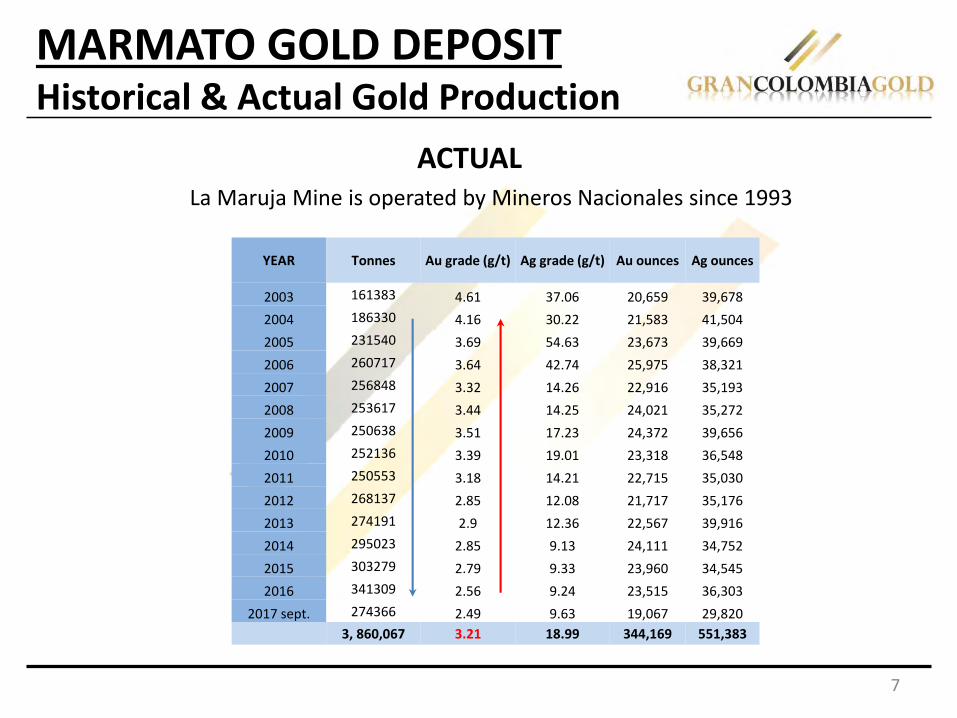
MARMATO GOLD DEPOSITHistorical & Actual Gold Production
HISTORICAL
7
YEAR Tonnes Au grade (g/t) Ag grade (g/t) Au ounces Ag ounces
2003 161383 4.61 37.06 20,659 39,678
2004 186330 4.16 30.22 21,583 41,504
2005 231540 3.69 54.63 23,673 39,669
2006 260717 3.64 42.74 25,975 38,321
2007 256848 3.32 14.26 22,916 35,193
2008 253617 3.44 14.25 24,021 35,272
2009 250638 3.51 17.23 24,372 39,656
2010 252136 3.39 19.01 23,318 36,548
2011 250553 3.18 14.21 22,715 35,030
2012 268137 2.85 12.08 21,717 35,176
2013 274191 2.9 12.36 22,567 39,916
2014 295023 2.85 9.13 24,111 34,752
2015 303279 2.79 9.33 23,960 34,545
2016 341309 2.56 9.24 23,515 36,303
2017 sept. 274366 2.49 9.63 19,067 29,820
3, 860,067 3.21 18.99 344,169 551,383
MARMATO GOLD DEPOSITHistorical & Actual Gold Production
La Maruja Mine is operated by Mineros Nacionales since 1993
ACTUAL

8
Marmato• is located on the eastern flank of theWestern Cordillera of the Colombia Andes. This isseparated from the Central Cordillera by the CaucaRiver.
The• Marmato deposit lies within the Cauca-RomeralTerrane, an oceanic terrane comprisingmetamorphosed mafic to ultramafic complexes,ophiolite sequences and oceanic sediments ofprobable Late Jurassic to Early Cretaceous age. Thisterrane was accreted to the continental margin alongthe Romeral Fault, which lies east of the River Cauca,in the Aptian (125 to 110 Ma).
The• Cauca-Romeral Terrane is bounded by theRomeral System Fault to the east and Cauca-PatiaSystem to the west.
The• Marmato porphyry stock is 18 km long by 3 to 6km wide and is elongated north-south. It intrudes theArquia Complex and the Amaga and Combiaformations.
MARMATO GOLD DEPOSITRegional Geology
9
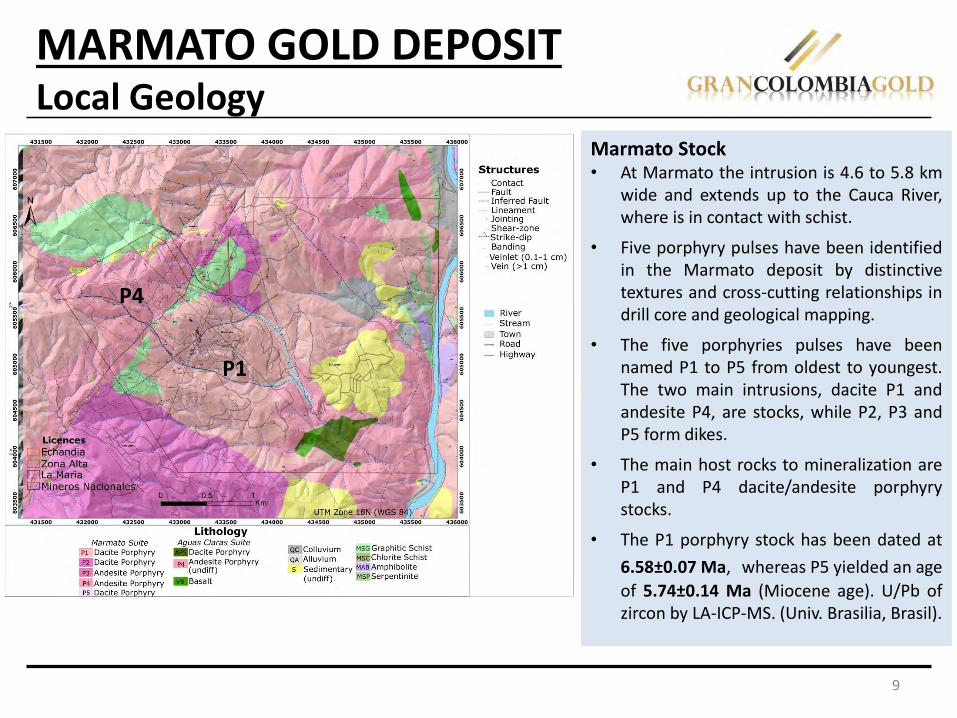
Marmato Stock• At Marmato the intrusion is 4.6 to 5.8 km
wide and extends up to the Cauca River,where is in contact with schist.
• Five porphyry pulses have been identifiedin the Marmato deposit by distinctivetextures and cross-cutting relationships indrill core and geological mapping.
• The five porphyries pulses have beennamed P1 to P5 from oldest to youngest.The two main intrusions, dacite P1 andandesite P4, are stocks, while P2, P3 andP5 form dikes.
• The main host rocks to mineralization areP1 and P4 dacite/andesite porphyrystocks.
• The P1 porphyry stock has been dated at
6.58±0.07 Ma, whereas P5 yielded an age
of 5.74±0.14 Ma (Miocene age). U/Pb ofzircon by LA-ICP-MS. (Univ. Brasilia, Brasil).
MARMATO GOLD DEPOSITLocal Geology
P1
P4

10
MARMATO GOLD DEPOSITLocal Geology
Petrography
(Santacruz et al., 2016, en revisión)

11
FIRST magmatic event
6.58 to 6.3 Ma (U/Pb of zircon)
5.96±0.02 Ma to 6.05±0.2 Ma Ar/Ar of Adularia
SECOND magmatic event
5.7 Ma (U/Pb of zircon)
MARMATO GOLD DEPOSITGeochronology
(Santacruz et al, 2016, en revisión)

12
Within the Marmato area there are fourprincipal trends of mineralized structuresrelated to syn-mineralization WNW-ESEcompression that reactivated some of thebasement structures as well as generating arange of second order shear and extensionalstructures fitting in a sinistral transpressionalshearing system.
▪ NNW-trending steep to sub-vertical faults reactivated as a sinistral transpressional shears (140-150°N),
▪ NW-trending steep to moderately inclined structures (120-130°N),
▪ E-W-trending structures (100-090°N) that tend to have moderate to relatively low-angle dips, and
▪ ENE to NE-trending structures (065-080°N) that show a range of dips.
In addition to these ore-bearing structures, there is a set of NNE-trending structures of varying dips that appear to represent different components of a reverse/thrust fault system.
MARMATO GOLD DEPOSITStructural Controls on Mineralization
13
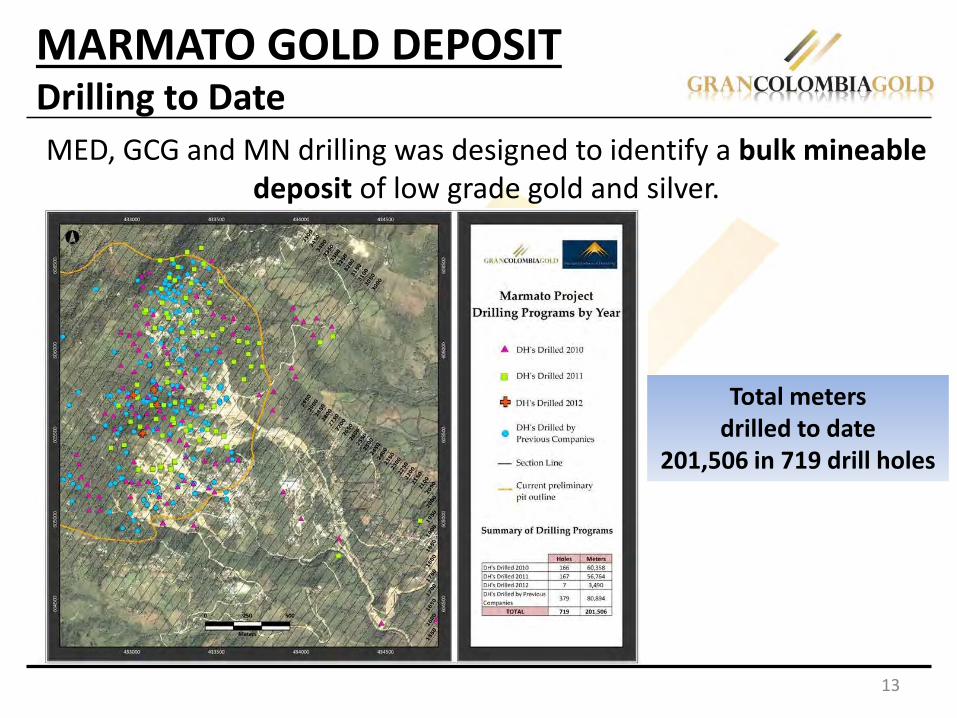
MARMATO GOLD DEPOSITDrilling to Date
MED, GCG and MN drilling was designed to identify a bulk mineable deposit of low grade gold and silver.
Total meters drilled to date
201,506 in 719 drill holes
MT-1455-A
MT-1499-AMT-1498
MT-1500
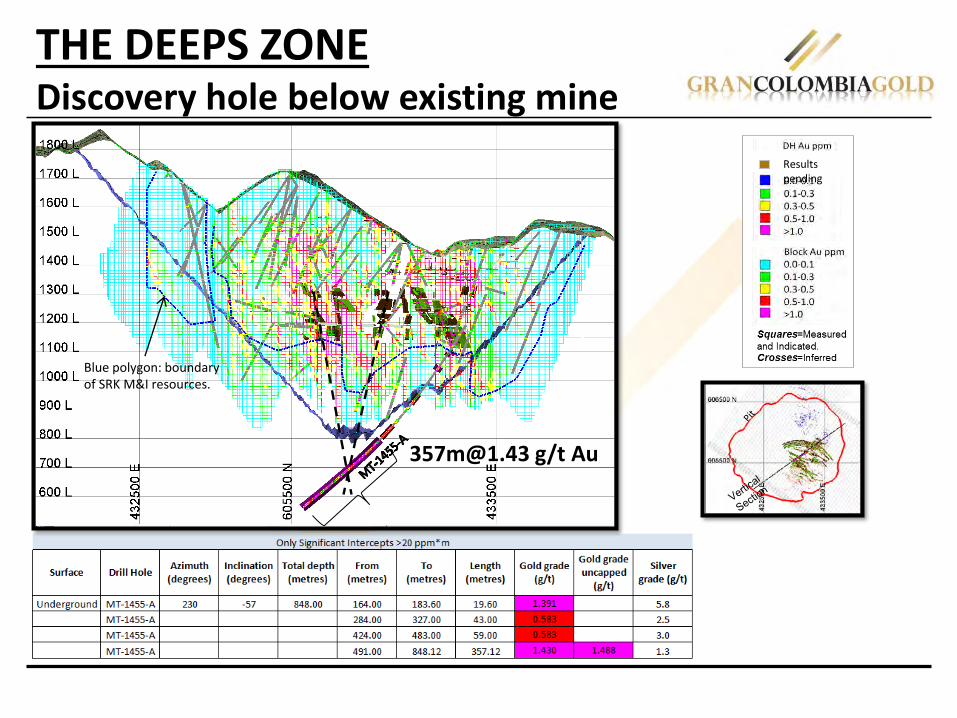
THE DEEPS ZONEDiscovery hole below existing mine
Results pending
Blue polygon: boundary of SRK M&I resources.
[email protected] g/t Au

THE DEEPS ZONEDrilling Summary & Best Intercepts
MND_282_01_17
MT-1445
MT-1455-A
MT-1499-A
MT-1498
MT-1500
MND_282_03_17
MND_11_16
Level 21
Level 20
Level 19
HOLE ID FROM (m) TO (m) LENGTH (m)Au (g/t) capped
Ag (g/t)
MT-1445 429.4 668.4 239 1.4 2.3
MT-1455A 491 848.1 357.1 1.4 1.3
MT-1498 204 943.45 739.4 1.47 1.1
MT-1499A 292 816 524 1.72 2.3
MT-1500 394 1,012.1 618.1 1.56 1.5
MND282-01-17
173.7 383.5 209.8 1.57 3.3
Including 206.0 261.9 55.9 2.79 5.3
MND282-03-17
137.26 183.0 45.74 3.67 3.58
7 holes drilled for a total of 5,095 meters
Deepest drill hole ended in mineralization

17
>80
0m ̴150m
Inferred top of the DEEPS mineralization
THE DEEPS ZONE3D section using a 1.0 g/t grade shell
+1050

18Summary Section of the Marmato Project, showing areas of potential at depth.
MARMATO GOLD DEPOSITLatest Mineral Resource Estimate
SRK Consulting (U.S.), Inc.
Veins
13.3 Mt @ 4.6 g/t Aufor 1,979 Mozusing 1.9 g/t CoG
Porphyry
27.0 Mt @ 2.1 g/t Aufor 1,858 Mozusing 1.9 g/t CoG

19
SRK Mineral Resource Statement for the Marmato Project, dated June 16, 2017*
Category Quantity
Grade Metal
Au Ag Au Ag
Mt g/t g/t 000's oz 000's oz
Underground Vein** Measured 2.6 4.7 21.3 396 1,774 Indicated 10.7 4.6 22.3 1,583 7,660 Measured and Indicated 13.3 4.6 22.1 1,979 9,434 Inferred 9.4 4.2 18.9 1,275 5,722 Underground Porphyry***
Measured Indicated 27.0 2.1 14.9 1,858 12,892 Measured and Indicated 27.0 2.1 14.9 1,858 12,892 Inferred 13.5 1.8 15.4 777 6,655 Underground Deeps*** Measured Indicated 0.9 2.0 8.0 60 235 Measured and Indicated 0.9 2.0 8.0 60 235 Inferred 29.3 2.3 2.8 2,142 2,628 Underground Combined Measured 2.6 4.7 21.3 396 1,774 Indicated 38.6 2.8 16.7 3,501 20,787 Measured and Indicated 41.2 2.9 17.0 3,897 22,561 Inferred 52.2 2.5 9.0 4,194 15,005
* Mineral resources are not mineral reserves and do not have demonstrated economic viability. All figures are rounded to reflect the relative accuracy of the estimate. All composites have been
capped where appropriate. ** Vein mineral resources are reported at a cut-off grade of 1.9 g/t. Cut-off grades based on a price of US$1,400 per ounce of gold, suitable benchmarked technical and economic parameters and
gold recoveries of 90 percent for underground resources, without considering revenues from other metal. *** Porphyry and Deeps mineral resources are reported at a cut-off grade of 1.2 g/t. Cut-off grades based on a price of US$1,400 per ounce of gold, suitable benchmarked technical and economic
parameters and gold recoveries of 90 percent for underground resources, without considering revenues from other metal within a limiting pit shell.
MARMATO GOLD DEPOSITLatest Mineral Resources Estimate

20
THE DEEPS ZONESPECTRAL INFRARED ANALYSIS OF ALTERATIONS
Three (3) sets of alteration associated to the DEEPS mineralization style were identified by Spectral Analysis of 6 drill holes (953 points recorded).
1. Pervasive Propylitic alteration relatedto iron-magnesium chlorite and epidotewith disseminated Pyrrhotite.
PoEp

21
THE DEEPS ZONESPECTRAL INFRARED ANALYSIS OF ALTERATIONS
2. An event of weak and patchy Potassium alteration, related to secondary biotite hosted in thin veinlets and disseminated in the matrix.

22
THE DEEPS ZONESPECTRAL INFRARED ANALYSIS OF ALTERATIONS
3. Whitish alteration referred to as Albite alteration, due to the presence of albite and muscovite (fine grained) forming an halo along the margins of qtz+pyrrhotite veinlets +bismuth minerals ± chlorite ± epidote.
SmAb
Sm
Sm
Vns Qtz

23
THE DEEPS ZONEAlteration overprinting
Epidote
Albite
Smectite
qtz vnsIllite

24
P1 dacite porphyry with stockwork of veinlets of quartz-pyrrhotite-minor chalcopyrite withnarrow illite halo, overprinting biotite alteration.MT-1498 at 854.0 m. Sample 2.0 m at 17.3 g/t Au, 3.5 g/t Ag and 330 ppm Cu.
Veinlet of quartz-pyrrhotite-chalcopyrite with halo of green sericite-smectite in P1 daciteporphyry with weak biotite alteration. MT-1498 at 847.3 m. Sample 2.0 m at 2.88 g/t Au, 0.7 g/t Ag, and 225 ppm Cu.
Predominance of native gold, commonly accompanied by bismuth tellurides and bismuth sulphides, stronglyassociated with silicate (quartz) gangue. (G. Di Prisco, 2012)
Fe
Po
Cpy
Maldonite (Au2Bi)
Native Bi
Tsumoite (BiTe)
Au
Bi
Jonassonite (AuBiS)
THE DEEPS ZONEDeeps Mineralization Style
25
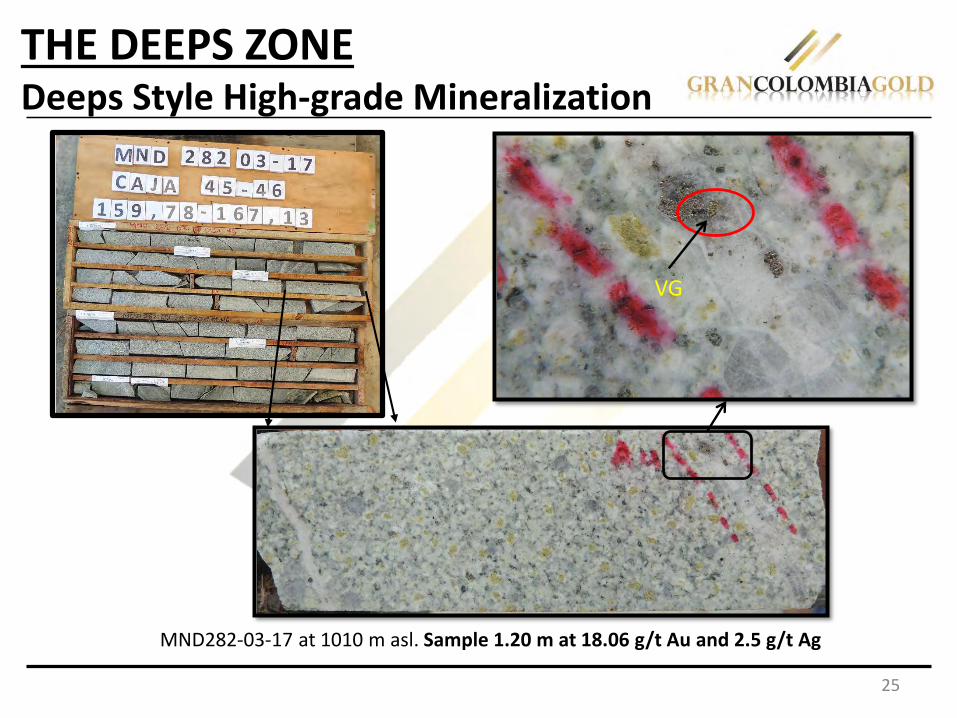
THE DEEPS ZONEDeeps Style High-grade Mineralization
MND282-03-17 at 1010 m asl. Sample 1.20 m at 18.06 g/t Au and 2.5 g/t Ag
VG

P1 showing
Propylitic
alteration
thin qtz vn+/-
Po-Te-Bi-Au
26
VGPo + Bi-sulph
THE DEEPS ZONEDeeps Style High-grade Mineralization
MT-1500 at 322 m asl. Sample 0.80 m at 133.9 g/t of Au and 26.6 g/t of Ag
VG

27
Phase 2 shows four paragenetic sequences:
2a) coarse Py-Apy-Gn2b) coarse iron-rich Sp-Po-Gn2c) fine Py-Ccp2d) fine Py-Mrc-Ccp-Tetrahedrite
Two formation environments:1. Low sulphidation (LS) state (2a, 2b)
with a superimposed2. Intermediate sulphidation (IS) state (2c,2d)
KEEP IN MIND Bi
STYLES OF MINERALIZATIONParagenetic Sequences
2a
2b
2c
2d
28
Legend
DRILL HOLES AU PPM
Pending
0 0.1
0.1 0.3
0.3 1
1 2.5
> 2.5
BLOCKS AU PPM
0 0.1
0.1 0.3
0.3 1
1 2.5
> 2.5
SW
Min
ero
s N
acio
nal
es
U/G
min
e
L 16
L 17
L 18
L 19
L 20
NEEl Burro Hill Echandia
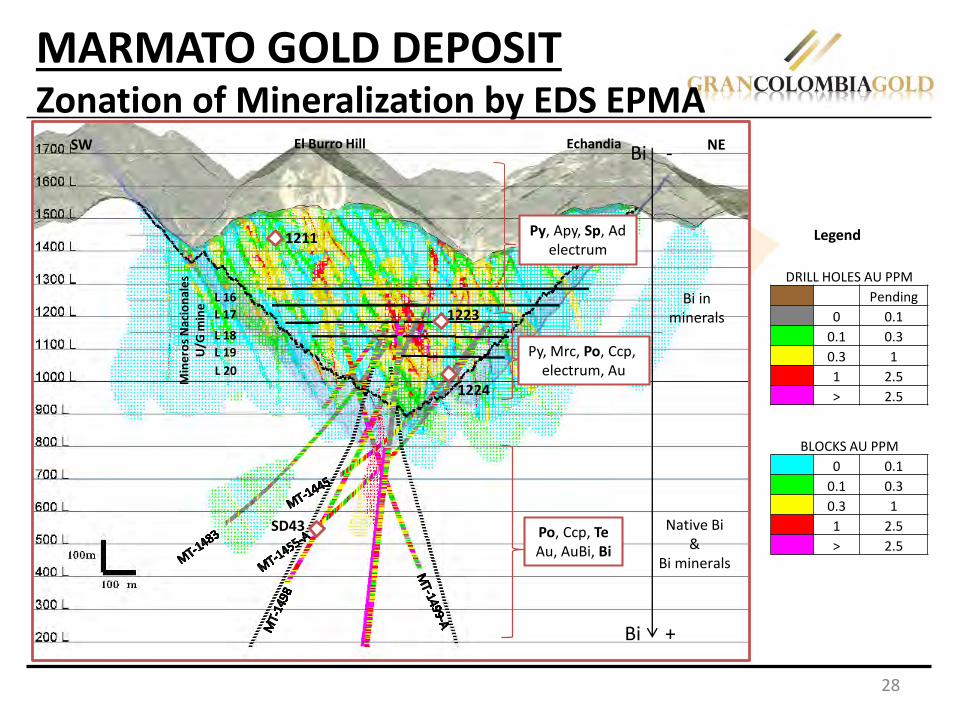
Po, Ccp, TeAu, AuBi, Bi
Py, Mrc, Po, Ccp, electrum, Au
Py, Apy, Sp, Adelectrum
Bi +
Bi -
Native Bi&
Bi minerals
Bi inminerals
SD43
1224
1223
1211
MARMATO GOLD DEPOSITZonation of Mineralization by EDS EPMA
29
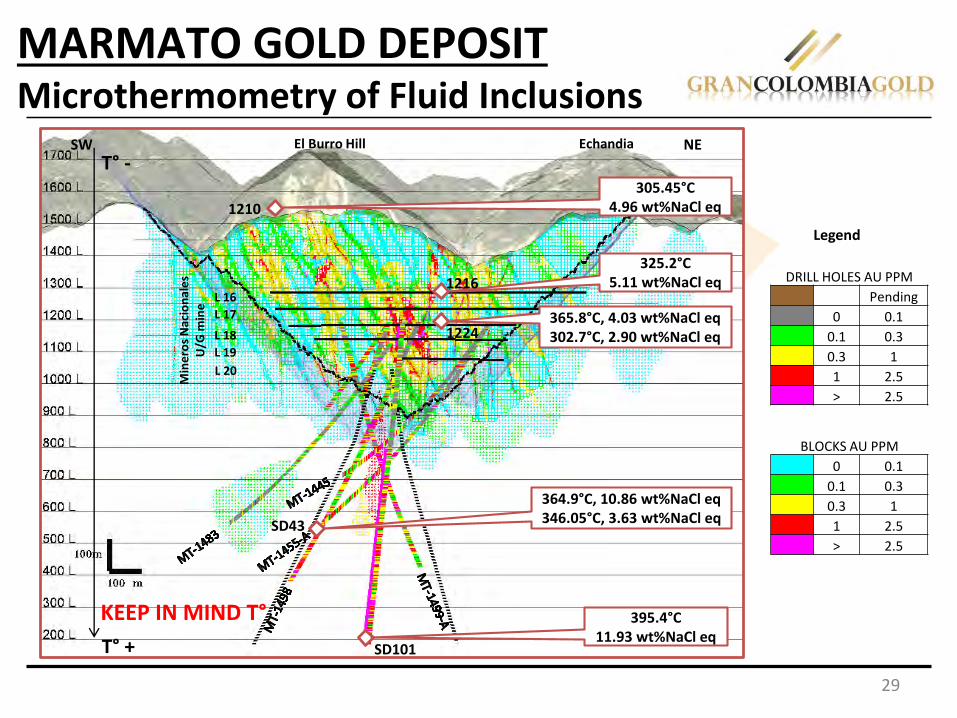
MARMATO GOLD DEPOSITMicrothermometry of Fluid Inclusions
Legend
DRILL HOLES AU PPM
Pending
0 0.1
0.1 0.3
0.3 1
1 2.5
> 2.5
BLOCKS AU PPM
0 0.1
0.1 0.3
0.3 1
1 2.5
> 2.5
SW NEEl Burro Hill Echandia
395.4°C11.93 wt%NaCl eq
364.9°C, 10.86 wt%NaCl eq346.05°C, 3.63 wt%NaCl eq
365.8°C, 4.03 wt%NaCl eq302.7°C, 2.90 wt%NaCl eq
325.2°C5.11 wt%NaCl eq
305.45°C4.96 wt%NaCl eq
Min
ero
s N
acio
nal
es
U/G
min
e
L 16
L 17
L 18
L 19
L 20
T° +
T° -
1210
SD43
1224
1216
SD101
KEEP IN MIND T°
30
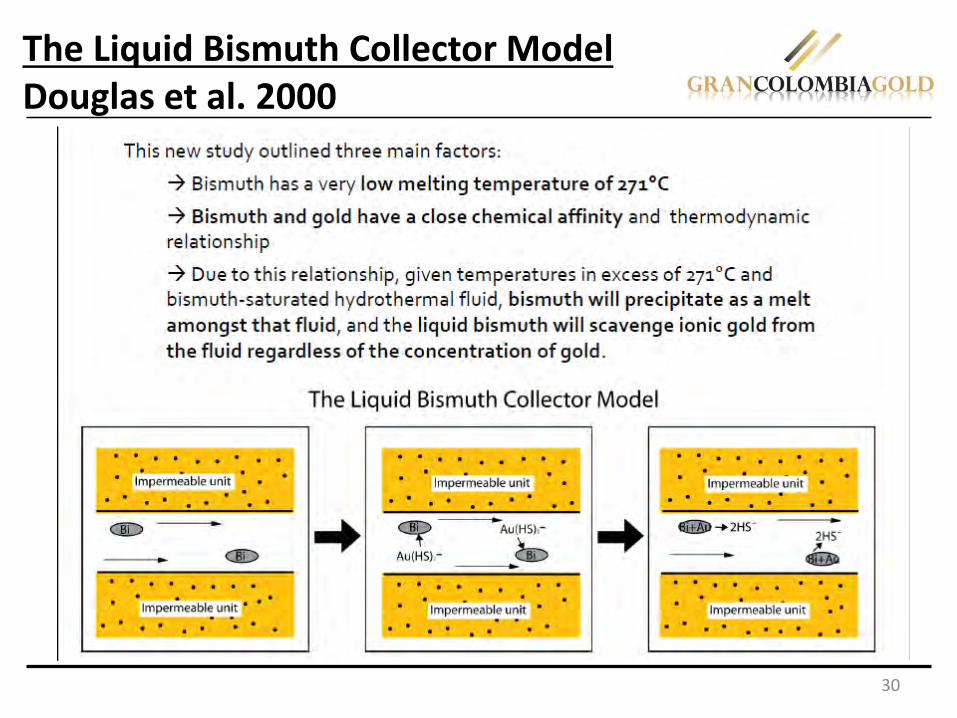
The Liquid Bismuth Collector ModelDouglas et al. 2000
31
THE DEEPS ZONEConclusions
Mineralization• extends vertically at least 900 m below the limit of the current undergroundoperation.
The• Deeps Zone has been drilled along strike for about 500 m and over a width of >100 m.
The• Deeps mineralization is related to veinlets of Qtz-Po±Ccp±Bi-sulph±Tellurides and VG. Cugrades are very low and are not of economic interest. The veinlets have a narrow halo ofintermediate argillic alteration. Pyrrhotite and chalcopyrite increase downwards.
The• high-grade areas within the Deeps Zone are commonly related to the presence of visible Auscattered throughout the thin quartz veinlets.
The• Deeps mineralization is structurally controlled, which is confirmed by a strong control of thegeneral disposition of the thin veinlets that host the mineralization. This structural controlpossibly depends on the same stress field that generated the fault system that hosts theepithermal events in the middle and upper areas of the deposit.
The• thin veinlets that characterized the Deeps Zone resemble a system of tension fracturesdeveloped in a compressive regime, within an envelope generated by a sinistral transpressionalshearing system related to WNW-ESE compression, which could be assimilated to a Dilationaljog.
The• alteration associated to the Deeps mineralization is generally weak, and does not match withany type of alteration related to a porphyry type deposit.

Detailed➢ Petrography program to gain a better understanding of theDeeps mineralization.
Planning➢ and execution of an infill drilling program aimed to convert andfurther develop the Inferred resources and, to further develop thegeologic knowledge of the Deeps Zone.
Run➢ a Conceptual Metallurgical Test program.
Run➢ a Geotechnical Testwork program.
Study➢ the potential to develop the new Deeps Zone into the overallbusiness plan for Marmato through a PEA.
32
THE DEEPS ZONEWork in progress

33
THANKS