Embed Size (px)
Citation preview

Shell Global ScenariosEnergy Implications for the US
Presentation to the USAEE Annual Conference
Denver, September 19th 2005
Andrew Slaughter
Shell – Global Business Environment
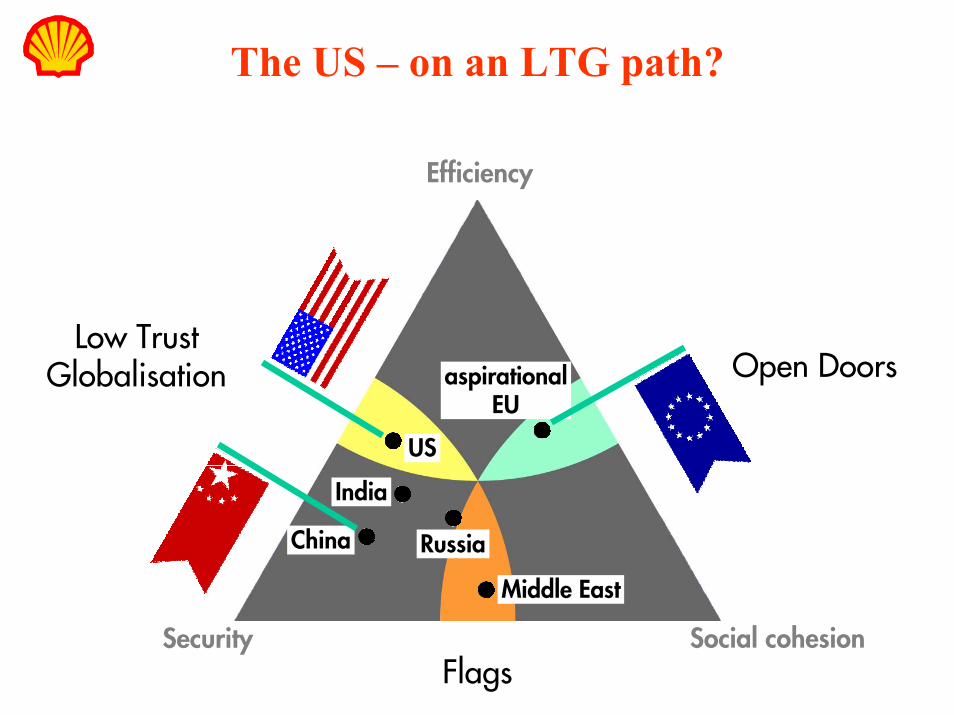
The US – on an LTG path?
Efficiency
Russia
Middle East
India
US
aspirationalEU
China
Open DoorsLow Trust
Globalisation
Social cohesionSecurityFlags

Low Trust GlobalisationThe scenario in a nutshell: “Carrots and Sticks”
A legalistic “prove it to me” world of courts, lawyers, auditors, and Chinese wallsSecurity through intrusive checks & controlsHigh degree of both government and market-based regulation (e.g. ISO)Strong states seek further globalisation on their termsGovernments drive energy diversityNGOs seek to overcome a more limited clout through alliances with investors and/or states
Manage regulatory change and compliance risk

Energy challenges in LTG – what will be the impact on North America?
carbon
energy intensive growth
security of supply
How will NA compete globally for energy resources versus growing energy-hungry economies?
What is the right mix of incentives for domestic energy versus international cooperation?
Will the US join growing international actions to limit
carbon emissions?

Which way for US Energy Policy in LTG?
Growing patchwork of state and local targets
No national consensus
Renewables, accelerated research into hydrogen and carbon
sequestrationCarbon
Selective trade and investment protocols
Favourable fiscal and access regimes for domestic energy
sources
Energy Intensive Growth
Efficiency standardsTaxation
Federal and local rules
Diversity of Supply- Geographical- Fuel mix (inc unconventionals and renewables)
Critical infrastructure (but tempered by safety and environmental concerns)
Security of supply
DemandSupply
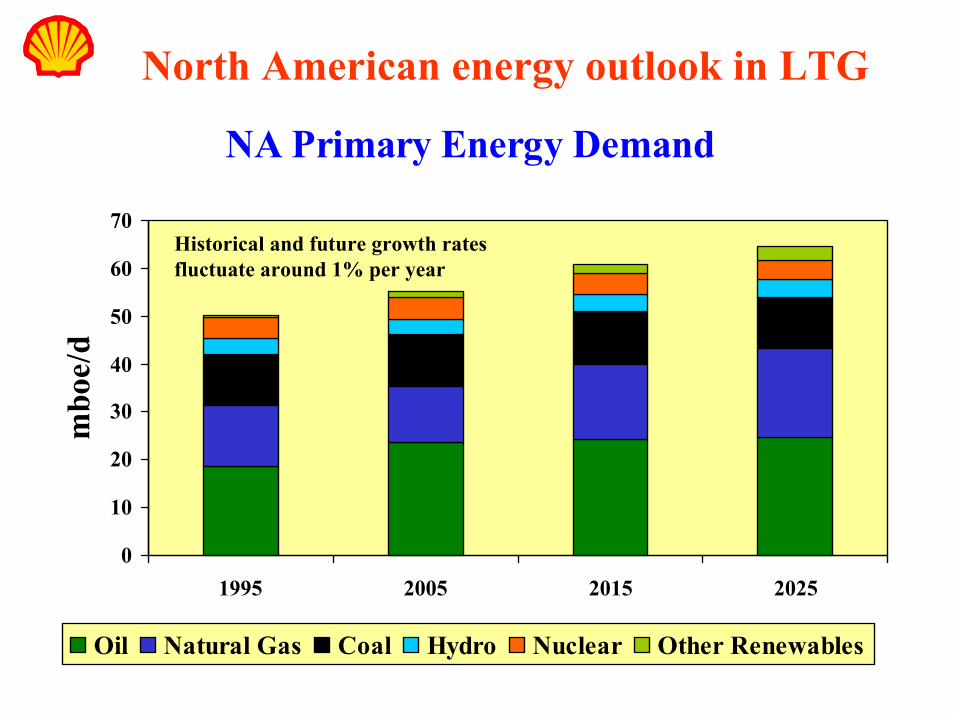
North American energy outlook in LTG
NA Primary Energy Demand
0
10
20
30
40
50
60
70
1995 2005 2015 2025
mbo
e/d
Oil Natural Gas Coal Hydro Nuclear Other Renewables
Historical and future growth rates fluctuate around 1% per year
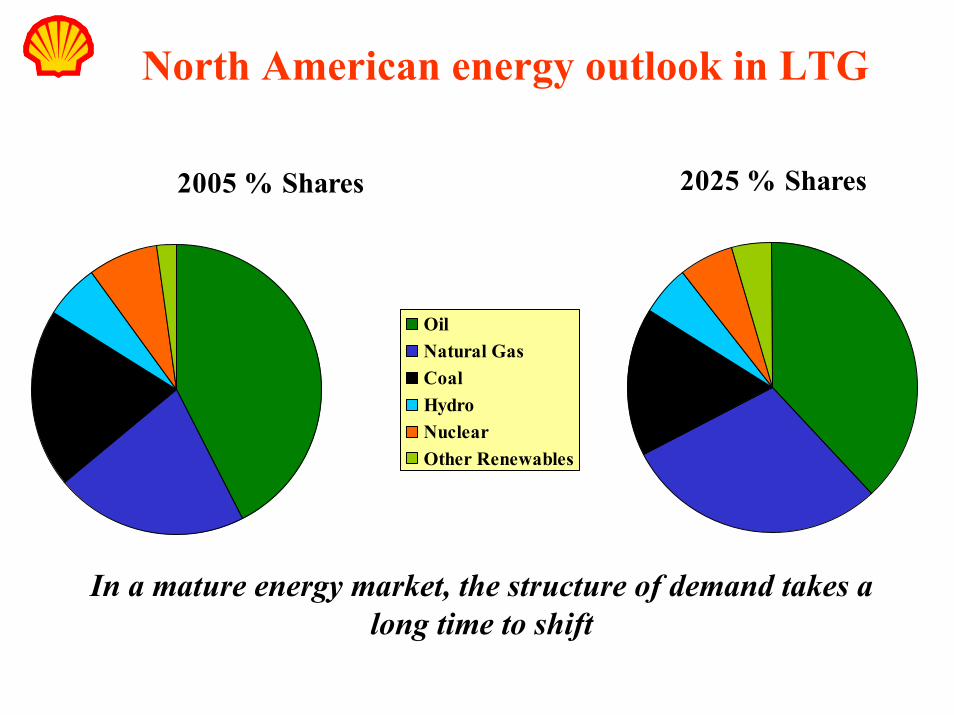
North American energy outlook in LTG
2005 % Shares
OilNatural GasCoalHydroNuclearOther Renewables
2025 % Shares
In a mature energy market, the structure of demand takes a long time to shift
Could North America move to an Open Doors world…?
• Trade• success of CAFTA, reinforcement of NAFTA• Boeing/Airbus dispute amicably settled• China revaluations continue, improving terms of trade
• Global Security• continuous improvement in anti-terrorism measures reduces threat to more manageable
levels, effective international cooperation is achieved• stabilisation of Iraq
Energy Impactsstrongest overall energy demand growthopen market for LNG infrastructure development and imports, unfettered by restrictive energy security concernsrenewables and unconventional fuels driven by improving technology and economics, and pulled by growing consumer acceptability – policy takes a back seatCO2 emissions adressed by market-based allowance trading

Or Flags?
• Trade• continuing trade tensions US/Europe, US/China, US/Canada etc….• competitive protectionist escalation
• Global Security• no relief from outbreaks of terrorist activity, in North America and internationally• increased focus on security requires step-up in funding and government attention, but
inhibits economic activity
Energy Impactsweakest overall energy demand growthdomestic energy supply source favoured with strong legislative and regulatory support: access to hydroacarbons; renewables credits and targets; unconventional fuels programmesinternational energy supply refocussed on hemispheric (“friendly”) supply sourcespotential for regulated demand side management if energy balances are tight
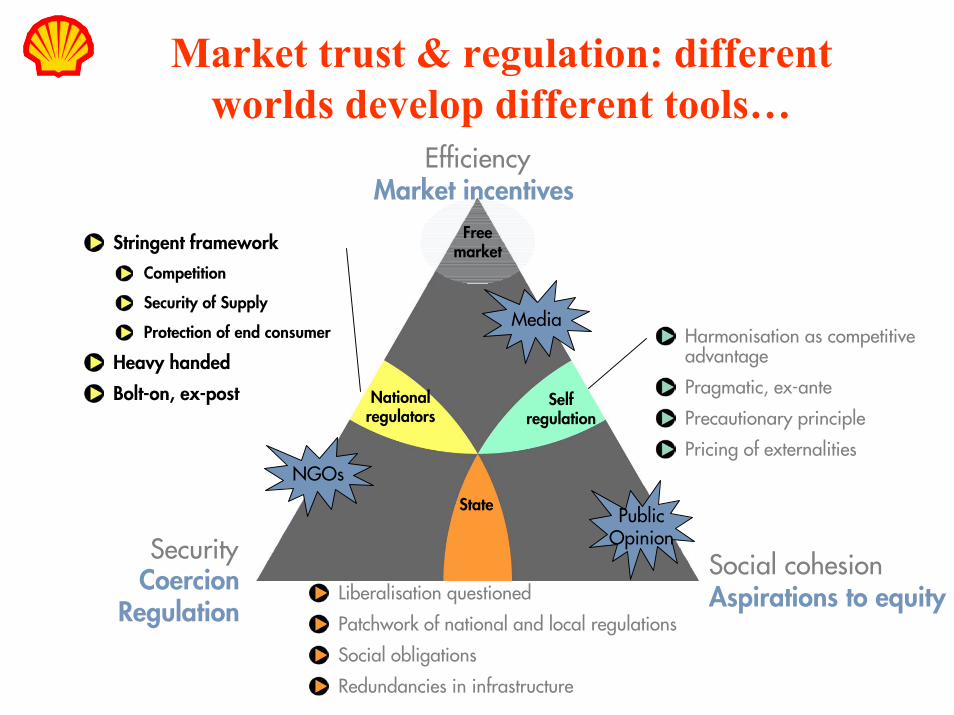
Market trust & regulation: different worlds develop different tools…
CoercionRegulation
Free market
National regulators
Self regulation
State
Harmonisation as competitive advantage
Pragmatic, ex-ante
Precautionary principle
Pricing of externalities
Stringent framework
Competition
Security of Supply
Protection of end consumer
Heavy handed
Bolt-on, ex-post
Market incentivesEfficiency
Security
Aspirations to equitySocial cohesion
NGOs
Media
PublicOpinion
Liberalisation questioned
Patchwork of national and local regulations
Social obligations
Redundancies in infrastructure

… and patterns of influence could shift
Low Trust GlobalisationLow Trust GlobalisationProve it to me
RegulatorsRegulators areare law enforcerslaw enforcersBureaucrats & Bureaucrats & lawyerslawyers
ProPro--business NGOsbusiness NGOs are more prominentare more prominentMediaMedia areare businessesbusinesses
RegulatorsRegulators areare facilitatorsfacilitators“rating value“rating value--chains”chains”
NGOsNGOs areare voices of endorsementvoices of endorsementMediaMedia areare iconoclastsiconoclasts
Open DoorsOpen DoorsKnow me
FlagsFlagsFollow me
Populist Populist political leaderspolitical leadersTrade unions & dominant constituenciesTrade unions & dominant constituencies
NGOsNGOs areare voices of public discontentvoices of public discontentMediaMedia areare part of establishmentpart of establishment
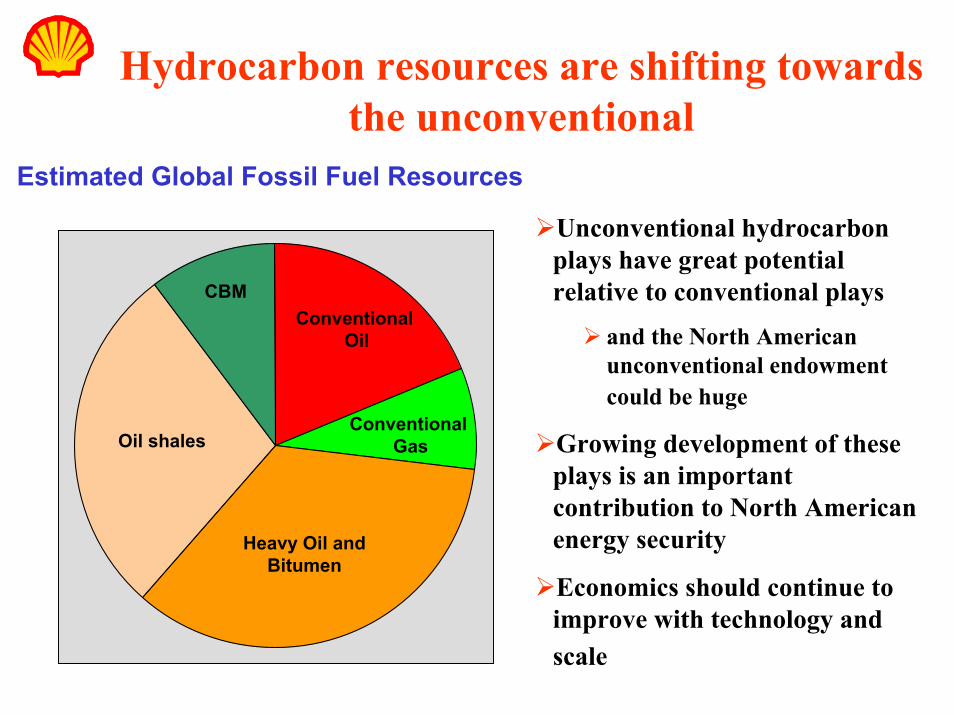
Hydrocarbon resources are shifting towards the unconventional
Estimated Global Fossil Fuel Resources
Conventional Oil
Conventional Gas
Heavy Oil and Bitumen
Oil shales
CBM
Unconventional hydrocarbon plays have great potential relative to conventional plays
and the North American unconventional endowment could be huge
Growing development of these plays is an important contribution to North American energy security
Economics should continue to improve with technology and scale

Long Term Oil Price Drivers
CoercionRegulation
Higheroil prices
Moderateoil prices
Loweroil prices
Strong Economic and oil demand growth
Core Middle-East OPEC
Oil price target moderate: Not to destroy oil demand
Moderate economic and oil demand growth
OPEC cohesive and coercive
Oil price target high:Test what the market can bear
Market incentivesEfficiency
Security
Aspirations to equitySocial cohesion
Terrorism
Demandgrowth >>
supply
Low economic and oil demand growth
OPEC cohesion put to test
Oil price target high, but unachievable
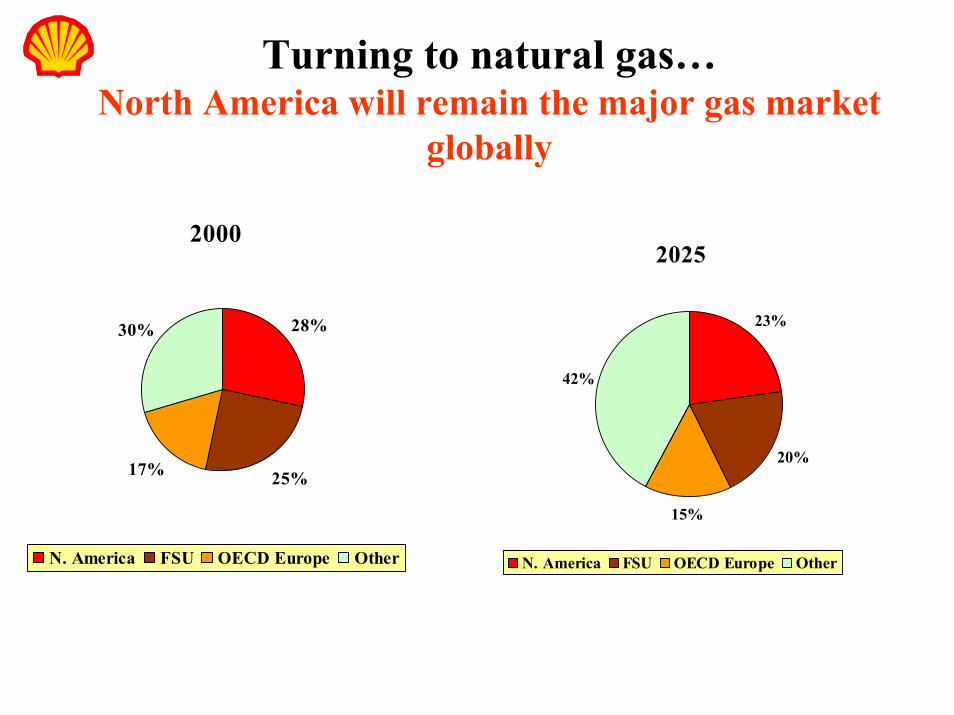
Turning to natural gas…North America will remain the major gas market
globally
2000
28%
25%17%
30%
N. America FSU OECD Europe Other
2025
23%
20%
15%
42%
N. America FSU OECD Europe Other
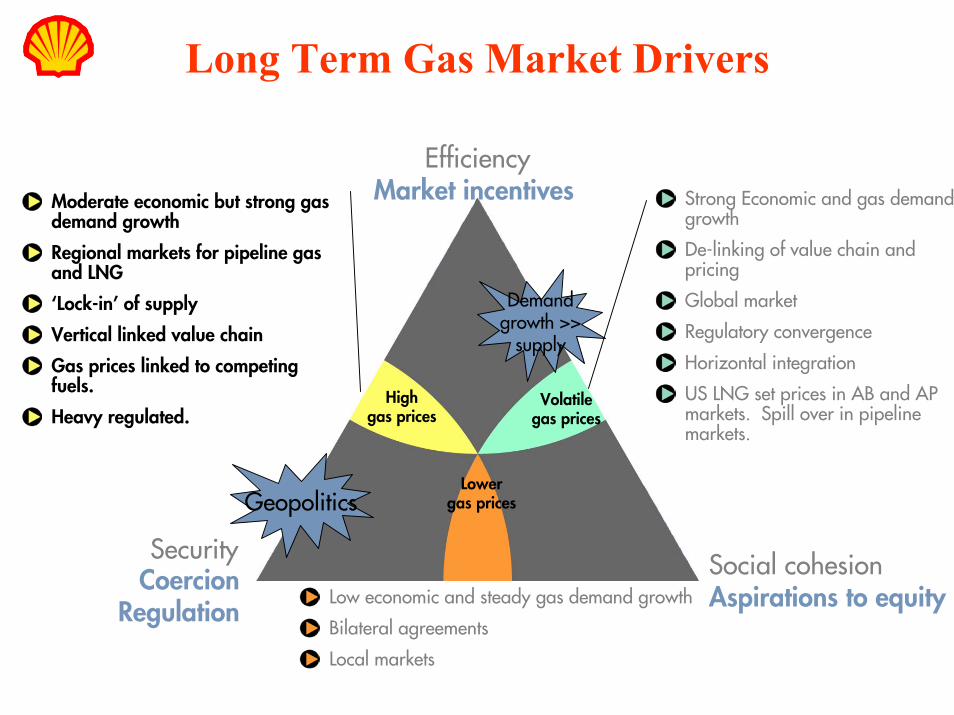
Long Term Gas Market Drivers
CoercionRegulation
Highgas prices
Volatilegas prices
Lowergas prices
Strong Economic and gas demand growth
De-linking of value chain and pricing
Global market
Regulatory convergence
Horizontal integration
US LNG set prices in AB and AP markets. Spill over in pipeline markets.
Moderate economic but strong gas demand growth
Regional markets for pipeline gas and LNG
‘Lock-in’ of supply
Vertical linked value chain
Gas prices linked to competing fuels.
Heavy regulated.
Market incentivesEfficiency
Security
Aspirations to equitySocial cohesion
Geopolitics
Demandgrowth >>
supply
Low economic and steady gas demand growth
Bilateral agreements
Local markets
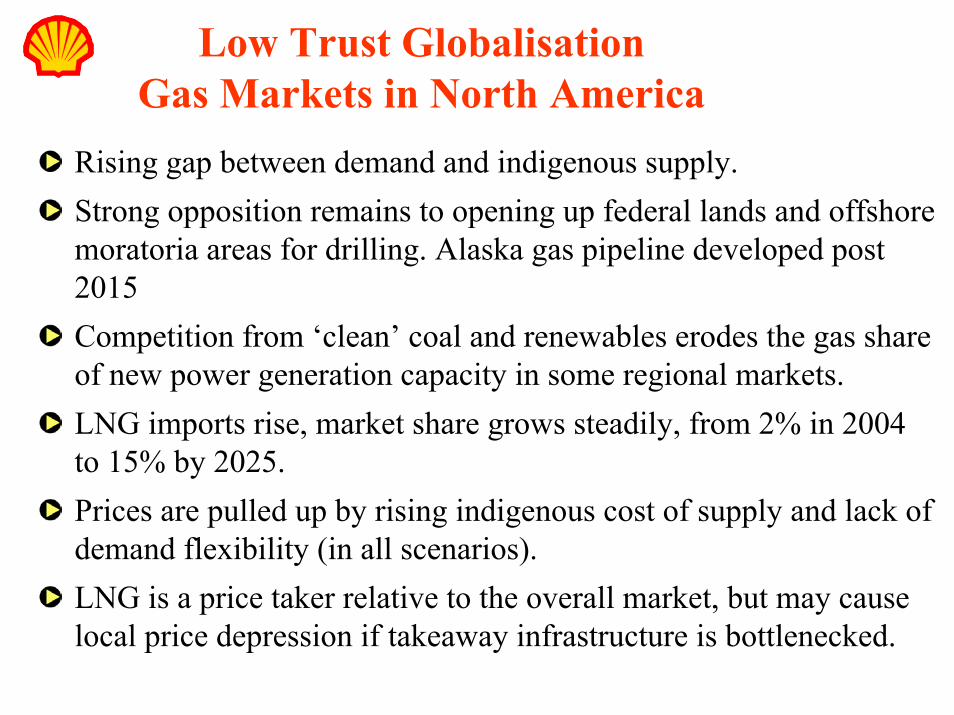
Low Trust Globalisation Gas Markets in North America
Rising gap between demand and indigenous supply. Strong opposition remains to opening up federal lands and offshore moratoria areas for drilling. Alaska gas pipeline developed post2015Competition from ‘clean’ coal and renewables erodes the gas share of new power generation capacity in some regional markets. LNG imports rise, market share grows steadily, from 2% in 2004 to 15% by 2025.Prices are pulled up by rising indigenous cost of supply and lack of demand flexibility (in all scenarios). LNG is a price taker relative to the overall market, but may cause local price depression if takeaway infrastructure is bottlenecked.
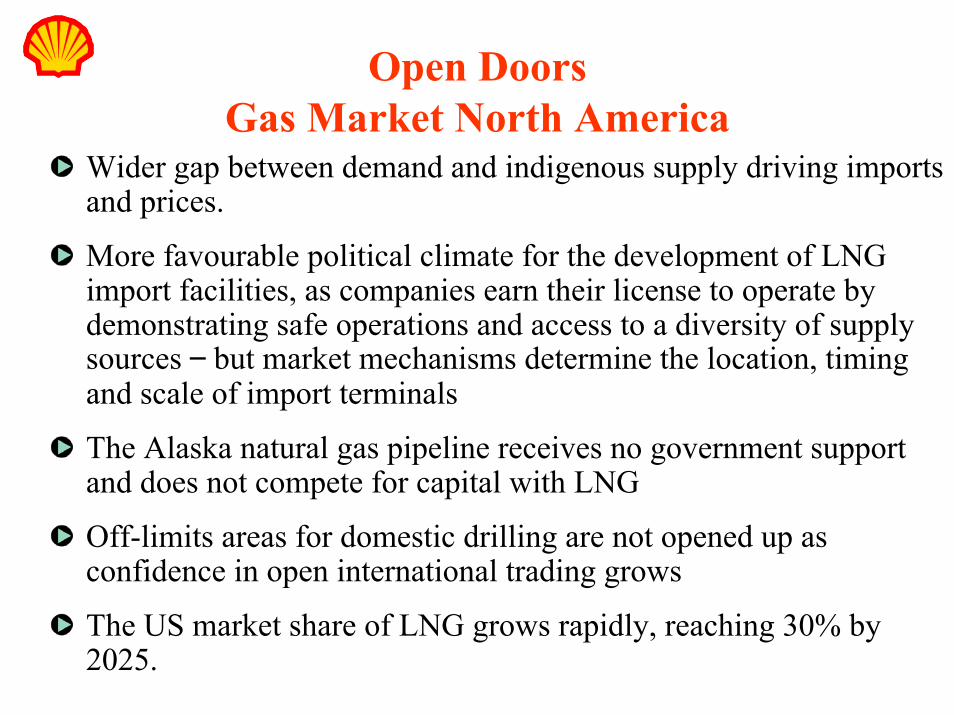
Open DoorsGas Market North America
Wider gap between demand and indigenous supply driving imports and prices.
More favourable political climate for the development of LNG import facilities, as companies earn their license to operate bydemonstrating safe operations and access to a diversity of supply sources – but market mechanisms determine the location, timing and scale of import terminals
The Alaska natural gas pipeline receives no government support and does not compete for capital with LNG
Off-limits areas for domestic drilling are not opened up as confidence in open international trading grows
The US market share of LNG grows rapidly, reaching 30% by 2025.

FlagsGas Markets North America
Opening to new drilling of off-limits areas on federal lands and offshore, despite only lukewarm public acceptance
Indigenous supply responds, reducing need for imports.
Federal and state guarantees enable development of Alaska natural gas pipeline by 2015, also unlocking further Arctic gas development potential
Prices are pulled up by rising indigenous cost of supply and lack of demand flexibility (in all scenarios).
US market share of LNG grows slowly to around 12.5% by 2025.

NA Natural Gas Prices have been on a clear rising trend since 1990NA Gas Prices 1990-200512 Month moving average
0
1
2
3
4
5
6
7
Jan-90
Jan-91
Jan-92
Jan-93
Jan-94
Jan-95
Jan-96
Jan-97
Jan-98
Jan-99
Jan-00
Jan-01
Jan-02
Jan-03
Jan-04
Jan-05
$/M
MB
tu -
Hen
ry H
ub C
ash
Mon
thly
Mov
ing
Ave
rage
Henry Hub
Each price trough is higher than the previous one
Each price peak is higher than the previous one
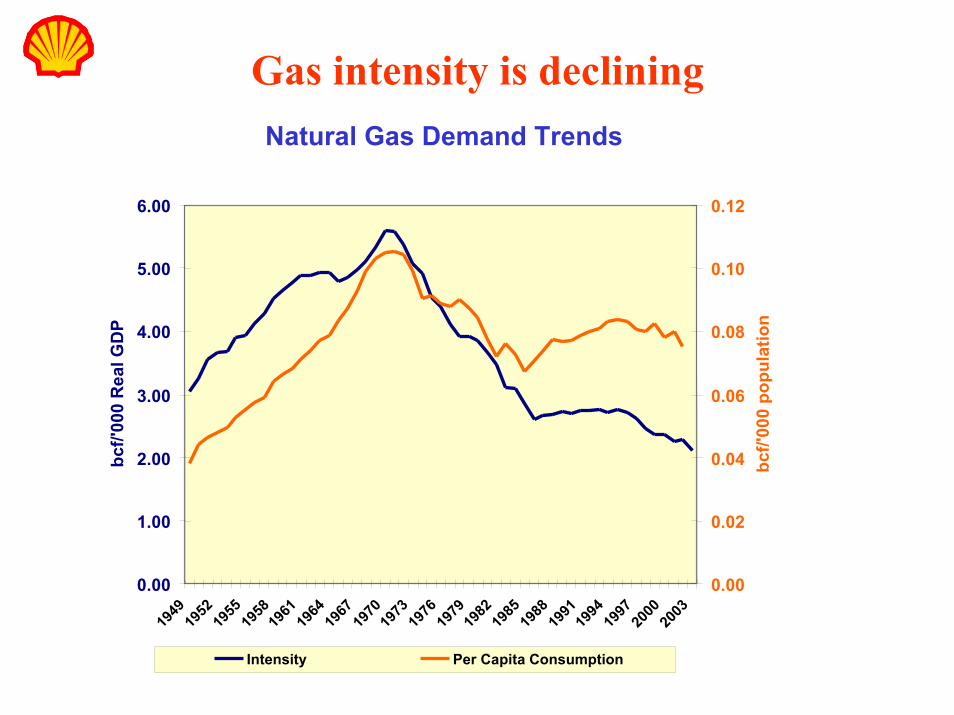
Gas intensity is decliningNatural Gas Demand Trends
0.00
1.00
2.00
3.00
4.00
5.00
6.00
1949
1952
1955
1958
1961
1964
1967
1970
1973
1976
1979
1982
1985
1988
1991
1994
1997
2000
2003
bcf/'
000
Rea
l GD
P
0.00
0.02
0.04
0.06
0.08
0.10
0.12
bcf/'
000
popu
latio
n
Intensity Per Capita Consumption
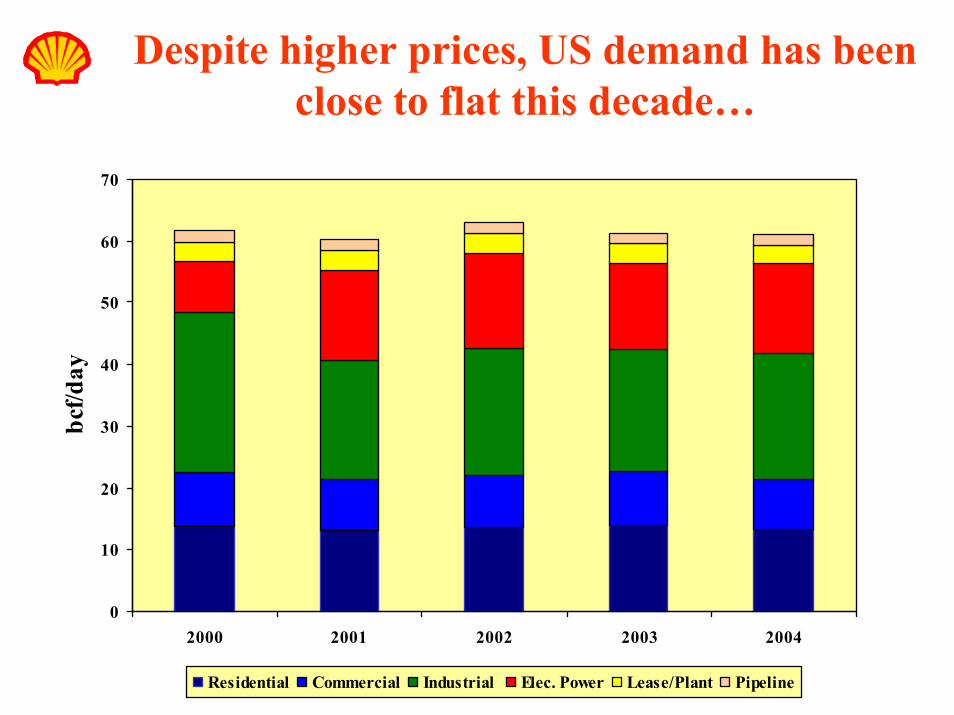
Despite higher prices, US demand has been close to flat this decade…
0
10
20
30
40
50
60
70
2000 2001 2002 2003 2004
bcf/d
ay
Residential Commercial Industrial Elec. Power Lease/Plant Pipeline
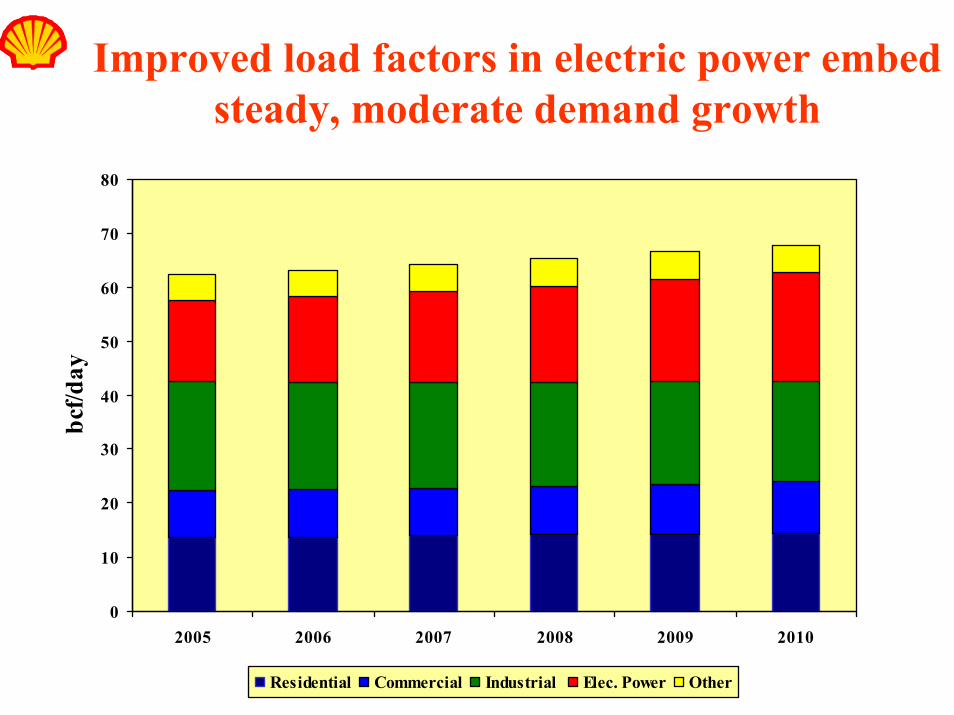
Improved load factors in electric power embed steady, moderate demand growth
0
10
20
30
40
50
60
70
80
2005 2006 2007 2008 2009 2010
bcf/d
ay
Residential Commercial Industrial Elec. Power Other
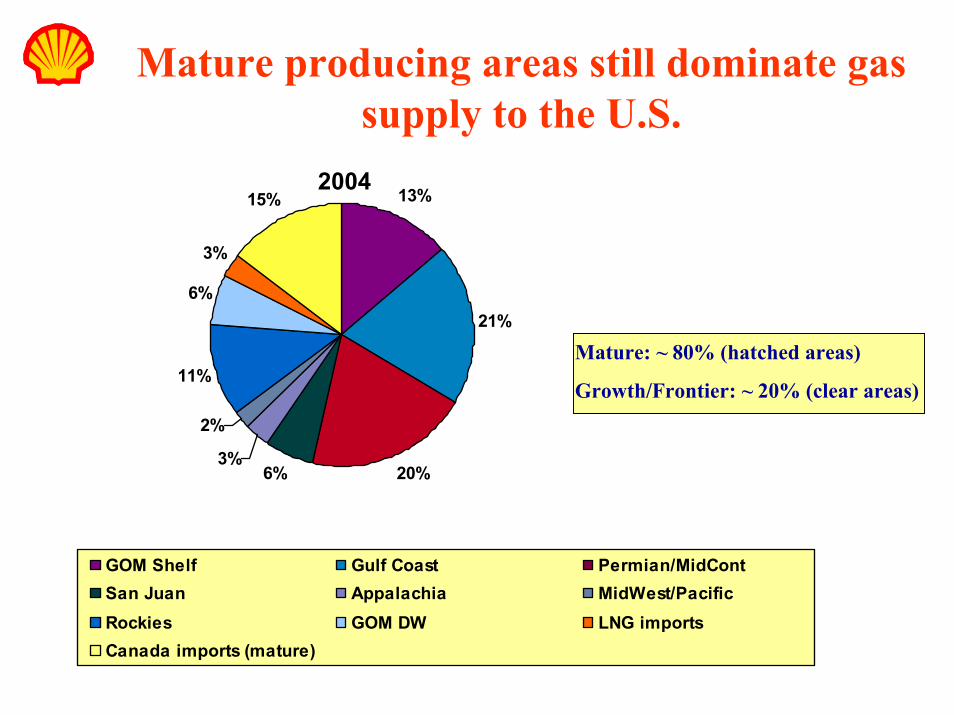
Mature producing areas still dominate gas supply to the U.S.
2004
Mature: ~ 80% (hatched areas)
Growth/Frontier: ~ 20% (clear areas)
13%
21%
20%6%3%
2%
11%
6%
3%
15%
GOM Shelf Gulf Coast Permian/MidContSan Juan Appalachia MidWest/PacificRockies GOM DW LNG importsCanada imports (mature)
0
5
10
15
20
25
30
35
Trill
ion
Cub
ic F
eet
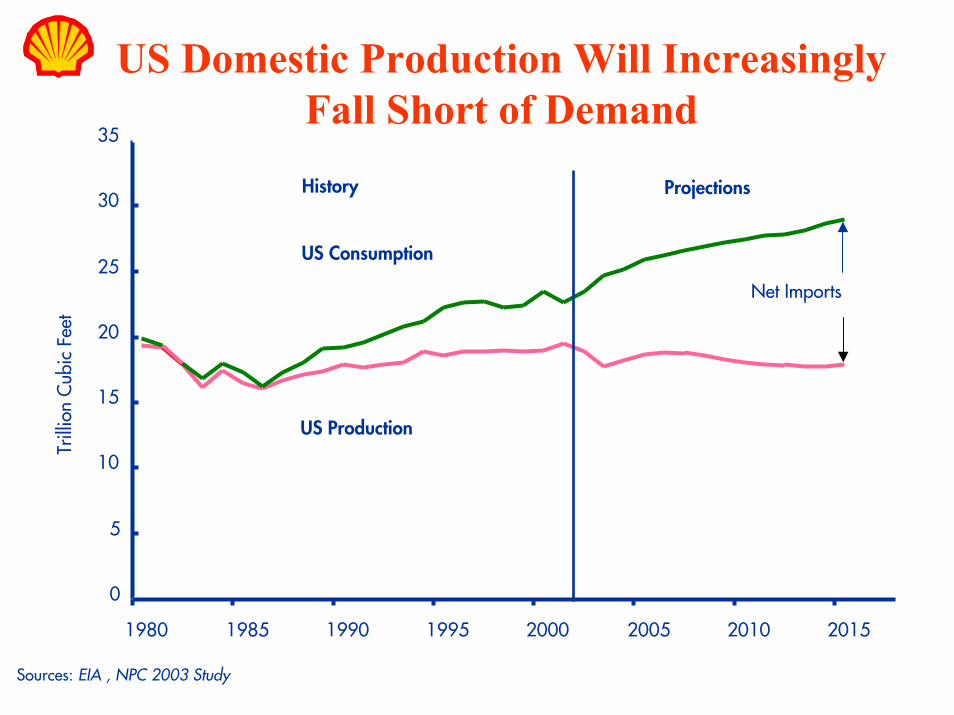
US Consumption
US Production
Net Imports
History Projections
US Domestic Production Will Increasingly Fall Short of Demand
1980 1985 1990 1995 2000 2005 2010 2015
Sources: EIA , NPC 2003 Study
Where strategy ends…
“Knowing is not enough: we must apply. Willing is not enough: we must do”
(Goethe)
In the end, we must act


![s00.static-shell.com...Ileqs IS]eqwew SHELL PENSIONERS ASSOCIATION Either complete this form and return with £10 cheque payable to 'Shell Pensioners Association/ to: SPA/ 14th Floor,](https://img.pdfslide.us/doc/110x75/60d111c48479d5342b0ebaf6/s00static-shellcom-ileqs-iseqwew-shell-pensioners-association-either-complete.jpg)