Embed Size (px)
Citation preview

SHELF LIFE STUDY OF HOMEMADE NOODLES INCORPORATED
WITH BELL PEPPER (Capsicum sp.)
By
TAN YEE QING
A project submitted to the Department of Agricultural and Food Science
Faculty of Science
Universiti Tunku Abdul Rahman
in partial fulfilment of the requirements for the degree of
Bachelor of Science (Hons) Food Science
December 2016

ii
ABSTRACT
SHELF LIFE STUDY OF HOMEMADE NOODLES INCORPORATED
WITH BELL PEPPER (Capsicum sp.)
Tan Yee Qing
Noodles serve as staple food in Asia and is gaining popularity worldwide due
to its convenience and low cost. Therefore, noodle production increases for past
few years to fulfill consumers’ demand. In this study, red bell pepper (capsicum
annum L.) was incorporated into homemade noodles to study its shelf life.
Different concentrations of red bell pepper (0, 5, 10 and 20 %) were
incorporated into noodles. For microbiological determination, total plate count
(TPC) and yeast and mold test (YM) were performed. TPC showed that all
samples including control started to have bacterial growth at day 4 with the
highest log cfu/g (>4.06). For YM, noodles with 20 % bell pepper had highest
count (7.04 log cfu/g) among all samples at day 8. Water activity of all noodles
showed average water activity of 0.978 ± 0.00, which were not significantly
different from each other (p>0.05). Proximate analysis indicated that ash and
fiber content were significantly different (p<0.05) among samples but not
significantly different in moisture, protein and fat content (p>0.05). Total
phenolic test revealed that noodles with 20 % bell pepper had highest phenolic
content (0.36 ± 0.05 mg/g), having significant difference among samples

iii
(p<0.05). Out of five sensory attributes (appearance, aroma, taste, texture and
overall acceptance), only taste attribute has significant difference among all
samples including control (p<0.05) where noodles with 10 % of bell pepper had
highest mean score value (53.33 ± 5.32). In conclusion, red bell pepper is less
effective in prolonging shelf life of noodles although noodles with 20 % bell
pepper has the highest phenolic content, this may be due to the loss of capsaicin
of bell pepper during preparation, reducing the initially low capsaicin content
in bell pepper to a negligible level and further caused the low efficiency of
microbial inhibitory effect of capsaicin.

iv
ACKNOWLEDGEMENT
I would like to express my sincere thanks of gratitude to my final year project
supervisor, Dr. Tan Yen Nee who is always patient in providing me constructive
suggestions, valuable advices and guidance throughout this project, including
the experimental planning (during bench work) and thesis writing period. I
deeply appreciate the insight and expertise my supervisor contributed which
greatly assisted me in my project, leading to the success of this project. This
project could not been accomplished without the splendid support and
encouragement from Dr. Tan. I gain a lot of new knowledge related to food
science field though this project, hence I am extremely thankful to Dr. Tan.
I am also very thankful for the cooperation and assistance from the laboratory
officers of Food Science Laboratory (D211A), Ms. Nurul Farhanah, Ms.
Lilyana, Mr. Zul and Mr. Hasif during my bench work period. Despite their
congested schedules, they still managed to respond promptly to my requests in
the laboratory.
I am extremely grateful on the tremendous moral support by my family
members who keep me motivated and inspired throughout this period. Lastly, I
would like to express special thanks to University Tunku Abdul Rahman
through the Department of Agricultural and Food Science for providing this
golden opportunity of conducting and presenting our very own project.

v
DECLARATION
I hereby declare that the project report is based on my original work except for
quotations and citations which have been duly acknowledged. I also declare that
it has not been previously or concurrently submitted for any other degree at
UTAR or other institutions.
TAN YEE QING

vi
APPROVAL SHEET
This project report entitled “SHELF LIFE STUDY OF HOMEMADE
NOODLES INCORPORATED WITH BELL PEPPER (Capsicum sp.)” was
prepared by TAN YEE QING and submitted as partial fulfilment of the
requirements for the degree of Bachelor of Science (Hons) Food Science at
Universiti Tunku Abdul Rahman.
Approved by:
___________________________
Dr. Tan Yen Nee Date:…………………..
Supervisor
Department of Agricultural and Food Science
Faculty of Science
Universiti Tunku Abdul Rahman

vii
FACULTY OF SCIENCE
UNIVERSITI TUNKU ABDUL RAHMAN
Date: __________________
PERMISSION SHEET
It is hereby certified that TAN YEE QING (ID No: 13ADB04005) has completed
this final year project entitled “SHELF LIFE STUDY OF HOMEMADE
NOODLES INCORPORATED WITH BELL PEPPER (Capsicum sp.)” under
the supervision of Dr. Tan Yen Nee from the Department of Agricultural and Food
Science, Faculty of Science.
I hereby give permission to the University to upload the softcopy of my final year
project in PDF format into the UTAR Institutional Repository, which may be made
accessible to the UTAR community and public.
Yours truly,
____________________
TAN YEE QING

viii
TABLE OF CONTENTS
Page
ABSTRACT ii
ACKNOWLEDGEMENT iv
DECLARATION v
APPROVAL SHEET vi
PERMISSION SHEET vii
TABLE OF CONTENTS viii
LIST OF TABLES x
LIST OF FIGURES xii
LIST OF ABBREVIATIONS xiii
CHAPTER
1 INTRODUCTION 1
2 LITERATURE REVIEW
2.1 Bell Pepper (Capsicum annum L.) 5
2.1.1 Sensory Attributes 5
2.1.2 Health Benefits 6
2.1.3 Antimicrobial Properties 8
2.1.4 Antioxidant Properties 11
2.1.5 Comparison between Different Colors of Bell
Peppers
18
2.2 Water Activity (Aw) 20
2.3 Proximate Analysis 21
2.4 Other Studies Regarding Methods to Increase the Shelf
Life of Food Products
22
2.4.1 Chemical Methods (Incorporation of Other
Bioactive Compounds)
22
2.4.2 Physical Methods (Packaging) 23
3 MATERIALS AND METHODS
3.1 Noodles Preparation 26
3.2 Shelf Life Determination 27
3.2.1 Microbial Analysis 27
3.2.2 Water Activity (Aw) Test 29
3.3 Proximate Analysis 30
3.3.1 Moisture Content 30
3.3.2 Ash Content 31
3.3.3 Protein Content 32
3.3.4 Fat Content 33

ix
3.3.5 Fiber Content 34
3.4 Total Phenolic Test 36
3.5 Sensory Evaluation 37
3.6 Statistical Analysis 38
4 RESULTS
4.1 Shelf Life Determination 39
4.1.1 Microbial Analysis 39
4.1.2 Water Activity (Aw) Test 44
4.2 Proximate Analysis 45
4.2.1 Moisture Content 46
4.2.2 Ash Content 46
4.2.3 Protein Content 48
4.2.4 Fat Content 49
4.2.5 Fiber Content 49
4.3 Total Phenolic Test 50
4.3.1 Standard Curve 50
4.3.2 Phenolic Content of Control and Noodle Samples
Incorporated with 5, 10 and 20 % of Bell Pepper
51
4.4 Sensory Evaluation 53
5 DISCUSSION
5.1 Shelf Life Determination 55
5.1.1 Microbial Analysis 55
5.1.2 Water Activity (Aw) Test 60
5.2 Proximate Analysis 61
5.3 Total Phenolic Test 63
5.4 Sensory Evaluation 65
5.5 Future Study 67
6 CONCLUSION 68
REFERENCES 70
APPENDIX 77

x
LIST OF TABLES
Table Page
2.1 Phenolic Compounds in Bell Pepper 16
2.2 Studies Regarding Incorporation of Other Bioactive
Compounds into Foods to Inhibit Microbial Growth
22
2.3 Microbial Counts of Whey Cheesecakes Samples (cfu/g)
after Combining MAP and OVP Techniques in the
Study of Secchi et al. (2017)
25
3.1 The ingredients (flour, salt, water and bell pepper) and
their amount required to be incorporated into control and
noodle samples incorporated with 5, 10 and 20 % of bell
pepper
27
4.1 Microbial count of control and noodle samples (with 5,
10 and 20 % of bell pepper incorporation) using TPC
method at day 0, 2, 4, 6 and 8
41
4.2 Microbial count of control and noodle samples (with 5,
10 and 20 % of bell pepper incorporation) using YM
method at day 0, 2, 4, 6 and 8
43
4.3 Water activity of control and noodle samples (with 5, 10
and 20 % of bell pepper incorporation) at day 0, 2, 4, 6
and 8
44

xi
4.4 Moisture, ash, protein, fat and fiber content of control
and noodle samples (with 5, 10 and 20 % of bell pepper
incorporation)
45
4.5 Images of ash content for control and noodles with 5 %
of bell pepper
47
4.6 Images of ash content for noodles with 10 and 20 % of
bell pepper
47
4.7 Absorbance and total phenolic content of control and
noodle samples incorporated with 5, 10 and 20 % of bell
pepper
52
4.8 Mean score value of sensory evaluation regarding
appearance, aroma, taste, texture and overall acceptance
of control and noodle samples incorporated with 5, 10
and 20 % of bell pepper
54

xii
LIST OF FIGURES
Figure Page
2.1 Structure of capsaicin 9
2.2 Mechanism of action of antioxidant 14
2.3 Basic structure of phenolic compound 15
4.1 Ash of control 47
4.2 Ash of noodles with 5 % of bell pepper 47
4.3 Ash of noodles with 10 % of bell pepper 47
4.4 Ash of noodles with 20 % of bell pepper 47
4.5 Color of the solution of control noodles and noodle
samples incorporated with 5, 10 and 20 % of bell pepper
in digestion tube after digestion process. (From left to
right: Control, noodles with 5, 10 and 20 % of bell pepper)
48
4.6 Images of fat extraction using Soxtherm analyzer 49
4.7 Standard curve of absorbance against Gallic acid
concentration
50
4.8 Color of different concentration of GA after incubating
with Na2CO3, ethanol and FC before subjecting to
spectrophotometer
51
4.9 Color of sample extract after incubating with Na2CO3,
ethanol and FC before subjecting to spectrophotometer
52

xiii
LIST OF ABBREVIATIONS
ANOVA Analysis of variance
Aw Water activity
Cfu/g Colony forming unit per gram
CuSO4 Copper (II) sulfate
FC Folin-Ciocalteau
GA Gallic acid
HCl Hydrochloric acid
H2SO4 Sulfuric acid
N Normality
NaOH Sodium hydroxide
K2SO4 Potassium sulfate
RDA Recommended dietary allowance
ROS Reactive oxygen species
SPSS Statistical package for the social
sciences
TPC Total plate count
YM Yeast and Mold
CHAPTER 1
INTRODUCTION
Noodles are categorized under cereal foods where most commonly, they are made
from wheat. The basic raw materials to prepare noodles are flour, salt and water.
The nutritional value of noodles mainly come from flour as flour is the main raw
material in producing noodles where noodles may contain protein, carbohydrates
and trace amount of fat and mineral. Therefore, noodles can be consumed as a
complete meal (Ojure and Quadri, 2012; Zhang and Ma, 2016). However, Ojure
and Quadri (2012) stated that there are little study and evidence on the nutrient
content of noodles and the process, wheat flour refinement that is carried out during
production of noodles may cause the lost in some of the nutrients such as B vitamins,
certain minerals and dietary fiber.
Cereal foods can be considered as the most economical energy food because they
are served as the main energy contributor to human. Therefore, noodles are widely
recognized as staple food for many Asian countries (Zhang and Ma, 2016). Notably,
China shows the most significant consumption rate of noodles because as suggested
by the study of Zhang and Ma (2016), China had sold a total of 8.6 billion yuan to
20.26 billion yuan of noodles, showing amazing sales, consumption and production
rate. In other word, China is the largest consumer of noodles as of 2016 (Zhang and
Ma, 2016). Nevertheless, noodles is gaining popularity and acceptability worldwide
especially in Western countries, such as Australia due to their convenience

2
(versatility – can be applied with different cooking methods and fast cooking
characteristics; simplicity – simple and little time needed for preparation),
organoleptic appeal (palatability), low cost and satiety (Bui & Small, 2007; Ojure
and Quadri, 2012; Omeire, Umeji and Obasi, 2014).
Fresh noodles are easily perishable due to high water content and nutrient
compounds, causing it to be susceptible to microorganism growth and enzymatic
activities. To prolong shelf life and maintain freshness of noodles, the most
commonly used chemical preservatives are calcium propionate and potassium
sorbate (Li et al., 2012). It is not advisable to consume too much preservative-
containing food products because adverse effect may be arise. In the case of
potassium sorbate that is used to inhibit microbial growth in noodles, there were
reports stating that contact dermatitis and urticaria can be triggered by sorbates
(Sharma, 2015).
Nowadays, the public are becoming more and more health conscious as a trend of
“green” consumerism can be identified. They would prefer natural “green” foods
(foods that have less synthetic food products included) and concern about the health
consequences that may be caused by food additives that are commonly used
currently. Therefore, in order to extend the shelf life and in the same time
maintaining freshness of perishable foods, natural preservatives are more preferable
over synthetic preservatives due to consumer behavior nowadays where consumers
desire safe and natural products of late (Del Nobile et al., 2009). Apart from that,

3
the natural food compound incorporated should exhibit antimicrobial properties in
order to inhibit microbial growth to prevent food spoilage. Synthetic compounds
may act as a more effective barrier against food spoilage but they do not specifically
attack the targeted microorganisms but also exhibit effects on non-target. This may
harm human body because synthetic compounds may kill some beneficial
microorganisms found in the gut (probiotics). Therefore, natural food compounds
with antimicrobial action are more preferable due to their biodegradable properties
and they would not cause toxic and allergic reactions (Ksibi et al., 2015).
As the name suggests, capsicum sp. belongs to the genus capsicum and is a member
of Solanaceae or Nightshade family. Vegetables that are categorized under this
genus are bell peppers, chilies, tomatoes, eggplants and so on. The botanical name
for bell pepper is Capsicum annuum L. Capsicum annuum L. is available in many
color, ranging from green, yellow, orange and red. Bell peppers are rich in vitamin
A, C and antioxidant vitamin E. Furthermore, they also contain high concentration
of antioxidants, such as flavonoids (luteolin, quercetin and hesperidin), carotenoids
(alpha- and beta-carotene, lutein and zeaxanthin) and capsaicinoids (Chávez-
Mendoza et al., 2015). Capsaicin enable capsicum sp. to preclude bacterial growth,
such as Escherichia coli as it can act as antibacterial agent. This property leads to
the possibility of capsicum sp. to prolong the shelf life of food products if
incorporated into a respective product (Othman et al., 2011).

4
As mentioned earlier, people nowadays prefer natural preservative as they are more
aware about their health. Bell pepper (Capsicum annum L.) as a vegetable may act
as natural preservative by inhibiting microbial activity due to its antibacterial
properties (due to capsaicin). Hence, bell pepper was incorporated into homemade
noodles to determine whether or not it is effective in prolonging the shelf life of
noodles. Thus, the objectives of this project were:
1. To prepare newly formulated homemade noodles incorporated with bell
pepper, then further examine and evaluate shelf life of noodles using
microbial and water activity tests.
2. To determine the nutritional value of homemade noodles incorporated with
different concentration (0, 5, 10 & 20 %) of bell peppers by proximate
analysis.
3. To determine antioxidant activities of homemade noodles incorporated with
bell peppers at different concentrations by total phenolic test.
4. To determine acceptance level of consumers towards homemade noodle
incorporated with bell peppers at different concentrations by carrying out
sensory evaluation.

5
CHAPTER 2
LITERATURE REVIEW
2.1 Bell Pepper (Capsicum annum L.)
2.1.1 Sensory Attributes
Bell pepper (Capsicum annum L.) is a type of capsicum sp. as it is included in the
capsicum genus and is a member of the Solanaceae family. The climate of North
and South America is often dry and warm, providing a favorable condition for bell
pepper to grow (Othman et al., 2011). Consumer acceptance towards bell peppers
is high as it is one of the most common vegetable found in the culinary world (eg.
Christmas ornaments) due to its attractive characteristics sensory properties (color,
texture and flavor), especially its intense color and strong flavor as well as highly
nutritious in the same time (Gomez et al., 2014). Bell pepper is famous for its
variation in many color, ranging from green, yellow, orange to red, depending on
its ripeness (Nadeem et al., 2011). Most commonly, green bell peppers serve as the
unripen/immature form while red bell peppers are the mature form of peppers.
However, some green bell peppers are also mature and ripen, depending on the
location on where they are breed. While bell peppers undergo maturation process,
chlorophyll (pigments that is responsible for the green color of green bell peppers)
started to degrade, and in the same time synthesizing capsanthin (3,3’dihydroxy-
β,κ-carotene-6’-one) and capsorubin (3,3’dihydroxy-κ,κ-carotene-6,6’dione) that
caused the red color of the red bell pepper, changing color of bell peppers from
green to red (Gomes et al., 2014). In some rare cases, brown and white bell peppers

6
can also be harvested. Other than having attractive appearance due to its distinctive
color, bell pepper is well known for its characteristics bell shape where standard
bell pepper features either 3 or 4 lobes with crunchy and thick fleshy texture,
differing it from other capsicum sp. (Chávez-Mendoza et al., 2015). Flavor wise,
the pungency of capsicum sp. is contributed by capsaicinoids, which act as one of
its characteristic attribute (Othman et al., 2011). However, according to a research
by Soetarno S. (1997), bell pepper is not as pungent and spicy as chili pepper, so it
is also known as sweet pepper.
2.1.2 Health Benefits
Bell pepper is well known for its high nutritional value as it contains high
concentration in phytonutrients and also exhibit antioxidant activities.
Phytonutrients, such as vitamin C (ascorbic acid), vitamin A, vitamin B6, β-
carotene, phenolic compounds (natural antioxidants), minerals (eg: folate,
manganese, molybdenum, potassium, thiamine, zinc, copper, chromium, cadmium,
iron, lead and cobalt), folic acid and other biotic compounds can be found in bell
peppers (Kothari et al., 2010; Bello, Boboye and Akinyosoye, 2015). A remarkably
high content of ascorbic acid at which by consuming 100 g serving of fresh bell
pepper, this can fulfill the criteria of RDA (60 mg per day) for daily intake of
ascorbic acid (Nadeem et al., 2011). In the case of red bell pepper, its lycopene
content is higher than green and yellow pepper which is useful in preventing cancer
(Nadeem et al., 2011). Bell peppers exhibit therapeutic activity due to presence of
capsaicin (a type of active ingredient in capsicum sp.) and their inherent

7
nutraceutical compounds, enabling them to be used as herbal medicine, not only in
Africa but also other countries as they can successfully prevent, diagnose or treat
certain illness (Chávez-Mendoza et al., 2015). According to Othman et al. (2011),
Gomez et al. (2014) and Bello, Boboye and Akinyosoye (2015), examples of
medicinal functions of bell peppers due to their considerable amount of capsaicin,
phenolic compounds (carotenoids such as lutein) and minerals are:
1. Anti-carcinogenic as it can fight against cancer (eg: progress of adult T-cell
of leukemia cells can be inhibited by capsaicin),
2. Hinder posterior sub-capsular cataracts due to its high carotenoids content,
3. Effective against neurogenic inflammation,
4. Prevent ulcer at intestinal lining by triggering the release of mucus due to
presence of minerals,
5. Useful against arthritis pain, inflammation and some peripheral painful
states (for instance, rheumatoid arthritis) due to its analgesic property,
6. Able to reduce high cholesterol level and avoid obesity and
7. Exhibit beneficial physiologically and psychologically effect on
gastrointestinal tract, respiratory, cardiovascular, thermoregulation and
sensory system.
Chávez-Mendoza et al. (2015) suggested that there were epidemiological studies
proved that the decline in number of death cases caused by cancer, heart diseases
and degenerative disorders (for instance, aging and macular degeneration in women)
is directly proportional to the amount of consumption of fruits and vegetables.
Therefore, it is believed that we can be healthier and stay away from diseases by

8
consuming more fruits and vegetables, such as bell pepper with such nutritious
property and its ability to defend our body from diseases. Incorporation of the
nourishing nutraceutical compounds from bell pepper into functional foods is
encouraged to increase their bioavailability in functional foods than from their
natural sources (Gomes et al., 2014). Further studies can be carried out to determine
whether or not bioavailability of bell pepper can be increase if incorporated into
non-functional foods.
2.1.3 Antimicrobial Properties
2.1.3.1 Capsaicin
Capsaicinoids are a group of bioactive compound that accounts for the pungency
attribute of the members in genus capsicum where the pungency trait is regulated
by Pun1 gene. They belong to the alkaloid group as they contain at least one
nitrogen atom. There are many different member in capsaicinoids group, the most
well-known will be capsaicin. The structure that different types of capsaicinoids
share in common is that they contain vanillylamide in branched fatty acid with 9 to
11 carbons while the difference is the number of double bond found at the fatty acid
side chain (Cisneros-Pineda et al., 2007). The synthesis site of capsaicinoids in
capsicum sp. is at the placenta. Therefore, capsaicinoids are most abundantly found
at placenta, the whitish inner part with attached seeds (Peña-Alvarez, Ramírez-
Maya and Alvarado-Suárez, 2009). Other than placenta, seeds and pericarp also
contain capsaicinoids as after capsaicinoids are finished synthesizing, they are
packaged into vacuoles by epidermal specialized cells and slowly distributed to

9
seeds and internal pericarp surface (Cisneros-Pineda et al., 2007). As mentioned
earlier, pungency of the capsicum sp. are mainly caused by capsaicin (8-methyl-N-
vanillyl-trans-6-nonenamide) where capsaicin is the major constituent (71 %) in
capsaicinoids, followed by dihydrocapsaicin at which capsaicin and
dihydrocapsaicin are the most abundantly found (90 %) capsaicinoids as compared
to others (Othman et al., 2011). The difference between capsaicin and
dihydrocapsaicin is the number of double bond found at the fatty acid side chain at
the 9th carbon (Cisneros-Pineda et al., 2007). Figure 2.1 showed the structure of
capsaicin:
Figure 2.1: Structure of capsaicin
2.1.3.2 Antimicrobial Activities of Capsaicin
As mentioned in 2.1.2, despite therapeutic activity, the presence of capsaicin enable
capsicum sp. to act as antimicrobial agent by inhibiting the growth of
microorganisms, including bacteria and fungi (Soetarno et al., 1997). Guil-
Guerrero et al. (2016) and Bello, Boboye and Akinyosoye (2015) suggested that
antimicrobial effect can be exhibited by capsaicin where capsaicin is able to retard
the proliferation of Escherichia coli and Psedomonas solanacearum and in the
same time, it can inhibit Bacillus subtilis growth. By referring to Othman et al.
(2011), a total concentration of 2.5 mg/g of capsaicin can be found in red bell

10
pepper. Therefore, red bell pepper is expected to display antimicrobial property and
if it is incorporated into food products, it should be able to prolong the shelf life as
it can hinder microbial growth, leading to prevention of food spoilage.
2.1.3.3 Microbiological Risk and Assessment for Determination of Shelf Life
of Noodle
Microbiological risk of noodles are considered as high due to its high moisture
content and sufficient nutrients where these two factors provide favorable growing
condition that “attract” the invasion of microorganisms. As stated by Akigbemidu,
Musa and Kuforiji (2015), microbial quality is the acceptability of a food compound
with a tolerable number of microorganisms in a food compound. In order to achieve
the safety and stability of noodles, their microbial quality needs to be taken into
consideration to ensure noodles are shielded from potential microbial
contamination and spoilage (Akigbemidu, Musa and Kuforiji, 2015). In the case of
noodles, by referring to a study by Akigbemidu, Musa and Kuforiji (2015), the
possible bacteria genera that may grow on noodles were Pseudomonas, Aeromonas,
Bacillus, Streptococcus and Staphylococcus sp. while fungi genera that could be
isolated from spoiled noodles were Candida, Aspergillus, Rhodotorula, Penicillium
and Mucor. In this project, microbial assessment were carried out to check whether
incorporation of bell pepper was useful in extending shelf life of noodle by delaying
or reducing microbial growth. In order to identify whether aerobic bacteria (for
instance, Pseudomonas) is able to grow on noodle at mesophilic temperature (37
℃), total plate count (TPC) or also known as standard plate count or aerobic plate

11
count was performed by using plate count agar (PCA) as the medium (Del nobile
et al., 2009). Phattra and Maweang (2009) also suggested that acidified potato
dextrose agar (PDA) could be used as agar medium to determine when yeast and
mold start to grow on the noodles incorporated with bell pepper. Only number of
colonies that fall in the range of 25 – 250 colonies are included in the calculation
of cfu/mL.
2.1.4 Antioxidant Properties
Phenolic compounds are also known as antioxidants as they are the compounds that
contribute to the antioxidative properties of a compounds. Due to inability of human
body to synthesize them and they must be obtained through diet, they are essential
to human body (Materska and Perucka, 2005). As the name suggests, antioxidants
are meant to inhibit or delay the occurrence of oxidation by eliminating free radicals
and ROS. This can be done by:
i. preventing their formation,
ii. scavenging any free radicals and ROS found and
iii. serving as their substrate.
This is because the stress caused by oxidation will result in free radicals and ROS
to be formed, damaging the commodity with free radicals by inducing lipid
peroxidation of body cells. Lipid peroxidation may be associated with the rancidity
off-odor of fat products where the off odor is resulted by the volatile aldehydes,
ketones, alcohols, furans, hydrocarbons or acids. These are the products of chemical
reaction between fat molecules with oxygen (Sainsburry et al., 2016).

12
There are two types of antioxidants functional in human body. Fat soluble and water
soluble antioxidants are required to adapt to the unique environment of human body.
Hence, it is said to have two lines of antioxidant defense with the presence of fat
and water soluble antioxidants. In order to prevent oxidation in cell cellular
membrane which consists of hydrophobic phospholipids, fat soluble antioxidants,
vitamin E (most potent, carries out chain breaking mechanism within cell
phospholipid membrane), β-carotene and co-enzymes are vital. The second line of
defense is constituted by water soluble antioxidants, vitamin C, catalase,
glutathione peroxidase and superoxide dismutase inside the cell as they need to
dissolve in the water-based cell interior to scavenge free radicals and ROS (Nadeem
et al., 2011).
Antioxidant properties may also related to antimicrobial properties. For example,
flavonoids, categorized under phenolic compounds with antioxidant properties are
able to bind to cell wall of bacteria as well as soluble and extracellular proteins to
form complexes (eg: tannins can form complex with wall proteins), and hence
causing the death of the microorganism by destabilizing and breaking the microbial
cell wall (Bello, Boboye and Akinyosoye, 2015).
Basically, in the food industry, butylated hydroxyanisole (BHA) and butylated
hydroxytoluene (BHT) are the most widely used synthetic additives used to prevent
oxidation in food products. However, natural antioxidants gain greater preference
from consumers due to the carcinogenic properties of synthetic antioxidants.

13
Natural antioxidants are more preferable as effective health promoting agent as well
(Medina-Juárez et al., 2012).
According to Medina-Juárez et al. (2012), phytonutrients need to be extensively
studied as the composition and levels of phytonutrients with antioxidant properties
found in plants does not correspond to the plant’s total antioxidant capacity. This
is because antioxidant capacity depends on type and concentration of
phytonutrients, synergistic and the inhibitory interaction among molecules present
in the compound (Medina-Juárez et al., 2012). Therefore, understanding on the
antioxidant properties of a compound is essential for the food manufacturers so they
can fully utilize the therapeutic and nutritional properties of dietary phenolic
antioxidants in vegetal plants (phytonutrients) to develop functional foods
(Conventional food with improved health benefits) (Materska and Perucka, 2005).
2.1.4.1 Mechanism of Action of Antioxidant
As the name suggests, antioxidants (mainly phenolic compounds) are able to
prevent oxidation from occurring due to their tendency in neutralizing free radicals
by rapidly donating their electron to a highly reactive free radicals to get paired.
This is to ensure the initially unstable free radical with a lone electron is able to
achieve its stable state after accepting an electron from antioxidant, leading to the
pairing of radical’s lone electron with the antioxidant electron, which neutralizes
and stabilizes the free radical. A stabilized radical would not damage body cell as
the chain reaction of oxidation has been disrupted. This prevents the induction of

14
diseases such as cancer and aging which is caused by the “snatching” of electron
by radical from body cells to pair up with the respective radical’s lone electron if
no electron is provided by antioxidant, oxidizing the cells and triggering diseases
like aging (Lobo et al., 2010; Nadeem et al., 2011). This mechanism of action is
known as chain breaking mechanism (Lobo et al., 2010). Similarly in the case of
foods, foods may be damaged by free radicals, especially high fat foods because
oxidation may cause rancidity of high fat foods. Therefore, antioxidants
incorporated in food products can disrupt the oxidation chain by chain breaking
mechanism as well. The pathway of chain breaking mechanism is shown in Figure
2.2:
Figure 2.2: Mechanism of action of antioxidant
Another type of mechanism that can be carried out by antioxidant is by quenching
chain initiating catalyst to remove ROS or other secondary antioxidants (reactive
nitrogen species initiators). Other different patterns of actions of antioxidants such
as by electron donating, metal ion chelating, establishing co-antioxidants and

15
regulating gene expression can be utilized by antioxidants to perform their
antioxidant properties on biological systems (Lobo et al., 2010).
2.1.4.2 Phenolic Compounds in Bell Pepper and Their Functions
Every phenolic compound contains at least one aromatic ring with at least one
hydroxyl (OH) group attached to it. To enhance better understanding of the
phenolic structure, Figure 2.3 displayed the basic structure of phenolic compound:
Figure 2.3: Basic structure of phenolic compound
Each phenolic compound in bell pepper plays their own role in preventing oxidative
damage in human body. The function of the phenolic compounds were important
in promoting human health, sometimes acting as a barrier against diseases, such as
cancer and degenerative disorders. The phenolic compounds that present in bell
pepper and their functions are presented in the table below (Chávez-Mendoza et al.,
2015; Ksibi et al., 2015 and Lobo et al., 2010):

16
Table 2.1: Phenolic Compounds in Bell Pepper
Phenolic
Compounds
Examples Functions
Flavonoids -Quercetin
(Flavonol)
-Luteolin
(Flavone)
-Hesperidin
(Flavanone
glycoside)
- Prevent oxidation and hence,
significantly reduces oxidative damages to
body cells.
- Reduces the risk of degenerative diseases,
for instance cancer, cataracts, diabetes,
cardiovascular diseases, Parkinson’s and
Alzheimer’s disorders.
- Enhance optimal functioning of brain by
preventing the oxidation of essential fats
found in brain cells, preventing damages to
brain cells, further causing brain disorder,
for examples, Parkinson’s and
Alzheimer’s disorders.
Carotenoid -β-carotene Can act as anti-carcinogenic agent:
- Able to revise the liver metabolism
effects of carcinogens.
- Protect body against cancer due to its
immuno-enhancement property.

17
Table 2.1 (continued): Phenolic Compounds in Bell Pepper
Phenolic
Compounds
Examples Functions
Carotenoid -β-carotene Can act as anti-carcinogenic agent:
- Exhibit pro-vitamin A activity, hence it is
useful in inhibiting ultraviolet light
induced carcinogenesis.
- Prevent genetic damage from products
caused by oxidation.
Oxygenated
Carotenoids
-Capsantine
-Capsorubin
-Cryptocapsin
- Effective in quenching and neutralizing
free radicals.
-Lutein
(Xantophyll)
- Helps in the prevention of cataracts and
macular degeneration.
Capsaicinoi-
nds
-Capsaicin
-Dihydrocapsaicin
- Antimicrobial agent by inhibiting
microbial growth.
By referring to Table 2.1, the most abundant phenolic compounds that can be found
in bell pepper is flavonoids. Theoretically, carotenoid is categorized under
terpenoid group but after it is oxygenated (after accepting oxygen), it proclaimed
the ability to scavenge free radicals present in human body. Therefore, in this case,
oxygenated carotenoids (eg:capsantine, capsorubin and cryptocapsin) can be
known as phenolic compounds due to their antioxidant properties. On the other
hand, bell pepper is also well known for its high concentration of carotenoids, for

18
instance β-carotene and zeaxanthin as well as α-carotene, luteolin and
cryptoxanthin in lower concentration (Chávez-Mendoza et al., 2015). Some
carotenoids are antioxidant and some are not as they do not contain aromatic ring
with OH group attached to it.
2.1.5 Comparison between Different Colors of Bell Peppers
In some cases, green bell pepper is considered the immature form of bell pepper as
it had not been through maturity stage at which it was harvested from mother plant
before it ripe (premature harvesting). In this case, red bell pepper serves as the
mature (ripened) form (Shotorbani, Jamei and Heidari, 2012). As it goes through
maturity stage, its chlorophyll layer starts to degrade, eventually synthesizing
capsanthin and capsorubin, which contributes to the red color of red bell pepper
(Gomes et al., 2014). Colon carcinogenesis can be prevented by the increasingly
capsanthin (which made up half of total carotenoids in red bell pepper) and
capsorubin content in red bell pepper as it slowly getting mature (Gomes et al.,
2014). Besides, lycopene content in red bell pepper increases as well where this
exhibits beneficial effect on attacking certain types of cancer (Nadeem et al., 2011).
Maturation process changes the phytonutrient content, such as phenolic content of
bell pepper (Shotorbani, Jamei and Heidari, 2012). This was proven by a research
by Sun et al. (2007) where total phenolic test, FC method was performed to
differentiate the phenolic content between different colored bell peppers. As
determined by FC test, red bell pepper contains highest total phenolic content (4.2
µmol catechin equivalent/g) as compared to green (2.4 µg/g), yellow (3.3 µg/g) and

19
orange pepper (3.4 µg/g). On the other hand, β-carotene, capsanthin, quercetin and
luteolin content of red bell pepper was recorded as highest among green, yellow
and orange peppers with value of 5.4, 8.0, 34.0 and 11.0 µg/g respectively (Sun et
al., 2007). As proven by another study by Shotorbani, Jamei and Heidari (2012),
red bell pepper contains higher β-carotene as compared to green and yellow peppers
(9 times more than the green verison). Besides the difference in antioxidant content,
the ascorbic acid and capsaicinoids in red bell peppers are higher than green and
yellow bell peppers (Haejin et al., 2014). The ascorbic acid content increases
(double up compared to green bell peppers) may be due to more ascorbic acid is
synthesized to withstand and prevent tissues from oxidative stress induced by the
higher light intensities as the season goes by. Apart from that, the reason why more
capsaicinoids present in mature peppers is may be the capsaicin synthase
(biosynthetic enzyme) reaches its optimum temperature to produce capsaicin as the
temperature increases from 23.3 – 25.0 °C (immature stage) to 34.4 – 36.1 °C
(mature stage) (Haejin et al., 2014). Furthermore, the taste of peppers is also taken
into consideration where due to green bell peppers are prematurely harvested, so
they have more bitter taste compared to red bell peppers. The sweet and fruity taste
of red bell peppers is assumed to gain more interest from consumers than green
peppers. Hence, incorporation of red bell pepper is said to be more nutritious than
green and yellow pepper as suggested by previous studies because it contains higher
nutrients as well as phenolic compounds.

20
2.2 Water Activity (Aw)
The degradation and deterioration of food quality and safety are in positive
correlation with the aw of the food products. This is because aw represent the state
of the water, reflecting the amount of availability of water for microbial growth and
metabolic processes. Once the growth microorganisms reaches a certain level, the
particular food is declared spoiled. A food with higher aw is more susceptible to
microbial spoilage because if the amount of free water (unbound water) is higher,
the mobility of molecules in the system is higher and hence there are more free
water can be utilized by microorganisms for growth, fastening the food spoilage.
This is because water is the main criteria for microbial proliferation (Agoda-
Tandjawa, Dieudé-Fauvel and Baudez, 2016; Medvedová, Valík and Studeničová,
2009; Secchi et al., 2017). A study by Li et al. (2011) stated that they obtained a aw
value of 0.979 for noodles, indicating that noodles are high in aw and belong to high
moisture food, causing them to be susceptible to microbial spoilage. Song and Kang
(2016) reported that lower aw can decrease the D value of microorganism. Therefore,
there are several food preservation method, for example salting and dehydration
that can decrease the aw to an acceptable level in order to prevent early spoilage.
Foods will be safer with lower aw.

21
2.3 Proximate Analysis
Proximate analysis, includes analysis of moisture, ash, protein, fat, carbohydrate
and fiber content. These tests enable food manufacturers to identify the proximate
composition and nutritional value of a food compound. Noodles belong to high
moisture food as Li et al. (2016) stated that water content of noodles made up of
approximately 30 %, resulting in its susceptibility to microbial growth. This is
because previous studies by Li et al. (2011) showed that a water content of 23 –
24 % is sufficient for microbial growth. Red bell peppers are also high in minerals,
for instance, potassium, phosphorus and manganese (Kothari et al., 2010; Bello,
Boboye and Akinyosoye, 2015), hence ash content for red bell pepper is expected
to be increasing if more red bell peppers are incorporated. Due to red bell peppers
are a type of vegetables, so they definitely will contribute fiber to the food products,
hence noodles incorporated with red bell peppers should have higher fiber content
than control noodles and increasing from noodles with lower concentration of red
bell peppers to noodles with higher concentration of red bell peppers. There was
limited research on the fat and protein content of red bell peppers but as stated by
Ojure and Quadri (2012), the noodles itself may contribute to protein and little
amount of saturated fatty acids. A study by Nadeem et al. (2011) proposed that a
green bell pepper contains 0.33 g of fat, 0.99 g of protein, 10.63 g of carbohydrate,
2.73 g of dietary fiber, 46.79 Cal of calorie and 195.58 kJ of energy. However, there
was limited studies on the proximate composition of red bell pepper.

22
2.4 Other Studies Regarding Methods to Prolong the Shelf Life of Food
Products
2.4.1 Chemical Methods (Incorporation of Other Bioactive Compounds)
There are a few studies regarding the addition of bioactive compounds to noodles
in order to lengthen its shelf life. The details about those studies were presented in
Table 2.2:
Table 2.2: Studies Regarding Incorporation of Other Bioactive Compounds into
Foods to Inhibit Microbial Growth
Compounds Inhibitory Action
1. Flaxseed - Showed positive result in inhibiting mold spoilage on
noodle incorporated with:
6 % flaxseed flour: Inhibit the growth of Fusarium
graminearum and Aspergillus flavus (Xu et al., 2008)
9 % flaxseed flour: Reduce the growth count of
Penicillium chrysogenum and Penicillium sp. (Xu et al.,
2008).
2. Chitosan - Able to inhibit growth of total coliform, mesophilic
and psychrophilic bacteria and Staphylococcus sp. on
homemade fresh pasta (Del Nobile et al., 2009).
3. Grapefruit seed
extract (GFSE)
- Effective against total coliform, mesophilic and
psychrophilic bacteria and Staphylococcus sp. on
homemade fresh pasta (Del Nobile et al., 2009).

23
Table 2.2 (continued): Studies Regarding Incorporation of Other Bioactive
Compounds into Foods to Inhibit Microbial Growth
Compounds Inhibitory Action
4. Thymol - Antibacterial agent to reduce growth count of
mesophilic and psychrophilic bacteria and
Staphylococcus sp. on homemade fresh pasta (Del
Nobile et al., 2009).
2.4.2 Physical Methods (Packaging)
2.4.2.1 Modified Atmosphere Packaging (MAP)
Despite prolonging shelf life of food products by chemical methods (adding
bioactive compounds) as well as improving nutritional value or sensory properties
of foods, efforts should also be put on the physical methods, such as packaging of
the food products as packaging shields the products from the outer environment
and directly come in contact with the products, hence the types and quality of
packaging certainly exhibit effects on the products. For instance, modified
atmosphere packaging (MAP) can be implied on food products to prolong their
shelf life. As the name suggests, the atmospheric environment of the internal
packaging of food products are modified to a level that is not suitable for microbial
growth. Low oxygen (O2), high carbon dioxide (CO2) and suitable amount of
nitrogen (N2) are desired in MAP. This is because if CO2 presence at high level, it
is able to kill bacteria and fungi due to its bacteriostatic and fungistatic properties.
O2 level is preferable to be low because a lot of microbes are aerobic (requires O2

24
to survive). N2 is inert and will not react with any other molecules, it can maintain
the packaging shape by preventing it from collapsing (Sanguinetti et al., 2016).
2.4.2.2 Studies that Implied MAP on Food Products
Sanguinetti et al. (2016) conducted a study that they attempt to maintain safety and
prolong the shelf life of gluten-free fresh filled pasta by MAP. Their attempt was
successful because when the pasta was air-packed (normal packaging), their shelf
life was 14 days as after this certain period of time, visible mold was observed on
the surface of pasta. Molds only started to grow on the surface of pasta in MAP
starting from 42 days. Therefore, this study proved that the application of MAP is
an effective technique in extending the shelf life of pasta. In this research, if the
microbial colonies formed were too few to count (TFTC), the symbol “<” was
included in front of the cfu/g value. This symbol was convenient as whenever this
symbol was observed, it can be understand that pasta spoilage have not occur yet
as the colonies formed were TFTC, where the amount of microorganisms grew was
not sufficient to cause spoilage yet.
Apart from that, Secchi et al. (2017) also utilized MAP on whey cheesecakes to
extend their shelf life. In this case, MAP modifies the internal environment of the
packaging to an oxygen concentration of less than 1 % and carbon dioxide
concentration of more than 20 %, contributing to antimicrobial properties (Secchi
et al., 2017). In the research by Secchi et al. (2017), by modifying the internal
packaging environment to a ratio of 70:30 for nitrogen to carbon dioxide ratio, they

25
successfully extended the shelf life of whey cheesecakes to 45 days where control
cheesecakes can only stand for 11 days. A portion of the microbial counts for the
samples of whey cheesecakes were showed in the table below:
Table 2.3: Microbial Counts of Whey Cheesecakes Samples (cfu/g) after
Combining MAP and OVP Techniques in the Study of Secchi et al. (2017)
Microbial
Media
Experimental
Batches
Storage Time (Days)
0 10 20 40 60
PCA* Control <1.0 x
101
2.5 x
103
-** - -
MAP 7.3 x
102
1.2 x
103
2.8 x
106
2.7 x
106
-
*: PCA = Plate Count Agar.
** Sampling and Calculation on cfu/g was stopped due to visible mold growth on
cheesecakes.
As observed in Table 2.3, the cfu/g for control on day 0-10 was recorded as less
than (<) 1.0 x 101 because the colonies formed was too few to count and was
negligible. It was viewed as slight microbial contamination. Visible mold started to
grow on control plates starting from day 21 while cheesecakes with MAP managed
to stay mold-free until day 45. According to the results, MAP is able to retard
microbial growth and prevent early food spoilage, prolonging the shelf life.

26
CHAPTER 3
MATERIALS AND METHODS
3.1 Noodles Preparation
The basic ingredients for homemade noodles, wheat flour, water and salt as well as
the ingredient of interest of this project, red bell pepper (Capsicum annum L.) were
purchased from local supermarket, Tesco, Kampar. The basic ingredients needed
to prepare the dough for the control noodles were 100 g of flour, 46 mL of water
and 2 g of salt (pre-dissolve in water). These three ingredients were measured and
mixed together thoroughly until a consistent dough was formed. Then, the dough
was left to rest for 20 min. After 20 min, a domestic noodle making machine was
used to obtain dough sheets by gradually reducing the thickness of dough. It was
then sliced into noodle strands using the same machine. The noodle strands were
subjected to cooking for 6 min, drained for 10 min and packed into individual
plastic bag and lastly, they were stored at 4 ℃ refrigerator. Noodles incorporated
with 5, 10 and 20 % of red bell pepper were prepared. Fresh red bell pepper was
prepared and blended where the amount used was in accordance to the
concentration required (5, 10 or 20 %). Then, blended red bell pepper was mixed
with an appropriate amount of flour, water and salt as shown in Table 3.1 so that
the noodle with required concentration of red bell pepper can be prepared. The
dough sheeting, cooking, draining, packaging and storing procedures were similar
to preparation of control (Li et al., 2012).

27
Table 3.1: The ingredients (flour, salt, water and bell pepper) and their amount
required to be incorporated into control and noodle samples incorporated with 5,
10 and 20 % of bell pepper
Flour (g) Salt (g) Water (g) Bell Pepper
(g)
Total
weight of
dough (g)
0 % Bell
Pepper
67 2 31 0 100
5 % Bell
Pepper
64 2 29 5 100
10 % Bell
Pepper
60 2 28 10 100
20 % Bell
Pepper
53 2 25 20 100
3.2 Shelf Life Determination
3.2.1 Microbial Analysis
3.2.1.1 Total Plate Count (TPC)
The procedures for TPC was performed according to as stated by Li et al. (2016)
with slight modification. Twenty five grams of sample were sampled from the
cooked control noodles and noodle incorporated with 5 %, 10 % and 20 % bell
pepper which were stored in the refrigerator after preparing. Two hundred and
twenty five milliliters (mL) of sterile saline solution (0.85 % NaCl) was mixed with
each sample. A stomacher was used to homogenize the samples in a Stomacher bag
for 2 min. Sterile saline solution was serial diluted into several dilutions and this

28
was carried out by initially pipetting 1 mL of homogenized sample into a sterile
tube and then subsequently adding 1 mL of solution into the next solution, forming
dilution from 10-1 to 10-6. For microbial assessments, all agar and apparatus (such
as test tubes) were autoclaved at 121 ˚C for around 2 h before subjected to any
microbial tests. Sterile / autoclaved plate count agar (PCA) was poured into empty
sterile Petri plates and allowed for solidification. After solidification of agar, 0.1
mL of each dilution were pipetted into respective plates and then the inoculum was
spread plated evenly on the agar surface by glass spreader. Then, the plates were
labelled accordingly. For each dilution, two plates were spread-plated with 0.1 mL
inoculum of the same dilution (duplicate). Lastly, each PCA plates were incubated
at 37 ℃ for 48 h to detect if there is any growth of aerobic mesophilic bacteria
(AMB). This can be done by observing whether colonies are formed on the surface
of PCA plates for each plates. Only 25 to 250 colonies were taken into consideration
in calculating the cfu/mL and log cfu/g of the bacterial colonies grown on PCA
plates. Plates with less than 25 colonies were recorded as too few to count (TFTC)
while too numerous to count (TNTC) was recorded for plates with more than 250
colonies.

29
3.2.2.2 Yeast and Mold (YM)
Procedures of YM test were similar to TPC. The difference was the agar used for
YM test was acidified potato dextrose agar (PDA) instead of PCA. After spread
plating each dilution into respective plates, incubation condition of the plates were
set at 26 ℃ for 72 h. To detect if any YM present, whether or not colonies were
formed on the plates was observed (King et al., 1986; Phattra and Maweang, 2015).
Similar to TPC, TFTC was labelled if colonies were less than 25 colonies and if
more than 250 colonies, TNTC was labelled as the range of fungal colonies that
was included in the calculation was 25 to 250 colonies.
3.2.2 Water Activity (Aw) Test
Water activity of every noodle samples, including control were determined by
LabSwift-aw water activity meter (Brand name: Novasina) as mentioned by Xu et
al. (2008) with slight modification. The containers that were designed specifically
to be inserted into the water activity meter were filled up completely by control
noodles. Then, the container that contained the control sample was inserted into the
meter and the process of measuring the water activity of the noodles started when
“start” button was pressed. The final water activity value displayed on the screen
was recorded when “beeping” sound was heard. These steps were repeated by
replacing control with noodles incorporated with 5, 10 and 20 % of bell pepper.
30
3.3 Proximate Analysis
3.3.1 Moisture Content
The four cooked noodle (control, 5, 10 and 20 % bell pepper) were subjected to
moisture content analysis following Association of Official Analytical Chemist
(AOAC) 934.06 official method. Twelve empty aluminum pans were oven-dried
for 3 h at 105 ℃ until they reached a constant weight and transferred to desiccator
to cool. The pans were weighed. Approximately 6 g of the four samples were
weighed and added to respective aluminum pans. The samples were cut into smaller
pieces before adding to the pans and they were distributed evenly on the pans using
spatula. The sample-containing pans were dried in the oven for at least 7 h at 105
℃. They were cooled in desiccator after drying. Lastly, pans and their dried samples
were reweighed. Moisture content analysis for each sample was carried out in
triplicate. Moisture content (in percentage) of the samples can be determined using
equation below (Olivera and Salvadori, 2009; Kumoro, Johnny and Alfilovita,
2016):
M (%) = 𝑊𝑖− 𝑊𝑓
𝑊𝑖 x 100
Where,
M (%) = Percentage of the moisture content of samples (%)
Wi = Initial weight of noodle samples before drying (g)
Wf = Final weight of noodle samples after drying (g)

31
3.3.2 Ash Content
AOAC 923.03 method was applied to measure the total ash content of samples.
Incineration of 12 crucibles and their lids were carried out in a muffle furnace at
550 ℃ for 8 h or overnight to burn off impurities on the surface of the crucibles.
The crucibles were allowed to cool in a desiccator for 30 min and before weighing.
Each samples were used and approximately 1.5 g form each dried samples were
weighed into the respective crucibles. Hot plates were used to burn the crucibles
containing samples until no more fumes can be observed releasing from the samples.
The crucibles were then incinerated in muffle furnace. The furnace was gradually
increased to a temperature of 550 ℃ for at least 8 h until no black carbon particle
present to obtain permanent weight. The crucibles that contained the ash were
cooled in desiccator. The crucibles together with ash were weighed. The samples
should be subjected to further ashing in the furnace if the samples do not turn grey.
Ash analysis for each sample was carried out in triplicate. The ash content (in
percentage) can be determined using formula below (Ahmed, Qazi and Jamal, 2015;
Kumoro, Johnny and Alfilovita, 2016):
A (%) = (𝑊𝑎+ 𝑊𝑝)− 𝑊𝑝
𝑊𝑠 x 100
Where,
A (%) = Percentage of ash content of samples (%)
Wa = Weight of ash (g)
Wp = Weight of crucibles (g)
Ws = Weight of samples (g)

32
3.3.3 Protein Content
The determination of crude protein content in each samples followed AOAC 920.87
official method. Kjedahl method was carried out. Around 0.5 to 1.0 g of sample
was crushed into smaller pieces and wrapped in filter paper, followed by insertion
into digestion flask. Similarly, dried samples were required. Half spatula of Kjedahl
catalyst (CuSO4 and K2SO4) which were prepared beforehand at ratio of 1:10 and
200 mL of concentrated sulphuric acid (H2SO4) were added subsequently. The
flasks were placed in holder and subjected to digestion using digestion unit. They
were heated for 1 – 2 h and boiled briskly until the solution turned clear green. The
digestion process ended, and the digests were set to undergo distillation. The
solutions were cooled and were installed in the distillation unit. Twenty five
milliliters of 4 % boric acid was added into conical flask and mixed with 3 drops
of indicator (mixture of methyl red and bromocresol green), forming pink solution.
This is to provide visual color changes when it reaches its end point. The conical
flask was connected to the distillation unit and the distillation process was allowed
to begin where appropriate amount of distilled water and 32 % NaOH were added
subsequently. Changing of color from pink to blue color indicates distillation was
completed. After distillation, 0.2 N HCl was used in the titration process to get
titrated by the boric acid mixture. Titration was said to reach completion when the
blue color of the boric acid mixture changed from blue to pink. The crude protein
content (in percentage) was calculated using formula below (Ahmed, Qazi and
Jamal, 2015; Kumoro, Johnny and Alfilovita, 2016):

33
P (%) = (𝑉 𝑥 𝑁)𝑥 1.4007
𝑔
𝑚𝑜𝑙 𝑥 100 𝑥 6.25
𝑊
Where,
P (%) = Percentage protein content of samples (%)
V = Volume of 0.2 N HCl used in sample titration (mL)
N = Normality of HCl (N)
W = Weight of samples (g)
14.007 = Molecular mass of nitrogen
6.25 = Conversation factor of protein-nitrogen
3.3.4 Fat Content
Standard method of AOAC to determine crude fat in cooked noodle was followed.
Extraction beakers and boiling stones were placed in an oven at 105 ℃ for 1 h to
make sure the weight of all the beakers are stable. The weight of extraction beakers
together with boiling stones were recorded as M1. Three grams of the four dried
samples were weighed (M0). Filter papers were used to wrap the four dried samples.
The samples were inserted into respective extraction thimble and inserted into
respective beaker. Appropriate amount of solvent (petroleum ether) was added to
each beaker to make sure all the sample were fully immersed in the solvent. A piece
of cotton wool was inserted on top of the sample before connecting the beakers to
Soxtherm for fat analysis. Extraction of fat was carried out for approximately 2 h.
After extraction, the beakers containing boiling stones and extracted fat (if any)
were dried in oven at 105 ℃ as there may be remaining solvent that were not dry
off yet. They were cooled down in desiccator for 1 h. The thimble and boiling stones
34
were removed. The extraction beakers were reweighed (M2). Crude fat content (in
percentage) can be determined using formula below (Ahmed, Qazi and Jamal,
2015):
F (%) = (𝑀2− 𝑀1)
𝑀0 x 100
Where,
F (%) = Percentage of fat content of samples (%)
M0 = Weight of samples (g)
M1 = Weight of extraction beaker and boiling stones before extracting fat (g)
M2 = Weight of extraction beaker and extracted fat (if any) (g)
3.3.5 Fiber Content
Crucibles were pre-ashed for 30 min in muffle furnace at 600 ℃. The crucibles
were cooled in 105 ℃ oven for 30 min first then transferred to desiccator for 30
min, ready to be inserted with digested sample. RF fiber bags were dried in oven
for 1 h at 105 ℃ and then cooled for 30 min in desiccator. The weight of fiber bags
for samples were measured and recorded as M1 whereas fiber bag for blank was
recorded as B1. Glass spacer was inserted into fiber bag before adding dried samples
(M2) into the fiber bag. Fiber bags together with the glass spacers were loaded into
carousel and inserted into a beaker. Then, the dried samples were subjected to
digestion process using Gerhardt Fiberbag system. To digest fiber, a beaker that
contained the carousel was added with 360 mL of 0.13 mol/L H2SO4. The carousel
was rotated for about 1 min to mix the sample with H2SO4. The hot plate of the
Gerhardt Fiberbag system was preheat for 5 min before inserting the beaker. After

35
preheating, the beaker was placed on the hot plate and heated to boil. After the
solution start to boil, the hot plate setting was reduced to allow gentle simmering
for about 30 min. The carousel was removed from the beaker, the solution and
soluble within the beaker was discarded. The beaker was added with 360 mL of
0.313 mol/L NaOH before inserting carousels with fiber bags into the beaker.
Similarly, it was allowed for gentle simmering for 30 min after it boiled. Fiber bags
with glass spacers were unloaded from carousel and glass spacers and inserted into
the pre-ashed crucibles. They were dried for 4 hours or overnight in an oven at 105
℃ and then cooled in desiccator for 30 min. The weight of fiber bags, dried digested
samples and pre-ashed crucibles were recorded as M3 while empty fiber bags and
pre-ashed crucible were recorded as B3. Then, they were incinerated in muffle
furnace at 600 ℃ for 4 h or overnight. They were cooled in 105 ℃ oven for 30 min
and then in desiccator for 30 min. Weight of crucibles, fiber bag ash and sample
ash (M4) and weight of crucible and empty fiber bag ash (B4) were obtained. The
percentage of fiber of samples were obtained by using formula below (Kumoro,
Johnny and Alfilovita, 2016):
F (%) = (𝑀3− 𝑀1− 𝑀4)−[(𝐵3− 𝐵1− 𝐵4) 𝑥 100]
𝑀2
Where,
F (%) = The percentage of fiber
M1 = Weight of fiber bag for samples (g)
B1 = Weight of empty fiber bag as blank (without sample) (g)
M2 = Weight of sample (g)
M3 = Weight of fiber bags, dried digested samples and pre-ashed crucibles (g)

36
B3 = Weight of empty fiber bags and pre-ashed crucibles (g)
M4 = Weight of crucibles, fiber bag ash and sample ash (g)
B4 = Weight of crucible and empty fiber bag ash (g)
3.4 Total Phenolic Test
To quantify the total phenolic compound in each sample, FC’s reagent assay was
performed where the phenolic content were expressed as GA equivalents (mg/g).
Standard curve was generated by using the standard GA solution between the
concentrations of 0.05 to 0.35 mg/mL. A 0.5 mg/mL of standard GA solution was
used as the stock solution. In order to prepare the stock solution, distilled water was
used to slowly dissolved the 0.5 g of GA, then the overall volume of the solution
was topped up to 10 mL using 10 mL volumetric flask. Then, this stock solution
was further diluted into lower GA concentration, with lowest concentration (0.05
mg/mL) to highest concentration (0.35 mg/mL). Next, 0.1 mL of each concentration
(0.05 – 0.35 mg/mL) was pipetted using micropipette into a universal bottle and
mixed with 2 mL sodium bicarbonate (Na2CO3). Then, it was left undisturbed for
2 min. After the incubation period, 0.3 mL of 80 % ethanol was added before adding
0.1 mL of 1 N FC. The mixture was incubated for 30 min before obtaining its
absorbance at 720 nm using spectrophotometer. After obtaining all the absorbance
reading, a standard curve was plotted (y = 2.7299x and r2 = 0.9831; where y and x
stand for absorbance and Gallic acid concentration respectively while r2 represents
the correlation coefficient). For the samples, the phenolic compounds from each
sample (noodle incorporated with 5 %, 10 % and 20 % bell pepper) were extracted

37
by triturating 5 g of each sample with 20 mL of 80 % ethanol for 2 min, forming
extract with the concentration 250 µM. The procedure in adding respective
chemicals (Na2CO3, ethanol and FC), incubation time and measuring absorbance
of the samples were similar to the preparation of standard curve, the only difference
was GA used in preparation of standard curve was replaced with noodle samples.
The total phenolic content of each sample were calculated using the standard curve
obtained earlier. The unit of the total phenolic content obtained from the standard
curve would be mg/mL, it needs to be converted to mg/g before subjecting to data
analysis (Khare, Biswas and Sahoo, 2014; Materska and Perucka, 2005).
3.5 Sensory Evaluation
Hedonic test (9 point rating scale) was carried out to measure the acceptability of
the cooked noodle incorporated with 5, 10 and 20 % of bell pepper. Control was
also included in this sensory evaluation. An untrained panel of 50 consumers were
recruited. Appropriate amount of plastic containers were coded randomly according
to Table of Random Number. A master sheet was constructed. The cooked noodles
were placed in the coded plastic container accordingly and served randomly
according to the master sheet. Panelists were asked to rate the appearance, aroma
taste, texture and overall appearance of each of the samples based on 9-point rating
scale, with ‘Dislike Extremely’ (1) and ‘Like Extremely’ (9) at either end with a
middle point of ‘Neither Like nor Dislike’ (5). Water was provided so that panelists
can rinse their mouth between samples before rating. This was carried out in
isolated booths to avoid interference (Olivera and Salvadori, 2009).

38
3.6 Statistical Analysis
Statistical analysis of the data obtained from each test was similar to as stated by
Xu et al. (2008) with slight modification. SPSS software (Version 20) was used
instead of SAS software to conduct ANOVA to analyze the data obtained from each
tests. The means of the data were separated using Tukey test at a 95 % confidence
interval (p<0.05) where means were significantly different from each other if
p<0.05 but not significantly different if p>0.05.

39
CHAPTER 4
RESULTS
4.1 Shelf Life Determination
4.1.1 Microbial Analysis
4.1.1.1 Total Plate Count (TPC)
The cfu/g and log cfu/g for each sample (control and noodles incorporated with 5,
10 and 20 % of bell pepper) were calculated at 2 days interval starting from the day
the noodles were prepared (day 0) to day 8. Therefore, in TPC test, two factors,
which were days and noodle samples were involved. After conducting ANOVA, it
was showed that there were significant difference (p<0.05) among the log cfu/g for
all the samples, including control. Furthermore, the microbial count for the noodle
samples were also significantly different (p<0.05) from each other at different days.
Hence, there were significant difference (p<0.05) for both of the factors. This can
be observed more clearly by the indication of superscript next to the mean value of
the respective log cfu/g at which the mean were compared and separated by Tukey
post hoc test to identify which mean was significantly different (p<0.05) from the
others. According to Table 4.1, TPC results showed that all the plates of control
and noodles incorporated with 5, 10 and 20 % of bell pepper started to have
bacterial growth at day 4. Starting from day 4, log cfu/g for control were recorded
as more than 4.06. Noodles incorporated with 5 and 20 % of bell pepper shared
similar trend in their log cfu/g where both of them increased from day 4 to 8.
However, there was an exception with noodles incorporated with 10 % of bell

40
pepper as it displayed different trend. Its microbial count decreased at day 6 (less
than 3.06 log cfu/g) compared to day 4 (less than 3.36 log cfu/g) then increased
again at day 8 (3.84 log cfu/g). By referring to Australian Standard (1993) and Food
and Drug Administration Philippines (2013), noodles are declared spoiled when its
bacterial count exceeded 105 cfu/g. Therefore, noodles incorporated with 5 and 20 %
bell pepper spoiled at day 8 and day 6 respectively as their cfu/g exceeded 105 cfu/g
at this point. Control was considered spoiled since day 4 because the cfu/g value
was more than 1.14 x 10⁴. Although it did not has an exact value, but it was
considered spoiled because the colonies formed on all of the plates were too
numerous to count. Overall, the log cfu/g for noodles incorporated with 20 % of
bell pepper was the highest at day 8, indicating it spoiled the most compared to
others. This showed that capsaicin in bell peppers exhibit low effectiveness of
antimicrobial inhibitory effect. This is because although the log cfu/g of noodles
incorporated with 5 and 10 % of bell pepper were lower than control (more than
4.06 log cfu/g) at day 4 and 6, but the log cfu/g of noodles incorporated with 20 %
of bell pepper was higher than control at day 6 (5.25 log cfu/g) and was the highest
(6.23 log cfu/g) at day 8.

41
Table 4.1: Microbial count of control and noodle samples (with 5, 10 and 20 % of
bell pepper incorporation) using TPC method at day 0, 2, 4, 6 and 8
Day 0 Day 2 Day 4 Day 6 Day 8
Noodles incorporated with 0 % of Bell Pepper
Cfu/g - - >1.14 x 10⁴ >1.14 x 10⁴ >1.14 x 10⁴
Log cfu/g - - >4.06aA >4.06aB >4.06aC
Noodles incorporated with 5 % of Bell Pepper
Cfu/g - - <1.14 x 10³ 2.35 x 10³ 1.18 x 10⁶
Log cfu/g - - <3.06cD 3.37bC 6.07aB
Noodles incorporated with 10 % of Bell Pepper
Cfu/g - - <2.27 x 10³ <1.14 x 10³ 6.90 x 10³
Log cfu/g - - <3.36bC <3.06cD 3.84aD
Noodles incorporated with 20 % of Bell Pepper
Cfu/g - - 4.15 x 10³ 1.77 x 10⁵ 1.71 x 10⁶
Log cfu/g - - 3.62cB 5.25bA 6.23aA
A-D: Data within the same column with same superscript are not significantly
different (p>0.05) while data with different superscript are significantly different
(p<0.05). a-c: Data within the same row with same superscript are not significantly different
(p>0.05) while data with different superscript are significantly different (p<0.05).

42
4.1.1.2 Yeast and Mold (YM)
Similar to TPC test, fungal count for YM was also conducted at 2 days interval for
all the samples, including control. There were significant difference (p<0.05)
among samples and days as indicated by the superscript next to each mean value
(Table 4.2). Superscripts were determined by Tukey test which separated the means
of each sample. According to Table 4.2, all plates except plates for noodles
incorporated with 10 % of bell pepper started to have fungal growth at day 4. In
this case, uncommon results were obtained for control and noodles incorporated
with 10 % of bell pepper because for noodles incorporated with 10 % of bell pepper,
there was no fungal growth at day 4 but instead, its fungal count started at day 6.
However, the count at day 8 (5.54 log cfu/g) was even lower than count on day 6
(6.38 log cfu/g). Fungal growth for control was unusual as the log cfu/g was higher
at day 4 (less than 3.36 log cfu/g) compared to day 6 (less than 3.08 log cfu/g) and
day 8 (less than 3.06 log cfu/g) where day 8 had the lowest count. According to the
results, noodles with 10 % of bell pepper was considered as spoiled as its yeast and
mold count (2.38 x 10⁶ cfu/g) exceeded the cut-off between spoiled and unspoiled
noodles (105 cfu/g) (Australian Standard, 1993; Food and Drug Administration
Philippines, 2013) at day 6. Even although its count decreased on day 8 and became
lower than day 6, but its count still exceeded 105 cfu/g at day 8.
Noodles with 5 and 20 % of bell pepper showed similar trend as in TPC where their
count gradually increased from 3.57 and 4.38 log cfu/g to 6.39 and 7.04 log cfu/g
respectively from day 4 to day 8. These two types of noodles were declared as

43
spoiled at day 8 and 6 respectively as they exceeded the cut-off point (105 cfu/g)
(Australian Standard, 1993; Food and Drug Administration Philippines, 2013).
Similar to TPC, noodles with 20 % of bell pepper had highest log cfu/g (7.04 log
cfu/g) and considered spoiled the most among others at day 8.
Table 4.2: Fungal count of control and noodle samples (with 5, 10 and 20 % of bell
pepper incorporation) using YM method at day 0, 2, 4, 6 and 8
Day 0 Day 2 Day 4 Day 6 Day 8
Noodles incorporated with 0 % of Bell Pepper
Cfu/g - - <2.27 x 10³ <1.19 x 10³ <1.14 x 10³
Log cfu/g - - <3.36aC <3.08bD <3.06cD
Noodles incorporated with 5 % of Bell Pepper
Cfu/g - - 3.75 x 10³ 1.26 x 10⁴ 2.43 x 10⁶
Log cfu/g - - 3.57cB 4.10bC 6.39aB
Noodles incorporated with 10 % of Bell Pepper
Cfu/g - - - 2.38 x 10⁶ 3.43 x 10⁵
Log cfu/g - - - 6.38aA 5.54bC
Noodles incorporated with 20 % of Bell Pepper
Cfu/g - - 2.40 x 10⁴ 1.01 x 10⁶ 1.09 x 10⁷
Log cfu/g - - 4.38cA 6.00bB 7.04aA
A-D: Data within the same column with same superscript are not significantly
different (p>0.05) while data with different superscript are significantly different
(p<0.05). a-c: Data within the same row with same superscript are not significantly different
(p>0.05) while data with different superscript are significantly different (p<0.05).

44
4.1.2 Water Activity (Aw) Test
Two factors were included in water activity test, which were the different samples
and days. Results showed that there were no significant difference (p>0.05) among
the samples as well as days. According to Table 4.3, mean water activity value for
each sample on different days showed no significant difference (p>0.05). Noodle
samples shared a mean value of 0.978 ± 0.00 at which this value was determined
by obtaining the overall mean value of the mean value of samples and days.
Table 4.3: Water activity of control and noodle samples (with 5, 10 and 20 % of
bell pepper incorporation) at day 0, 2, 4, 6 and 8
Day 0 Day 2 Day 4 Day 6 Day 8 Mean
Noodles incorporated with 0 % of Bell Pepper
Average
Aw
0.978aA
± 0.00
0.977 aA
± 0.00
0.978aA
± 0.00
0.978aA
± 0.00
0.978aA
± 0.00
0.977aA
± 0.00
Noodles incorporated with 5 % of Bell Pepper
Average
Aw
0.978aA
± 0.00
0.977aA
± 0.00
0.978aA
± 0.00
0.980aA
± 0.00
0.979aA
± 0.00
0.978aA
± 0.00
Noodles incorporated with 10 % of Bell Pepper
Average
Aw
0.977aA
± 0.00
0.977aA
± 0.00
0.977aA
± 0.00
0.978aA
± 0.00
0.978aA
± 0.00
0.977aA
± 0.00
A: Data within the same column with same superscript are not significantly different
(p>0.05). a: Data within the same row with same superscript are not significantly different
(p>0.05).

45
Table 4.3 (continued): Water activity of control and noodle samples (with 5, 10
and 20 % of bell pepper incorporation) at day 0, 2, 4, 6 and 8
Day 0 Day 2 Day 4 Day 6 Day 8 Mean
Noodles incorporated with 20 % of Bell Pepper
Average
Aw
0.979aA
± 0.00
0.978aA
± 0.00
0.977aA
± 0.00
0.979aA
± 0.00
0.978aA
± 0.00
0.978aA
± 0.00
Mean 0.978aA
± 0.00
0.977aA
± 0.00
0.977aA
± 0.00
0.979aA
± 0.00
0.978aA
± 0.00
0.978 ±
0.00
A: Data within the same column with same superscript are not significantly different
(p>0.05). a: Data within the same row with same superscript are not significantly different
(p>0.05).
4.2 Proximate Analysis
For proximate analysis, as stated in Table 4.4, only ash and fiber content showed
significant difference (p<0.05) among samples while the samples were not
significantly different (p>0.05) from each other in moisture, fat and fiber content.
Table 4.4: Moisture, ash, protein, fat and fiber content of control and noodle
samples (with 5, 10 and 20 % of bell pepper incorporation)
Content (%)
Moisture Ash Protein Fat Fiber
0 % Bell
Pepper
71.33a
± 7.25
1.01c
± 0.09
29.07a
± 0.36
0.00a
± 0.00
0.14c
± 0.01
5 % Bell
Pepper
69.73a
± 0.80
1.13c
± 0.01
29.13a
± 0.11
0.00a
± 0.00
0.29b
± 0.02

46
a-c: Data within the same column with same superscript are not significantly
different (p>0.05) while data with different superscript are significantly different
(p<0.05).
Table 4.4 (continued): Moisture, ash, protein, fat and fiber content of control and
noodle samples (with 5, 10 and 20 % of bell pepper incorporation)
Content (%)
Moisture Ash Protein Fat Fiber
10 % Bell
Pepper
68.02a
± 1.57
1.26b
± 0.03
29.19a
± 0.31
0.00a
± 0.00
0.40b
± 0.04
20 % Bell
Pepper
67.46a
± 1.14
1.47a
± 0.01
29.28a
± 0.44
0.00a
± 0.00
0.58a
± 0.04
a-c: Data within the same column with same superscript are not significantly
different (p>0.05) while data with different superscript are significantly different
(p<0.05).
4.2.1 Moisture Content
Moisture content slightly decreased from control (71.33 ± 7.25 %) to noodles
incorporated with 20 % of bell pepper (67.46 ± 1.14 %) but there were no
significant differences (p>0.05) noticed among all samples, including control.
4.2.2 Ash Content
Control and noodles incorporated with 5, 10 and 20 % of bell pepper were
incinerated until grey pinkish ash were obtained for each sample. According to
Table 4.4, ash content showed significant increase (p<0.05) from control (1.01 ±
0.09 %) to noodles incorporated with 20 % of bell pepper (1.47 ± 0.01 %). The ash
content of control was significantly different (p<0.05) from noodle incorporated

47
with 10 % (1.26 ± 0.03 %) and 20 % (1.47 ± 0.01 %) of bell pepper but showed
no significant difference (p>0.05) with the noodles incorporated with 5 % of bell
pepper (1.13 ± 0.01 %). The ash content of each samples were showed in Table 4.5
and 4.6.
Table 4.5: Images of ash content for control and noodles with 5 % of bell pepper
Control Noodles incorporated with 5 % of bell
pepper
Figure 4.1: Ash of control
Figure 4.2: Ash of noodles with 5 % of
bell pepper
Table 4.6: Images of ash content for noodles with 10 and 20 % of bell pepper
Noodles incorporated with 10 % of
bell pepper
Noodles incorporated with 20 % of
bell pepper
Figure 4.3: Ash of noodles with 10 %
of bell pepper
Figure 4.4: Ash of noodles with 20 %
of bell pepper

48
4.2.3 Protein Content
There was a slight increase in protein content from the lowest protein content of
control noodles (29.07 ± 0.36 %) to the noodles with 20 % of bell pepper that
contained the highest protein content (29.28 ± 0.44 %). However, the increase in
protein content was not significant (p>0.05). Figure 4.5 showed the clear green
solution of each sample after digestion process.
Figure 4.5: Color of the solution of control noodles and noodle samples
incorporated with 5, 10 and 20 % of bell pepper in digestion tube after digestion
process. (From left to right: Control, noodles with 5, 10 and 20 % of bell pepper)

49
4.2.4 Fat Content
Fat for each sample were extracted using Soxtherm analyzer as shown in Figure
4.6. However, no fat was detected for each of the sample, hence recorded as 0.00 ±
0.00 %. Hence, the fat content of each sample were not significantly different from
each other (p>0.05) as no results were obtained.
Figure 4.6: Images of fat extraction using Soxtherm analyzer
4.2.5 Fiber Content
The fiber content for control was the lowest (0.14 ± 0.01 %). Fiber content
increased as higher concentration of bell peppers were incorporated into the noodles
with the highest fiber content in noodles incorporated with 20 % of bell pepper
(0.58 ± 0.04 %), showing a significant increase (p<0.05) in fiber content. Noodles
with 5 and 10 % of bell pepper did not differ from each other but they differed from
control and noodles with 20 % of bell pepper. The fiber content of control and
noodles with 20 % of bell pepper were significantly different (p<0.05) from each
other as well.

50
4.3 Total Phenolic Test
4.3.1 Standard Curve
The initially colorless GA turned to blue color where the intensity of the blue color
was in correspondence with the GA concentration (Figure 4.8). The higher GA
concentration, the higher intensity of blue color of the solution. Different GA
concentration, ranging from 0.05 to 0.35 mg/mL were subjected to FC assay,
obtaining absorbance that correspond to the respective GA concentration. By
plotting the absorbance obtained against their corresponsive GA concentration,
standard curve as shown in Figure 4.7 was obtained.
Figure 4.7: Standard curve of absorbance against Gallic acid concentration
y = 2.7299x
R² = 0.9831
0
0.2
0.4
0.6
0.8
1
1.2
0 0.05 0.1 0.15 0.2 0.25 0.3 0.35 0.4
Ab
sorb
an
ce (
A)
Gallic Acid Concentration (mg/mL)
Standard Curve
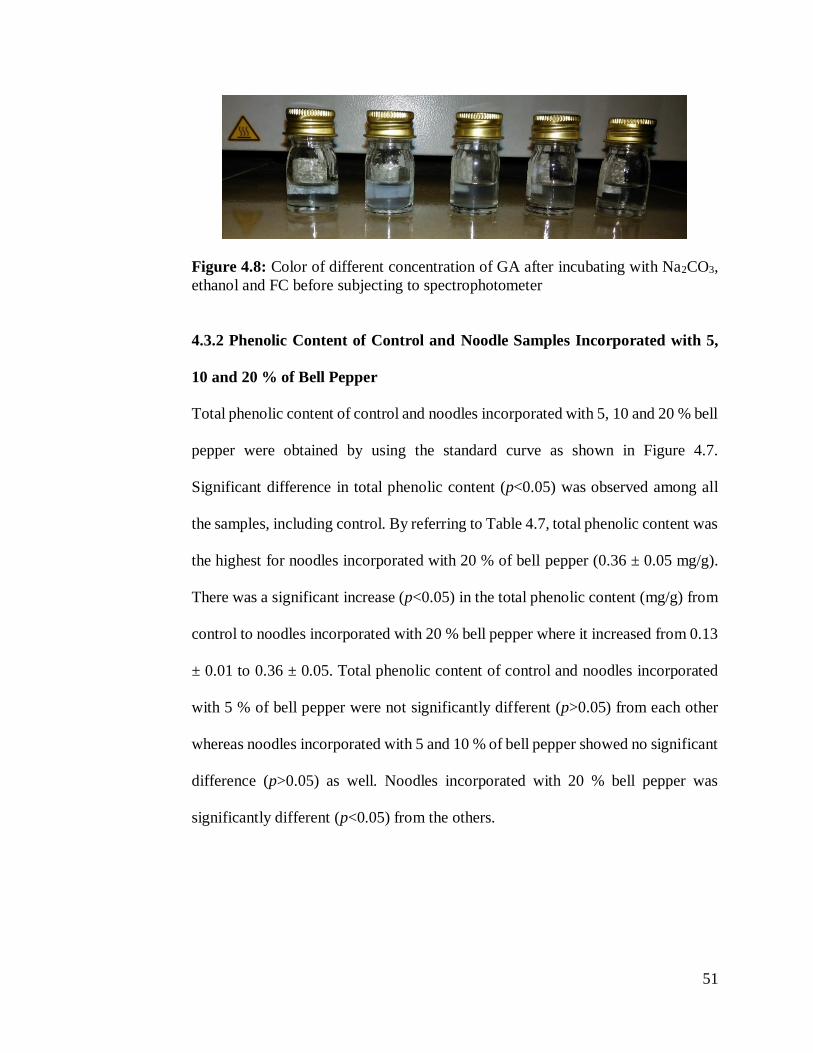
51
Figure 4.8: Color of different concentration of GA after incubating with Na2CO3,
ethanol and FC before subjecting to spectrophotometer
4.3.2 Phenolic Content of Control and Noodle Samples Incorporated with 5,
10 and 20 % of Bell Pepper
Total phenolic content of control and noodles incorporated with 5, 10 and 20 % bell
pepper were obtained by using the standard curve as shown in Figure 4.7.
Significant difference in total phenolic content (p<0.05) was observed among all
the samples, including control. By referring to Table 4.7, total phenolic content was
the highest for noodles incorporated with 20 % of bell pepper (0.36 ± 0.05 mg/g).
There was a significant increase (p<0.05) in the total phenolic content (mg/g) from
control to noodles incorporated with 20 % bell pepper where it increased from 0.13
± 0.01 to 0.36 ± 0.05. Total phenolic content of control and noodles incorporated
with 5 % of bell pepper were not significantly different (p>0.05) from each other
whereas noodles incorporated with 5 and 10 % of bell pepper showed no significant
difference (p>0.05) as well. Noodles incorporated with 20 % bell pepper was
significantly different (p<0.05) from the others.

52
Table 4.7: Absorbance and total phenolic content of control and noodle samples
incorporated with 5, 10 and 20 % of bell pepper
Total Phenolic Content (mg/g)
0 % Bell Pepper 0.13c ± 0.01
5 % Bell Pepper 0.16bc ± 0.01
10 % Bell Pepper 0.26b ± 0.00
20 % Bell Pepper 0.36a ± 0.05
a-c: Data within the same column with same superscript are not significantly
different (p>0.05) while data with different superscript are significantly different
(p<0.05).
Figure 4.9: Color of sample extract after incubating with Na2CO3, ethanol and FC
before subjecting to spectrophotometer

53
4.4 Sensory Evaluation
According to Table 4.8, out of five sensory attributes (appearance, aroma, taste,
texture and overall acceptance), only consumer acceptance for the taste attribute
showed significant difference (p<0.05) whereas consumer acceptability for the
appearance, aroma, texture and overall acceptance were not significantly different
(p>0.05). Consumer panelists tend to like and prefer noodles incorporated with 10 %
of bell pepper more than others with the highest acceptability of 53.33 ± 5.32 mean
score value. The taste attribute of noodles with 10 % of bell pepper was
significantly different (p<0.05) from control and noodles incorporated with 5 % of
bell pepper but not significantly different (p>0.05) from noodles incorporated with
20 % of bell pepper. In overall, the results showed that consumer panelists prefer
control noodles as the overall consumer acceptability for control was the highest
with a mean score value of 55.50 ± 6.89.

54
Table 4.8: Mean score value of sensory evaluation regarding appearance, aroma,
taste, texture and overall acceptance of control and noodle samples incorporated
with 5, 10 and 20 % of bell pepper
Appearance Aroma Taste Texture
Overall
Acceptance
0 % Bell
Pepper
57.00a
± 6.57
47.17a
± 5.91
44.50b
± 4.14
52.33a
± 8.29
55.50a
± 6.89
5 % Bell
Pepper
50.17a
± 6.52
47.00a
± 4.47
45.67b
± 4.68
50.83a
± 5.27
50.67a
± 6.68
10 % Bell
Pepper
51.33a
± 6.25
49.67a
± 5.75
53.33a
± 5.32
50.17a
± 3.76
50.50a
± 5.09
20 % Bell
Pepper
47.83a
± 5.74
48.83a
± 4.54
48.33ab
± 4.41
48.17a
± 7.20
46.50a
± 6.25
a-b: Data within the same column with same superscript are not significantly
different (p>0.05) while data with different superscript are significantly different
(p<0.05).

55
CHAPTER 5
DISCUSSION
5.1 Shelf Life Determination
5.1.1 Microbial Analysis
5.1.1.1 Total Plate Count (TPC)
TPC results showed that control noodles and noodles incorporated with 5 and 20 %
of bell pepper started to spoil at day 4, 8 and 6 respectively. Microbial count of
noodles with 10 % bell pepper did not exceed 105 cfu/g (Australian Standard, 1993;
Food and Drug Administration Philippines, 2013), so it was not considered spoiled
yet. According to Table 4.1, starting from day 4 to day 8, the colonies formed on
the plates of control were too numerous to count, no actual plates were available
for colonies counting, hence their log cfu/g was recorded as more than 4.06. There
are limited studies on the fluctuation of microbial count as indicated by noodles
incorporated with 10 % of bell pepper, it may be due to the environment condition
during preparation, cooking or storing process. Furthermore, it may be due to
technical error while pipetting. Pipetting error may occur if an inaccurate amount
of inoculum is pipetted and placed on the plates prior to spread plating where not
exactly 0.1 mL of inoculum was pipetted. Thus, microbial count on the plates may
be less accurate and inconsistent as the amount of inoculum pipetted was not
accurate and consistent. If lesser amount of inoculum containing the potential
bacteria was pipetted, there may be lower microbial count at day 6. Apart from that,
improper way of sterilization of glass spreader prior to spread plating may also be

56
a factor in decreasing microbial count at day 6. The glass spreader was flamed using
Bunsen burner to sterilize it before spread plating. After sterilizing, the glass
spreader may not be cool enough and when the still-hot glass spreader may kill off
some bacteria when it came in contact with inoculum to spread them evenly on the
surface of the plates, leading to lower microbial count due to the death of some
bacteria. Besides, the bacteria grow on this types of noodles at day 6 may be
psychrophilic bacteria (bacteria that are able to grow under cold condition) as they
were stored at a refrigerator at 4 °C. Therefore, incubation temperature of TPC
(37 °C) might not be suitable to recover this type of bacteria. However, this
argument needs to be further studied as there was limited research on this.
Supposedly, noodles incorporated with bell pepper should be able to inhibit
microbial growth and has lower microbial count than control due to the presence of
capsaicin. However, the results showed that the log cfu/g of noodles incorporated
with 20 % of bell pepper was the highest at day 8. Researches performed by Li et
al. (2013) and Li et al. (2014), they stated that large amount (approximately 61 %)
of the capsaicin would be lost during preparation if directly incorporated into
noodles. Boiling or cooking process may cause a moderate decrease in the
capsaicinoids content (Loizzo et al., 2015). Othman et al. (2011) conducted a
research to determine the amount of capsaicin and dihydrocapsaicin in capsicum
sp. Their results revealed that the capsaicin amount (mg/g) in red bell pepper is
negligible, reflecting the low concentration of capsaicin in bell pepper. This was
strengthen by another statement by Bello, Boboye and Akinyosoye (2015) where

57
they stated that the concentration of capsaicin is negligible in sweet bell pepper but
hot chili or jalapeno peppers contains much higher capsaicin content. As a
consequence, the initially low concentration of capsaicin was reduced even more
after preparation and cooking process as indicated by the studies of Li et al. (2013),
Li et al. (2014) and Loizzo et al. (2015), leading to the inefficiency of bell pepper
in inhibiting microbial growth due to level of capsaicin is too low to perform its
antibacterial function. Furthermore, the moisture content of red bell pepper itself is
around 90 % (90.1 g in 100 g) (Rufián-Henares, J., Guerra-Hernández, E. and
García-Villanova, B., 2013), which is very high, hence after its incorporation into
noodle, the moisture content may induce more microbial growth, leading to the
higher log cfu/g of noodles incorporated with higher concentration of bell pepper.
In addition to the high moisture content, bell pepper is also rich in nutrients, such
as potassium and phosphorus (Jyoti, Syed and Pritee, 2014), providing a favorable
condition for microbial growth and catabolic activity as a study by Tahseen et al.
(2016) showed that a high amount of potassium and phosphorus were utilized by
bacteria for their proliferation, leading to the higher microbial count of noodles with
higher amount of bell pepper. In order to declare noodles are spoiled, the cfu/g
needs to be higher than 105 cfu/g (Australian Standard, 1993; Food and Drug
Administration Philippines, 2013) where in this case, noodles with 20 % bell pepper
perished the most at day 8 (1.71 x 10⁶ cfu/g). In addition, there may be some
interaction between the basic ingredients of the noodles (wheat flour, salt and water)
and composition of bell pepper that inhibit the bioactivity of the capsaicin in

58
constraining microbial growth. However, there was limited studies on the inhibitory
effect of noodles ingredients on the antimicrobial property of capsaicin.
5.1.1.2 Yeast and Mold Test (YM)
Noodles incorporated with 5 and 20 % of bell pepper perished at day 8 and 6
respectively while control’s fungal count did not the cut-off point (105 cfu/g)
(Australian Standard, 1993; Food and Drug Administration Philippines, 2013) and
noodles incorporated with 10 % of bell pepper started to perish at day 6 because
the samples exceeded 105 cfu/g at that respective day. The accuracy of results of
YM for the control and noodles incorporated with 10 % of bell pepper were less
convincing. YM results for control was considered less accurate and it should
follow the trend of TPC where the colonies formed should be too numerous to be
count as well. According to Table 4.2, the log cfu/g of control in YM were
decreasing from day 4 to day 8, which was absolutely not logic because as the day
progressed, the microbial growth should be increasing, there should be increment
in the log cfu/g of control (3.36) at day 4 and not reducing to less than log 3.06
cfu/g at day 8. This condition was again observed in the case of noodles
incorporated with 10 % of bell pepper where there was also a decline in the log
cfu/g (from 6.38 to 5.54 log cfu/g). All types of samples started to have fungi
growing on the plates at day 4, including the noodles with the highest percentage
(20 %) of bell pepper so there should be fungal count for noodles incorporated with
10 % of bell pepper starting at day 4. This condition and the decreasing of log cfu/g
might occur due to pipetting error when pipetting the inoculum onto acidified
59
potato dextrose agar (PDA) plates. Hence, lesser amount of inoculum that contained
the fungi may be cultured on the plates, leading to lesser fungal growth on acidified
PDA plates. Moreover, while sterilizing the glass spreader during spread plating,
the glass spreader may be still hot and not cool enough, hence killing off all or a
portion of the yeast and mold when the hot glass spreader came in contact with the
inoculum.
The reason why noodles incorporated with bell pepper had higher log cfu/g than
the control may be similar to TPC. The noodle cooking process may cause the loss
of capsaicinoids, causing reduction of the initially low concentration of capsaicin
to even lower level, and hence losing its effectiveness in inhibiting microbial
growth (Li et al., 2013; Li et al., 2014; Loizzo et al., 2015; Othman et al., 2011).
Furthermore, bell pepper now with low or without efficiency in antimicrobial
activities due to low level or even negligible capsaicin, the high moisture (90 %)
and nutrient content (contains potassium and phosphorus that are required for
microbial growth) may cause it to be more susceptible to fungal growth, hence
having higher log cfu/g than control (Jyoti, Syed and Pritee, 2014; Rufián-Henares,
J., Guerra-Hernández, E. and García-Villanova, B., 2013; Tahseen et al., 2016).
Control might not be as rich moisture and nutrient content as the bell pepper, so
there was lesser invasion of yeast and mold. Similar to TPC, there might be
inhibitory interaction between noodles ingredients and microbial activity of
capsaicin which results in the inefficiency of antimicrobial function of bell pepper.
However, this needs to be further studied.

60
5.1.2 Water Activity (Aw) Test
There was no significant difference in the aw of all samples including control
(p>0.05) where they all shared a mean value of 0.978 (± 0.001) according to Table
4.3. This is because noodles belong to high moisture food (Li et al., 2012). This
may be due to the cooking process of noodles, leading to its high moisture content
after absorbing the boiling water to get cooked. Then, the cooked noodles were
drained for 10 min to remove most of the water instead of drying in oven prior to
storing in a 4 °C refrigerator, leading to the high availability of water in noodles.
This is because this project was meant for homemade noodles, drying noodles in
oven is inconvenient for most people as normally, they will just prepare, cook and
store the noodles if there are any leftover. Unless, if he or she is interested to store
the noodles for a certain period of time, then he or she may try to dry the noodles.
However, this condition is a seldom case. Aw (0.978) of all the noodles was in
conformity with a research performed by Li et al. (2011) where this research
obtained aw of 0.979 for their control noodle. This enhance the accuracy of the aw
obtained in this project. Aw of 0.978 is high enough for microbial growth because
in order to inhibit the growth of most of the spoilage microorganisms, the aw needs
to be lower than 0.90 (Thomas et al., 2014). Incorporation of bell pepper did not
cause any difference in the aw of noodles, hence the noodles were still susceptible
to microorganisms and enzymatic activities. Aw was a factor that contribute to the
spoilage of all noodles samples including control because the higher the aw, the
more free water available for usage by microorganisms for their growth and
metabolic processes, the higher the microbial count and thus, the faster the food

61
spoilage. Therefore, aw of a food should be reduced to a level that microorganisms
could not multiply to avoid early food spoilage (Arslan and Özcan, 2011).
5.2 Proximate Analysis
The data for proximate analysis, including determination of moisture, ash, protein,
fat and fiber content were recorded in Table 4.4. By referring to Table 4.4, only ash
and fiber content showed significant difference among all noodles samples
(p<0.05), including the control. As shown in Figure 4.1, 4.2, 4.3 and 4.4, pinkish
grey ash were observed for each sample. Normally, ash appeared as whitish grey.
In this case, the pinkish grey color of the samples’ ash may be due to the red
coloration of bell pepper, contributed by capsanthin and capsorubin (Gomes et al.,
2014), hence the leftover minerals (ash) may appear as pinkish grey color. Bell
pepper is a good source of minerals, hence resulting in the increasingly ash content
from the noodles incorporated with lower to higher concentration of bell pepper (5
to 20 %) where it significantly increased (p<0.05) from control (1.01 ± 0.09 %) to
noodles with 20 % bell pepper (1.47 ± 0.01 %) (Bello, Boboye and Akinyosoye,
2015). Therefore, noodles incorporated with 20 % bell pepper has the highest ash
content because it contained the highest percentage of bell pepper. This is because
the minerals come from bell pepper, the more the bell pepper incorporated, the
higher the ash content.

62
For fiber analysis, noodles incorporated with 20 % of bell pepper contained the
highest percentage of fiber (0.58 ± 0.04 %) compared to other samples, including
control.
However, the moisture, protein and fat content were not significantly different
among all samples (p>0.05). For protein analysis, the samples were said to be
completely digested when clear green solution were formed for each samples as
shown in Figure 4.5 where nitrogen in the samples bind to the sulphate ion (SO42-)
contributed by the concentrated H2SO4 used for digestion of samples, forming
ammonium sulphate ((NH4)2SO4). The amount of nitrogen content was determined
by quantifying the volume of 0.2 N HCL needed to change the color of blue solution
to pink solution when end point was reached during titration process. By applying
the calculation in Chapter 3 to determine protein content, it can be observed that
the protein content slightly increased because there are traces of protein in bell
pepper (Nadeem et al., 2011).
There was a slight decline in moisture content from control to noodles incorporated
with 20 % bell pepper from (71.33 ± 7.25 %) to (67.46 ± 1.14 %). This may be due
to technical error while draining the noodles for 10 min after cooking and prior to
storage. Lastly, no fat was extracted from control and each sample so the value
recorded was zero for all of the noodle samples, including control. Supposedly,
there are little amount of saturated fatty acids in noodles (Ojure and Quadri, 2012),
it might be too little to be detected.

63
5.3 Total Phenolic Test
Folin-Ciocalteau assay was carried out to determine the total phenolic content of
control and noodles incorporated with 5, 10 and 20 % of bell pepper. Their total
phenolic content were quantified as Gallic acid equivalences (mg/g). It can be
observed in Table 4.7 that total phenolic content increased gradually from control
to noodles incorporated with 20 % of bell pepper, indicating a significant difference
(p<0.05) among them with the highest phenolic content was recorded as 0.36 ± 0.05
mg/g for noodles incorporated with 20 % of bell pepper, corresponding to their high
antioxidant activity. The phenolic content of the noodles was in accordance to its
antioxidant activity. Bell pepper is high in high phenolic compounds such as
flavonoids (eg: quercetin and luteolin) as well as carotenoids (β-carotene) and
oxygenated carotenoids (eg: capsorubin) (Chávez-Mendoza et al., 2015). Therefore,
the higher the concentration of bell pepper incorporated, the higher the total
phenolic content. This could be reflected by the results in Table 4.7. Blue color
solution was observed as shown in Figure 4.9 due to reduction of FC agent into
phosphotungstate and phosphomolybdenum, forming a blue chromophore
(Blainski, Lopes and de Mello, 2013). The higher the intensity of the blue complex,
the higher the total phenolic content as more phenolic compounds were reduced by
FC reagent, hence developing more blue complexes. Spectrophotometer is used to
measure the absorbance of the blue chromophores, hence the absorbance reflects
the total phenolic content. The wavelength that needs to be set to read the
absorbance varies among different product. In this case, the suitable wavelength to
measure absorbance in noodles incorporated with bell pepper was 720 nm (Khare,

64
Biswas and Sahoo, 2014). The possible reason why wavelength was set at 720 nm
is at this wavelength, the wavelength can be absorbed best by the phenolic
compounds of bell pepper and showed the most accurate absorbance value,
reflecting the total phenolic content of the noodle samples, including control.
However, by comparing to the results of a research on the total phenolic content of
red bell pepper conducted by Shotorbani, Jamei and Heidari (2013), the phenolic
content extracted from fresh red bell pepper was around 3.25 mg/g which was much
more higher than the noodles with the highest phenolic content compared to others
in this project, which was the noodles incorporated with 20 % of red bell pepper
(0.36 ± 0.05 mg/g). In the research of Shotorbani, Jamei and Heidari (2013), the
phenolic content was directly extracted from red bell pepper without incorporating
into food matrix and cooking. This is because volatilization and thermal
decomposition may be induced by the heat exerted during cooking process (Silva
et al., 2013), leading to the loss of phenolic content. This argument is also supported
by another study where it stated that significant losses of phenolic content would
occur due to cooking because the cooking heat exerted on the food incorporated
with phenolic compounds would dehydrate and reduce the stability of the food
matrix when the food is completely in contact with the boiling water, leading to
leakage of phenolic compounds from the food (Loizzo et al., 2015). According to
Materska and Perucka (2005), low temperature would also exhibit negative effect
on total phenolic content of the food. The ice crystals formed at low temperature
may induce loss of phenolic compounds from food as the membrane of matrix is

65
damaged (Materska and Perucka, 2005). In this case, the phenolic content in bell
pepper was first blended and incorporated into noodles. During this process, the
oxidation of the phenolic content may occur, reducing the phenolic content. In
addition to this, the noodles with bell pepper were subjected to cooking, leading to
the loss of more phenolic content as this was proven by previous studies. This could
be the reason that leads to the low efficiency of microbial inhibitory effect as
discussed in TPC and YM. This is because phenolic compounds with antioxidant
properties are able to cause the death of microorganisms by binding to the microbial
cell wall, soluble and extracellular proteins to form complexes, destructing the cell
wall and hence, killing the microorganisms (Bello, Boboye and Akinyosoye, 2015).
As a result, the total phenolic content directly extracted from red bell pepper
without any treatment (eg: cooking) has higher phenolic content than those
subjected to treatment.
5.4 Sensory Evaluation
A total of 50 panelists participated in the sensory evaluation of control and noodles
incorporated with 5, 10 and 20 % of bell pepper to evaluate their sensory attributes,
which were appearance, aroma, taste, texture and overall appearance by using 9-
scale hedonic test. Most of the panelists (35 of them) were female where there was
only 15 male panelists who took part in this session. Due to the sensory evaluation
was conducted at food science laboratory, majority of the panelists (40 of them)
were students while 9 lecturers were invited to test the control and samples and
there was 1 panelist who work as a microbiologist. Table 4.8 showed that out of all
66
five sensory attributes, only taste attribute was significantly different among control
and samples (p<0.05). Panelists have highest acceptance for the noodle
incorporated with 10 % bell pepper with mean score value of 53.33 ± 5.32. This
may be due to the characteristic taste contributed by the bell pepper. However, they
do not prefer noodle incorporated with 5 and 20 % bell pepper because they may
think that taste contributed by 5 % bell pepper was too little to be traced while taste
of 20 % bell pepper was too intense. As shown in Table 4.8, the mean value of
appearance, aroma, texture and overall appearance for the control and each sample
shared the same superscript, indicating they were not significantly different from
each other (p>0.05). Panelists may find it hard to differentiate these four attributes
because they were untrained. For some panelists, this was their first time taking part
in a sensory evaluation. Due to lack of practice and unsure on how to evaluate and
score the intensities of sensory attributes, majority of the panelists tend to score “5”
(Neither like nor dislike) for each attribute. Although there was no significant
difference (p<0.05) in the overall acceptance, but it can be observed that panelists
preferred control more than others in overall with a mean score value of 55.50 ±
6.89, this may be because panelists are not ready to accept new flavored noodle as
the mean score value of appearance (57.00 ± 6.57) and texture (52.33 ± 8.29) were
also higher for control compared to other samples as well. Consumers may not be
able to accept the reddish color of noodles contributed by the capsanthin and
capsorubin of red bell pepper as well as the texture of noodles after incorporation
of bell pepper.

67
5.5 Future Study
A research by Othman et al. (2011) showed that there was negligible amount of
capsaicin in bell pepper, contributing to the condition that bell pepper is less
effective in inhibiting microbial growth. Therefore, for future study, bell pepper
can be replaced by other capsicum sp. which has higher capsaicin content, so it can
do a better job in prolonging shelf life of noodles due to its better microbial
inhibitory effect. For instance, hot chili or jalapeno peppers which contain higher
concentration of capsaicin (Bello, Boboye and Akinyosoye, 2015) may act as an
alternative to bell pepper as natural preservative in noodles or other kind of food
with lower moisture content.
Due to higher concentration of capsaicin incorporated, to prevent the capsaicin
from causing too much spiciness in the mouth, retention of the capsaicin should be
carried out. In order to achieve this, layered noodles can be prepared by having
capsaicin-enriched dough as the middle layer, getting sandwiched by two layers of
gastro-resistant wheat flour dough. As a result, this suits consumers who cannot
withstand the intense spiciness caused by the high capsaicin content in the mouth
while chewing because capsaicin-enriched layered noodles enables capsaicin to be
released only when it reached stomach and small intestine (Li et al., 2011).
Three layers of noodles may be too tough for certain consumers. Therefore, soy
protein isolate and microbial transglutaminase can be added to soften the texture of
the noodles to a desirable level that can accepted by the consumers (Li et al., 2011).

68
CHAPTER 6
CONCLUSION
In conclusion, incorporation of red bell pepper (capsicum annum L.) into
homemade noodles was found out to be less effective in prolonging the noodles’
shelf life, indicating the low efficiency of microbial inhibitory effect of capsaicin
due to loss of capsaicin during noodles preparation. TPC and YM assays showed
that the newly formulated noodles incorporated with 5, 10 and 20 % of bell pepper
started to have microbial count at day 4, showed no difference compared to control
which also had microbial growing at the same day but control had higher microbial
count. The microbial growth for noodles with the highest concentration of bell
pepper (20 %) was highest at day 8 where its count for bacterial and fungal growth
as determined by TPC and YM assay were recorded as 6.23 and 7.04 log cfu/g
respectively. Water activity for all the samples, including control shared mean value
of 0.978 ± 0.00, indicating the susceptibility of noodles to microbial spoilage.
Nutritional value in term of ash and fiber content of noodles increases along with
incorporation of bell pepper into noodles. Ash and fiber content showed significant
increase (p<0.05) in noodles as more bell pepper was incorporated. Noodles with
20 % bell pepper contained highest ash (1.47 ± 0.01 %) and fiber content (0.58 ±
0.04 %) compared to the ash (1.01 ± 0.09 %) and fiber content (0.14 ± 0.01 %) of
control. However, all samples did not showed significant difference (p>0.05) in
moisture, protein and fat content.

69
Noodles with 20 % of bell pepper contained highest total phenolic content (0.36 ±
0.05 mg/g) as bell pepper is rich in phenolic compounds (eg: flavonoids), showing
highest antioxidant activities. Antioxidant activities can be related to antimicrobial
activities as binding of antioxidants to microbial cell wall can disrupt the cell wall,
killing the microorganism and can prolong the shelf life of food product.
For sensory evaluation, although results showed that consumers prefer the taste of
noodles with 10 % of bell pepper (53.33 ± 5.32 mean score value) with a significant
difference (p<0.05) from control and noodles with 5 % of bell pepper, consumers
may not be ready to accept noodles with bell pepper because the overall acceptance
was the highest for control (55.50 ± 6.89 mean score value). This may be due to
they could not accept the appearance and texture after incorporating noodles with
bell pepper as for control, these two attributes had highest mean score value of
(57.00 ± 6.57 mean score value) and (52.33 ± 8.29 mean score value) respectively.
Thus, the outcome of this project suggested that red bell pepper is not an effective
natural preservative in prolonging shelf life of homemade noodles because the
initially low capsaicin content in red bell pepper is reduced to a negligible level
after preparation and cooking process, hence reducing its efficiency in microbial
inhibitory effect. Although noodles with highest concentration of bell pepper (20 %)
had highest total phenolic content, the amount may not be significant enough to
inhibit microbial growth. There may be some loss of phenolic compounds through
cooking, oxidation and low temperature during storage.

70
REFERENCES
Agoda-Tandjawa, G., Dieudé-Fauvel, E. and Baudez, J., 2016. Water Dynamics
and Time-dependent Structural Changes of Aqueous Dispersions of
Laponite: Linking Water Activity and Rheology. Applied Clay Science,
132-133, pp. 528 – 534.
Ahmed, I., Qazi, I. and Jamal, S., 2015. Quality evaluation of noodles prepared
from blending of broken rice and wheat flour. Starch - Stärke, 67(11-12),
pp.907.
Akhigbemidu, W., Musa, A. and Kuforiji, O., 2015. Assessment of the Microbial
Qualities of Noodles and the Accompanying Seasonings. Nigerian Food
Journal, 33(1), pp. 48 – 53.
Arslan, D. and Özcan, M., 2011. Dehydration of Red Bell Pepper (Capsicum annum
L.): Change in Drying Behavior, Color and Antioxidant Content. Food and
Bioproducts Processing, 89(4), pp. 504 – 513.
Australian Standard: Methods for the Microbiological Examination of Food, 1993.
ISO 5552:1997. AS 5013.8—2004.
Bello, I., Boboye, B. and Akinyosoye, F., 2015. Phytochemical Screening and
Antibacterial Properties of Selected Nigerian Long Pepper (Capsicum
frutescens) Fruits. African Journal of Microbiology Research, 9(38), pp.
2067 – 2078.
Blainski, A., Lopes, G. and de Mello, J., 2013. Application and Analysis of the
Folin Ciocalteau Method for the Determination of the Total Phenolic
Content from Limonium Brasiliense L. Molecules, 18, pp. 6852 – 6865.
Bui, L. and Small, D., 2007. The contribution of Asian noodles to dietary thiamine
intakes: A study of commercial dried products. Journal of Food
Composition And Analysis, 20(7), pp.575-583.

71
Chávez-Mendoza, C., Sanchez, E., Munoz-Marquez, E., Sida-Arreola, J. P. and
Flores-Cordova, M. A., 2015. Bioactive Compounds and Antioxidant
Activity in Different Grafted Varieties of Bell Pepper. Antioxidants, 4, pp.
427 – 446.
Cisneros-Pineda, O., Torres-Tapia, L., Gutiérrez-Pacheco, L., Contreras-Martín, F.,
González-Estrada, T. and Peraza-Sánchez, S., 2007. Capsaicinoids
Quantification in Chili Peppers Cultivated in the State of Yucatan, Mexico.
Food Chemistry, 104, pp. 1755 – 1760.
Del Nobile, M., Di Benedetto, N., Suriano, N., Conte, A., Corbo, M. and Sinigaglia,
M., 2009. Combined effects of chitosan and MAP to improve the microbial
quality of amaranth homemade fresh pasta. Food Microbiology, 26(6),
pp.587-591.
Del Nobile, M., Benedetto, N., Suriano, N., Conte, A., Lamacchia, C., Corbo, M.
and Sinigaglia, M., 2009. Use of Natutal Compounds to Improve the
Microbial Stability of Amaranth-based Homemade Fresh Paste. Food
Microbiology, 26, pp. 151 – 156.
Food and Drug Administration Philippines, 2013. Revised Guidelines for the
Assessment of Microbiological Quality of Processed Foods. Alabang:
Muntinlupa City.
Gomes, L., Petito, N., Costa, V., Falcão, D. and Araújo, K., 2014. Inclusion
Complexes of Red Bell Pepper Pigments with β-cyclodextrin: Preparation,
Characterisation and Application as Natural Colorant in Yogurt. Food
Chemistry, 148, pp. 428 – 436.
Gomez, L., Petito, N., Costa, V., Falcão, D. and Araújo, K., 2014. Inclusion
complexes of red bell pigments with β-cyclodextrin: Preparation,
characterization and application as natural colorant in yogurt. Food
Chemistry, 148, pp. 428 – 436.
Guil-Guerrero, J., Ramos, L., Moreno, C., Zúñiga-Paredes, J., Carlosama-Yepez,
M. and Ruales, P., 2016. Antimicrobial Activity of Plant-food By-products:
A Review Focusing on the Tropics. Livestock Science, 189, pp. 32 – 49.

72
Haejin, B., Jayaprakasha, G., Crosby, K., Yoo, K., Leskovar, D., Jifon, J. and Patil,
B., 2014. Ascorbic Acid, Capsaicinpod, and Flavonoid Aglycone
Concentrations as a Function of Fruit Maturity Stage in Greenhouse-grown
Peppers. Journal of Food Composition and Analysis, 33(2), pp. 195 – 202.
Jyoti, D., Syed, N. and Pritee, M., 2014. Comparative Study of Bell Pepper on the
Aspects of Their Approximate Analysis (Capsicum Annum). International
Journal of Technical Research and Applications, 2(3), pp. 53 – 55.
Khare, A., Biswas, A. and Sahoo, J., 2014. Comparison Study of Chitosan, EDTA,
Eugenol and Peppermint Oil for Antioxidant and Antimicrobial Potentials
in Chicken Noodles and Their Effect on Color and Oxidative Stability at
Ambient Temperature Storage. LWT – Food Science and Technology, 55,
pp. 286 – 293.
King, A., Pitt, J., Beuchat, L. and Corry, J., 1986. Methods for the Mycological
Examination of Food. New York: Plenum Publishing Corporation.
Kothari, S., Joshi, A., Kachhwaha, S. and Ochoa-Alejo, N., 2010. Chili Peppers –
A review on Tissue Culture and Transgenesis. Biotechnology Advances, 28,
pp. 35 – 48.
Ksibi, I., Slama, R., Faidi, K., Ticha, M. and M’henni, M., 2015. Mixture approach
for optimizing the recovery of colored phenolics from red pepper
(Capsicum annum L.) by-products as potential source of natural dye and
assessment of its antimicrobial activity. Industrial Crops and Products, 70,
pp. 34 – 40.
Kumoro, A., Johnny, D. and Alfilovita, D., 2016. Incorporation of Microalgae and
Seaweed in Instant Fried Wheat Noodles Manufacturing: Nutrition and
Culinary Properties Study. International Food Research Journal, 23(2), pp.
715 – 722.
Li., L., Easa, A., Liong, M., Tan, T. and Foo, W., 2013. The Use of Microbial
Transglutaminase and Soy Protein Isolate to Enhance Retention of
Capsaicin in Capsaicin-Enriched Layered Noodles. Food Hydrocolloids,
30(2), pp. 495 – 503.

73
Li, L., Tan, T., Liong, M. and Easa, A., 2014. Preparation and Evaluation of Chili
Powder-Enriched Layered Noodles. LWT – Food Science and Technology,
59(1), pp. 566 – 571.
Li, M., Zhu, K., Guo, X., Peng, W. and Zhou, H., 2011. Effect of Water Activity
(aw) and Irradiation on the Shelf Life of Fresh Noodles. Innovative Food
Science & Emerging Technologies, 12(4), pp. 526 – 530.
Li. M., Zhu, K., Wang, B., Guo, X., Peng, W. and Zhou, H., 2012. Evaluation of
Quality Characteristics of Wheat Flour and Shelf Life of Fresh Noodles as
Affected by Ozone Treatment. Food Chemistry, 135(4), pp. 2163 – 2169.
Li, M., Zhu, K., Sun, Q., Amza, T., Guo, X. and Zhou, H., 2016. Quality
Characteristics, Structural Changes and Storage Stability of Semi-dried
Noodles Induced by Moderate Dehydration: Understanding the Quality
Changes in Semi-dried Noodles. Food Chemistry, 194, pp. 797 – 804.
Lobo, V., Patil, A., Phatak, A. and Chandra, N., 2010. Free Radicals, Antioxidants
and Functional Foods: Impact on Human Health. Pharmacognosy Review,
4(8), pp. 118 – 126.
Loizzo, M., Pugliese, A., Bonesi, M., Menichini, F. and Tundis, R., 2015.
Evaluation of Chemical Profile and Antioxidant Activity of Twenty
Cultivars from Capsicum annum, Capsicum baccatum, Capsicum
chacoense and Capsicum chinense: A Comparison between Fresh and
Processed Peppers. LWT – Food Science and Technology, 64 (1), pp. 623 –
631.
Materska, M. and Perucka, I., 2005. Antioxidant Activity of the Main Phenolic
Compounds Isolated from Hot Pepper Fruit (Capsicum annum L.). Journal
of Agricultural and Food Chemistry, 53(5), pp. 1750 – 1756.
Medina-Juárez, L., Molina-Quijada, D., Toro-Sánchez, C., González-Aguilar, G.
and Gámez-Meza, N., 2012. Antioxidant Activity of Peppers (Capsicum
annum L.) Extracts and Characterization of Their Phenolic Constituents.
Interciencia, 37, pp. 588 – 593.

74
Medvedová, A., Valík, L. and Studeničová, A., 2009. The Effect of Temperature
and Water Activity on the Growth of Staphylococcus aureus. Czech Journal
of Food Science, 27(2), pp. 28 – 35.
Nadeem, M., Anjum, F., Khan, M., Saeed M. and Riaz A., 2011. Antioxidant
Potential of Bell Pepper (Capsicum annum L.) – A review. Pakistan Journal
of Food Sciences, 21 (1-4), pp. 45 – 51.
Ojure, M.A. and Quadri, J.A., 2012. Quality Evaluation of Noodles Produced from
Unripe Plantain Flour Using Xanthan Gum. Ijrras, 13(3), pp. 740 – 752.
Olivera, D. and Salvadori, V., 2009. Effect of Freezing Rate in Textural and
Rheological Characteristics of Frozen Cooked Organic Pasta. Journal of
Food Engineering, 90, pp. 271 – 276.
Omeire, G., Umeji, O. and Obasi, N., 2014. Acceptability of Noodles Produced
from Blends of Wheat, Acha and Soybean Composite Flours. Nigerian
Food Journal, 32(1), pp.31 – 37.
Othman, Z., Ahmed, Y., Habila, M. and Ghafar, A., 2011. Determination of
Capsaicin and Dihydrocapsaicin in Capsicum Fruit Samples using High
Performance Liquid Chromatography. Molecules, 16 (12), pp. 8919 – 8929.
Peña-Alvarez, A., Ramírez-Maya, E. and Alvarado-Suárez, L., 2009. Analysis of
Capsaicin and Dihydrocapsaicin in Peppers and Pepper Sauces by Solid
Phase Microextraction – Gas Chromatography – Mass Spectrometry.
Journal of Chromatography A, 1216, pp. 2843 – 2847.
Phattra, B. and Maweang, M., 2015. Effects of Natural Fermentation on the Rice
Slurry Properties Related to Rice Paper Production. Journal of Food
Science and Agricultural Technology, 1(1), pp. 22 – 25.
Rufián-Henares, J., Guerra-Hernández, E. and García-Villanova, B., 2013. Effect
of Red Sweet Pepper Dehydration Conditions on Maillard Reaction,
Ascorbic Acid and Antioxidant Activity. Journal of Food Engineering,
118(1), pp. 150 – 156.

75
Sainsbury, J., Grypa, R., Ellingworth, J., Duodu, K. and De Kock, H., 2016. The
Effects of Antioxidants and Shelf Life Conditions on Oxidation Markers in
a Sunflower Oil Salad Dressing Emulsion (SOSDE). Food Chemistry, 213,
pp. 230 – 237.
Sanguinetti, A., Del Caro, A., Scanu, A., Fadda, C., Milella, G., Catzeddu, P. and
Piga, A., 2016. Extending the Shelf Life of Gluten-free Fresh Filled Pasta
by Modified Atmosphere Packaging. LWT – Food Science and Technology,
71, pp. 96 – 101.
Sharma, S., 2015. Food Preservatives and Their Harmful Effects. International
Journal of Scientific and Research Publications, 5(4), pp. 1 – 2.
Shotorbani, N., Jamei, R. and Heidari, R., 2012. Antioxidant Activities of two sweet
pepper Capsicum annum L. Varieties Phenolic Extracts and the Effects of
Thermal Treatment. Avicenna Journal of Phytomedicine, 3(1), pp. 25 – 34.
Secchi, N., Fadda, C., Sanna, M., Conte, P., Del Caro, A., Catzeddu, P. and Piga,
A., 2017. Effectiveness of Modified Atmosphere Packaging and Ovine
Whey Powder in Extending the Shelf Life of Whey Cheesecakes. LWT –
Food Science and Technology, 75, pp. 373 – 378.
Silva, L., Azevedo, J., Pereira, M., Valentão, P. and Andrade, P., 2013. Chemical
Assessment and Antioxidant Capacity of Pepper (Capsicum annum L.)
seeds. Food and Chemical Toxicology, 53, pp. 240 – 248.
Soetarno, S., Yulinah, S. and Sylvia, 1997. Antimicrobial Activities of the Ethanol
of Capsicum Fruits with Different Levels of Pungency. JMS, 2(2), pp. 57 –
63.
Song, W. and Kang, D., 2016. Influence of Water Activity on Inactivation of
Escherichia coli O157:H7, Salmonella Typhimurium and Listeria
monocytogenes in Peanut Butter by Microwave Heating. Food
Microbiology, 60, pp. 104 – 111.
Sun, T., Xu, Z., Wu, C., Janes, M. and Prinyawiwatkul, W., 2007. Antioxidant
Activities of Different Colored Sweet Bell Peppers (Capsicum annum L.).
Journal of Food Science, 72(2), pp. 98 – 102.

76
Tahseen, R., Afzal, M., Iqbal, S., Shabir, G., Khan, Q., Khalid, Z. and Banat, I.,
2016. Rhamnolipids and Nutrients Boost Remediation of Crude Oil-
Contaminated Soil by Enhancing Bacterial Colonization and Metabolic
Activities. International Biodeterioration & Biodegradation, 115, pp. 192
– 198.
Thomas, R., Yeoh, T., Wan-Nadiah, W. and Bhat, R., 2014. Quality Evaluation of
Flat Rice Noodles (Kway Teow) Prepared from Bario and Basmati Rice.
Sains Malaysiana, 43(3), pp. 339 – 347.
Xu, Y., Hall III, C., Wolf-Hall, C. and Manthey, F., 2008. Fungistatic Activity of
Flaxseed in Potato Dextrose Agar and a Fresh Noodle System. International
Journal of Food Microbiology, 121(3), pp. 262 – 267.
Zhang, N. and Ma, G., 2016. Noodles, traditionally and today. Journal of Ethnic
Foods, 3(3), pp.209 – 212.

77
APPENDIX
QUESIONNAIRE OF SENSORY EVALUATION
Panel No. : Date :
Gender :
Age :
Occupation :
Product: Homemade Noodles
Instruction: You are given four coded samples. Kindly evaluate these samples in
terms of appearance, aroma, taste, texture and overall acceptance. Please rate how
much you LIKE or DISLIKE each other according to the scale given below for the
respective sensory attribute.
9 Like Extremely
8 Like Very Much
7 Like Moderately
6 Like Slightly
5 Neither Like Nor Dislike
4 Dislike Slightly
3 Dislike Moderately
2 Dislike Very Much
1 Dislike Extremely

78
Please rinse your mouth with water before tasting each sample. Evaluate the
samples starting from the left.
Sensory Attribute Sample Code
Appearance
Aroma
Taste
Texture
Overall
Acceptance
Comments:
Thank You.