Embed Size (px)
Citation preview

1
Shedding light on energy in the EUA GUIDED TOUR OF ENERGY STATISTICS 2020 edition

2
Lighting, heating, moving, producing...
...energy is vital for our day-to-day life. Without energy, people and businesses cannot function. Turning on our computers or starting our cars are actions that we take for granted, yet they represent the final stage of a complex process.
First of all, energy resources have to be extracted from our environment. Primary energy sources are transformed into energy products available for consumption. For example crude oil is transformed into motor gasoline, while fossil, nuclear and renewable energy are transformed into electricity.
Statistics can help to make the complex process of energy more understandable.
• Where does our energy come from?• How dependent are we on energy imports?• Which kind of energy do we consume in the EU and how much does it cost?• Are we efficient in the consumption of energy?• How much greenhouse gas do we emit in the EU?
By providing simple statistical answers to these questions and by presenting the information in different forms (texts, infographics, videos, etc.), this new tool developed by Eurostat replies to the needs of those who are not familiar with the energy sector, but who would like to better understand the challenges the Energy Union initiative is facing. For more experienced users, the whole energy process – from source to final use – is presented in a very detailed way in a user-friendly Sankey-diagram.
Introduction

3
Contents
1. WHAT ARE THE EUROPEAN GREEN DEAL AND THE ENERGYUNION ABOUT? 4
2. WHAT ENERGY IS AVAILABLE IN THE EU? 5 1. Where does our energy come from? 5 2. What do we produce in the EU? 7 3. From where do we import energy and how dependent are we? 8 4. From source to use - what are the energy flows? 11
3. WHICH TYPE OF ENERGY DO WE CONSUME? 12 1. What kind of energy do we consume in the EU? 12 2. What is the source of the electricity we consume? 15 3. How much does the energy we consume cost? 16
4. WHAT ARE THE LINKS BETWEEN ENERGY AND THEENVIRONMENT? 18 1. How are emissions of greenhouse gases by the EU evolving? 19 2. How efficient are we in our consumption of energy? 21 3. What is the share of renewable energy in the EU? 22
GLOSSARY 23
FURTHER INFORMATION 26
Contents

4 1. What are the European Green Deal and the Energy Union about?
1. WHAT ARE THE EUROPEAN GREEN DEAL AND THE ENERGY UNION ABOUT?
The European Green Deal is the ambitious EU climate policy that aims for Europe to become the first climate neutral continent by 2050. This requires a fundamental transformation of our energy system. The Energy Union is the main policy instrument to deliver this transformation, which aims at bringing secure, sustainable, competitive and affordable energy to all EU consumers -households and businesses-.
The European Commission launched in February 2015 a new strategy for a resilient Energy Union with a forward-looking climate change policy.
The goal of the Energy Union is to give EU consumers - households and businesses - secure, sustainable, competitive and affordable energy. Achieving this goal will require a fundamental transformation of Europe’s energy system.
The Energy Union Strategy is made up of five closely interrelated and mutually reinforcing dimensions, designed to bring greater energy security, sustainability and competitiveness:
Energy security, solidarity and trust: Diversifying Europe’s sources of energy and making better, more efficient use of energy produced within the EU.
A fully-integrated internal energy market: Using interconnectors which enable energy to flow freely across the EU - without any technical or regulatory barriers. Only then can energy providers freely compete and provide the best energy prices.
Energy efficiency contributing to moderation of demand: Consuming less energy in order to reduce pollution and preserve domestic energy sources. This will reduce the EU’s need for energy imports.
Decarbonising the economy: Pushing for a global deal for climate change and encouraging private investment in new infrastructure and technologies.
Research, innovation and competitiveness: Supporting breakthroughs in low-carbon technologies by coordinating research and helping to finance projects in partnership with the private sector.
The State of the Energy Union monitors each year the progress made and highlights the issues where further attention is needed. It shows progress made since the Energy Union Framework Strategy was adopted to bring about the transition to a low-carbon, secure and competitive economy.
European Green Dealhttps://ec.europa.eu/info/strategy/priori-ties-2019-2024/european-green-deal_en
Communication – Energy Union Framework Strategy https://eur-lex.europa.eu/legal-content/EN/TXT/?uri=COM:2015:80:FIN
State of the Energy Unionhttps://ec.europa.eu/commission/publica-tions/4th-state-energy-union_en
The Energy Union on Track to Deliver – Press release on the first State of the Ener-gy Union Report https://ec.europa.eu/commission/presscorner/detail/en/IP_19_1876
Video link : http://europa.eu/!hR86XP
5 2. WHAT ENERGY IS AVAILABLE IN THE EU?
2. WHAT ENERGY IS AVAILABLE IN THE EU?
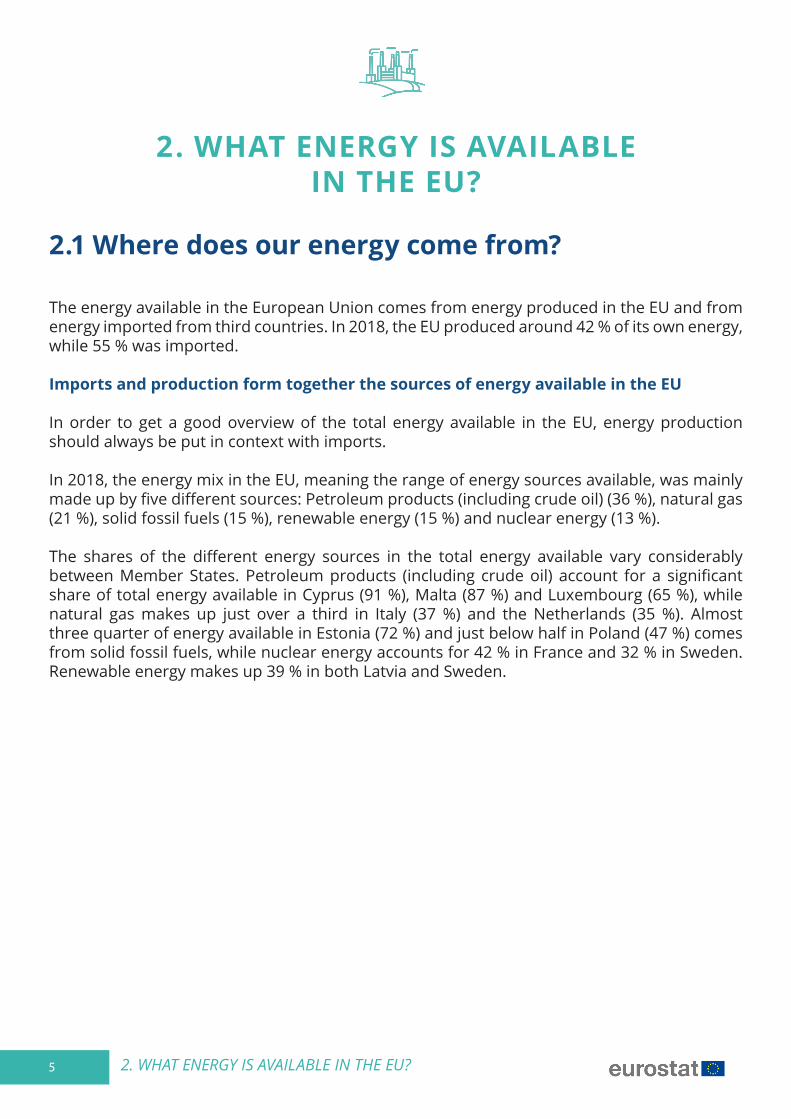
The energy available in the European Union comes from energy produced in the EU and from energy imported from third countries. In 2018, the EU produced around 42 % of its own energy, while 55 % was imported.
Imports and production form together the sources of energy available in the EU
In order to get a good overview of the total energy available in the EU, energy production should always be put in context with imports.
In 2018, the energy mix in the EU, meaning the range of energy sources available, was mainly made up by five different sources: Petroleum products (including crude oil) (36 %), natural gas (21 %), solid fossil fuels (15 %), renewable energy (15 %) and nuclear energy (13 %).
The shares of the different energy sources in the total energy available vary considerably between Member States. Petroleum products (including crude oil) account for a significant share of total energy available in Cyprus (91 %), Malta (87 %) and Luxembourg (65 %), while natural gas makes up just over a third in Italy (37 %) and the Netherlands (35 %). Almost three quarter of energy available in Estonia (72 %) and just below half in Poland (47 %) comes from solid fossil fuels, while nuclear energy accounts for 42 % in France and 32 % in Sweden. Renewable energy makes up 39 % in both Latvia and Sweden.
2.1 Where does our energy come from?

6 2.1. Where does our energy come from?

7 2.2 What do we produce in the EU?
The production of energy in the EU is spread across a range of different energy sources: solid fossil fuels, natural gas, crude oil, nuclear energy and renewable energy (such as hydro, wind and solar energy).
Renewable energy (34 % of total EU energy production) was the largest contributing source to energy production in the EU in 2018. Nuclear energy (31 %) was the second largest source, followed by solid fuels (22 %), natural gas (9 %) and crude oil (4 %).
However, the production of energy is very different from one Member State to another. The significance of nuclear energy is particularly high in France (78 % of total national energy production), Belgium (65 %)
and Slovakia (63 %). Renewable energy is the main source of energy produced in a number of Member States, with over 90 % (of the energy produced within the country) in Malta, Latvia, Cyprus, Portugal and Lithuania. Solid fuels have the highest importance in Poland (78 %), Estonia (74 %), Greece (57 %) and Czechia (55 %), while natural gas is the main source of energy produced in the Netherlands (76 %). Crude oil is the major source of energy produced in Denmark (41 %)
2.2 What do we produce in the EU?

8 2.3. From where do we import energy and how dependent are we?
What do we import?
For its own consumption, the EU also needs energy which is imported from third countries. In 2018, the main imported energy product was petroleum products (including crude oil, which is the main component), accounting for almost two thirds of energy imports into the EU, followed by gas (24 %) and solid fossil fuels (8 %).
Russia is the main EU supplier of crude oil, natural gas and solid fuels
The stability of the EU’s energy supply may be threate-ned if a high proportion of imports are concentrated among relatively few external partners. In 2018, al-most two thirds of the extra-EU’s crude oil imports came from Russia (30 %), Iraq (9 %) and Saudi Arabia, Norway, Kazakhstan and Nigeria (7 % each). A simi-lar analysis shows that almost three quarters of the EU’s imports of natural gas came from Russia (40u%), Norway (18 %) and Algeria (11 %), while almost three quarters of solid fuel (mostly coal) imports origi-nated from Russia (42 %), the United States (18 %) and Colombia (13 %).
Different patterns among the EU Member States
More than 80 % of energy imports are petroleum products in Cyprus, Malta, Greece, Sweden and Romania and more than a third is gas in Hungary, Austria and Italy. Around 20 % of energy imports are solid fuels in Slovakia and Poland.
How dependent are we from energy produced outside the EU?
The dependency rate shows the extent to which an economy relies upon imports in order to meet its energy needs. It is measured by the share of net imports (imports - exports) in gross inland energy consumption (meaning the sum of energy produced and net imports). In the EU in 2018, the dependency rate was equal to 58 %, which means that more than half of the EU’s energy needs were met by net imports. This rate ranges from over 90 % in Malta, Luxembourg and Cyprus to below 25 % in Romania, Denmark and Estonia. The dependency rate on energy imports has increased since 2000, when it was just 56 %.
As mentioned in the part dealing with energy imports, the EU mainly depends on Russia for imports of crude oil, natural gas and solid fuels, followed by Norway for crude oil and natural gas.
2.3 From where do we import energy and how dependent are we?

9 2.3. From where do we import energy and how dependent are we?

10 2.3. From where do we import energy and how dependent are we?

11 2.4 From source to use - what are the energy flows?
The energy flows are shown through a Sankey diagram, which is a graphic illustration displaying the whole energy process.
2.4 From source to use - what are the energy flows?

12 3. WHICH TYPE OF ENERGY DO WE CONSUME?
3. WHICH TYPE OF ENERGY DO WE CONSUME?
Out of the total energy available in the EU, around two thirds are consumed by end users, for example EU citizens, industry, transport etc. The difference – around one third – is mainly lost during electricity generation and distribution, used to support energy production processes or in non-energy uses (like asphalt or bitumen).
To properly interpret energy statistics, it is necessary to distinguish between primary and secondary energy products. A primary energy product is extracted or captured directly from natural resources, such as crude oil, firewood, natural gas or coal. Secondary energy products (such as electricity or motor gasoline) are produced as a result of a transformation process, either from a primary or from a different secondary energy product.
3.1 What kind of energy do we consume in the EU?
Flow of energy products from production to final consumption

13 3.1 What kind of energy do we consume in the EU?
Petroleum products are the most consumed
In the EU in 2018, petroleum products (such as heating oil, petrol, diesel fuel), which represent 41 % of final energy consumption were the most consumed, followed by natural gas and electricity (both 21 %) and direct use of renewables (not transformed into electricity, e.g. wood, solar thermal, geothermal or biogas for space heating or hot water production) (10 %), derived heat (such as district heating) (4 %) and solid fossil fuels (mostly coal) (3 %). The real consumption of renewable energy is higher than 10 %, because other renewable sources are included in electricity (e.g. hydropower, wind power or solar photovoltaic).
Within the EU Member States, the final energy consumption pattern varies considerably. Petroleum products reach 60 % or over of final energy consumption in Cyprus and Luxembourg, while gas accounts for almost 30 % or over in the Netherlands, Hungary and Italy. Renewable energies reach over 20 % in Latvia, Finland and Sweden, while the consumption of electricity in Malta and Sweden accounts for over 30 % of their final energy consumption.
The transport sector consumes a third of the final energy consumption in the EU
Energy is consumed by different sectors of the economy: households (i.e. energy consumed in citizen’s dwellings), transport (e.g. rail, road, domestic aviation or inland shipping), industry, services (including commercial and public services) and agriculture & forestry.
Looking at which sectors in the EU consume the most energy, the industry sector (32 % of final energy consumption) consumes the most energy, followed by the transport sector (28 %), households (24 %), services (13 %) and agriculture & forestry (3 %).

14 3.1 What kind of energy do we consume in the EU?

15
3.2 What is the source of the electricity we consume?
Over 40 % of the electricity consumed in the EU comes from power stations burning fossil fuels
Around 21 % of the final energy we consume is electricity and it comes from different sources. In the EU in 2018, 40 % of the electricity consumed came from power stations burning fossil fuels and 33 % from renewable energy sources, while 26 % came from nuclear power plants. Among the renewable energy sources, the highest share of electricity consumed came from wind turbines (11 %), hydropower plants (13u%), biofuels (5 %) and solar power (4 %).
The sources of electricity production vary among the Member States: around 90 % of electricity production came from fossil fuels in Cyprus and Malta, while almost three quarters (71 %) of electricity production came from nuclear power plants in France, followed by 55 % in Slovakia. In Luxembourg and Austria, around 60u% of electricity production came from hydro power plants, while 46 % of electricity production in Denmark came from wind energy.
3.2 What is the source of the electricity we consume?

16
3.3 How much does the energy we consume cost?
Electricity prices for households highest in Germany and Denmark
In order to compare prices of electricity and gas among the Member States, national prices have been converted into euro. Exchange rate fluctuations can have an effect on prices expressed in euro for non-euro area Member States.
For medium size household consumers, electricity prices including taxes and levies were the highest in the first semester of 2019 in Germany (EUR 0.31 per kWh), Denmark (EUR 0.30 per kWh) and Belgium (EUR 0.28 per kWh), while the lowest prices were recorded in Bulgaria (EUR 0.10 per kWh) and Hungary (EURu0.11 per kWh). It should however be noted that over half of the electricity price in Denmark and Germany consists of taxes and levies, and almost a half in Belgium. Furthermore, in Bulgaria taxes and levies account for 17 % and in Hungary for 21 %.
For medium size household consumers, natural gas prices including taxes and levies were highest in the first semester of 2019 in Sweden (EUR 0.12 per kWh), the Netherlands and Denmark (both EUR 0.09 per kWh) and Italy and Portugal (both EUR 0.08 per kWh) and lowest in Hungary and Romania (both EUR 0.03 per kWh).Taxes and levies make up 56 % of gas prices in Denmark and in the Netherlands, 43 % in Sweden and 34 % in Italy.
Gas prices for non-household consumers highest in Finland and Sweden
For non-household consumers, electricity prices (excluding VAT and other recoverable taxes and levies) in the first semester of 2019 ranged from EUR 0.17 per kWh in Italy and EUR 0.16 in Cyprus and Germany to EUR 0.07 per kWh in Denmark, Finland and Sweden.
For non-household consumers, natural gas prices (excluding VAT and other recoverable taxes and levies) in the first semester of 2019 were highest in Finland (EUR 0.063 per kWh) and Sweden (EUR 0.040 per kWh) and lowest in Belgium (EUR 0.024 per kWh).
For an interactive view, see the energy prices visualisation tool.https://ec.europa.eu/eurostat/cache/infographs/energy_prices/enprices.html
For petrol, diesel and heating oil prices, see the Oil bulletin of the Directorate-General for Energy of the European Commission.
3.3 How much does the energy we consume cost?

17
Electricity and gas pricesHouseholds
3.3 How much does the energy we consume cost?

18
Electricity and gas pricesHouseholds
3.3 How much does the energy we consume cost?

19 4.WHAT ARE THE LINKS BETWEEN ENERGY AND THE ENVIRONMENT?
4. WHAT ARE THE LINKS BETWEEN ENERGY AND THE ENVIRONMENT?
Climate change is a threat to sustainable development. After years of extensive research, the scientific community agrees that man-made greenhouse gas (GHG) emissions are the dominant cause of the Earth’s average temperature increases over the past 250 years (IPCC, 2014). Man-made GHG emissions are primarily a by-product of burning of fuels in power plants, cars or homes. Farming and waste decaying in landfills are also sources of GHG emissions.
EU greenhouse gas emissions declined steadily between 2010 and 2014, after which the trend changed and started slightly increasing again.
In 2017, EU GHG emissions were down by 19u% compared with 1990 levels, representing an absolute reduction of 935 million tonnes of CO2 equivalents, putting the EU on track to meet its 2020 target, which is to reduce GHG emissions by 20 % by 2020 and by 40 % by 2030 compared with 1990.
In 2017, the energy producing industries had the largest share (29.0 %) of total greenhouse gas emissions, followed by fuel combustion by users (25.5 %) and the transport sector (23.8 %). Compared with 1990, the share of most sources decreased, transport increased however from 14.8 % in 1990 to 23.8 % in 2017.
4.1 How are emissions of greenhouse gases by the EU evolving?

20 4.1 How are emissions of greenhouse gases by the EU evolving?

21
4.2 How efficient are we in our consumption of energy?
One of the priorities of the Energy Union strategy is to increase energy efficiency in an attempt to reduce energy consumption by 32.5 % by 2030.
Energy intensity is a measure of an economy’s energy efficiency and shows how much energy is needed in order to produce a unit of gross domestic product (GDP). For instance, if an economy becomes more efficient in its use of energy and its GDP remains constant, then the ratio for this indicator should fall. It is expressed in kilograms of oil equivalent per EUR 1 000 of GDP.
The least intensive economies in the EU in 2018, i.e. those using the least amount of energy relative to their overall economic size (based on GDP in purchasing power standards), were Ireland, Denmark and Romania. The most energy-intensive EU Member States were Malta and Estonia. It should be noted that the economic structure of a country plays an important role in determining energy intensity, as service based economies will, a priori, display relatively low energy intensities, while economies with heavy industries (such as iron and steel production) may have a considerable proportion of their economic activity within industrial sectors, thus leading to higher energy intensity.
4.2 How efficient are we in our consumption of energy?

22
4.3 What is the share of renewable energy in the EU?
The share of renewable energy in energy consumption iincreased continuously between 2004 and 2018, from 9.6 % to 18.9 %. The Europe 2020 target is 20 % by 2020 and the Europe 2030 target is 32 % by 2030.
The share of renewable energy in the Member States was highest in Sweden (54.6 % of energy consumption) followed by Finland (41.2u%) and Latvia (40.3 %). This share was lowest
in the Netherlands (7.4 %), Malta (8.0 %) and Luxembourg (9.1 %). Differences stem from variations in the endowment with natural resources, mostly in the potential for building hydropower plants and in the availability of biomass. All Member States increased their renewable energy share between 2004 and 2018, fourteen have at least doubled their share.
4.2 What is the share of renewable energy in the EU?

23
Glossary
Bunkers
Bunkers include all dutiable petroleum products loaded aboard a vessel for consumption by that vessel. International maritime bunkers describe the quantities of fuel oil delivered to ships of all flags that are engaged in international navigation. It is the fuel used to power these ships. International navigation may take place at sea, on inland lakes and waterways, and in coastal waters. International maritime bunkers do not include fuel oil consumption by: ships engaged in domestic navigation; whether a vessel is engaged in domestic or international navigation is determined only by the ship’s port of departure and port of arrival - not by the flag or nationality of the ship; fishing vessels; military forces.
Combined heat and power
Combined heat and power describes the simultaneous production of both useful heat (that can be used, for example, in industrial processes or city heating schemes) and electricity in a single process or unit.
Derived heat
Derived heat is used for warming spaces and for industrial processes and is obtained by burning combustible fuels like coal, natural gas, oil, renewables (biofuels) and wastes, or also by transforming electricity to heat in electric boilers or heat pumps.
Energy dependency rate
The energy dependency rate shows the proportion of energy that an economy must import. It is defined as net energy imports
(imports minus exports) divided by gross inland energy consumption plus fuel supplied to international maritime bunkers, expressed as a percentage. A negative dependency rate indicates a net exporter of energy while a dependency rate in excess of 100 % indicates that energy products have been stocked.
Energy intensity
Energy intensity measures the energy consumption of an economy and its energy efficiency. It is the ratio between gross inland consumption of energy and gross domestic product (GDP). Gross inland consumption of energy is calculated as the sum of gross inland consumption of five energy types: coal, electricity, oil, natural gas and renewable energy sources. The GDP figures are taken at constant prices to avoid the impact of inflation. Since gross inland consumption is measured in kilograms of oil equivalent and GDP in EUR 1 000, this ratio is measured in kgoe per EUR 1 000.
Final energy consumption
Final energy consumption is the total energy consumed by end users, such as households, industry and agriculture. It is the energy which reaches the final consumer’s door and excludes that which is used by the energy sector itself. Final energy consumption excludes energy used by the energy sector, including for deliveries, and transformation. It also excludes fuel transformed in the electrical power stations of industrial auto-producers and coke transformed into blast-furnace gas where this is not part of overall industrial consumption but of the transformation sector. Final energy consumption in "households, services, etc." covers quantities consumed by private households, commerce, public administration, services, agriculture and
Glossary

24
gigajoule is equal to one thousand million joules.
Gigawatt hours
Gigawatt hours, abbreviated as GWh, is a unit of energy representing one billion (1 000 000 000) watt hours and is equivalent to one million kilowatt hours. Gigawatt hours are often used as a measure of the output of large electricity power stations.
Greenhouse gas (GHG)
Greenhouse gases constitute a group of gases contributing to global warming and climate change. The Kyoto Protocol, an environmental agreement adopted by many of the parties to the United Nations Framework Convention on Climate Change (UNFCCC) in 1997 to curb global warming, covers six greenhouse gases: carbon dioxide (CO2), methane (CH4), nitrous oxide (N2O), and the so-called F-gases (hydrofluorocarbons and perfluorocarbons) and sulphur hexafluoride (SF6). Converting them to carbon dioxide (or CO2) equivalents makes it possible to compare them and to determine their individual and total contributions to global warming.
Gross inland energy consumption
Gross inland energy consumption, sometimes abbreviated as gross inland consumption, is the total energy available of a country or region. It represents the quantity of energy necessary to satisfy inland consumption of
Glossary
fisheries.
Energy end user categories
Energy end user categories include private households, agriculture, industry, road transport, air transport (aviation), other transport (rail, inland navigation) and services.
Electricity
Electricity denotes the set of physical phenomena related to electrical charges. It allows to store and transfer energy, or to consume it through electrical appliances. It has a very wide range of applications in almost all kinds of human activities ranging from industrial production, household use, agriculture or commerce and it is normally used for running machines, lighting and heating.
Fossil fuel
Fossil fuel is a generic term for non-renewable natural energy sources such as coal, natural gas and oil that were formed from plants and animals (biomass) that existed in the geological past (for example, hundreds of millions of years ago). Fossil fuels are carbon-based and currently supply most human energy requirements.
Gas
Gas includes mostly natural gas and derived gases.
Gigajoule
A gigajoule, abbreviated as GJ, is a unit of measurement of energy consumption: a
Glossary

25
Glossary
the geographical entity under consideration. Gross inland energy consumption covers consumption by the energy sector itself; distribution and transformation losses; final energy consumption by end users; ‘statistical differences’ (not already captured in the figures on primary energy consumption and final energy consumption). Gross inland consumption does not include energy (fuel oil) provided to international maritime bunkers. It is calculated as follows: primary production + recovered products + net imports + variations of stocks – bunkers.
Gross electricity generation
Gross electricity generation or gross electricity production refers to the process of producing electrical energy. It is the total amount of electrical energy produced by transforming other forms of energy, for example nuclear or wind power. It is commonly expressed in gigawatt hours (GWh). Total gross electricity generation covers gross electricity generation in all types of power plants. The gross electricity generation at plant level is defined as the electricity measured at the outlet of the main transformers, i.e. including the amount of electricity used in the plant auxiliaries and in the transformers.
District heating
City heating, also known as district heating, is the distribution of heat through a network to one or several buildings using hot water or steam produced centrally, often from co-
generation plants, from waste heat from industry, or from dedicated heating systems.
Kilogram of oil equivalent
Kilogram(s) of oil equivalent, usually abbreviated as kgoe, is a normalized unit of energy. By convention it is equivalent to the approximate amount of energy that can be extracted from one kilogram of crude oil. It is a standardized unit, assigned a net calorific value of 41 868 kilojoules/kg and may be used to compare the energy from different sources.
Kilowatt hours
Kilowatt hours, abbreviated as KWh, is a unit of energy representing one thousand watt hours. Kilowatt hours are often used as a measure of domestic energy consumption.
Net electricity generation
Net electricity generation or net electricity production is equal to gross electricity generation minus the consumption of power stations’ auxiliary services.
Nuclear heat
Nuclear heat is the thermal energy produced in a nuclear power plant (nuclear energy). It is obtained from the nuclear fission of atoms, usually of uranium and plutonium.
Primary production of energy
Primary production of energy is any extraction of energy products in a useable form from
Glossary

26
Glossary
natural sources. This occurs either when natural sources are exploited (for example, in coal mines, crude oil fields, hydro power plants) or in the fabrication of biofuels. Transforming energy from one form into another, such as electricity or heat generation in thermal power plants (where primary energy sources are burned), or coke production in coke ovens, is not primary production.
Renewable energy sources
Renewable energy sources, also called renewables, are energy sources that replenish (or renew) themselves naturally. Renewable energy sources include the following: Biomass (solid biofuels): organic, non-fossil material of biological origin, which may be used for heat production or electricity generation. It includes: charcoal; wood and wood waste; black liquor, bagasse, animal waste and other vegetal materials and residuals.
Biogases: gases composed principally of methane and carbon dioxide produced by anaerobic fermentation of biomass, or by thermal processes. It includes: landfill gas; sewage sludge gas; other biogases from anaerobic digestion; bio gases from thermal processes.
Liquid biofuels are liquid fuels from a non-fos-sil biological origin and a renewable energy source, to be distinguished from fossil fuels. Biofuels can be split up into four categories: bio gasoline, biodiesel, bio jet kerosene (avia-tion fuel) and other liquid biofuels.
Renewable waste: portion of waste produced by households, industry, hospitals and the
tertiary sector which is biological material collected by local authorities and incinerated at specific installations.
Hydropower: the electricity generated from the potential and kinetic energy of water in hydroelectric plants (the electricity generated in pumped storage plants is not included).
Geothermal energy: the energy available as heat from within the earth’s crust, usually in the form of hot water or steam.
Wind energy: the kinetic energy of wind converted into electricity in wind turbines.
Solar energy: solar radiation exploited for so-lar heat (hot water) and electricity production.Tide, wave, ocean: mechanical energy derived from tidal movement, wave motion or ocean current and exploited for electricity genera-tion.
Share of renewable energy in energy consumption
Renewable energy sources cover solar ther-mal and photovoltaic energy, hydro (including tide, wave and ocean energy), wind, geother-mal energy and all forms of biomass (inclu-ding biological waste and liquid biofuels). The contribution of renewable energy from heat pumps is also covered for the Member States for which this information was reported. The renewable energy delivered to final consu-mers (industry, transport, households, ser-vices including public services, agriculture, fo-restry and fisheries) is the numerator of this indicator. The denominator, the gross final energy consumption of all energy sources, co-
Glossary

27
Glossary
vers total energy delivered for energy purpo-ses to final consumers as well as the transmis-sion and distribution losses for electricity and heat. It should be noted that exports/imports of electricity are not considered as renewable energy unless a specific intergovernmental agreement has been signed. For more infor-mation: The national shares of energy from renewable sources in gross final consumption of energy are calculated according to specific calculation provisions of Directive 2009/28/EC (http://eur-lex.europa.eu/legal-content/EN/TXT/HTML/?uri=CELEX:32009L0028&from=EN).
Solid fuels
Solid fuels are fossil fuels covering various types of coals and solid products derived from coals. They consist of carbonised vegetable matter and usually have the physical appea-rance of a black or brown rock.
Tonnes of oil equivalent
Tonne(s) of oil equivalent, abbreviated as toe, is a normalized unit of energy. By convention it is equivalent to the approximate amount of energy that can be extracted from one tonne of crude oil.
Total fuels
Total fuels is the sum of all energy products and is composed of the following fuel families: Solid fuels (coal), total petroleum products (crude oil and derived petroleum products), gas, nuclear heat, derived heat, renewable en-ergies, electricity and waste (non-renewable).
Total petroleum products
Total petroleum products are fossil fuels (usually in liquid state) and include crude oil and all products derived from it (e.g. when processed in oil refineries), including motor gasoline, diesel oil, fuel oil, etc.
Glossary
Waste (non-renewable)
Waste (non-renewable) consists of materials coming from combustible industrial, institu-tional, hospital and household wastes such as rubber, plastics, waste fossil oils and other similar types of wastes, which can be either solid or liquid.

28
FURTHER INFORMATIONShedding light on energy in the EU - A guided tour of energy statistics is a digital publica-tion released by Eurostat, the statistical office of the European Union.
For further information
The dedicated section on energy on the Eurostat website.
Articles on energy in Statistics Explained.
Information on data
The European Union (EU) includes 27 EU Member States.Date of data extraction: April 2020 for text and all infographics and animations. The Sankey diagram is continuously updated.
Contact
If you have questions on the data, please contact the Eurostat User Support.
Identifiers of the digital publication:
Catalogue number: KS-02-20-278-EN-QISBN 978-92-76-18199-6DOI: 10.2785/841743
The European Commission is not liable for any consequence stemming from the reuse of this publication.
© European Union, 2020
The reuse policy of European Commission documents is implemented based on Commission Decision 2011/833/EU of 12 December 2011 on the reuse of Commission documents (OJ L 330, 14.12.2011, p. 39).
Except otherwise noted, the reuse of this document is authorised under a Creative Commons Attribution 4.0 International (CC-BY 4.0) licence. This means that reuse is allowed provided appropriate credit is given and any changes are indicated.
For any use or reproduction of elements that are not owned by the European Union, permis-sion may need to be sought directly from the respective rightholders. The European Union does not own the copyright in relation to the following elements:
Cover photo: © Shutterstock - copyright Capitanoseye - Image number: 315873152Menu icons: © Flaticon
For more information, please consult: https://ec.europa.eu/eurostat/about/policies/copyright
Further information