Embed Size (px)
Citation preview
4CHAPTER 4RESULTS: SHEAR-WAVE-VELOCITYMEASUREMENTS AT SEISMIC RECORDINGSTATIONS
Detailed site characterization studies for the EPRI (2004, 2006) Ground-Motion Model(GMM) Review Project are contained in a separate EPRI report, Report 3002000719,EPRI (2004,2006) Ground-Motion Model (GMM) Review Project: Shear Wave VelocityMeasurements at Seismic Recording Stations (EPRI, 2013a).
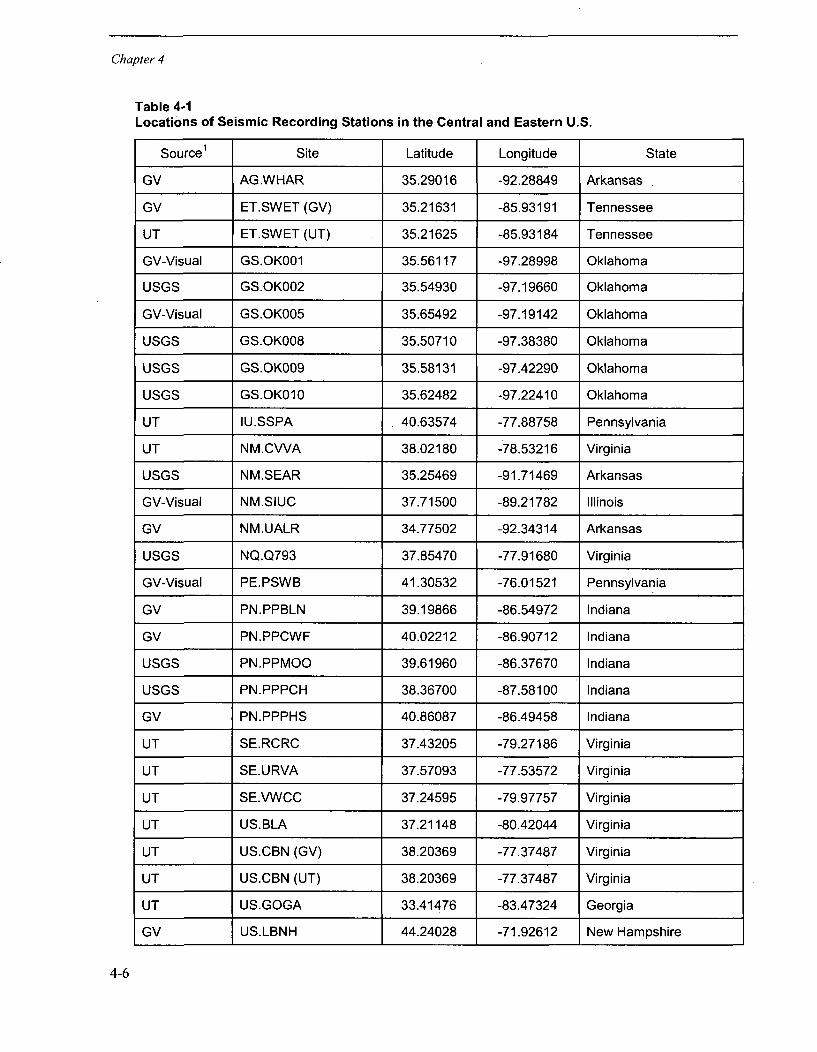
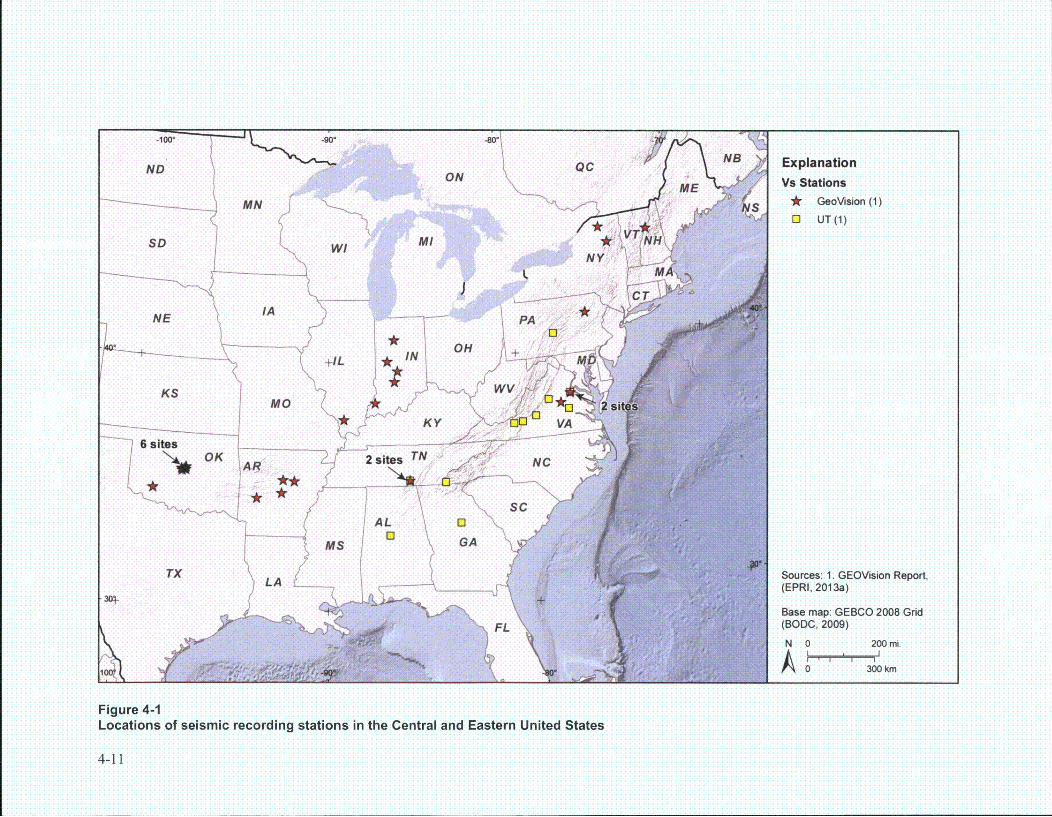
This chapter summarizes the investigations conducted in the EPRI (2013a) task to obtainshear-wave-velocity measurements at 33 recording stations in the Central and EasternUnited States (CEUS). At each recording station, shear-wave measurements wereobtained to a depth of at least 30 m in order to determine the average shear-wave velocityof the upper 30 m (Vs30). Figure 4-1 shows the locations of the 33 recording stations, andTable 4-1 lists the stations where the measurements were recorded for this project.
Geophysical techniques used during this investigation consisted primarily of activesurface-wave techniques: spectral analysis of surface waves (SASW) and multichannelanalysis of surface waves, either Rayleigh waves (MASW) or Love waves (MALW). Atmany locations the techniques included compression-wave and shear-wave seismicrefraction. None of the sites had sufficient background noise to warrant the use of passivesurface-wave techniques.
GEOVision (referred to herein as "GV") managed the investigation using input from theProject Manager, Technical Integration (TI) Team, and the NGA-East ProjectGeotechnical Working Group regarding identification of seismic recording stations forshear-wave-velocity measurement. To improve quality and ensure schedule requirementswere met, two groups of sites were characterized using two separate surface wavegeophysical approaches conducted by GV and The University of Texas at Austin (UT)independently. The south and southeastern 11 sites in Alabama, Georgia, Virginia, andWest Virginia were characterized by UT under subcontract to GV, and the remaining 22sites Were characterized by GV. Two overlapping sites were also characterized by GV.Generally, the UT approach used the SASW method, whereas the GV approach usedMASW, MALW, or seismic refraction (both compression- and shear-wave), as necessaryand applicable, depending on site conditions. The field investigation was conductedbetween May 15 and July 19, 2012.
4-1
Chapter 4
4.1 Technical Approach
Characterization of shear-wave-velocity structure at the seismic stations in the CEUS wasexpected to be quite difficult because many sites have a thin layer of low-velocitysediments overlying high-velocity rock. In such cases, dominant higher modes are often asignificant issue when applying surface-wave techniques utilizing Rayleigh waves. Toovercome these difficulties, two different strategies were used. UT used the SASWtechnique with a vibratory energy source for large receiver spacings and modelingsoftware capable of incorporating the effects of higher-mode Rayleigh waves. GV used astrategy that incorporated MASW, MALW, and compression- and shear-wave seismicrefraction techniques.
The compression- and shear-wave refraction techniques were expected to be of limiteduse at sedimentary rock sites, as the seismic refraction technique cannot image velocityinversions that are often present to varying degrees in such environments. However, theseismic refraction surveys were expected to be useful for identifying the depth of thesaturated zone and bedrock and maximum seismic velocities in the upper 30 m, and forquantifying lateral-velocity variation. The MASW technique was expected to be effectiveat sites with a thick sequence of sediments overlying rock and at sites with rock at thesurface. The MALW technique was expected to be effective at shallow rock sites andsites with steep velocity gradients. Previous investigations have revealed several geologicconditions where the MALW technique can be more effective than the MASW techniqueat characterizing subsurface velocity structure. These include sites with a thin, low-velocity sediment layer over much stiffer sediments/rock, those with shallow rock, andthose with with a steep velocity gradient in rock. At such sites, dominant higher modesand/or superposition of modes are often problematic in Rayleigh wave data, but thefundamental mode is dominant in Love wave data. Multi-mode or effective modesolutions can often adequately model the Rayleigh wave dispersion curve at these typesof sites, but fundamental mode inversion of Love wave data is less complicated.
4.2 Discussion and Results
A total of 33 seismic station sites were characterized during this investigation (Table4.2-1). Eleven of these sites were characterized by UT using the SASW technique andmodeling software capable of accounting for the higher-mode Rayleigh wave energyoften prevalent in the types of geologic environments encountered. The other 22 siteswere characterized by GV using a combination of techniques, including MASW, MALW,and compression- and shear-wave seismic refraction. Two of the sites characterized byUT were also characterized using the procedures deployed by GV (ET.SWET andUS.CBN), although the testing arrays were not exactly coincident. Of the 24 sitescharacterized by GV, 16 were characterized using the MALW technique, 4 using theMASW technique and 4 using both the MASW and MALW techniques. The MALWtechnique was applied more extensively than usual because geologic conditions at manyof the sites consist of a thin, low-velocity sediment layer over much higher-velocity rock.In such geologic environments, higher-mode Rayleigh waves can be dominant over awide frequency range, whereas the fundamental-mode Love wave is typically dominant.
4-2
Chapter 4
Although multi-mode or effective-mode inversion of Rayleigh wave dispersion data canoften be effective in these conditions, inversion of the fundamental-mode Love wavedispersion data likely has less uncertainty.
Velocity models developed by modeling of compression- and shear-wave refraction datawere not typically considered to accurately represent subsurface velocity structure at sitesconsisting of sedimentary rock because the seismic refraction technique cannot detectvelocity inversions that are often present in such environments. However, compression-and shear-wave refraction models were very useful for the following purposes:
" To quantify approximate variation in lateral velocity beneath the surface-wave arrays.
" To identify the depth and compression wave velocity of the saturated zone, which ispreferably constrained during modeling of Rayleigh wave data.
* To determine depth to bedrock.
* To estimate the maximum seismic velocities in the near surface.
The technical approaches used by UT and GV are both considered viable forcharacterizing sites with the types of velocity structure encountered during thisinvestigation.
The results of this investigation are presented in the individual site reports contained inEPRI (2013a).
Each report generally includes the following information:
* Coordinates (latitude and longitude in WGS84 coordinate system) for:
- The station (if different from the published data and accessible to a GPS unit).
- The ends of surface-wave and seismic-refraction arrays.
" Photos of the field setup showing instruments and methods, as well as photos of theseismic station.
* Geophysical methods utilized.
* Written description of site conditions.
" Georeferenced site map and geologic map showing testing location(s).
" Velocity structure plots and tables.
* Calculated Vs30 and estimated Vs30 adjusted for seismic station conditions.
* Depth of sensors
* Miscellaneous observations and discussion.
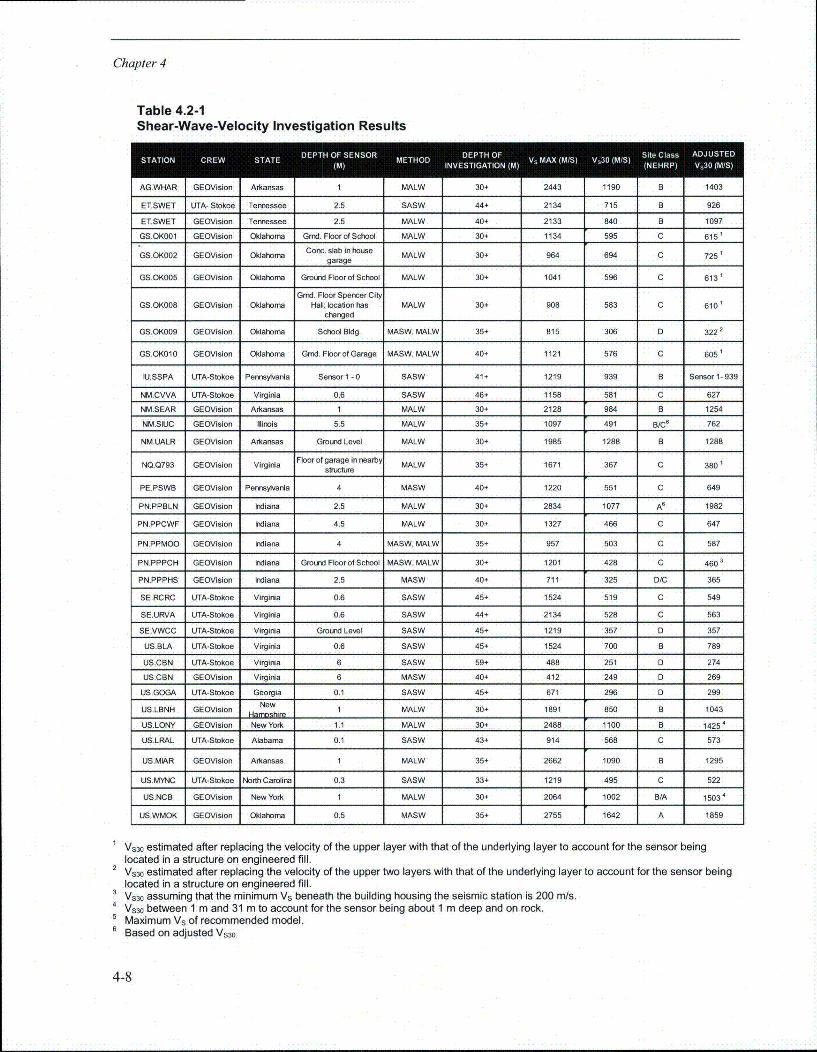
Table 4.2-1 summarizes the results of the GV and UT investigations to measure shear-wave velocity at seismic recording stations.
4-3
Chapter 4
4.3 Observations
Based on the investigations conducted, including overlapping shear-wave-velocitymeasurements at stations ET.SWET and US.CBN, the following results were obtained forsupport of ground-motion modeling in the CEUS:
" Shear-wave velocity for rock sites, in general, are lower than the CEUS reference-rock velocity of 2,800 m/s, which is assumed for developing GMPEs; shear-wavevelocities approaching or equal to the reference-rock velocity were encountered atdepths greater than 30 m at such sites as PN.PPBLN-Indiana and US.WMOK-Oklahoma.
* Velocity inversions occurred at some sites; shear-wave velocity of Layer 1 in theprofile can be higher than Layer 2.
" Information on the depth of seismograph instrument emplacement was obtained forthe recording stations.
* The near-surface geology at the recording stations can be highly variable, and lateral-velocity variation is an important issue at many sites. Future investigations mayrequire more testing arrays.
* The effects of different configurations of the velocity measurement instrumentation,lateral variation in the properties of the near-surface strata, and local variation in thedepth of water table must be taken into account when evaluating Vs 30 measurements.
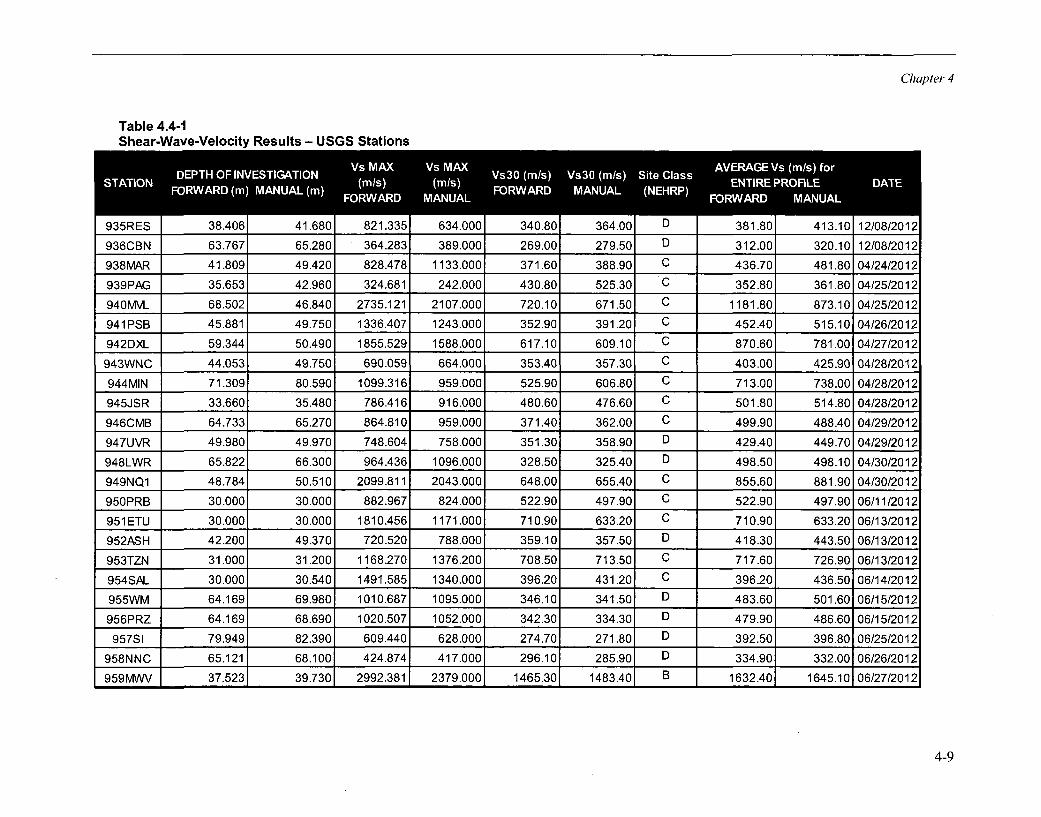
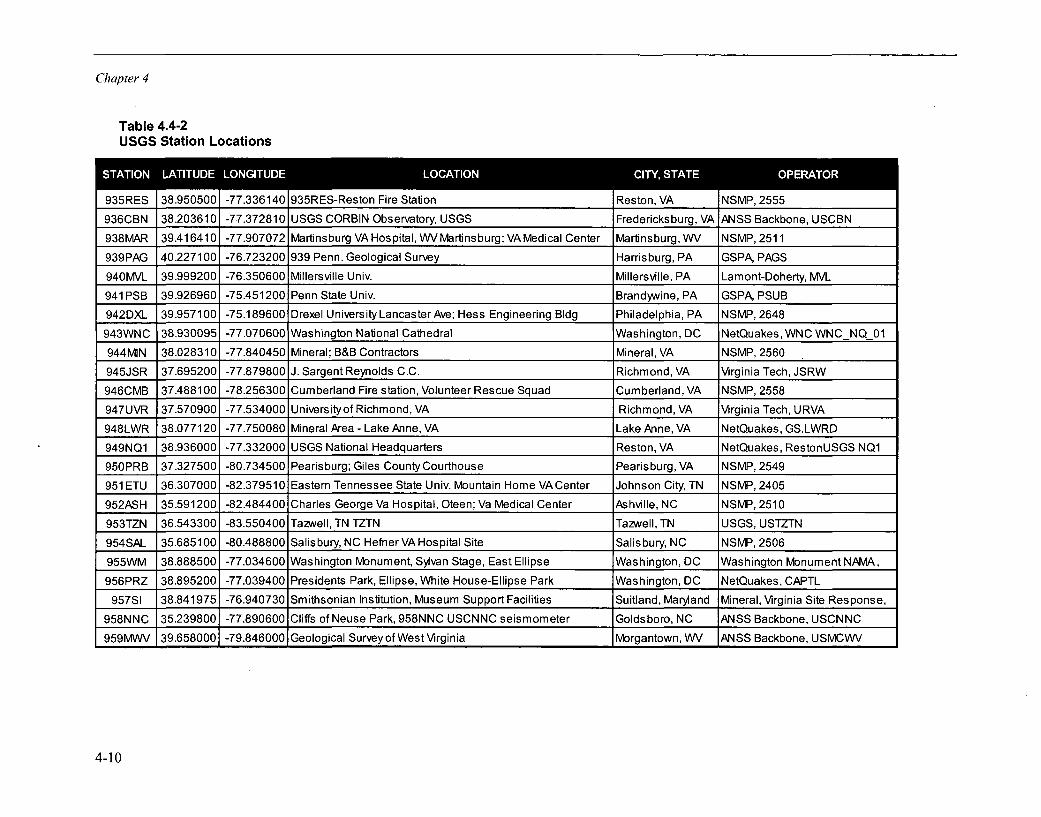
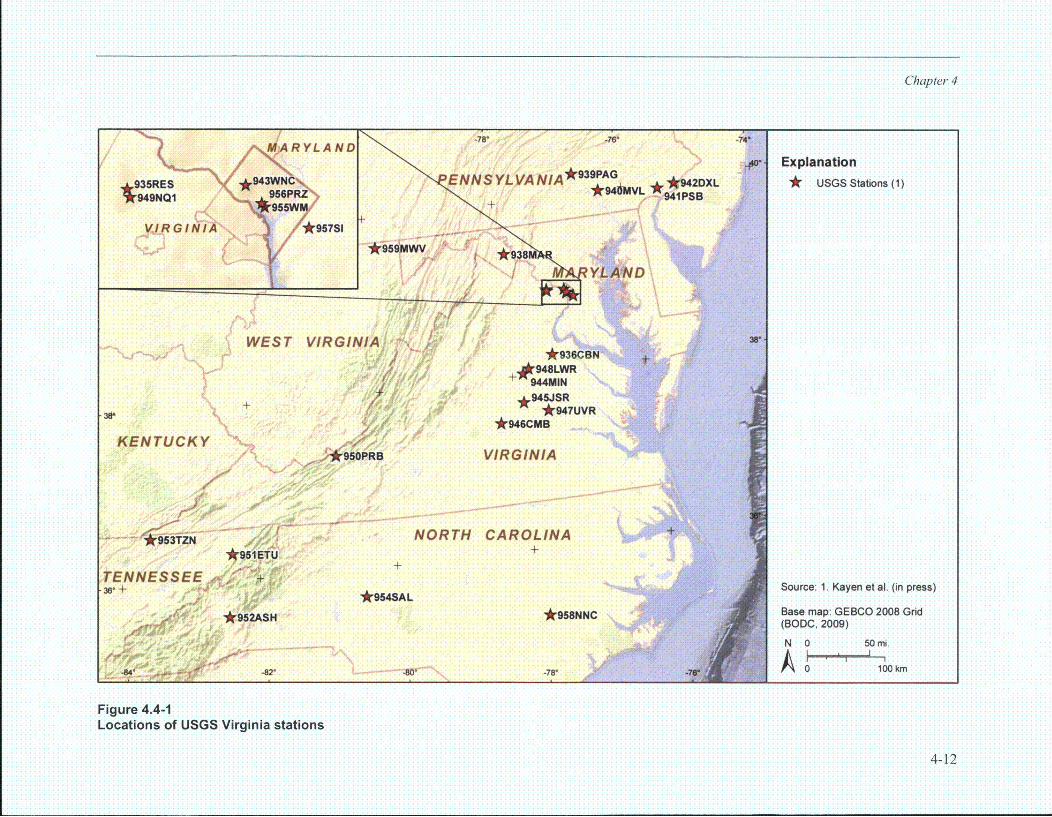
4.4 USGS Shear-Wave-Velocity Data
The shear-wave-velocity data obtained from this study were augmented withmeasurements obtained by the USGS. The USGS measured shear-wave velocity at 24seismic recording stations during 2011 and 2012 using SASW (Kayen et al., 2013).Figure 4.4-1 shows the location of the USGS Virginia SASW analysis stations. Table4.4-1 provides a summary of the USGS shear-wave-velocity results, and Table 4.4-2provides the USGS site locations.
4.5 Use of Shear-Wave-Velocity Data
The shear-wave-velocity profiles obtained from this study, the USGS data, and the NGA-East study were used in Chapters 6 and 7 to evaluate the EPRI (2004) GMM and developweights for the GMPEs in the Updated EPRI (2004, 2006) GMM. See Table 7.3.1.1-1 fordetails on which shear-wave-velocity profiles were used to correct for site conditions inChapters 6 and 7.
As described in Chapter 1, the focus of the project was to develop a GMM for areference-rock site condition with shear-wave velocity of 2,800 m/s or higher. The shear-wave-velocity data were used to develop scaling factors to adjust the recorded groundmotion data to be representative of the reference site conditions. Two adjustmentapproaches were used. One approach was to compute specific adjustments for individual
4-4
Chapter 4
sites using the site shear-wave-velocity profiles. This approach could only be applied atthe recording stations where velocity profiles were measured. Details of the analyticalsite adjustment approach are provided in Section 7.3.1.
The other approach was to compute empirical adjustment factors based on broad sitecategories. The shear-wave-velocity data described here were used to aid in thedevelopment of rock site categories. The development of rock site categories is describedin Section 7.2, and the development of empirical site adjustment factors is described inSection 7.3.2.
4-5
Chapter 4
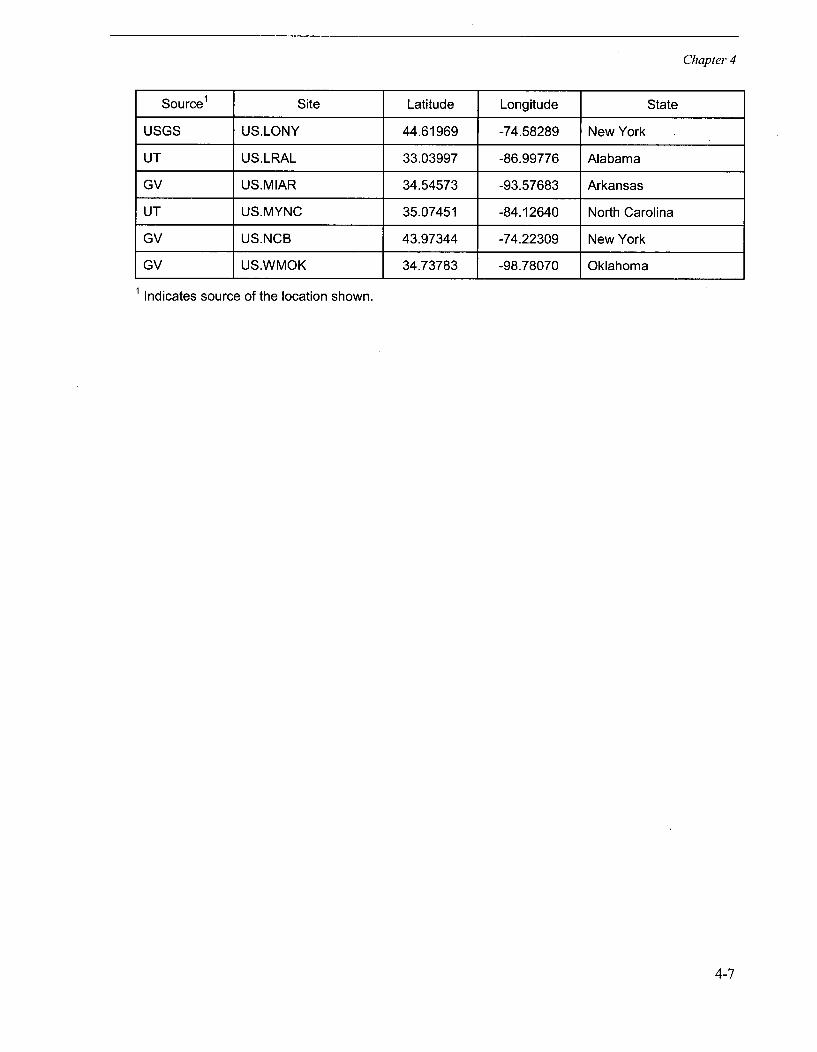
Table 4-1Locations of Seismic Recording Stations in the Central and Eastern U.S.
Source1 Site Latitude Longitude State
GV AG.WHAR 35.29016 -92.28849 Arkansas
GV ET.SWET (GV) 35.21631 -85.93191 Tennessee
UT ET.SWET (UT) 35.21625 -85.93184 Tennessee
GV-Visual GS.OK001 35.56117 -97.28998 Oklahoma
USGS GS.OK002 35.54930 -97.19660 Oklahoma
GV-Visual GS.OK005 35.65492 -97.19142 Oklahoma
USGS GS.OK008 35.50710 -97.38380 Oklahoma
USGS GS.OK009 35.58131 -97.42290 Oklahoma
USGS GS.OK010 35.62482 -97.22410 Oklahoma
UT IU.SSPA 40.63574 -77.88758 Pennsylvania
UT NM.CVVA 38.02180 -78.53216 Virginia
USGS NM.SEAR 35.25469 -91.71469 Arkansas
GV-Visual NM.SIUC 37.71500 -89.21782 Illinois
GV NM.UALR 34.77502 -92.34314 Arkansas
USGS NQ.Q793 37.85470 -77.91680 Virginia
GV-Visual PE.PSWB 41.30532 -76.01521 Pennsylvania
GV PN.PPBLN 39.19866 -86.54972 Indiana
GV PN.PPCWF 40.02212 -86.90712 Indiana
USGS PN.PPMOO 39.61960 -86.37670 Indiana
USGS PN.PPPCH 38.36700 -87.58100 Indiana
GV PN.PPPHS 40.86087 -86.49458 Indiana
UT SE.RCRC 37.43205 -79.27186 Virginia
UT SE.URVA 37.57093 -77.53572 Virginia
UT SE.VWCC 37.24595 -79.97757 Virginia
UT US.BLA 37.21148 -80.42044 Virginia
UT US.CBN (GV) 38.20369 -77.37487 Virginia
UT US.CBN (UT) 38.20369 -77.37487 Virginia
UT US.GOGA 33.41476 -83.47324 Georgia
GV US.LBNH 44.24028 -71.92612 New Hampshire
4-6
Chapter 4
Source1 Site Latitude Longitude State
USGS US.LONY 44.61969 -74.58289 New York
UT US.LRAL 33.03997 -86.99776 Alabama
GV US.MIAR 34.54573 -93.57683 Arkansas
UT US.MYNC 35.07451 -84.12640 North Carolina
GV US.NCB 43.97344 -74.22309 New York
GV US.WMOK 34.73783 -98.78070 Oklahoma
Indicates source of the location shown.
4-7
Chapter 4
Table 4.2-1Shear-Wave-Velocity Investigation Results
STTO CRE STT DET OF SESO MEHD DPHO ,MX(/) V,0(/)St s AJSE
AG.WHAR GEOVision Arkansas 1 MALW 30+ 2443 1190 B 1403
ET.SWET UTA-Stokoe Tenessee 2.5 SASW 44+ 2134 715 B 926
ET.SWET GEOVision Tennessee 2.5 MALW 40+ 2133 840 B 1097
GS.OK001 GEOVision Oklahoma Grmd. Floor of School MALW 30+ 1134 595 C 615 1
GS.OK002 GEOVision Oklahoma Conc. slab in house MALW 30+ 964 694 C 725 1
garage
GS.OK005 GEOVision Oklahoma Ground Floor of School MALW 30+ 1041 596 C 6131
Gmd. Floor Spencer CityGS.OK008 GEOVision Oklahoma Hall; location has MALW 30+ 908 583 C 6101
changed
GS.OK009 GEOVision Oklahoma School Bldg. MASW, MALW 35+ 815 306 D 322 2
GS.OK010 GEOVision Oklahoma Gmd. Floor of Garage MASW, MALW 40+ 1121 576 C 6051
IU.SSPA UTA-Stokoe Pennsylvania Sensor 1 - 0 SASW 41+ 1219 939 B Sensor 1- 939
NM.CVVA UTA-Stokoe Virginia 0.6 SASW 46+ 1158 581 C 627
NM.SEAR GEOVision Arkansas 1 MALW 30+ 2128 984 B 1254
NM.SIJC GEOVision Ilinois 5.5 MALW 35+ 1097 491 B/C' 762
NM.UALR GEOVision Arkansas Ground Level MALW 30+ 1985 1288 B 1288NO.Q793 GEOVision Virginia Floor of garage in nearby MALW 35+ 1671 367 C 3801
structure
PE.PSWB GEOVision Pennsylvania 4 MASW 40+ 1220 551 C 649
PN.PPBLN GEOVision Indiana 2.5 MALW 30+ 2834 1077 A' 1982
PN.PPCWF GEOVision Indiana 4.5 MALW 30+ 1327 466 C 647
PN.PPMOO GEOVision Indiana 4 MASW, MALW 35+ 957 503 C 587
PN.PPPCH GEOVision Indiana Ground Floor of School MASW, MALW 30+ 1201 428 C 460'
PN.PPPHS GEOVision Indiana 2.5 MASW 40+ 711 325 D/C 365
SE.RCRC UTA-Stokoe Virginia 0.6 SASW 45+ 1524 519 C 549
SE.URVA UTA-Stokoe Virginia 0.6 SASW 44+ 2134 528 C 563
SE.VWCC UTA-Stokoe Virginia Ground Level SASW 45+ 1219 357 D 357
US.BLA UTA-Stokoe Virginia 0.6 SASW 45+ 1524 700 B 789
US.CBN UTA-Stokoe Virginia 6 SASW 59+ 488 251 D 274
US.CBN GEOVision Virginia 6 MASW 40+ 412 249 D 269
US.GOGA UTA-Stokoe Georgia 0.1 SASW 45+ 671 296 D 299
US.LBNH GEOVision New1 MALW 30+ 1891 850 B 1043Hamnshir-
USLONY GEOVision New York 1.1 MALW 30+ 2488 1100 B 1425'
US.LRAL UTA-Stokoe Alabama 0.1 SASW 43+ 914 568 C 573
US.MIAR GEOVision Arkansas I MALW 35+ 2662 1090 B 1295
US.MYNC UTA-Stokoe NorthCarolina 0.3 SASW 33+ 1219 495 C 522
US.NCB GEOVision New York 1 MALW 30+ 2064 1002 B/A 1503'
US.WMOK GEOVision Oklahoma 0.5 MASW 35+ 2755 1642 A 1859
1 Vs 30 estimated after replacing the velocity of the upper layer with that of the underlying layer to account for the sensor beinglocated in a structure on engineered fill.
2 Vs 3o estimated after replacing the velocity of the upper two layers with that of the underlying layer to account for the sensor beinglocated in a structure on engineered fill.
3 Vs 30 assuming that the minimum Vs beneath the building housing the seismic station is 200 m/s.4 VS30 between 1 m and 31 m to account for the sensor being about 1 m deep and on rock.5 Maximum Vs of recommended model.6 Based on adjusted Vs3o
4-8
Chapter 4
Table 4.4-1Shear-Wave-Velocity Results - USGS Stations
935RES 38.406 41.680 821.335 634.000 340.80 364.00 D 381.80 413.10 12/08/2012
936CBN 63.767 65.280 364.283 389.000 269.00 279.50 D 312.00 320.10 12/08/2012
938MAR 41.809 49.420 828.478 1133.000 371.60 388.90 C 436.70 481.80 04/24/2012
939PAG 35.653 42.960 324.681 242.000 430.80 525.30 C 352.80 361.80 04/25/2012
940MVL 68.502 46.840 2735.121 2107.000 720.10 671.50 C 1181.80 873.10 04/25/2012
941PSB 45.881 49.750 1336.407 1243.000 352.90 391.20 C 452.40 515.10 04/26/2012
942DX. 59.344 50.490 1855.529 1588.000 617.10 609.10 C 870.60 781.00 04/27/2012
943WNC 44.053 49.750 690.059 664.000 353.40 357.30 C 403.00 425.90 04/28/2012
944MIN 71.309 80.590 1099.316 959.000 525.90 606.80 C 713.00 738.00 04/28/2012
945JSR 33.660 35.480 786.416 916.000 480.60 476.60 C 501.80 514.80 04/28/2012
946CMB 64.733 65.270 864.810 959.000 371.40 362.00 C 499.90 488.40 04/29/2012
947UVR 49.980 49.970 748.604 758.000 351.30 358.90 D 429.40 449.70 04/29/2012
948LWR 65.822 66.300 964.436 1096.000 328.50 325.40 D 498.50 498.10 04/30/2012
949NQ1 48.784 50.510 2099.811 2043.000 648.00 655.40 C 855.60 881.90 04/30/2012
950PRB 30.000 30.000 882.967 824.000 522.90 497.90 C 522.90 497.90 06/11/2012
951ETU 30.000 30.000 1810.456 1171.000 710.90 633.20 C 710.90 633.20 06/13/2012
952ASH 42.200 49.370 720.520 788.000 359.10 357.50 D 418.30 443.50 06/13/2012
953TZN 31.000 31.200 1168.270 1376.200 708.50 713.50 C 717.60 726.90 06/13/2012
954SAL 30.000 30.540 1491.585 1340.000 396.20 431.20 C 396.20 436.50 06/14/2012
955WM 64.169 69.980 1010.687 1095.000 346.10 341.50 D 483.60 501.60 06/15/2012
956PRZ 64.169 68.690 1020.507 1052.000 342.30 334.30 D 479.90 486.60 06/15/2012
957SI 79.949 82.390 609.440 628.000 274.70 271.80 D 392.50 396.80 06/25/2012
958NNC 65.121 68.100 424.874 417.000 296.10 285.90 D 334.90 332.00 06/26/2012
959MWV 37.523 39.730 2992.381 2379.000 1465.30 1483.40 B 1632.40 1645.10 06/27/2012
4-9
Chapter 4
Table 4.4-2USGS Station Locations
00 0 .4 nlmo 004lIiI''l '~Dkl VIA I AKIC'C' rV.....flL......... I ICt'flkIUOKA•,DINI 00. UOU IU -I. f.01 40 U UO%..70. %~•,/" II• O.JU lVatuly U 0 .'0 -rredeInCKS.Urfg, VA' I-M100 DaC;I•bo[Ie, USUDIN
938MAR 39.416410 -77.907072 Martinsburg VA Hospital, WVMartinsburg; VAMedical Center Martinsburg, WV NSMP, 2511
939PAG 40.227100 -76.723200 939 Penn. Geological Survey Harrisburg, PA GSPA, PAGS
940MVL 39.999200 -76.350600 Millersville Univ. Millersville, PA Lamont-Doherty, MVL
941PSB 39.926960 -75.451200 Penn State Univ. Brandywine, PA GSPA, PSUB
942DXL 39.957100 -75.189600 Drexel University Lancaster Ave; Hess Engineering Bldg Philadelphia, PA NSMP, 2648
943WNC 38.930095 -77.070600 Washington National Cathedral Washington, DC NetQuakes,WNC WNC NQ 01
944MIN 38.028310 -77.840450 Mineral; B&B Contractors Mineral, VA NSMP, 2560
945JSR 37.695200 -77.879800 J. Sargent Reynolds C.C. Richmond, VA Virginia Tech, JSRW
946CMB 37.488100 -78.256300 Cumberland Fire station, Volunteer Rescue Squad Cumberland, VA NSMP, 2558
947UVR 37.570900 -77.534000 Universityof Richmond, VA Richmond, VA Virginia Tech, URVA
948LWR 38.077120 -77.750080 Mineral Area - Lake Anne, VA Lake Anne, VA NetQuakes, GS.LWRD
949NQ1 38.936000 -77.332000 USGS National Headquarters Reston, VA NetQuakes, RestonUSGS NQ1
950PRB 37.327500 -80.734500 Pearisburg; Giles County Courthouse Pearisburg, VA NSMP, 2549
951 ETU 36.307000 -82.379510 Eastern Tennessee State Univ. Mountain Home VA Center Johnson City, TN NSMP, 2405
952ASH 35.591200 -82.484400 Charles George Va Hospital, Oteen; Va Medical Center Ashville, NC NSMP, 2510
953TZN 36.543300 -83.550400 Tazwell, TN TZTN Tazwell, TN USGS, USTZTN
954SAL 35.685100 -80.488800 Salisbury, NC Hefner VA Hospital Site Salisbury, NC NSMP, 2506
955WM 38.888500 -77.034600 Washington Monument, Sylvan Stage, East Ellipse Washington, DC Washington Monument NAMA,
956PRZ 38.895200 -77.039400 Presidents Park, Ellipse, White House-Ellipse Park Washington, DC NetQuakes, CAPTL
957SI 38.841975 -76.940730 Smithsonian Institution, Museum Support Facilities Suitland, Maryland Mineral, Virginia Site Response,
958NNC 35.239800 -77.890600 Cliffs of Neuse Park, 958NNC USCNNC seismometer Goldsboro, NC ANSS Backbone, USCNNC
959MWV 39.658000 -79.846000 Geological Surveyof WestVirginia Morgantown, WV ANSS Backbone, USMCWV
4-10
ExplanationON
IVs Stations
* GeoVision (1)
o UT (1)
MIWI
j
KS
6 sites
*
NC
TX Sources: 1. GEOVision Report,(EPRI, 2013a)
304-
Base map: GEBCO 2008 Grid(BODC, 2009)FLN 0 200 mi.
0 300 km
Figure 4-1Locations of seismic recording stations in the Central and Eastern United States
4-11
Chapter 4
Explanation
* USGS Stations (1)
Source: 1. Kayen et al. (in press)
Base map: GEBCO 2008 Grid(BODC, 2009)
N 0 50 mi.S I ', I I --I0 100 km
Figure 4.4-1Locations of USGS Virginia stations
4-12