Embed Size (px)
Citation preview
DC Retail Action Strategy
SWOT Analysis, Retail Demand Analysis, Strategy and Preliminary Planning DiagramsShaw - Convention Center

Shaw-Convention Center SWOT Analysis

This historic neighborhood north of downtown DC is experiencing tremendous growth and transformation, in part because of the recently built Washington Convention Center. The former home of jazz legend Duke Ellington, the Shaw neighborhood is a historic center of African-American culture. As such, it has great historic buildings, including the O Street Market, which is slated for major redevelopment. This area has a prime location just north of bustling Gallery Place/Chinatown and south of Howard University. It is also positioned on a major corridor (7th Street/Georgia Ave), with access to the Metro’s Green and Yellow Lines.
Overview
= Core commercial area
Introduction
Zoning
Boundaries
The Convention Center district is a commercial extension of retail-centered Penn Quarter to its south. The surrounding residential area extends into the commercial area at the northeastern end of the Convention Center (near the Mt Vernon Metro station), as well as just south of Rhode Island Avenue. The commercial zone narrows near the northern end of the district to cover only 7th Avenue, which turns into Georgia Avenue further north. Other nearby commercial corridors include 14th Street and Florida Avenue.
Both sides of 7th and 9th Streets, from Convention Center (Massachusetts Avenue/New York Avenue) north to Rhode Island Avenue, centered on the O Street Market

Retail OpportunityNeighborhood Heart This upper portion of the Shaw-Convention Center submarket is the area’s residential core, with residences ranging in size from densely arranged rowhouses to 10-story apartment buildings. While the new Convention Center defines the lower portion of the submarket (see below), the historic O Street Market is this area’s most iconic building. Although the market is no longer in use (it is slated for a major redevelopment called City Market at O Street), it reflects this area’s focus on neighborhood goods and services. Convention CenterThe 6-block Convention Center dominates the area below N Street.This state-of-the-art facility is a regional draw and has brought improvements to the area’s streetscape. However, its retail component took longer than expected to build-out and lease, and it also has not yet revitalized vacant shops along 7th and 9th Streets. Even so, this area has more potential for denser development (7th Street is the more promising corridor) than points north because of its proximity to downtown and its visibility along busy New York Avenue.
1
2
2C
1A
1B
2B
2A
1
2
NODE 1O Street MarketGiant7-ElevenTiki Food Carry-OutChina ExpressLaundromatDollar PlusAzi’s CafeBP
NODE 2Altersteins FurnitureRuppert Real EstateWarehouseMercy Medical CenterHappy CleanersSubwayEnterprise Rent-a-carOld Dominion Brew HouseMongolian GrillTokyo SushiModern Liquors
1A
1B
2A
2B2C
Note: Tenant lists do not include all businesses located in the submarket.
N Street Northwest

Retail Node 1: Neighborhood HeartCommunity Anchors comprise the center of the Neighborhood Heart; it is surrounded on both ends by Residences and Retail.
B - Community Anchors like Giant, the O Street Market, and the JFK Recreation Center form the heart of this community. Similarly, several large religious buildings line this central part of 9th Street, where residences and retail are revitalizing. For example, rowhouses on 9th Street across from Giant are in good condition, and nearby Azi’s Cafe and Vegetate offer pleasant settings for neighborhood eating. This area shows real potential to anchor the community with neighborhood-serving shops. The City Market at O Street has been granted preliminary development and financing approvals and can provide the necessary momentum.
A - Residences and Retail bookend this node. Large-scale public housing lines 7th Street, while rowhouses run along 9th Street. While 7th Street shows great potential for revitalization in Node 2, this northern node is occupied by residences with minimal retail (although the Parcel 42 project at the corner of 7th Street and Rhode Island Avenue will bring 8,000sf of ground-floor shops). This node is suited to remaining neighborhood-serving; store depths are limited by adjacent residences and this area does not have the same drawing power as Node 2. The current offerings are in poor condition and need physical improvements.
7th Street N
orthwest
A
B
= Minor Intersection
= Neighborhood Intersection
= Sub-node A
= Sub-node B
= Major Intersection
O Street North-
1
B
N Street North-

Retail Node 2: Convention CenterThe Washington Convention Center divides this node south of N Street NW into 2 distinct sub-nodes: 7th Street and 9th Street.
A - 7th Street contains the Mt. Vernon Square 7th Street-Convention Center Metro station at its intersection with M Street. This intersection has public housing on 3 corners, including one corner where the Convention Center is wrapped in housing. This prime intersection has great potential for retail; however, like the northern part of 7th Street (see Node 1), its redevelopment is limited both by the presence of existing residential uses and by building configurations that are not conducive to retail. Just south of this intersection, however, housing gives way to vacant inline shops. This area has the most potential for immediate retail development; it has the necessary visibility from New York Avenue and momentum on 7th Street coming from downtown.
B - 9th Street contains smaller-scale buildings that are mostly boarded up, as well as vacant ground-floor retail in the Convention Center. While significant redevelopment is slated for the area near Massachusetts Avenue, 9th Street does not have quite the same drawing power as 7th Street. Therefore, redevelopment along this corridor should focus on improving neighborhood and Convention-serving offerings.
9th Street Northw
est
N Street Northwest
M Street Northwest
= Major Intersection
= Neighborhood Intersection
= Sub-node A
= Sub-node B
AB
= Minor Intersection

Retail Infrastructure
7th Street is the submarket’s dominant street and is a major DC artery. In addition to following the Metro’s Green and Yellow Lines, it runs alongside the Verizon Center to the south and turns into Georgia Ave to the north. 7th Street has 2 northbound lanes of traffic and 1 southbound lane, and parked cars occupy an extra outer lane in both directions. Although it is secondary to 7th Street, 9th Street has more lanes of traffic (2 in each direction). The streetscape is in good condition around the Convention Center, with brick sidewalks and regularly planted trees. There are even occasional historical plaques geared toward tourists. North of N Street above the Convention Center, however, the streetscape becomes less manicured, and the neighborhood takes on a less maintained appearance.
Streets & Blocks Intersections Buildings Alleys & ServiceRhode Island and Massachusetts Avenues create major intersections where they meet 7th and 9th Streets. The northern intersection at Rhode Island Avenue is scaled for automobiles rather than pedestrians. Although this intersection contains the Shaw-Howard University Metro station, it is hardly visible behind a chainlink fence. Moreover, buildings at the other corners are imposing, with few windows and blank facades. The southern intersection at Massachusetts Avenue is more successful, and uses a change in material to help denote pedestrian crosswalks. Other than these two major intersections, most intersections are small. Even the intersection of M Street and 7th Street, where the Metro station is located, is not noticeable as a major intersection.
As most retail is small and marginal, there are no clearly established areas for service and loading. There are small parking lots behind many buildings on 7th and 9th Street accessible from narrow alleys; however, these are not intended for patrons, so customer parking is problematic. If it is completed as planned, the City Market at O Street redevelopment may help ease this problem with its 700 proposed underground parking spaces.
Besides the Convention Center and historic O Street Market, the most prominent buildings are mid- to high-rise public housing apartments that line 7th Street. 9th Street closer to Mount Vernon Place has a few tall buildings, including new office and residential buildings. Retail shops, which are scattered throughout the submarket, tend to be in small 1-story buildings or on the ground-floor of 3-story residences. Many of them are vacant and in need of substantial improvements in order to function as good quality retail space; some exceptions are on 9th Street between M Street and P Street, where buildings with ground-floor retail space have been upgraded. Civic buildings on 9th Street generally tend to be in better condition and help form the core near the O Street Market.
Shaw-Convention Center–Working Group Draft–May 2008 7

Strengths• As a high-powered regional draw, the Washington Convention Center is a major impetus for revitalizing the area• The area’s proximity to Gallery Place/Chinatown and Penn Quarter makes it appealing and convenient to office workers and tourists alike• Its location near Howard University gives it access to a sizeable student body of approximately 11,000• 7th Street follows the Metro’s Green and Yellow Lines and thus is primed for transit-oriented development• 7th Street is also a major traffic artery in and out of the city, as it turns into Georgia Ave further north• Although many buildings are rundown, the building stock is good overall, with many historic structures• There are many new development opportunities in the “gaps”, particularly along 9th Street• There is momentum for redevelopment and the City Market at O Street has already gained preliminary development and financing approvals
Weaknesses• The Convention Center is a very large, insular building that currently does not fully activate or engage its surroundings• The Metro intersection at 7th St and M St is underutilized• Many retail spaces are vacant and often restricted by height (ie. tucked into the ground floor of a large building)• Although 7th Streets shows promise as a Main Street, much of it is residential, which limits the amount of retail development that can occur• High crime rates, vacancy, and gaps in the urban fabric may negatively impact retailers’ perceptions and the willingness of shoppers, including Convention Center visitors, to frequent retail in the submarket
Opportunities• Strengthen the Convention Center’s connection to Gallery Place/Chinatown and Penn Quarter by obtaining parcels of land along New York Ave, K Street, and Massachusetts Ave (e.g., NPR headquarters up for sale)• Develop retail and other mix of uses, especially around the Mount Vernon Sq/Convention Ctr Metro station, with 7th Street as a clear Main Street• Improve offerings along 9th Street and fill in the gaps; focus on Convention-serving goods and services near Massachusetts Avenue and continue to improve neighborhood-serving shops in the northern section• For both 7th and 9th Streets, the blocks between Mount Vernon Place and L Street have high visibility, making them especially promising sites for retail redevelopment• Implement streetscape guidelines to promote a pedestrian culture at the northernmost intersection with Rhode Island Avenue, taking advantage of the area’s proximity to Howard University• Improve visibility and accessibility at the Shaw/Howard University Metro Station so it can anchor the Rhode Island Avenue intersection• Develop more office buildings along New York Avenue to help activate retail during the day and transition from downtown• The City Market at O Street redevelopment could revitalize the northern part of the submarket, with its new grocery store and preserved market, 600 residential units, hotel, and shops
SWOT Analysis
Shaw-Convention Center–Working Group Draft–May 2008 8

Threats• The former Convention Center site (to the south) is slated for a huge redevelopment, which could take away from the retail viability of shops here• While the Convention Center fits in with new development further south (such as the Verizon Center), it detracts from the neighborhood’s authentic urban fabric, which has evolved over time; redevelopment efforts should be sensitive to this contextual balance
SWOT Analysis

Shaw-Convention Center Preliminary Planning Diagrams

Planning Analysis Node 1: Neighborhood Heart
7th Street N
orthwest
= Minor Intersection
= Neighborhood Intersection
= Node 1
= Major Intersection
O Street North-
1
General Observations about Existing Area:
1) Shops along 9th Street comprise a neighborhood-serving commercial corridor. Residential and civic uses dominate the streetscape of 8th and 7th Street.
2) The Giant grocery store currently turns its back and exposes its loading area to 9th Street, although the proposed City Market at O Street mixed-use redevelopment will more dynamically engage the surrounding streets.
3) Retail locations in converted ground-floor residential townhomes are unappealing for traditional retail; however, lower rents in these locations have created good opportunities for local start-up businesses.
4) Single-use retail anchors with surface parking are no longer appropriate for this dense, urban neighborhood.
Retail Planning Principles:
1) Redevelop large, single-owned commercial parcels to a higher-density, mixed-use product.
2) Implement streetscape and storefront guidelines that promote a cohesive retail environment and celebrate the unique qualities of the Shaw district.
3) Promote this node as a neighborhood shopping destination that serves the everyday needs of the Shaw community.
4) While this area will remain distinctly community oriented, it could benefit from the built-in consumer base associated with nearby Howard University and the Convention Center. Consumers from these areas will be more likely to shop here if the tenant mix and aesthetic quality of the retail space are improved. Signs of this change can already be seen on 9th Street between M and P Streets.
N Street North-

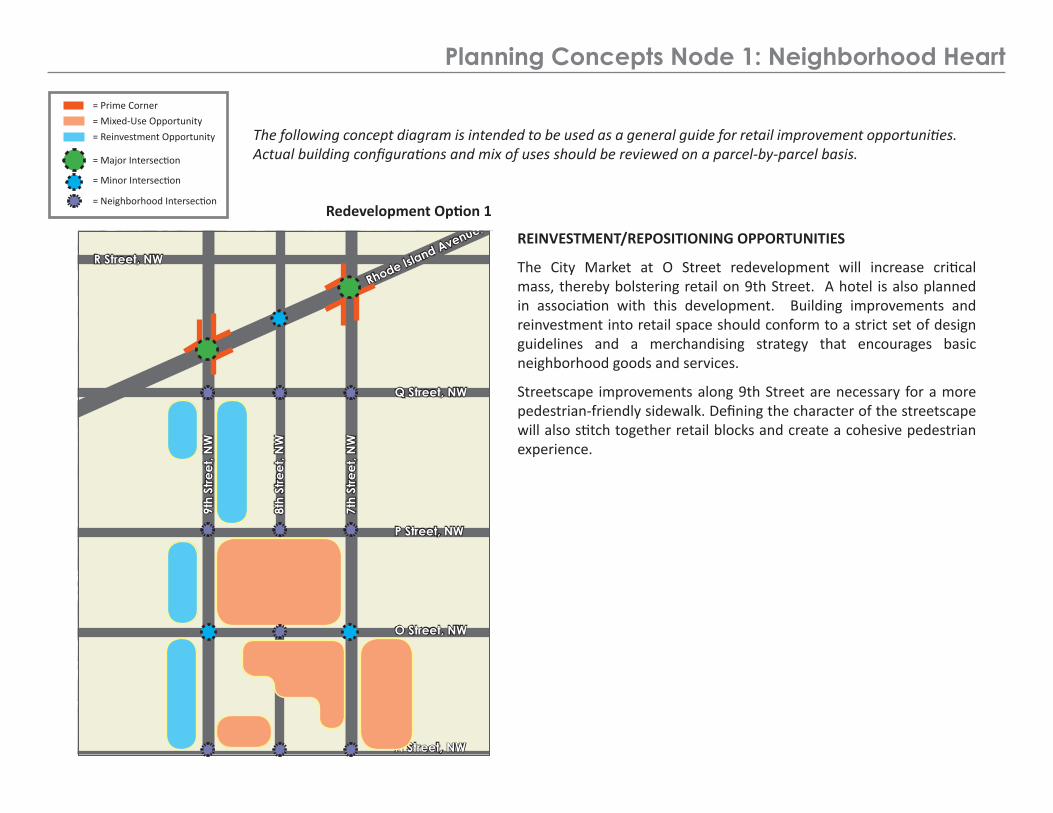
The following concept diagram is intended to be used as a general guide for retail improvement opportunities. Actual building configurations and mix of uses should be reviewed on a parcel-by-parcel basis.
HIGH-DENSITY, MIXED-USE DEVELOPMENT OPPORTUNITIES
The City Market at O Street site has the greatest potential for a high-density, mixed-use development. Commercial development at this location will benefit from clear visibility and ease of access from both major corridors, 9th Street and 7th Street. Due to the elimination of 8th Street and merging of 2 city blocks, this location also has the advantage of being the largest single-owned commercial property in the node. The large site area allows for optimal parking dimensions, a critical component to urban mixed-use projects.
Smaller opportunities for mixed-use buildings exist between O and N Streets, and are currently being constructed by local developers. Retail in these areas should continue to focus on meeting the needs of the surrounding residential community, daytime Convention Center patrons, and Howard University students.
From a retail perspective, 9th Street has potential for immediate improvements. However, on 7th Street, large residential buildings limit retail expansion opportunities in the near term. Please note that redevelopment along this portion of 7th Street in the future is strongly encouraged as a result of more than adequate site dimensions and close proximity to the major mixed-use grocery-anchored center in the submarket.
Planning Concepts Node 1: Neighborhood Heart
9th
Stre
et, N
W
7th
Stre
et, N
W
8th
Stre
et, N
W
P Street, NW
O Street, NW
Q Street, NW
N Street, NW
Rhode Island Avenue, NW
R Street, NW
Redevelopment Option 1
= Prime Corner
= Major Intersection
= Neighborhood Intersection
= Minor Intersection
= Reinvestment Opportunity
= Mixed-Use Opportunity
The following concept diagram is intended to be used as a general guide for retail improvement opportunities. Actual building configurations and mix of uses should be reviewed on a parcel-by-parcel basis.
REINVESTMENT/REPOSITIONING OPPORTUNITIES
The City Market at O Street redevelopment will increase critical mass, thereby bolstering retail on 9th Street. A hotel is also planned in association with this development. Building improvements and reinvestment into retail space should conform to a strict set of design guidelines and a merchandising strategy that encourages basic neighborhood goods and services.
Streetscape improvements along 9th Street are necessary for a more pedestrian-friendly sidewalk. Defining the character of the streetscape will also stitch together retail blocks and create a cohesive pedestrian experience.
Planning Concepts Node 1: Neighborhood Heart
9th
Stre
et, N
W
7th
Stre
et, N
W
8th
Stre
et, N
W
P Street, NW
O Street, NW
Q Street, NW
N Street, NW
Rhode Island Avenue, NW
R Street, NW
Redevelopment Option 1
= Prime Corner
= Major Intersection
= Neighborhood Intersection
= Minor Intersection
= Reinvestment Opportunity
= Mixed-Use Opportunity

Planning Analysis Node 2: Convention Center
9th Street, NW
N Street Northwest
M Street Northwest
= Major Intersection
= Neighborhood Intersection
= Node 1
= Minor Intersection
General Observations about Existing Area:
1) The majority of commercial space within the Convention Center exists along 9th Street.
2) Housing on the eastern side of the Convention Center limits retail redevelopment opportunities.
3) Multiple ownerships and limited site depths make for difficult consolidation efforts along 9th Street.
4) Retail space within the public housing along 7th Street lacks good visibility due to the breezeway that lines the first floor of the building.
Retail Planning Principles:
1) The retail needs of the daytime Convention Center patrons and the needs of the surrounding neighborhood are not dissimilar. Direct a merchandising strategy that includes quick-bite and casual restaurants will satisfy the needs of both groups.
2) Allow the momentum of new development along the upper part of 9th Street (see Node 1) to drive reinvestment efforts to historic mixed-use buildings along this lower section of 9th Street parallel to the Convention Center.
3) Extend downtown’s retail development along 7th Street with a major mixed-use offering at the intersection of New York Avenue and 7th Street.
4) Encourage a repositioning of the residential buildings to a more appropriate high-density, mix-use product that can better serve the needs of the growing community.
7th Street, NW
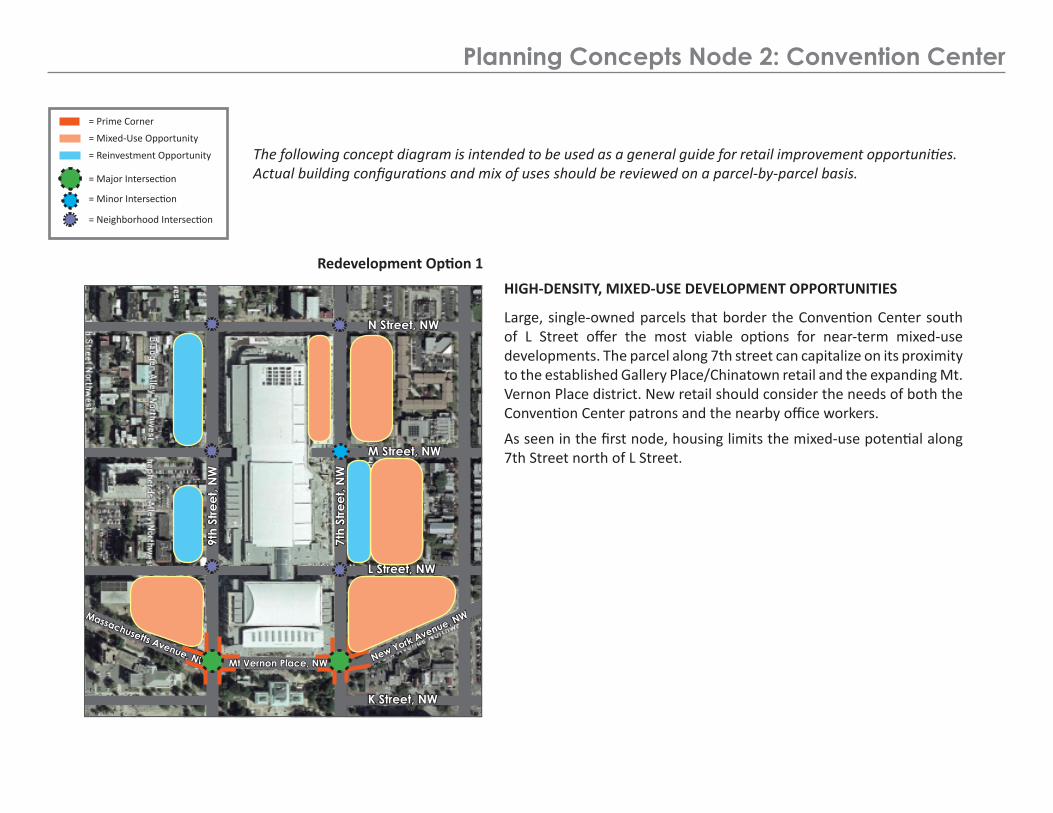
HIGH-DENSITY, MIXED-USE DEVELOPMENT OPPORTUNITIES
Large, single-owned parcels that border the Convention Center south of L Street offer the most viable options for near-term mixed-use developments. The parcel along 7th street can capitalize on its proximity to the established Gallery Place/Chinatown retail and the expanding Mt. Vernon Place district. New retail should consider the needs of both the Convention Center patrons and the nearby office workers.
As seen in the first node, housing limits the mixed-use potential along 7th Street north of L Street.
Planning Concepts Node 2: Convention Center
The following concept diagram is intended to be used as a general guide for retail improvement opportunities. Actual building configurations and mix of uses should be reviewed on a parcel-by-parcel basis.
N Street, NW
M Street, NW
L Street, NW
K Street, NW
Mt Vernon Place, NW New York Avenue, NWMassachusetts Avenue, NW
9th
Stre
et, N
W
7th
Stre
et, N
W
Redevelopment Option 1
= Prime Corner
= Major Intersection
= Neighborhood Intersection
= Mixed-Use Opportunity
= Minor Intersection
= Reinvestment Opportunity
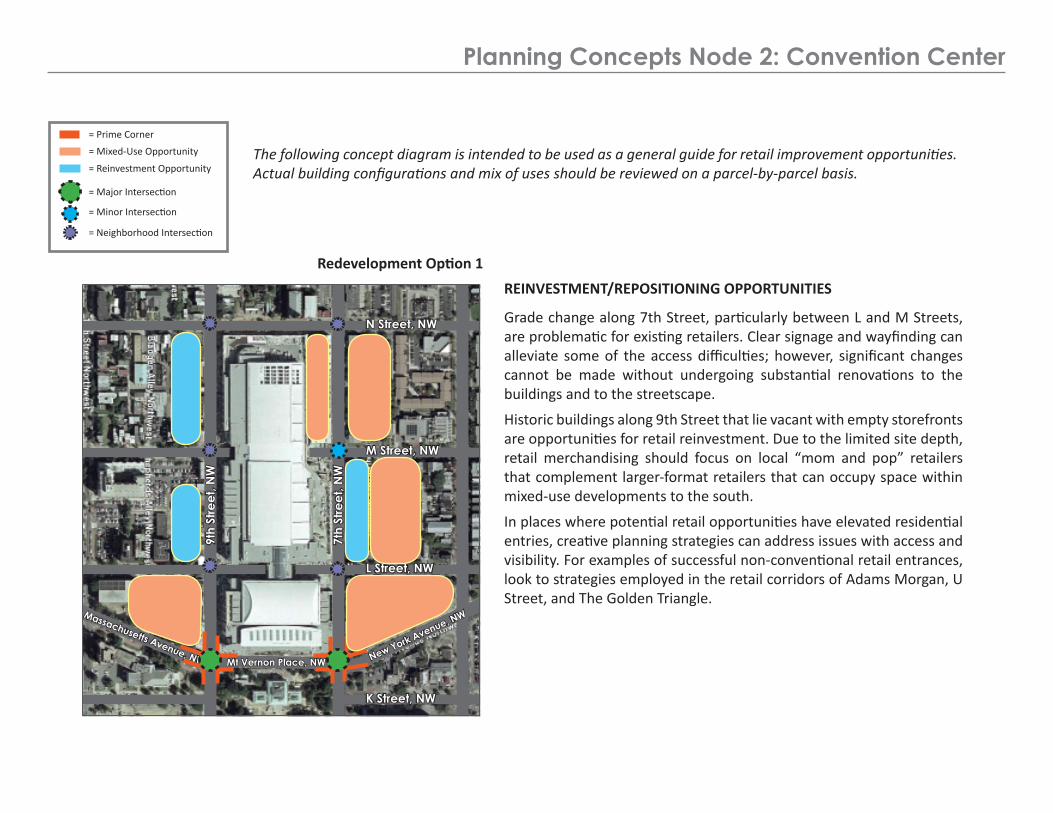
REINVESTMENT/REPOSITIONING OPPORTUNITIES
Grade change along 7th Street, particularly between L and M Streets, are problematic for existing retailers. Clear signage and wayfinding can alleviate some of the access difficulties; however, significant changes cannot be made without undergoing substantial renovations to the buildings and to the streetscape.
Historic buildings along 9th Street that lie vacant with empty storefronts are opportunities for retail reinvestment. Due to the limited site depth, retail merchandising should focus on local “mom and pop” retailers that complement larger-format retailers that can occupy space within mixed-use developments to the south.
In places where potential retail opportunities have elevated residential entries, creative planning strategies can address issues with access and visibility. For examples of successful non-conventional retail entrances, look to strategies employed in the retail corridors of Adams Morgan, U Street, and The Golden Triangle.
Planning Concepts Node 2: Convention Center
The following concept diagram is intended to be used as a general guide for retail improvement opportunities. Actual building configurations and mix of uses should be reviewed on a parcel-by-parcel basis.
= Prime Corner
= Major Intersection
= Neighborhood Intersection
= Mixed-Use Opportunity
= Minor Intersection
= Reinvestment Opportunity
N Street, NW
M Street, NW
L Street, NW
K Street, NW
Mt Vernon Place, NW New York Avenue, NWMassachusetts Avenue, NW
9th
Stre
et, N
W
7th
Stre
et, N
W
Redevelopment Option 1

Shaw-Convention Center Retail Demand Analysis

The retail submarket is located along 7th and 9th Streets (both sides) from Convention Center (Mass Ave/New York), north to Rhode Island Avenue, centered on O Street Market
Key Elements
• Trade areas assess residents and other potential cus-tomers who could be drawn to the site
• The primary trade area encompasses the block groups within a ¼ mile of the retail submarket; the secondary trade area includes the block groups within a ½ mile of the retail submarket (reasonable walking distances for pedestrian shopping)
• Primary trade area residents are expected to be fre-quent customers, with a focus on those living closest to the site; secondary trade area residents are expected to be consistent, but not frequent customers
• Potential customers who are not primary or second-ary trade area residents are accounted for by an “inflow” factor; this is a percentage applied to potential expendi-tures at the site

New households in the Shaw-Convention Center trade area will make a significant impact on retail demand
• Strong increases in population and households, along with continued visitation at the Convention Center will provide opportunities to capture retail expenditures in the retail trade area
• Total population in the trade area is projected to increase from 32,009 in 2007 to 39,926 in 2012; an average annual growth rate of 4.5 percent
• New residential projects from the development pipeline may add 3,225 households or approximately 6,772 new residents (based on average household size in each trade area) in addition to projections by ESRI. ERA accounted for this addition in the 2012 figures for population and households
• Major new projects include City Market at O Street and City Vista
Trade Area Population Growth, 2007 and 2012
Source: ESRI Business Analyst; ERA 2007
Trade Area Household Growth, 2007 and 2012
15,634
8,651
6,983
)*+mated
2007
19,818Total
11,333Secondary
8,485Primary
Projected2012

Shaw-Convention Center Key Demographics- Trade Area Profile Summary
• The Shaw-Convention Center trade area is comprised of mostly middle-lower income households
• Median household income in the primary trade area is $34,666 and is $41,606 in the secondary trade area
• Median family income is $39,831 in the primary trade area and is $40,533 in the secondary trade area
• Per Capita income in the primary trade area is $24,027 and is $34,286 in the secondary trade area; compared to $27,916 nationally
• The trade area is primarily African-American (51%) fol-lowed by White (31%) and Other (11%)*
*“Other” includes mixed racial populations or self-identi-fied as such. The group may include Latinos or Hispan-ics who do not identify with another race. Latino and Hispanic are ethnic groups, not racial, but may include people of several racial groups
Income Statistics, 2007
Source: ESRI Business Analyst; ERA 2007
Racial and Ethnic Groups, 2007

Significant increases in population aged 20 to 34 and 45 to 64 are positive indicators for retail and residential demand over the next five years
• The 20 through 24 age cohort is expected to see the most significant increase in population over the next five years
• Age cohort 25 to 34 will also see an increase in population over the next five years, a positive indicator for residential demand, as these cohorts typically begin forming households
• Growth in the 55 to 64 cohort will increase demand for goods and services associated w/ “Empty Nesters”, including personal care (pharmacy and foodservice, for example)
• Population decreases in the 35 to 44 age cohort is a negative indicator for demand, however the strength in those just younger and just older should provide signifi-cant opportunity to make up demand
Trade Area Population by Age, 2007 and 2012
Source: ESRI Business Analyst; ERA 2007

Shaw-Convention Center Key Demographics- Trade Area Profile Summary
• A significantly higher percentage of households in the Shaw-Convention Center submarket rent their homes, versus own (74% v. 26%)
• In 2007 trade area residents spent a total of $224 mil-lion on products and services in the categories repre-sented on the graph. This is total spending everywhere, not just in the trade area
• Household expenditures in the trade area show lower amounts being spent for personal care and household furnishings. The stronger performing categories are gro-cery, entertainment and food & drink away from home. As previously noted, projected age cohort changes will continue to support entertainment and foodservice businesses, but personal care may increase as the area includes more “empty nest” households
Home Ownership, 2007
Household Expenditures (In Millions) by Category, 2007
Source: ESRI Business Analyst; ERA 2007

Development Pipeline
Pipeline Projects
• Approximately 204,600 square feet of retail is current-ly under construction in the Shaw Convention Center trade area
• There are currently 30 projects under construction in the Shaw-Convention Center trade area. These projects will deliver:
204,573 square feet of retail space
2,234 residential units
• There are another 19 projects planned in the Shaw-Convention Center trade area, including the CityMarket at O Street which will have a 65,000 square foot Giant Grocery Store. In total, the planned projects will deliver:
108,042 square feet of retail space
991 residential units

Overview of Market Demand Analysis
The purpose of the market analysis is to provide quantitative data that, combined with qualitative analysis in the Strengths-Weaknesses-Opportunities-Threats (SWOT) section, inform the retail development strategy for the submarket and provide a tool to DC government, private developers and retailers, and community organizations for developing retail business opportunities.
Developing Estimates of Supportable Square Footage
A key component of the quantitative analysis is determining how much retail space is supportable in each submarket. To calculate this, retail demand or spending within the trade area along with an estimate of the spending that the submarket could capture are measured. Various factors are taken into ac-count in developing submarket capture rates, such as the quality of existing retail offerings and trade area competition. Retail spending potential for each major retail category (Convenience Retail, Specialty Retail and Food & Beverage/Restaurants other Food Service) is divided by the retail industry stan-dard for sales-per-square foot (sometimes called retail sales productivity) to arrive at an estimate of retail square footage that the submarket can support. Submarket demand is compared to supply by subtracting the existing retail inventory to determine the net supportable square feet for retail space.
For potential future development in 2012, pipeline residential and commercial projects, and associated increases in trade area expenditures, are factored into future demand. On the supply side, the pipeline of “under construction” and “planned” retail projects is subtracted from the estimate of supportable retail space, as it is assumed that the new space will absorb an equivalent amount of space at the threshold productivity levels.
Generally speaking, retail market demand analysis should not be considered conclusive, as it combines “typical” and “industry average” performance measures with professional judgment based on local conditions and knowledge of the market and retail industry. There are several factors that will deter-mine the success or failure of any individual retail business; that is why the industry is constantly changing. This analysis is intended to guide the Retail Action Strategy to opportunities to recruit potential successful retail categories based on estimated demand potential.
*Estimated retail spending potential is based on household spending patterns, household income and household composition as reported by the Con-sumer Expenditure Survey prepared by the US Census for the US Bureau of labor Statistics. For retail sales productivity rates, ERA used a range of retail industry-based sales per square foot estimates based on the company’s experience in urban commercial districts similar to each individual submarket, as shopping center industry standards do not always reflect comparable performance in either market orientation or financial structure by locally-owned businesses or by smaller/older commercial buildings.
Retail Demand: Primary Trade Area Supportable Retail Space
Retailers measure business success by comparing their sales per square foot or productivity against their costs and revenue objectives as well as report-ed retail industry standards for comparable types of stores. The amount retailers can afford to spend for rent is also determined by annual sales (both the total amount and sales per square foot per year). Retail rents usually range between 8 percent and 12 percent of total annual sales. This industry stan-dard is a benchmark by which retail performance can be determined.
Local retailers whose sales fall below these industry standards may be considered to be underperforming; the reasons for underperformance may be a result of the size of the market, stronger competitors with better merchandise, merchandising, and/or better pricing, or undercapitalization. Under-performing retailers may cause the analysis of supportable square footage to be underestimated. The higher performing operators can capture market share from existing retailers as well as new customers not currently patronizing a commercial district. When considering a commercial location or district such as the submarkets included in this analysis, retailers often review the levels of rent achieved by property owners as an indication of the level of sales that other retailers are generating.
Lower average rent levels also influence the amount that property owners can afford to invest in property improvements to retain existing tenants or recruit new ones. If property owners are unable to offer tenant improvements because rents are too low, the retailers are then required to increase the amount they must spend to prepare a building to become a store, café, or consumer service business. The greater the amount the retailer is required to invest in space improvements, the greater the financial risk, resulting in additional financial pressures during the early years while the retailer is becoming established and building a customer base. Districts presenting a higher risk of failure have difficulty attracting well managed, well capitalized businesses.
This relationship establishes the connection between the total sales that retailers can achieve, the amount they can afford to pay in rent, and whether the property owners will be willing (or able) to invest in major needed building upgrades (electrical systems, HVAC, tenant improvements) to attract or retain retail tenants.

Trade Area Resident Spending
Retail opportunities are measured using trade area retail expenditures, which describe consumer spending patterns
Expenditures typically cover resident spending, but have been adjust-ed to include worker, visitor, and other spending, as appropriate
Key categories
Apparel and Apparel Services
Entertainment and Recreation
Personal Care
Household Furnishing and Equipment
Grocery
Food and Drink Away from Home
• Entertainment and Recreation includes expenditures such as fees and admissions, TV/video/sound equipment, pets, toys, recreational vehicles, sports equipment, photo accessories, and reading
• Personal Care includes stores such as, drugstores (excluding prescription drugs), cosmetic stores, and services (nail salons, hair salons, shoe repair, etc.)
• Grocery (food and drink for consumption at home) absorbs the most expenditures for the households in the trade area
Trade Area Expenditures per Household By Category, 2007
Source: ESRI Business Analyst; ERA 2007
Capture rates are applied to total trade area expenditures in order to estimate potential expendi-tures within the retail submarket
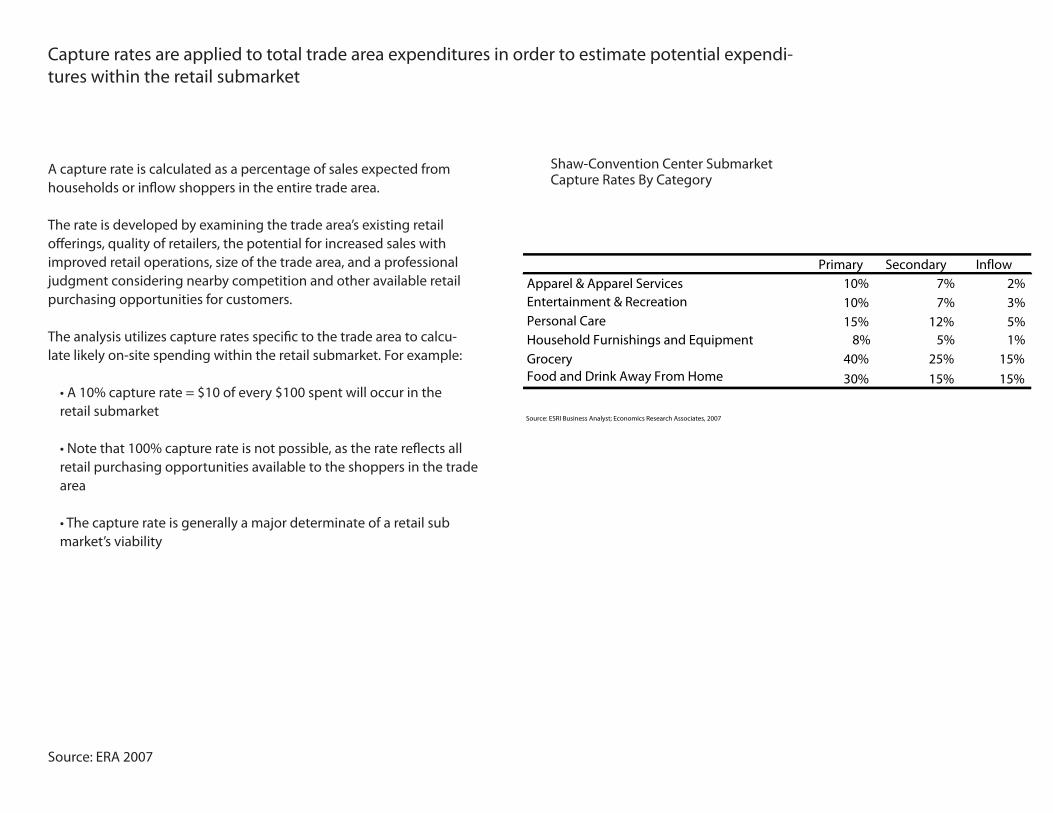
A capture rate is calculated as a percentage of sales expected from households or inflow shoppers in the entire trade area.
The rate is developed by examining the trade area’s existing retail offerings, quality of retailers, the potential for increased sales with improved retail operations, size of the trade area, and a professional judgment considering nearby competition and other available retail purchasing opportunities for customers.
The analysis utilizes capture rates specific to the trade area to calcu-late likely on-site spending within the retail submarket. For example:
• A 10% capture rate = $10 of every $100 spent will occur in the retail submarket
• Note that 100% capture rate is not possible, as the rate reflects all retail purchasing opportunities available to the shoppers in the trade area
• The capture rate is generally a major determinate of a retail sub market’s viability
Source: ERA 2007
Shaw-Convention Center Submarket Capture Rates By Category
Primary Secondary InflowApparel & Apparel Services 10% 7% 2%Entertainment & Recreation 10% 7% 3%Personal Care 15% 12% 5%Household Furnishings and Equipment 8% 5% 1%Grocery 40% 25% 15%Food and Drink Away From Home 30% 15% 15%
Source: ESRI Business Analyst; Economics Research Associates, 2007

Estimated Captured Spending within the Retail Market
• Captured spending in the Shaw-Convention Center retail trade area was estimated to be $45 million in 2007 compared to total trade area spending of $224 million in the same year
• Captured spending in the Shaw-Convention Center retail trade area is expected to be $58 million in 2012 compared to total trade area spending of $290 million in the same year
• ERA estimates by 2012 that Grocery spending accounts for more than $30 million annually and Food and Drink (away from home) ac-counts for more than $15 million annually
• Captured spending in the retail trade area is expected to increase by more than $13 million between 2007 and 2012, due mostly to signifi-cant changes in population and income levels
Source: ERA 2007
$45 Million
$58 Million
Estimated Captured Retail Trade Area Spending, 2007
Estimated Captured Retail Trade Area Spending, 2012

Productivity and Typical Store Size
• A calculation of store productivity is typically based on optimal per-formance of quality retailers, not actual operators
• However the lower quality of the retail space available in this retail submarket requires that a lower than “optimal” productivity rate must be used to adjust the supportable square footage calculation
• The square footage of retail type does not indicate number of stores since stores sizes vary
“Typical” stores sizes might be:
• Apparel 3,500 SF
• Accessories 2,000 – 10,000 SF
• Personal Care 2,000 – 10,000 SF
• Household Furnishings 3,500 – 10,000 SF
• Grocery Stores- 30,000 to 65,000
• Restaurants 3,000 – 6,000+ SF
• Quick Service food 1,200 – 3,500 SF
• The retail submarket offerings could be anchored by a supermar-ket, a collection of restaurants and neighborhood-focused goods and services
Shaw-Convention Center SubmarketComparable Productivity
• The best way to estimate a site’s productivity is to assess annuals sales per square foot for comparable projects
• The type of retail often impacts the sales per square foot (i.e. jewelry versus furniture)
While the productivity rates used for this submarket were based on national averages as reported by the International Council of Shopping Centers (ICSC), ERA used the lower national rates to reflect space limi-tations and likely performance in the submarket. The rate still reflects the minimum productivity that would be needed for a quality retail operation return on investment.
Sales per Square Foot
Category Low High Apparel & Apparel Services 250$ 400$ Entertainment & Recreation 300$ 350$ Personal Care 350$ 500$ Household Furnishings and Equipment 350$ 500$ Grocery 450$ 650$ Food and Drink Away From Home 400$ 550$
Source: Economics Research Associates, 2007
1/ International Council of Shopping Centers, Dollars & Cents of Shopping
Centers 2006

2007 Net Supportable Square Feet
• Based on the current and projected level of households in the trade area and their spending patterns, the Shaw-Convention Center submarket can support between 103,200 and 137,600 square feet of retail in 2007
• The existing retail inventory totals 219,686 square feet within the retail submarket. In order to take into account the lower quality space it was discounted to 96,662 square feet
The retail submarket has a net supportable square foot range between 6,538 and 40,938 in 2007
• Based on typical store size and spending patterns, the site can sup-port a grocery store, multiple restaurants, and one or more entertain-ment/recreation stores such as a gym or bookstore
• While there is evidence suggesting support for a couple of apparel stores, such businesses perform best in a larger cluster
Estimated Net Supportable Square Feet, 2007

2012 Net Supportable Square Feet
• Based on estimated trade area expenditures and capture rates, the Shaw-Convention Center submarket can support between 132,400 and 176,500 square feet of retail in 2012
• There is approximately 312,600 square feet of new retail planned for the trade area, including space at City Market at O Street, City Vista and Broadcast Center One
• The existing retail square footage and planned new projects are sub-tracted from the subtotal to arrive at net supportable square footage for 2012
• Due to the large amount of retail planned or under construc-tion in the trade area there is approximately (262,177) net nega-tive square feet of supportable demand in the submarket by 2012
Estimated Net Supportable Square Feet, 2012

What Does Negative Supportable Square Feet Mean?
• Negative supportable square feet indicates that, at a certain point in time, there may be more retail space than the current market expenditure potential can support
• Many existing retailers in Washington DC
(a) operate in lower priced spaces that can be considered functionally inefficient/obsolete (too small, too shallow, in poor condition, etc.) or
(b) are not well capitalized to compete in an improved environment. ERA has ‘discounted’ the square footage of these retailers in many areas to reflect the qualitative/competitive differences in operating capacity
• Markets evolve and shift as the amount and type of available retail changes; what today may appear to be oversupply can attract new spenders from outside the immediate trade area and become positive over time (such as Adams-Morgan or downtown Washington near the Verizon Center). A ‘nega-tive’ supportable square footage estimate in 2012 does not mean an area is permanently oversupplied
• Retail submarkets may have a store mix imbalance and unfulfilled retail potential. These areas may have too much of one kind of retail and not enough of other types. An improved retail mix could increase demand and reduce the perceived oversupply of space.
• The retail subdmarket strategies will include programs and incentives to assist local retailers operating in growth/expanding markets where substantial new retail is being introduced

Commentary on the Current Retail Inventory
According to CoStar Group Real Estate Information Services, there is 1,072,467 square feet of retail space in the Shaw Convention Center trade area. Within the retail submarket itself, there are 219,686 square feet of retail space. To determine net supportable square feet, the exist-ing retail space is subtracted from the gross supportable square feet. One major determinant of opportunity relies on the quality of the existing space – how competitive is the space relative to the rest of the trade area and other competitive districts?
A recent study of Great Streets neighborhood retail for the Office of the Deputy Mayor for Planning & Economic Development studied the quality of the existing retail space in several commercial districts to determine the feasibility of a tax increment finance (TIF) district, including Shaw Convention Center. While the study area did not coincide directly with the trade area, the assessment of the relative quality of the existing building stock suggests the general condition of the property inventory in the area.
The study concluded that 56% of the retail inventory in the trade area was Grade “C”, or inadequate, for contemporary retailing needs. It also stated that 16% of space was classified as “build to suit” (BTS), mean-ing space constructed for a specific purpose or tenant in such a manner that makes conversion to another use or tenant impractical. Only 9% and 19% were rated Class A and B, respectively. In order to calculate supportable square footage, the existing space was discounted by removing the Grade “C” inventory from the equation.
Source: Office of Deputy Mayor for Planning & Economic Development
Inventory Adjustment
Existing Retail Inventory in Submarket 219,686
Less Discounted Space ("C" Grade) 123,024
Adjusted Existing Inventory 96,662
Source: CoStar; DC Office of The Deputy Mayor for Planning and Economic Development; Economics Research Associates

Multiple factors will ultimately affect the supportable square feet and success of the submarket’s retail offerings over the long-term
Factors Affecting Store Supportable Square Feet, 2007
Factors Affecting Store Productivity
Well-formed MerchandiseMix
Higher Store Productivity
Incorporation of Other Uses
6,538 SF 40,938 SF18,038 SF
The success and appeal of a retail district is directly linked to its mer-chandise mix and its function as a destination.
A store’s size, placement within the district, interior and storefront de-sign are part of total appeal for customers
Price-points and merchandise should accurately reflect the demograph-ics and lifestyle characteristics of the customers
Merchandise quality/price positioning/merchandising/mark-up relative to cost of goods, as well as store size and other operating factors, influ-ence a retailers’ profitability (Sales / SF)
Incorporating other uses and programs may limit retail space, but complement overall project
The trade areas are capable of spending a certain amount. If more $$ are spent in one store less $$ will be spent elsewhere
Stores Cater to MarketCharacteristics
Location, Design, &Configuration
Type of Store
Low Sales / SF High Sales / SF
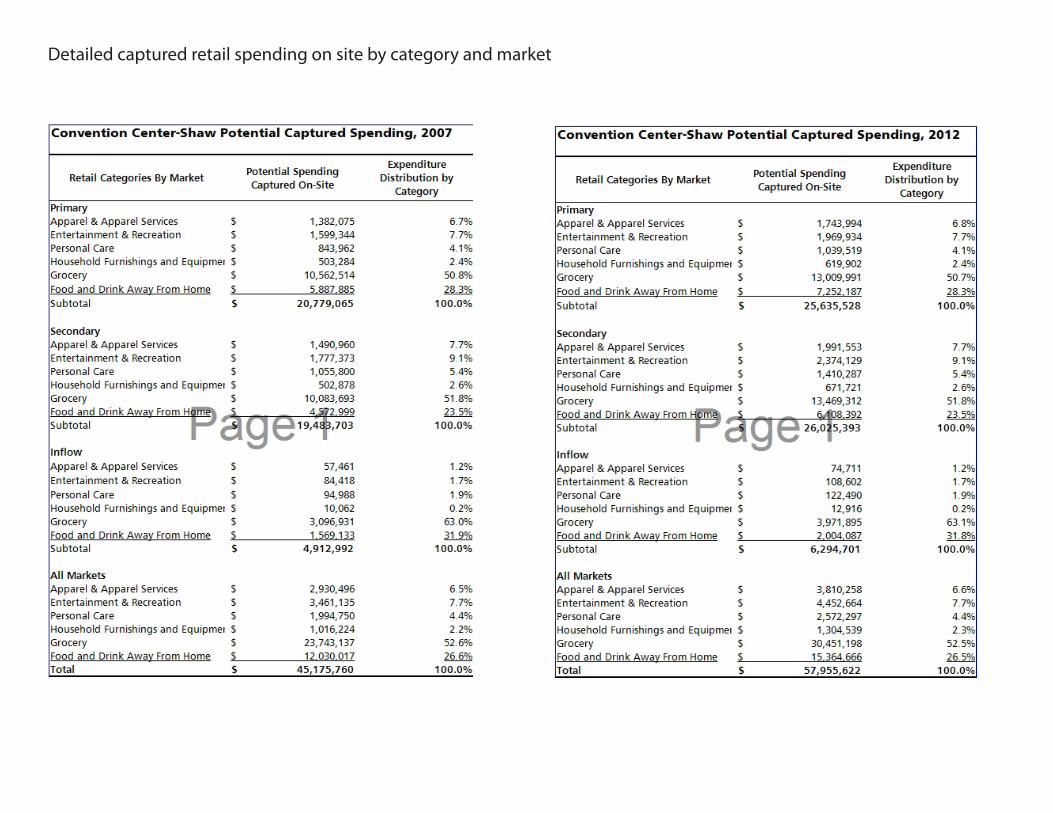
Detailed captured retail spending on site by category and market
2007 Potential Captured Spending on Site

Shaw-Convention Center Strategy

Shaw - Convention Center
Introduction
The Shaw-Convention Center district is changing rapidly. It stands to benefit from major mixed-use developments that include the new DC Con-vention Center at the southern end of the district and the redevelopment of the City Market at O Street at the northern end. Other areas of major residential and commercial growth that are proximate to the submarket include Penn Quarter to the south, NoMA to the southeast and, from a retail influence perspective, the old Convention Center site immediately to the southwest of the new Convention Center.
Strong increases in population and households, along with continued visitation at the Convention Center will provide opportunities for the sub-market to capture more retail expenditures. Total population in the trade area is projected to increase from 32,009 in 2007 to 39,926 in 2012 including new residential projects that may add 2,853 households (approximately 5,647 new residents). Strong population growth in residents aged 20 to 34 and 55 to 64 are positive indicators for increased retail demand.
The submarket is bounded by 7th and 9th Street, and broken up into two nodes. The southern node is anchored by the six-block long Convention Center. The proposed City Market at O Street development, to include a new 65,000 square foot Giant grocery store as well as new residential and retail, sits in the northern node. Retail demand from the surrounding residential neighborhoods exists, and there is also considerable development activity, with over 300,000 square feet of retail space under construction or planned in the trade area. The Convention Center already includes ap-proximately 30,000 square feet of retail, food service and consumer services, providing many of the basic needs of convention visitors during the day. While the Convention Center generates demand for food service, the Shaw-Convention Center submarket faces steep competition from the supply of high-quality restaurants closer to the hotels where convention visiors currently stay. The Hines development at the old Convention Center site is ex-pected to include a major restaurant cluster that should attract both Convention Center visitors as well as establish another dining destination within the downtown core to serve a regional audience.
Much of the existing retail space near the Convention Center node and the future City Market at O Street node is comprised of smaller store spaces in residential/commercial buildings, sometimes located in English basement/ground floor spaces in either single-story stores, or in the ground floor of three-story residential buildings (an exception is the Giant Food Store). Most of these storefront locations are in need of substantial renovation and investment to become competitive retail spaces. According to a recent study for the Office of the Deputy Mayor for Planning & Economic Devel-opment, 56% of the retail inventory in the trade area was Grade “C”, or inadequate for contemporary retailing needs. Also, the large-block, uninter-rupted format of the DC Convention Centers discourages a vibrant street life along the enclosed sides; the Center’s sides create retail streets that are single-loaded (that is, streets with retail only on one side, a less desirable condition than a double-loaded retail street with stores and food service on both sides). Most movement within and around the Convention Center is directed by major Center entrances and proximity to transit. Because the principal entrance is located on the southern end of the building, exiting convention visitors will be close to the new Hines redevelopment of the old Convention Center site.

Market positioning for Shaw-Convention center should focus on selectively-located convenience retail, services, and food and beverage for two primary market segments: 1) nearby existing (and future) residents, and 2) convention center visitors, contractors, and employees. Both market segments will patronize moderate to mid-level restaurants and cafés, carryout food, coffee shops, and upscale wine bars and liquor bars. The new City Market at O Street will capture most resident-based grocery expenditures from the larger resident trade area, but is not expected to draw much support from the convention visitor market. Existing retail services located within the convention center will continue to capture a high percentage of on-site sales, but the visibility, proximity, and scale of the historic buildings at the southern end of the study area provide a selective opportunity for redevelopment and clustering opportunities for additional food services (a carry out deli such as Potbelly Deli), coffee shop, and business supplies and services. Example by category and size are listed in the Merchandising Concepts section.
Merchandising Concepts
The recommended retail mix for the Shaw-Convention Center district should blend carefully placed retail uses that respond to both the resident-based market to the north and the conventioneer demand for convenience retail to the south. Retail in each location will need to reflect the physical characteristics of the spaces that are available. The greater range and depth of resident-oriented retail and dining options in neighboring areas downtown and in NoMA suggest that Shaw should accommodate the convenience and service uses required by its residents and visitors, but should not position itself as a destination retail district attempting to compete with larger, better merchandised shopping areas nearby.Quick-service food and beverage such as cafes, bars or snack-stores (sized at approximately 750 to 1,200 square feet) serving convention attendees should be clustered in the lower blocks of 7th Street NW and 9th Street NW, and made visible through better signage and clear sight lines to the Con-vention Center entrance areas.
The physical characteristics of retail spaces in the historic residential buildings along 7th Street NW and 9th Street NW can best attract selected smaller locally-owned businesses. The more restricted access and layouts in the buildings will make it easier for smaller local businesses to enter this market without the higher rental pressures that large mixed-use projects may require.Specific retail opportunities include local and national restaurants (for example, Mia’s, Pizza Paradiso, and Lauriol Plaza), a bank/ATM (1,200 and 75 square feet, respectively), and business supplies (such as a FedEx Kinko’s or UPS Store or a Staples, sized at approximately 1,200 to 5,000 square feet, assuming that a large enough retail space is available). Other retail niches include a local or national coffee shop (Murky Coffee, Mayorga Coffee, Star-bucks, or Caribou Coffee sized at approximately 750 to 1,200 square feet). In the personal services category a unisex hair salon, women’s hair and nail salon, or spa would also complement the mix (for example, Hoopla DC, or AVEDA Institute at 900 to 1,200 square feet).
Attracting Retailers
The Shaw Main Street program has been involved in retail improvements for several years and should continue to be involved in coordinating retail attraction programs. Storefront improvements, interior renovations and appropriate signs (and financial assistance to encourage these im-provements) should continue to be focused on the 7th Street NW and 9th Street NW corridors. The City Market at O Street is seeking substan-tial financial incentives to encourage development of the Giant/retail/housing components, and is expected to create a grocery-based attraction that will draw from the surrounding neighborhoods, splitting market share with the P Street Whole Foods Market and the new Safeway Pavilions

grocery concept in NOMA.
To encourage recruitment and sustainability for locally owned businesses, provision of ongoing technical support (offered through the Department of Small and Local Business Development and other city-supported technical assistance providers, cooperative programs with local universities and the DC Main Streets Program) should be combined with selective use of available financial incentives.
Supportable Square Footage and Evolving Markets
The Shaw/Convention Center study area is an evolving market that will be heavily influenced by development of the Old Convention Center and there developed City Market at O Street Market. When pipeline projects are taken into account, the study area will have more retail space than is supportable under existing and near-term market conditions. This estimate, sometimes indicated by so-called “negative” supportable square footage, should not be viewed as a permanent condition, and will be affected by both near-term improvements as well as longer-term (beyond the five-year study period) growth through projects such as the projects listed above and other nearby development projects representing mil-lions of square feet of new residential and office space. Available expenditures and the rate at which retail businesses in Shaw/Convention Center can capture a share of those expenditures will be based on both increases in median household income levels over time as well as by the quality and quantity of retail uses that are retained and recruited to the area.
Key Recommendations
1. Focus mixed-use with retail development on 7th Street for “Main Street”-type retail environment to contrast with the Convention Center and new retail at the former convention center site.
2. Support the development of the City Market at O Street to serve as a retail anchor for the northern node of the submarket. Promote the north-ern node as a neighborhood shopping district.
3. Implement streetscape improvements north of N Street to link the northern node commercial area (including City Market at O Street) with the rest of the submarket and the neighborhood.